Preprint
Review

Challenges for District Heating in Poland

Altmetrics

Downloads

302

Views

90

Comments

0

A peer-reviewed article of this preprint also exists.

Submitted:

23 May 2023

Posted:

24 May 2023

You are already at the latest version

Alerts
Abstract
Currently, the district heating (DH) in Poland is facing many challenges. The business model used hitherto was very simple—in most cities, heating plants produced heat, and centralized heating systems supplied the "product" at a price approved annually by the president of the Energy Regulatory Office (URE). However, recent years have brought significant changes on the market. EU regulations force the elimination of old coal-fired plants that were still built in the Polish People's Republic (PRL), moreover, high prices of CO2 emission allowances aggravate the financial situation of companies. In addition, in the heating sector, the trend observed in the power sector is becoming increasingly visible—limiting the role of large sources in favor of energy generated locally, closer to the customer. One of the biggest challenges is achieving the targets set by the EU for the share of renewable energy sources (RES) in the heating sector. The war in Ukraine and problems with the supply of coal and gas are an additional impulse to turn to RES. Thus, the development of sustainable and innovative solutions for energy production and supply at the level of urban networks is currently one of the main technical challenges. The purpose of the paper is to present the current situation and perspectives of development of district heating systems in Poland with a view to the status of district heating in the world, and some deeper insight into European conditions. The review presents energy sources with particular emphasis on renewable energy sources (RES) and their cogeneration for heat production. The examples of existing heating network solutions using renewable energy sources, based on the selected published case studies, are also discussed.
Keywords: 
Subject: Engineering  -   Energy and Fuel Technology

1. Introduction

On 15 November 2022, the world’s population reached eight billion people and it is projected to reach nine billion until 2037 [1]. According to [2] this dynamics of growth in population is expected to result in an increase in the number of households from 1.9 billion in 2010 to 3.2 billion in 2050. With respect to all households in U.S. and Europe, and their total energy consumption, the residential and commercial buildings are responsible for the consumption of 40% and 26% of energy, respectively [2,3]. The inevitable consequence of such a state of affairs is the emission of carbon dioxide (CO2), which is at the level of 38% for U.S. and 36% for Europe. Furthermore, the rapid increase in urbanization is associated with undesirable effects, e.g., in the form of urban heat islands [4,5]. Therefore, the statistics provide a rationale for the necessity of a global objective to reduce CO2 emission by half by 2050 on a global scale with emphasis on Pathway to Net Zero in 2050, which, however, is associated with the fact that emissions must fall by 8% each year [6]. The outlook [6] forecasts also that the demand shock of the pandemic and the supply shock that came with Russia’s invasion of Ukraine, despite having caused a temporary slowdown, exert little long-term influence over a transition that will be rapid and extensive. The flagship documents regulating the energy transformation and reduction of CO2 emissions in the European Union are Fit for 55 package [7] and RePowerUE [8], and in Poland—the Polish Energy Policy until 2040 (PEP2040) [9] as well as the National Energy and Climate Plan (KPEiK) [10].
It was noticed that cities used two-thirds of global final energy and produced 75% of CO2 emissions on our planet [11], thus cities play an important role in mitigating climate change. The transformation of district heating networks is the key to local energy transformation, as district heating networks provide a large proportion of heating and cooling services in many urban areas around the world. For example, in countries such as Iceland, Denmark, Sweden, Finland, Estonia, Latvia, Lithuania, Poland, Russia and northern China, more than 50% of local energy demand is met by district heating [12]. Therefore, the decarbonization of district heating is of utmost importance to promote the transition to carbon neutrality in countries and cities where district heating is a major part of the energy infrastructure.
There is a great potential for decarbonizing the district heating (DH) sector, in particular in terms of heat sources. The district heating system is relatively flexible and permits the use of various energy conversion technologies to produce heat. Typical characteristics and categorizing of DH with regard to geographical location, scale, heat density, end-user demand as well as ongoing advancements and main limitations of the existing methods can be found in [13,14,15]. An extensive review of the implementation of heating and cooling systems in the US was carried out in [16]. The involvement and market potential of new technologies and technology coupling in order to improve the profitability of thermal enterprises and the development of renewable energy sources were revised in [17]. The optimal planning of future district heating systems has been taken up in [18]. To reduce the harmful emissions in DH systems smart technologies can be applied. Simulation results for Metropolis GZM, that is Górnośląska-Zagłębiowska Metropolia, have been discussed in [19], whereas smart asset management for DH systems in the Baltic Sea region—in [20]. A case study in Italy concerning the efficient DH in a decarbonization perspective can be found in [21].
The authors of [22], on the basis of the results of the conducted analyzes, emphasized the positive role of innovative cogeneration (CHP) solutions securing the supply of electricity and heat, the importance of network congestion management with the use of flexibility resulting from the interconnection of sectors and the necessary network expansion plans. The article presents a comprehensive analysis of Germany's coal withdrawal plans by 2038. The current status and DH challenges for the UK can be found in [23].
The renewable energy sources (RES) in the heating sector are of the greatest interest, especially in the context of low-temperature district heating networks [24,25]. An opportunity for the development of heating and achieving efficiency is power to heat, i.e. the use of electricity produced by wind farms to produce heat. The numerous benefits of this solution based on 34 projects and an overview from the 1950s are presented in [26].Integration of solar heat [27], heat pumps [28], nuclear reactors [29], or geothermal energy [30,31] in DH cause what is inevitable, namely radical technological change [32].
The main goal of the paper is to provide an overview of the state of district heating in Poland as well as future development prospects with a focus on global trends and a view on the European situation. The review presents short history of DH with an emphasis on the evolution of the Polish heating network over the years. The energy sources with particular focus on renewable energy sources (RES) and their cogeneration for heat production are discussed. The examples of existing heating network solutions using renewable energy sources, based on the selected published case studies, are also presented.

2. District Heating Systems

2.1. History of DH

The first DH in the world is considered to be the geothermal hot water distribution to about thirty houses and a church in Chaude-Aigues, France, in 1334 [33]. By the end of the 19th century, a few new systems had been developed around the world, although key features remained unchanged [34]. Modern heating started in the middle of the nineteenth century in the United States, where the inventor Birdosill Holly first tested a central heating system in his own home, then started a district heating company and expanded it in downtown Lockport, New York, and after a few years, 65 homes were connected to it [35]. Soon after, there were New York, Chicago and a dozen other cities in the USA. Heating also gave rise to changes in architecture—the Empire State Building, a centrally heated skyscraper, could have been built. In Europe, the first district heating systems were built in Germany, in Hamburg, Berlin and Dresden, in the 1920s. Then Copenhagen, Paris and Zurich joined. Europe mainly focused on water-powered systems, the US—steam-powered, while the system created in 1930 in Reykjavik used geothermal energy [36]. China introduced DH in the 1950s, the current state has been described in [37]. Evaluations, reviews or investigations of DH in the world have been accessible since the 1930s [38,39] and in Europe since the late 1940s [40,41,42]. At present, DH grids operate in many cities around the world, just to name a few: New York, Seoul, Warsaw, Berlin, Hamburg, Prague, Paris, Copenhagen, Helsinki, Stockholm, Beijing, Vienna and Milan. Out of a total of 80,000 estimated systems [43], 6000 are located in Europe.
In Warsaw, Poland, at the beginning, heating installations were intended for individual buildings. In 1841, the first building heated in this way was erected at Jan Mitkiewicz Square [44]. Built at the beginning of the 20th century, the Infant Jesus hospital complex on Lindley Street and the Warsaw University of Technology were equipped with their own combined heat and power plants and a heating system [45]. In the 1920s and 1930s, a modernist Warsaw housing estate for workers in Żoliborz was built, with a central boiler house heating the blocks of flats. The heating boom in the capital of Poland appeared during its reconstruction after the WW2. Currently, the Warsaw heating network is the largest system of this type in the European Union, it is about 1800 km of networks, which provide heat to 19,000 facilities in Warsaw, covering 80% of the capital's needs [44]. The Warsaw heating system is supplied from four sources and its ring structure guarantees the security of heat supply in the city [46].
Pre-war Kraków, Poland, was heated mainly by stoves in apartments. Occasionally, there were boiler houses for individual buildings or small housing estates. They gave rise to the Municipal Heating Company (MC), which was established in 1953. The company took over the management of these boiler houses. There were a total of twelve of them, and the total heat distribution network was only 30 km long. In the following years, MC took over the management of subsequent local heating plants, and in 1962 it was transformed into the Municipal Heat Energy Company (MPEC) [47]. In the early 1960s, Kraków was heated mainly thanks to the heat produced by the Lenin Steelworks. In 1970, a new large heat and power plant was launched, and in the mid-1980s, the heating system in Kraków was once again revolutionized [44].
In the interwar Łódź, Poland, power plants were primarily built for the needs of individual industrial companies. In order to meet the demand of the textile industry for a technological steam and initiate the start of the city's heat supply system, a plan was created to build four heat and power plants and adopt the existing historical one—EC-1. However, despite the fact that the history of Łódź professional energy sector dates back to 1907, the power plant began to give up the steam for the industry in 1953. In 1957, the Łódź District Heating Plant (ZSC) was created. In subsequent years, steam networks were dynamically expanded, connecting industrial customers to them. In 1959 another heat and power plant was launched—EC-2, then, in the 60s and 70s another tens of kilometers of heating network were built and two more EC-3 and EC-4 heat and power plants were built [44]. In 1989, a company managing the whole district heating system in Łódź was established [48]. Today it is based on two heat and power plants and over 820 km of heating networks.
In Poznań, Poland, as in most cities, the beginning was electricity production. Already in 1904, the first power plant, Grobla, was built here, another one was launched 25 years later in Garbary. However, the Poznań II Karolin heat and power plant, built in the 1970s, provided opportunities to meet the challenges of the rapidly developing capital of Greater Poland. Along with it, in 1967, the Municipal Heat Energy Company (MPEC) was established. Today, under the name of Veolia Energy S.A. [49], it offers its customers comprehensive solutions in the field of electricity, heat and industrial media supplies as well as technical service of installations.
The beginnings of the heating industry in Lublin, Poland, date back to the late 1950s and 1960s, when the Department of Heat Management started operating at the Municipal Board of Residential Buildings. Then, under the name of the Municipal Heat Energy Company, took over the tasks of operation and development of the heating system in Lublin. The current name, Lublin Heat Energy Company (LPEC) has been in use since 1974. The result of the centralization of the Lublin heating sector in the 1970s was the elimination of local and regional boiler houses and connecting as many facilities as possible to the municipal network. In the 1980s, the company sought to combine all heat sources and create the so-called ring heating system. LPEC [50] has become one of the pioneers in the automation of heat energy transmission, distribution and the energy conversion [44].
In Wrocław, Poland, the decision to build a power plant for municipal purposes was made in the 1890s. Electricity began to be produced in 1901. After the WW2, in 1947, the power plant was handed over to Polish management. First, it was rebuilt from war damage, and in the 1950s it was transformed into a combined heat and power plant. At the same time, the Czechnica Power Plant was modernized and included in the network, which was transformed into a combined heat and power plant in the early 1980s [44]. In 1999, the entire district heating system in Wrocław was concentrated in the Wrocław Heat and Power Plant Group [51].
Municipal Heat Management Company in Szczecin, Poland, was established in 1962 on the basis of local coal-fired boiler houses. There were as many as 160 of them scattered throughout the city. In the mid-1970s, a company that managed networks in the entire Szczecin voivodship was established. Therefore, it was given the name of the Voivodship Heat Energy Company (WPEC). Heating systems became the property of the communes in 1997 and since then the recent history of the company named Szczecin District Heating (SEC) [52] begins.
The 1970s also marked the beginning of heating in Opole, Poland. One of the most dynamically operating companies on the Polish heating market, Opolszczyzna District Heating (ECO), was founded and developed here [53]. The basis for the establishment of ECO was a pioneering organizational solution, which consisted in creating a company based on the heating assets of the communes of the Opolskie Voivodeship.
The end of the 1990s and the beginning of the 21st century is a new period in the Polish district heating sector. Foreign capital with new know-how and a strategy for the development of modern, energy-efficient heating systems appears in many companies. In addition, there are new opportunities related to access to EU funds for network modernization and construction of new heat sources. Along with the Baltic countries, Poland can boast the most extensive heating networks. 50% of the population uses system heat [44]. At the same time, heating companies and heat producers face new challenges—meeting the requirements regarding environmental protection and the share of RES in energy production. This is a challenge for the next years of the energy history of our country.

2.2. DH Sources

An exceptionally important feature of district heating is its versatility with the use of various heat sources. Lots of different centralized and decentralized sources can be connected to a district heating network for reliable operation and flexibility thanks to basic control strategies. Considering economical, energy and environmental factors, the most common technologies for generating heat have been ranked in [54]. The authors applied a fuzzy comprehensive evaluation method and arranged these technologies in the following order, starting from used most often: Combined heat and power (CHP), gas boiler, water source heat pumps, coal boiler, ground source heat pumps, solar energy heat pumps and the last one—oil boilers. In the light of decarbonization, renewable and waste sources are certainly the most valued [55], especially that they can be utilized in a low temperature heat grid [56]. Waste heat can be obtained from industrial or agricultural processes [57,58,59] as well as from combustion the waste, which is called Energy from waste (EfW) [60,61,62]. Bioenergy, sourced from wood pellets and chips as well as from biofuels, biogas in particular, is a developed technology to be applied in a district heating network on a larger scale [63,64,65,66]. Bioenergy is commonly used as co-fired or as a replacement to fossil fuels in CHP plants. Solar thermal energy is the conversion of solar radiation into heat and it is a very promising alternative energy that can be harvested in two forms: solar thermal energy or electrical energy. This technology can be incorporated in both large scale and small scale setups [67,68,69,70]. The role of heat pumps in supplying energy to the DH network is of increasing interest. Due to the source from which the heat is obtained one can distinguished heat pumps extracting low temperature heat from e.g. geothermal water [71,72,73,74], seawater [75,76,77] or air absorption [78,79,80].
Thermal storages are the option for energy accumulation in periods of lower demand, and, on the other hand, at times of high demand can serve as the heat sources. The energy storages are expected to be an integral part of DH to eliminate the effects of unpredictable fluctuations in the supply of energy from RSEs [81]. Heat storages have mainly the form of large hot water tanks [82], especially in the context of centralized storing [83]. The estimated efficiency of the energy storage is within 20–60% [84]. Different types of energy storage are listed and characterized, according to [85], in Table 1, and the main concept of each is shown in Figure 1 [86].

2.3. DH Generations

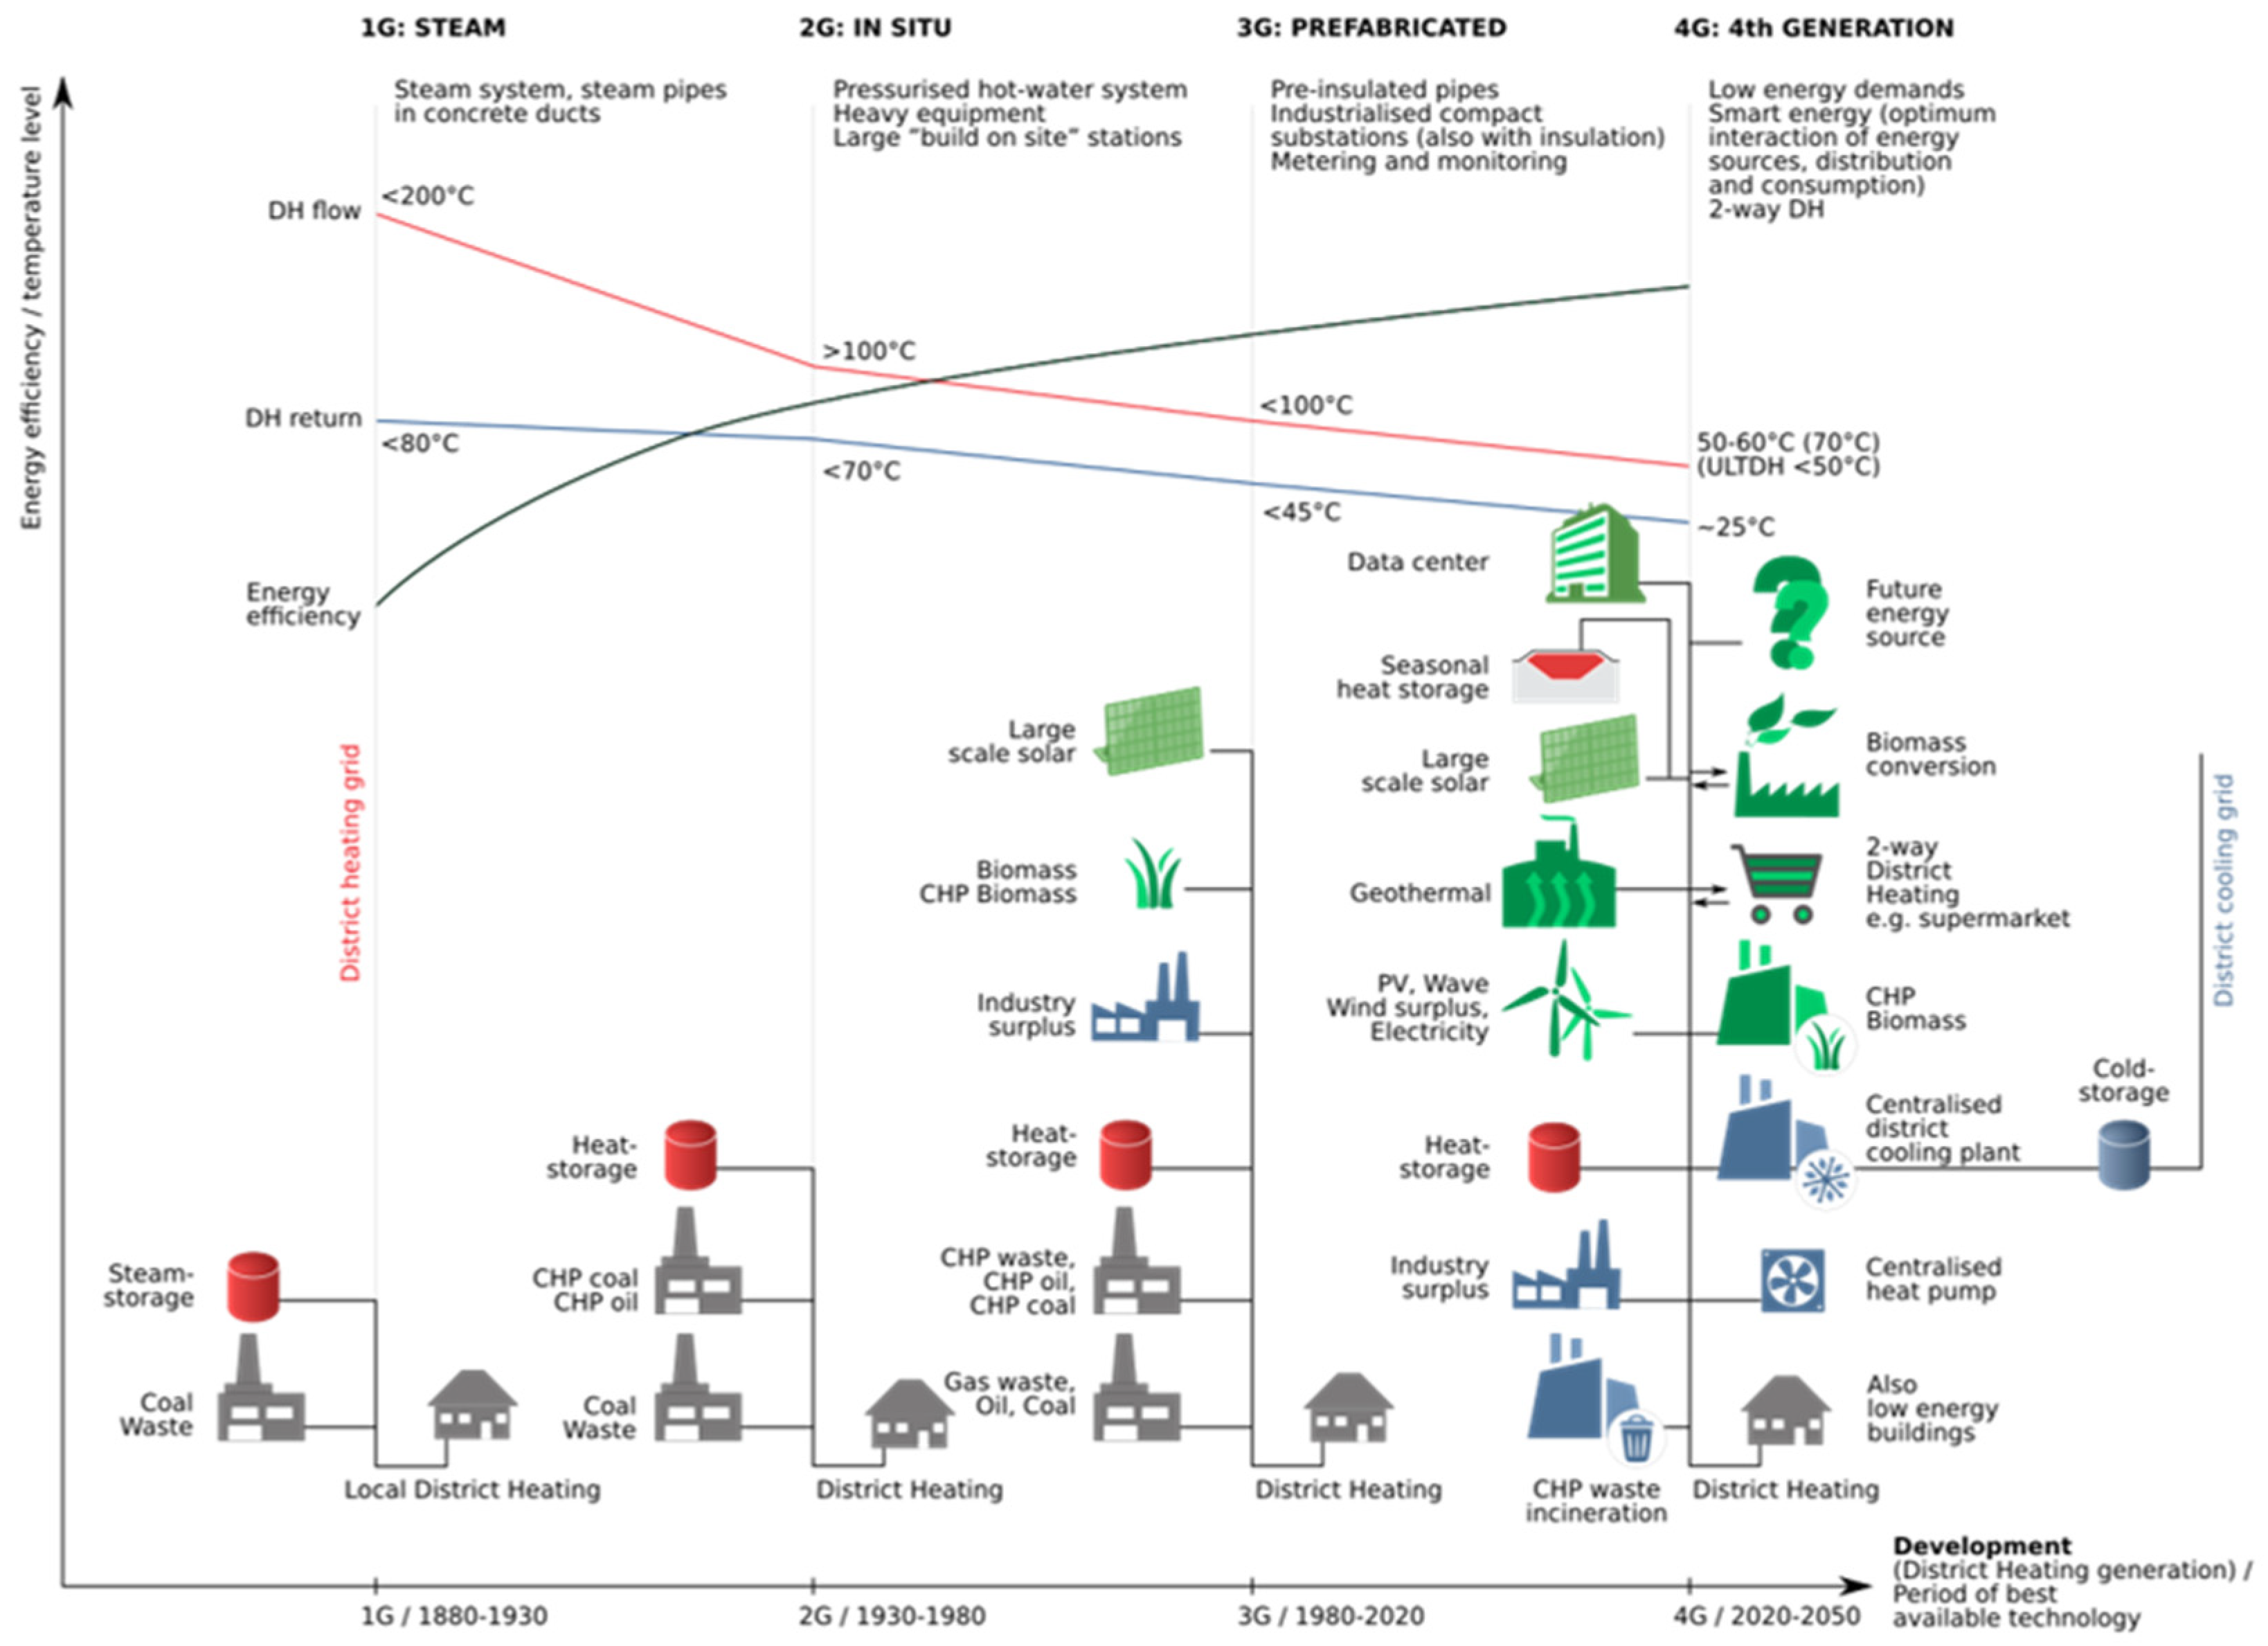
In the first heating networks, called the first generation networks, which were created at the end of the 19th century in the USA and Western Europe, the heat carrier was steam with a temperature above 150 ˚C [87]. In the second generation district heating systems, the heat carrier was pressurized water with a temperature above 130 ˚C, sent through steel pipes without good insulation, which ran in concrete channels. This technology has been used since the 1930s and it was popular until the 1970s, especially in socialist countries, including Poland [87]. Transmission losses were high for both of these technologies. The third generation of heating systems has been developed in the 1970s in Scandinavia—the water temperature was lowered below 100 ˚C, pre-insulated pipes dug into the ground were used. This technology currently serves as the basis for the vast majority of networks worldwide [88] with supply temperatures of 70–120 ˚C and return temperatures of 40–70 ˚C [89]. Transmission losses are much lower and network construction is cheaper compared to the two previous generations.
After the third generation, the time has come for the fourth generation in the heating sector—the water temperature drops below 70 ˚C, the municipal heating, energy, sewage and gas infrastructure are integrated into one system. In this generation, the importance of the central heat source, e.g., the main heat and power plant, is decreasing. Its place is taken by RES installations (solar collectors, geothermal sources, wind farms), and also waste heat transferred to the grid from industrial plants (see Figure 2 [90]). Low-temperature district heating networks develop, among others, Denmark, Sweden, Finland and Germany [91]. Low-temperature networks require new infrastructure—energy storage and IT systems to regulate the operation of many energy sources. Heat is also to be provided by buildings with a positive energy potential. The heating system will be profiled for the recipient and his needs, which will enable the creation of energy solutions, e.g. for selected districts, shopping centers, public utility buildings. District heating, similarly to roads and highways, is an investment for years. The networks being built now will be operational by the middle of the century. Therefore, it is worth investing in modern systems.

3. Heating State in Poland

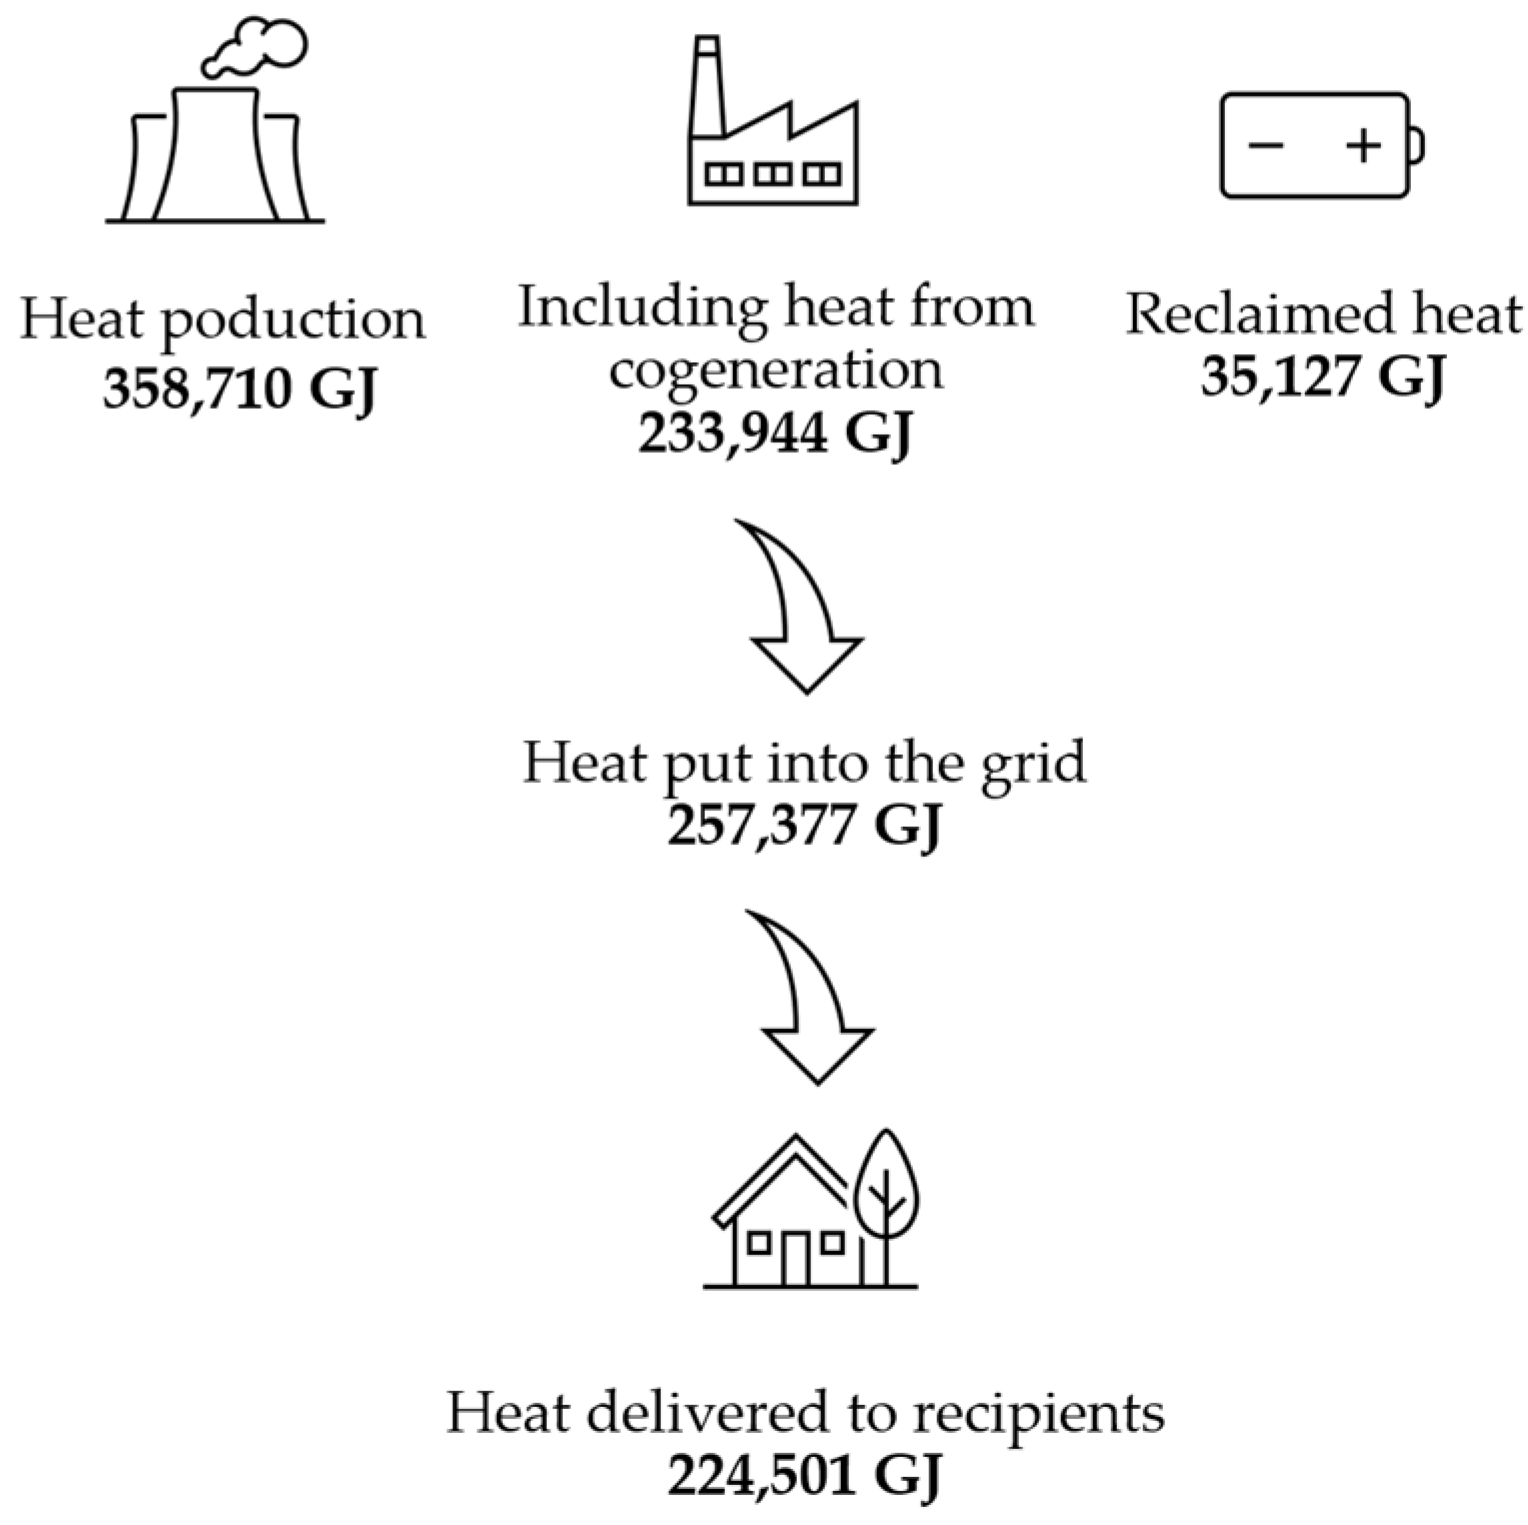
According to the annual publication by the Energy Regulatory Office (URE) [92], as of the last day of 2020, there were 387 licensed energy companies dealing with heat supply in Poland. The potential of these enterprises was the installed capacity of 53,271.1 MW in the generation sources of these enterprises and the distribution networks with a length of 22,123.1 km. Among the surveyed enterprises, 8.4% did not have a network, 65.8 % had nets longer than 10 km, 1/3 of which were over 50 km long. In 2020, licensed companies sold 344,712,640 GJ of heat. Information on the production of licensed heat, as well as the volume of heat supplied to the network from recipients is presented in Figure 3 [93].
Another 5 MW of capacity is ordered from energy companies that are not included in the licensed companies. It is estimated that these companies sell 50,000,000 GJ of heat to their customers. Further 500,000,000 GJ of heat is produced for own needs by households and local heating plants that meet the thermal needs of residents of multi-unit buildings. Also the industry that generates over 200,000,000 GJ of heat cannot be forgotten.
With such ambitious goals of the European Union's climate and energy policy and the adopted Polish Energy Policy until 2040 [9], it should be indicated that the process of diversification of fuels used for heat production is progressing very slowly, in particular in the situation of the energy crisis caused by the Russian military attack in Ukraine.
The data published by the Energy Regulatory Office [92] shows that:
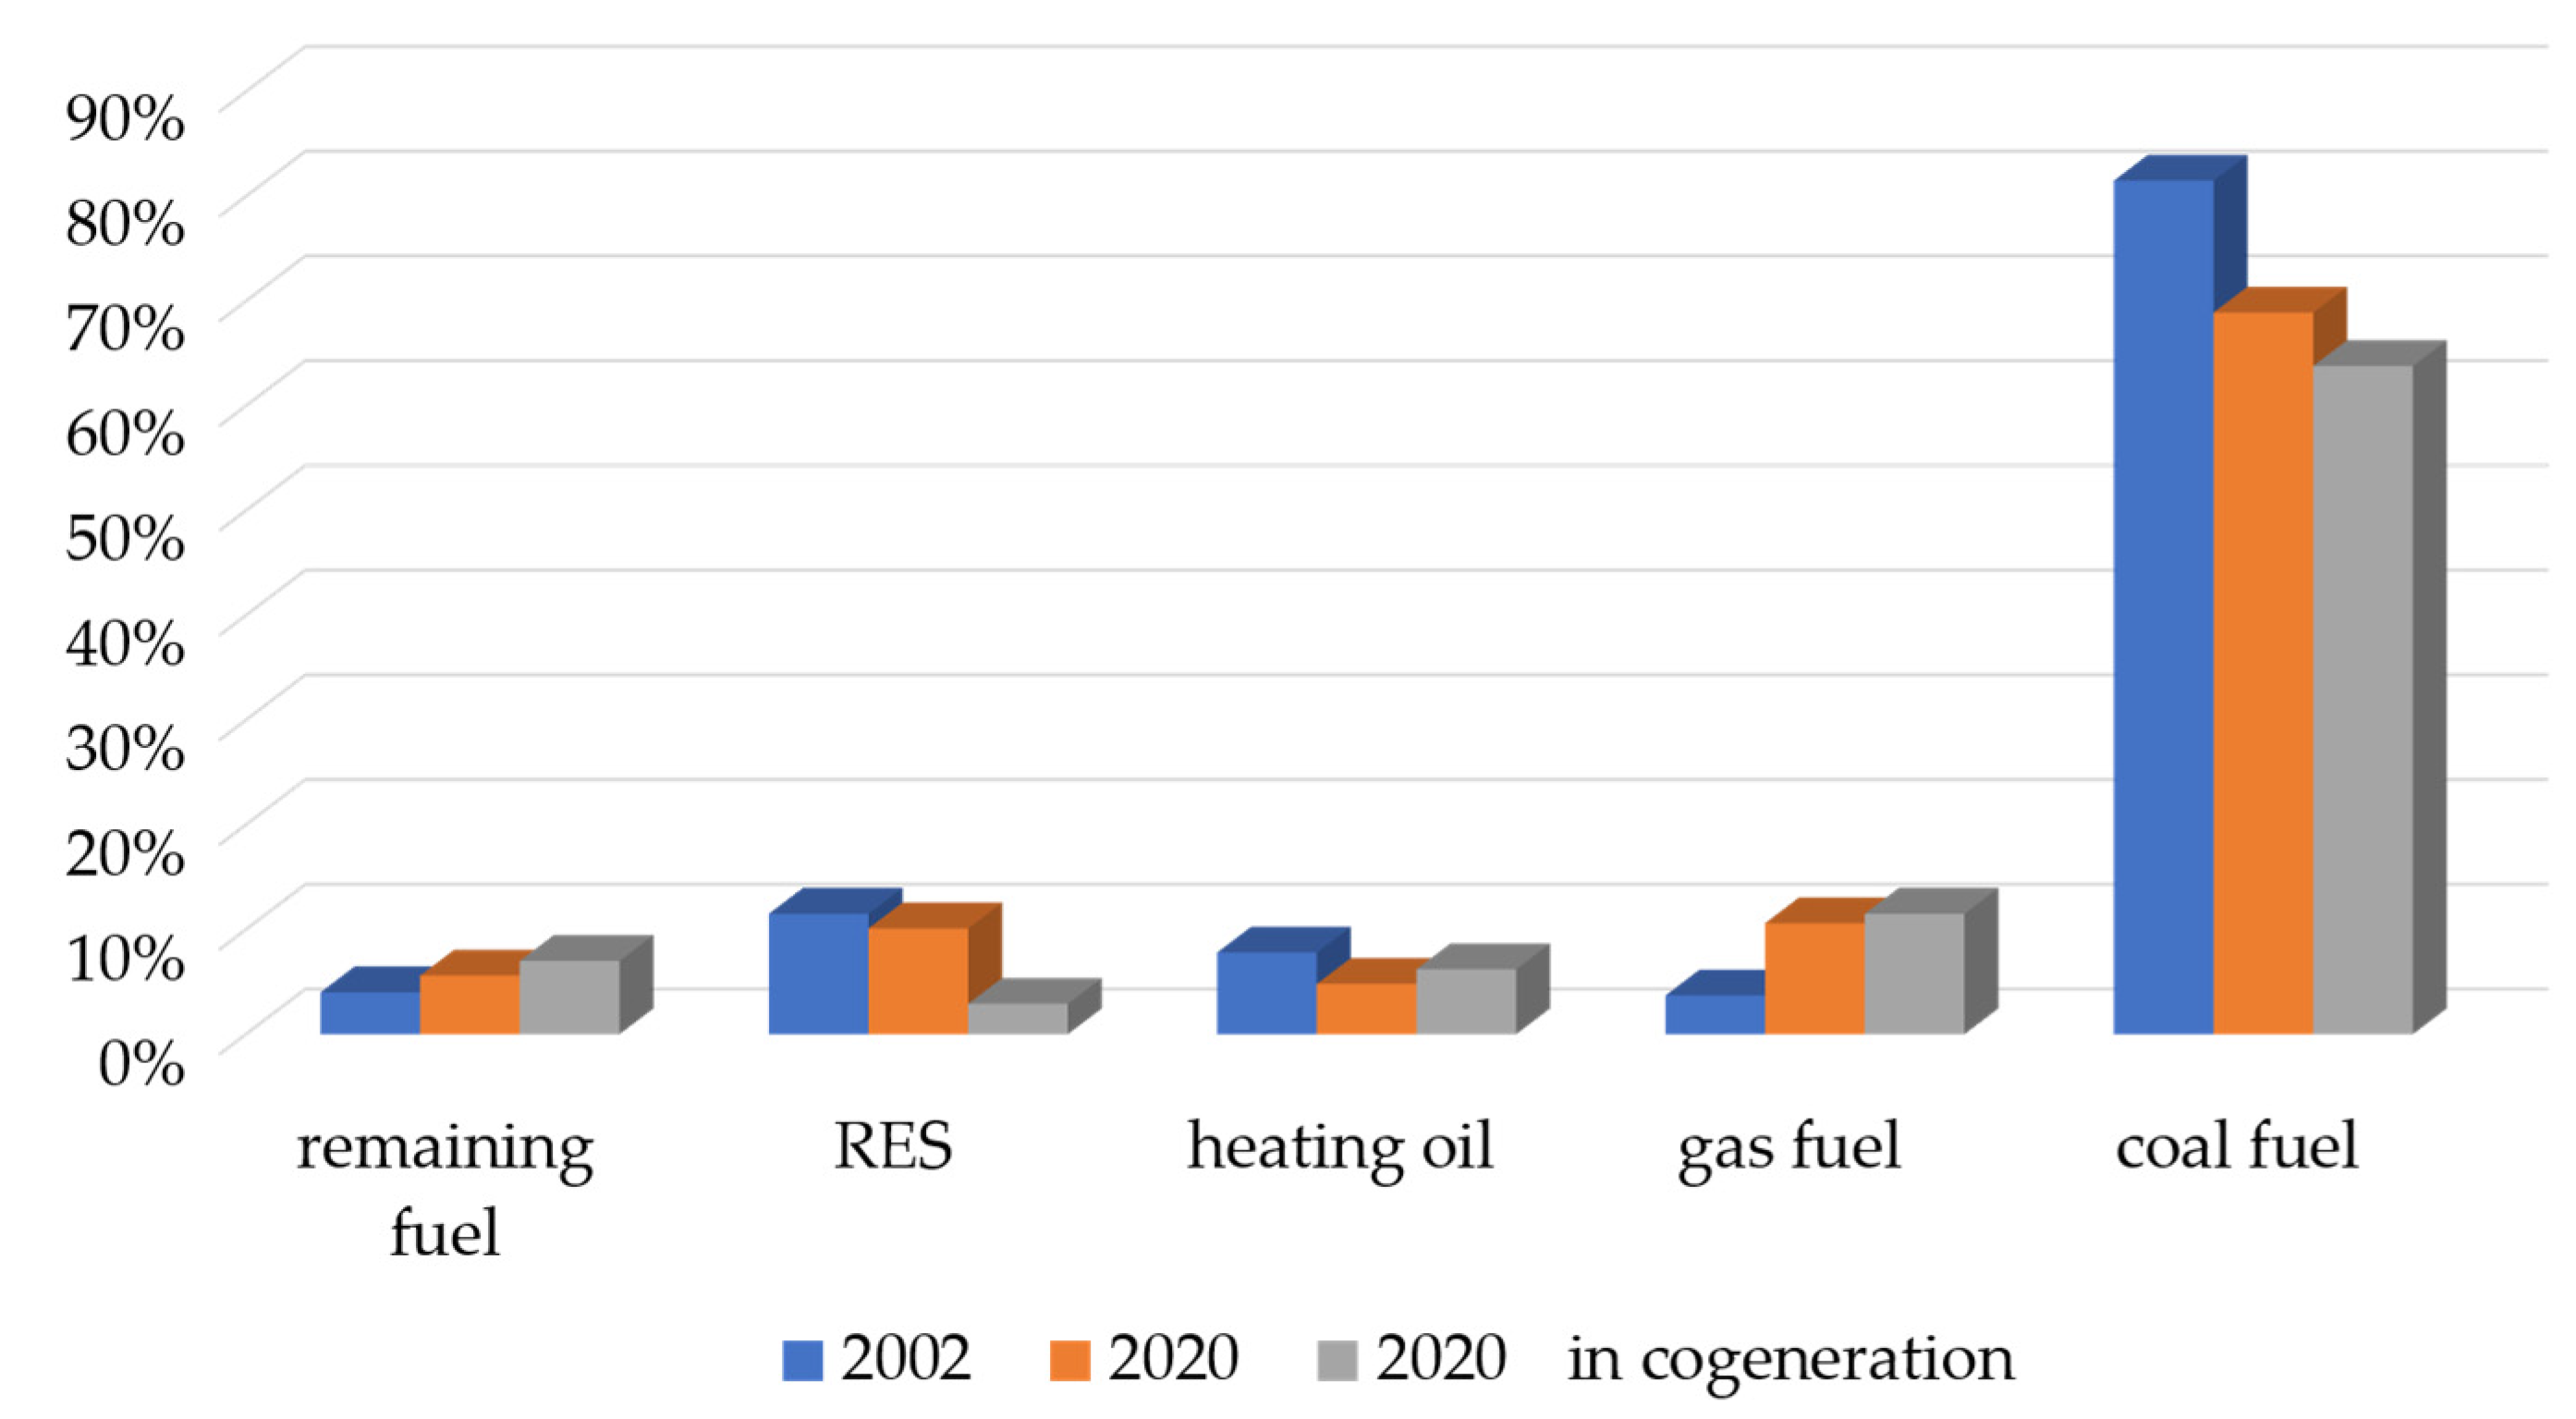
  • Coal fuels continue to dominate, the share of which in 2020 accounted for almost 69% fuels used in heat sources (in 2019 it was 71%, in 2018—72.5%, and in 2017—74%);
  • Since 2002, the share of coal fuels has decreased by 12.8 pp. At the same time, the share of gaseous fuels is increasing—by 6.9 pp. and renewable energy sources—by 7.2 pp. since 2002;
  • In 2020, the total debt decreased and the financial liquidity of enterprises in the sector increased;
  • In the years 2002–2020, a significant increase in the replacement rate of fixed assets was recorded. This value increased by 37.5%, which indicates a high degree of investment, exceeding the level of depreciation of fixed assets;
  • In 2020, more than 90 % of all surveyed heating companies dealt with the production of heat. They generated, including heat recovered in technological processes, almost 394,000 TJ of heat, which means a decrease in production by 1.6% compared to the previous year;
  • In 2020, the share of heat from cogeneration was 65.2% of total heat production;
  • 370 companies producing heat participated in the study, 128 of them also generate heat in cogeneration (i.e. 34.6%);
  • The average single-component price of heat in 2020 amounted to PLN 55.95 / GJ and was higher by 7.7 % than the 2019 price (PLN 51.93 / GJ), and by 13.1% (PLN 49.46 / GJ) comparing to the 2018 price;
  • In 2020, the total volume of heat sales by licensed heating companies (including resale to other enterprises) amounted to approx. 344,000 TJ and was 0.3% lower than in 2019;
  • In 2020, the average price of heat sold from all licensed heat generating sources amounted to PLN 44.33 / GJ, thus showing an increase by 8.2%. compared to 2019 (PLN 40.97 / GJ), with the average price of heat sold from licensed heat-generating sources without cogeneration being PLN 51.87 / GJ, and the average price of heat sold from licensed heat-generating sources in cogeneration was 41.32 PLN / GJ.

3.1. The Structure of Heating Companies in Poland

According to the data of the President of the URE published in [94] as of December 31, 2020, a license to conduct activities in the field of generation, transmission and distribution and trade in heat was held by 387 companies (a total of 797 individual licenses for a given type of activity in the field of supplying heat to consumers) . As reported, the first research of the heating sector was carried out by the Energy Regulatory Office in 2002. Since then, the number of licensed heating companies in Poland has decreased by more than a half, which was mainly caused by the change in the Energy Law and had an impact on the size of the regulated heat market. Analyzing the data in Table 2 regarding the installed thermal power, it can be indicated that the total amount of thermal power installed by producers has decreased since the first study in 2002 by 25%, and has the value of 53,271.1 MW. The stabilization has been observed in recent years. Licensed heating companies had 22,123.1 km of networks in 2020. This amount included heating networks connecting heat sources with heat nodes and low-parameter networks—external receiving installations. Out of the surveyed enterprises, 8.5% did not have networks, 67.9% of enterprises had networks over 10 km long, and 31.4% had networks over 50 km.
According to [94], from 2022 a significant change in the legal structures of heating companies can be observed. The trend of changing the structure, shown in Table 3, has an impact on the transformation of the ownership of individual enterprises.
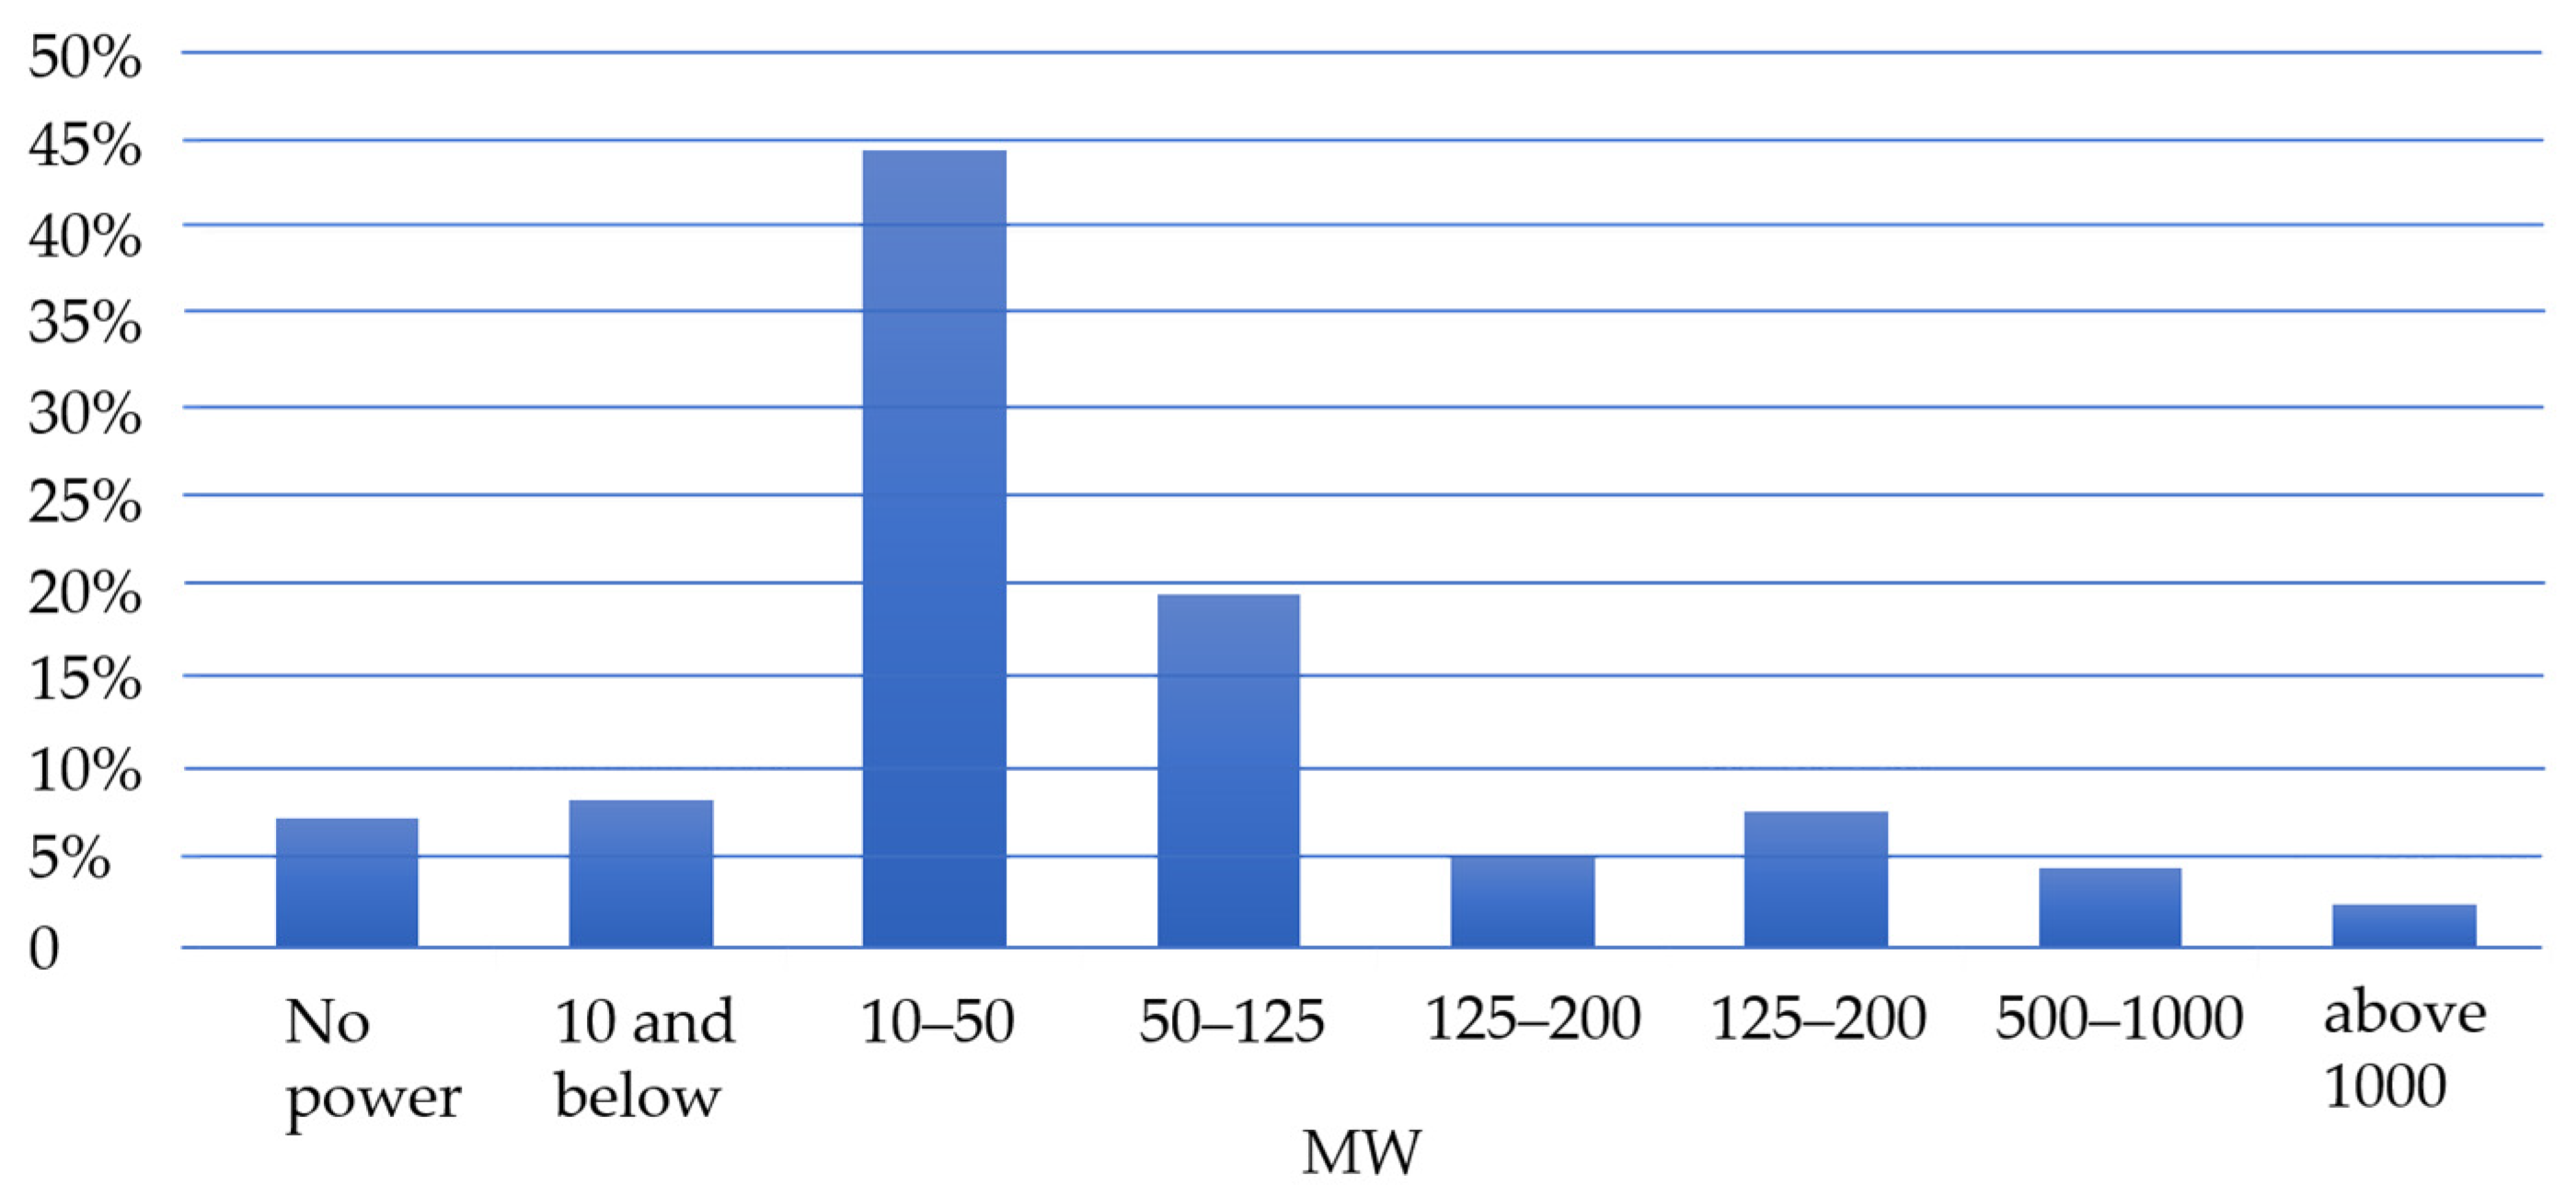
In 2020, enterprises generated heat from sources of various sizes, with a quantitative predominance of small sources up to 50 MW (44.6% of enterprises). Only ten enterprises had the achievable power of sources exceeding 1000 MW each. The structure of enterprises is shown in Figure 4.

3.2. Fuel Consumption for Heat Production.

As mentioned in the introduction, in line with the URE, the diversification of fuels used for heat production is progressing, albeit very slowly. Unfortunately, coal fuels are the dominant source, the share of which in 2020 accounted for almost 69% of fuels used in heat sources (in 2019 it was 71%, in 2018—72.5%, and in 2017—74%). Very detailed data can be found in [95]. Table 4 summarizes the structure of fuel and energy consumption for total activity in enterprises of the energy sector and other enterprises producing and selling heat.
Production and distribution companies include distributors and professional producers of heat, i.e. companies that have only district heating (distribution) networks or district heating and heating networks or combined heat and power plants (distribution and generation) or only heating plants or combined heat and power plants (generation). Companies which are heat producers do not deal with distribution. In the group of producers, heat is produced for own use in combined heat and power plants and is sold only as surpluses.
The share of coal as a heating source has decreased by 12.8 pp. since 2002 [94]. At the same time, the share of gaseous fuels increased in the same years by 6.9 pp. and renewable energy sources by 7.2 pp. On the other hand, heat from cogeneration amounted to 7% in 2020 from 65.2% of total heat production. The data is presented in Figure 5.
Enterprises producing heat in cogeneration are characterized by a more diversified fuel consumption for heat production. Unfortunately, coal fuels also dominate in the group of these enterprises, but one third are other fuels, including 10.1% of renewable energy sources, 10.6% of natural gas and 4.8% of heating oil, which is presented in Table 5.
The consumption of fuels to generate heat varies depending on the voivodeship. The greatest differentiation can be observed in the Mazowieckie voivodeship. The leaders in the share of renewable sources are three voivodeships: Kujawsko-Pomorskie, Podlaskie and Pomorskie, while in the Lubuskie voivodeship over 95% of heat is produced from natural gas. Hard coal definitely dominates in nine voivodeships: Dolnośląskie, Świętokrzyskie, Łódzkie, Opolska, Małopolskie, Lubelskie, Warmińsko-Mazurskie, Wielkopolskie and Zachodniopomorskie, and the share of consumption is over 80%, with the highest share in Lower Silesia—nearly 90.4% [93,95].
According to the Energy Forum report [96], the heating is still based to a great extent on coal, moreover, individual heating uses technology from the 1950s and 1960s and the society suffers huge costs of air pollution—the consequences of damage to health cost Polish society PLN 120 billion annually [96]. In order to meet the assumptions of the country's policy to obtain effective heating, a change in technology based on solutions from renewable energy sources is necessary and inevitable. According to [92], the dependence on coal fuels in Poland is still much higher than that of other EU Member States, which is why a fair transition is so important to Poland, which means taking into account the starting point, the social context of the use of carbon fuels.

2.3. Sale and Sale Prices for Heat.

The European Emissions Trading System, Just Transition, Supply Diversification and Network Expansion of Natural Gas, Russia's Gas War are issues that are often discussed in the media and in many analyzes. The heat sector, which has been a bit neglected so far, is becoming one of the key transformation sectors. Assumptions and, e.g, the amendment to the building law lead to an increase in the share of district heating. According to [92], by 2030 about 1.5 million new households are to be connected to the heating network. At the same time, changes in technology must go hand in hand to achieve the goal of at least 85% of systems (heating or cooling) with a capacity exceeding 5 MW by 2030 to meet the criterion of an energy-efficient system.
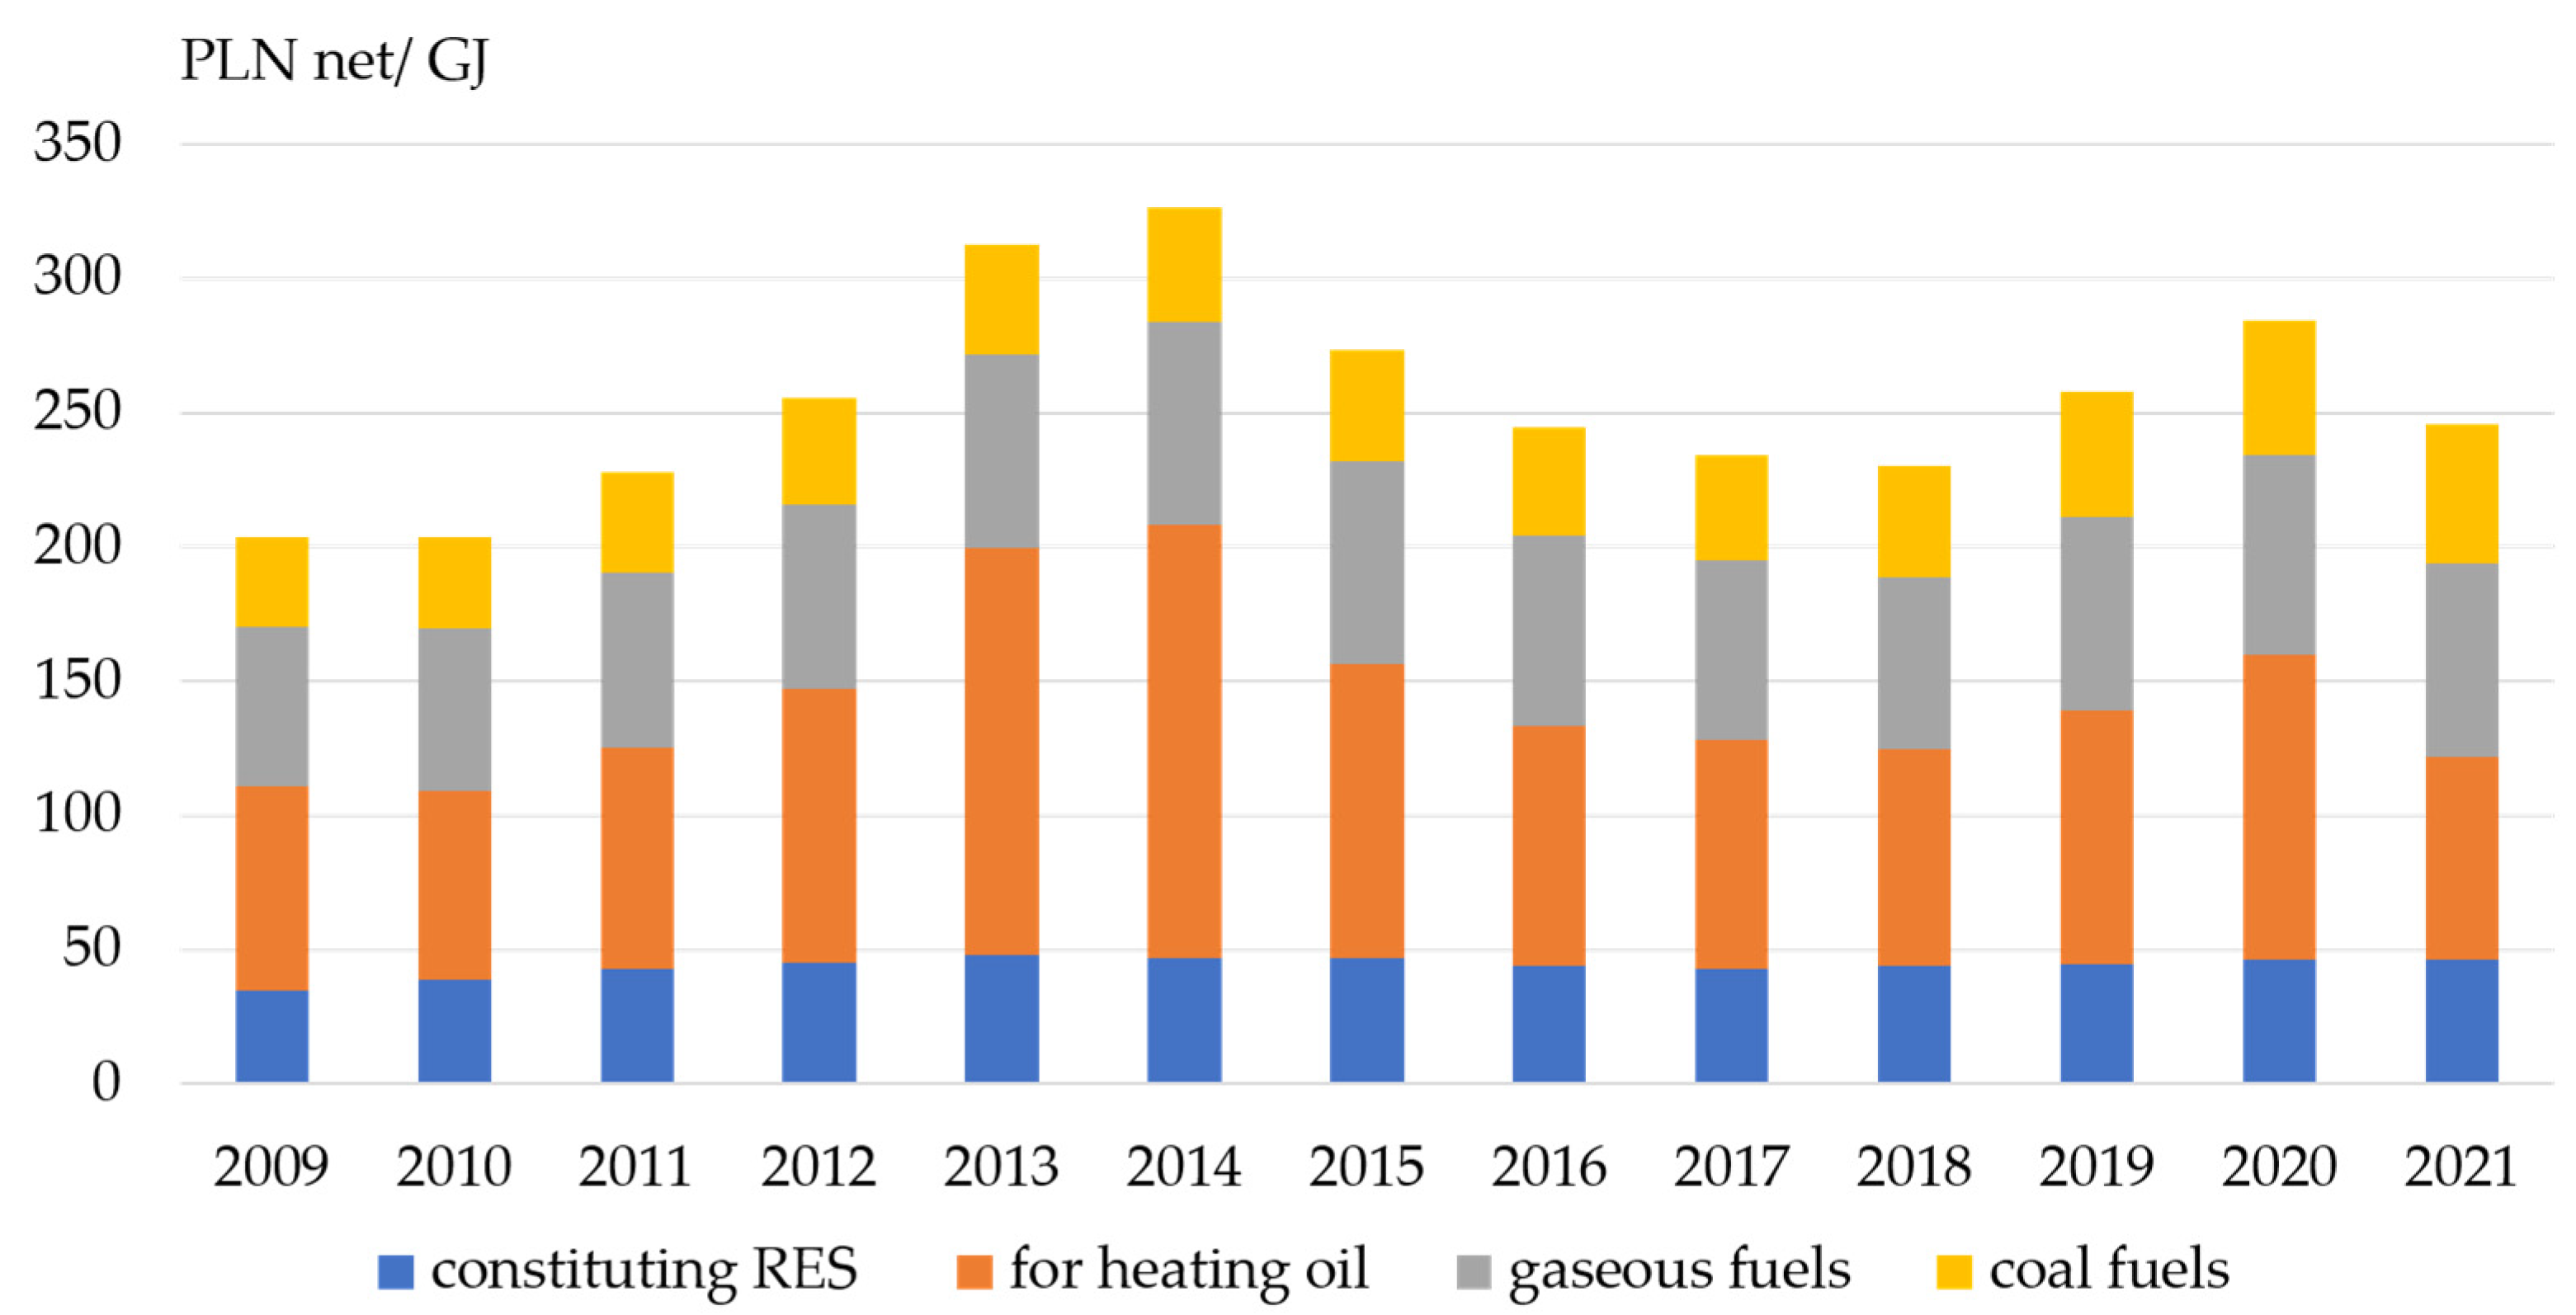
The price of heat will play an important role in the entire transformation. According to the URE data [94], in 2020 the average price of heat sold from all licensed heat generating sources was PLN 44.33 / GJ, which means an increase by 8.2% compared to the price in 2019 (PLN 40.97 / GJ). At the same time, the average price of heat sold from licensed heat generating sources without cogeneration amounted to PLN 51.87 / GJ, while the average price of heat sold from licensed heat generation sources in cogeneration was PLN 41.32 / GJ (see Figure 6).
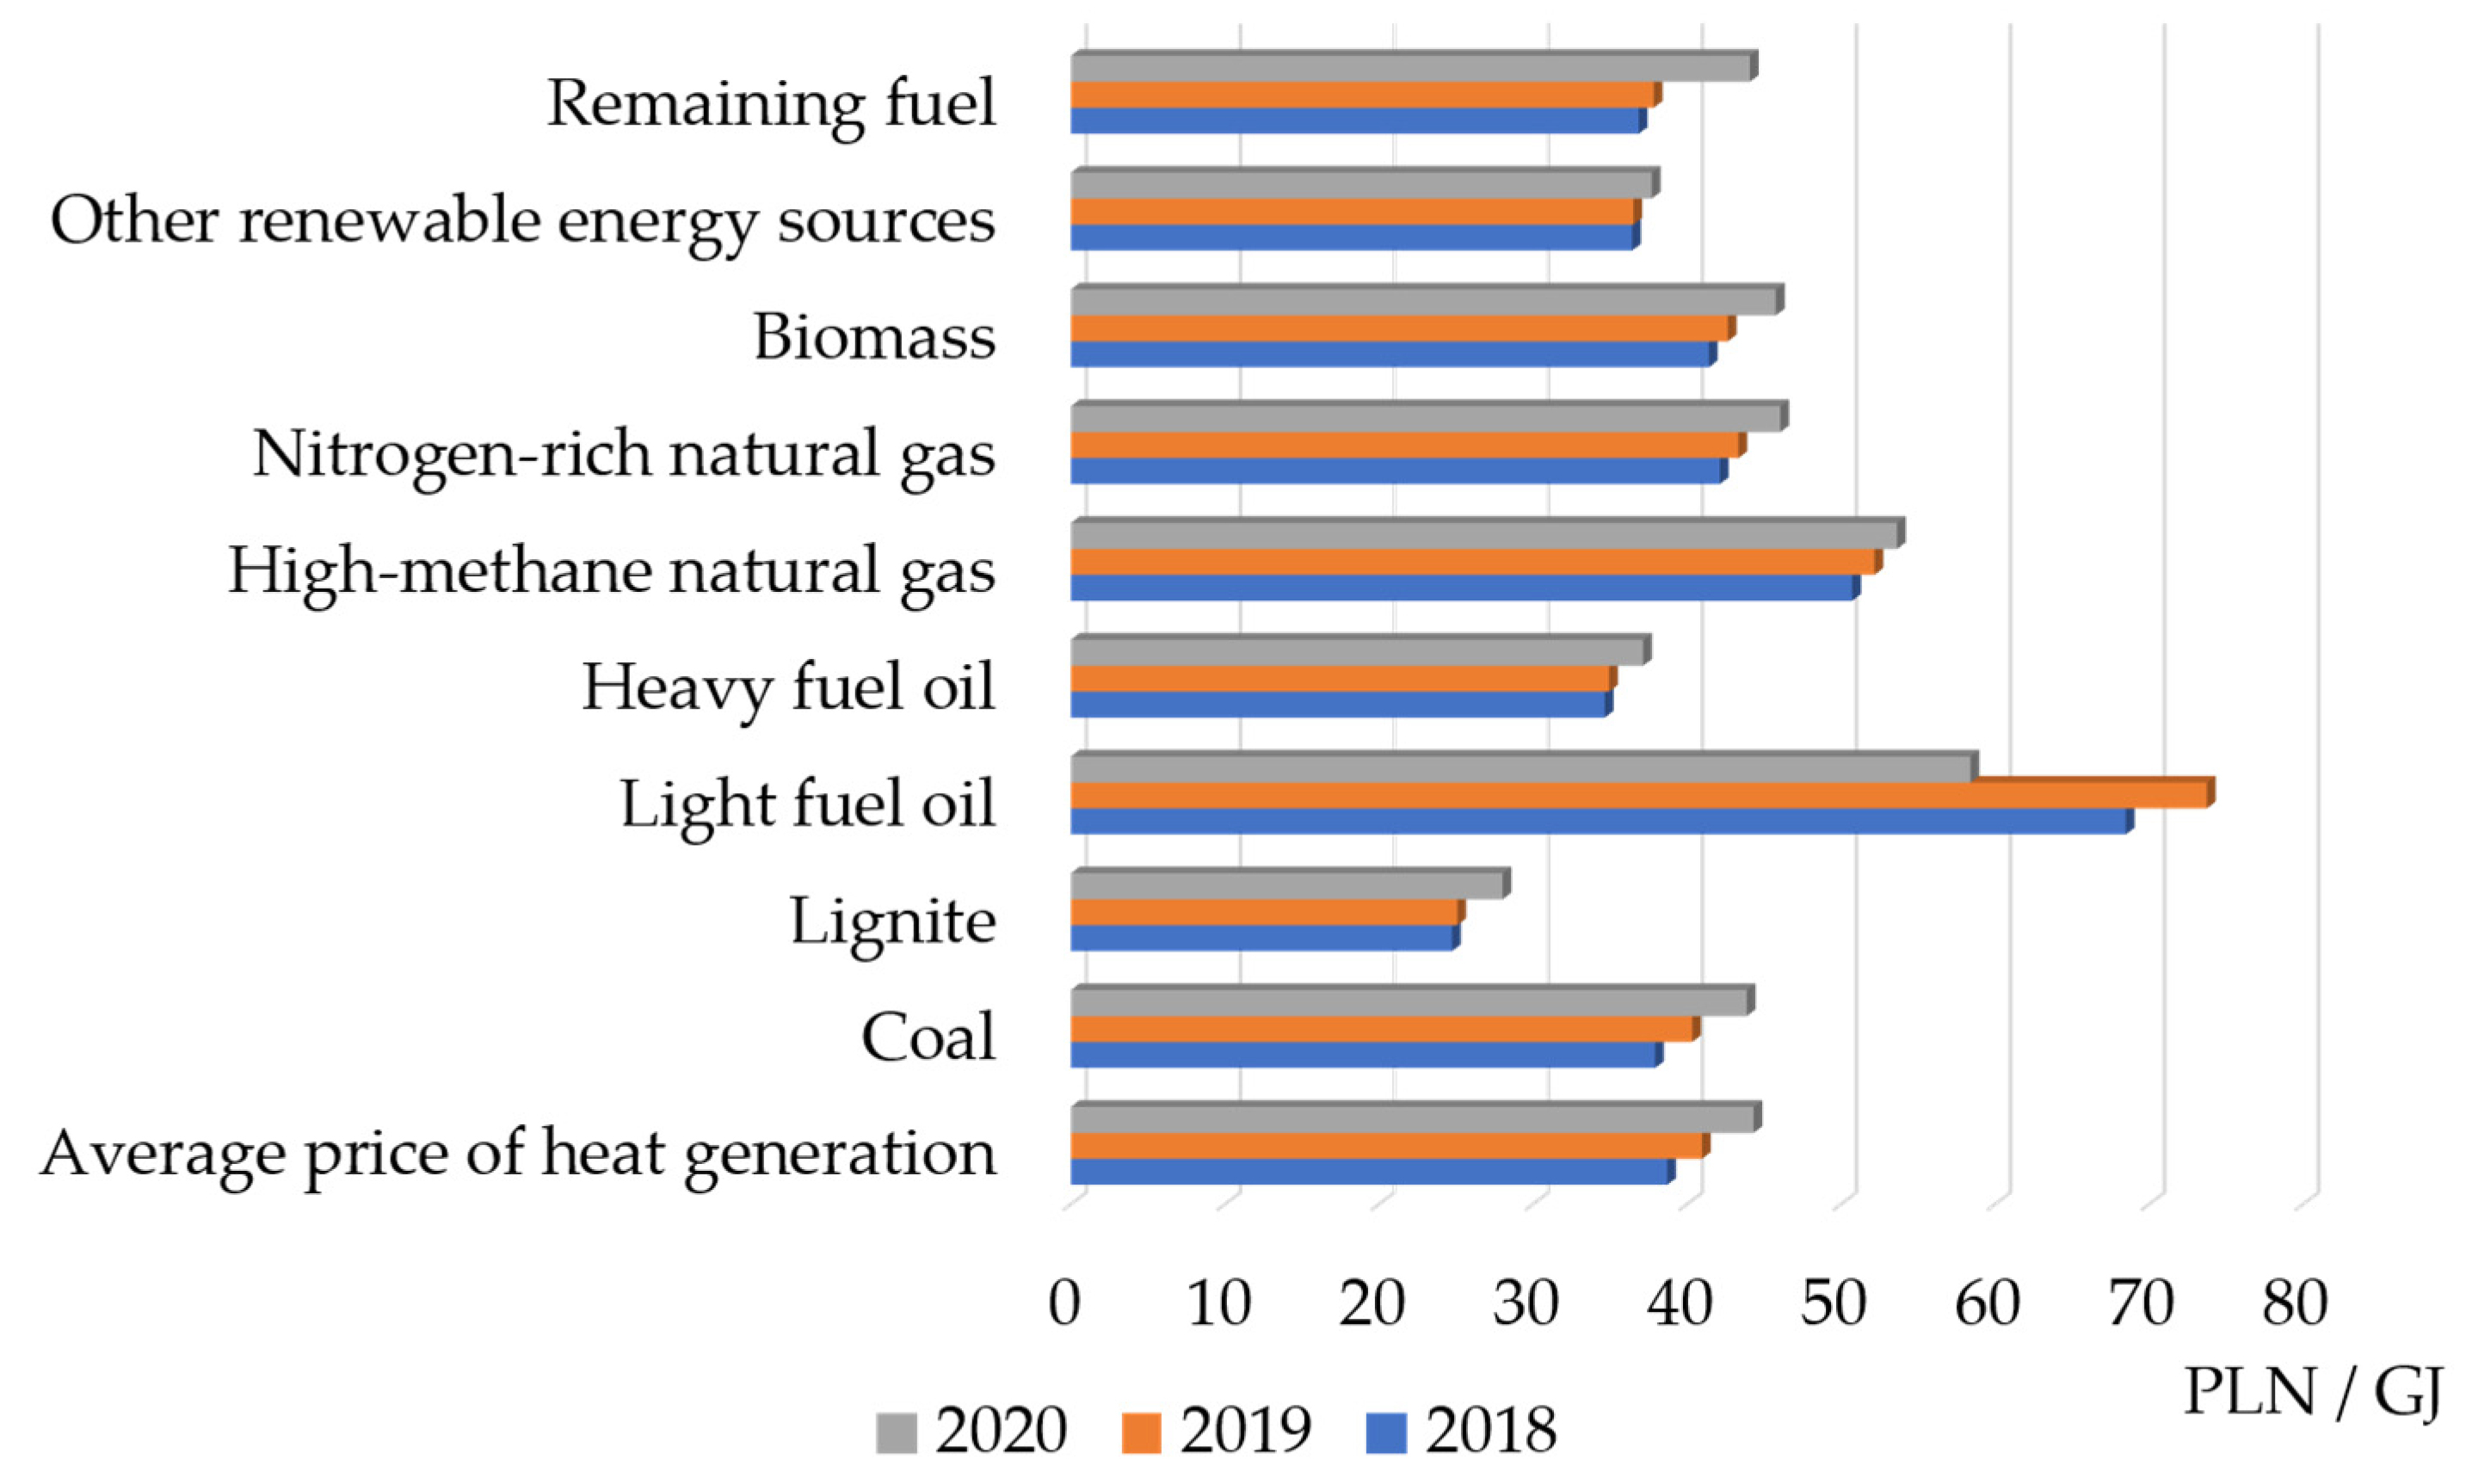
The following years show a significant increase in prices. According to the data published by URE in 2021 [97], the average sales prices of heat generated in units owned by licensed heating companies amounted to PLN 51.91 / GJ in units fired with coal fuels, PLN 75.66 / GJ in units fired with fuel oil, PLN 72.02 / GJ in units fired with gaseous fuels and PLN 46.12 / GJ in units representing renewable energy sources. The selling price depending on the type of fuel are shown in Figure 7. In 2021, compared to 2020, the price of coal fuel and gas fuel is growing, only the prices of heating oil and fuel from RESs have decreased.
When analyzing the fuel price, one should mention the constantly growing cost of CO2 emission allowances in the total production costs. As reported by PSE [98], the average price of CO2 in July 2022 ranges from PLN 370.96 / MG CO2 to PLN 413.59 / MG CO2. The recorded rapid increase in the price of allowances means an increase in the price of energy. It should be noted that the prices of CO2 emission allowances have been rising for several years. In recent months, a significant acceleration in price growth has been observed. Early in 2022, markets struggled with record commodity prices, which was especially felt in the case of gas. It was undoubtedly the result of the Russian invasion of Ukraine. Another factor were the quotations of CO2 emission allowances, rubbing against nearly EUR 100 / t. This situation certainly translated into even higher costs of heat production in 2022, thus worsening the results of enterprises.
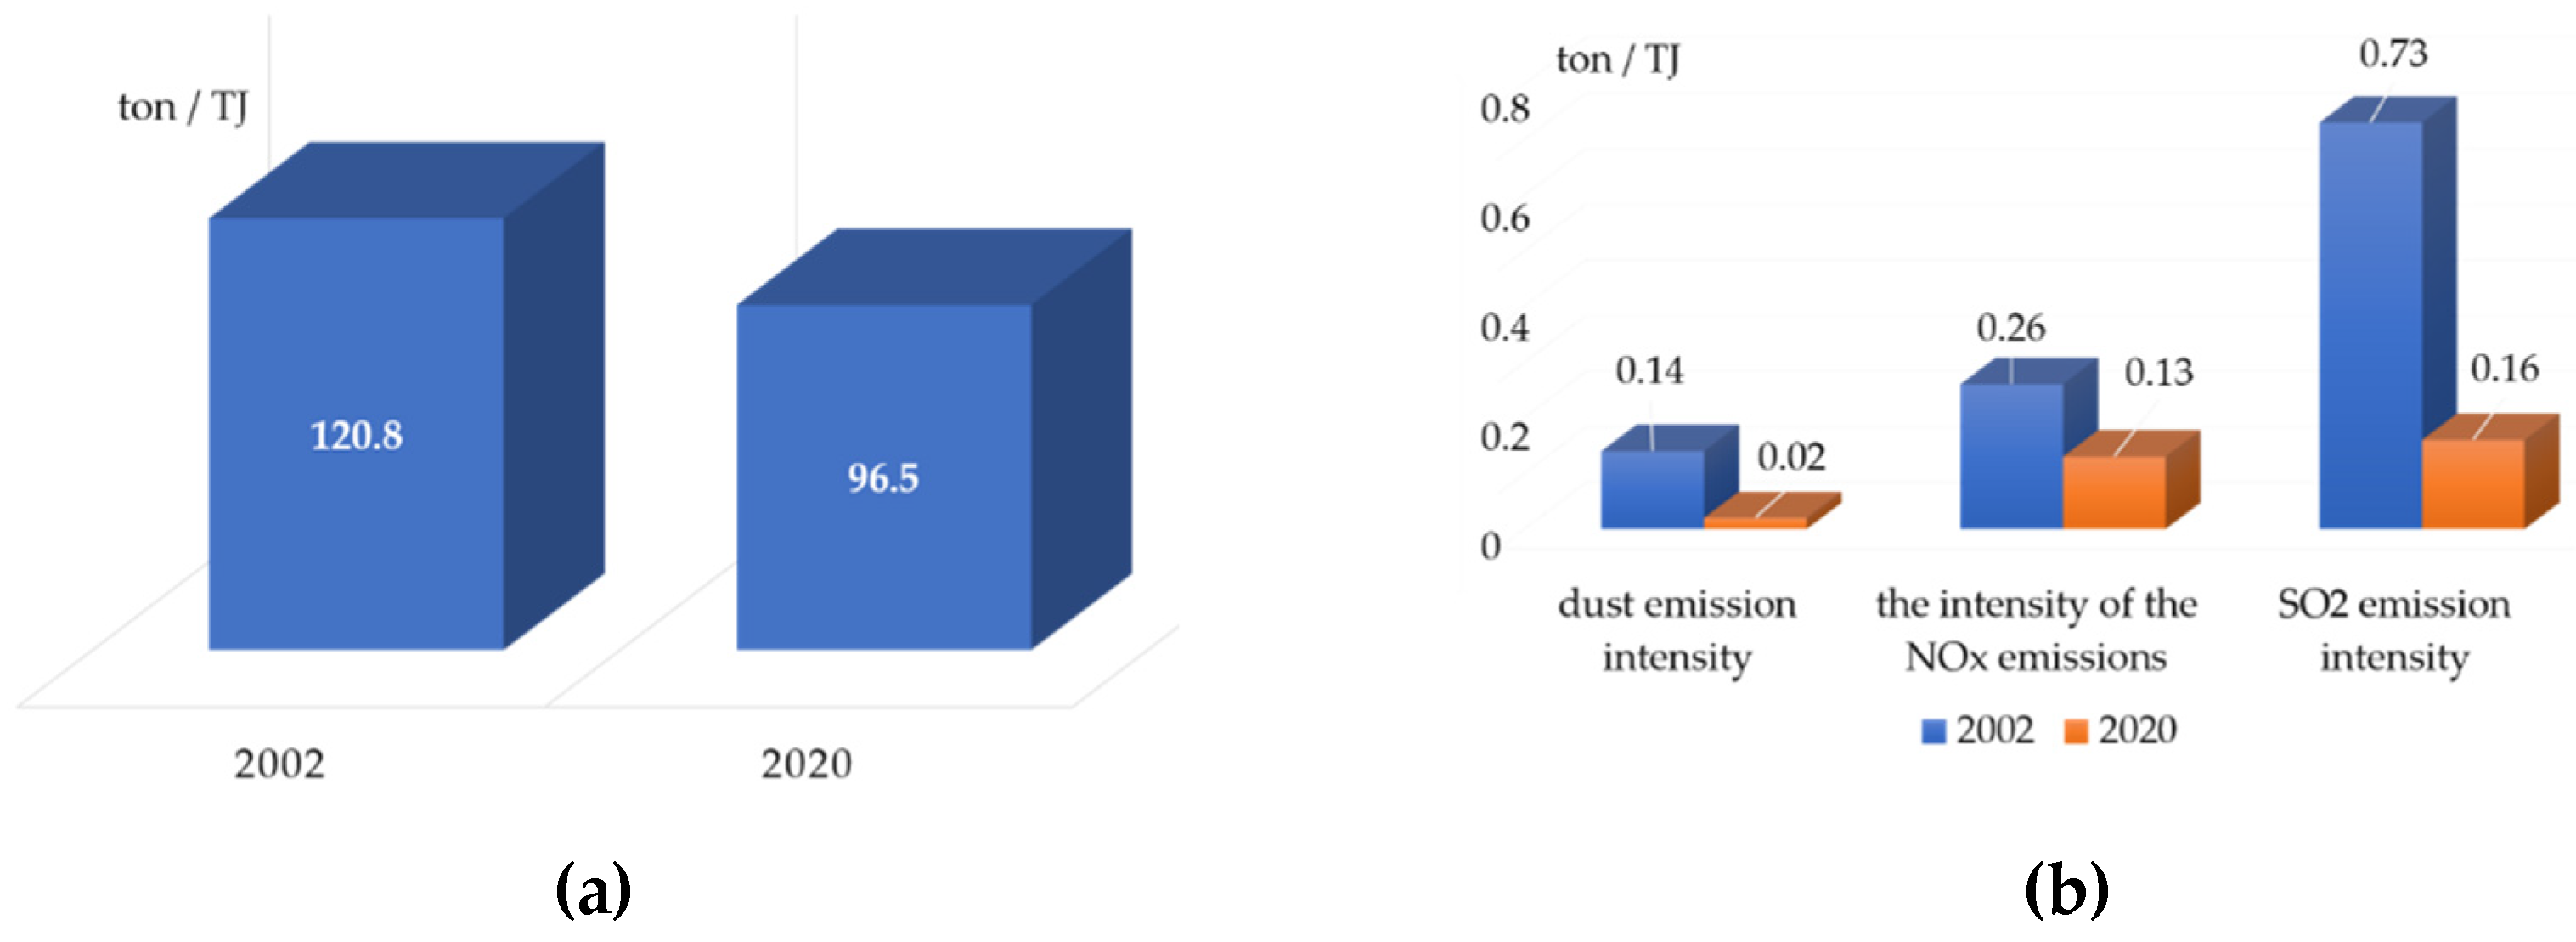
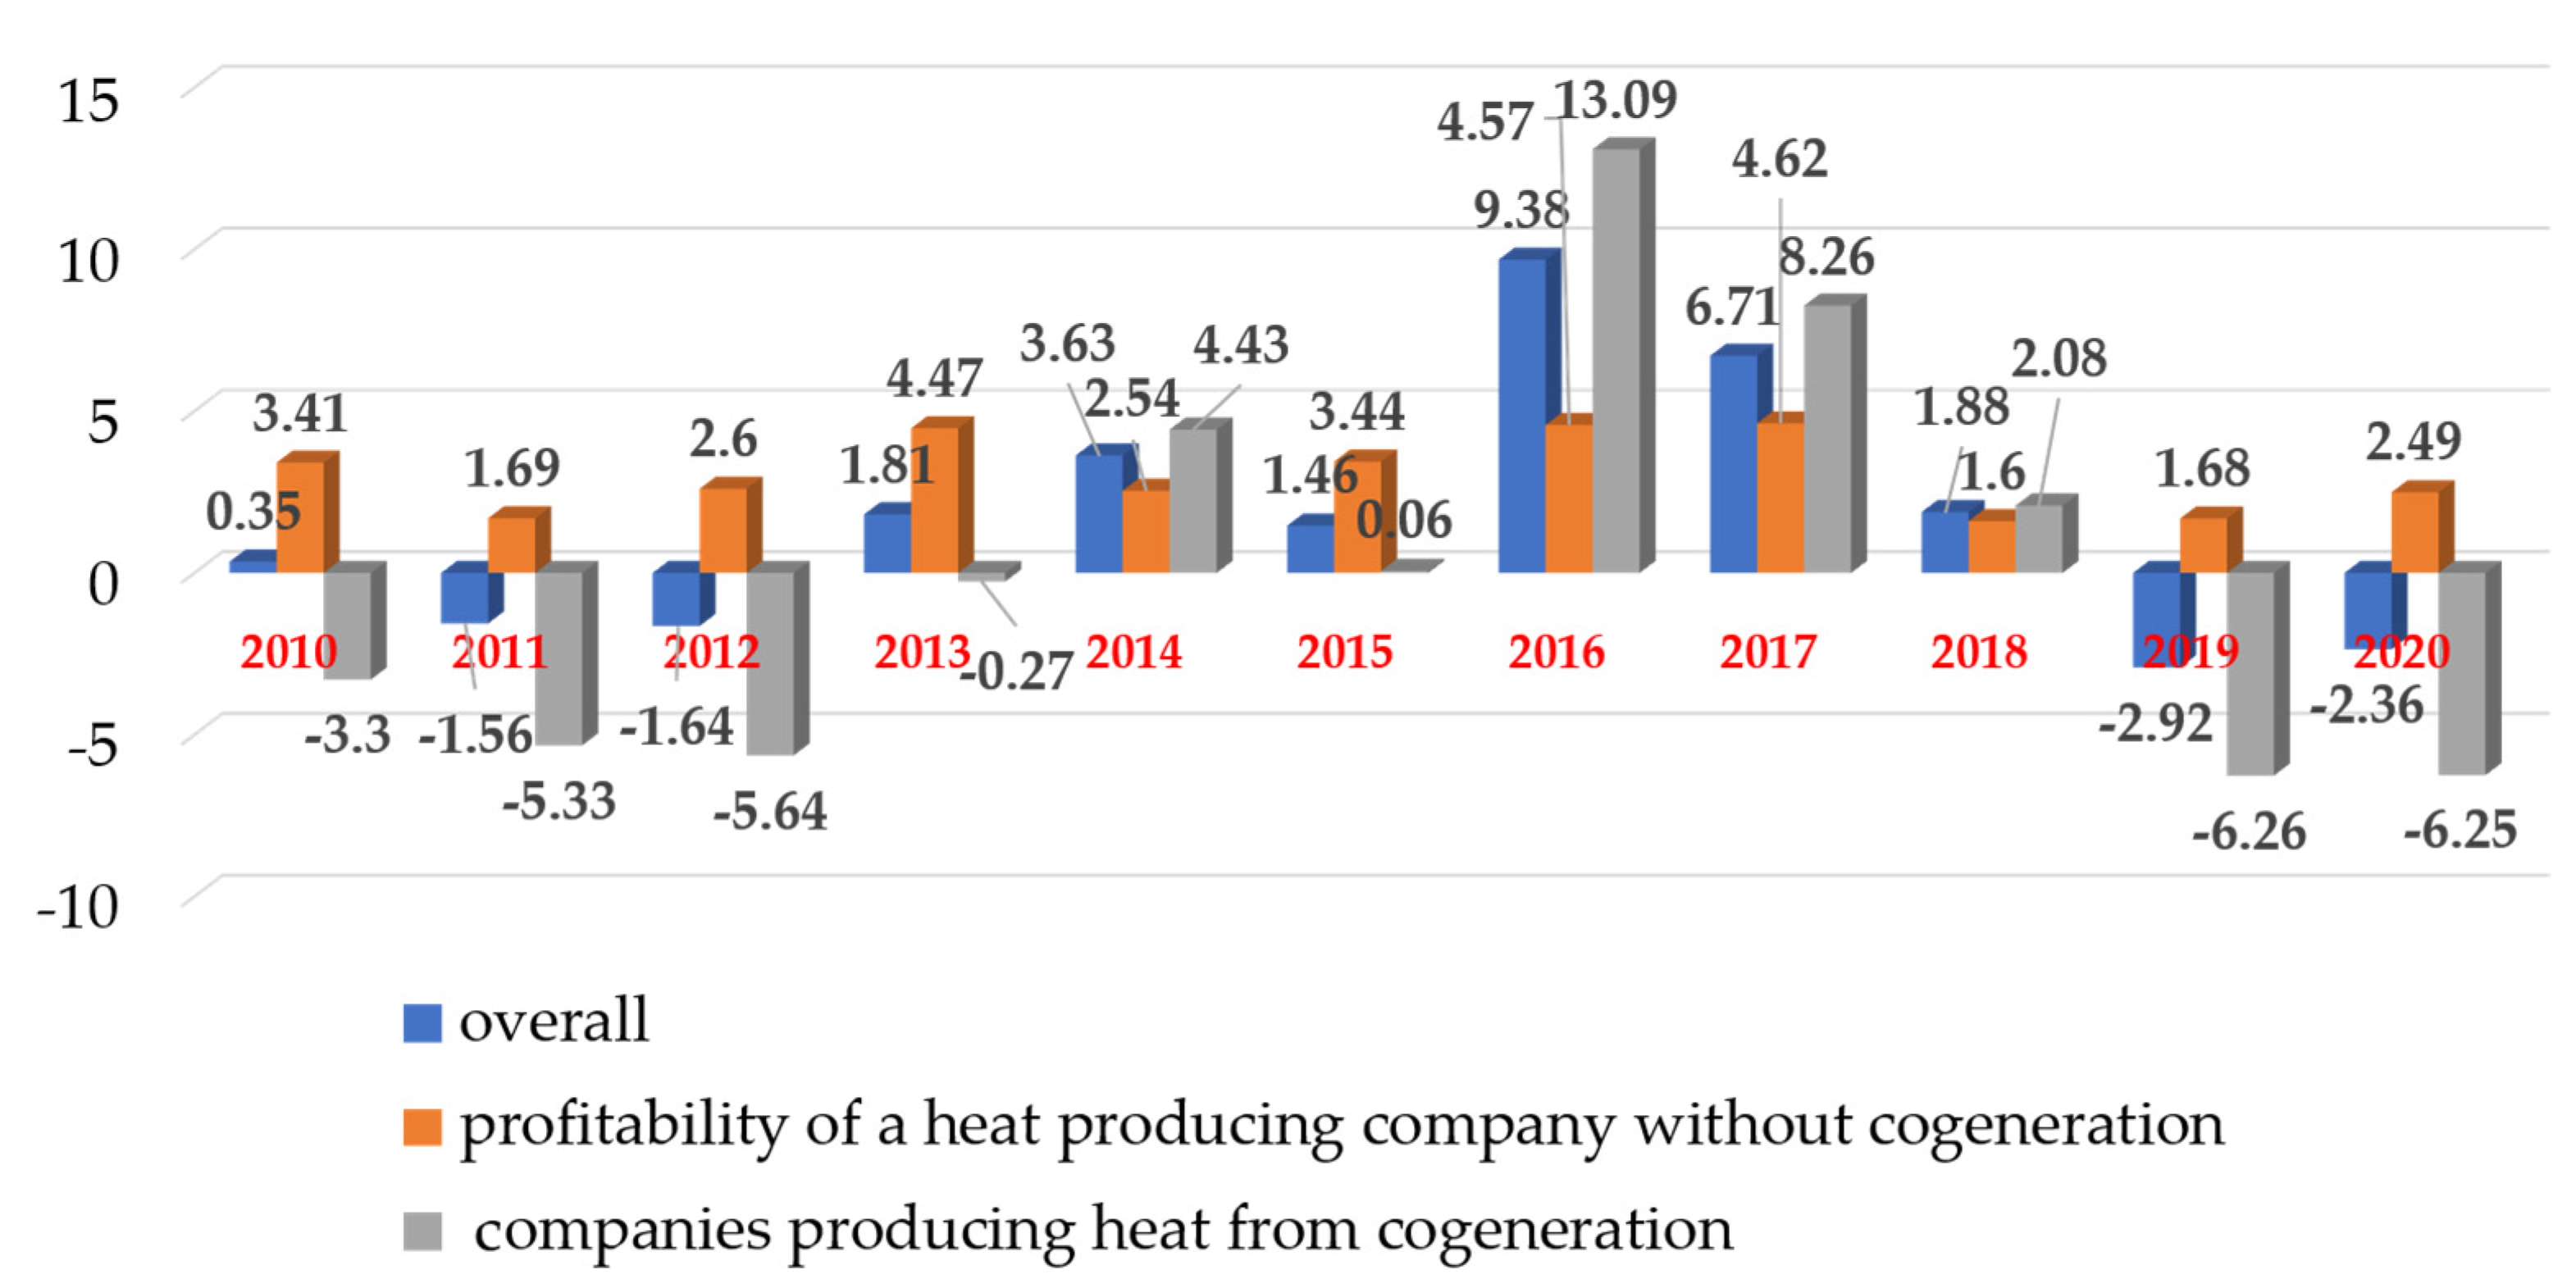
According to the data of the Energy Regulatory Office [94], in 2020 the revenues generated by the licensed heating companies did not cover the costs of conducting activities related to supplying heat to consumers. The recorded gross financial result amounted to PLN (–) 473 million. As a result, heating companies have become unprofitable with profitability parameters in (–) 2.4% (in 2019 it was (–) 2.9%). The main reason for such poor profitability in these years are the very high costs of purchasing CO2 allowances. According to the figures presented in the charts (see Figure 8), a decrease in carbon dioxide and other gas emissions can be seen in the period from 2002 to 2020. However, it is necessary to maintain this downward trend, which requires constant restructuring and financial outlays. Figure 9 shows the profitability of heating companies in the period from 2010 to 2020. It can be seen that in 2020 most companies in the heating sector were unprofitable. In 2020, the profitability of companies generating heat without cogeneration was (+) 2.49, and with cogeneration (–) 6.25. This proves the great financial outlay that had to be expended in order to restructure the company.
In accordance with the opinion of the President of URE [99], high CO2 prices and forecasts of their further increases raise justified concerns of all market participants, due to their practically direct impact on the prices of both electricity and heat. At the same time, failure to undertake the necessary investments in emission reduction, modernization, and change of the method of generation in individual sources may, in the long term, result in a permanent increase in heat prices and, consequently, a reduction in the use of district heating for the purposes of supplying customers with heat. It is indisputable when analyzing the galloping prices of fuels and CO2 emissions, the only right thing to do is to develop a technology based on renewable energy sources, biomass and hydrogen.

4. Development goals

4.1. Goals of the European Union and Poland

The vast majority of district heating systems in Poland still remain ineffective. The current definition of an effective heating and cooling system states, that it is a system in which heat or cold is used to produce:
  • at least 50% of energy from renewable sources or
  • at least 50% of waste heat, or
  • at least 75% of heat from cogeneration, or
  • at least 50% combination of such energy and heat.
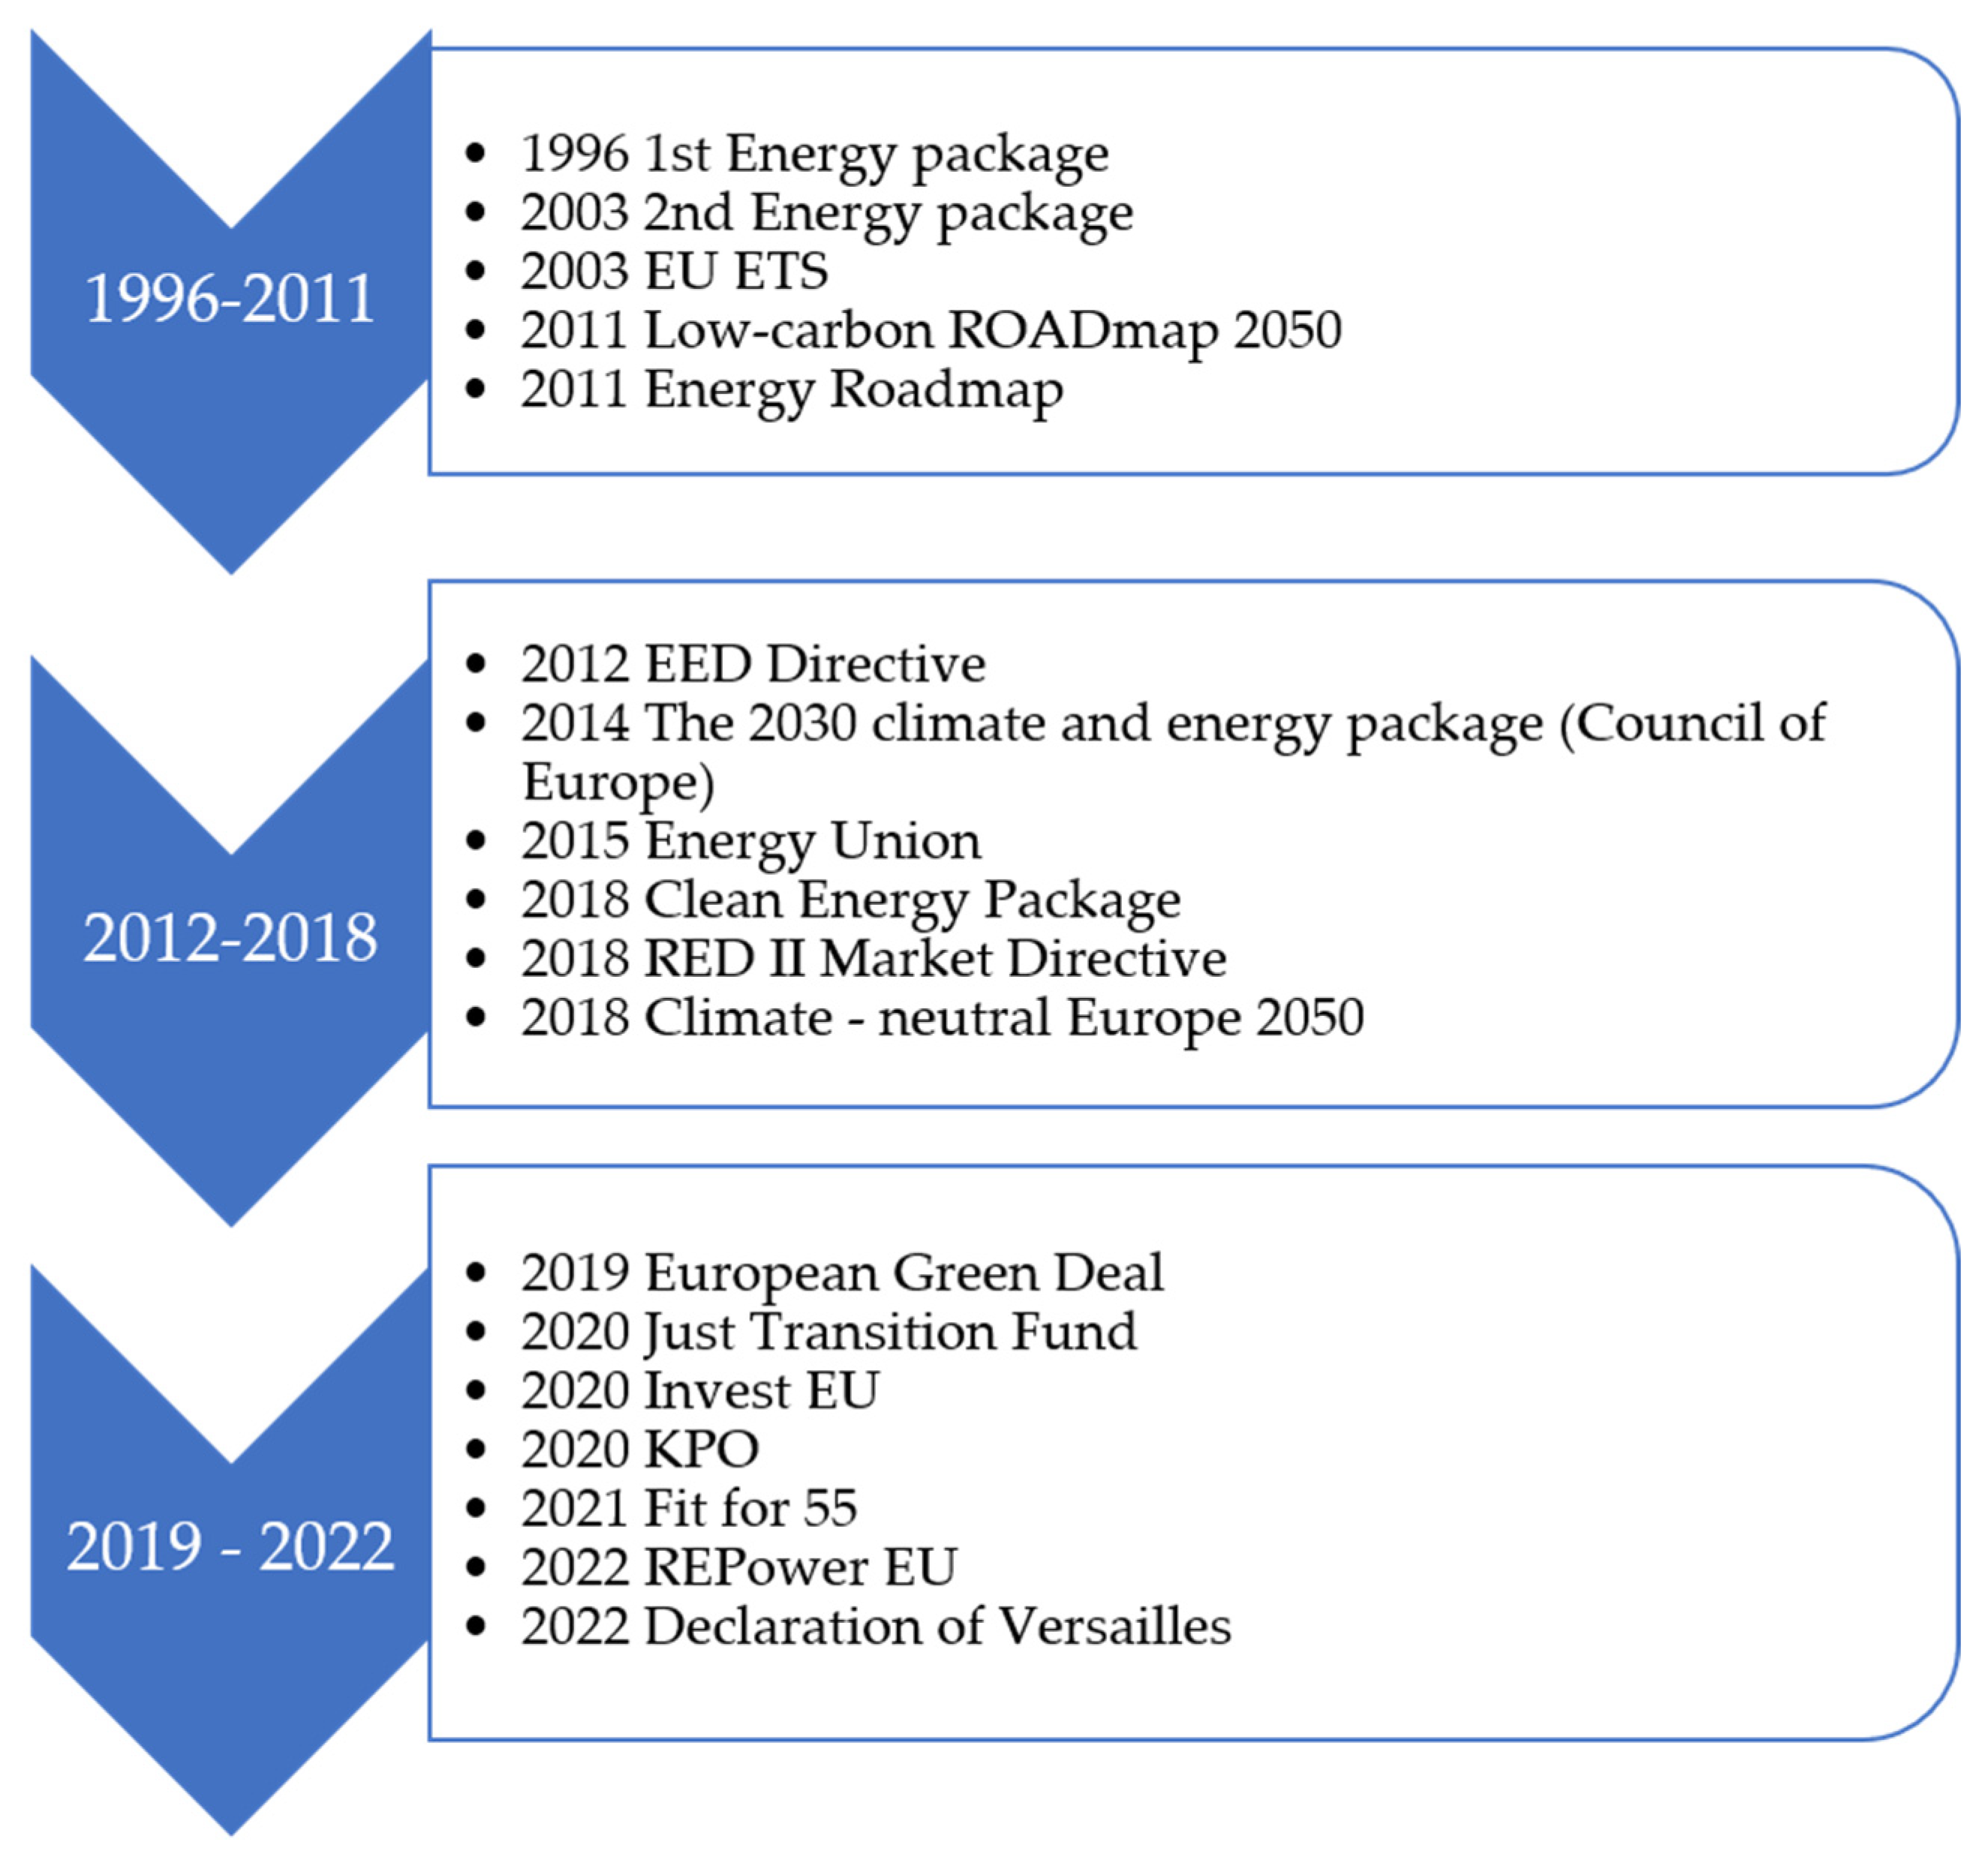
Since 1996, the European Union has adopted many guidelines regulating the energy transformation, which, as stated by Institute of Renewable Energy (IEO) [98], can be summarized in Figure 10.
The directions of transformation of the entire heating sector have been strongly emphasized in two basic strategic documents for the Polish energy sector, namely the National Energy and Climate Plan for 2021-2030 (KPEiK) [10] and Poland's Energy Policy until 2040 (PEP2040) [9]. All actions indicated by PEP 2040 are to be based on three pillars. The first one says that only the transition, where energy poverty is eradicated and jobs related to the extraction of fossil fuels is eliminated, is supplemented by new industries related to renewable energy sources (also in heating) and nuclear energy. The second pillar indicates that a zero-emission energy system, in which, apart from offshore wind energy and nuclear energy, a prominent place takes local and community energy, which, for heat, may mean the revival of prosumer activity not less than that observed recently in electricity generation. Finally, the third pillar emphasizes good air quality, which makes it necessary to transform heating, especially local heating, and thus heat generated in home furnaces.
Moreover, PEP 2040 includes the guidelines, as the key elements, for district heating.
  • By 2040, the thermal needs of all households are to be covered by system heat and by zero-emission or low-emission individual sources;
  • There should be a significant increase in the installed capacity of photovoltaics, approx. 5–7 GW in 2030 and approx. 10–16 GW in 2040, which will enable low-cost use of electricity used to drive heat pumps and switch to heat generation from electricity auto producers and prosumers;
  • It is expected that natural gas will be a bridge fuel in the energy transformation, and in 2030 the capacity to transport a mixture containing about 10% of decarbonized gases via gas networks will be achieved, which will enable low-emission heat generation in cogeneration, both in economic activity and in own needs. The possibility of using decarbonized fuel will facilitate the transformation of energy companies towards effective heating systems (an appropriate share of heat from cogeneration, heat from RES or waste heat in the system;
  • The low-emission direction of transformation of individual sources should be implemented through the use of heat pumps, solar collectors and electric heating, which will facilitate the achievement of the goal of abandoning coal combustion in households in cities by 2030, and in rural areas by 2040;
  • The most anticipated innovations for heating may be:
    • heat storage technologies that will allow for the optimization and effective operation of sources generating heat and electricity in cogeneration, regardless of the passing peaks of the demand for these products, which will increase the operational safety of the entire power system;
    • electricity storage facilities, which will allow for further dynamic development of sources based on solar and wind energy, as they will eliminate their most serious disadvantage, instability and dependence on natural conditions;
    • hydrogen technologies, especially technologies enabling the production of "green hydrogen", which will allow the development of local hydrogen clusters based on local production of hydrogen associated with decentralized production of renewable energy (including "green heat") and local demand, and the dedicated hydrogen infrastructure can use hydrogen for the production and supply of heat to residential and commercial buildings.
In addition to energy security as well as competitiveness and energy efficiency, the goal of PEP 2040 is a limited impact of the energy sector on the environment. Therefore, with regard to heating, specific objectives were included, the leading of which are:
  • The need to cover heat needs on an individual basis by using sources with the lowest possible emission (heat pumps, electric heating, natural gas—preferably with decarbonized gas) and the coal phase-out—in cities by 2030, and in rural areas by 2040;
  • The assumption that approx. 1.5 million new households will be connected to the heating network by 2030;
  • Heating or cooling systems, in which the ordered capacity exceeds 5 MW, at least 85% in 2030 will meet the criteria of an energy-efficient heating system (currently it is approx. 10%);
  • Assumption that in the next decade there will be an increase in heat generation from RES by at least 1.1 pp. every year, which, according to the (KPEiK), gives the expected 28.4% share of renewable sources in the entire heating sector in 2030.
One cannot forget about the challenges of Fit for 55 [93]. The package consists of several legislative proposals related to greenhouse gas emissions and is intended to enable the EU to achieve a higher net greenhouse gas emission reduction target of at least 55% in 2030. The district heating sector is mainly influenced by the following directives: Energy Efficiency Directive (EED) [100], Renewable Energy Directive (RED III) [101] and the Energy Performance of Buildings Directive (EPBD) [102].
The Energy Efficiency Directive states:
  • there is a new criterion to introduce a limit for direct CO2 emissions (for units using fossil fuels) of less than 270 g CO2 per kWh of combined heat and power (combined heat, electricity and mechanical energy). The direct emissions limit will apply from the entry into force of the recast directive, while its role will be particularly important from 1 January 2026, when the criteria in the definition of an efficient heating and cooling system will refer directly to high-efficiency cogeneration;
  • prevent coal-fired cogeneration from maintaining its high-efficiency status and, at the same time, introduce an emission limit for gas-fired units. The entry of the new criterion will mean that coal-fired cogeneration units, which will not be modernized by the end of 2025, will lose the status of high-efficiency cogeneration, which in the vast majority of systems will also translate into the loss of the status of an effective heating and cooling system. The draft EED directive does not explicitly define the methodology for calculating the new emission criterion. This is important in the context of the operating conditions of cogeneration units, including the seasonal change in the heat curve and system services provided for the power system—factors affecting the level of direct CO2 emissions.
The abovementioned criteria pose a high risk for the heating sector in Poland. In the event of failure to implement new technologies and decarburization strategies, enterprises may lose financial support resulting from subsidies from the European Union.
The Renewable Energy Directive changes the definition of district heating and cooling in order that in the following years it meets the following criteria:
  • by 31 December 2025, a system using at least 50% renewable energy, 50% waste heat, 75% cogeneration heat or 50% a combination of such energy and heat (existing definition);
  • from 1 January 2026, a system using at least 50% of energy from renewable sources, 50% of waste heat, 80% of heat from high-efficiency cogeneration or at least a combination of such heat supplied to a network with a renewable energy share of at least 5%, and the total share of renewable energy, waste heat or heat from high-efficiency cogeneration is at least 50%;
  • •from 1 January 2035, a system using at least 50% of energy from renewable sources and waste heat with a share of energy from renewable sources of at least 20%;
  • from 1 January 2045, a system using at least 75% of energy from renewable sources and waste heat, with a share of energy from renewable sources of at least 40%;
  • •from 1 January 2050, a system using only renewable energy and waste heat with a share of energy from renewable sources of at least 60%.
This criterion will enable heating plants to become effective only in the case of an increase in the share of renewable energy and waste heat. In addition, gas cogeneration with a large admixture of hydrogen or only hydrogen will be the preferred technology (in the case of green hydrogen). Taking into account the conditions of Polish heating, the success and postulate of the European Commission is to divide the systems into smaller installations.
The Energy Performance of Buildings Directive assumes:
  • a national building renovation plan to replace long-term renovation strategies. One of the elements of the plan is to identify policies and measures to decarbonize the heating and cooling sector through district heating and cooling, and phase out fossil fuels in these sectors with a view to their complete phase-out by 2040 at the latest;
  • complete gas elimination by 2040—target inconsistent with overall policy objectives;
  • inability to connect new buildings after 2030 to efficient heating systems that are not completely decarbonized.
The idea behind the implementation of RED and a fair energy transition requires a combination of technological solutions with more open decision-making, based on reliable analysis, knowledge in the field of engineering, spatial planning and social sciences [103]. However, the new EU climate package "Fit-for-55" prepares a change of the definition of an effective heating system and excludes heat from sources with emissions above 270 kg CO2 / MWh [104], which means that it is impossible to obtain investment support by gas cogeneration (this is also confirmed in the principles of the so-called green taxonomy). Therefore, cogeneration does not fully meet the idea of a transitional fuel, as it is inflexible, poorly controllable and does not eliminate the limitations of solar and wind sources, while being constantly emissive and dependent on the rapidly growing price of gas fuel. Cogeneration systems must undergo a strong transformation towards zero-emission systems in the near future. To be competitive, they will also have to be emission-free and operate flexibly in the heating system, in synergy with the operation of weather-dependent sources.

4.2. The Involvement of Renewable Energy Sources in Heat Engineering and Potential Directions of Development

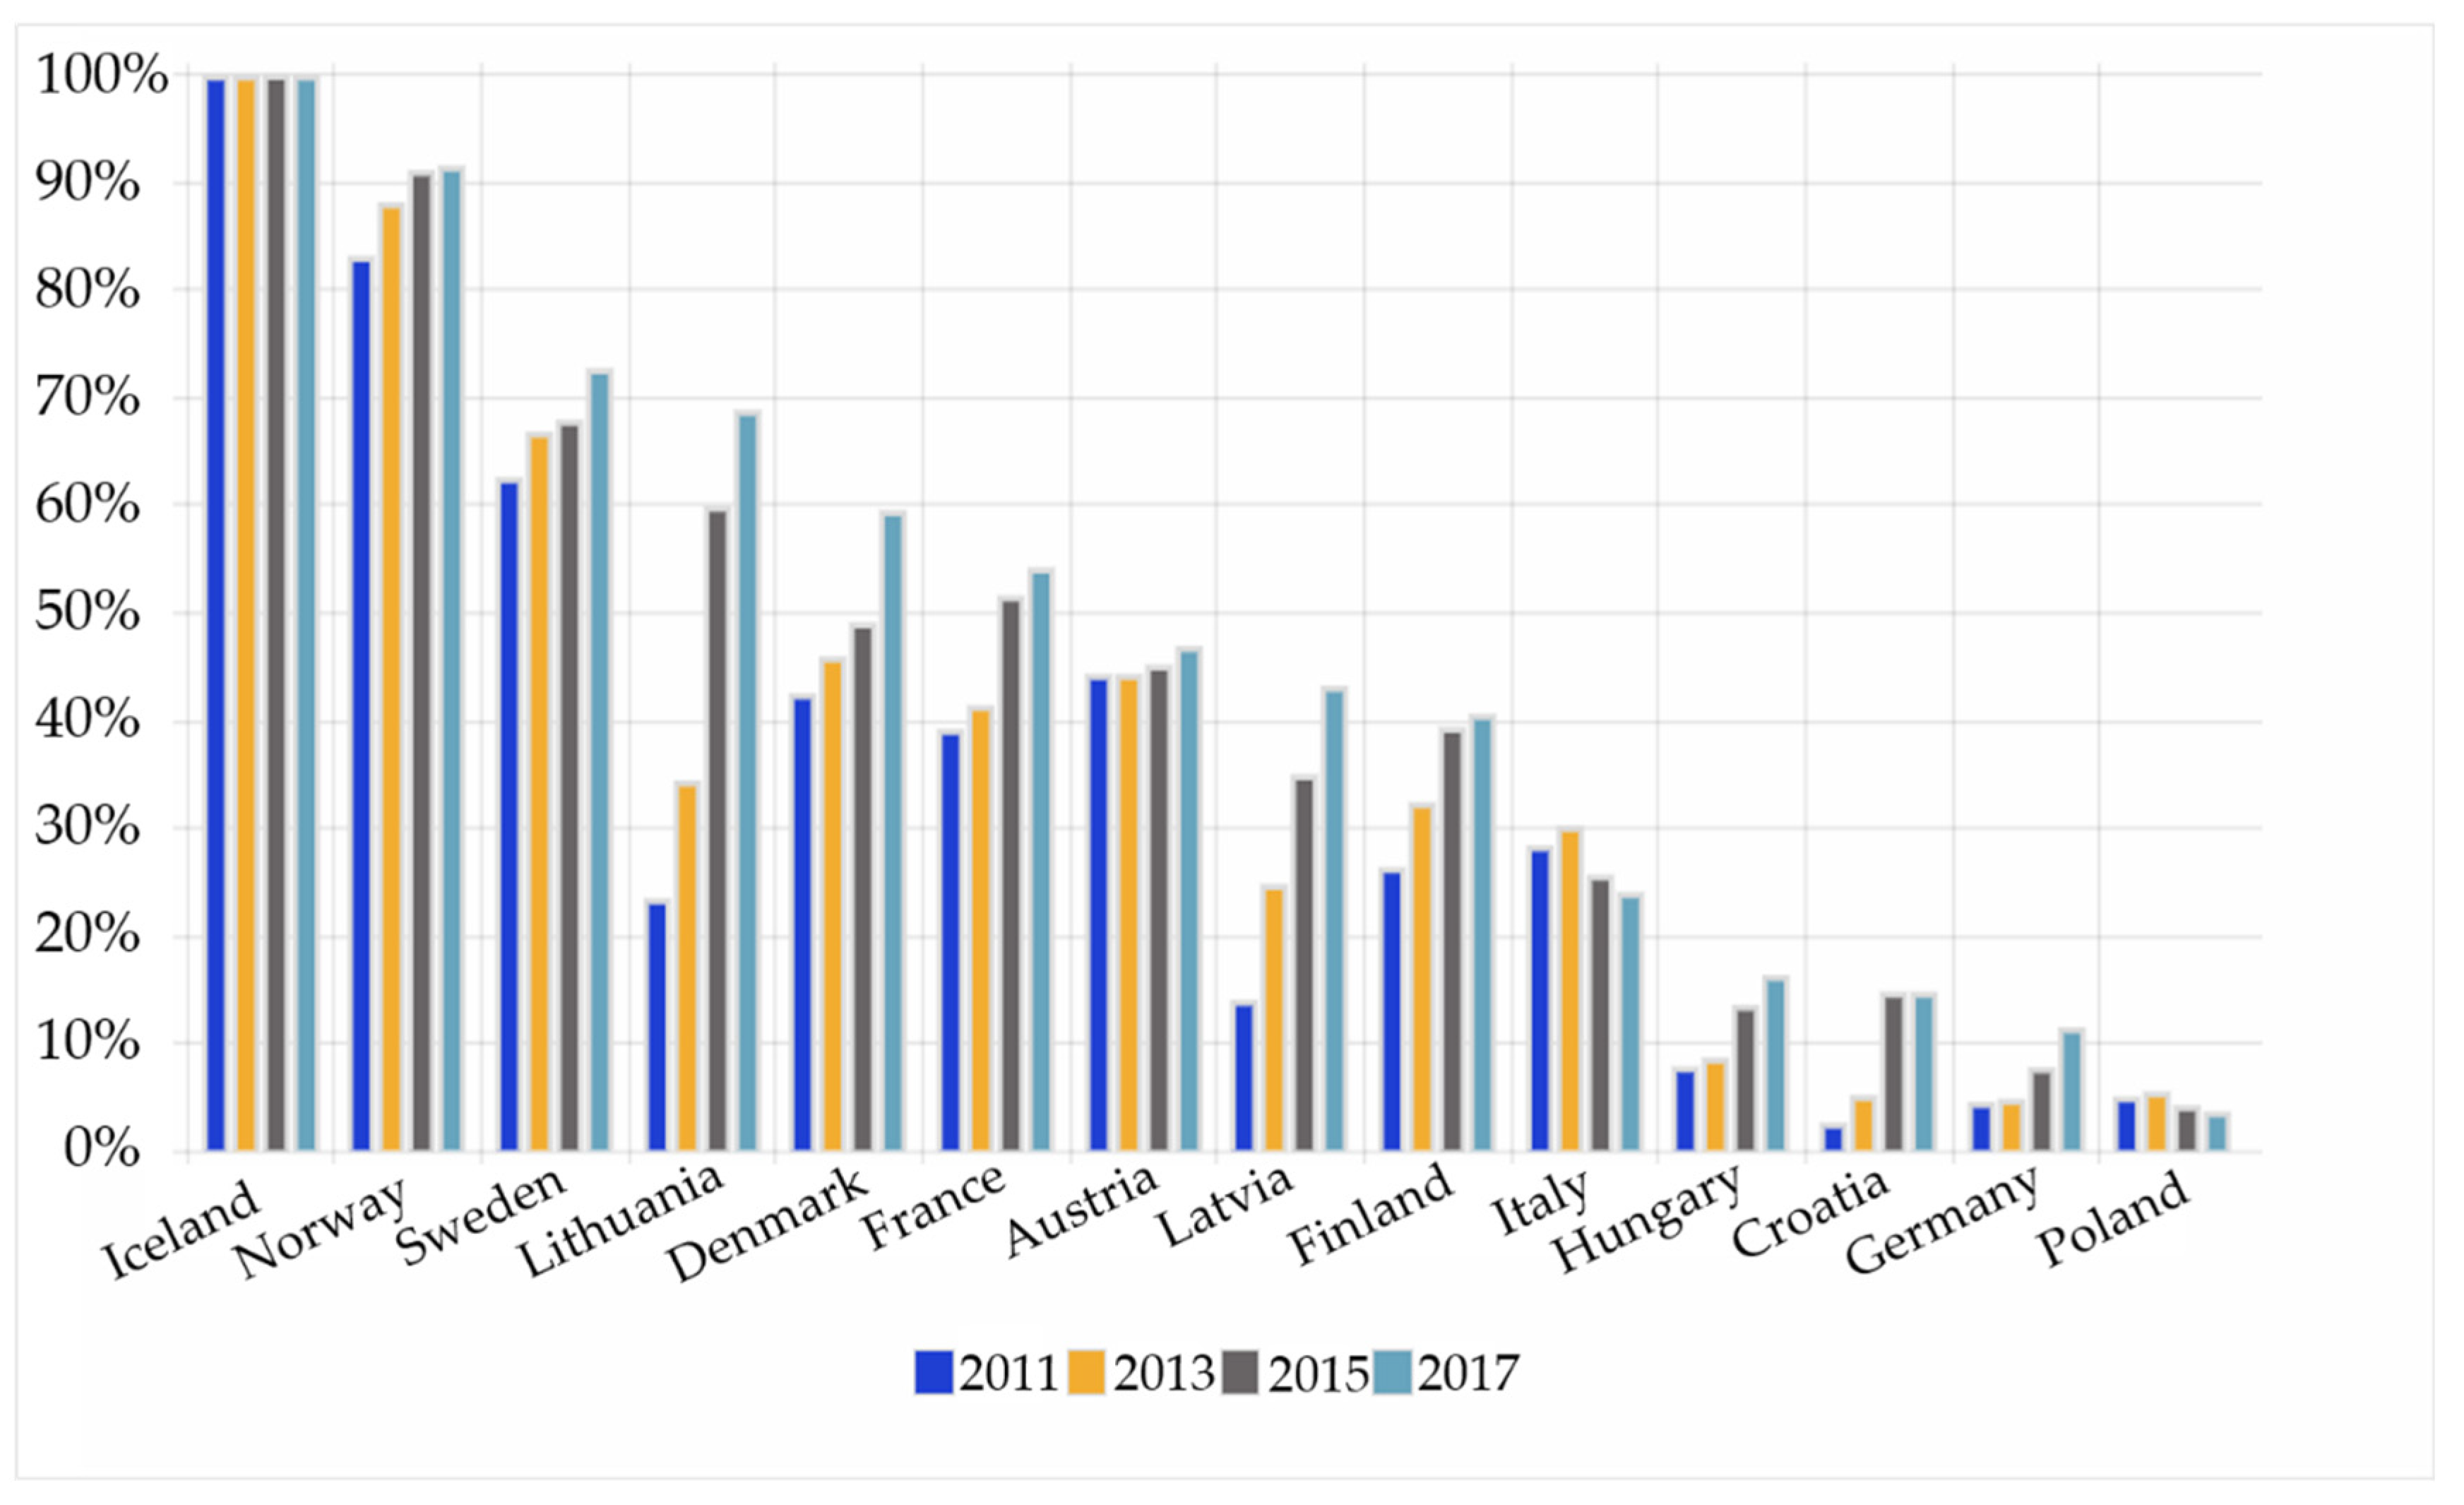
The share of renewable energy in district heating in selected EU Member States was discussed in [105] and is shown in Figure 11. According to these data, it can be concluded that heating companies in Poland, compared to other countries, face a major challenge in implementing the requirements of the directives. This transformation is time-consuming and requires a large financial investment.
The very right and accurate goals of technology change for the energy sector in the context of the impact of the European Union's policy in the perspective of 2025 and 2030 were set by the Chamber of Commerce Polish District Heating [106], namely:
  • Generation of energy from emission-free sources;
  • Energy storage;
  • Development of decentralized production of energy from renewable sources;
  • Electrification of the heating sector;
  • Promoting more sustainable and efficient technologies and solutions;
  • Closer integration of the electricity and heating sectors;
  • Use of waste for energy production;
  • Development of modern, low-temperature heating systems;
  • Improving the energy infrastructure and making it resistant to climate change;
  • Adapt infrastructure with intelligent and cybersecurity digital solutions.
The directions of the development can be found in Figure 2.1. However, according to the Institute for Renewable Energy [107], large cities are forced to spread the energy transformation process towards zero-emission ones over a longer period and rely on the import of low-emission energy carriers, at least until zero-emission (green) hydrogen becomes popular or until the share of renewable energy sources is 100% in electricity generation. The period of this perspective for the next 20 years will still result in high costs of heat generation, and thus high heat prices for consumers. Smaller cities look different, as their location gives greater access to other fuel sources, including renewable energy.
In the climatic conditions of Poland, from 1 km2 allocated to the production of energy from renewable sources can be obtained respectively [108]:
  • 1440 TJ from solar thermal energy (solar collectors, efficiency 40%);
  • 360 TJ from solar photovoltaic energy (efficiency 10%);
  • up to 150 TJ from wind energy (with a high density of windmills of 20 MW / km2);
  • up to 15 TJ from biomass (with the most efficient energy crops).
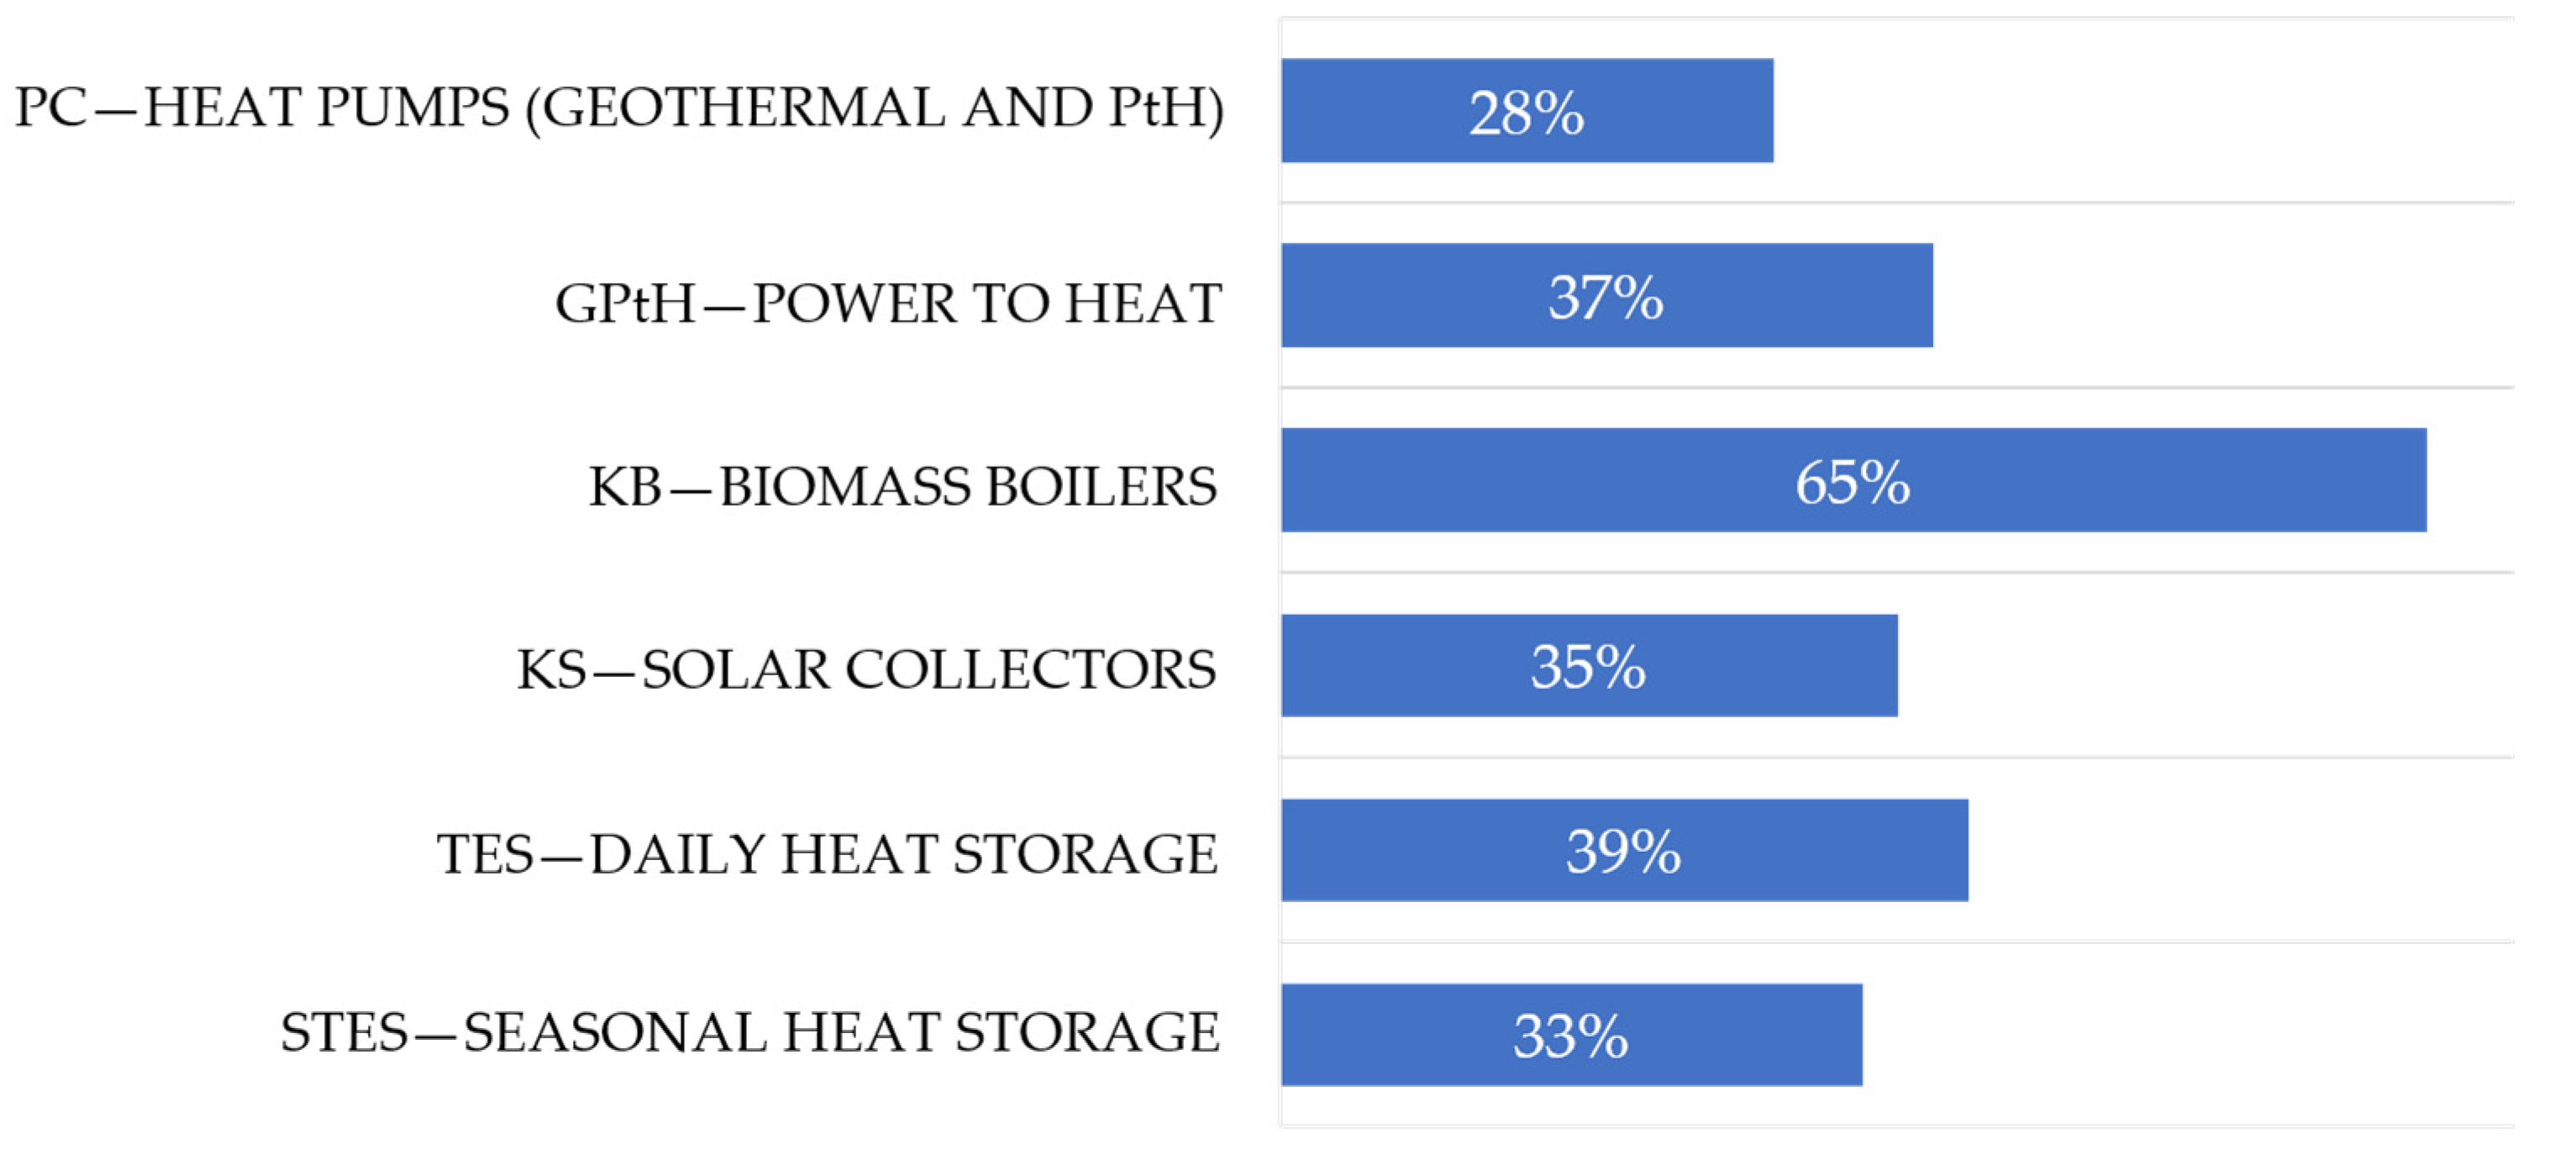
According to the research carried out by IEO in cooperation with the Chamber of Commerce Polish District Heating, as part of the work for the National Fund for Environmental Protection and Water Management [109], recent years have shown an increase in the acceleration of energy transformation towards RES in smaller towns. Heating companies intended to invest and use various renewable energy sources (also other than biomass, which, as a result of the EU policy on taking into account its carbon footprint, is losing significantly) not used so far, see Figure 12.
The research also showed great interest among enterprises in small towns in daily heat storage and in the Green Power-to-Heat (PtH) technology, which allows, for example, the use of unbalanced wind energy in heat plants, which is very popular. We still do not have the technologies implemented. This requires large financial outlays. This is what the research programs of the National Center for Research and Development [110] under pre-commercial procurement are to serve.

4.3. New Technologies for Construction

Rising energy costs from fossil fuels generates great interest in devices that use renewable energy. Heating companies more and more often choose biomass as fuel. Biomass is considered a renewable energy solution. The most popular types of biomass for boilers are: wood chips, pellets and lump wood. A case study of heating solutions based on renewable energy sources in France was presented in [111]. Heat pumps or biomass centralized installations are resistant to different future conditions, while current natural gas domestic heating is underperforming compared to renewable technologies. It should be noted that the RED III directive imposes a reduction in the use of biomass after 2020. According to the opinion of IEO, biomass boilers can complement hybrid installations.
When replacing new technologies, one should remember about solar collectors and geothermal energy. Geothermal energy is a beneficial solution that does not adversely affect the environment. Unfortunately, it depends on the company's location and is still limited by high financial outlays and the lack of technology [96]. On the other hand, solar collectors are the most popular innovative technology. Its universality and availability translates into low costs. In Poland, the largest solar collectors that produce electricity for district heating are in Olsztyn, Iłża [112]. It is worth emphasizing that solar collectors can work with central heating boilers or heat pumps, on a large scale and on a smaller scale as home systems.
Fuel cells are very interesting and becoming increasingly popular technologies. The cell generates electricity from the oxidation of the fuel constantly supplied to it. Fuel cells, according to the electrolyte used, can be divided into [113]:
  • Alkaline (AFC—Alkaline Fuel Cell);
  • With molten carbonate (MCFC—Molted Carbonate Fuel Cell);
  • With phosphoric acid (PAFC—Phosphoric Acid Fuel Cell);
  • With a proton exchange membrane (PEMFC—Proton Exchange Membrane Fuel Cell);
  • Oxide (SOFC—Solid Oxide Fuel Cell).
The use of cells is very wide. They can be used in individual and collective transport, in P2G—power to gas technology, where the source is hydrogen, in combined systems generating electricity and heat for heating and cooling purposes, in large cogeneration units and micro, energy storage [114]. The power to gas (P2G) technology makes it possible, using hydrogen as a carrier, to store the resulting surplus electricity. The direction of the development of the Power to gas technology was presented in [115].
Fuel cells in combination with a pump or cooling can form a total micro-combined heating, cooling and power (CCHP) system [114]. A study [116] explored the potential of installed heating, cooling and power systems to support grid flexibility for each of the seven US Independent System Operators (ISO) / Regional Transmission Organizations (RTOs) using their operational data on three time scales (i.e. yearly, monthly and hourly). The results revealed that regardless of ISO / RTO, sector or season, more than 40% of installed combined heat and power (CHP) capacity has not been fully utilized and may be available to increase network flexibility. The available CHP power ranged from 0.7 to 8.7 GW and accounted for 1–9% of the peak electricity demand in the relevant ISO / RTO. Using this available cogeneration capacity it would be possible to avoid installation costs of up to USD 16.4 billion for new peak load plants to meet peak demand, growing capacity or other needs related to increasing levels of renewable energy generation. Due to reduced cold start cycles and part load operations, the installed CHP systems can reduce criteria pollutants and greenhouse gas emissions than those new peak installations. While this study focused on seven US ISO / RTOs, the approach could be applied in more local situations.
The development of technology would not be possible without the development of heat storage technology. Thanks to the storage, one can use energy that depends on the weather. According to the IEO, thermal stores have a significant advantage over electric ones, which can only store energy in hourly cycles and are more expensive. In [117] different types of magazines were presented.
On December 7th, 2021, the Polish Hydrogen Strategy until 2030 [118] with a perspective until 2040 was announced. In accordance with the policy, "green" hydrogen is a fuel that can very effectively replace gas and coal and appears as a remedy for the current problems of heating companies. The main assumptions of the Strategy are the objectives: implementation of hydrogen technology in the energy and heating sectors, as well as the use of hydrogen as a fuel for transport supporting the decarbonization of the industry. In order to achieve the goals in line with the Policy the following actions should be taken:
  • Implement hydrogen technology in the energy sector along with the definition of the legal framework;
  • Launch a P2G class 1 MW installation—support for stabilizing the operation of distribution networks; such installation will produce 3150 MWh of hydrogen / year;
  • Implement the possibility of co-firing hydrogen in gas turbines (depending on the technical capabilities of the turbine);
  • Start up cogeneration and polygeneration installations, e.g., medium-sized combined heat and power plants (50 MWt), where the main fuel will be hydrogen (demand around 580 GWh per year);
  • Start using hydrogen as an energy store;
  • Installation of polygeneration berths for apartment blocks, small housing estates and public utility buildings from 10 kW to 250 kW with the use of fuel cells.

5. Future of DH—Selected Case Studies

5.1. Berlin, Germany

A fifth-generation district heating network is to be built on the site of Berlin's Tegel Airport, which will be transformed into a modern office and residential district after its closure. The low-temperature network (LowEx) is to be 20-40 degrees Celsius and operate in a decentralized manner. It will receive surpluses of heat and cold produced in homes and offices that will not be used on site. The entire heating system is to integrate prosumers, energy storage, heat pumps, photovoltaic farms, cogeneration and geothermal installations [91].

5.2. Albertslund, Denmark

Building new generation networks in place of old heat pipelines is difficult, but not impossible. A good example is the Danish town of Albertslund (with a population of 30,000), which decided to implement low-temperature networks based on the already existing district heating infrastructure, which was built in the 1960s and 1970s. The decision was preceded by an ambitious renovation and thermal modernization program—most of the buildings in the municipality were built at the same time as the old district heating network. This made it possible to connect successive buildings to the heat network at a temperature of 55 ˚C in stages. The old network, operating at a temperature of 90 degrees, is still functioning, but it is gradually being replaced by a new one. Albertslund wants all heat and electricity supply to be CO2-neutral by 2025 [91].

5.3. Malmö, Sweden

The use of modern IT technologies will make it easier for cities to build energy self-sufficient districts. Swedish Malmö (340,000 inhabitants) opted for such solutions. In 2011, the city authorities decided to build a climate-neutral district of Hyllie, where smart devices control energy and heat demand. The project consisted of two elements: an agreement between the city and the energy supplier to achieve 100% the share of RES in energy supplies for Hyllie by 2030 and the creation of a smart grid network. Thanks to it, houses are equipped with smart meters and energy storage, and residents can optimize energy consumption using applications on their smartphones. Investments in the construction of new smart infrastructure have so far amounted to EUR 100 million. In order to finance them, the city decided, among others, to issue the green bonds [91]. Following this investment, Malmö's CO2 emissions fell from 2.21 million tons in 2010 to 1.37 million tons in 2016, which gives a 38% decrease [119].

5.4. Ostrów Wielkopolski, Poland

An example of successful use of biomass in cogeneration is Ostrów Wielkopolski. The local municipal heating company, in place of the liquidated coal boiler, built a modern cogeneration unit powered by wood biomass with a capacity of 11.4 MW. At the same time, the heat and power plant was connected by a distribution network to the local public transport depot, which enabled the chargers for electric buses to be powered with locally produced green electricity. This is the first case of a city in Poland that has created its own system of powering bus chargers with energy from RES. Annual savings from the implementation of this system are estimated at PLN 0.5 million with four electric buses and are expected to increase to PLN 1 million with ten vehicles [91].

5.5. Wałcz, Poland

The project of Heat Energy Plant Ltd. (ZEC) in Wałcz is planned with the collaboration with the Danish investor Eurowind Energy Ltd. and it will involve the construction of a wind [120] and photovoltaic farms within a radius of 30 km from Wałcz. The KR2 boiler houses in Wałcz will be supplied with a direct power line. With the use of a private off-grid network, green energy from RES farms will be delivered directly to the boiler house in Wałcz, where an electrode boiler will transform it to create thermal energy, assuming 100% efficiency. The electrode boiler is constructed as a cylindrical high-pressure tank to which electricity is supplied with the voltage of 10–11 kV for the 10 MW boiler. The temperature in the boiler circuit is 130 ° C/95 ° C. The details of the boiler operating principles can be found in [121]. It is predicted that 99.8 MWh of heat will be sent from 100 MWh of electricity transmitted from the wind farm to the Wałcz district heating network. It means that the production efficiency of the boiler in discussion is 99.8%, whereas the efficiency of coal boilers is 84% and gas boilers 95% [121].

6. Conclusions

The real problems faced by the heating industry, especially the difficult time for investment implementation, the increase in the energy awareness of the society for the consent and acceptance of the transformation, gives the green light to heating companies to undertake their own development strategies based on renewable energy. EU and national regulations should create conditions for the safe operation of heating companies, as well as the development of the entire energy industry. Although there is currently an accumulation of so many unfavorable business phenomena, the investment effort made will not be wasted. There is also the issue of financing this transformation, and here remains a large role for the EU and the Polish government. It is important to emphasize that on March 9, 2023, an act amending the act on investments in wind farms and some other acts was adopted [122]. The act allowed the location of wind turbines within 700 m from the nearest residential development. The introduced change will allow for an increase in the number of wind projects in Poland, which will have the consequence of increasing the potential possibilities of developing power to heat projects and carrying out the expected restructuring of the heating sector, i.e., the process of generating thermal power used for heating and cooling, usually utilizing heat pumps or boilers.
While analyzing the goals of the European Union, the transformation of the heating sector is inevitable. Such a large reform requires, on the one hand, financial outlays, and, on the other hand, knowledge of potential directions of development and products available on the market. Therefore, it is necessary to expand engineering knowledge and develop technology. The ambitious pace can lead to a capacity shortage.
Along with technological development and reaching for new solutions, legislative support and a modern (pro-development) industrial policy are necessary. It is not enough to focus on large domestic enterprises, but small and individual heat engineering should be supported. The nation should have a sense of security, no fear of galloping prices, and awareness of the purpose of the transformation being implemented, i.e. the need to increase the role of decarbonization of heating.
The increase in the role of renewable energy sources with the simultaneous change in the structures of fuel demand in heating, reducing the heat demand by 21% should be a key factor in the current times of pandemic and war restricting access to sources. It is worth remembering Stephen Covey's sentence "The best way to predict the future is to create it".

Author Contributions

Conceptualization, K.T., A.K.-P. and T.G.; investigation, K.T.; resources, K.T.; data curation, K.T.; writing—original draft preparation, K.T., A.K.-P.; writing—review and editing, K.T., A.K.-P., and T.G.; visualization, K.T., A.K.-P.; supervision, A.K.-P. and T.G.; project administration, A.K.-P.; funding acquisition, T.G. All authors have read and agreed to the published version of the manuscript.

Funding

This research received no external funding.

Data Availability Statement

Not applicable.

Conflicts of Interest

The authors declare no conflict of interest.

Abbreviations

ASHP air source heat pump
ATES Aquifer thermal energy storage
BTES Borehole thermal energy storage
CCHP combined heating, cooling and power
CHP Combined heating and power
ECO Opolszczyzna District Heating
EED Energy Efficiency Directive
EfW Energy from waste
EPDB Energy Performance of Buildings Directive
GPtH green power to heat
GSHP ground source heat pump
IED Industrial Emissions Directive
IEO Institute of Renewable Energy
LPEC Lublin Heat Energy Company
MC Municipal Heating Company
MPEC Municipal Heat Energy Company
KB biomass boilers
KPEiK National Energy and Climate Plan
KS solar collectors
PC heat pumps
PEP2040 Polish Energy Policy up to 2040
PRL Polish People's Republic
PSE Polish Power Grids
PTES Pit thermal energy storage
PV photovoltaics
RED III Renewable Energy Directive
RES renewable energy sources
SEC Szczecin District Heating
STES seasonal heat storage
TES Thermal energy storage
TTES Tank thermal energy storage
URE Energy Regulatory Office
WTG wind turbine generator
WPEC Voivodship Heat Energy Company
ZEC Heat Energy Plant in Wałcz
ZSC Łódź District Heating Plant

References

  1. United Nations. Day of eight billlion. Available online: https://www.un.org/development/desa/pd/events/day-eight-billionUnited Nations (accessed on 20 November 2022).
  2. Report: Pathways to a Clean Energy System; Energy Technology Perspectives, I.E. Agency, 2012.
  3. Mertens, R.; Manual for Statistics on Energy Consumptionin Households. Publications Office of the European Union, Luxembourg, 2013. Available on: http://ec.europa.eu/eurostat/documents/3859598/5935825/KS-GQ-13-003-EN.PDF/baa96509-3f4b-4c7a-94dd-feb1a31c7291 (accessed on 20 November 2022).
  4. Mirzaei, P.A. Recent challenges in modeling of urban heat island. Sustain. Cities Soc. 2015, 19, 200–206. [Google Scholar] [CrossRef]
  5. Mirzaei, P.A.; Olsthoorn, D.; Torja, M.; Haghighat, F. Urban neighborhood characteristics influence on a building indoor environment. Sustain. Cities Soc. 2015, 19, 403–413. [Google Scholar] [CrossRef]
  6. Report: Energy transition outlook 2022. A global and regional forecast to 2050. DNV Group, 2022.
  7. Proposal for a Directive of the European Parliament and of the Council Amending Directive 2003/87/EC Establishing a System for Greenhouse Gas Emission Allowance Trading within the Union, Decision (EU) 2015/1814 Concerning the Establishment and Operation of a Market Stability Reserve for the Union Greenhouse Gas Emission Trading Scheme and Regulation (EU) 2015/757. Available online: https://ec.europa.eu/info/sites/default/files/revision-eu-ets_with-annex_en_0.pdf (accessed on 20 November 2022).
  8. RePowerEU: A Plan to Rapidly Reduce Dependence on Russian Fossil Fuels and Fast Forward the Green Transition. 2022. Available online: https://eur-lex.europa.eu/legal-content/EN/TXT/PDF/?uri=CELEX:52022DC0230&from=EN (accessed on 20 November 2022).
  9. Polityka Energetyczna Polski do 2040 r./Poland’s Energy Policy until 2040 (PEP2040). Ministry of Climate and Environment: Warsaw, Poland. 2021. Available online: https://isap.sejm.gov.pl/isap.nsf/DocDetails.xsp?id=WMP20210000264 (accessed on 11 August 2022). (In Polish).
  10. Krajowy Plan na Rzecz Energii i Klimatu na Lata 2021–2030 (KPEiK)/The National Energy and Climate Plan for the Years 2021–2030. 2019. Available online: https://www.gov.pl/web/aktywa-panstwowe/krajowy-plan-na-rzecz-energii-i-klimatu-na-lata-2021-2030-przekazany-do-ke (accessed on 18 August 2022). (In Polish).
  11. Reda, F.; Ruggiero,S.; Auvinen, K.; Temmes, A. Towards low-carbon district heating: Investigating the socio-technical challenges of the urban energy transition. Smart Energy 2021, 4, 100054. [CrossRef]
  12. Werner, S. International review of district heating and cooling. Energy 2017, 137, 617–631. [Google Scholar] [CrossRef]
  13. Mazhar, A.R.; Liu, S.; Shukla, A. A state of art review on the district heating systems. Renew Sustain Energy Rev 2018, 96, 420–439. [Google Scholar] [CrossRef]
  14. Talebi, B.; Mirzaei, P.A.; Bastani, A.; Haghighat, F. A Review of District Heating Systems: Modeling and Optimization. Front. Built Environ. 2016, 2, 22. [Google Scholar] [CrossRef]
  15. Buffa, S.; Fouladfar, M.H.; Franchini, G.; Lozano Gabarre, I.; Andrés Chicote, M. Advanced Control and Fault Detection Strategies for District Heating and Cooling Systems—A Review. Appl. Sci. 2021, 11, 455. [Google Scholar] [CrossRef]
  16. Lake, A.; Rezaie, B.; Beyerlein, S. Review of district heating and cooling systems for a sustainable future. Renew Sustain Energy Rev 2017, 67, 417–425. [Google Scholar] [CrossRef]
  17. Salman, C.A; Li, H.; Li, P.; Yan, J. Improve the flexibility provided by combined heat and power plants (CHPs)–a review of potential technologies. Adv. Electr. Electron. Eng. 2021, 1, 100023. [Google Scholar] [CrossRef]
  18. Jiang, M.; Rindt, C.; Smeulders, D.M.J. Optimal Planning of Future District Heating Systems—A Review. Energies 2022, 15, 7160. [Google Scholar] [CrossRef]
  19. Kinelski, G.; Stęchły, J.; Sienicki, A.; Czornik, K.; Borkowski, P. Application of Smart Technologies in Metropolis GZM to Reduce Harmful Emissions in District Heating Systems. Energies 2021, 14, 7665. [Google Scholar] [CrossRef]
  20. Grzegórska, A.; Rybarczyk, P.; Lukoševičius, V.; Sobczak, J.; Rogala, A. Smart Asset Management for District Heating Systems in the Baltic Sea Region. Energies 2021, 14, 314. [Google Scholar] [CrossRef]
  21. Ricci, M.; Sdringola, P.; Tamburrino, S.; Puglisi, G.; Donato, E.D.; Ancona, M.A.; Melino, F. Efficient District Heating in a Decarbonisation Perspective: A Case Study in Italy. Energies 2022, 15, 948. [Google Scholar] [CrossRef]
  22. Metzger, M.; Duckheim, M.; Franken, M.; Heger, H.J.; Huber, M.; Knittel, M.; Kolster, T.; Kueppers, M.; Meier, C.; Most, D.; Paulus, S.; Wyrwoll, L.; Moser, A.; Niessen, S. Pathways toward a Decarbonized Future—Impact on Security of Supply and System Stability in a Sustainable German Energy System. Energies 2021, 14, 560. [Google Scholar] [CrossRef]
  23. Millar, M.-A.; Burnside, N.M.; Yu, Z. District Heating Challenges for the UK. Energies 2019, 12, 310. [Google Scholar] [CrossRef]
  24. Neirotti, F.; Noussan, M.; Riverso, S.; Manganini, G. Analysis of Different Strategies for Lowering the Operation Temperature in Existing District Heating Networks. Energies 2019, 12, 321. [Google Scholar] [CrossRef]
  25. Pellegrini, M.; Bianchini, A. The Innovative Concept of Cold District Heating Networks: A Literature Review. Energies 2018, 11, 236. [Google Scholar] [CrossRef]
  26. Gjorgievski, V.Z.; Markovska, N.; Abazi, A.; Neven Duić, N. The potential of power-to-heat demand response to improve the flexibility of the energy system: An empirical review. Renewable Sustainable Energy Rev. 2021, 138, 110489. [Google Scholar] [CrossRef]
  27. Reiter, A; Poier, H. ; Holter, C. BIG Solar Graz: Solar district heating in Graz – 500,000 m² for 20% solar fraction. Energy Procedia 2016, 91, 578–584. [Google Scholar] [CrossRef]
  28. David, A.; Mathiesen, B.V.; Averfalk, H.; Werner, S.; Lund, H. Heat Roadmap Europe: Large-Scale Electric Heat Pumps in District Heating Systems. Energies 2017, 10, 578. [Google Scholar] [CrossRef]
  29. Teräsvirta, A.; Syri, S.; Hiltunen, P. Small Nuclear Reactor—Nordic District Heating Case Study. Energies 2020, 13, 3782. [Google Scholar] [CrossRef]
  30. Sáez Blázquez, C.; Farfán Martín, A.; Nieto, I.M.; González-Aguilera, D. Economic and Environmental Analysis of Different District Heating Systems Aided by Geothermal Energy. Energies 2018, 11, 1265. [Google Scholar] [CrossRef]
  31. Romanov, D.; Leiss, B. Geothermal energy at different depths for district heating and cooling of existing and future building stock. Renew Sustain Energy Rev 2022, 167, 112727. [Google Scholar] [CrossRef]
  32. Djørup, S.; Sperling, K.; Nielsen, S.; Østergaard, P.A.; Zinck Thellufsen, J.; Sorknæs, P.; Lund, H.; Drysdale, D. District Heating Tariffs, Economic Optimisation and Local Strategies during Radical Technological Change. Energies 2020, 13, 1172. [Google Scholar] [CrossRef]
  33. Wiltshire, R. Wiltshire, R. Advanced district heating and cooling (DHC) systems. Woodhead Publishing Ltd: Cambridge, 2015.
  34. Sayegh, M.A.; Danielewicz, J.; Nannou, T.; Miniewicz, M.; Jadwiszczak, P.; Piekarska, K.; Jouhara, H. Trends of European research and development in district heating technologies. Renew Sustain Energy Rev 2017, 68, 1183–1192. [Google Scholar] [CrossRef]
  35. Collins, J. The history of district heating. Dist Heat 1959, 44, 154–161. [Google Scholar]
  36. Axelsson, G.; Gunnlaugsson, E.; Jónasson, T.; Ólafsson, M. Low-temperature geothermal utilization in Iceland – Decades of experience. Geothermics 2010, 39, 329–338. [Google Scholar] [CrossRef]
  37. Liu, L. Major issues and solutions in the management system of space heating system in North China. Renew Sustain Energy Rev 2015, 49, 221–231. [Google Scholar] [CrossRef]
  38. Schulz, E. Öffentliche Heizkraftwerke und Elekrizitätswirtschaft in Städten. Springer Verlag: Berlin, 1933. (In German).
  39. Margolis, A. Experiences with district heating in Europe and USA and its further development. J Inst Heat Vent Eng 1935, 3, 361–413. [Google Scholar]
  40. Margolis, A. Area Heating. Nature 1944, 153, 27. [Google Scholar] [CrossRef]
  41. Margolis, A. Continental practise. Bull Natl Dist Heat Assoc 1947, 33, 13–17. [Google Scholar]
  42. Nielsen, A. District heating in Denmark, Norway, Sweden, and Finland. Bull Natl Dist Heat Assoc 1948, 34, 15–16. [Google Scholar]
  43. Frederiksen, S.; Werner, S. District Heating and Cooling. Studentlitteratur: Lund, 2013.
  44. Sto lat, sto lat już grzeje, grzeje nam…Magazyn Ciepła Systemowego 2018, 3(40), 20–22. Available online: https://magazyncieplasystemowego.pl/cieplownictwo/sto-lat-sto-lat-juz-grzeje-grzeje-nam/ (accessed on 5 February 2023). (In Polish).
  45. Wojdyga, K. Polish District Heating Systems—Developmen Perspectives. J. Civ. Eng. 2016, 10, 268–279. [Google Scholar] [CrossRef]
  46. Veolia Energia Warszawa S.A., Available online: https://energiadlawarszawy.pl/# (accessed on 18 February 2023). (In Polish).
  47. MPEC S.A. Kraków, Available online: https://www.mpec.krakow.pl/ (accessed on 18 February 2023). (In Polish).
  48. Veolia Energia Łódź S.A., Available online: https://energiadlalodzi.pl/ (accessed on 18 February 2023). (In Polish).
  49. Veolia Energia Poznań S.A., Available online: https://energiadlapoznania.pl/ (accessed on 15 February 2023). (In Polish).
  50. Lubelskie Przedsiębiorstwo Energetyki Cieplnej S.A., Available online: https://lpec.pl/ (accessed on 15 February 2023). (In Polish).
  51. Zespół Elektrociepłowni Wrocławskich Kogeneracja S.A. Available online: https://www.kogeneracja.com.pl/en/ (accessed on 15 February 2023).
  52. Szczecińska Energetyka Cieplna Sp. z o.o., Available online: https://sec.com.pl/en/ (accessed on 15 February 2023).
  53. Energetyka Cieplna Opolszczyzny S.A., Avaliable online: https://www.ecosa.pl/ (accessed on 15 February 2023). (In Polish).
  54. Wei, B.; Wang, S-L.; Li, L. Fuzzy comprehensive evaluation of district heating systems. Energy Policy 2010, 38, 5947–5955.
  55. Zvingilaite, E.; Balyk, O. Heat savings in buildings in a 100% renewable heat and power system in Denmark with different shares of district heating. Energy Build 2014, 82, 173–186. [Google Scholar] [CrossRef]
  56. Lund, H.; Werner, S; Wiltshire, R.; Svendsen, S.; Thorsen, J.E.; Hvelplund F.; et al. 4th Generation District Heating (4GDH). Integrating smart thermal grids into future sustainable energy systems. Energy 2014, 68, 1–11.
  57. Persson, U.; Werner, S. District heating in sequential energy supply. Appl. Energy 2012, 95, 123–131. [Google Scholar] [CrossRef]
  58. Fang, H.; Xia, J.; Jiang, Y. Key issues and solutions in a district heating system using low-grade industrial waste heat. Energy 2015, 86, 589–602. [Google Scholar] [CrossRef]
  59. Yang, B.; Jiang, Y.; Fu, L.; Zhang, S. Experimental and theoretical investigation of a novel full-open absorption heat pump applied to district heating by recovering waste heat of flue gas. Energy Build. 2018, 173, 45–57. [Google Scholar] [CrossRef]
  60. Eriksson, O.; Finnveden, G.; Ekvall, T.; Bjorklund, A. Life cycle assessment of fuels for district heating: a comparison of waste incineration, biomass- and natural gascombustion. Energy Policy 2007, 35, 1346–1362. [Google Scholar] [CrossRef]
  61. Persson, U.; Münster, M. Current and future prospects for heat recovery from waste in European district heating systems: A literature and data review. Energy 2016, 110, 116–128. [Google Scholar] [CrossRef]
  62. Udomsri, S.; Bales, C.; Martin, A.R.; Martin, V. Decentralised cooling in district heating network: monitoring results and calibration of simulation model. Energy Build. 2011, 43, 3311–3321. [Google Scholar] [CrossRef]
  63. Djuric Ilic, D.; Dotzauer, E.; Trygg, L.; Broman, G. Introduction of large-scale biofuel production in a district heating system —an opportunity for reduction of global greenhouse gas emissions. J. Clean. Prod. 2014, 64, 552–561. [Google Scholar] [CrossRef]
  64. Djuric Ilic, D.; Dotzauer, E.; Trygg, L.; Broman, G. Integration of biofuel production into district heating—part II: An evaluation of the district heating production costs using Stockholm as a case study. J. Clean. Prod. 2014, 69, 188–198. [Google Scholar] [CrossRef]
  65. Karschin, I.; Geldermann, J. Efficient cogeneration and district heating systems in bioenergy villages: an optimization approach. J. Clean. Prod. 2014, 104, 305–314. [Google Scholar] [CrossRef]
  66. Saad, M.G.; Dosoky, N.S.; Zoromba, M.S.; Shafik, H.M. Algal Biofuels: Current Status and Key Challenges. Energies 2019, 12, 1920. [Google Scholar] [CrossRef]
  67. Carpaneto E, Lazzeroni P, Repetto M. Optimal integration of solar energy in a district heating network. Renew. Energy 2015, 75, 714–721. [Google Scholar]
  68. Lindenberger, D.; Bruckner, T.; Groscurth, H.M.; Kümmel, R. Optimization of solar district heating systems: seasonal storage, heat pumps, and cogeneration. Energy 2000, 25, 591–608. [Google Scholar] [CrossRef]
  69. Marx, R.; Bauer, D.; Drueck, H. Energy efficient integration of heat pumps into solar district heating systems with seasonal thermal energy storage. Energy Procedia 2014, 57, 2706–2715. [Google Scholar] [CrossRef]
  70. Kumar, L.; Hasanuzzaman, M.; Rahim, N.A. Global advancement of solar thermal energy technologies for industrial process heat and its future prospects: A review. Energy Convers. Manag. 2019, 195, 885–908. [Google Scholar] [CrossRef]
  71. Yamankaradeniz, N. Thermodynamic performance assessments of a district heating system with geothermal by using advanced exergy analysis. Renew Energy 2016, 85, 965–972. [Google Scholar] [CrossRef]
  72. Sekret, R.; Nitkiewicz, A. Exergy analysis of the performance of low-temperature district heating system with geothermal heat pump. Arch Thermodyn 2014, 35, 77–86. [Google Scholar] [CrossRef]
  73. Romanov, D.; Leiss, B. Geothermal energy at different depths for district heating and cooling of existing and future building stock. Renewable Sustainable Energy Rev. 2022, 167, 112727. [Google Scholar] [CrossRef]
  74. Sáez Blázquez, C.; Farfán Martín, A.; Nieto, I.M.; González-Aguilera, D. Economic and Environmental Analysis of Different District Heating Systems Aided by Geothermal Energy. Energies 2018, 11, 1265. [Google Scholar] [CrossRef]
  75. Calise, F.; Cappiello, F,L. ; Cimmino, L.; d'Accadia, M.D.; Vicidomini, M. Optimal design of a 5th generation district heating and cooling network based on seawater heat pumps. Energy Convers. Manag. 2022, 267, 115912. [Google Scholar] [CrossRef]
  76. Østergaard, P.A.; Andersen, A.N. Economic feasibility of booster heat pumps in heat pump-based district heating systems. Energy 2018, 155, 921–929. [Google Scholar] [CrossRef]
  77. Zheng, W.; Zhang, H.; You, S.; Ye, T. Heat transfer performance of a seawater-source heat pump with radiant floor heating system in cold areas of China. Sci Technol Built Environ 2017, 23, 469–77. [Google Scholar] [CrossRef]
  78. Shirani, A.; Merzkirch, A.; Roesler, J. Leyer, S.; Scholzen, F.; Maas, S. Experimental and analytical evaluation of exhaust air heat pumps in ventilation-based heating systems. J. Build. Eng. 2021, 44, 102638. [CrossRef]
  79. Carroll, P.; Chesser, M.; Lyons, P. Air Source Heat Pumps field studies: A systematic literature review. Renewable Sustainable Energy Rev. 2020, 134, 110275. [Google Scholar] [CrossRef]
  80. Kensby, J.; Trüschel, A.; Dalenbäck, J.O. Heat source shifting in buildings supplied by district heating and exhaust air heat pump. Energy Procedia 2017, 116, 470–480. [Google Scholar] [CrossRef]
  81. Tarragona, J.; Pisello, A.L.; Fernández, C.; de Gracia, A.; Cabeza, L.F. Systematic review on model predictive control strategies applied to active thermal energy storage systems. Renewable Sustainable Energy Rev. 2021, 149, 111385. [Google Scholar] [CrossRef]
  82. Dahash, A.; Ochs, F.; Bianchi Janetti, M.; Streicher, W. Advances in seasonal thermal energy storage for solar district heating applications: A critical review on large-scale hot-water tank and pit thermal energy storage systems. Appl. Energy 2019, 239, 296–315. [Google Scholar] [CrossRef]
  83. Nuytten, T.; Claessens, B.; Paredis, .; Van Bael, J.; Six, D. Flexibility of a combined heat and power system with thermal energy storage for district heating. Appl Energy 2013, 104, 583–591. [CrossRef]
  84. EuroHeat and Power. Guidelines for district heating substations & countrywise survey. Brussels, 2008.
  85. Sørensen, P.A., Schmidt, T. Design and Construction of Large Scale Heat Storages for District Heating in Denmark, In Proceedings of the 14th International Conference on Energy Storage, Adana, Turkey, 25–28 April 2018.
  86. Task 45 Large Systems. Seasonal thermal energy storage. Report: on state of the art and necessary further R+D; SHC, IEA Germany: Stuttgart, Germany, 2015. Available online: http://task45.iea-shc.org/data/sites/1/publications/IEA_SHC_Task45_B_ Report.pdf (accessed on 4 February 2023).
  87. Wiltshire, R. Advanced district heating and cooling (DHC) systems, 1st ed.; Woodhead Publishing: Cambridge, Great Britain; 2015. Woodhead Publishing: Cambridge.
  88. Lund, H.; Werner, S.; Wiltshire, R.; Svendsen, S.; Thorsen, J.E.; Hvelplund, F, et al. Generation District Heating (4GDH): Integrating smart thermal grids into future sustainable energy systems. Energy 2014, 68, 1–11. [CrossRef]
  89. Skagestad, B.; Mildenstein, P. District heating and cooling connection handbook. NOVEM: Netherlands Agency for Energy and the Environment, 2002.
  90. Wikimedia Commons. Available online: https://upload.wikimedia.org/wikipedia/commons/8/83/Generations_of_ district_heating_systems_EN.svg (accessed on 1 February 2023).
  91. Tomaszewski, R. Research: Ciepło do zmiany. Jak zmodernizować sektor ciepłownictwa systemowego w Polsce. Polityka INSIGHT, 2020. (In Polish).
  92. Energy Regulatory Office (URE). https://www.ure.gov.pl/en (accessed on 18 February 2023).
  93. Raport: Dekarbonizacja ciepłownictwa systemowego w Polsce w świetle pakietu „Fit for 55”/ Report: Decarbonisation of system heating in Poland in the light of the "Fit for 55" package; Polskie Towarzystwo Elektrowni Zawodowych, Kraków, Poland, 2022. (In Polish).
  94. Raport: Energetyka Cieplna w Liczbach—2020/Report: Thermal Energy in Numbers—2020. URE: Warsaw, Poland. 2022. Available online: https://www.ure.gov.pl/pl/cieplo/energetyka-cieplna-w-l/10096,2020.html (accessed on 18 February 2023). (In Polish).
  95. Statystyka Ciepłownictwa Polskiego 2020/Statistics of Polish Heating 2020, Yearbook ARE: Warsaw, Poland. 2021. Available online: https://www.are.waw.pl/badania-statystyczne/wynikowe-informacje-statystyczne/publikacje-roczne (accessed on 20 February 2022). (In Polish). 2021.
  96. Forum Energii, Available online: https://forum-energii.eu/pl/dane-o-energetyce (accessed on 18 February 2023). (In Polish).
  97. Raport: Energetyka Cieplna w Liczbach—2021/Report: Thermal Energy in Numbers—2021. URE: Warsaw, Poland. 2022. Available online: https://www.ure.gov.pl/pl/cieplo/energetyka-cieplna-w-l/10763,2021.html (accessed on 18 February 2023).
  98. Dane Systemowe/System Data, Polish Energy Networks PSE. Available online: https://www.pse.pl/dane-systemowe/funkcjonowanie-rb/raporty-dobowe-z-funkcjonowania-rb/podstawowe-wskazniki-cenowe-i-kosztowe/rozliczeniowa-cena-uprawnien-do-emisji-co2-rcco2 (accessed on 8 February 2022).
  99. Urząd Regulacji Energetyki/Energy Regulatory Office. Available online: https://www.ure.gov.pl/en (accessed on 19 February 2023).
  100. Energy Efficiency Directive 2012/27/EU. Available online: https://eur-lex.europa.eu/legal-content/EN/TXT/?qid=1399375464230&uri=CELEX:32012L0027 (accessed on 18 May 2023).
  101. Renewable Energy Directive 2018/2001/EU. Available online: https://eur-lex.europa.eu/legal-content/EN/TXT/?uri=uriserv:OJ.L_.2018.328.01.0082.01.ENG&toc=OJ:L:2018:328:TOC (accessed on 18 May 2023).
  102. Energy Performance of Buildings Directive 2010/31/EU. Available online: https://eur-lex.europa.eu/legal-content/EN/ALL/;ELX_SESSIONID=FZMjThLLzfxmmMCQGp2Y1s2d3TjwtD8QS3pqdkhXZbwqGwlgY9KN!2064651424?uri=CELEX:32010L0031 (accessed on 18 May 2023).00.
  103. Hoicka, C.E.; Lowitzsch, J.; Brisbois, M.C.; Kumar, A.; Camargo, L.R. Implementing a just renewable energy transition: Policy advice for transposing the new European rules for renewable energy communities. Energy Policy 2021, 156, 112435. [Google Scholar] [CrossRef]
  104. Instytut Energetyki Odnawialnej (IEO)/Institute of Renewable Energy. Available online: https://ieo.pl/en/ (accessed on 21 February 2023).
  105. Analiza: Dekarbonizacja ciepłownictwa systemowego w Polsce w świetle pakietu „Fit for 55”—2022/ Analysis: Decarbonisation of district heating in Poland in the light of the "Fit for 55" package. Polskie Towarzystwo Elektrociepłowni Zawodowych 2022. Available online: http://ptez.pl/files/news_attachment/364/dekarbonizacja_cieplownictwa_systemowego_w_polsce_w_swietle_pakietu_fit_for_55.pdf (accessed on 21 February 2023). (In Polish).
  106. Raport w zakresie kierunków transformacji sektora ciepłownictwa systemowego—2021/Report on the directions for transformation of the district heating sector—2021. Izba Gospodarcza Ciepłownictwo Polskie 2021. (In Polish).
  107. Ekspertyza: Założenia do ustanowienia przez Narodowy Fundusz Ochrony Środowiska i Gospodarki Wodnej programu wsparcia dla ciepłownictwa w zakresie budowy, modernizacji i rozwoju systemów ciepłowniczych współpracujących z OZE i magazynami ciepła—2018/Expert opinion: Assumptions for establishing a support programme for the heating sector by the National Fund for Environmental Protection and Water Management with regard to the construction, modernisation and development of district heating systems cooperating with RES and heat storage facilities. Instytut Energetyki Odnawialnej: Warsaw, Poland. 2018. (In Polish). W: Odnawialnej.
  108. Wiśniewski G.: Zmiana paradygmatu w energetyce—rolnik podmiotem i producentem energii/ A paradigm shift in energy—farmer as subject and energy producer. Energetyka-Społeczeństwo-Polityka 2016, 1(3), 61–81. Available online: http://energetyka-collegium.pl/wp-content/uploads/2016/07/Grzegorz-Wisniewski_OK_n.pdf (accessed on 17 May 2023) (In Polish).
  109. National Fund for Environmental Protection and Water Management. Available online: https://www.gov.pl/web/nfosigw-en (accessed on 17 May 2023).
  110. National Center for Research and Development. Available online: https://www.gov.pl/web/ncbr-en (accessed on 17 May 2023).
  111. Koponen. K.; Le Net, E. Towards robust renewable energy investment decisions at the territorial level. Appl. Energy 2021, 287, 116552. [CrossRef]
  112. Wiśniewski, G.; Więcka, A.; Kowalak, T.; Tokarczyk, P.; Gręda, D. OZE i magazyny ciepła w miejskich systemach ciepłowniczych. Analiza kosztów i możliwości przeciwdziałania wzrostom cen ciepła/ RES and heat storage in district heating systems. Analysis of costs and options for counteracting heat price increases. Energetyka Cieplna i Zawodowa 2019, 5, 102–110. (In Polish).
  113. Leśniak , A. Światowy rynek ogniw paliwowych/ The global fuel cell market. Przegląd Elektrotechniczny 2020, 96(4), 197-202. [CrossRef]
  114. Żyjewska, U. Rodzaje ogniw paliwowych i ich potencjalne kierunki wykorzystania/ Types of fuel cells and their potential fields of application. Nafta–Gaz 2020, 5, 332–339. (In Polish) [Google Scholar] [CrossRef]
  115. Piskowska-Wasiak, J. Doświadczenia i perspektywy procesu Power to Gas/ Experiences and perspectives of the Power to Gas process. Nafta–Gaz 2017, 8, 332–339. (In Polish) [Google Scholar] [CrossRef]
  116. Ahn, H.; William Miller, W.; Sheaffer, P.; Tutterow, V.; Rapp, V. Opportunities for installed combined heat and power (CHP) to increase grid. Energy Policy 2021, 157, 112485. [Google Scholar] [CrossRef]
  117. Belik, B.; Dreissigacker, V.; Zunft, S. Power-to-heat integration in regenerator storage: Enhancing thermal storage capacity and performance. J. Energy Storage 2022, 50, 104570. [Google Scholar] [CrossRef]
  118. Polska Strategia Wodorowa do Roku 2030 z Perspektywą do Roku 2040/Polish Hydrogen Strategy until 2030 with a Perspective until 2040. Ministry of Climate and Environment: Warsaw, Poland. 2021. Available online: https://isap.sejm.gov.pl/isap.nsf/download.xsp/WMP20210001138/O/M20211138.pdf (accessed on 18 February 2023). (In Polish).
  119. Case studies: Steps to achieving 100% renewable energy use: Malmö, Sweden. International Renewable Energy Agency IRENA 2018. Available online: https://www.irena.org//media/Files/IRENA/Agency/Publication/2018/Dec/IRENA_Cities_2018e_ Malm.pdf?la=en&hash=15AAEB18677CA4C7575A1D86F75E9BA6C941661A (accessed on 18 February 2023).
  120. Talarek, K.; Knitter-Piątkowska, A.; Garbowski, T. Wind Parks in Poland—New Challenges and Perspectives. Energies 2022, 15, 7004. [Google Scholar] [CrossRef]
  121. alarek, K.; Garbowski, T. OZE przyszłością ciepłownictwa systemowego/ RES as the future of district heating. Przegląd Budowlany 2023, 3-4, 66-75 (In Polish). -4.
  122. Ustawa z Dnia 9 marca 2023 r. o zmianie ustawy o inwestycjach w zakresie elektrowni wiatrowych oraz niektórych innych ustaw/Act of 9 March 2023 on on amending the Act on investments in wind power plants and certain other acts. 2023. Available online: https://isap.sejm.gov.pl/isap.nsf/DocDetails.xsp?id=WDU20230000553 (accessed on 18 May 2023). (In Polish).
Figure 1. Different thermal energy storage types.
Preprints 74421 g001
Figure 2. Directions of development of heating systems.
Preprints 74421 g002
Figure 3. Basic parameters of heat supplied to the network in Poland.
Preprints 74421 g003
Figure 4. Structure of heating companies by MW installed capacity in heat sources in 2020.
Preprints 74421 g004
Figure 5. Structure of fuels used for heat production in 2002 and in 2020, and for heat production in cogeneration in 2020.
Preprints 74421 g005
Figure 6. Heating prices in Poland depending on the sources in 2018-2020.
Preprints 74421 g006
Figure 7. Average sales prices of heat in generation units, with division into source type in 2009–2021 in PLN net / GJ.
Preprints 74421 g007
Figure 8. Energy efficiency index for heat: (a) CO2 emission intensity; (b) index value.
Preprints 74421 g008
Figure 9. Index of profitability of warmer energy [95].
Preprints 74421 g009
Figure 10. Legislative timeline of RES directives and regulations [95].
Preprints 74421 g010
Figure 11. Share of renewable energy in district heating.
Preprints 74421 g011
Figure 12. Interest in individual renewable energy and heat storage technologies in the surveyed group of companies. STES—seasonal heat storage, TES—daily heat storage, KS—solar collectors, KB—biomass boilers, GPtH —(green) power to heat, PC—heat aid (geothermal and PtH).
Preprints 74421 g012
Table 1. Types and characteristics of seasonal heat storage.
Type Reservoir Reservoir
in a soil excavation
Ground battery Battery
in an aquifer
English name
and abbreviation used
Tank thermal energy storage (TTES) Pit thermal energy storage (PTES) Borehole thermal energy storage (BTES) Aquifer thermal energy storage (ATES)
Storage potential kWh/m3 60–80 30–80 15–30 30–40
Characteristics Ground or semi-underground water reservoir A water reservoir formed in a pit dug in the ground filled with water or water and gravel Storage of heat in the ground by supplying and receiving heat through boreholes Heat storage in aquifers, access via two wells
Table 2. The number of licensed enterprises, installed and ordered capacity and network lengths in 2002, 2019 and 2020.
Tasks 2002 2019 2020 Dynamics 2020/02 (%) Dynamics 2020/19 (%)
Number of licensed heating
companies
894 396 387 43.29 97.73
Number of enterprises
participating in the survey
849 404 399 47 98.76
Installed capacity (MW) 70,953.80 53,560.80 53,271.10 75.08 99.46
Power ordered (MW) 38,937.00 34,408.00 34,665.54 89.03 100.75
Network length (km) 1 17,312.50 21,701.20 22,123.11 127.79 101.94
Employment in full-time jobs 60,239.00 29037 28737 47.70 98.97
Total heat sales (TJ) 469,355.50 344,712.64 343,690.65 73.23 99.70
Heat transferred to the grid (TJ) 336,043.00 258,909.40 257,377.29 76.59 99.41
1 Since 2004, the length of the network also includes low-parameter networks.
Table 3. Changes in the structures of legal forms of heating companies in the years 2002–2022.
Share (%) Local government units (%) Joint-stock
companies (%)
Limited liability companies (%) Housing
companies (%)
State-owned
enterprises (%)
Other companies (%)
2022 9 26.1 54.4 2.7 3.4 4.4
2020 0.8 18 77.4 77.4 0 2.8
Table 4. Structure of fuel and energy consumption for total activity in enterprises of the energy sector and other enterprises and selling heat.
Energy carrier Commercial Power
Industry
(%)
Production
and distribution
companies
(%)
Other heat producing companies
(%)
Overall 2019 100 100 100
2020 100 100 100
Energetic hard coal 2019 51.1 73.09 4.68
2020 49.15 71.2 4.33
Coking coal 2019 - - 11.55
2020 - - 10.38
Hard coal briquettes 2019 - - -
2020 - - -
Lignite 2019 33.6 0.08 0.03
2020 33.39 0.07 0.02
Lignite briquette 2019 - - -
2020 - - -
Coke and semi-coke 2019 - 0.01 0.29
2020 - 0.01 0.32
Firewood 2019 2 4.23 0.75
2020 2.26 4.71 0.82
Petroleum and
gasoline
2019 - - 40.45
2020 - - 39.07
Light fuel oil 2019 0.18 0.17 0.16
2020 0.15 0.18 0.16
Light fuel oil 2019 0.28 0.12 0.96
2020 0.3 0.12 1
Diesel and (ON I) 2019 0.07 0.08 1.18
2020 0.06 0.08 1.06
Other diesel oils 2019 - - 0.01
2020 - - 0.12
Petrol engine fuels (excl. aviation) 2019 0.02 0.01 0.3
2020 0.01 0.01 0.2
Aviation fuels 2019 - - -
2020 - - -
Jet fuel 2019 - - -
2020 - - -
Liquefied gas 2019 - - 0.19
2020 - - 0.2
High-methane
natural gas
2019 2.03 4.43 10.57
2020 3.23 5.13 11.05
Nitrogen-rich
natural gas
2019 1.4 0.3 2.21
2020 1.48 0.31 2.21
Gas from minemethane drainage 2019 0.24 0.93 0.08
2020 0.28 0.76 0.1
Dry post-refinery gas 2019 - - 1.96
2020 - - 1.88
Coke gas 2019 0.71 0.95 1.68
2020 0.5 0.94 1.55
Blast furnace gas 2019 1.18 0.01 -
2020 1.04 0.02 -
Heat in steam and hot water 2019 1.27 10.42 8.88
2020 1.34 10.5 8.96
Electricity 2019 4.44 3.14 5.82
2020 4.85 3.08 5.72
Waste fuel 2019 0.1 0.36 2.04
2020 0.11 0.45 4.03
Biogas 2019 0.24 0.06 0.18
2020 0.28 0.07 0.18
Semi-processed crude oil 2019 - - 0.97
2020 - - 1.26
Other products 2019 1.15 1.6 5.06
2020 1.55 2.36 5.31
Table 5. Fuel consumption for heat production in 2020 in Poland.
Fuel Total
(GJ)
Fuel consumption
in cogeneration (GJ)
Heat
(%)
Heat
in cogeneration
(%)
Coal 285,345,066.45 201,428,781.97 67.72 62.42
Lignite 4,916,154.41 4,347,275.31 1.17 1.35
Light fuel oil 1,226,226.07 1,070,092.40 0.29 0.33
Heavy fuel oil 18,996,757.45 18,978,012.08 4.51 5.88
High-methane
natural gas
36,257,839.32 29,113,523.84 8.60 9.02
Nitrogen-rich
natural gas
8,425,678.24 8,048,812.44 2.00 2.49
Biomass 41,548,379.86 36,921,746.47 9.86 11.44
Biogas 175,368.53 175,368.53 0.04 0.05
Other renewable energy sources 721,500.30 0.0 0.17 0.0
Solid municipal waste 7,762,979.37 7,761,746.17 1.84 2.41
Non-renewable industrial waste 1,207,719.95 1,207,719.95 0.29 0.37
Other fuels 14,794,759.45 13,653,837.21 3.51 4.23
Disclaimer/Publisher’s Note: The statements, opinions and data contained in all publications are solely those of the individual author(s) and contributor(s) and not of MDPI and/or the editor(s). MDPI and/or the editor(s) disclaim responsibility for any injury to people or property resulting from any ideas, methods, instructions or products referred to in the content.
Copyright: This open access article is published under a Creative Commons CC BY 4.0 license, which permit the free download, distribution, and reuse, provided that the author and preprint are cited in any reuse.
Prerpints.org logo

Preprints.org is a free preprint server supported by MDPI in Basel, Switzerland.

Subscribe

© 2024 MDPI (Basel, Switzerland) unless otherwise stated