Submitted:
23 May 2023
Posted:
24 May 2023
You are already at the latest version
Abstract
Keywords:
1. Introduction
2. Experiments
2.1. Raw Materials
2.2. Matching ratio
2.3. Test method
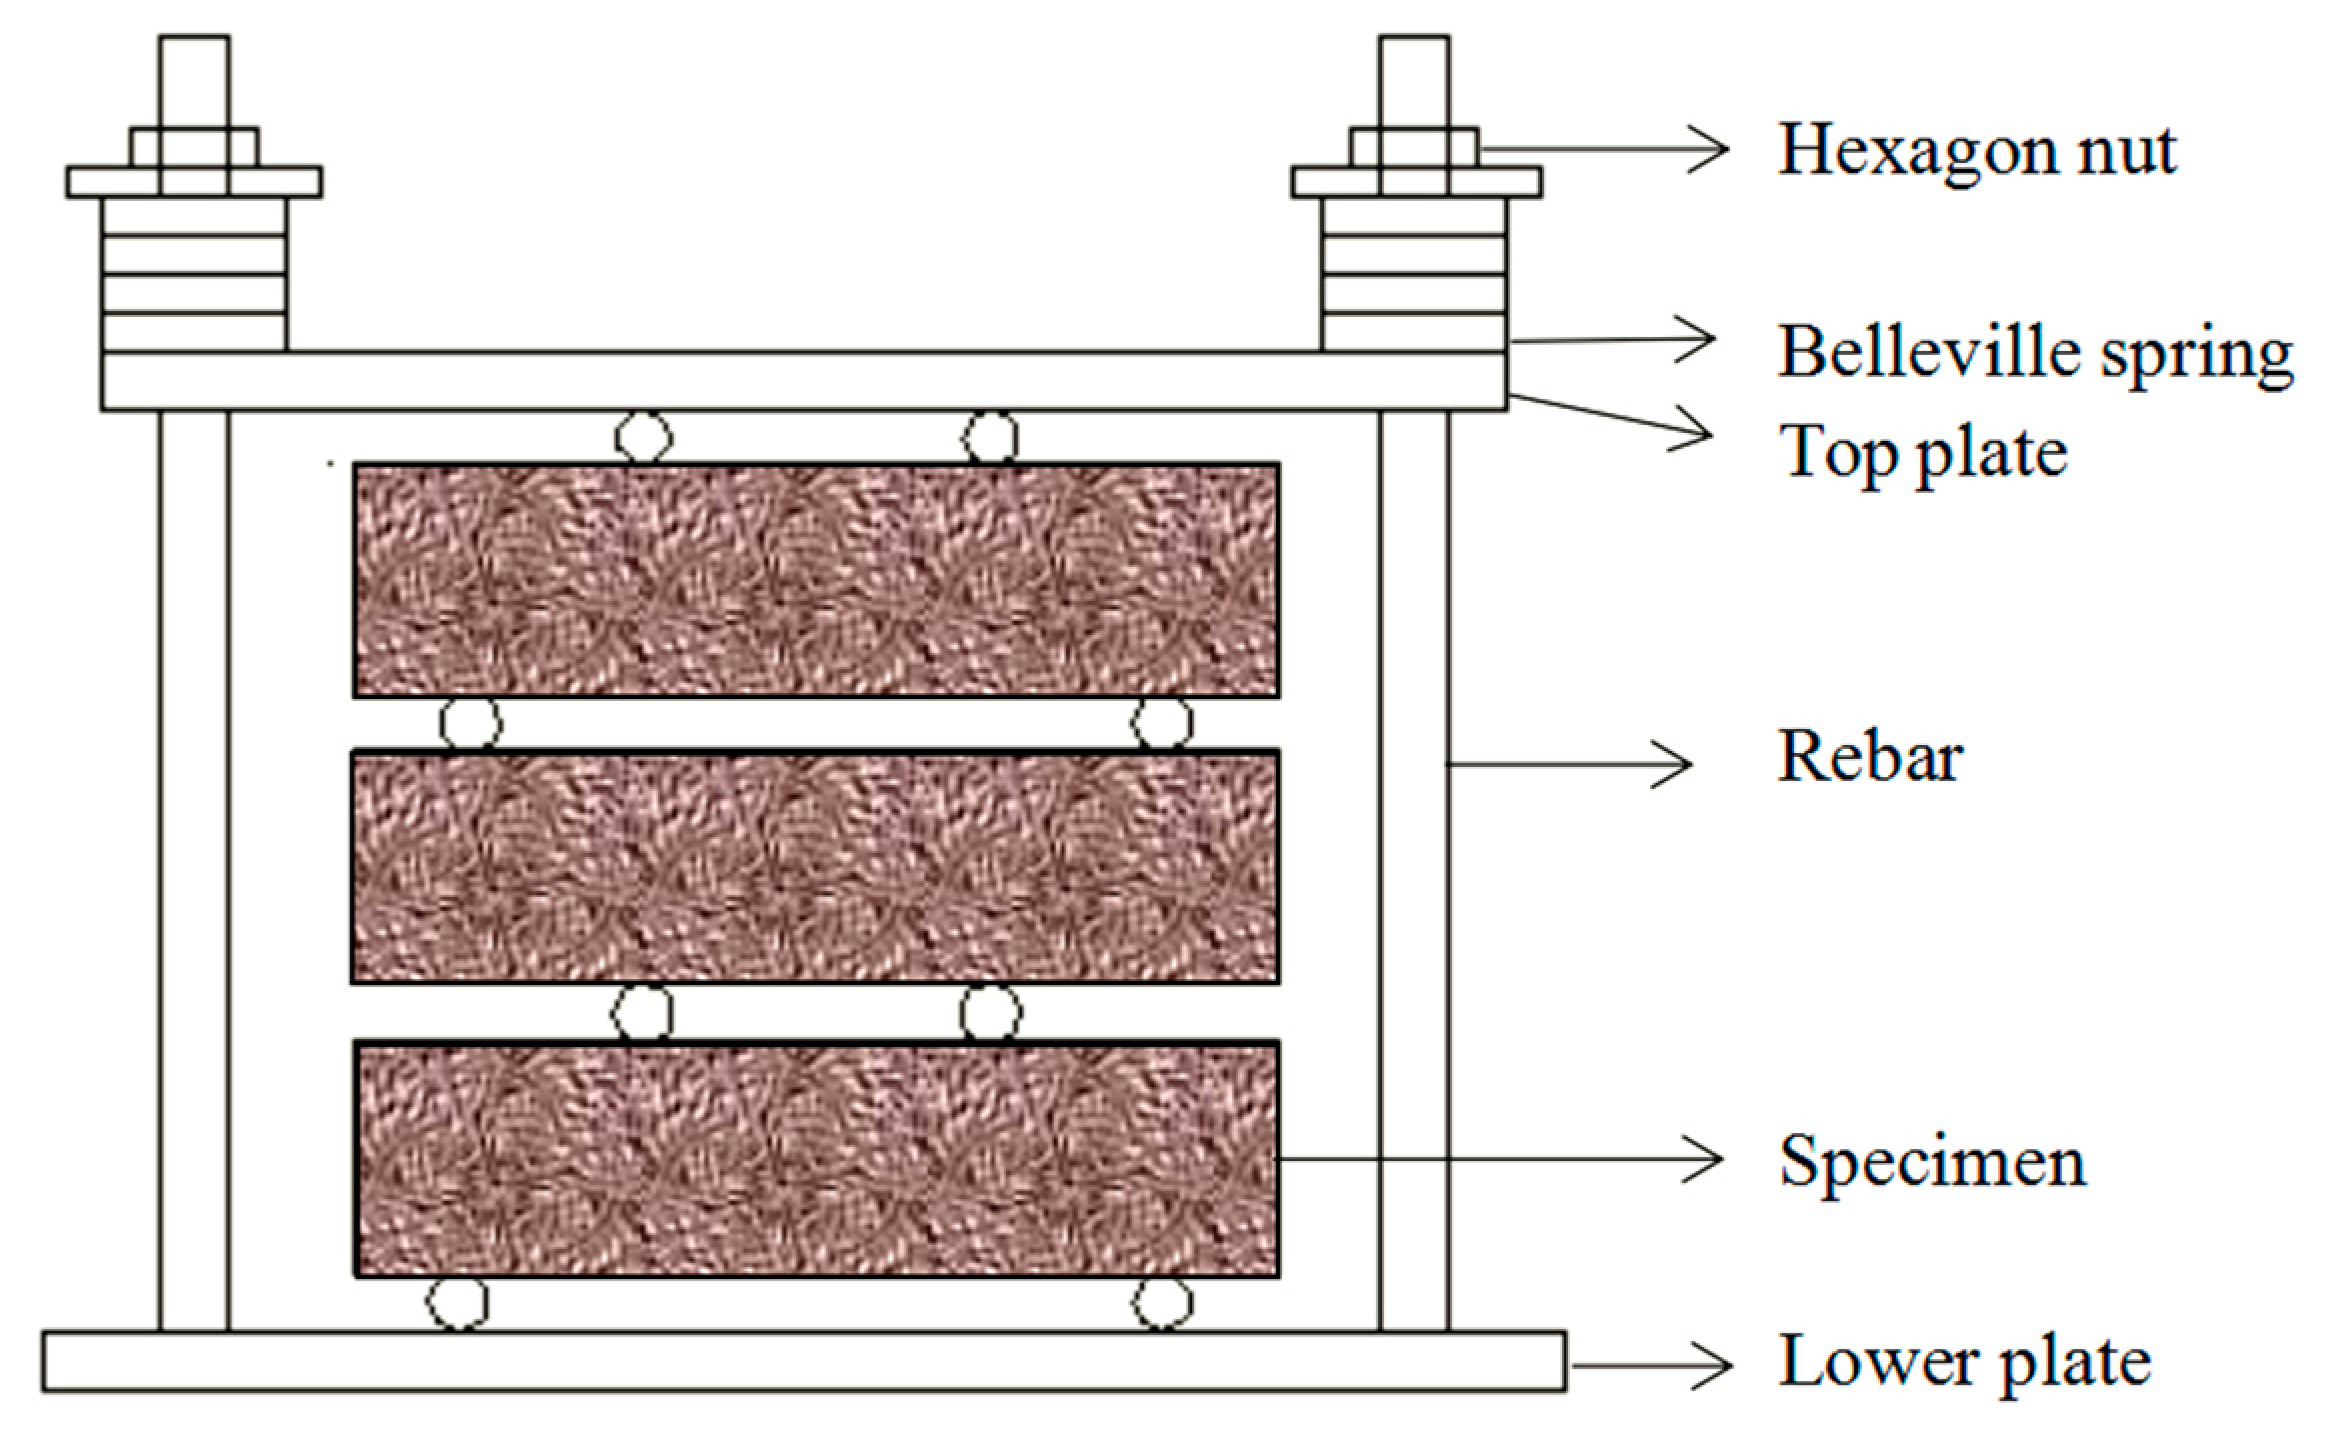
2.3.1. Sulfate wet and dry cycle
2.3.2. Mechanical analysis
2.3.3. Microstructure
3. Results and analysis
3.1. Effect of coupling of load and sulfate on the mechanical properties of cementitious materials
3.2. Microscopic Analysis
4. Simulation
4.1. Theoretical basis of sulfate ion diffusion model
4.1.1. Diffusion coefficient of sulfate ions in cement mortar
4.1.2. Coefficient of diffusion of the sulphate ion in the interface transition zone
4.1.3. Coefficient of diffusion of sulphate ions in concrete
4.1.4. Effect of loading action on the diffusion coefficient of sulfate ions
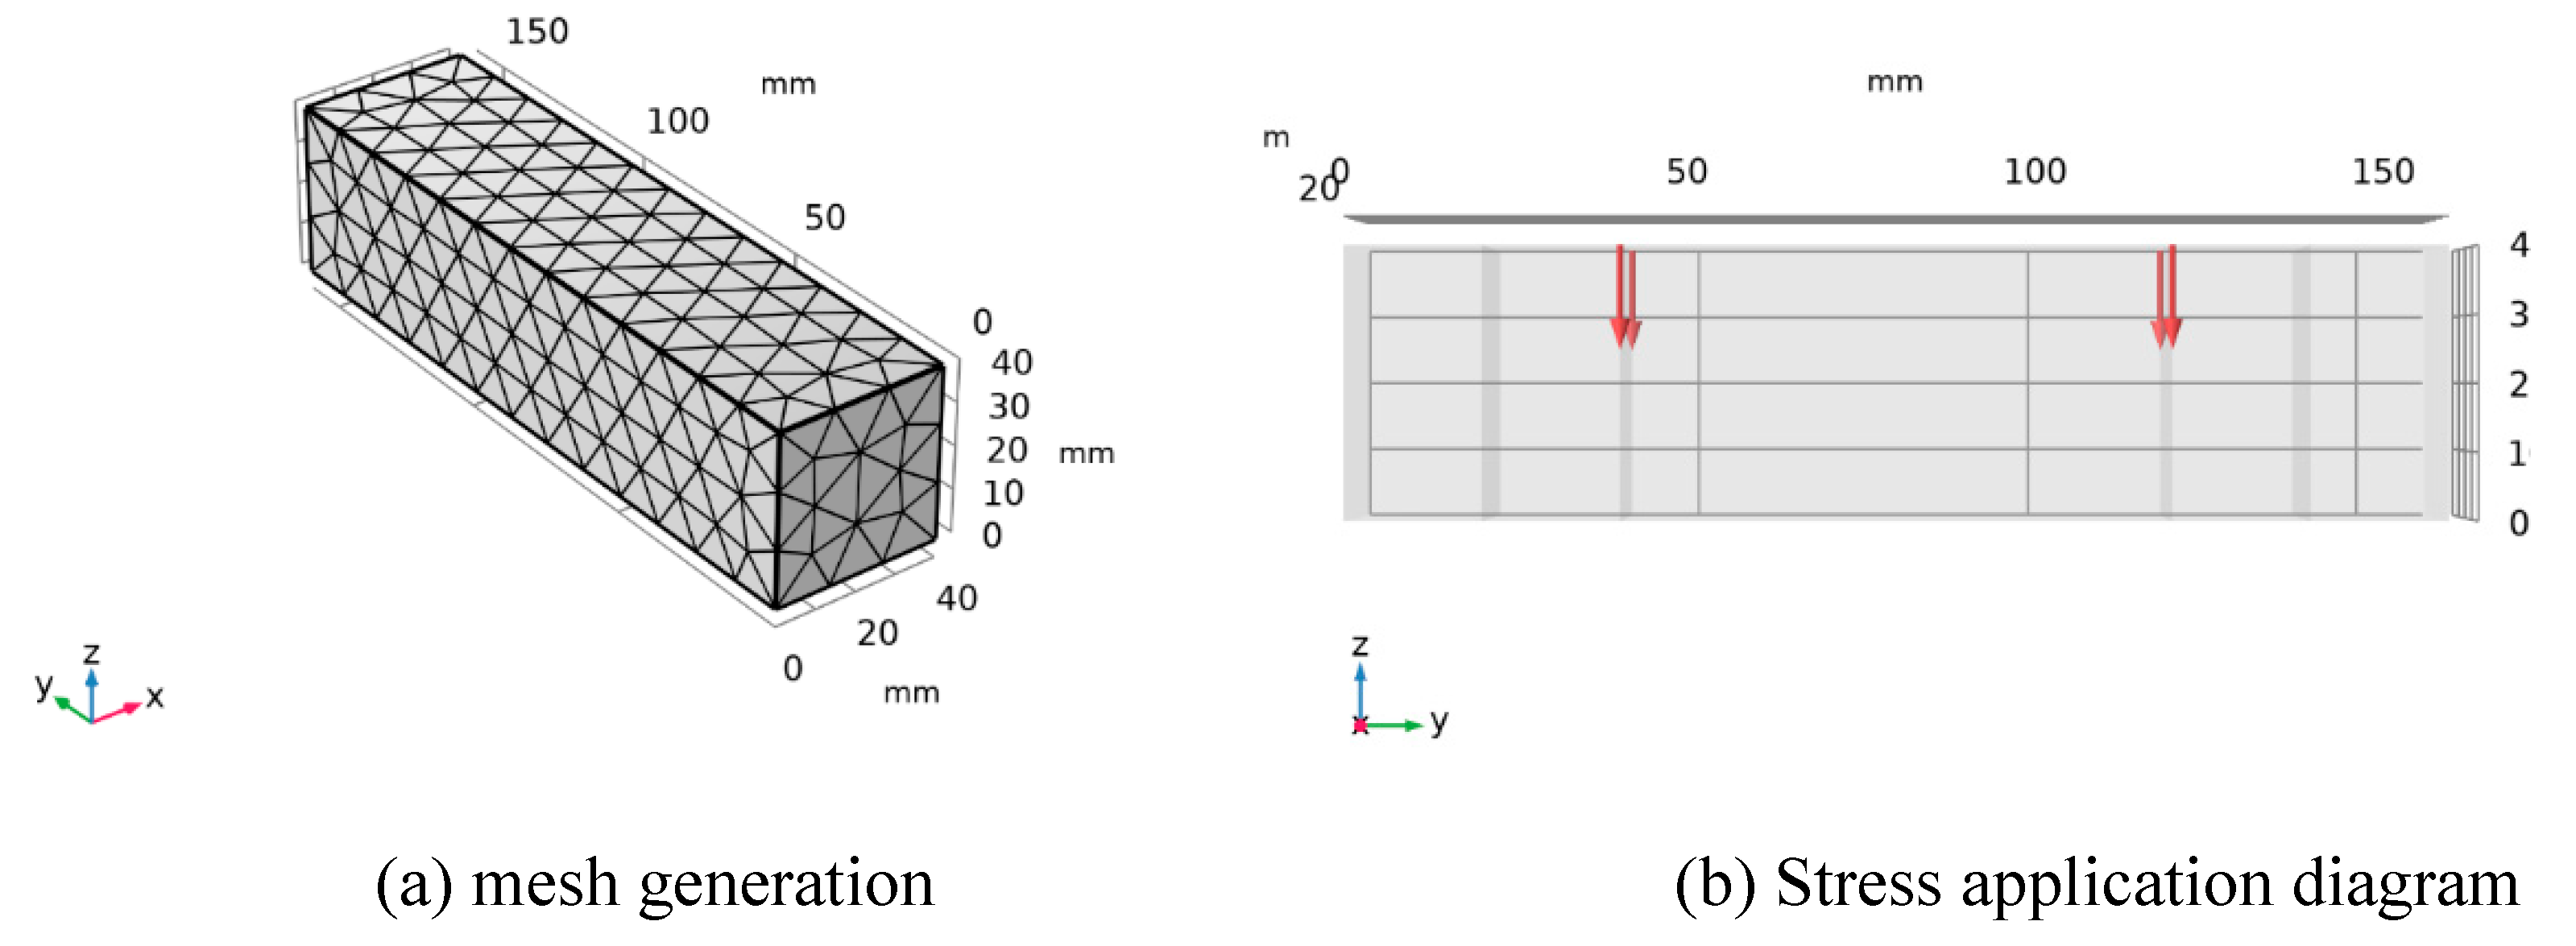
4.2. Numerical Simulation
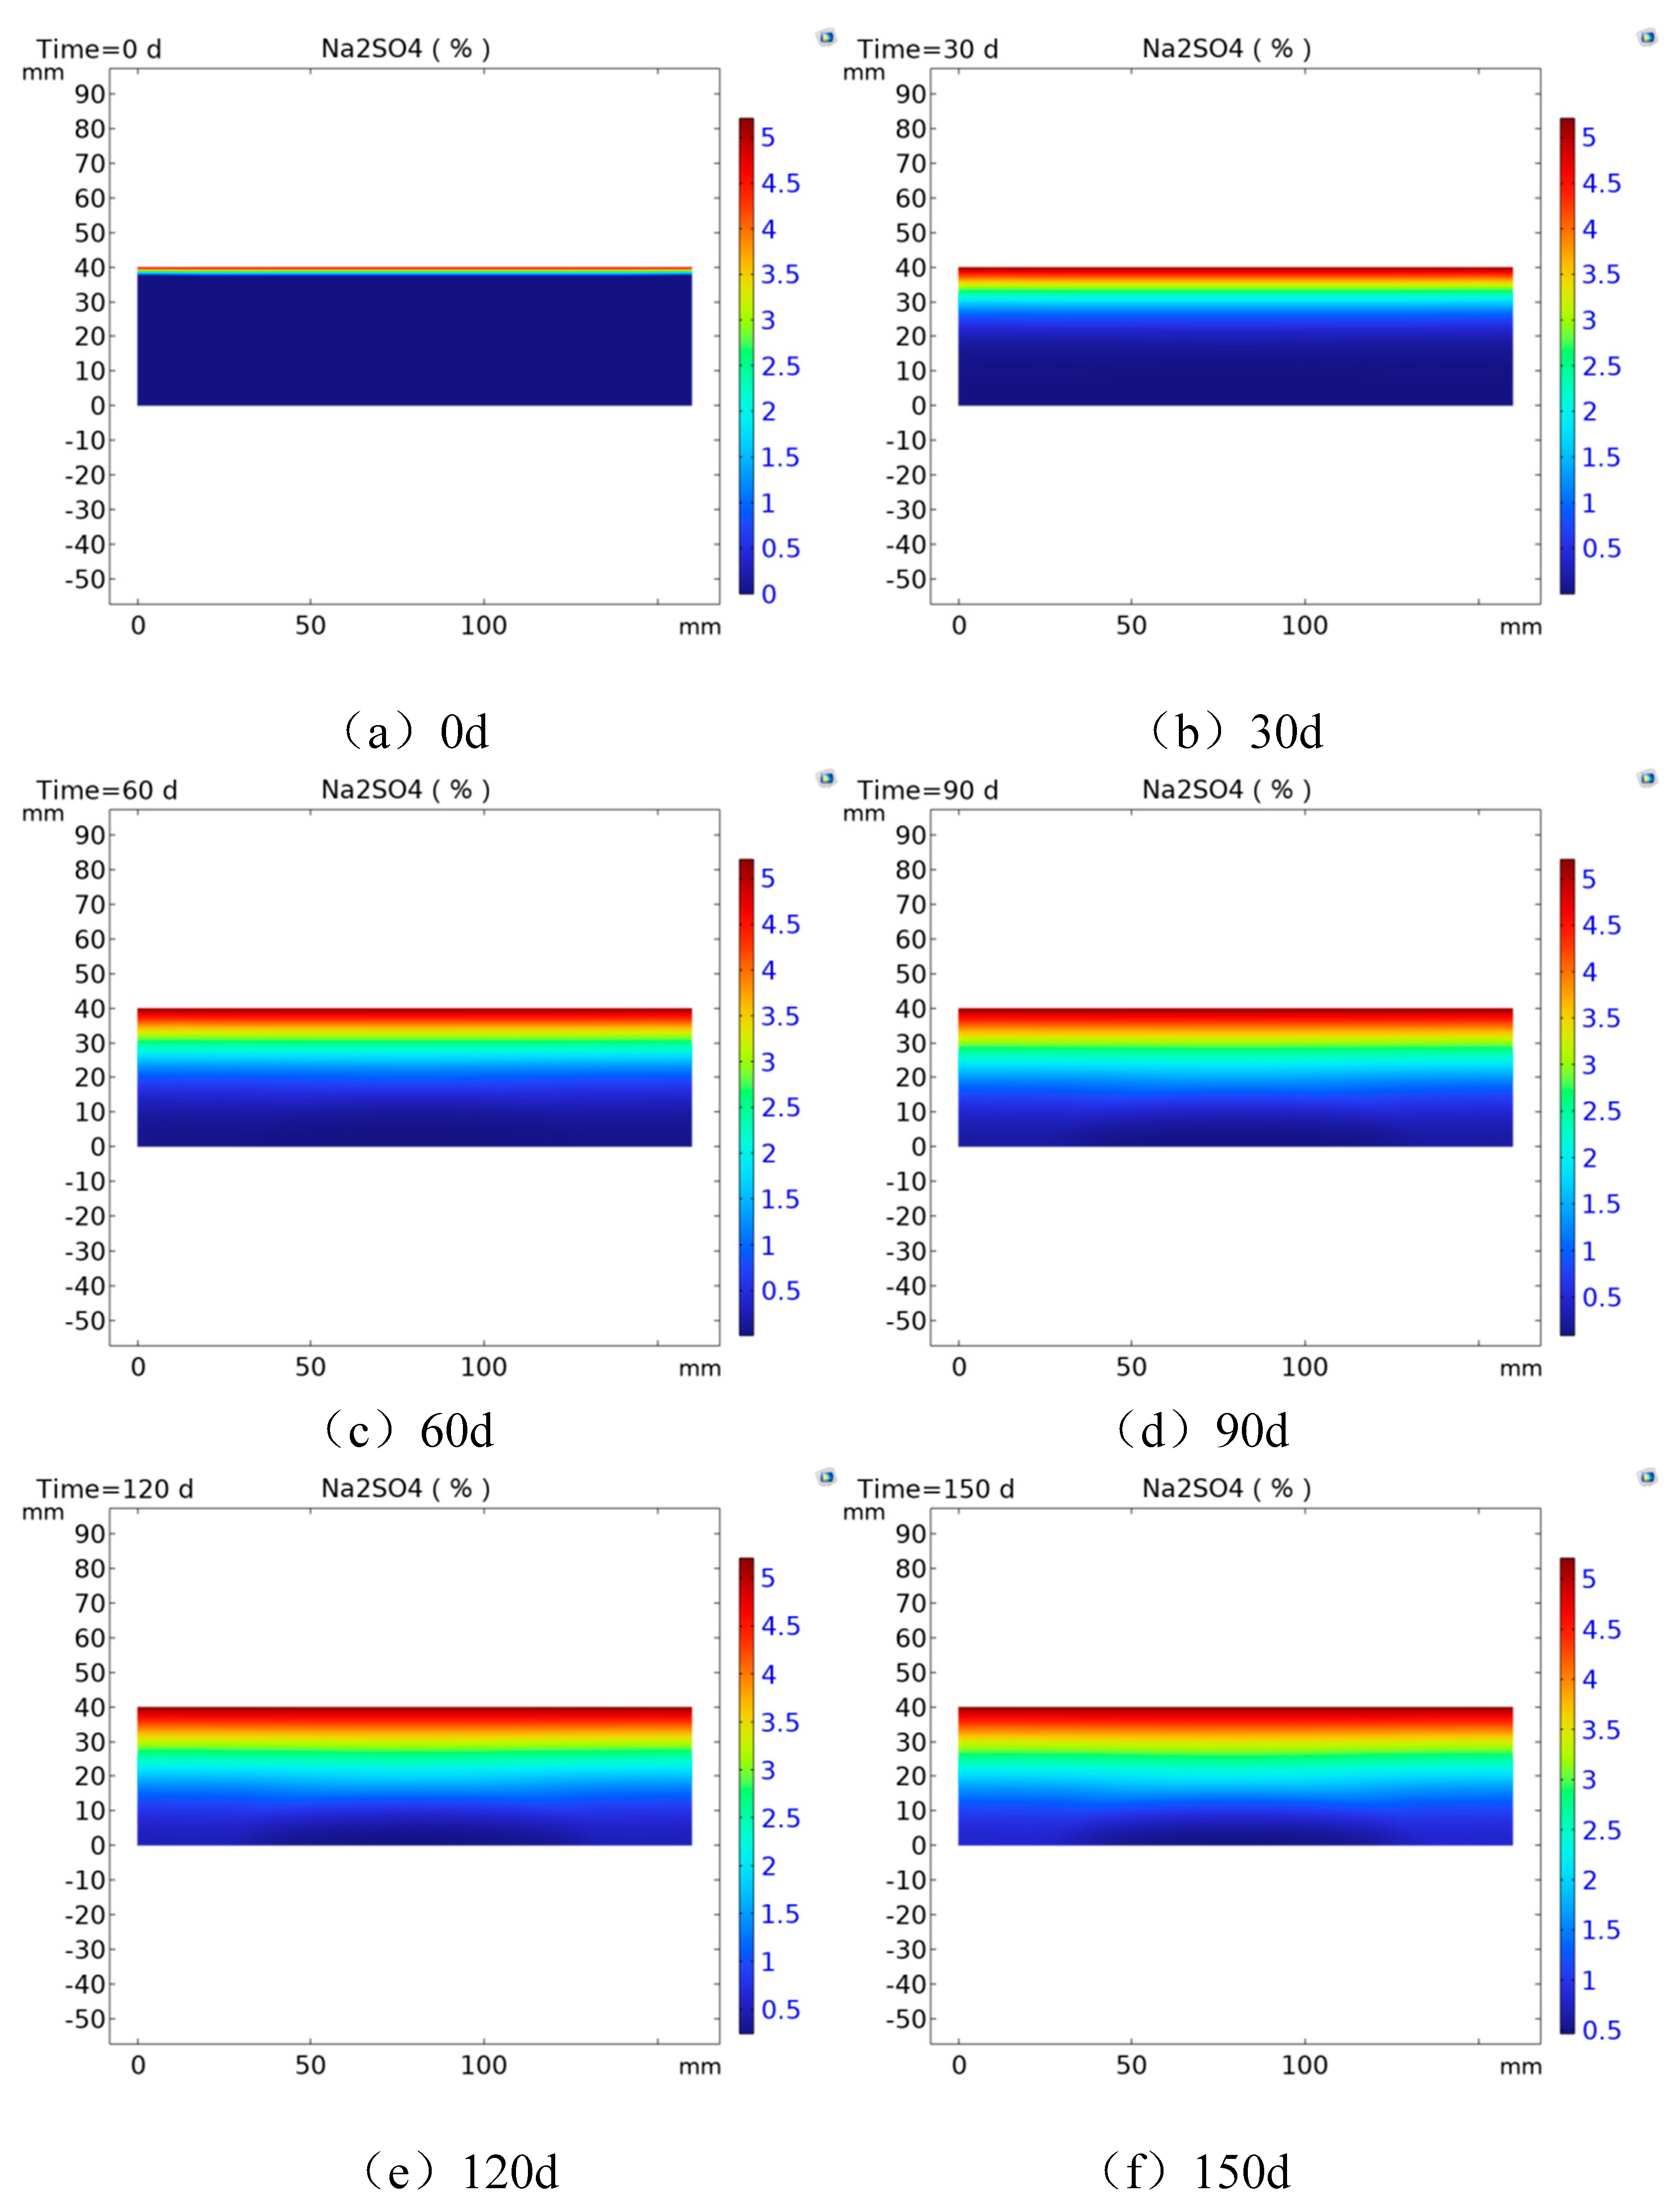
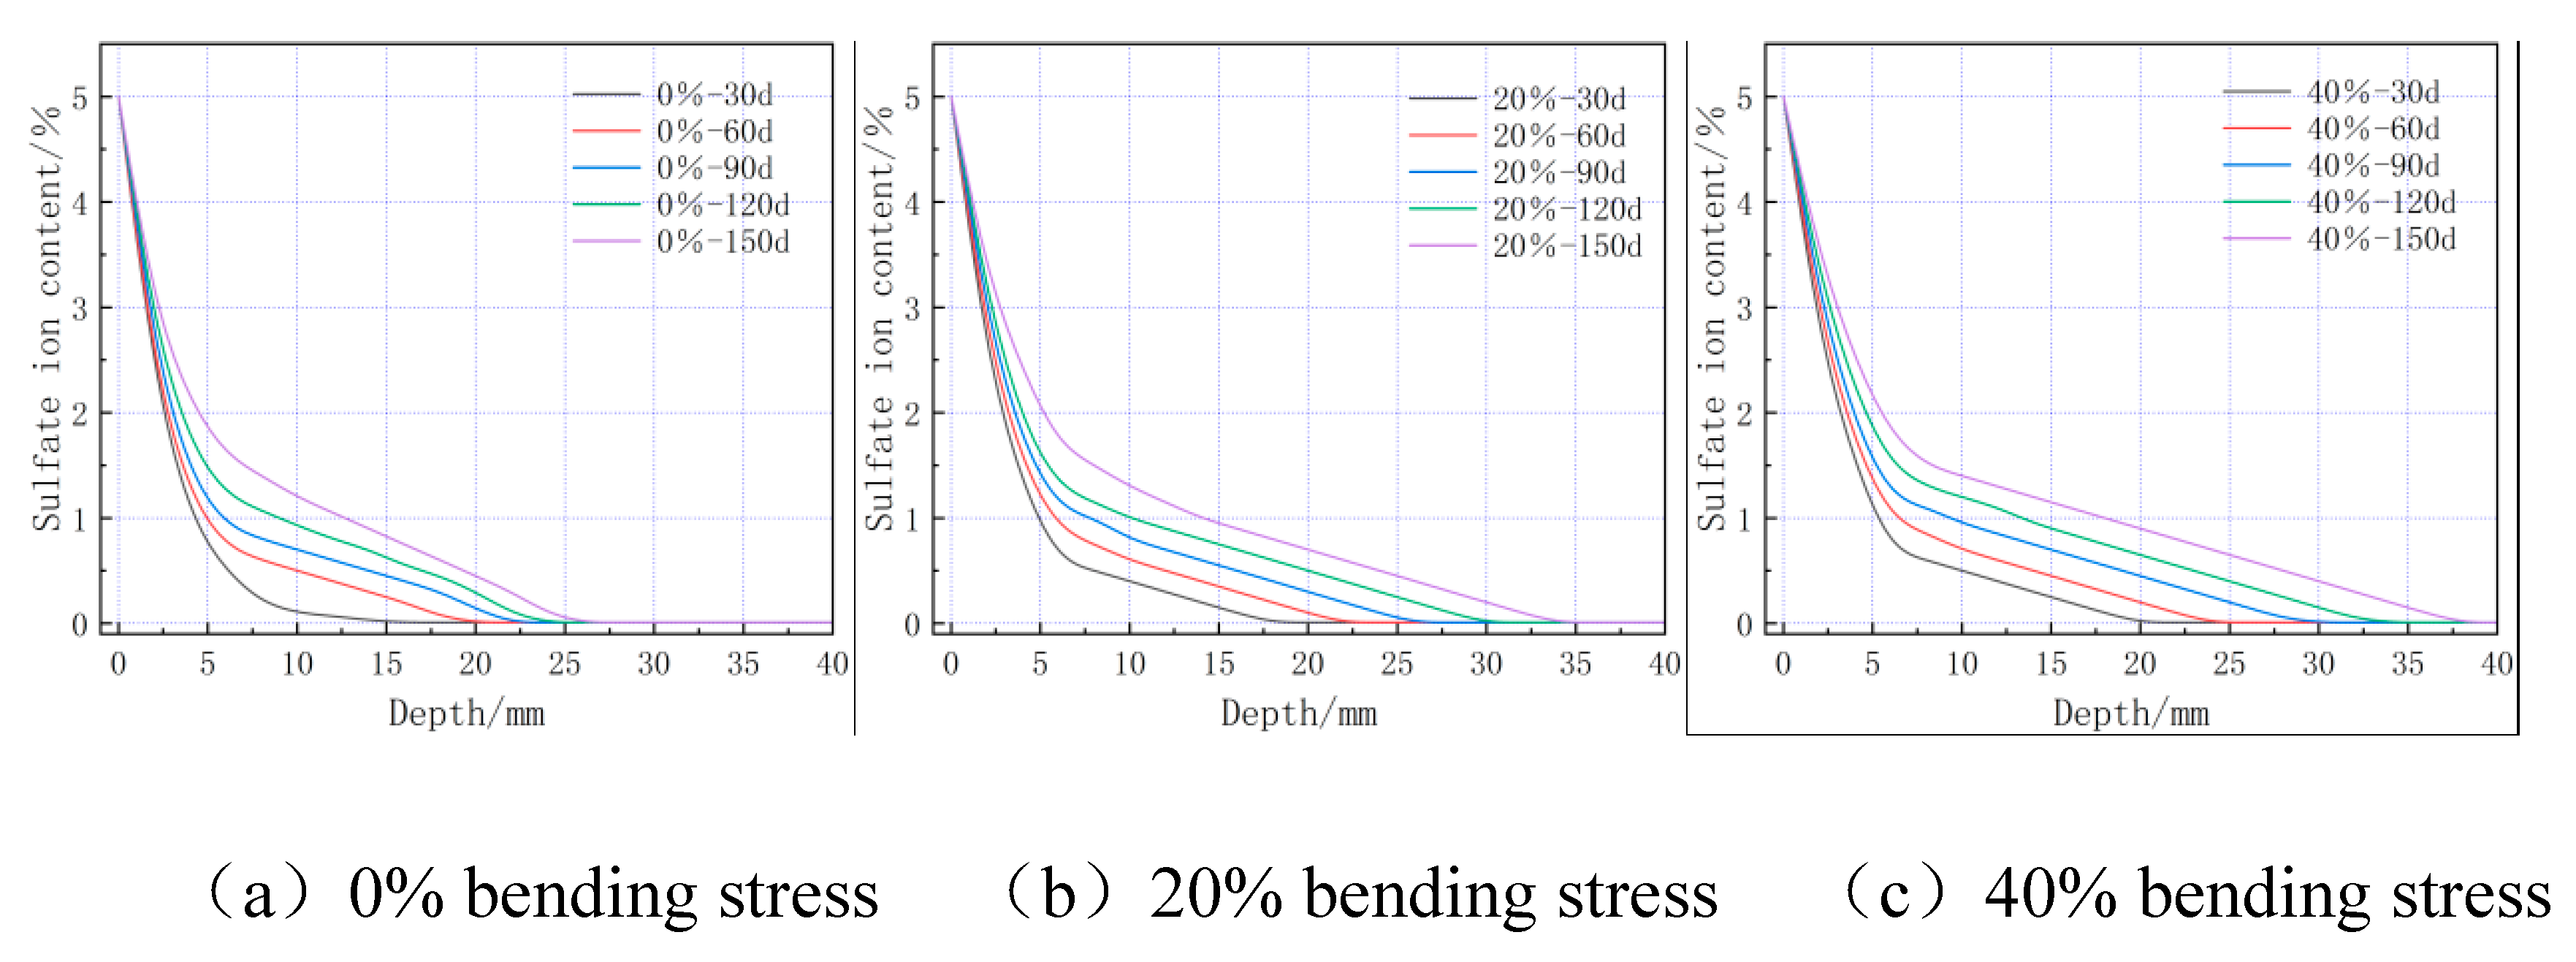
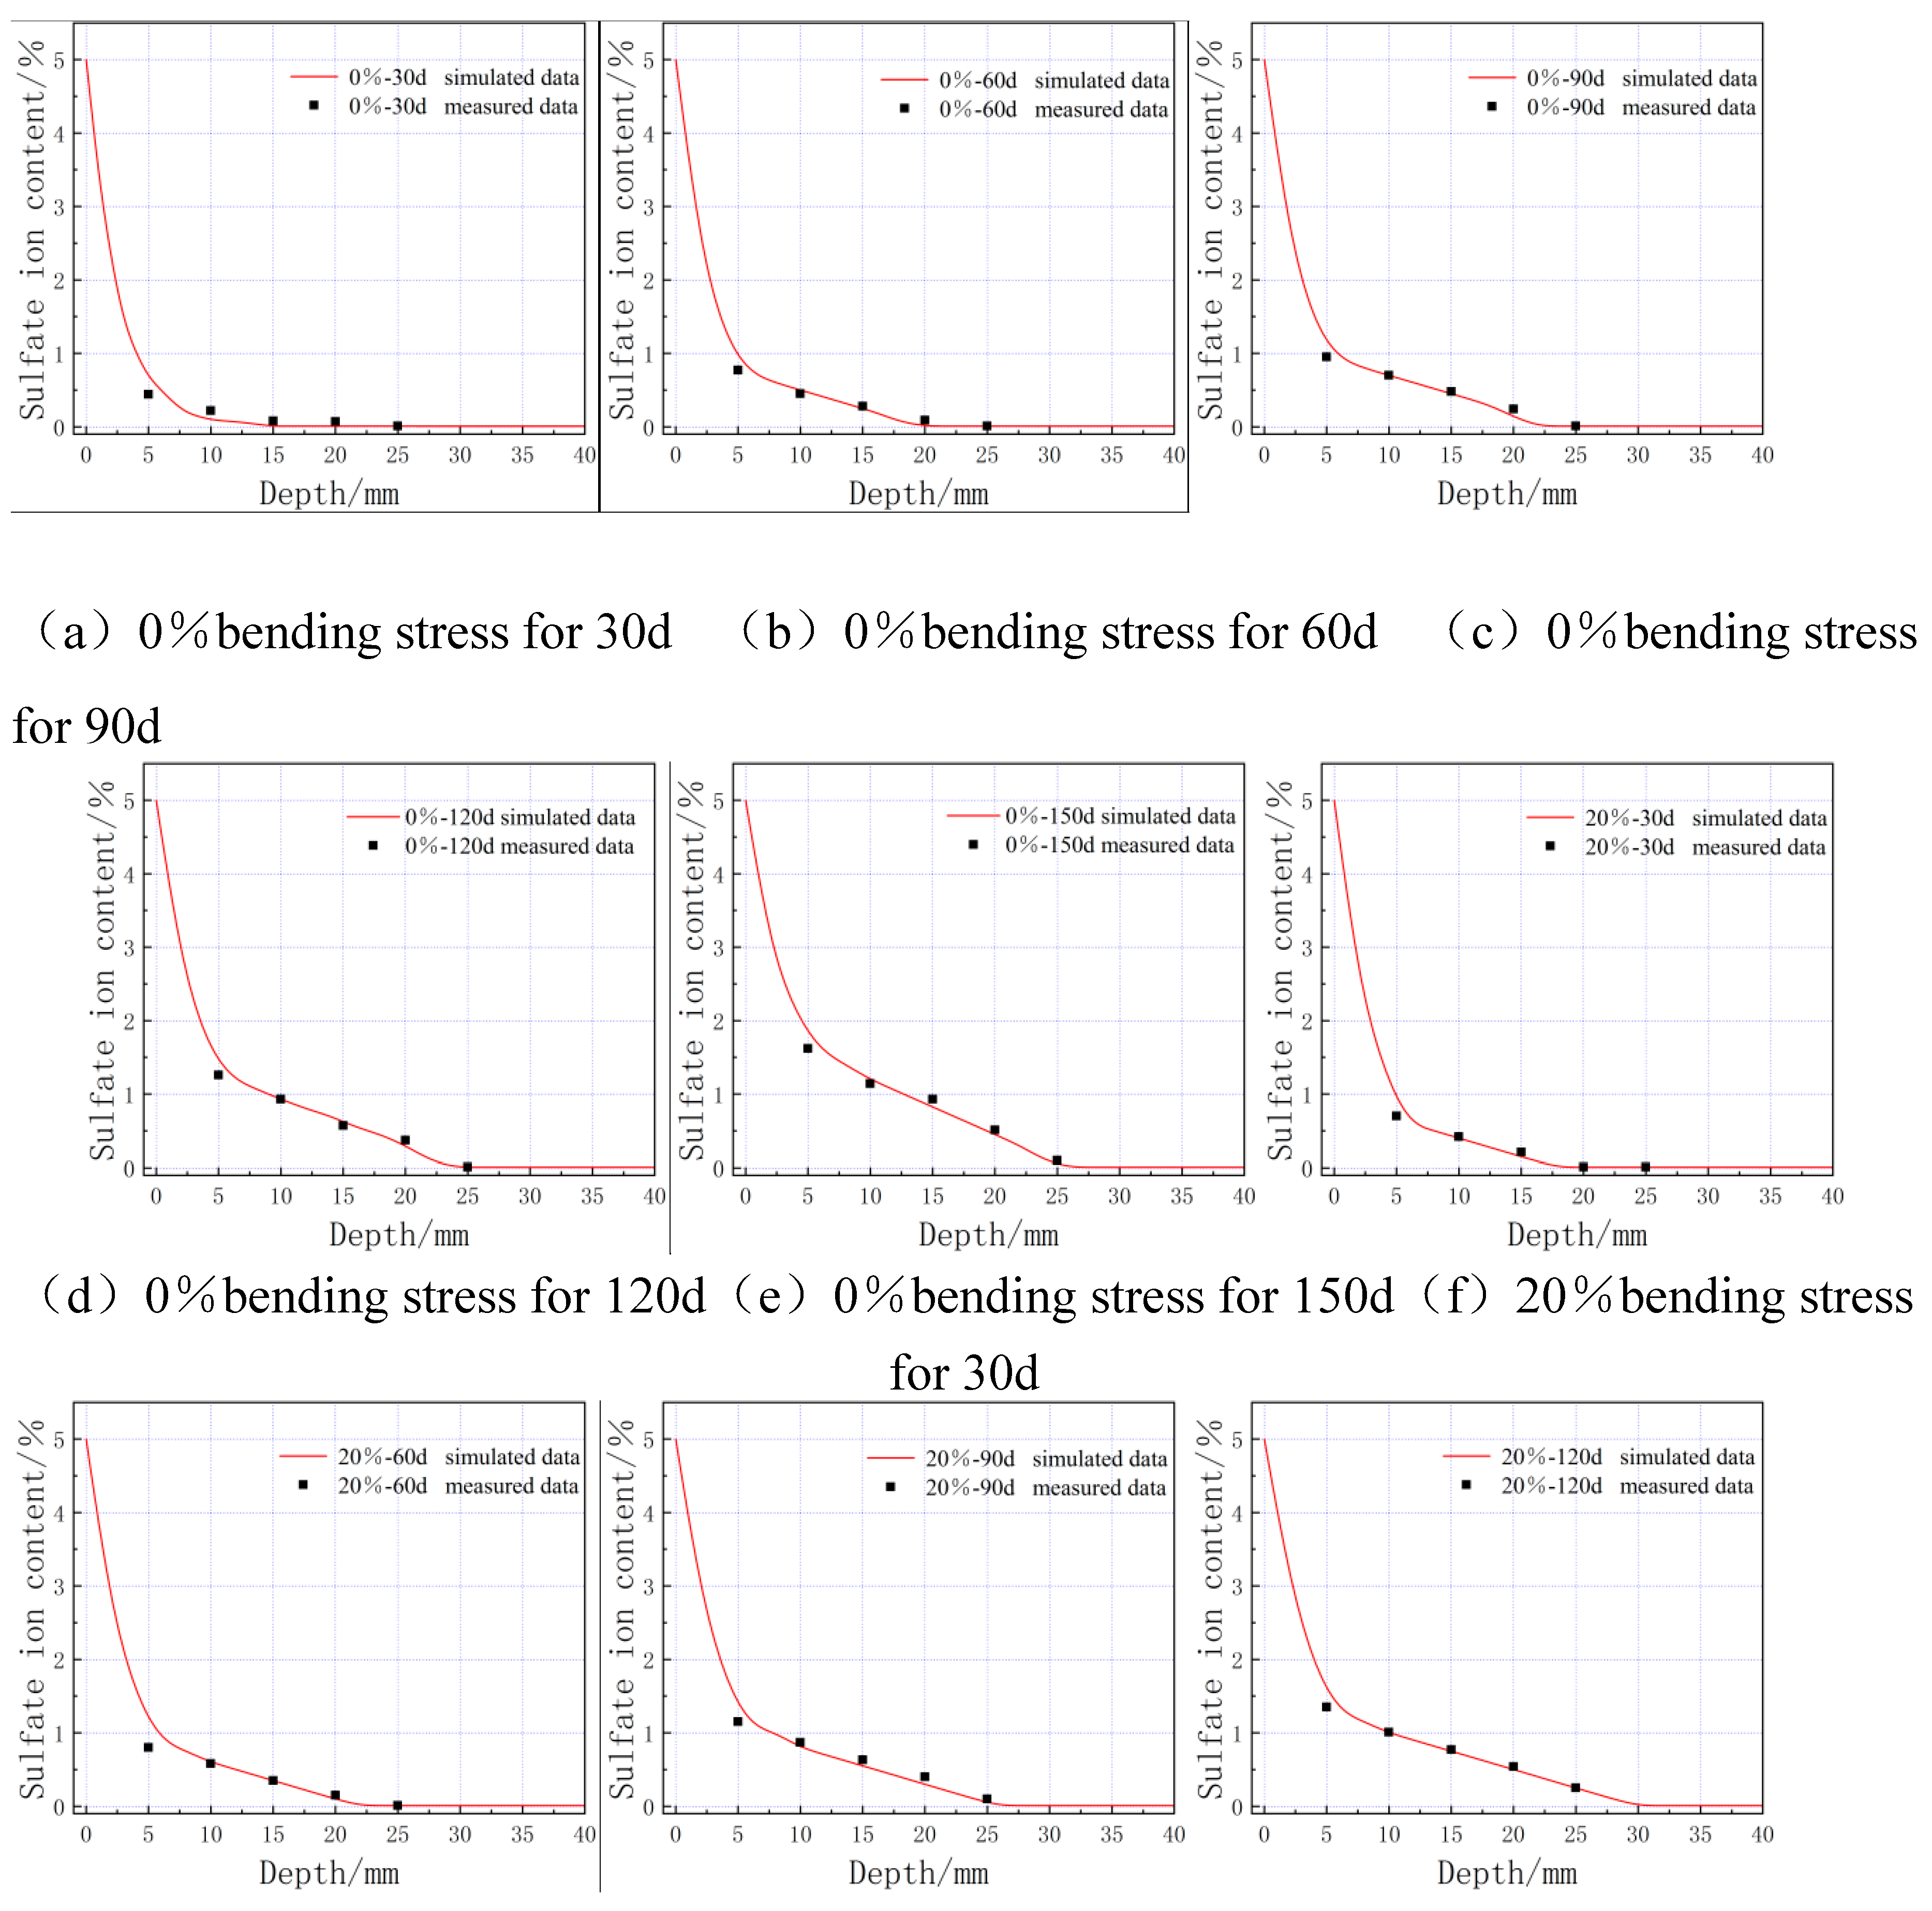
4.3. Numerical simulation results and analysis
5. Conclusions
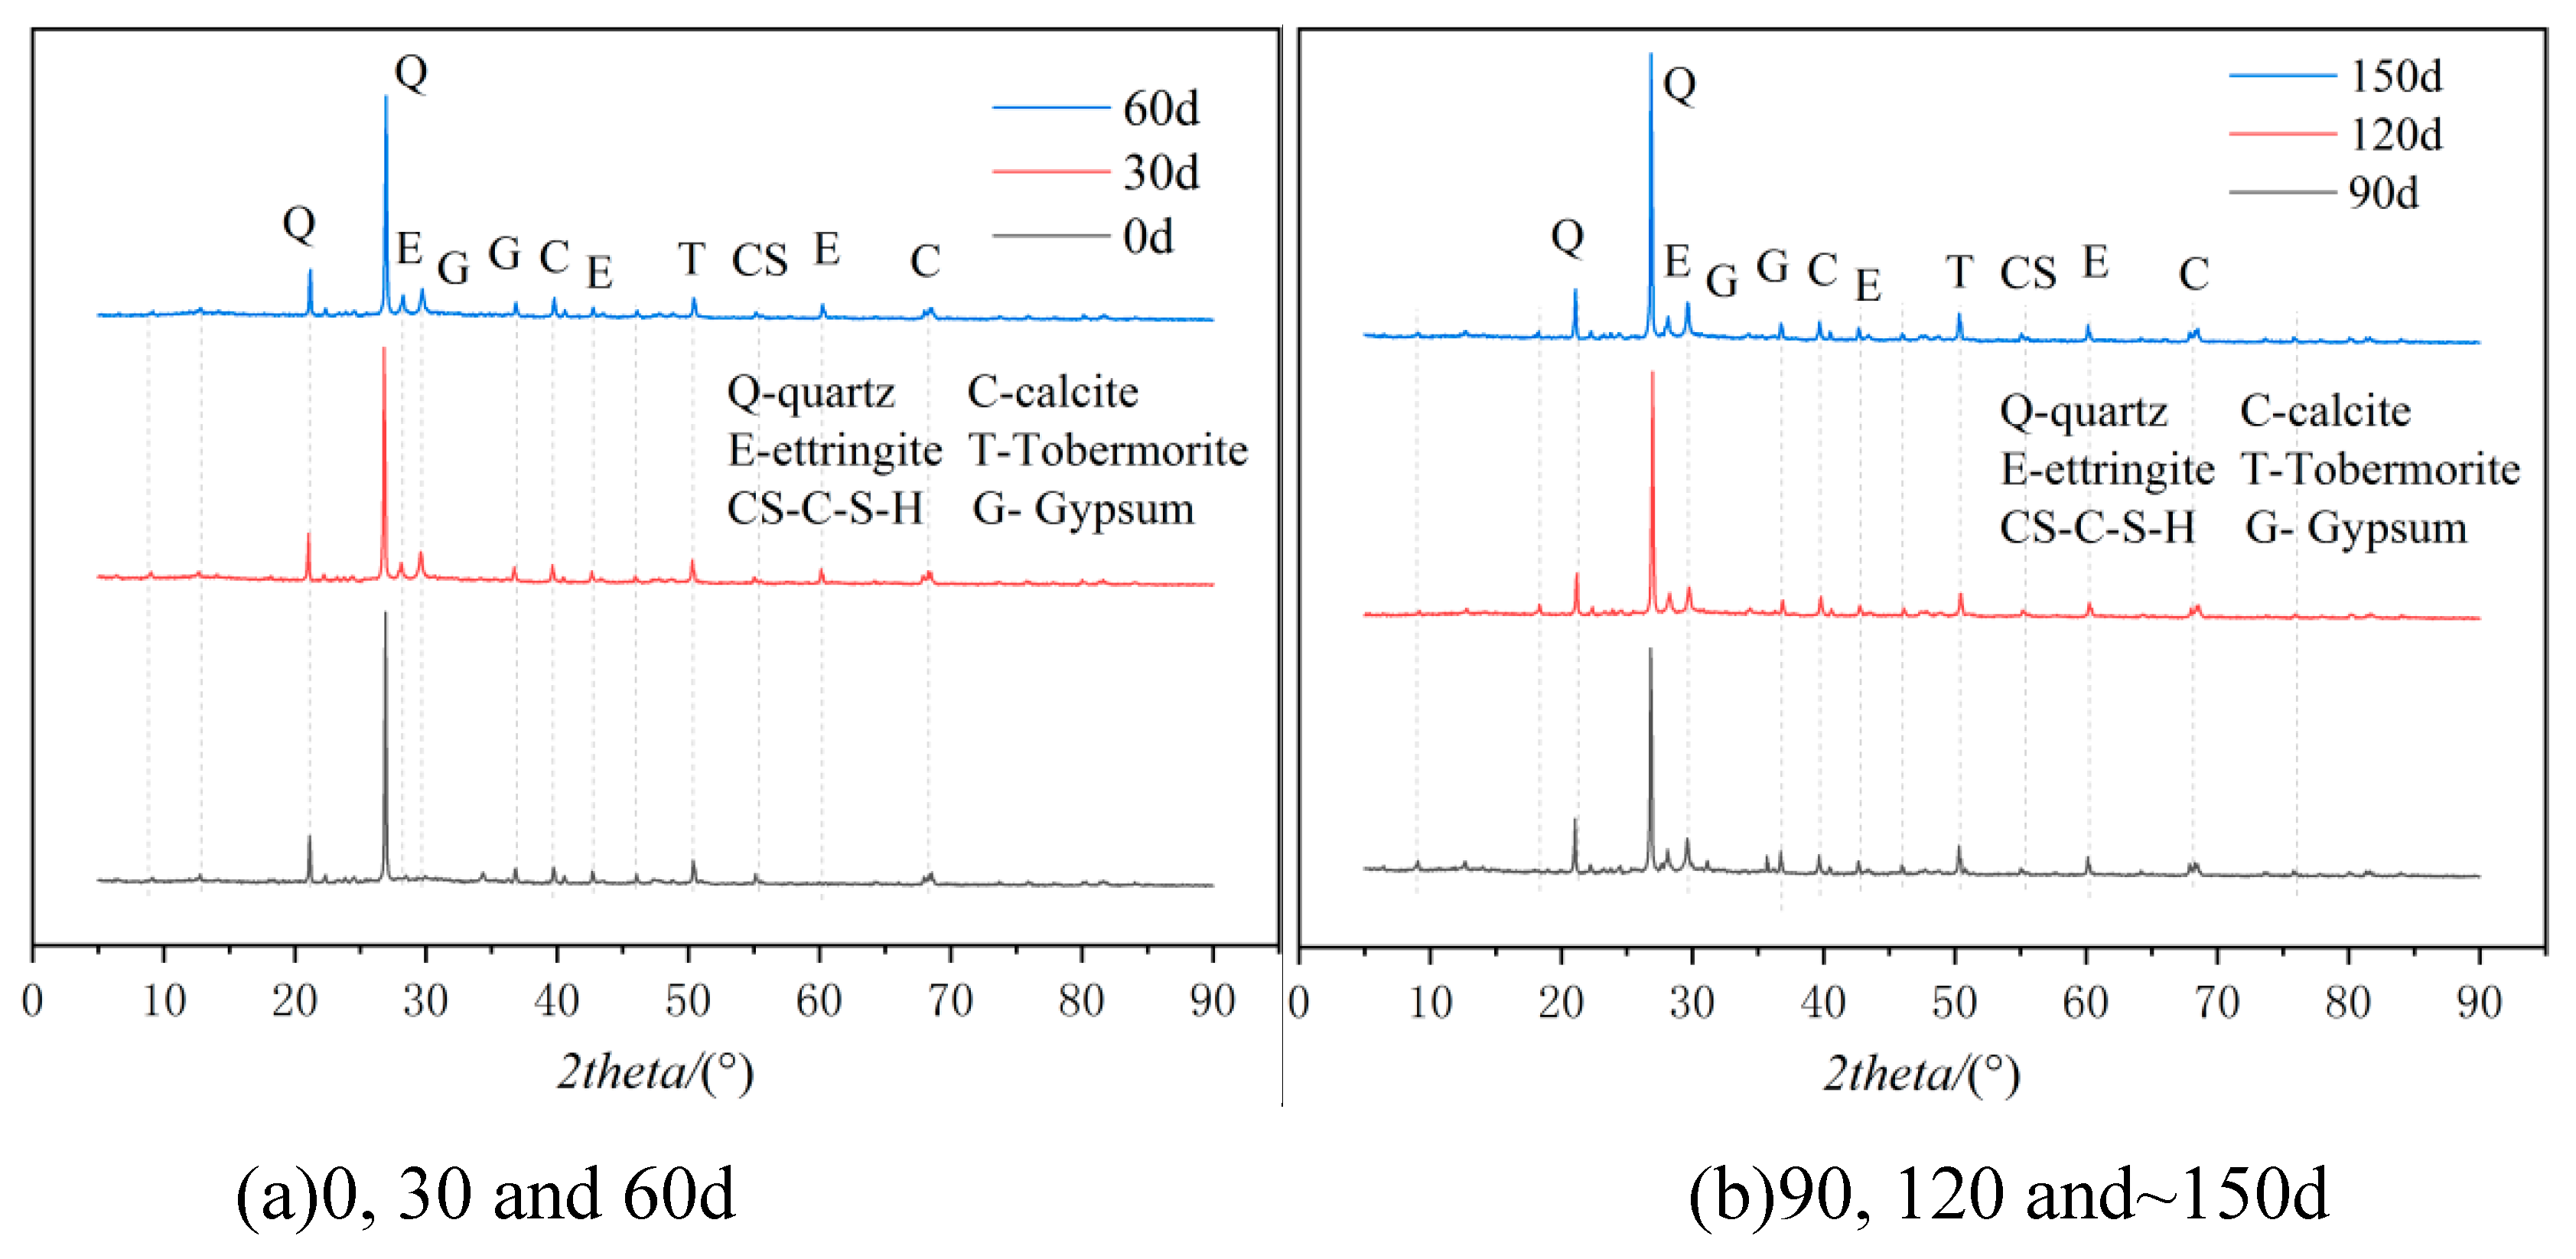
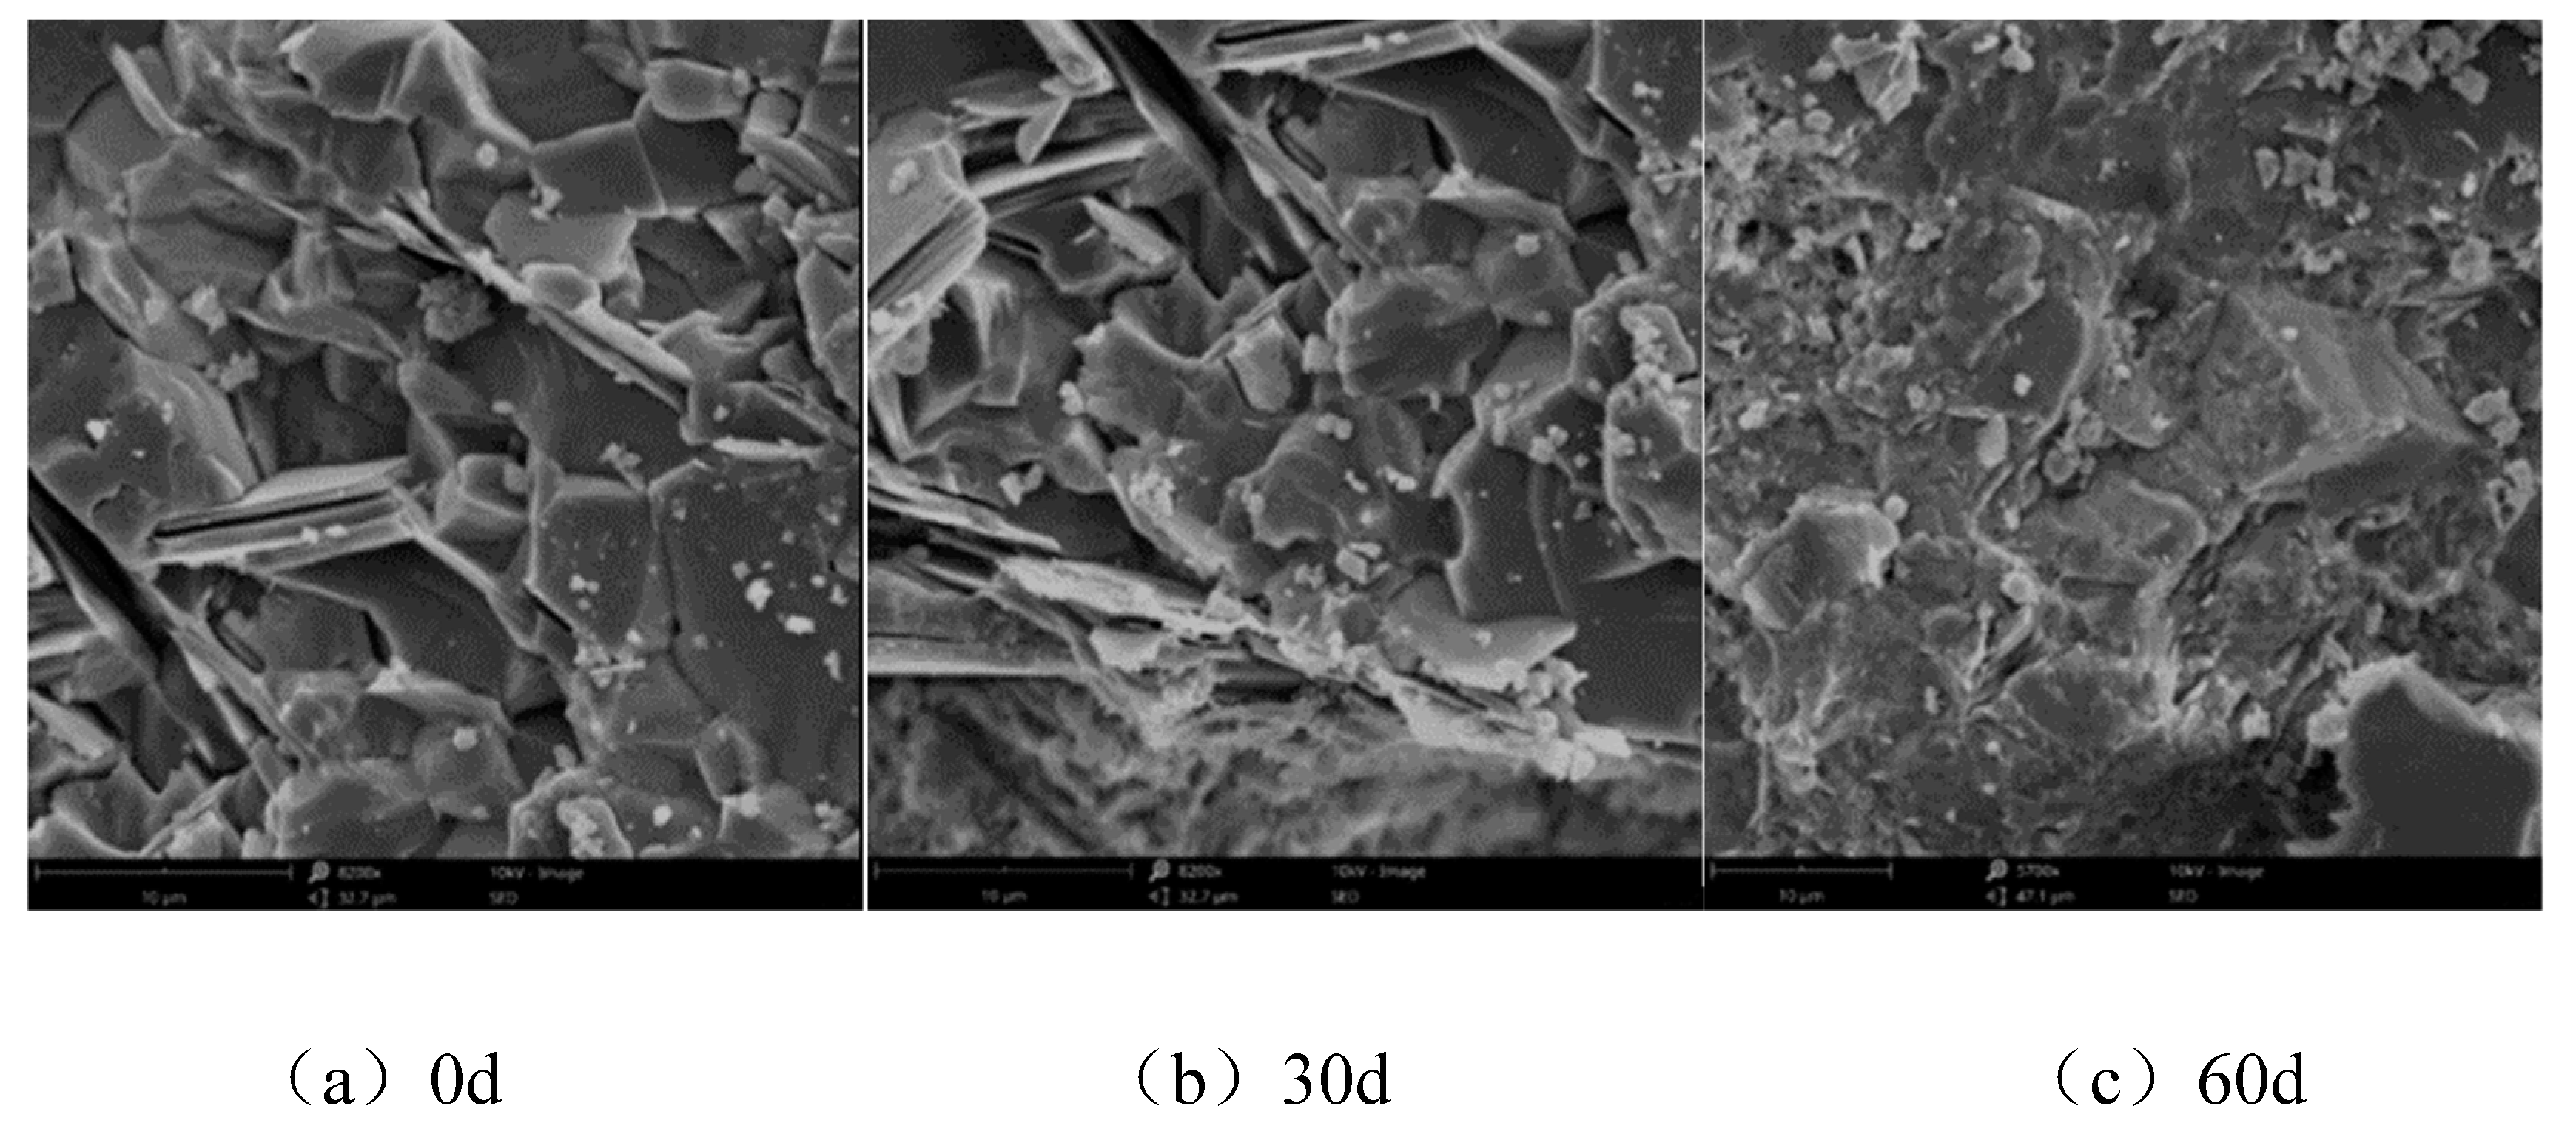
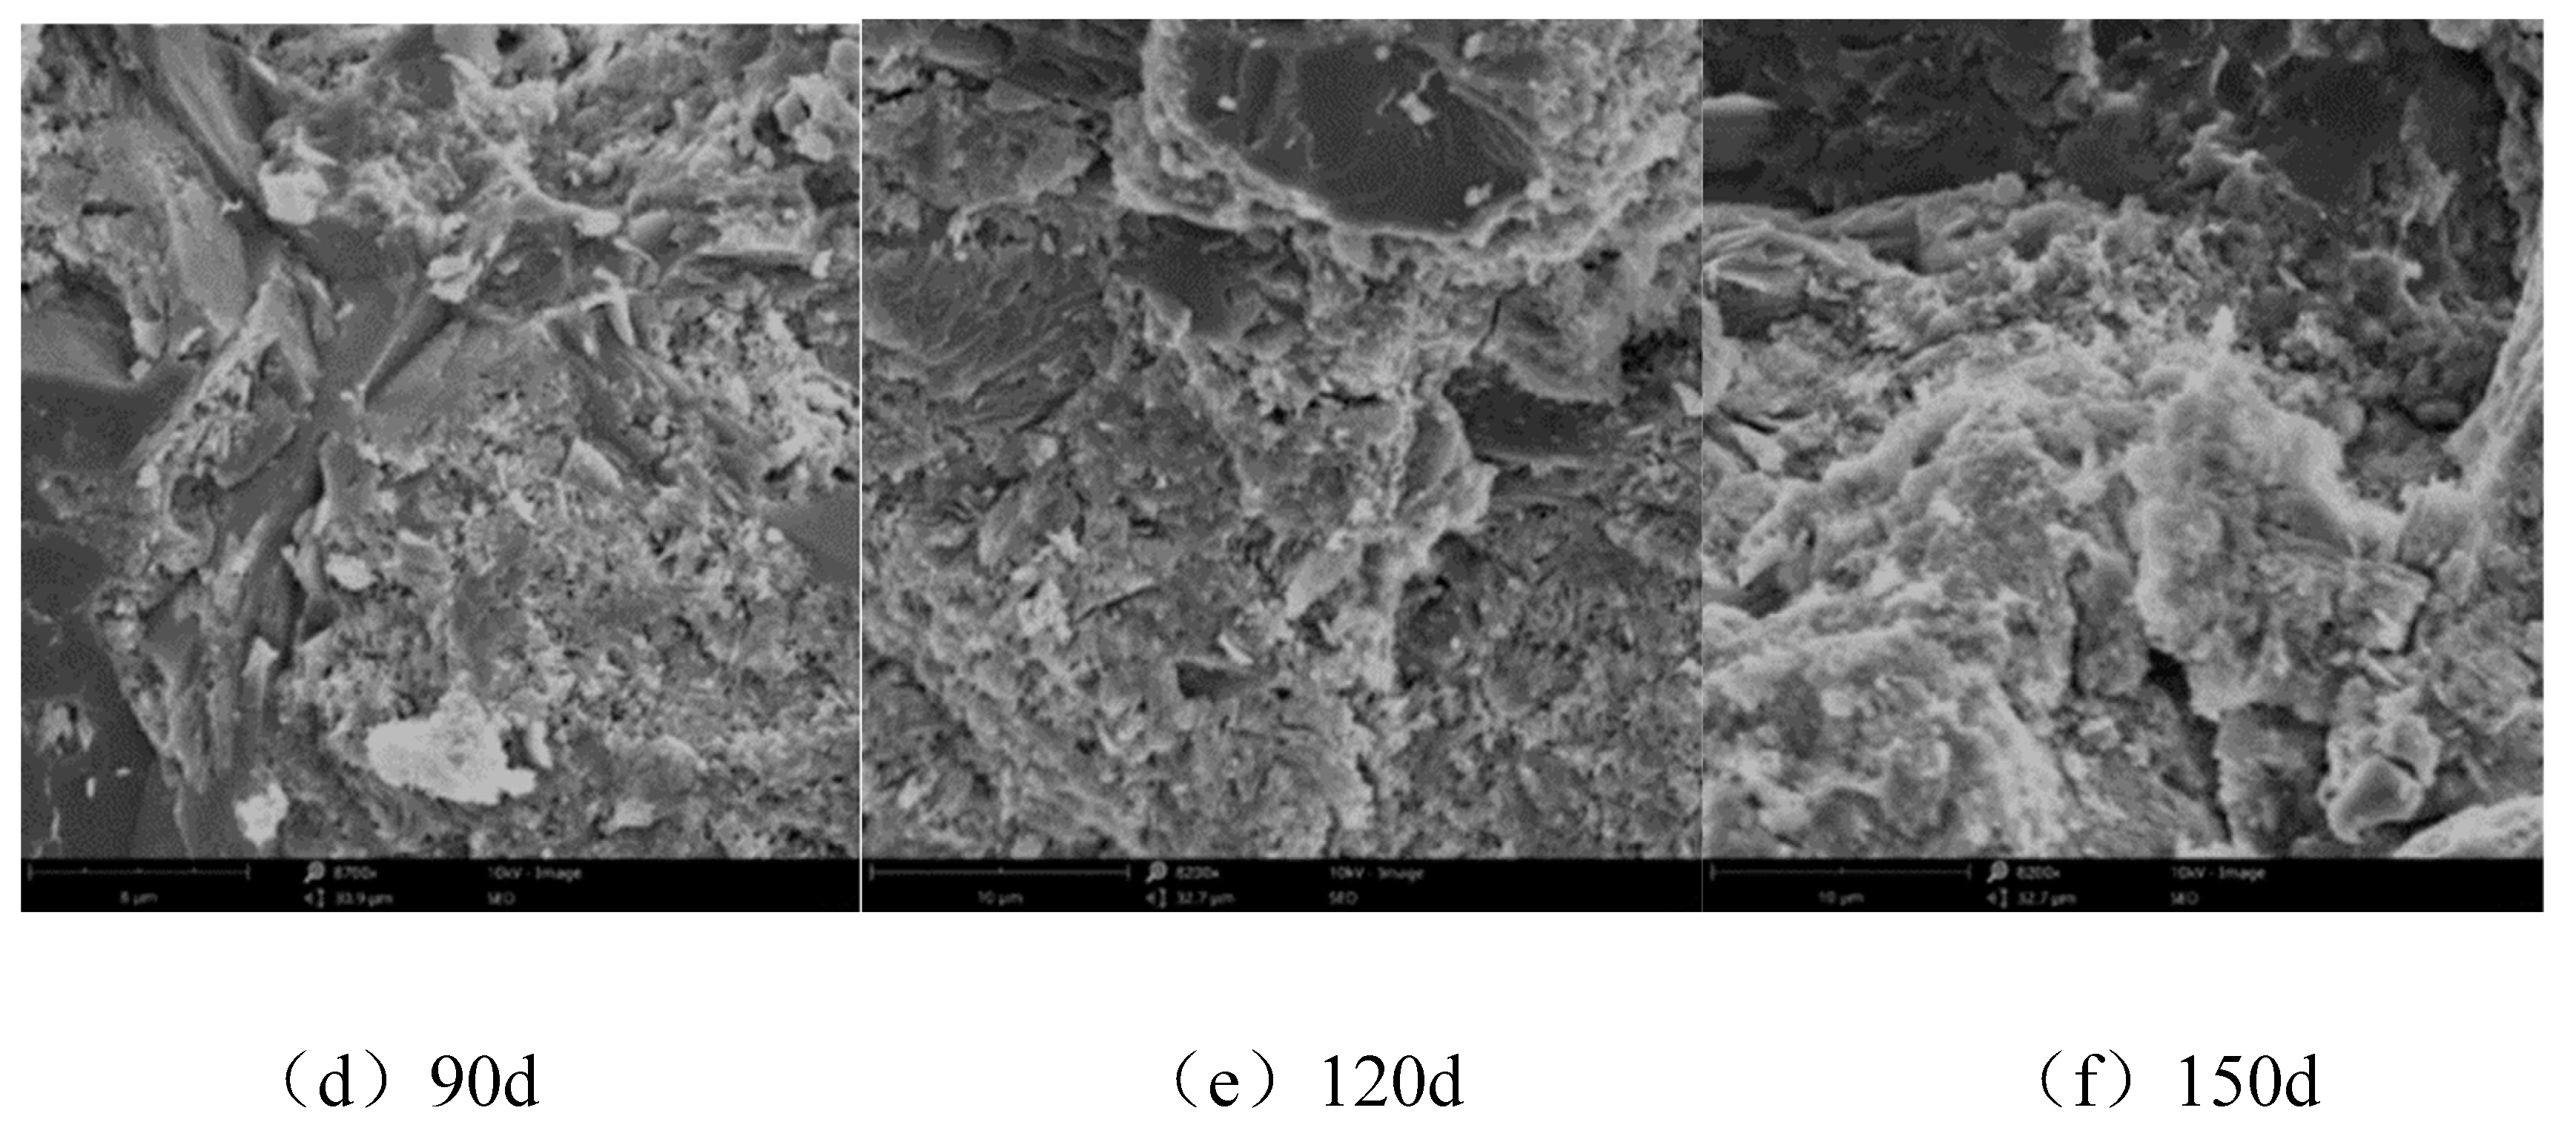
- Sulfate erosion of cementitious materials is caused by sulfate ions entering cementitious materials by diffusion and other means, and then chemically reacting with hydrated calcium silicate, etc., in cement-based materials, swell products like plaster and calcium aluminate can form and cause rusting.
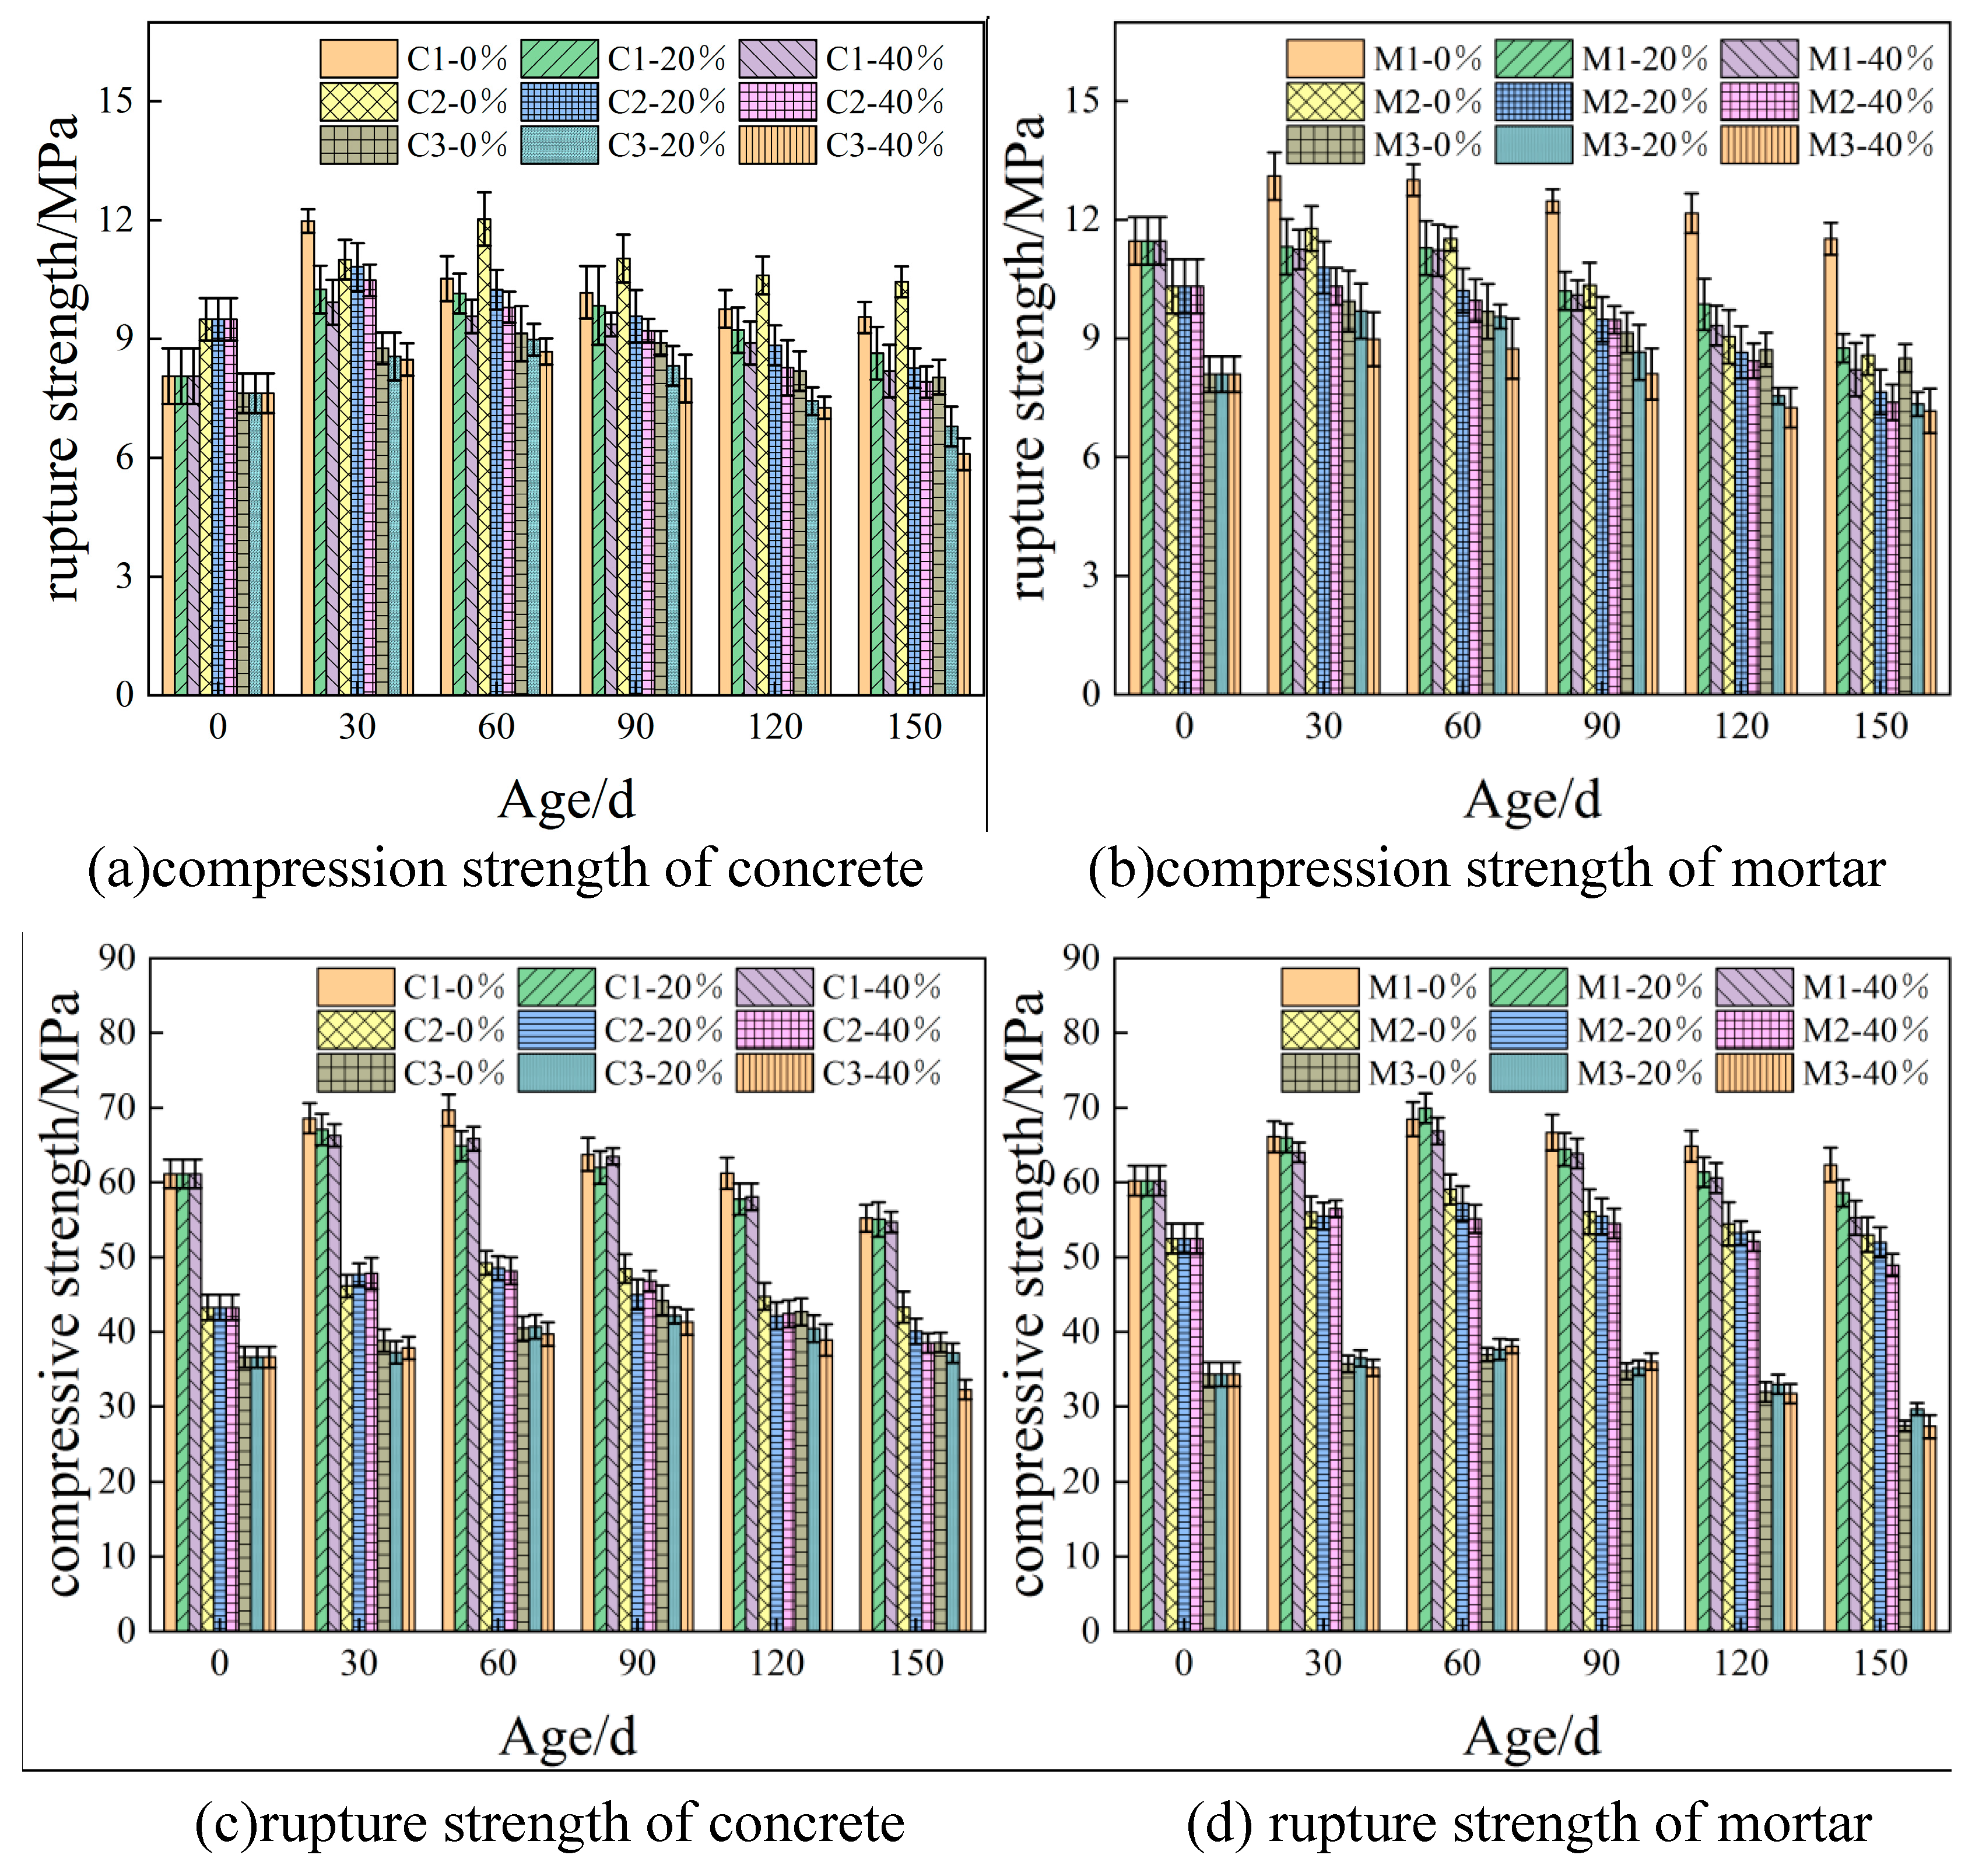
- The compressive and flexural strength of the cementitious material increases with the age of sulphate erosion and then decreases, reaching a maximum value at 60 d. The flexural strength of the cementitious material decreases with increasing flexural stress, which to some extent promotes sulphate erosion.
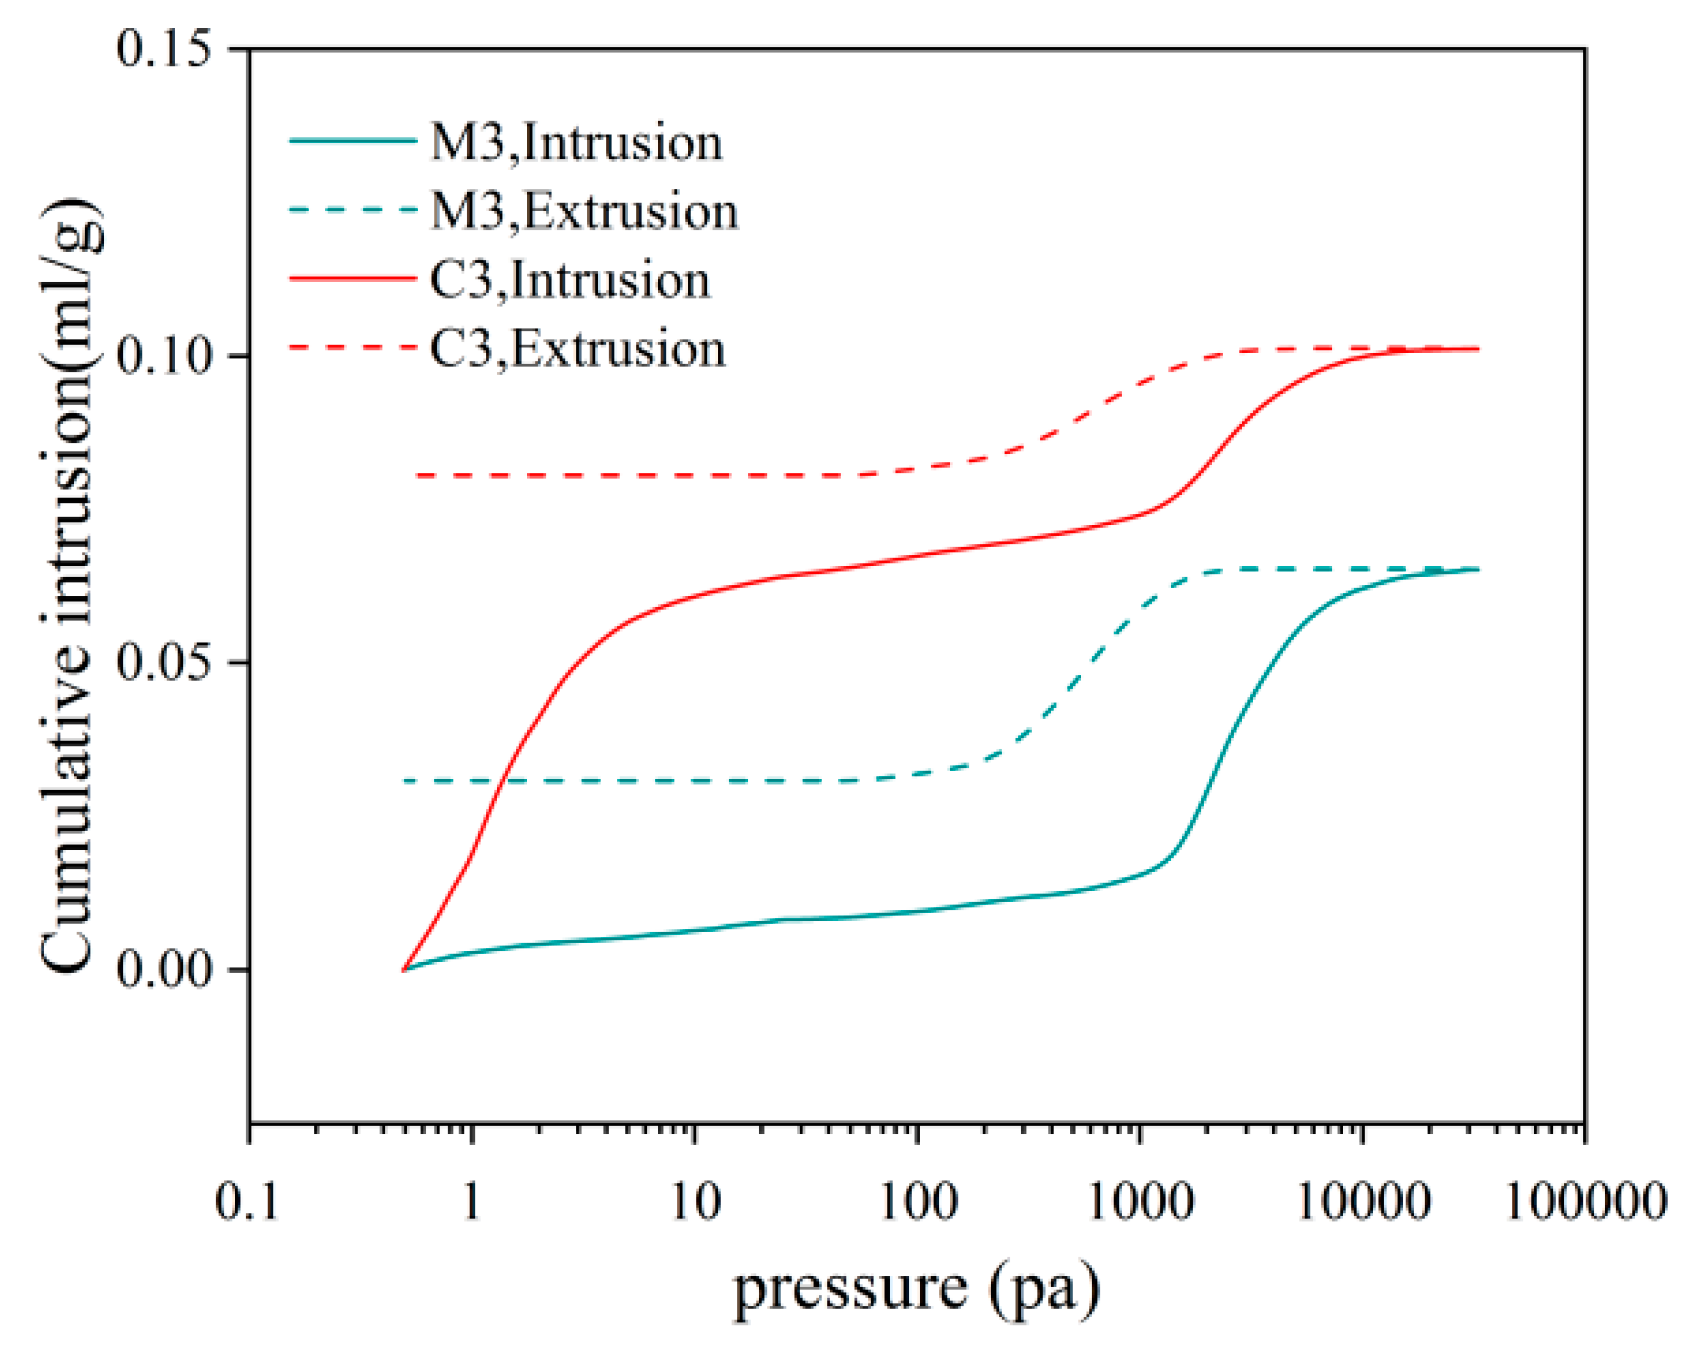
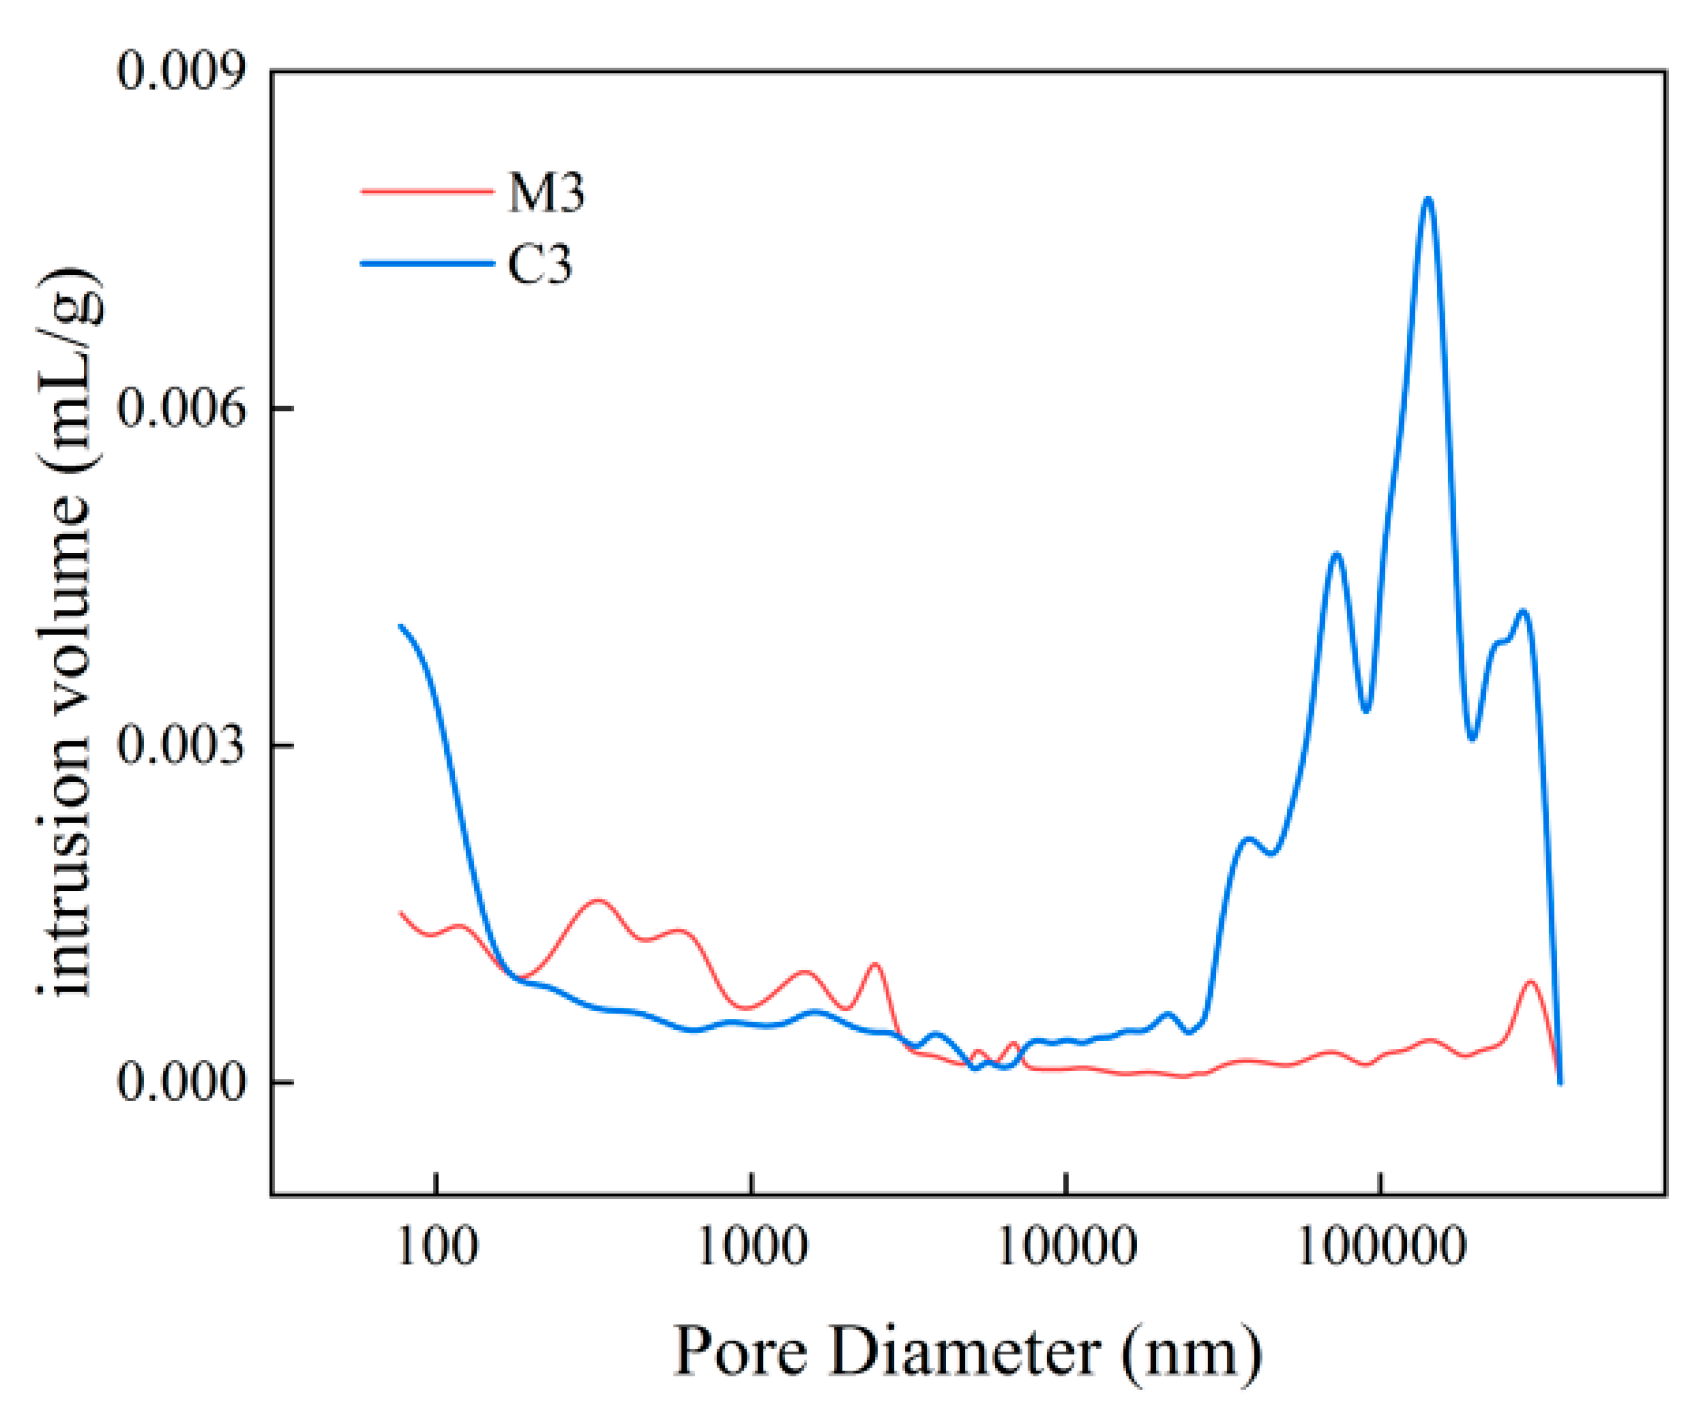
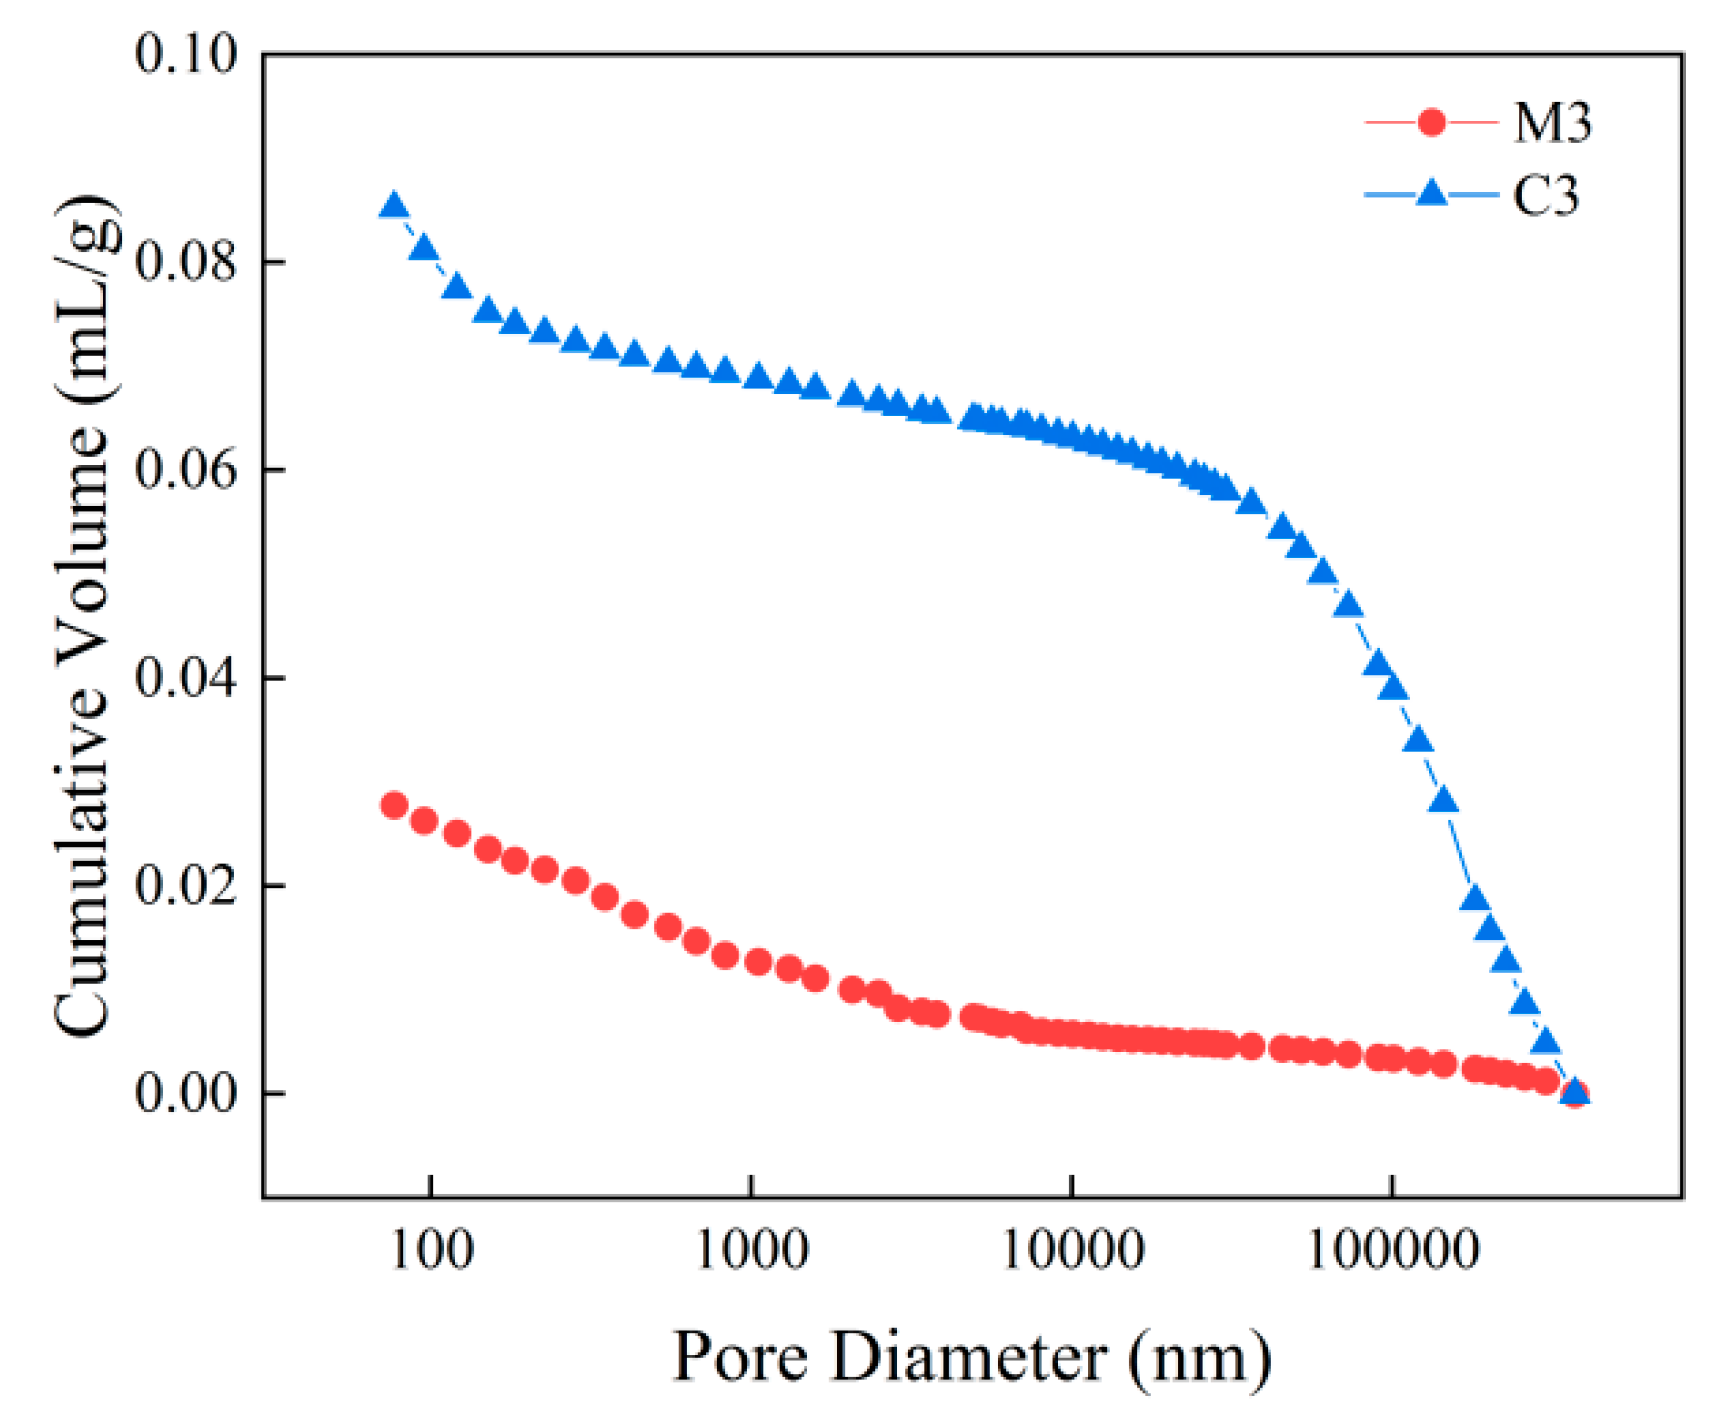
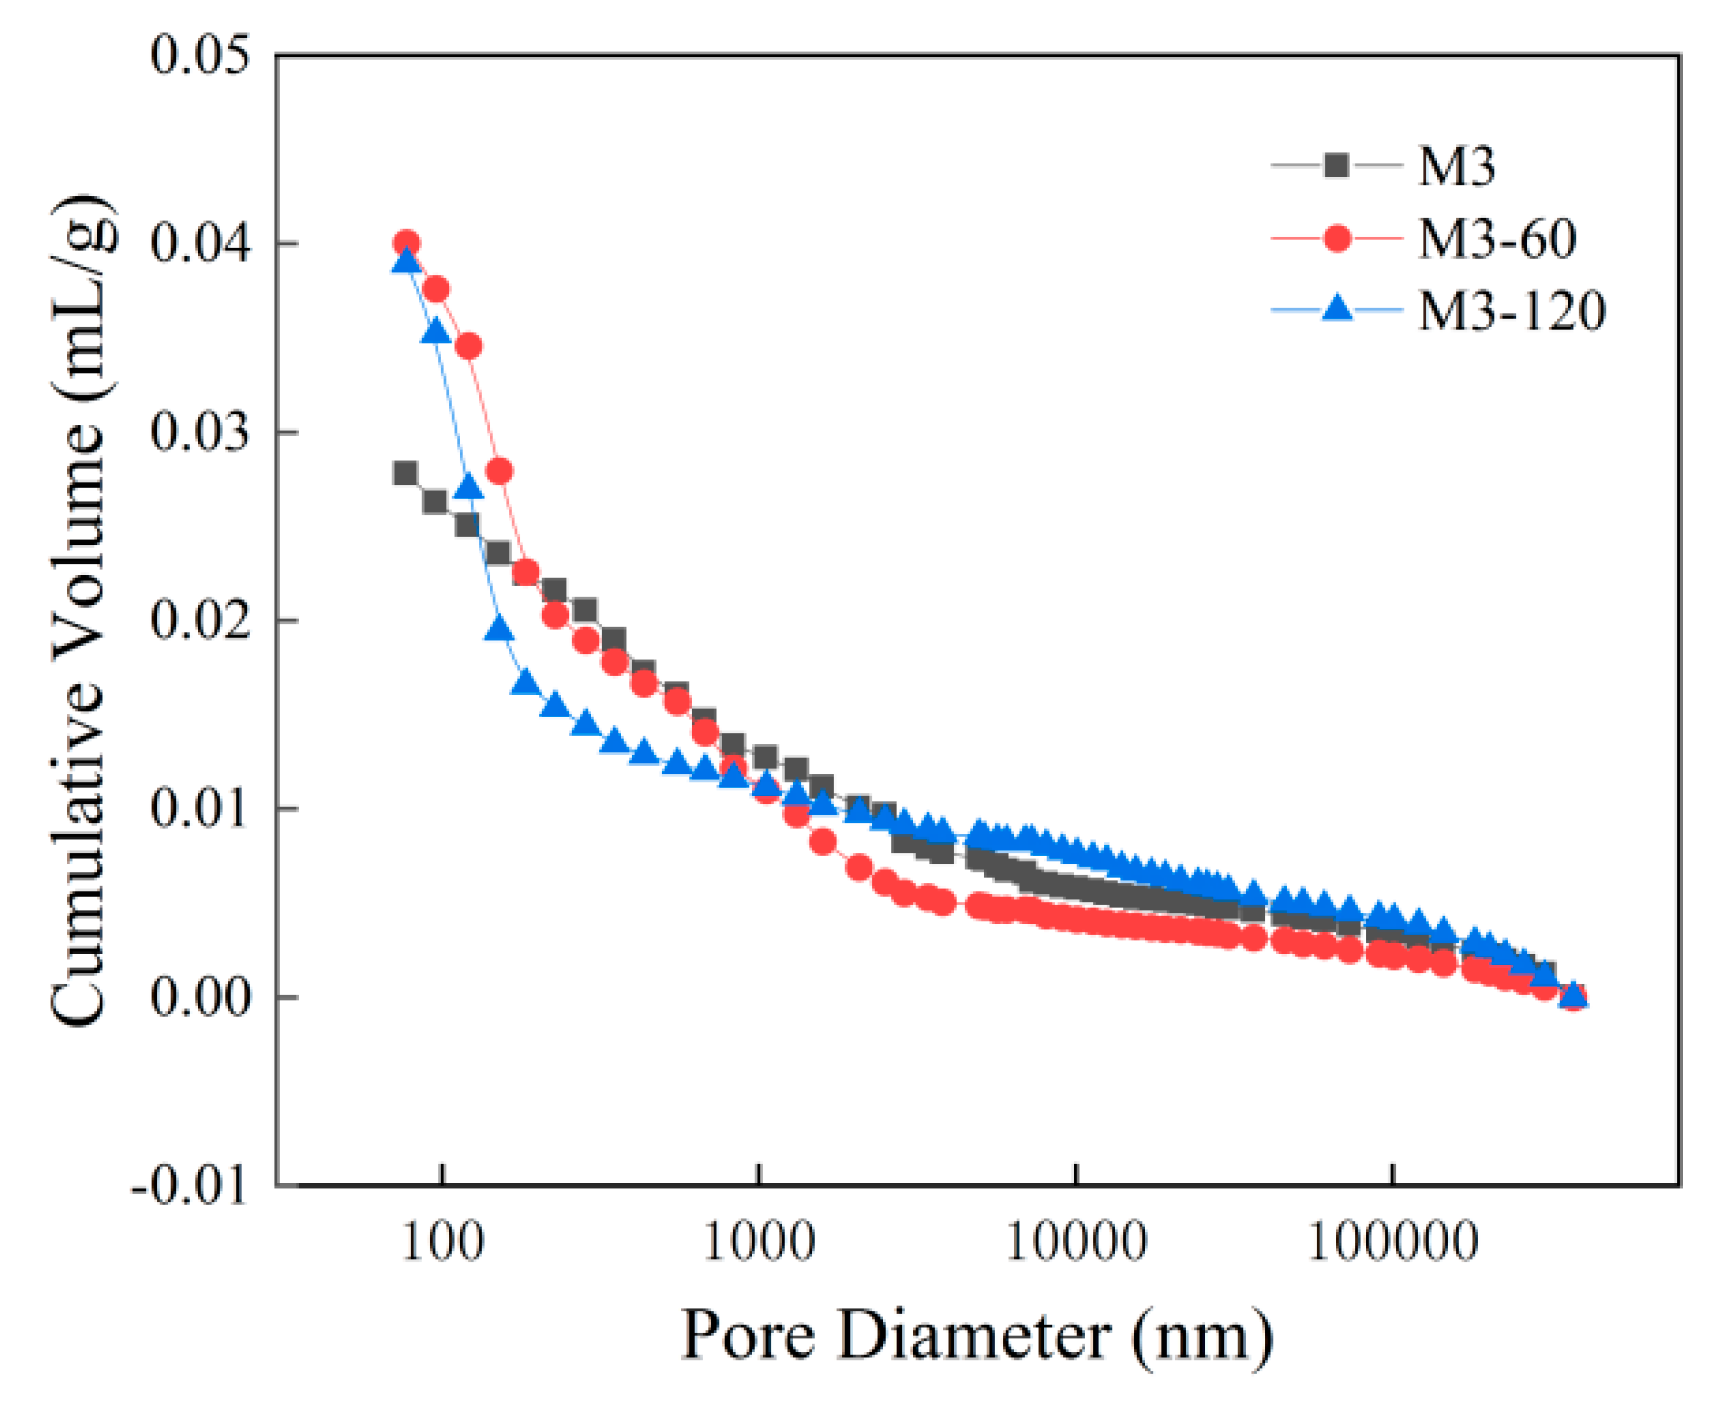
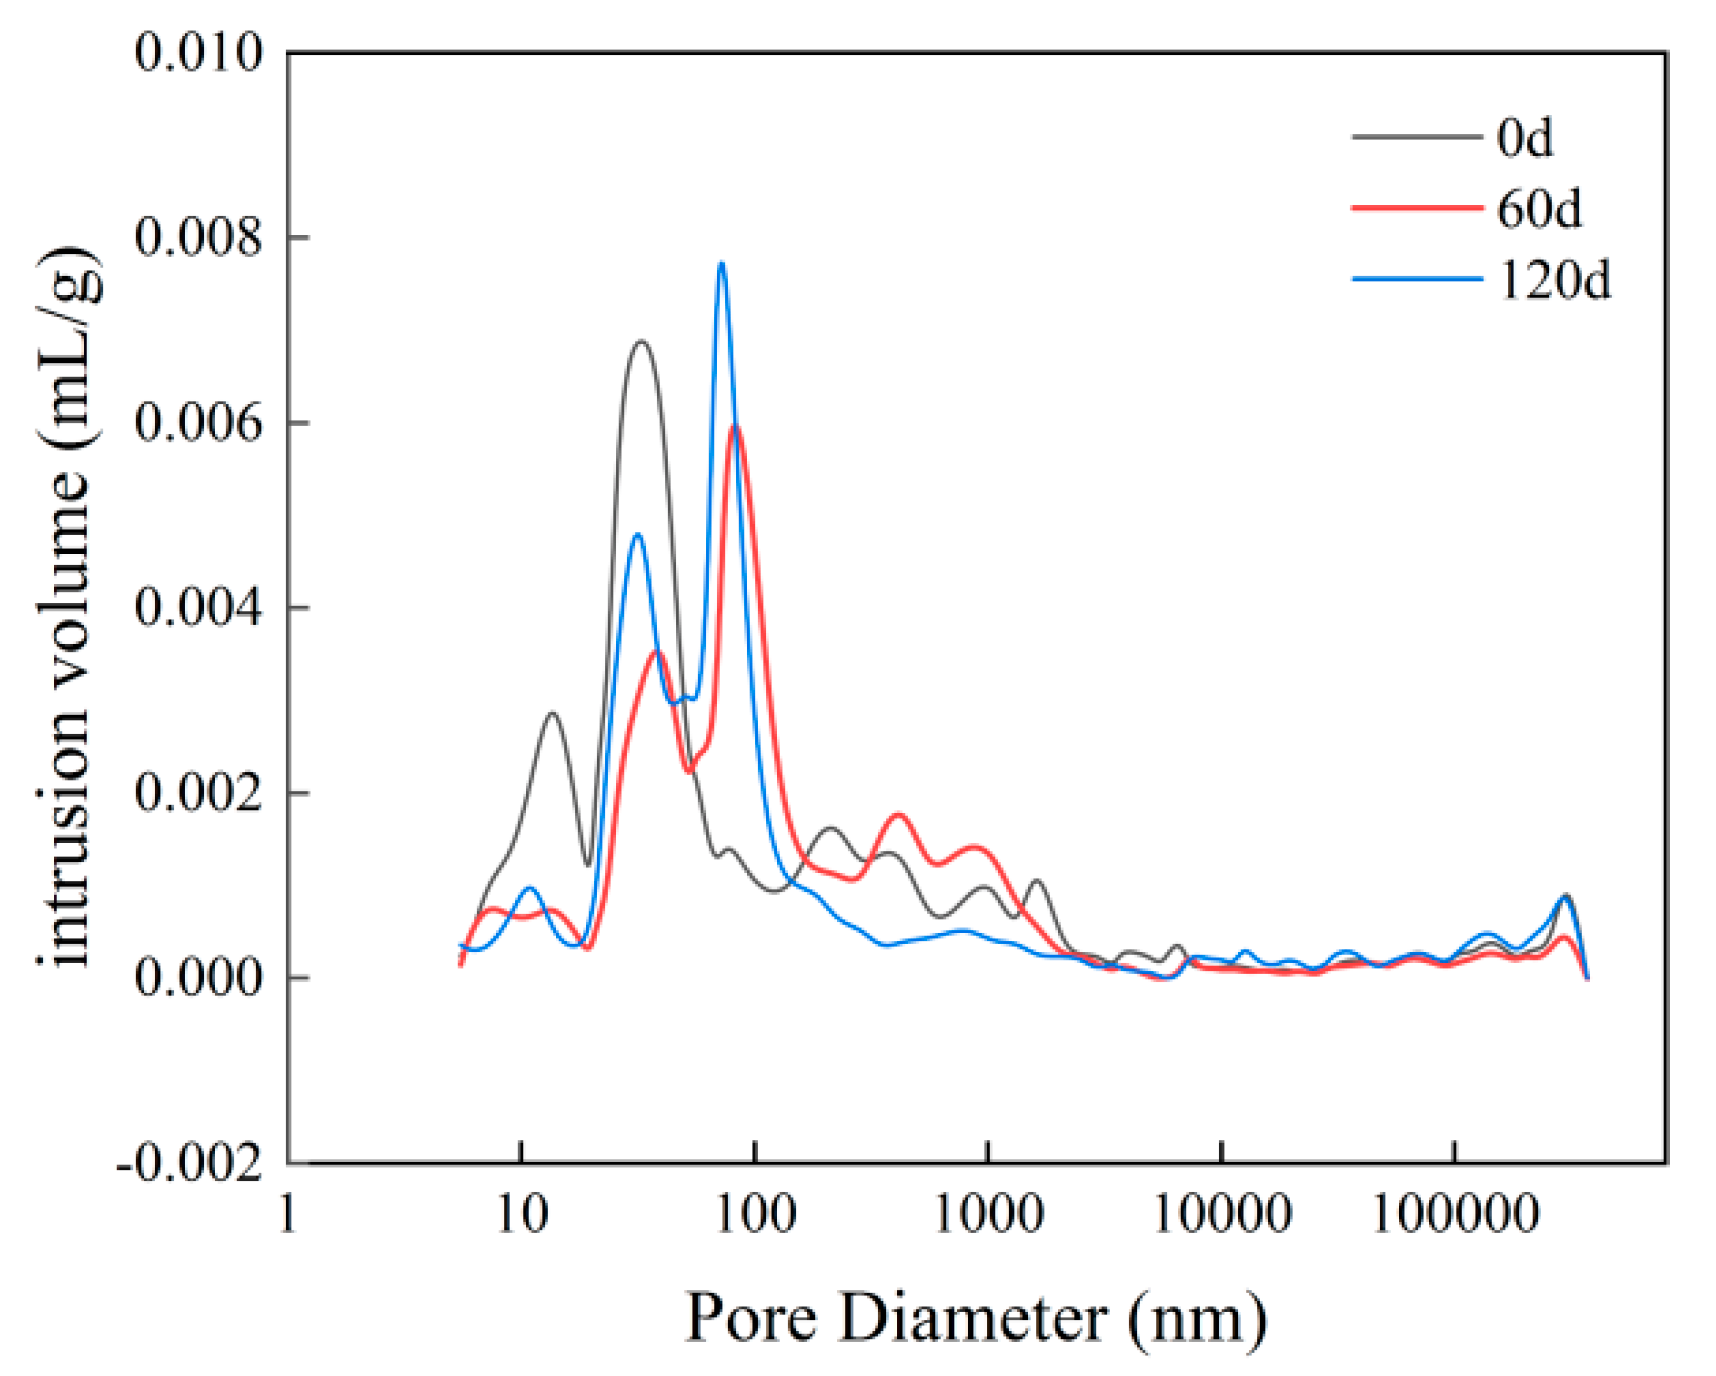
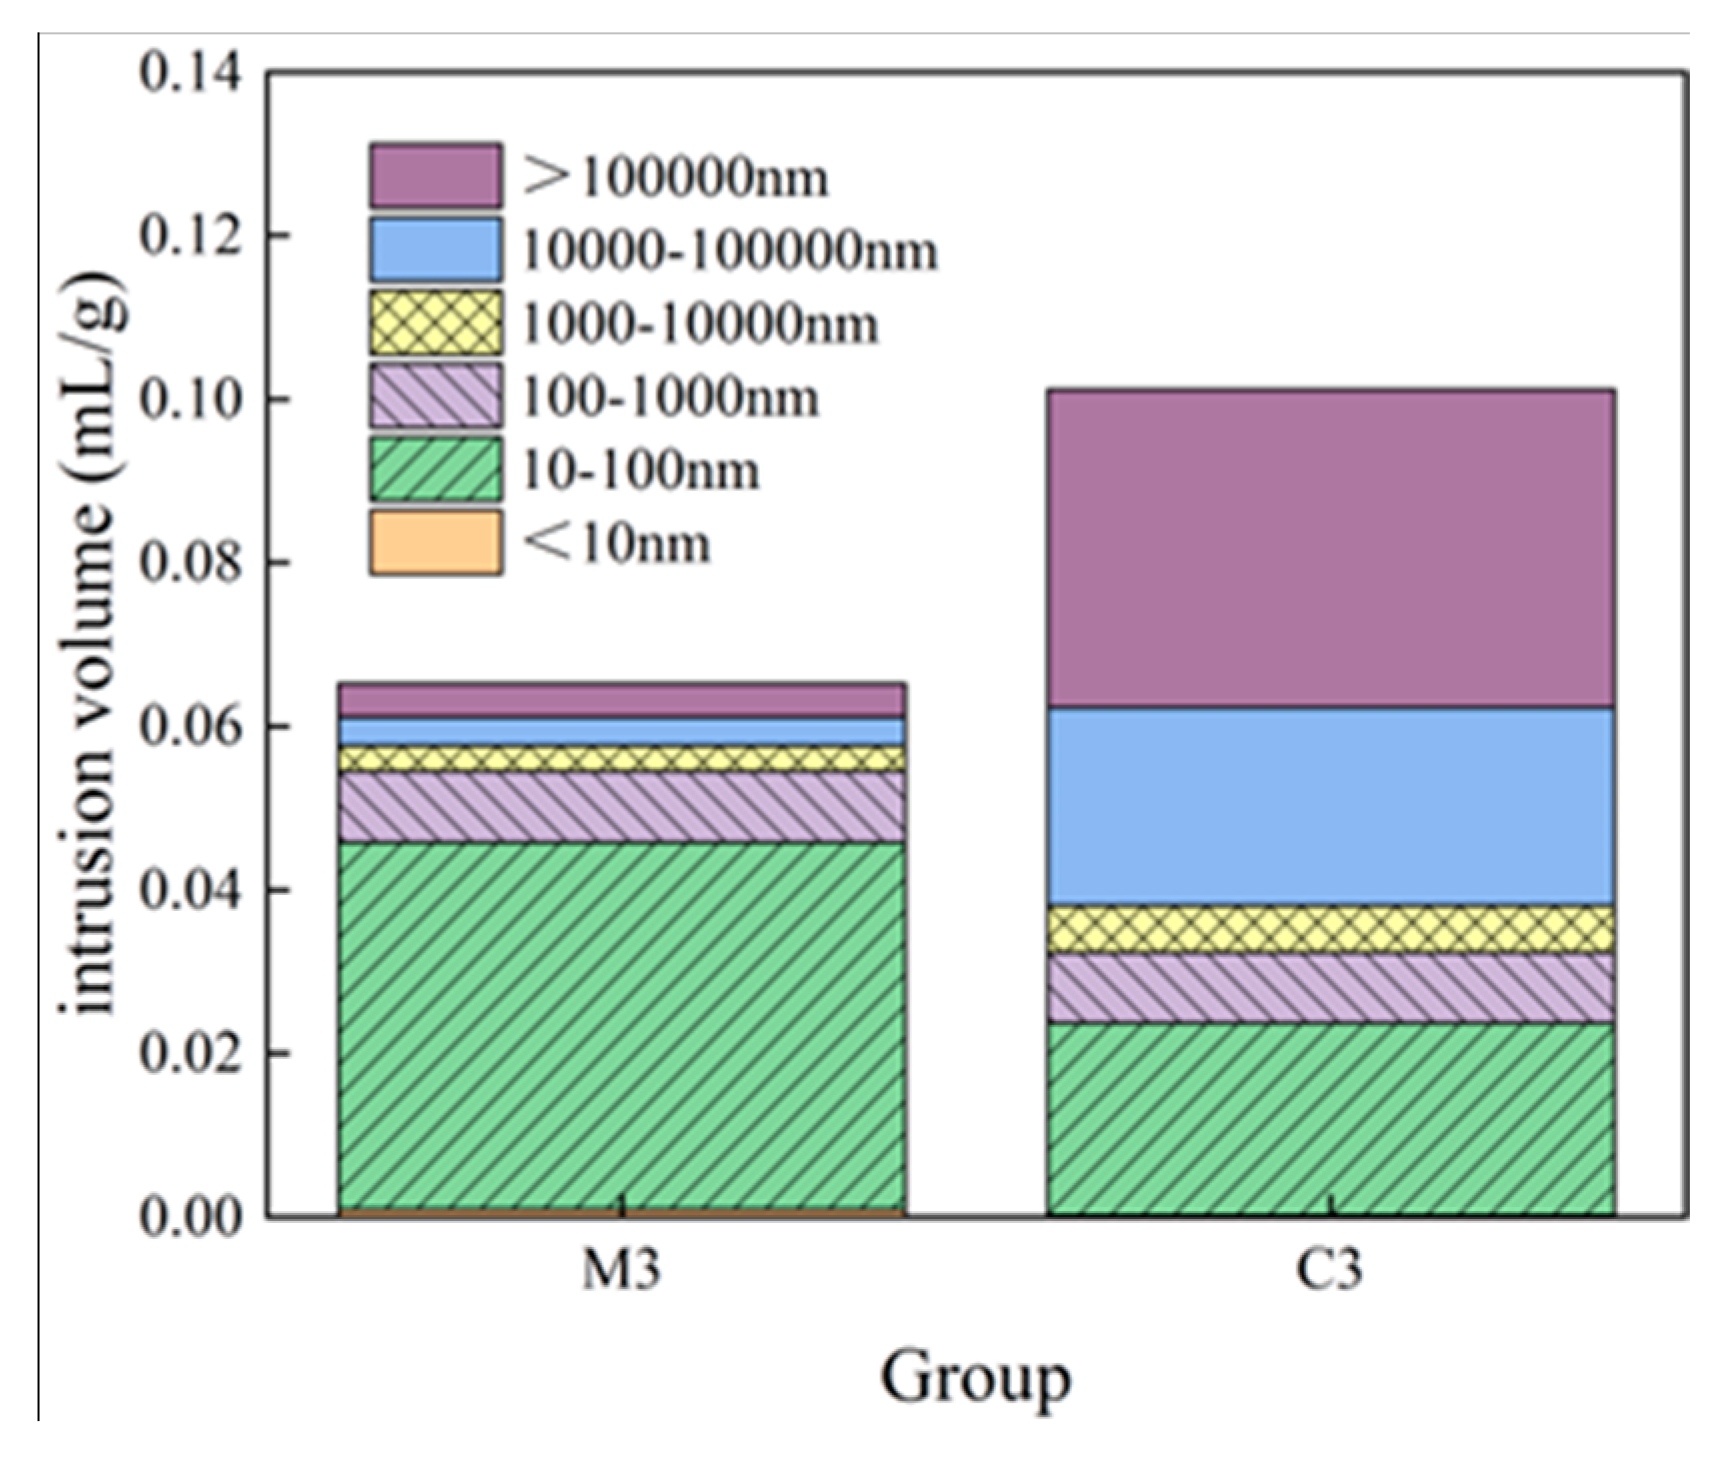
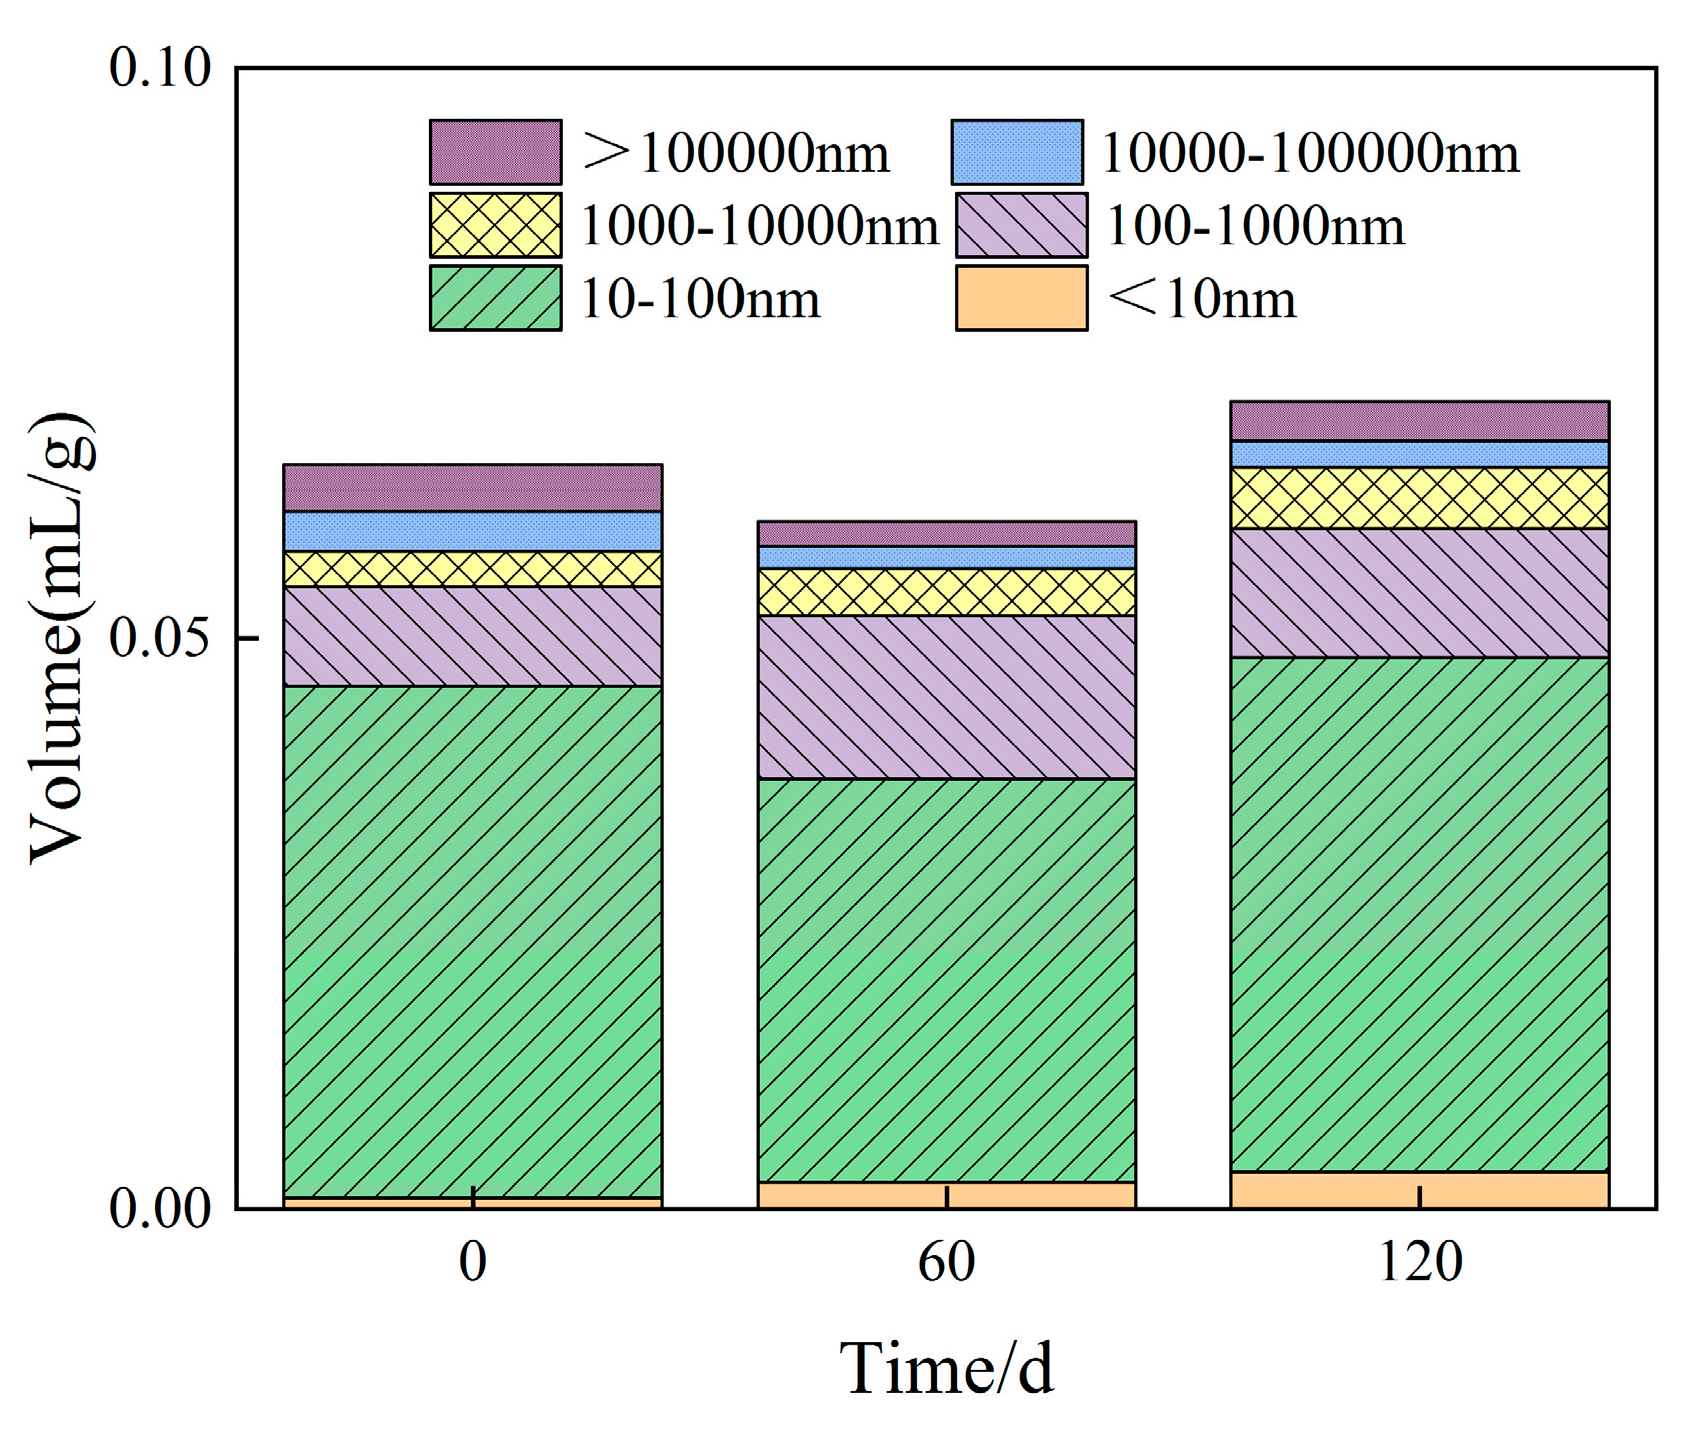
- With increasing sulphate erosion age, the porosity of cementitious materials tends to decrease and then increase. With the incorporation of coarse aggregates, the porosity in cementitious materials increases, and the porosity of concrete is about 4-6 times that of mortar when the pore diameter is greater than 10,000 nm.
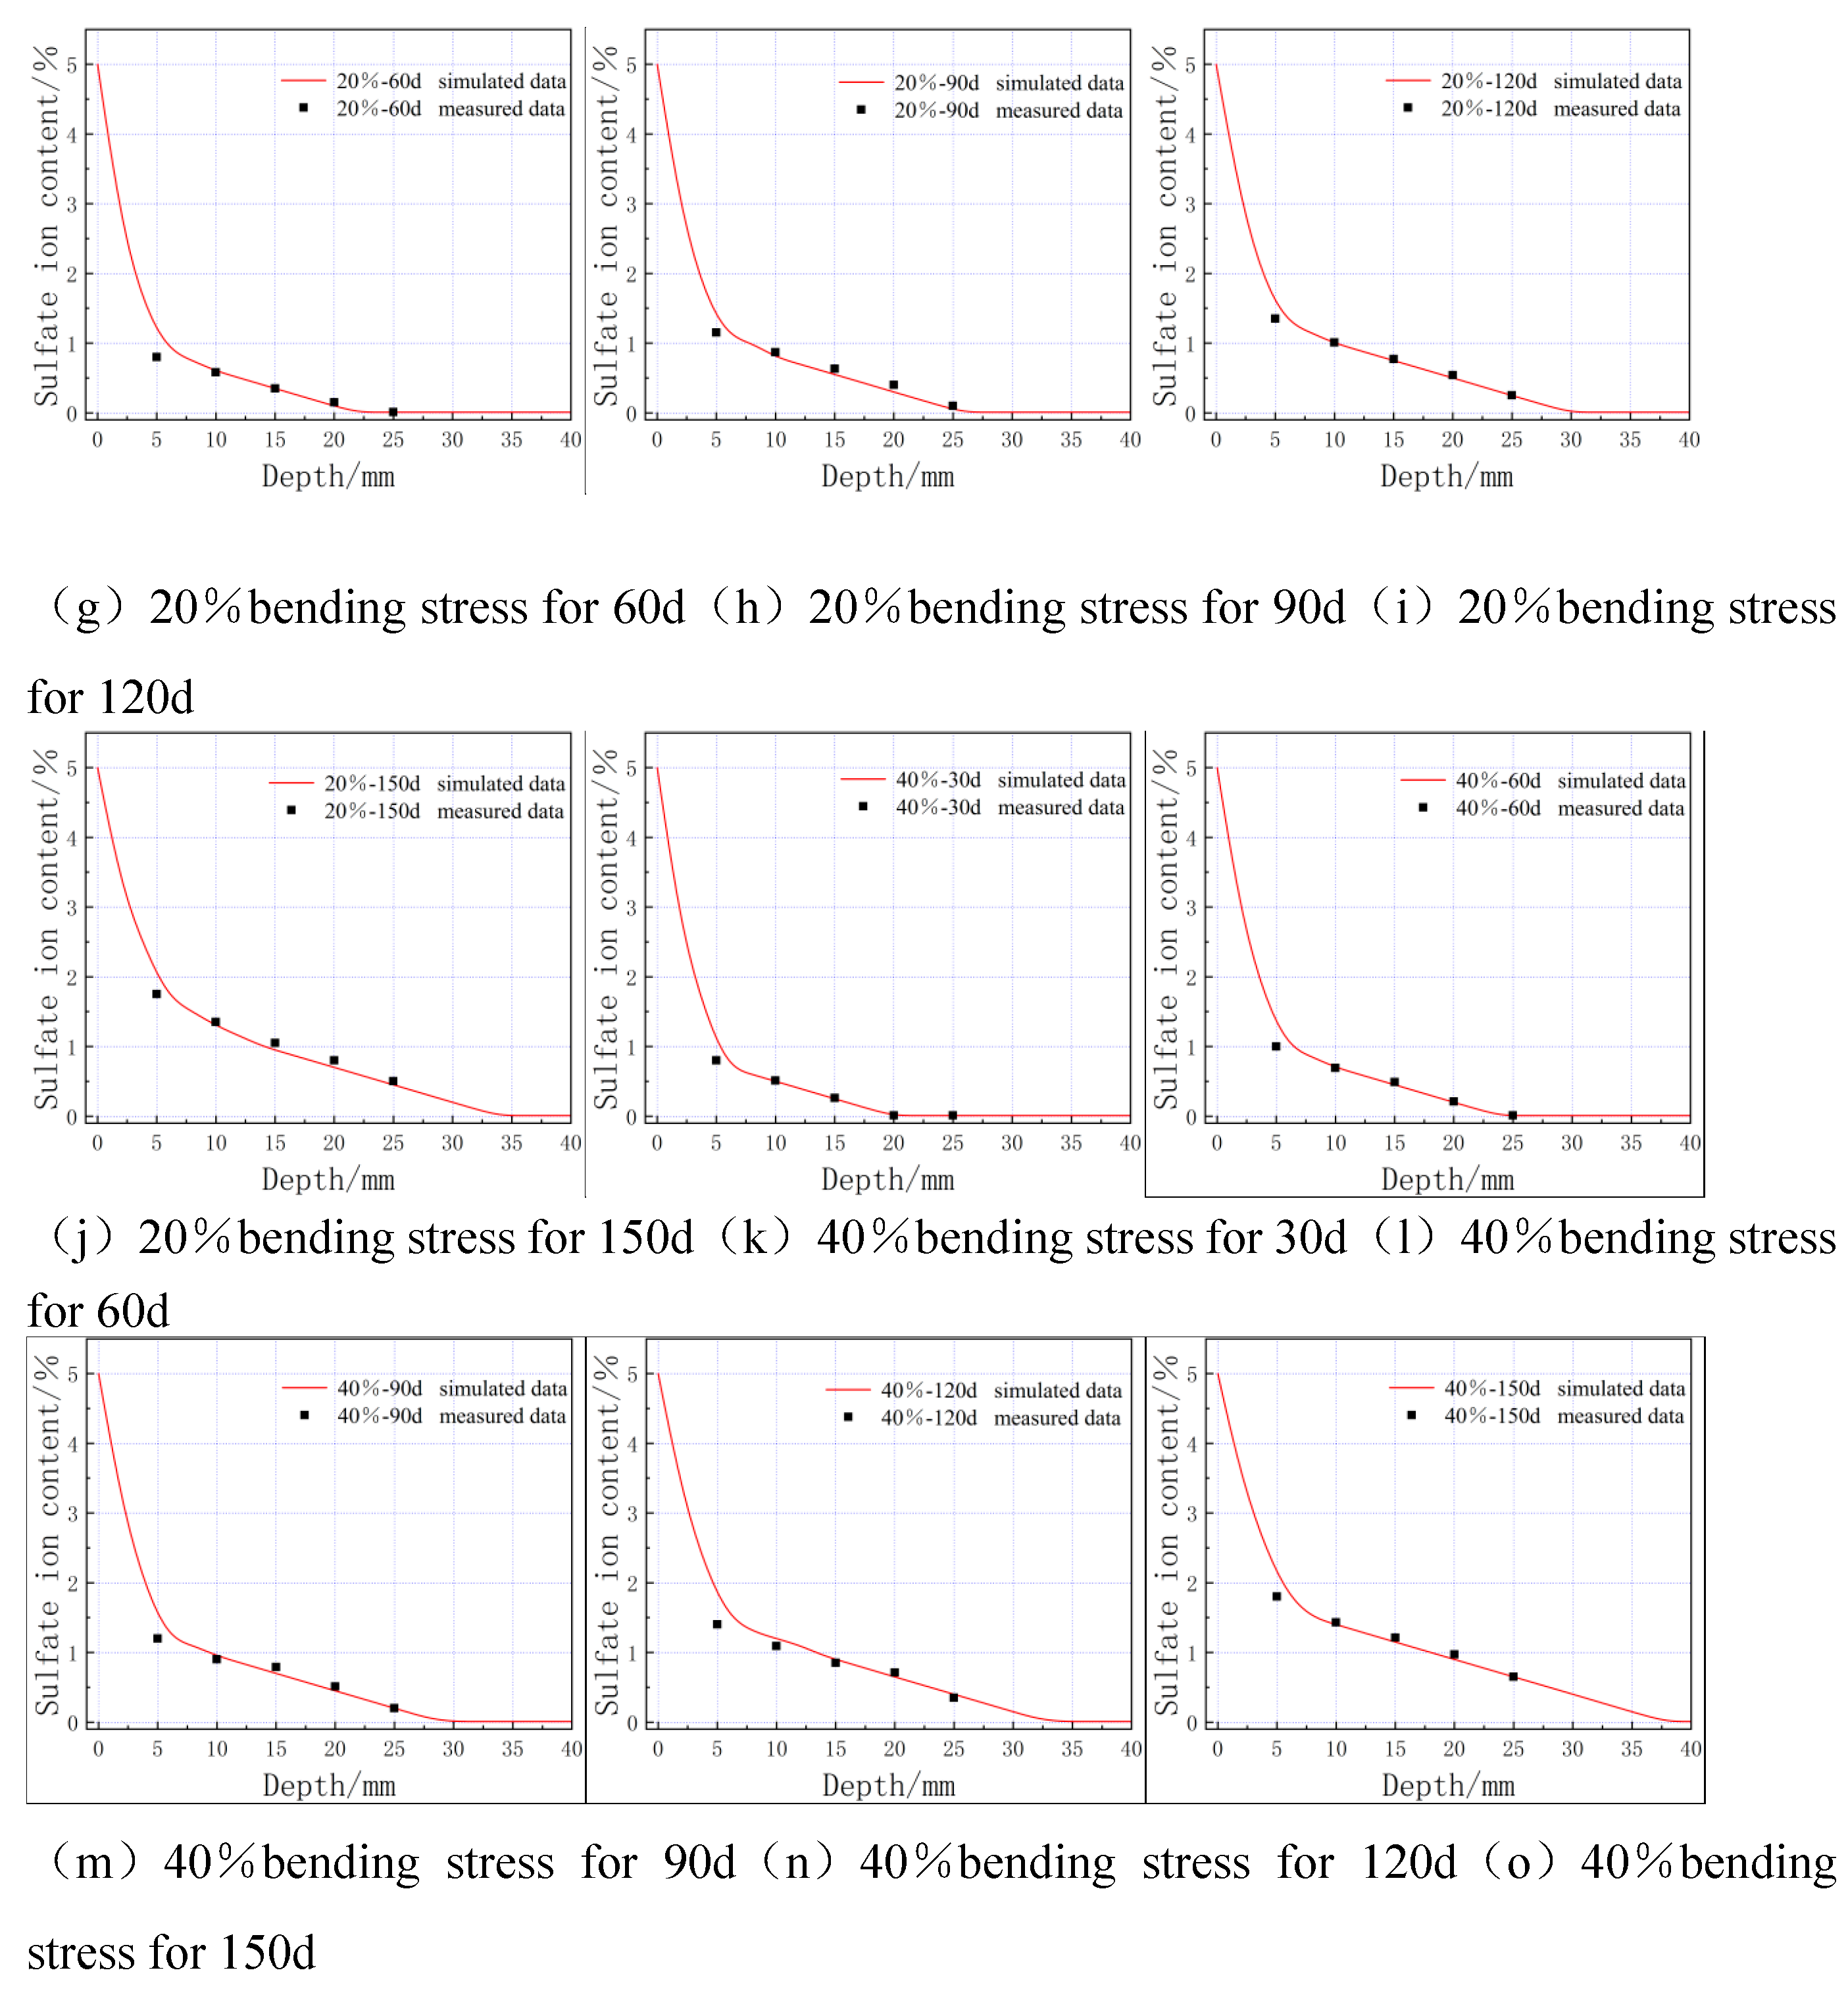
- Through refinement of Fick's second law and chemical reaction kinetics, the diffusion coefficient of sulphate ions within the cementitious material was derived and a three-dimensional COMSOL finite element model was created. The simulation results were compared with the measured data to ensure the validity and accuracy of the theoretical model, which serves as a reference for the design of anti-erosion measures in the field of sulphate erosion.
Author Contributions
Acknowledgments
Conflicts of interest
References
- Lippiatt N, Ling T C, Pan S Y. Towards carbon-neutral construction materials: Carbonation of cement-based materials and the future perspective[J]. Journal of Building Engineering 2020, 28, 101062. [Google Scholar] [CrossRef]
- Ascensão F, Fahrig L, Clevenger A P, et al. Environmental challenges for the Belt and Road Initiative[J]. Nature Sustainability 2018, 1, 206–209. [Google Scholar] [CrossRef]
- Delong Xu, Yuansheng Cui, Hui Li, et al. On the future of Chinese cement industry [J]. Cement and Concrete Research 2015, 78, 2–13. [Google Scholar] [CrossRef]
- Zhao L, Guo X, Song L, et al. An intensive review on the role of graphene oxide in cement-based materials[J]. Construction and Building Materials 2020, 241, 117939. [Google Scholar] [CrossRef]
- Yang L, Fulin Y, Gaozhan Z. Synergistic effects of sustained loading and sulfate attack on the damage of UHPC based on lightweight aggregate[J]. Construction and Building Materials 2023, 374, 130929. [Google Scholar] [CrossRef]
- Yu D, Guan B, He R, et al. Sulfate attack of Portland cement concrete under dynamic flexural loading: A coupling function[J]. Construction and Building Materials 2016, 115, 478–485. [Google Scholar] [CrossRef]
- Yu D, Feng C, Fu T, et al. Effect of Sulfate Concentration on Chloride Diffusion of Concrete under Cyclic Load[J]. Materials 2022, 15, 2036. [Google Scholar] [CrossRef]
- Chen F , Gao J , Qi B , et al. Degradation progress of concrete subject to combined sulfate-chloride attack under drying-wetting cycles and flexural loading[J]. Construction & Building Materials 2017, 151, 164–171. [Google Scholar]
- Cheng H, Liu T, Zou D, et al. Compressive strength assessment of sulfate-attacked concrete by using sulfate ions distributions[J]. Construction and Building Materials 2021, 293, 123550. [Google Scholar] [CrossRef]
- Wang F , Zhang Y , Jiang J , et al. Effect of temperature on the capillary transport of sodium sulfate solution in calcium silicate hydrate nanopore: A molecular dynamics study[J]. Construction and Building Materials 2020, 231, 117111. [Google Scholar] [CrossRef]
- Qi B , Gao J , Chen F , et al. Evaluation of the damage process of recycled aggregate concrete under sulfate attack and wetting-drying cycles[J]. Construction and Building Materials 2017, 138, 254–262. [Google Scholar] [CrossRef]
- Ikumi T, Cavalaro S H P, Segura I. The role of porosity in external sulphate attack[J]. Cement and Concrete Composites 2019, 97, 1–12. [Google Scholar] [CrossRef]
- Wang K, Guo J, Yang L. Effect of dry–wet ratio on sulfate transport-reaction mechanism in concrete[J]. Construction and Building Materials 2021, 302, 124418. [Google Scholar] [CrossRef]
- Gao J, Yu Z, Song L, et al. Durability of concrete exposed to sulfate attack under flexural loading and drying–wetting cycles[J]. Construction and Building Materials 2013, 39, 33–38. [Google Scholar] [CrossRef]
- Liu F, You Z, Diab A, et al. External sulfate attack on concrete under combined effects of flexural fatigue loading and drying-wetting cycles[J]. Construction and Building Materials 2020, 249, 118224. [Google Scholar] [CrossRef]
- Zhang P, Ren S, Zhao Y, et al. Combined effects of sulfate attack under drying–wetting cycles and loading on the fatigue behavior of concrete[J]. Advances in Structural Engineering 2021, 24, 3825–3836. [Google Scholar] [CrossRef]
- He W. Numerical Simulation of the Ion Transport Behavior in Concrete under Coupled Axial Loading and Sulfate Attack[J]. Tehnički vjesnik Tehnički vjesnik, Tehnički vjesnik, 1791–1799. [Google Scholar]
- Zhang J, Sun M, Hou D, et al. External sulfate attack to reinforced concrete under drying-wetting cycles and loading condition: Numerical simulation and experimental validation by ultrasonic array method[J]. Construction and Building Materials 2017, 139, 365–373. [Google Scholar] [CrossRef]
- Zhuang Y, Liu X, Zhou X, et al. Diffusion model of sulfate ions in concrete based on pore change of cement mortar and its application in mesoscopic numerical simulation[J]. Structural Concrete 2022. [Google Scholar]
- GB/T 50082-2009, Standard for long-term performance and durability test methods for ordinary concrete[S]. (in Chinese).
- Zhao Y, Gao J, Qi B, et al. Effect of flexural loading on degradation progress of recycled aggregate concrete subjected to sulfate attack and wetting-drying cycles[J]. J. Southeast Univ. Engl. Ed 2019, 35, 85–90. [Google Scholar]
- GB/T 50080-2002, Standard of Test Methods for Mechanical Properties of ordinary concrete [S]. (in Chinese).
- Ma Y, Hu J, Ye G. The pore structure and permeability of alkali activated fly ash[J]. Fuel 2013, 104, 771–780. [Google Scholar] [CrossRef]
- Yin G J, Zuo X B, Tang Y J, et al. Numerical simulation on time-dependent mechanical behavior of concrete under coupled axial loading and sulfate attack[J]. Ocean Engineering 2017, 142, 115–124. [Google Scholar] [CrossRef]
- Li J, Xie F, Zhao G, et al. Experimental and numerical investigation of cast-in-situ concrete under external sulfate attack and drying-wetting cycles[J]. Construction and Building Materials 2020, 249, 118789. [Google Scholar] [CrossRef]
- POWERS T, C. Structure and physical properties of hardened Portland cement paste[J]. Journal of the american ceramic society 1958, 41, 1–6. [Google Scholar] [CrossRef]
- SUN Y, LIANG M, CHANG T. Time/depth dependent diffusion and chemical reaction model of chloride transportation in concrete[J]. Applied Mathematical Modelling 2012, 36, 1114–1122. [Google Scholar] [CrossRef]
- SARKAR S, MAHADEVAN S, MEEUSSEN J, et al. Numerical simulation of cementitious materials degradation under external sulfate attack[J]. Cement and Concrete Composites 2010, 32, 241–252. [Google Scholar] [CrossRef]
- ZUO X, SUN W, YU C. Numerical investigation on expansive volume strain in concrete subjected to sulfate attack[J]. Construction and Building Materials 2012, 36, 404–410. [Google Scholar] [CrossRef]
- MALTAIS Y, SAMSON E, MARCHAND J. Predicting the durability of Portland cement systems in aggressive environments—Laboratory validation[J]. Cement and concrete research 2004, 34, 1579–1589. [Google Scholar] [CrossRef]
- CAO C, CHEUNG M M, CHAN B Y. Modelling of interaction between corrosion-induced concrete cover crack and steel corrosion rate[J]. Corrosion Science 2013, 69, 97–100. [Google Scholar] [CrossRef]
- He R, Zheng S, Gan V J L, et al. Damage mechanism and interfacial transition zone characteristics of concrete under sulfate erosion and Dry-Wet cycles[J]. Construction and Building Materials 2020, 255, 119340. [Google Scholar] [CrossRef]
- JIN L, ZHANG R, DU X, et al. Multi-scale analytical theory of the diffusivity of concrete subjected to mechanical stress[J]. Construction and Building Materials 2015, 95, 171–185. [Google Scholar] [CrossRef]
| Ingredient. | SiO2 | Al2O3 | Fe2O3 | CaO | MgO | SO3 | K2O | Na2O | LiO |
|---|---|---|---|---|---|---|---|---|---|
| Cement(mass fraction, %) | 20.12 | 5.75 | 3.26 | 63.44 | 0.98 | 2.71 | 0.49 | 0.73 | 2.13 |
| Scheme | W/C | Amount of each material in concrete (kg·m-3) | ||||
|---|---|---|---|---|---|---|
| Water | Cement | Sand | Gravel | Superplasticizer | ||
| M1 | 0.60 | 242.3 | 403.8 | 872.3 | 0 | 1.00 |
| M2 | 0.50 | 262.0 | 523.0 | 1413.0 | 0 | 1.00 |
| M3 | 0.35 | 219.4 | 626.8 | 1253.7 | 0 | 3.10 |
| C1 | 0.60 | 218.2 | 363.6 | 1090.8 | 727.2 | 0.91 |
| C2 | 0.50 | 210.0 | 386.0 | 1044.0 | 774.0 | 0.96 |
| C3 | 0.35 | 173.0 | 494.0 | 741.0 | 988.0 | 2.40 |
| Specimen | Porosity/% | Average pore diameter/nm | <10nm | 10nm~100nm | 100nm~1000nm | 1000nm~10000nm | 10000nm~1000000nm | >1000000nm |
|---|---|---|---|---|---|---|---|---|
| M3-0 | 13.58 | 58.87 | 1.48% | 68.41% | 13.4% | 4.76% | 5.33% | 6.62% |
| M3-60 | 12.57 | 55.26 | 3.78% | 58.75% | 23.73% | 6.87% | 3.2% | 3.67% |
| M3-120 | 14.17 | 36.09 | 4.52% | 63.77% | 15.97% | 7.57% | 3.3% | 4.87% |
| C3 | 20.06 | 177.56 | 0.19% | 23.27% | 8.53% | 5.62% | 23.96% | 38.44% |
Disclaimer/Publisher’s Note: The statements, opinions and data contained in all publications are solely those of the individual author(s) and contributor(s) and not of MDPI and/or the editor(s). MDPI and/or the editor(s) disclaim responsibility for any injury to people or property resulting from any ideas, methods, instructions or products referred to in the content. |
© 2023 by the authors. Licensee MDPI, Basel, Switzerland. This article is an open access article distributed under the terms and conditions of the Creative Commons Attribution (CC BY) license (http://creativecommons.org/licenses/by/4.0/).


