Preprint
Article

New Antibacterial Diterpenoids from the South China Sea Soft Coral Klyxum molle

Altmetrics

Downloads

127

Views

29

Comments

0

A peer-reviewed article of this preprint also exists.

Submitted:

23 May 2023

Posted:

24 May 2023

You are already at the latest version

Alerts
Abstract
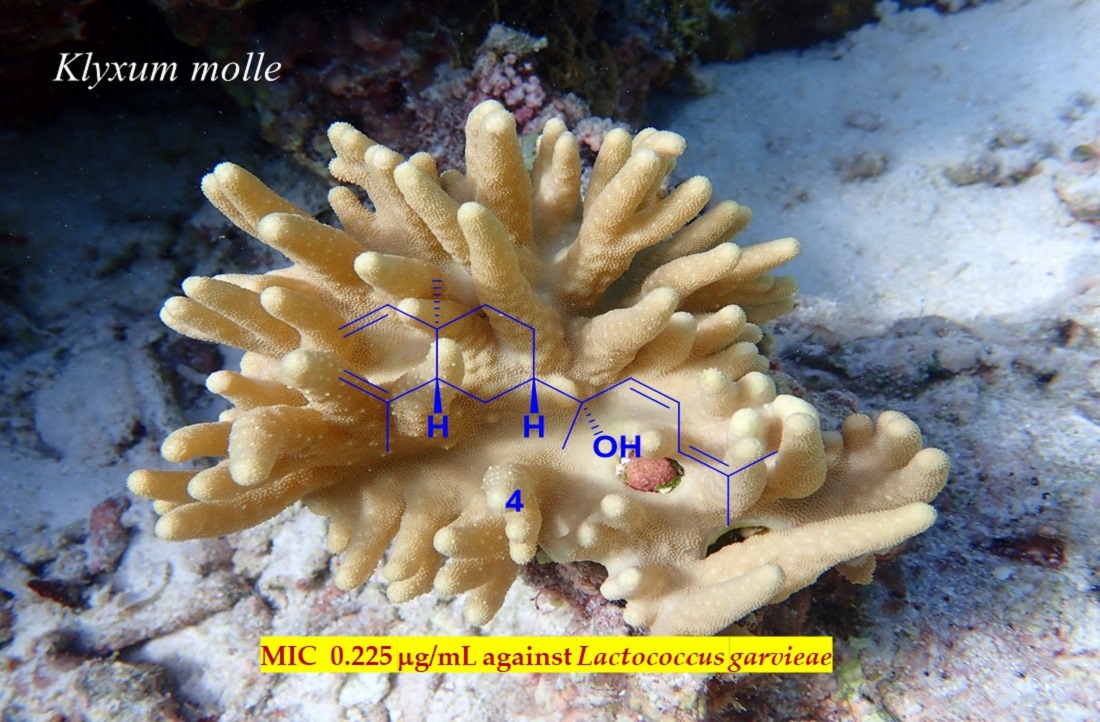
Fifteen new diterpenoids, namely xishaklyanes A-O (1-15), along with three known related ones (16-18), were isolated from the soft coral Klyxum molle collected from Xisha Islands, South China Sea. The stereochemistry of the new compounds were elucidated by a combination of detailed spectroscopic analyses, chemical syntheses, quantum chemical calculations and comparison with the reported data. The absolute configuration of compound 18 was established by the modified Mosher's method for the first time. In bioassay, some of these compounds exhibited considerable antibacterial activities on fish pathogenic bacteria, and compound 4 showed the most effective activity with MIC of 0.225 g/mL against Lactococcus garvieae.
Keywords: 
Subject: Chemistry and Materials Science  -   Medicinal Chemistry

1. Introduction

Soft corals of the genus Klyxum (order Alcyonacea, family Alcyoniidae) were broadly distributed over the tropical Indo-Pacific, including the South China Sea [1]. Different from the commonly chemically investigated Sinularia [2] and Sarcophyton [3] soft corals, only three species from the genus Klyxum have been chemically studied, including Klyxum simplex [4-7], Klyxum molle [8-11], and Klyxum flaccidum [12-15]. Besides, diverse secondary metabolites were discovered, including novel skeleton (Klyflaccilides A and B) and eunicellin-type diterpenoids [8-12]. These compounds exhibited widespread biological activities, such as antibacterial, cytotoxic, and anti-inflammatory effects [4-12,14,15].
As part of our continuous research project aiming for the discovery of bioactive metabolites from Chinese marine Cnidaria [12,16-18], Klyxum molle collected off the Xisha Islands were conducted systematic research, yielding fifteen new diterpenoids 115 and three known related diterpenoids 1618 (Figure 1). Herein, the isolation, structural elucidation, and biological evaluations of these compounds are reported.

2. Results and Discussion

By a series of column chromatography in combination with HPLC, the acetone extract of K. molle resulted in the purification of fifteen new diterpenoids, namely xishaklyanes A-O (1-15), along with three known related ones (16-18) (Figure 1). Those known diterpenoids were unambiguously identified as fuscol (16) [19], lobovarol H (17) [20], and 17,18-epoxyloba-8,10,13(15)-trien-16-ol (18) [21], respectively, by comparing their NMR data and specific rotation values with those reported in the literature.
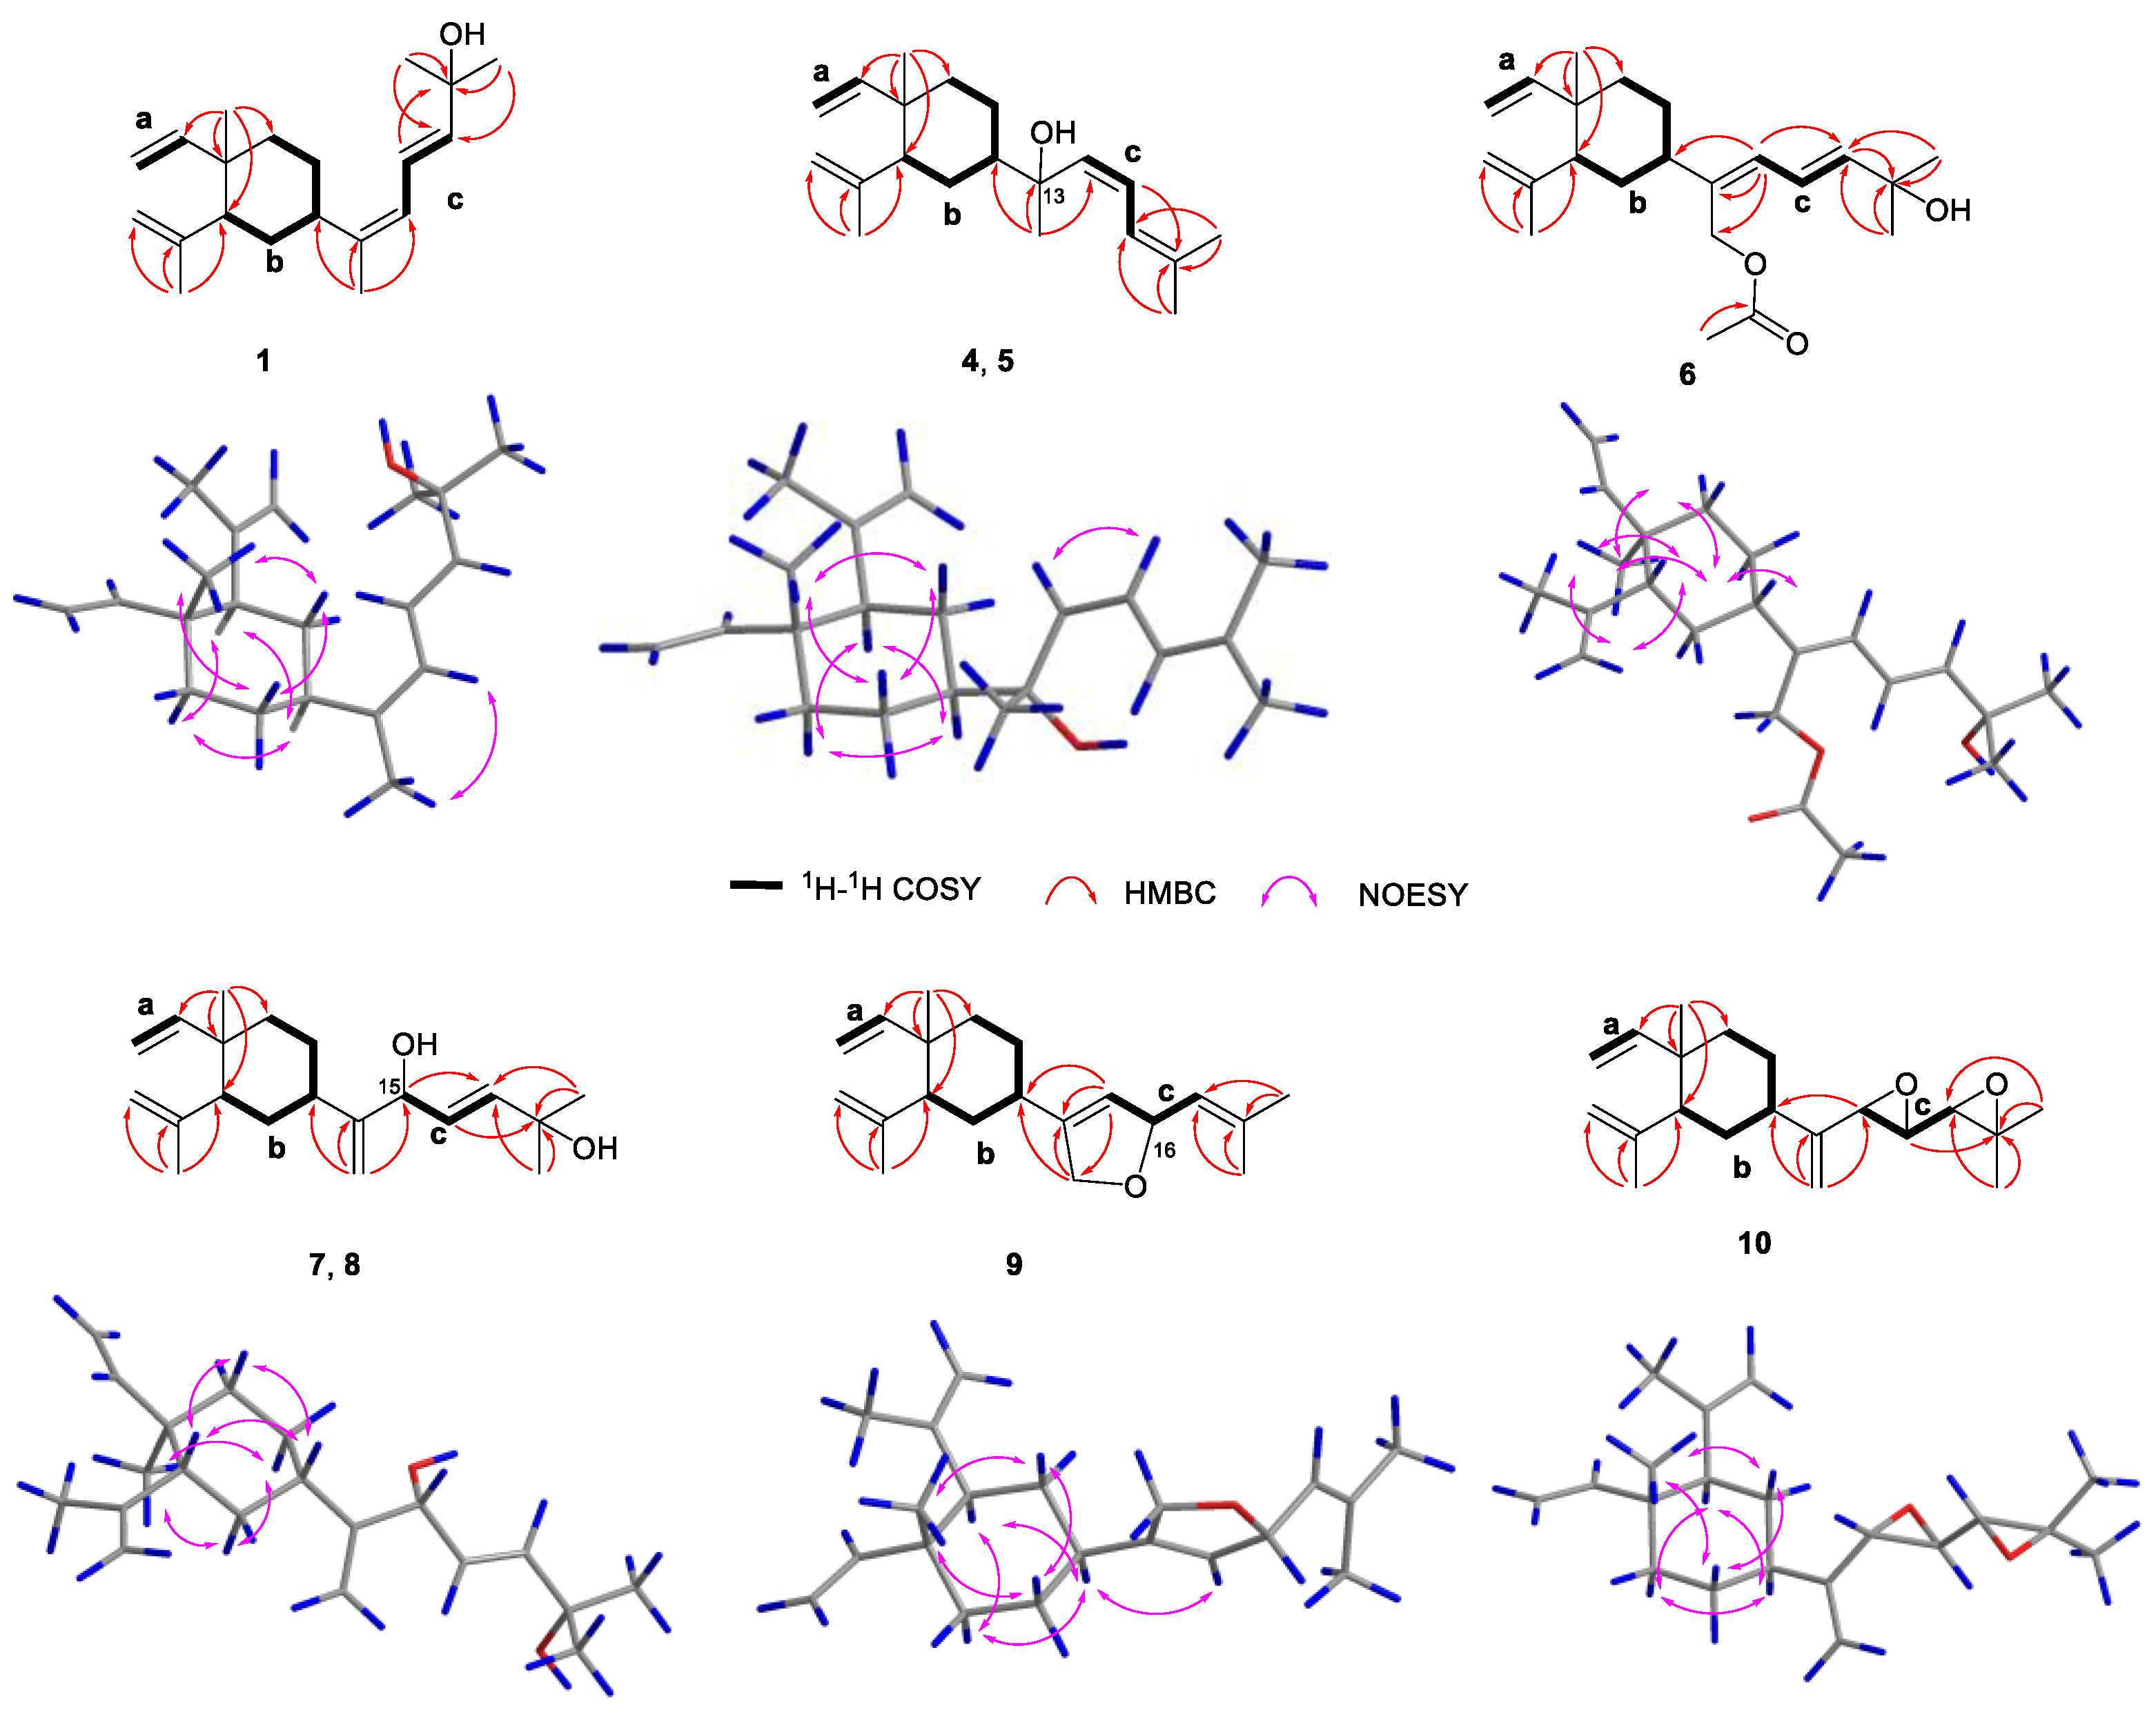
Xishaklyane A (1) was obtained as an optically active colorless oil. From the molecular ion peak at m/z 289.2527 ([M + H]+, calcd. 289.2526) in the HRESIMS spectrum, a molecular formula of C20H32O was established, indicating five degrees of unsaturation. The 1H and 13C NMR data of 1 (Table 1 and Table 3) highly resembled those of co-occurring 16, with the only differences of signals on C-4 (δC 47.5 in 16 and 40.5 in 1), C-14 (δC 15.3 in 16 and 20.2 in 1), and C-15 (δC 122.9 in 16 and 124.6 in 1), suggesting that 1 was the analogue of 16, with the opposite geometry on Δ13,15. Besides, the characteristic NOE correlation between H3-14 and H-15 also confirmed the Z geometry of Δ13,15 in 1 (Figure 2). The structure of 1 was further confirmed by 2D NMR analysis including HMBC and NOESY correlations. Thus, compound 1 was determined to be 13Z-fuscol, namely xishaklyane A.
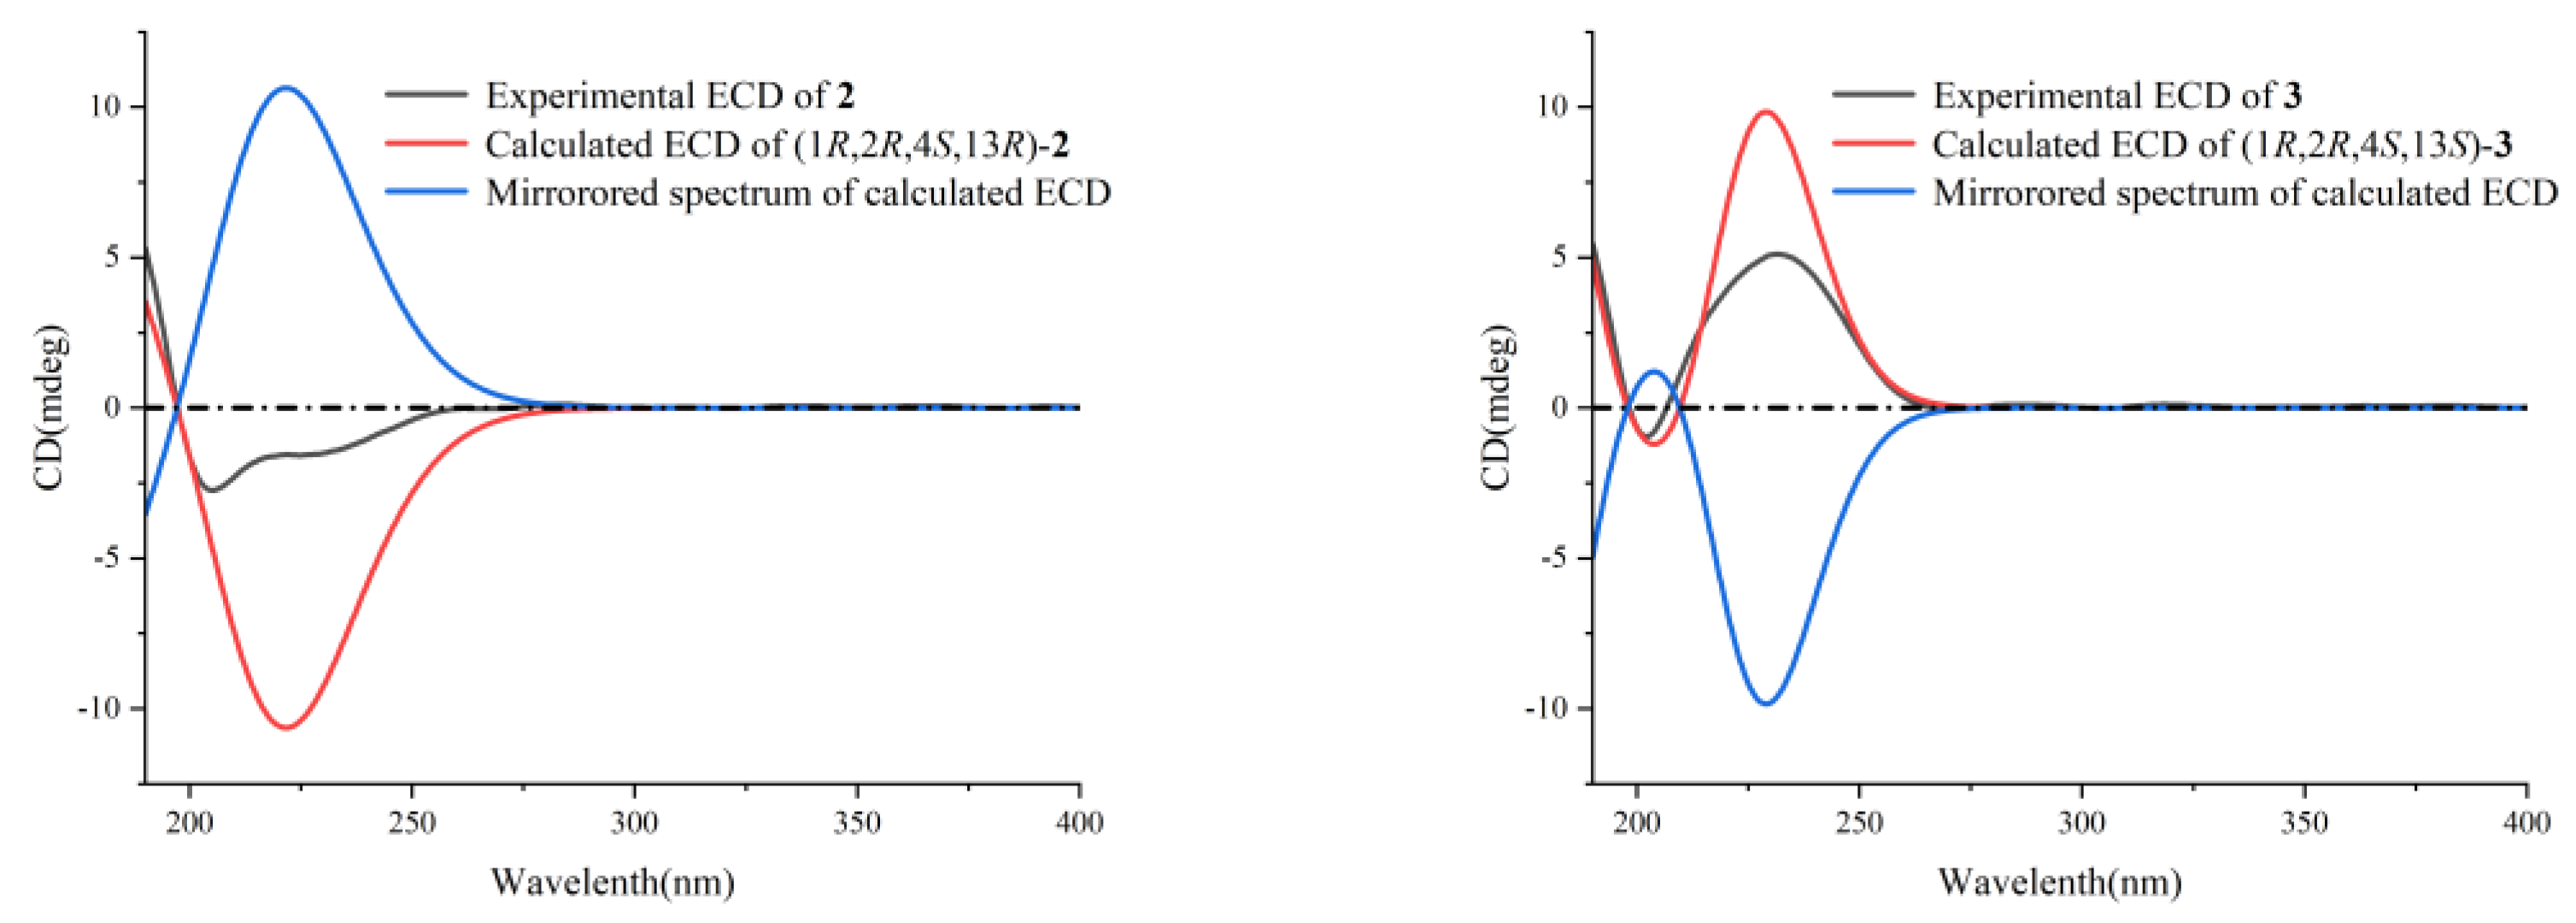
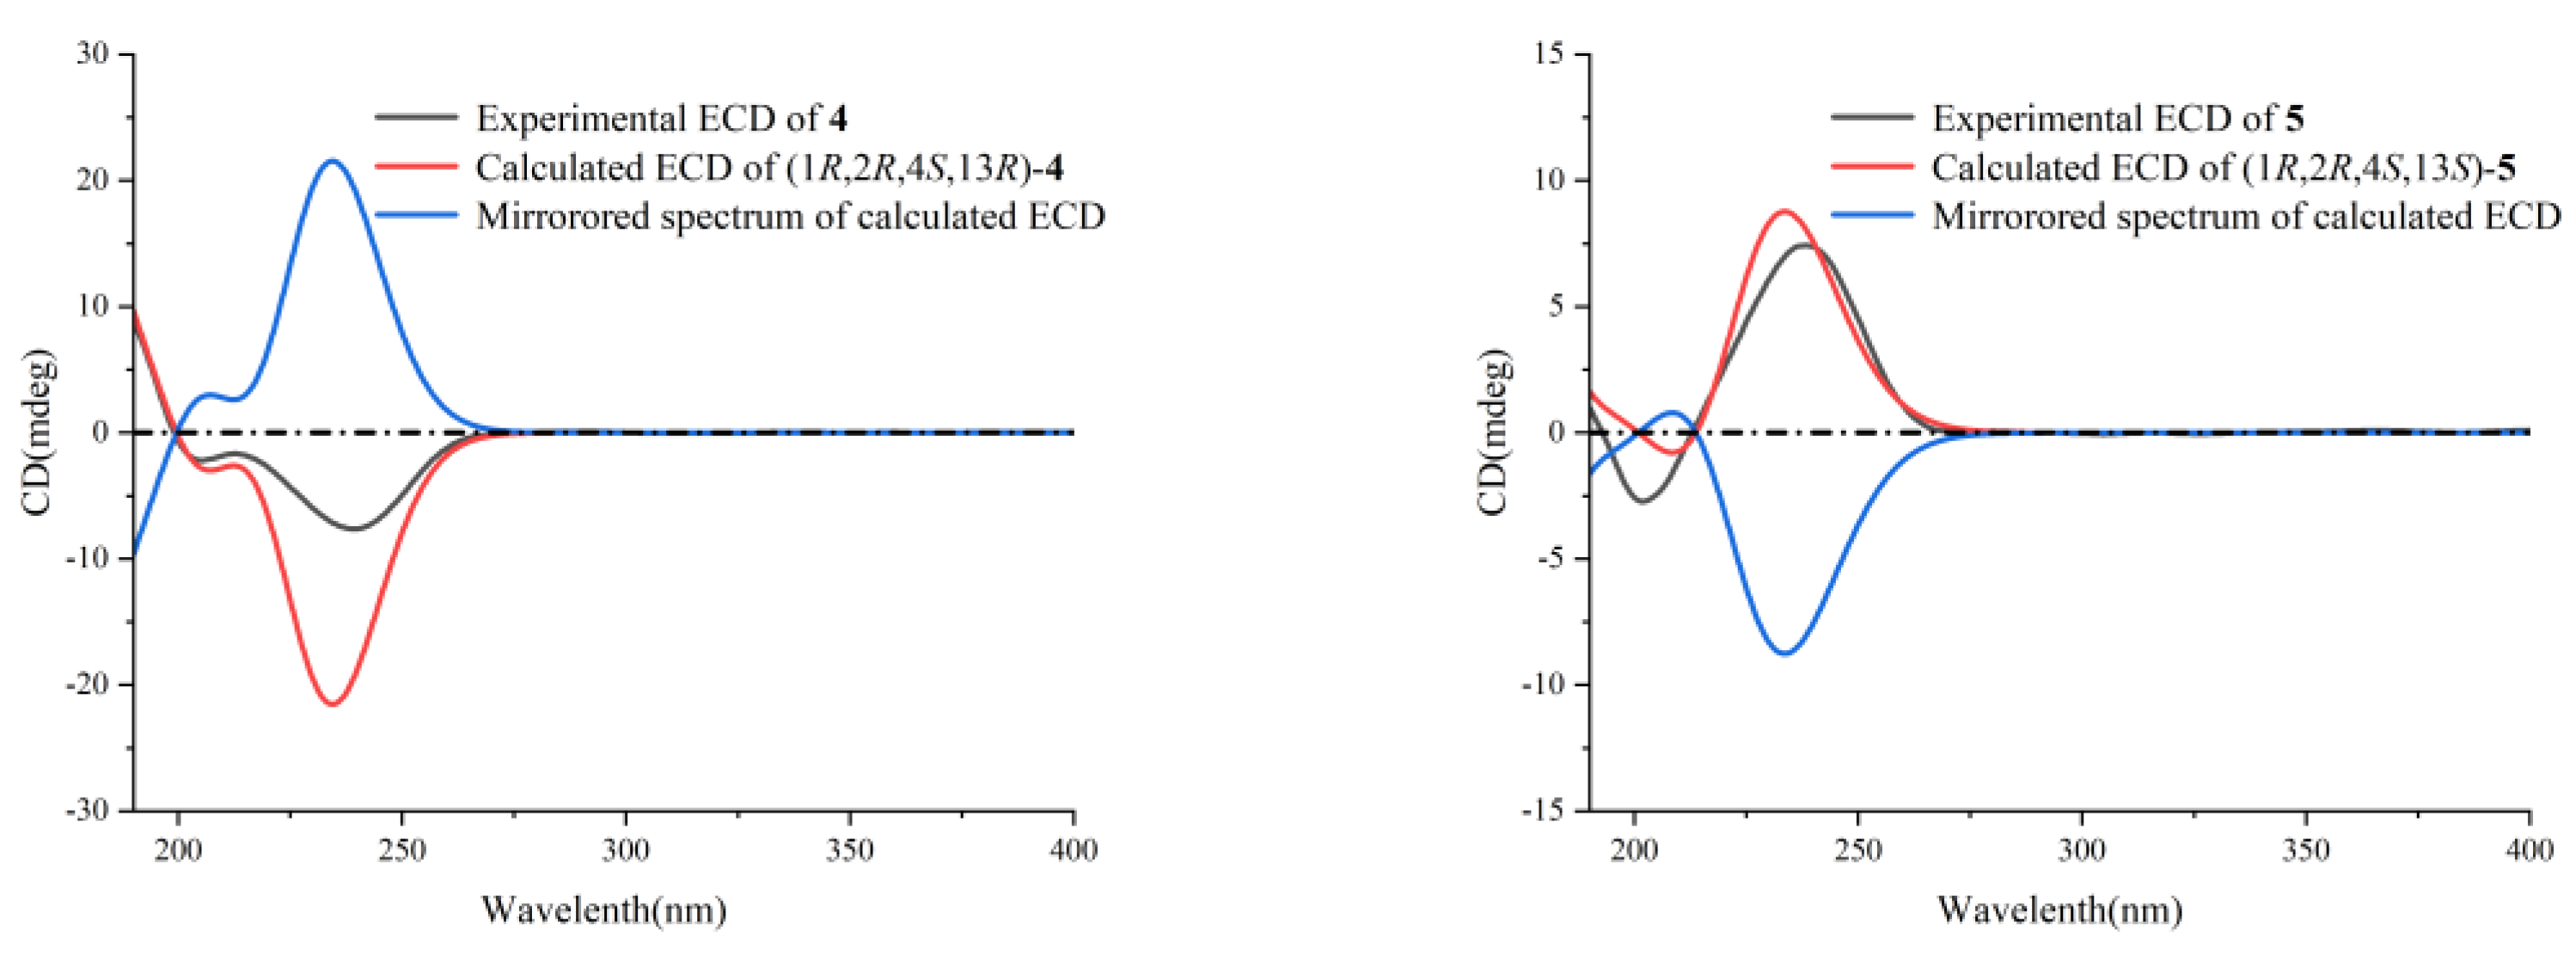
Xishaklyane B (2) and xishaklyane C (3) were initially isolated as a mixture [22], displaying two sets of carbon signals in the 13C NMR spectrum. Normal Phase-High Performance Liquid Chromatography (NP-HPLC) CHIRALPAK® IC (250 mm × 4.6 mm, 5 µm, Daicel Corporation, Japan) [n-hexane/isopropyl (99.7:0.3), 1.0 mL/min] (2: tR= 4.6 min; 3: tR= 5.5 min) was used to successfully separate the mixture into 2 and 3. The absolute configurations (ACs) of 2 and 3 were further established by TDDFT-ECD calculations, a reliable approach to determine the ACs of natural products with chiral carbons near the chromophore groups [23-26]. As shown in Figure 4, the Boltzmann-averaged ECD spectrum of (1R,2R,4S,13R,15E)-2 matched to the experimental ECD spectrum of 2, while the Boltzmann-averaged ECD spectrum of (1R,2R,4S,13S,15E)-3 matched to the experimental ECD spectrum of 3. Consequently, the ACs of 2 and 3 were determined to be 1R, 2R, 4S, 13R, 15E, and 1R, 2R, 4S, 13S, 15E, respectively. Thus, xishaklyanes B (2) and C (3) were deduced to be 13R, 15E-isofuscol and 13S, 15E-isofusol, respectively.
Xishaklyane D (4) and xishaklyane E (5) were also isolated as a pair of epimers which were separated by NP-HPLC [n-hexane/isopropyl (99.2:0.8), 1.0 mL/min] (5: tR= 6.5 min; 6: tR= 5.6 min). The 1D and 2D NMR spectra of the mixture (Table 1 and Table 3) showed great similarity to those of the mixture of 2 and 3, with the only differences of the chemical shifts between C-13 and C-17, indicating the opposite geometry of Δ15,16. The Z geometry of Δ15,16 was deduced by the 1H–1H coupling constants (J = 12.0 Hz). The ACs of 4 and 5 were also determined by TDDFT-ECD calculation. As shown in Figure 4, the Boltzmann-averaged ECD spectrum of (1R,2R,4S,13R,15Z)-4 matched to the experimental ECD spectrum of 4, while the Boltzmann-averaged ECD spectrum of (1R,2R,4S,13S,15Z)-5 matched to the experimental ECD spectrum of 5. Consequently, the ACs of 4 and 5 were determined to be 1R,2R,4S,13R,15Z. and 1R,2R,4S,13S,15Z, respectively. Finally, xishaklyane D (4) was determined as 13R,15Z-isofuscol, while xishaklyane E (5) was determined to be 13S,15Z-isofusol.
Xishaklyane F (6) was obtained as an optically active colorless oil. Its molecular formula was deduced to be C22H34O3 on the basis of HRESIMS [sodiated ion peak at m/z 369.2408 ([M + Na]+, calcd. 369.2400)], indicating six degrees of unsaturation. The 1H and 13C NMR data of 6 were reminiscent of those of the known compound 17 (Table 2 and Table 3), with the only difference on C-14 (δH 4.29, 4.31, δC 60.0 in 17 and δH 4.75, 4.75, δC 61.6 in 6), as well as an additional acetyl group in 6 (δH 2.07 s, δC 21.2, 171.3), indicating the acetylation of 14-OH of 17 towards 6. To confirm our deduction, the acetylation of 17 (3 mg) was carried out using pyridine and Ac2O at room temperature for 24 h. yielding the acetate 6 (2 mg). Thus, compound 6 was determined as the 14-acetate of the known compound lobovarol H (17), namely xishaklyane F.
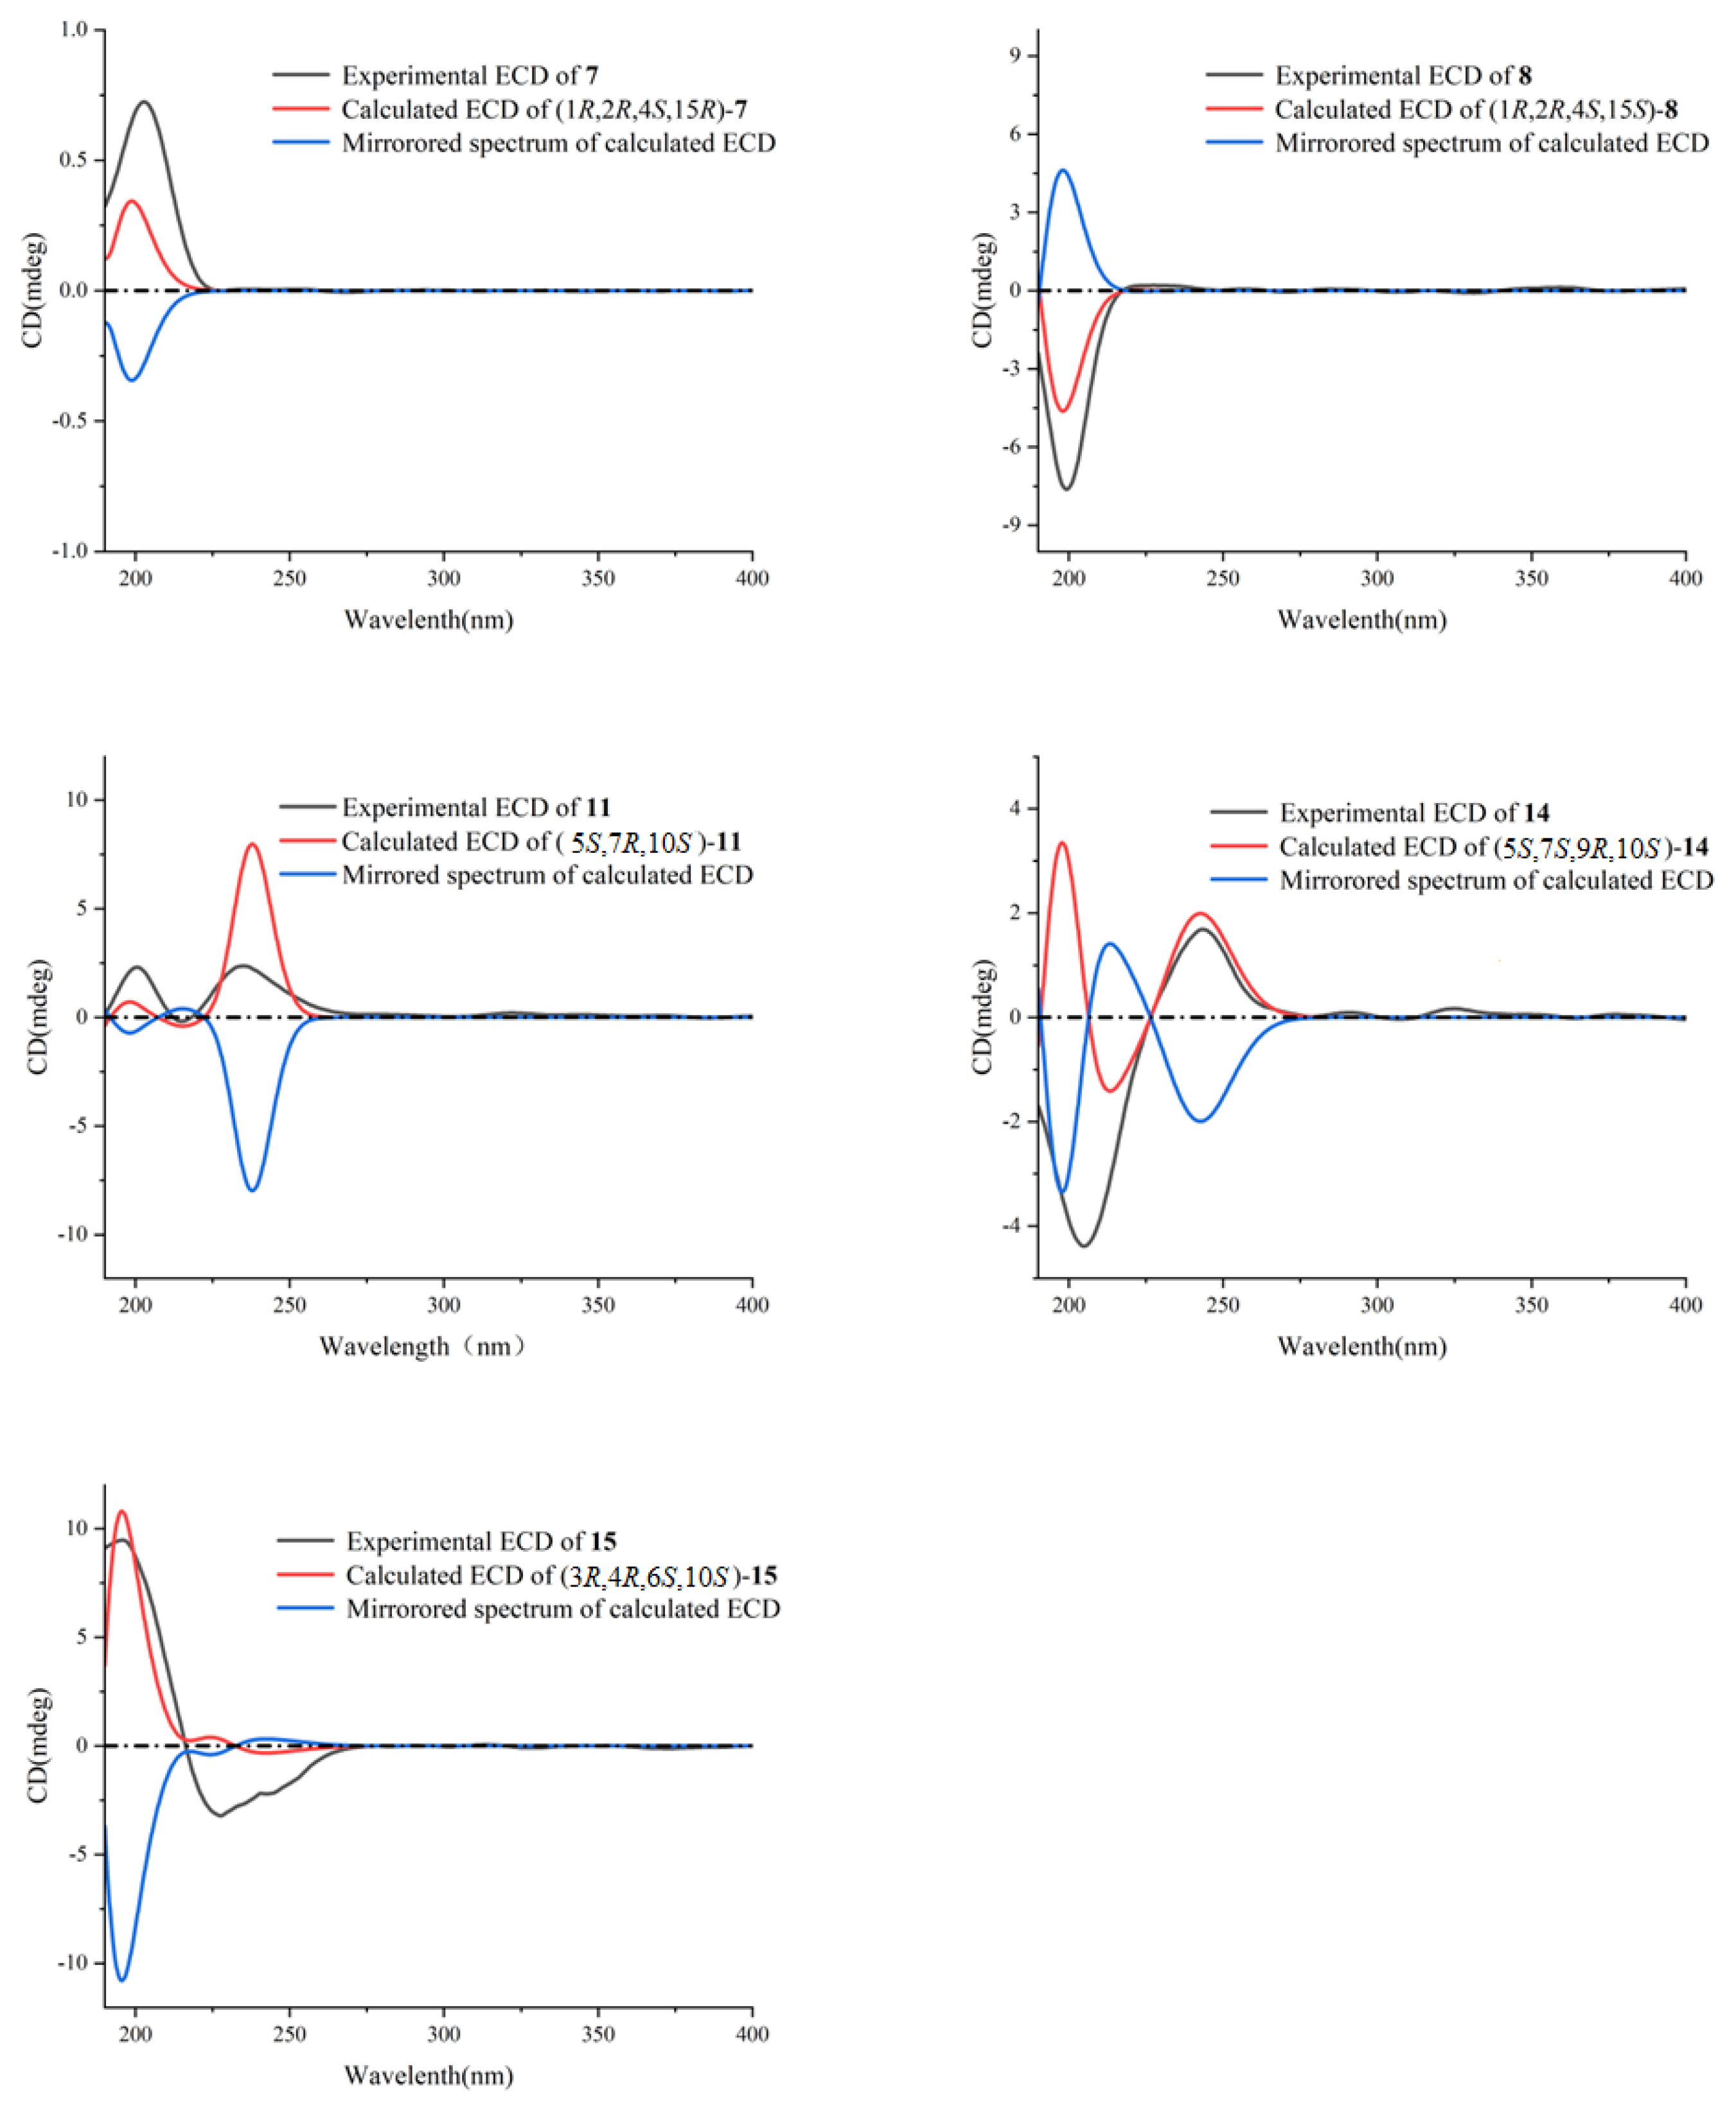
Xishaklyanes G and H (7 and 8) were initially obtained as a mixture, which were further separated by NP-HPLC [n-hexane/isopropyl (90:10), 0.9 mL/min] (7: tR= 6.4 min; 8: tR= 5.6 min). They showed the same molecular ion peak at m/z 303.2329 ([M - H], calcd. 303.2330) in the HRESIMS spectrum, and owned the same molecular formula of C20H32O2, indicating compound 7 to be isomeric with 8. Detailed analysis of their NMR data suggested an epimeric relationship between 7 and 8. The 1H and 13C NMR data of 7 and 8 (Table 2 and Table 3) showed difference at C-15 and its neighboring carbons (e.g., C-3, C-5 and C-14), indicating 7 and 8 may have the opposite configuration of 15-OH. For the planar structure of both compounds, taking 7 for an example, its 1H and 13C NMR and HSQC resonances as well as coupling constants of the connected protons, indicated the presence of one monosubstituted terminal double bond [δH 5.81 (dd, J = 17.8, 10.5 Hz), 4.91 (d, J = 17.8 Hz), 4.90 (d, J = 10.5 Hz), δC 110.1 (t), δC 150.3 (s)], two disubstituted terminal olefinic bond [δH 4.82 (s), δH 4.58 (s), δC 112.4 (t), δC 147.7 (s); δH 4.99 (s), δH 5.15 (s), δC 109.0 (t), δC 156.0 (s)], and two monosubstituted double bond [δH 5.66 (dd, J = 15.6, 6.5 Hz), δH 5.90 (d, J = 15.6 Hz), δC 128.2 (d), δC 139.7 (d)]. The above olefinic bonds accounted for four degrees of unsaturation, so the remaining one degree should be ascribed to a ring in the molecule. Further analysis of 1H–1H COSY spectrum of compound 7 revealed three structural fragments a–c. These fragments were connected with well resolved HMBC correlations from H3-7 to C-1/C-2/C-6/C-8, from H3-12 to C-2/C-10/C-11, from H3-19/H3-20 to C-17/C-18, and from H2-14 to C-4/C-13/C-15 (Figure 2). Consequently, the planar structure of 7 was identified as shown in Figure 1, featuring a lobane-type diterpenoid skeleton. The determination of the relative configurations (RCs) of 7 and 8 were highly challenging, because chiral carbon on side chain whose RCs cannot be elucidated by only a NOESY experiment. The E geometry of Δ16,17 was deduced by the 1H–1H coupling constants (J = 15.6 Hz). NOE correlations of H-4/H-3β/H-2 revealed that these protons were disposed at the same side of the molecule, and randomly assigned as β-oriented. Besides, the correlation of H3-7/H-3α revealed that these protons and proton-bearing groups were positioned at the other side of the molecule, thus α-directed (Figure 2). The ACs of 7 and 8 were determined by the TDDFT-ECD calculation. As shown in Figure 5, the Boltzmann-averaged ECD spectrum of (1R,2R,4S,15R,16E)-7 matched to the experimental ECD spectrum of 7, while the Boltzmann-averaged ECD spectrum of (1R,2R,4S,15S,16E)-8 matched to the experimental ECD spectrum of 8. Consequently, the absolute configuration of 7 was determined to be 1R,2R,4S,15R,16E. The absolute configuration of 8 was determined to be 1R,2R,4S,15S,16E.
Xishaklyane I (9) was obtained as an optically active colorless oil. Its molecular formula of C20H30O was determined from the molecular ion peak at m/z 286.2288 ([M]+, calcd. 286.2291) in the HREIMS spectrum, indicating six degrees of unsaturation. Under detailed diagnostic 2D NMR spectra, as well as coupling constants of the connected protons (Table 2 and Table 3), compound 9 own the same skeleton as the previously mentioned compounds. The major differences between them mainly happened at the C-14 position. An ether bridge between C-14 and C-16 formed a furan ring, which can further verificated by HMBC correlation from H-16 to C-14. As for the relative stereochemistry of 9, the relative configurations at C-1, C-2 and C-4 were suggested to be the same as that of 1-8, which was supported by the similar NOE relationships observed in the NOESY spectrum (Figure 2). Therefore, there are only two possibilities for the RC of 9 [(1R*, 2R*, 4S*, 16R*)-9 and (1R*, 2R*, 4S*, 16S*)-9]. Thus, the QM-NMR calculation and DP4+ analyses [27-29] of 13C NMR parameter on the two possible candidate diastereoisomers were performed. Finally, the experimentally observed 13C NMR data for 9 gave its best match for the 1R*, 2R*, 4S*, 16R* isomer (9a, see the details in SI), with a 99.83% probability. Like the AC of fuscol, consequently, the absolute configuration of 9 was determined to be 1R,2R,4S,13Z,16R.
The molecular formula C20H30O2 of Xishaklyane J (10) was deduced by the HRESIMS molecular ion peak at m/z 303.2315, implying six degrees of unsaturation. The 1H and 13C NMR data of 10 (Table 2 and Table 3) was closely reminiscent of those of the co-occurrent 17,18-epoxyloba-8,10,13(15)-trien-16-ol (18). The only difference between them was the presence of a terminal alkene (C-13/C-14) and an epoxide (C-15/C-16) in 10 instead of a trisubstituted double bond (C-13/C-15) and a hydroxyl (C-16) in 18. The detailed 2D NMR analysis shown in Figure 2 confirmed its planar structure. To further confirm the structure and RC of 10, the QM-NMR calculation and DP4+ analyses were used. Finally, the experimentally observed NMR data for 10 gave its best match for the 1R*, 2R*, 4S*, 16S*, 17R*, 18R* isomer (10d, see the details in SI), with a 100.00% probability. Like the AC of fuscol, consequently, the absolute configuration of 10 was determined to be 1R,2R,4S,16S,17R,18R.
Biogenetically, 10 was believed to be derived from compound 18 by an acid induced electron delivery from 16-OH to first generate the 15,16-epoxyl, and then promote the double bond migration towards the terminal olefin. The AC of the known compound 17,18-epoxyloba-8,10,13(15)-trien-16-ol (18) has not been defined. To obtain its absolute configuration at C-16, two aliquots of compound 18 were treated with (R)- and (S)-α-methoxy-α-trifluoromethylphenyl acetyl (MTPA) chlorides to obtain the (S)- and (R)-esters, respectively. Analysis of ΔδSR values (δS - δR) observed for the signals of the protons close to 16-OH indicated the R configuration at this carbon (Figure 6).
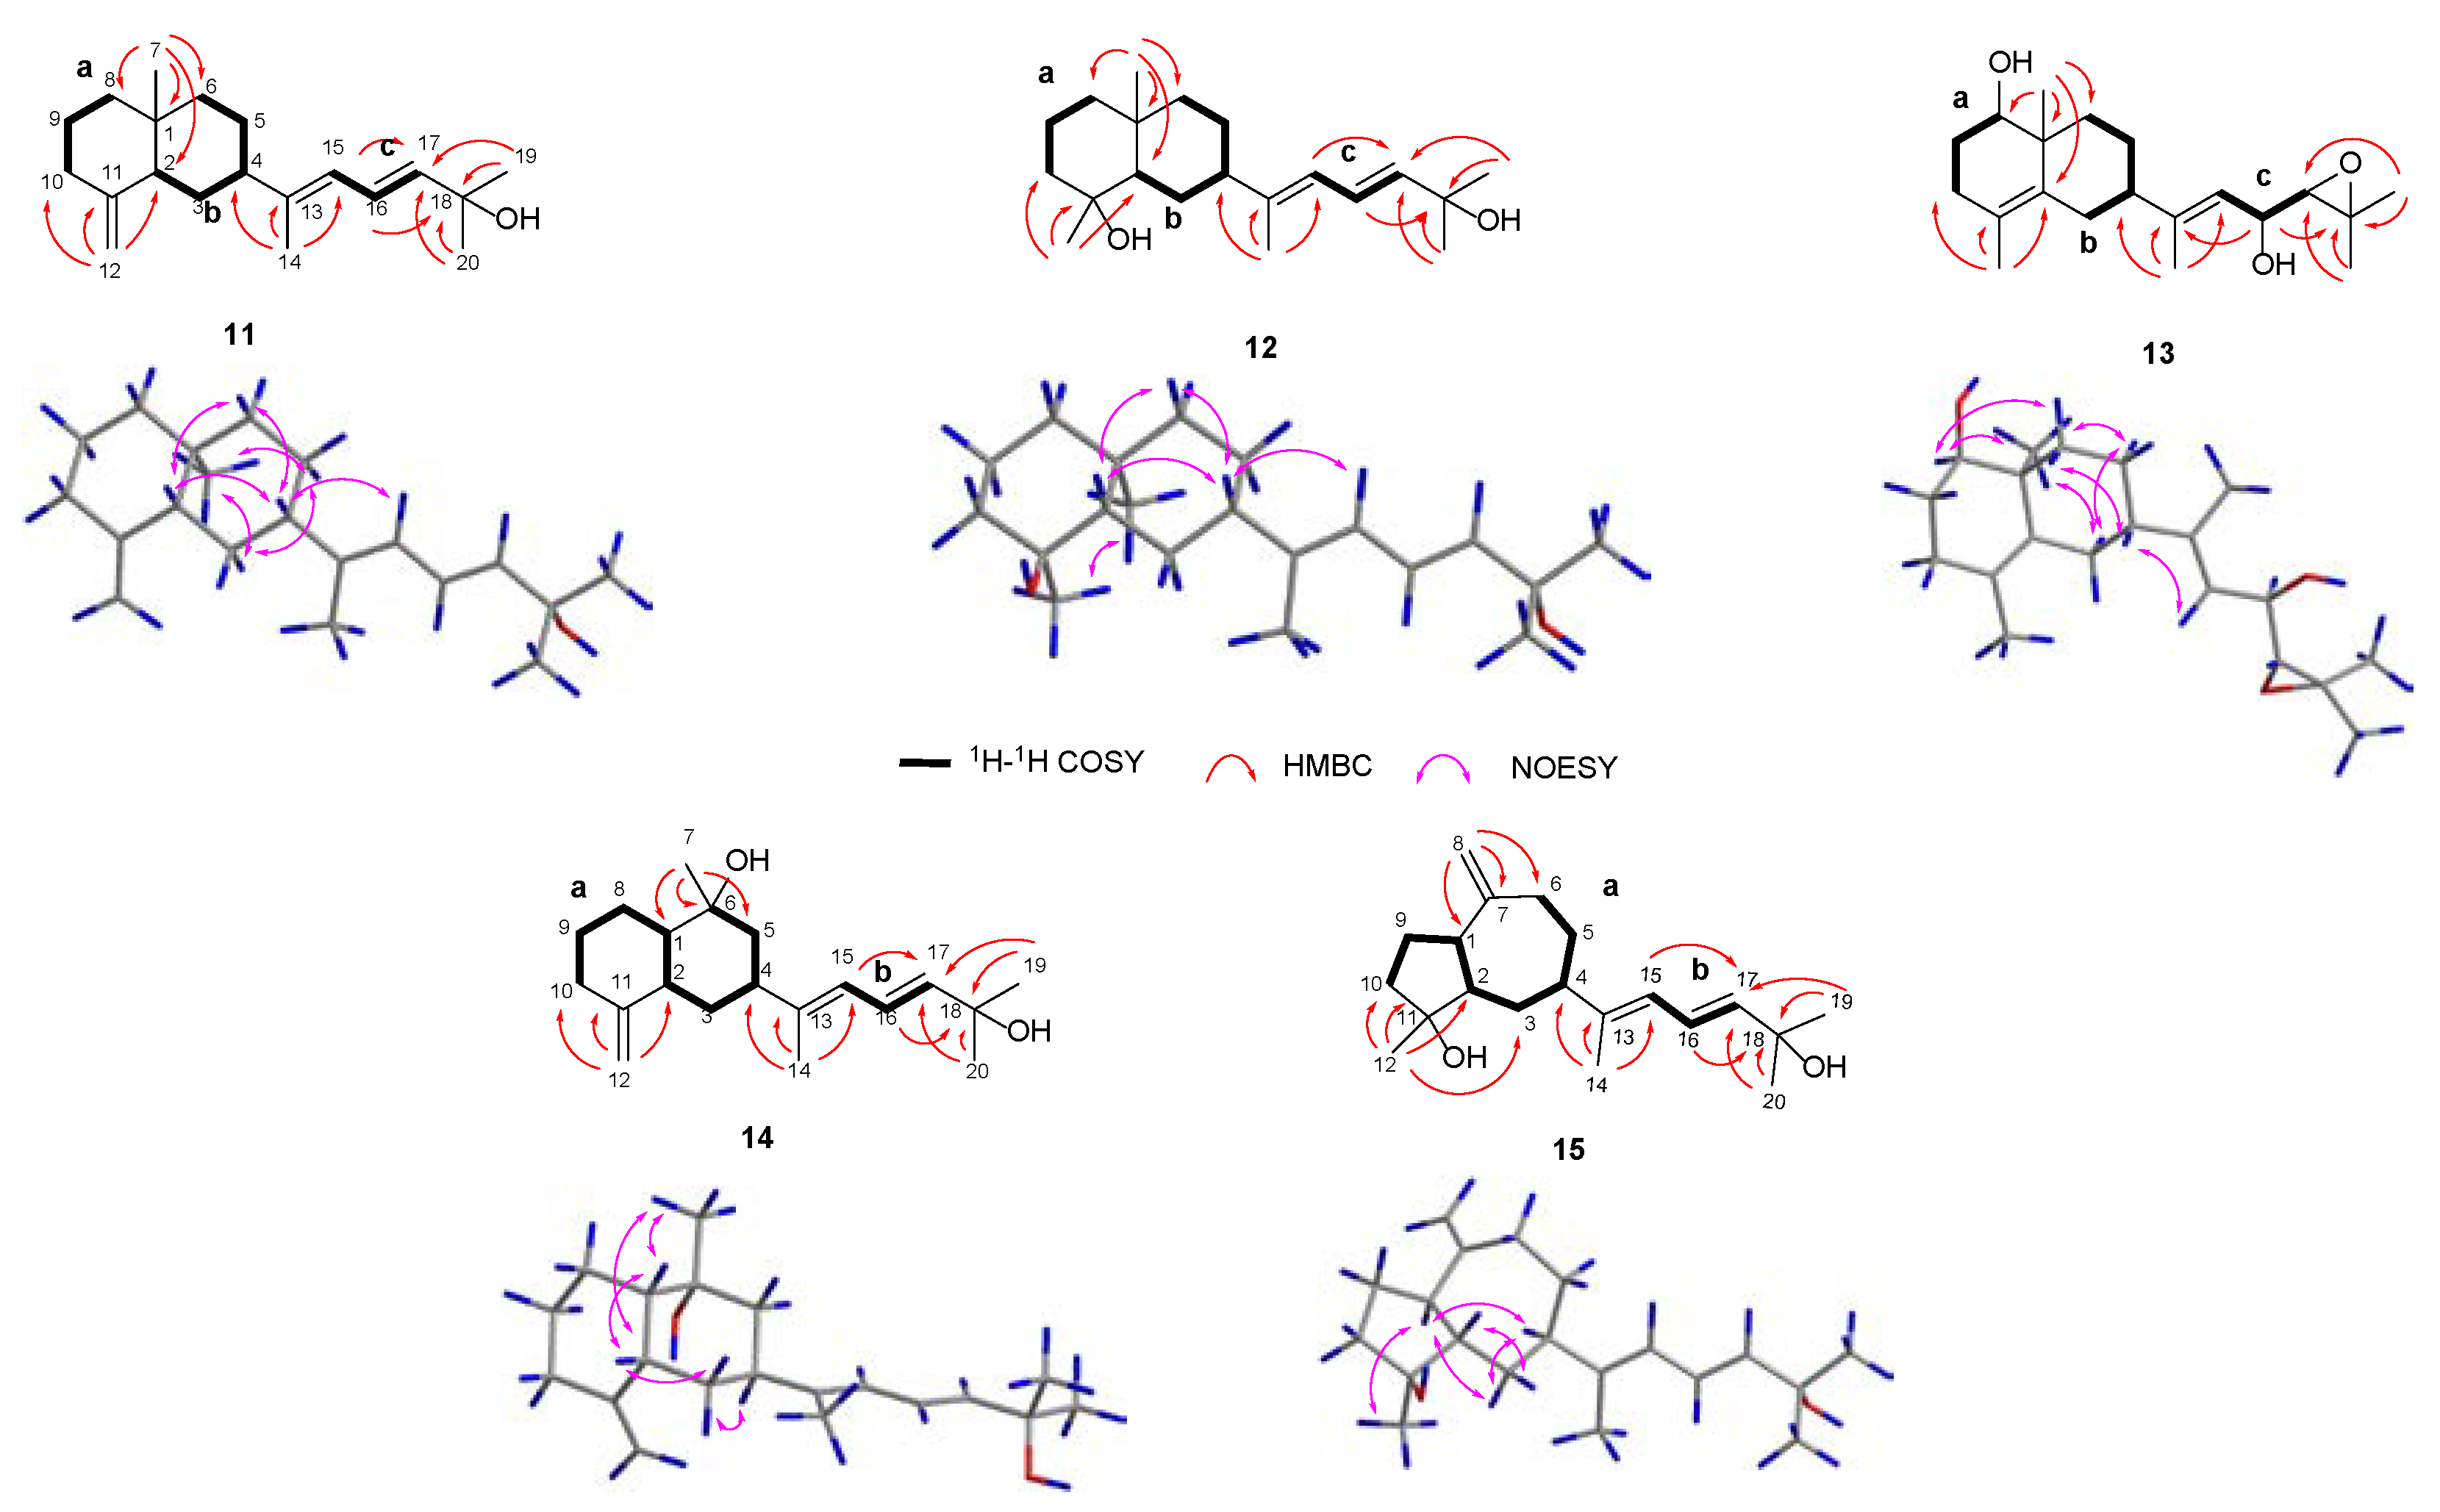
Xishaklyane K (11) was obtained as an optically active colorless oil. Its molecular formula was deduced to be C20H32O on the basis of the HREIMS [molecular ion peak at m/z 288.2443 ([M]+, calcd. 288.2448)]. Careful analysis of the 1D NMR spectra of 11 (Table 4 and Table 5) showed a close similarity with those of co-occurring 16, indicating 11 also being a same side carbon chain at C-4. Further analysis of its 1D and 2D NMR spectra revealed that the main difference was between C-8 and C-12. The 1H–1H COSY correlation of H2-9/H2-10 formed a six-membered ring, which can also deduce from the HMBC correlation from H2-10 to C-8. Therefore, the planar structure was identified as shown in Figure 1, a prenyleudesmane type diterpene. Now, the remaining task is to determine the structure and RC of 11. The E geometry of Δ16,17 was deduced by the 1H–1H coupling constants (J = 15.3 Hz) and the E geometry of Δ13,15 was deduced by the NOE correlations between H-15 and H-4 (Figure 3). The relative configuration of chiral centers C-1, C-2 and C-4 in compound 11 was as the same as those compounds mentioned above. To determine the AC of 11, TDDFT-ECD calculation was performed. As shown in Figure 5, the Boltzmann-averaged ECD spectrum of (1S,2R,4S)-11 matched to the experimental ECD spectrum of 11. Consequently, the AC of 11 was determined to be 1S,2R,4S,13E,16E.
Xishaklyane L (12) was obtained as an optically active colorless oil. From the molecular ion peak at m/z 306.2553 ([M]+, calcd. 306.2553) in the HREIMS spectrum, a molecular formula of C20H32O2 was established. The structural features of 12 were reminiscent of the known compound lobovarol K [20]. Compound 12 was methylated at the hydroxyl of C-18 to form lobovarol K. Besides, the same NOE correlations (Figure 3) meant that the structure of 12 was tentatively determined to be the same as lobovarol K.
Xishaklyane M (13) has a molecular formula C20H32O3, as displayed from the ion peak in the HREIMS (m/z 320.2347 [M]+). The 1D and 2D NMR data of 13 (Table 4 and Table 5) further revealed that it is a diterpene possessing the same double rings with identical substitutions as that of the eudesmane derivative. The NOE correlations between H3-7 and H-3α/H-5α, H-3α and H-5α, H-8 and H-6α, and between H-4 and H-6β, suggested the β-orientation of H-4, and the α-orientation of H3-7 and H-8, respectively (Figure 3). The side chain was established by detailed 1D and 2D NMR data of 13, indicating a hydroxyl at C-16 and an epoxide at C-17/C-18, which is same to the known compound 18. Comparing their NMR data, the absolute configuration of 13 was tentatively determined to be 1S,2Z,4S,8R,13E,16R,17R.
Xishaklyane N (14) displayed a molecular formula of C20H32O2 as established by the HREIMS ion peak at m/z 304.2400 ([M]+ calcd for 304.2397). The 1H and 13C NMR data of 14 (Table 4 and Table 5) were very similar with 11. Detailed analysis of those spectra of 14 and comparing with those of 11 recealed that the main differences between them happened at C-6 to C-8 segments. The HMBC correlations from H3-7 to three carbons (C-1/C-5/C-6) insteated of four carbons (C-1/C-2/C-5/C-6) in 11, indicating a methyl was displaced at C-6. As for the stereochemistry of compound 14, the chemical shifts of C-14 (δC 15.4, CH3) and J value of H-16 and H-17 (15.3 Hz) indicated the E-geometry for the 13,15- and 16,17-double bonds, respectively. The NOE correlations between H3-7 and H-1/H-2, H-1 and H-2, H-2 and H-3β, and between H-4 and H-3α, suggested the β-orientation of H-1, H-2 and H3-7, and the α-orientation of H-4, respectively (Figure 3). RC of 14: 1S*, 2S*, 4S*, 6R*. As shown in Figure 5, the Boltzmann-averaged ECD spectrum of (1S,2S,4S,6R)-14 matched to the experimental ECD spectrum of 14. Consequently, the AC of 14 was determined to be 1S,2S,4S,6R,13E,16E.
Xishaklyane O (15) was also obtained as an optically active colorless oil. From the molecular ion peak at m/z 304.2402 ([M]+, calcd. 304.2397) in the HREIMS spectrum, a molecular formula of C20H32O2 was established, indicating five degrees of unsaturation. Detailed analysis of 1D and 2D NMR spectra (Table 4 and Table 5) revealed that the same side chain as compounds 11, 12, 14 and 16. Further analysis of 1H–1H COSY and HMBC spectrum of 15 revealed a 5/7-fused carbon ring system (Figure 3). As for the stereochemistry of compound 15, the E geometry of Δ16,17 was deduced by the 1H–1H coupling constants (J = 15.3 Hz) and the E geometry of Δ13,15 was deduced by the chemical shifts of C-14 (δC 14.9, CH3). The NOE correlations between H-3β and H-1/H-4, H-3α and H-2, H-1 and H-4, and between H3-12 and H-1, suggested the α-orientation of H-1, H-2and H3-12, and the β-orientation of H-4, respectively. RC of 15: 1S*, 2R*, 4S*, 11R*. As shown in Figure 5, the Boltzmann-averaged ECD spectrum of (1S,2R,4S,11R)-15 matched to the experimental ECD spectrum of 15. Consequently, the absolute configuration of 15 was determined to be 1S,2R,4S,11R,13E,16E.
All compounds were screened for antibacterial activities on fish pathogenic bacteria. As shown in Table 6, some of them exhibited considerable antibacterial activities. Among them, compound 5 was the most effective one with MIC of 0.225 μg/mL against Lactococcus garvieae, whereas compound 11 showed the best antibacterial activity against Streptococcus parauberis with MIC of 0.9 μg/mL.

3. Materials and Methods

3.1. General Experimental Procedures

Optical rotations were measured on a Perkin-Elmer 241MC polarimeter (PerkinElmer, Fremont, CA, USA). UV and CD spectra recorded on a Jasco J-815 spectropolarimeter (JASCO, Japan) at ambient temperature using chromatographic grade CH3OH and CH3CN as solvents. IR spectra were recorded on a Nicolet 6700 spectrometer (Thermo Scientific, Waltham, MA, USA); peaks are reported in cm-1. The NMR spectra were measured at 300K on Bruker Avance III 400, 500, 600 or 800 MHz NMR spectrometers (Bruker Biospin AG, Fällanden, Germany). Chemical shifts are reported in parts per million (δ) in CDCl3 (δH reported referred to CHCl3 at 7.26 ppm; δC reported referred to CDCl3 at 77.16 ppm) and coupling constants (J) in Hz; assignments were supported by 1H-1H COSY, HSQC, HMBC, and NOESY experiments. HREIMS data were recorded on a Finnigan-MAT-95 mass spectrometer (Finnigan-MAT, San Jose, CA, USA). HRESIMS spectra was recorded on an Agilent G6520 Q-TOF mass spectrometer (Agilent, Santa Clara, CA, USA). Semi-preparative RP-HPLC was performed on an Agilent-1260 system (Agilent, Santa Clara, CA, USA) equipped with a DAD G1315D detector at 210 and 254 nm using XDB-C18 column (250 mm × 9.4 mm, 5 µm) by eluting with CH3OH-H2O or CH3CN-H2O system at 3 mL/min. NP-HPLC was performed on a Shimadzu LC-6A system (Shimadzu, Japan) equipped with a DAD SPD-M20A detector using CHIRALPAK® IA or CHIRALPAK® IC (250 mm × 4.6 mm, 5 µm, Daicel Corporation, Japan) by eluting with n-hexane-isopropyl system at 1 mL/min. Commercial silica gel (100-200, 200-300 and 300-400 mesh; Qingdao Haiyang Chemical Group Co., Ltd., Qingdao, China) was used for column chromatography (CC). Precoated silica gel GF254 plates (Sinopharm Chemical Reagent Co., Shanghai, China) were used for analytical TLC. Spots were detected on TLC under UV light or by heating after spraying with anisaldehyde H2SO4 reagent. Sephadex LH-20 (Amersham Biosciences) was also used for CC. All solvents used for column chromatography and HPLC were of analytical grade (Shanghai Chemical Reagents Co., Ltd., Shanghai, China) and chromatographic grade (Dikma Technologies Inc., CA, USA), respectively.

3.2. Animal Material

Specimens of the soft coral Klyxum molle were collected by scuba diving at a depth of -20 m in Xisha Islands, Hainan Province, China, in 2019, and identified by Professor Xiu-Bao Li (Hainan University, Hainan, China). The biological material was frozen immediately after collection. A voucher specimen (19-XS-41) is available for inspection at Shanghai Institute of Materia Medica, Chinese Academy of Sciences.

3.3. Extraction and Isolation

The frozen animals (868 g, dry weight) of K. molle were cut into pieces and extracted exhaustively with acetone at room temperature (3 × 3.0 L). The organic extract was evaporated to give a brown residue, which was then partitioned between Et2O and H2O. The upper layer was concentrated under reduced pressure to give a brown residue (43.3 g), which was fractioned by gradient silica gel (200–300 mesh) column chromatography (CC) (0~100% Et2O in petroleum ether (PE)), yielding 11 fractions (A–K). Fr. D was fractioned by Sephadex LH-20 (PE/CH2Cl2/MeOH, 2:1:1) to obtain three sub-fractions Fr. Da, Db, and Dc. The subfraction Dc was separated on a column of silica gel (10~20% Et2O in PE) to afford 16 (1.31 g), 1 (0.26 g). Fr. C was fractioned by Sephadex LH-20 (PE/CH2Cl2/MeOH, 2:1:1) to obtain four sub-fractions Fr. Ca, Cb, Cc and Cd. The subfraction Cd was separated on a column of silica gel (5~20% Et2O in PE) to afford mixtures Cd2 and Cd6. Cd2 was further purified by RP-HPLC [MeOH/H2O (90:10), 3.0 mL/min] to give 10 (3.9 mg, tR = 11.0 min), Cd2c (0.7 mg, tR = 11.8 min). Cd6 was further purified by RP-HPLC [MeOH/H2O (95:5), 3.0 mL/min] to give 11 (1.1 mg, tR = 8.0 min), Cd6a (3.1 mg, tR = 5.3 min). Cd2c was purified by NP-HPLC [n-hexane/isopropyl (99.2:0.8), 1.0 mL/min] to give 4 (0.5 mg, tR = 6.5 min), 5 (0.2 mg, tR = 5.6 min). Cd6a was purified by NP-HPLC [n-hexane/isopropyl (99.7:0.3), 1.0 mL/min] to give 2 (1.4 mg, tR = 4.6 min), 3 (1.4 mg, tR = 5.5 min). Fr. G was fractioned by Sephadex LH-20 (PE/CH2Cl2/MeOH, 2:1:1) to obtain three sub-fractions Fr. Ga, Gb, and Gc. Gb was further purified by RP-HPLC [MeOH/H2O (85:15), 3.0 mL/min] to give 17 (0.9 mg, tR = 8.3 min), 18 (3.7 mg, tR = 13.7 min). Gc was further purified by RP-HPLC [MeCN/H2O (60:40), 3.0 mL/min] to give 9 (0.8 mg, tR = 10.4 min), 13 (0.6 mg, tR = 5.3 min). Fr. H was fractioned by Sephadex LH-20 (PE/CH2Cl2/MeOH, 2:1:1) to obtain three sub-fractions Fr. Ha, Hb, and Hc. The subfraction Hc was separated on a column of silica gel (50~75% Et2O in PE) to afford 6 (15.0 mg), and mixtures Hc1 and Hc2. Hc2 was further purified by RP-HPLC [MeCN/H2O (70:30), 3.0 mL/min] to give 14 (2.0 mg, tR = 9.3 min), Hc1 was further purified by RP-HPLC [MeCN/H2O (55:45), 2.0 mL/min] to give 12 (7.0 mg, tR = 21.3 min), 15 (1.0 mg, tR = 18.2 min), and Hc1d (1.3 mg, tR = 23.6 min). Hc1d was purified by NP-HPLC [n-hexane/isopropyl (90:10), 0.9 mL/min] to give 7 (0.5 mg, tR = 6.4 min), 8 (0.7 mg, tR = 5.6 min).

3.4. Spectroscopic Data of Compounds

Xishaklyane A (1): Colorless oil; [α ] D 20 –43.1 (c 1.95, CHCl3); UV (MeCN) λmax (log ε) 240 (3.31) nm; ECD (CH3CN) λmaxε) 215 (–5.2) nm; IR (KBr) νmax 3382, 2969, 2928, 2860, 1637, 1440, 1376, 1148,1005 cm-1; HRESIMS [M+H]+ m/z 289.2527 (calcd. for 289.2526, C20H33O).
Xishaklyane B (2): Colorless oil; [α ] D 20 –7.4 (c 0.14, CHCl3); UV (MeCN) λmax (log ε) 238 (3.23) nm; ECD (CH3CN) λmaxε) 201 (–1.6) nm.
Xishaklyane C (3): Colorless oil; [α ] D 20 +30.2 (c 0.14, CHCl3); UV (MeCN) λmax (log ε) 238 (3.27) nm; ECD (CH3CN) λmaxε) 232 (+2.3) nm.
Xishaklyane D (4) and Xishaklyane E (5): For 4, Colorless oil; [α ] D 20 –35.0 (c 0.05, CHCl3); UV (MeCN) λmax (log ε) 240 (3.29) nm; ECD (CH3CN) λmaxε) 240 (–3.4) nm; For 5, Colorless oil; [α ] D 20 +75.8 (c 0.02, CHCl3); UV (MeCN) λmax (log ε) 240 (3.35) nm; ECD (CH3CN) λmaxε) 244 (+3.8) nm; For mixture of 4 and 5, IR (KBr) νmax 3455, 2966, 2925, 2854, 1438, 1376, 1180, 1142, 1099, 1075,1029 cm-1; HREIMS [M]+ m/z 288.2454 (calcd. for 288.2448, C20H32O).
Xishaklyane F (6): Colorless oil; [α ] D 20 +33.5 (c 0.09, CHCl3); UV (MeCN) λmax (log ε) 239 (3.30) nm; ECD (CH3CN) λmaxε) 234 (+2.9) nm; IR (KBr) νmax 3451, 2968, 2925, 2854, 1735, 1377, 1260, 1230, 1075,1027 cm-1; HRESIMS [M + Na]+ m/z 369.2408 (calcd. for 369.2400, C22H34NaO3).
Xishaklyane G (7) and Xishaklyane H (8): For 7, Colorless oil; [α ] D 20 +25.3 (c 0.05, CHCl3); ECD (CH3CN) λmaxε) 196 (–4.4) nm; For 8, White solid; [α ] D 20 +24.0 (c 0.07, CHCl3); ECD (CH3CN) λmaxε) 204 (+5.6) nm; For mixture of 7 and 8, IR (KBr) νmax 3443, 2968, 2924, 2853, 1384, 1180, 1143, 1095, 1076, 1029 cm-1; HRESIMS [M - H]- m/z 303.2329 (calcd. for 303.2330, C20H31O2).
Xishaklyane I (9): Colorless oil; [α ] D 20 +67.9 (c 0.08, CHCl3); IR (KBr) νmax 3451, 2967, 2925, 2854, 1444, 1374, 1180, 1059, 1029 cm-1; HREIMS [M]+ m/z 286.2288 (calcd. for 286.2291, C20H30O).
Xishaklyane J (10): Colorless oil; [α ] D 20 +2.8 (c 0.09, CHCl3); IR (KBr) νmax 3454, 2965, 2926, 2856, 1643, 1456,1379, 1075, 1029 cm-1; HRESIMS [M + H]+ m/z 303.2315 (calcd. for 303.2319, C20H31O2).
Xishaklyane K (11): Colorless oil; [α ] D 20 -20.0 (c 0.11, CHCl3); UV (MeCN) λmax (log ε) 240 (3.34) nm; ECD (CH3CN) λmaxε) 200 (+2.0) nm; IR (KBr) νmax 3451, 2869, 2925, 2852, 1442, 1386, 1180, 1143, 1075, 1030 cm-1; HREIMS [M]+ m/z 288.2443 (calcd. for 288.2448, C20H32O).
Xishaklyane L (12): Colorless oil; [α ] D 20 +25.7 (c 0.70, CHCl3); UV (MeCN) λmax (log ε) 240 (3.33) nm; ECD (CH3CN) λmaxε) 242 (+2.1) nm; IR (KBr) νmax 3385, 2970, 2926, 2864, 1456, 1384, 1143, 1105 cm-1; HREIMS [M]+ m/z 306.2553 (calcd. for 306.2553, C20H34O2).
Xishaklyane M (13): Colorless oil; [α ] D 20 –13.3 (c 0.06, CHCl3); IR (KBr) νmax 3450, 2963, 2925, 2854, 1436, 1378, 1180, 1075, 1028 cm-1; HREIMS [M]+ m/z 320.2347 (calcd. for 320.2346, C20H32O3).
Xishaklyane N (14): Colorless oil; [α ] D 20 –15.5 (c 0.20, CHCl3); UV (MeCN) λmax (log ε) 239 (3.34) nm; ECD (CH3CN) λmaxε) 210 (–1.9) nm; IR (KBr) νmax 3450, 2963, 2925, 2857, 1386, 1180, 1143, 1095, 1075, 1028 cm-1; HREIMS [M]+ m/z 304.2400 (calcd. for 304.2397, C20H32O2).
Xishaklyane O (15): Colorless oil; [α ] D 20 –16.8 (c 0.10, CHCl3); UV (MeCN) λmax (log ε) 240 (3.38) nm; ECD (CH3CN) λmaxε) 197 (+4.2) nm; IR (KBr) νmax 3450, 2959, 2923, 2852, 1384, 1180, 1143, 1129, 1099, 1075, 1029 cm-1; HREIMS [M]+ m/z 304.2402 (calcd. for 304.2397, C20H32O2).

3.5. Esterification of 3 and 5 with MTPA chlorides

Compound 18 (2.0 mg) was dissolved in dry pyridine (1000 μL), and the solution was transferred into two NMR tubes (500 μL each), treated with (R)-(-)-2-methoxy-2-(trifluoromethyl) phenylacetyl chloride ((R)-(-)-MTPA-Cl) (20 μL) and (S)-(+)-2-methoxy-2-(trifluoromethyl) phenylacetyl chloride ((S)-(+)-MTPA-Cl) (20 μL), respectively. Carefully shaking and then monitored immediately by 1H NMR. The reaction was found to be completed in 30 min. Then the solutions were evaporated in vacuo and the residue was purified by silica gel CC (10% Et2O in PE) to obtain the S-MTPA ester 18s, and R-MTPA ester 18r, respectively. For (S)-MTPA ester of 18 (18s), Selected 1H NMR (CDCl3, 400 MHz): δH 5.812 (1H, dd, J = 17.6, 10.7 Hz, H-8), 5.626 (1H, t, J = 9.2 Hz, H-16), 5.359 (1H, d, J = 9.8 Hz, H-15), 4.917 (1H, d, J = 15.9 Hz, H-9α), 4.912 (1H, d, J = 12.4 Hz, H-9β), 4.842 (1H, s, H-11α), 4.585 (1H, s, H-11β), 2.997 (1H, d, J = 8.4 Hz, H-17), 2.009 (1H, d, J = 12.2 Hz, H-4), 1.827 (3H, s, Me-14), 1.713 (3H, s, Me-12), 1.338 (3H, s, Me-20), 1.323 (3H, s, Me-19), 1.013 (3H, s, Me-7). For (R)-MTPA ester of 18 (18r), Selected 1H NMR (CDCl3, 400 MHz): δH 5.807 (1H, dd, J = 17.6, 10.6 Hz, H-8), 5.591 (1H, t, J = 9.2 Hz, H-16), 5.148 (1H, d, J = 10.1 Hz, H-15), 4.911 (1H, d, J = 16.6 Hz, H-9α), 4.910 (1H, d, J = 11.5 Hz, H-9β), 4.848 (1H, s, H-11α), 4.579 (1H, s, H-11β), 2.996 (1H, d, J = 8.6 Hz, H-17), 1.995 (1H, d, J = 11.9 Hz, H-4), 1.856 (3H, s, Me-14), 1.713 (3H, s, Me-12), 1.358 (3H, s, Me-20), 1.331 (3H, s, Me-19), 0.997 (3H, s, Me-7).

3.6. QM-NMR Calculational Section

For the QM-NMR calculations of compounds, torsional sampling (MCMM) conformational searches using OPLS_2005 force field were carried out by the means of conformational search module in Macro model 9.9.223 software (Schrodinger, http://www.schrodinger. com/MacroModel), applying an energy window of 21 kJ/mol (5.02 kcal/mol) for saving structures. The following DFT calculations were performed using Gaussian 09, and Conformers above 1% population were reoptimized at B3LYP/6-311G(d,p) level of theory. Magnetic shielding constants (σ) were calculated by means of the gauge including atomic orbitals (GIAO) method at mPW1PW91/6-31+G(d,p) level of theory as recommended for DP4+ analysis.

3.7. TDDFT-ECD Calculational Section

For the time-dependent density functional theory/electronic circular dichroism (TDDFT-ECD) calculations of compounds, conformational searches were done following the general protocols previously described for QM-NMR calculation. Conformers above 1% population were used for re-optimizations and the following TDDFT-ECD calculations, which were performed using Gaussian 09 at the B3LYP/6-311G(d,p) level of theory with IEFPCM solvent model for acetonitrile. Finally, the SpecDis 1.62 software was used to obtain the calculated ECD spectrum and visualize the results.

3.8. Antibacterial assays

Five pathogenic bacteria, namely Streptococcus parauberis KSP28, Streptococcus parauberis SPOF3K, Lactococcus garvieae MP5245, Aeromonas salmonicida AS42, and Photobacterium damselae FP2244, were provided by National Fisheries Research & Development Institute, Korea. MIC values of test compounds were determined by the modified 0.5 Mcfarland standard method.

4. Conclusions

This detailed chemical investigation on the South China Sea soft coral K. molle yielded fifteen new diterpenes, namely xishaklyanes A-O (1-15), as well as three related known analogues (16-18). Among them, the absolute configuration of compound 18 was determined by the modified Mosher’s method. And the stereochemistry of the new compounds was determined by QM-NMR and TDDFT-ECD, or chemical connections. In antibacterial activities on fish pathogenic bacteria, compound 4 exhibited the best activity with MIC of 0.225 μg/mL against Lactococcus garvieae. Further study should be conducted on the accumulation of the most effective compounds for in-depth antibacterial research.

Supplementary Materials

The following supporting information can be downloaded at the website of this paper posted on Preprints.org, Figures S1–S110: NMR, HRESIMS, HREIMS, UV, CD and IR data of compounds 115; Figures S111–S116: Structure of studied isomers of compound 9 and 10, Averaged isotropic magnetic shielding constants (σ) of studied isomers and experimental 1H and 13C data of 9 and 10, DP4+ results obtained using experimental data of compounds 9 versus isomers 9a9b and 10 versus isomers 10a10d.

Author Contributions

Conceptualization: H. Wang and Y.-W. Guo; methodology: H. Wang and Y.-W. Guo; validation: J.-D. Yu, M.-Z. Su, Y.-C. Gu and D.-D. Yu; formal analysis: J.-D. Yu; investigation & data curation: J.-D. Yu and M.-Z. Su; writing & original draft preparation: J.-D. Yu; writing & review and editing: Y.-W. Guo; supervision: H. Wang and Y.-W. Guo; project administration: H. Wang and Y.-W. Guo; funding acquisition: Y.-W. Guo. All authors have read and agreed to the published version of the manuscript.

Funding

This research work was financially supported by the National Key Research and Development Program of China (No. 2022YFC2804100), the National Natural Science Foundation of China (Nos. 81991521 and 41876194), and the SKLDR/SIMM Project (No. SIMM2103ZZ-06).

Institutional Review Board Statement

Not applicable.

Informed Consent Statement

Not applicable.

Data Availability Statement

Data are contained within the article or Supplementary Materials.

Acknowledgments

We thank X.-B. Li from Hainan University for the taxonomic identification of the soft coral material. J.-D. Yu is thankful for the financial support of Syngenta-ZJUT-PhD Studentship Project.

Conflicts of Interest

The authors declare no conflict of interest.

References

  1. Chill, L.; Berrer, N.; Benayahu, Y.; Kashman, Y. Eunicellin diterpenes from two Kenyan soft corals. J. Nat. Prod. 2005, 68, 19–25. [Google Scholar] [CrossRef] [PubMed]
  2. Yan, X.; Liu, J.; Leng, X.; Ouyang, H. Chemical diversity and biological activity of secondary metabolites from soft coral genus Sinularia since 2013. Mar. Drugs 2021, 19, 335. [Google Scholar] [CrossRef] [PubMed]
  3. Elkhawas, Y.A.; Elissawy, A.M.; Elnaggar, M.S.; Mostafa, N.M.; Al-Sayed, E.; Bishr, M.M.; Singab, A.N.B.; Salama, O.M. Chemical diversity in species belonging to soft coral genus Sacrophyton and its impact on biological activity: a review. Mar. Drugs 2020, 18, 41. [Google Scholar] [CrossRef] [PubMed]
  4. Wu, S.-L.; Su, J.-H.; Huang, C.-Y.; Tai, C.-J.; Sung, P.-J.; Liaw, C.-C.; Sheu, J.-H. Simplexins P–S, eunicellin-based diterpenes from the soft coral Klyxum simplex. Mar. Drugs 2012, 10, 1203–1211. [Google Scholar] [CrossRef] [PubMed]
  5. Chen, B.-W.; Wu, Y.-C.; Chiang, M.Y.; Su, J.-H.; Wang, W.-H.; Fan, T.-Y.; Sheu, J.-H. Eunicellin-based diterpenoids from the cultured soft coral Klyxum simplex. Tetrahedron 2009, 65, 7016–7022. [Google Scholar] [CrossRef]
  6. Chen, B.-W.; Chao, C.-H.; Su, J.-H.; Tsai, C.-W.; Wang, W.-H.; Wen, Z.-H.; Huang, C.-Y.; Sung, P.-J.; Wu, Y.-C.; Sheu, J.-H. Klysimplexins I–T, eunicellin-based diterpenoids from the cultured soft coral Klyxum simplex. Org. & Biomol. Chem. 2011, 9, 834–844. [Google Scholar] [CrossRef]
  7. Wu, S.-L.; Su, J.-H.; Wen, Z.-H.; Hsu, C.-H.; Chen, B.-W.; Dai, C.-F.; Kuo, Y.-H.; Sheu, J.-H. Simplexins A−I, eunicellin-based diterpenoids from the soft coral Klyxum simplex. J. Nat. Prod. 2009, 72, 994–1000. [Google Scholar] [CrossRef]
  8. Hsu, F.-J.; Chen, B.-W.; Wen, Z.-H.; Huang, C.-Y.; Dai, C.-F.; Su, J.-H.; Wu, Y.-C.; Sheu, J.-H. Klymollins A–H, bioactive eunicellin-based diterpenoids from the Formosan soft coral Klyxum molle. J. Nat. Prod. 2011, 74, 2467–2471. [Google Scholar] [CrossRef]
  9. Lin, M.-C.; Chen, B.-W.; Huang, C.-Y.; Dai, C.-F.; Hwang, T.-L.; Sheu, J.-H. Eunicellin-based diterpenoids from the Formosan sosft coral Klyxum molle with inhibitory activity on superoxide generation and elastase release by neutrophils. J. Nat. Prod. 2013, 76, 1661–1667. [Google Scholar] [CrossRef]
  10. Chang, F.-Y.; Hsu, F.-J.; Tai, C.-J.; Wei, W.-C.; Yang, N.-S.; Sheu, J.-H. Klymollins T–X, bioactive eunicellin-based diterpenoids from the soft coral Klyxum molle. Mar. Drugs 2014, 12, 3060–3071. [Google Scholar] [CrossRef]
  11. Chang, F.-Y.; Chokkalingam, U.; Tai, C.-J.; Huang, C.-Y.; Wei, W.-C.; Yang, N.-S.; Su, J.-H.; Sung, P.-J.; Sheu, J.-H. New eunicellin-derived diterpenoids from a Taiwanese soft coral Klyxum molle. Tetrahedron 2016, 72, 192–198. [Google Scholar] [CrossRef]
  12. Li, G.; Li, H.; Tang, W.; Guo, Y.-W.; Li, X.-W. Klyflaccilides A and B, diterpenoids with 6/5/8/3 fused tetracyclic carbon skeleton from the Hainan soft coral Klyxum flaccidum. Org. Lett. 2019, 21, 5660–5664. [Google Scholar] [CrossRef] [PubMed]
  13. Li, G.; Sun, L.-L.; Dickschat, J.S.; Guo, Y.-W. Klyflaccilins B-T, polyoxgenated eunicellins from the soft coral Klyxum flaccidum. Eur. J. Org. Chem. 2021, 9, 1402–1406. [Google Scholar] [CrossRef]
  14. Ahmed, A.F.; Tsai, C.-R.; Huang, C.-Y.; Wang, S.-Y.; Sheu, J.-H. Klyflaccicembranols A–I, new cembranoids from the soft coral Klyxum flaccidum. Mar. Drugs 2017, 15, 23. [Google Scholar] [CrossRef] [PubMed]
  15. Tseng, W.-R.; Ahmed, A.F.; Huang, C.-Y.; Tsai, Y.-Y.; Tai, C.-J.; Orfali, R.S.; Hwang, T.-L.; Wang, Y.-H.; Dai, C.-F.; Sheu, J.-H. Bioactive capnosanes and cembranes from the soft coral Klyxum flaccidum. Mar. Drugs 2019, 17, 461. [Google Scholar] [CrossRef] [PubMed]
  16. Ye, F.; Zhu, Z.-D.; Chen, J.-S.; Li, J.; Gu, Y.-C.; Zhu, W.-L.; Li, X.-W.; Guo, Y.-W. Xishacorenes A–C, diterpenes with bicyclo[3.3.1]nonane nucleus from the Xisha soft coral Sinularia polydactyla. Org. Lett. 2017, 19, 4183–4186. [Google Scholar] [CrossRef] [PubMed]
  17. Ye, F.; Li, J.; Wu, Y.; Zhu, Z.-D.; Mollo, E.; Gavagnin, M.; Gu, Y.-C.; Zhu, W.-L.; Li, X.-W.; Guo, Y.-W. Sarinfacetamides A and B, nitrogenous diterpenoids with tricyclo[6.3.1.01,5]dodecane scaffold from the South China Sea soft coral Sarcophyton infundibuliforme. Org. Lett. 2018, 20, 2637–2640. [Google Scholar] [CrossRef] [PubMed]
  18. Yang, M.; Li, X.-L.; Wang, J.-R.; Lei, X.; Tang, W.; Li, X.-W.; Sun, H.; Guo, Y.-W. Sarcomililate A, an unusual diterpenoid with tricyclo[11.3.0.02,16]hexadecane carbon skeleton, and its potential biogenetic precursors from the Hainan soft coral Sarcophyton mililatensis. J. Org. Chem. 2019, 84, 2568–2576. [Google Scholar] [CrossRef]
  19. Edrada, R. A.; Proksch, P.; Wray, V.; Witte, L.; Ofwegen, L. Four new bioactive lobane diterpenes of the soft coral Lobophytum pauciflorum from Mindoro, Philippines. J. Nat. Prod. 1998, 61, 358–361. [Google Scholar] [CrossRef]
  20. Chang, C.-H.; Ahmed, A.F.; Yang, T.-S.; Lin, Y.-C.; Huang, C.-Y.; Hwang, T.-L.; Sheu, J.-H. Isolation of lobane and prenyleudesmane diterpenoids from the soft coral Lobophytum varium. Mar. Drugs 2020, 18, 223. [Google Scholar] [CrossRef]
  21. Raju, B.L.; Subbaraju, G.V.; Rao, Ch.B.; Trimurtulu, G. Two new oxygenated lobanes from a soft coral of Lobophytum species of the Andaman and Nicobar Coasts. J. Nat. Prod. 1993, 56, 961–966. [Google Scholar] [CrossRef]
  22. Coll, J.C.; Bowden, B.F.; König, G.M.; Braslau, R.; Price, I.R. Studies of Australian soft corals. xxxx.1 The natural products chemistry of alcyonacean soft corals with special reference to the genus Lobophytum. Bull. Soc. Chim. Belg. 1986, 95, 815–834. [Google Scholar] [CrossRef]
  23. Li, X.-L.; Kurtán, T.; Hu, J.-C.; Mándi, A.; Li, J.; Li, X.-W.; Guo, Y.-W. Structural and stereochemical studies of Laurokamurols A–C, uncommon bis-sesquiterpenoids from the Chinese Red Alga Laurencia okamurai Yamada. J. Agric. Food Chem. 2017, 65, 1550–1555. [Google Scholar] [CrossRef] [PubMed]
  24. Pescitelli, G. ECD exciton chirality method today: a modern tool for determining absolute configurations. Chirality 2022, 34, 333–363. [Google Scholar] [CrossRef] [PubMed]
  25. Huo, Z.-Q.; Zhu, F.; Zhang, X.-W.; Zhang, X.; Liang, H.-B.; Yao, J.-C.; Liu, Z.; Zhang, G.- M.; Yao, Q.-Q.; Qin, G.-F. Approaches to configuration determinations of flexible marine natural products: advances and prospects. Mar. Drugs 2022, 20, 333. [Google Scholar] [CrossRef] [PubMed]
  26. Sun, L.-L.; Li, W.-S.; Li, J.; Zhang, H.-Y.; Yao, L.-G.; Luo, H.; Guo, Y.-W.; Li, X.-W. Uncommon diterpenoids from the South China Sea soft coral Sinularia humilis and their stereochemistry. J. Org. Chem. 2021, 86, 3367–3376. [Google Scholar] [CrossRef] [PubMed]
  27. Li, S.-W.; Cuadrado, C.; Yao, L.-G.; Daranas, A.H.; Guo, Y.-W. Quantum mechanical–NMR-aided configuration and conformation of two unreported macrocycles isolated from the soft coral Lobophytum sp.: energy calculations versus coupling constants. Org. Lett. 2020, 22, 4093–4096. [Google Scholar] [CrossRef]
  28. Grimblat, N.; Zanardi, M.M.; Sarotti, A.M. Beyond DP4: an improved probability for the stereochemical assignment of isomeric compounds using quantum chemical calculations of NMR Shifts. J. Org. Chem. 2015, 80, 12526–12534. [Google Scholar] [CrossRef]
  29. Grimblat, N.; Gavín, J.A.; Daranas, A.H.; Sarotti, A.M. Combining the power of J coupling and DP4 analysis on stereochemical assignments: The J-DP4 Methods. Org. Lett. 2019, 21, 4003–4007. [Google Scholar] [CrossRef]
Figure 1. This is a figure. Schemes follow the same formatting.
Preprints 74450 g001
Figure 2. 1H-1H COSY, key HMBC and NOESY correlations of compounds 1, 4-10.
Preprints 74450 g002
Figure 3. 1H-1H COSY, key HMBC and NOESY correlations of compounds 1, 4-10.
Preprints 74450 g003
Figure 4. Comparison of experimental ECD spectrum (black) and DFT-predicted ECD spectra of 2-5. ECD spectra were predicted by means of time-dependent DFT calculations at the MPW1PW91/6-31G(d, p) level.
Preprints 74450 g004aPreprints 74450 g004b
Figure 5. Comparison of experimental ECD spectrum (black) and DFT-predicted ECD spectra of 7, 8, 11, 14, 15. ECD spectra were predicted by means of time-dependent DFT calculations at the MPW1PW91/6-31G(d, p) level.
Preprints 74450 g005
Table 1. The 1H NMR Data (600 MHz, δH in ppm, J in Hz) for compounds 1-5 in CDCl3.
No. 1 2 3 4 5
δH mult. (J Hz) δH mult. (J Hz) δH mult. (J Hz) δH mult. (J Hz) δH mult. (J Hz)
2 2.08, m 1.94, m 1.94, m 1.97, m 1.97, m
3a 1.68, m 1.43, m 1.43, m 1.50, m 1.50, m
3b 1.74, m 1.59, m 1.59, m 1.62, m 1.62, m
4 2.70, m 1.43, m 1.43, m 1.50, m 1.50, m
5a 1.38, m 1.44, m 1.44, m 1.33, m 1.33, m
5b 1.59, m 1.63, m 1.63, m 1.45, m 1.45, m
6a 1.44, m 1.44, m 1.44, m 1.46, m 1.46, m
6b 1.55, m
7 1.02, s 0.97, s 0.97, s 0.97, s 0.97, s
8 5.83, dd (17.2, 11.3) 5.80, dd (15.3, 10.9) 5.80, dd (15.3, 10.9) 5.80, dd (15.3, 10.9) 5.80, dd (15.3, 10.9)
9a 4.90, d (11.3) 4.88, d (10.9) 4.88, d (10.9) 4.88, d (10.9) 4.88, d (10.9)
9b 4.90, d (17.2) 4.89, d (15.3) 4.89, d (15.3) 4.89, d (15.3) 4.89, d (15.3)
10a 4.59, s 4.58, s 4.58, s 4.58, s 4.58, s
10b 4.81, s 4.81, s 4.81, s 4.81, s 4.81, s
12 1.71, s 1.70, s 1.70, s 1.70, s 1.70, s
14 1.76, s 1.29, s 1.29, s 1.35, s 1.35, s
15 5.77, d (10.9) 5.65, d (15.3) 5.65, d (15.3) 5.31, d (11.9) 5.31, d (11.9)
16 6.50, dd (15.2, 10.9) 6.43, dd (15.3, 10.9) 6.43, dd (15.3, 10.9) 6.19, t (11.9) 6.19, t (11.9)
17 5.70, d (15.2) 5.84, d (10.9) 5.84, d (10.9) 6.63, d (11.9) 6.63, d (11.9)
19 1.34, s 1.78, s 1.78, s 1.74, s 1.74, s
20 1.34, s 1.78, s 1.78, s 1.81, s 1.81, s
* Chemical shifts (ppm) refer to CHCl3 (δH 7.26). Assignments were deduced by analysis of 1D and 2D NMR spectra.
Table 2. The 1H NMR Data (600 MHz, δH in ppm, J in Hz) for compounds 6-10 in CDCl3.
No. 6 7 8 9 10
δH mult. (J Hz) δH mult. (J Hz) δH mult. (J Hz) δH mult. (J Hz) δH mult. (J Hz)
2 2.02, m 1.99, m 1.99, m 2.01, m 2.02, m
3a 1.57, m 1.57, m 1.57, m 1.61, m 1.53, m
3b 1.60, m
4 2.11, m 1.99, m 1.99, m 2.10, m 1.99, m
5a 1.48, m 1.47, m 1.47, m 1.44, m 1.50, m
5b 1.63, m 1.62, m 1.62, m 1.68, m 1.62, m
6a 1.48, m 1.45, m 1.45, m 1.46, m 1.48, m
6b 1.51, m 1.51, m 1.51, m 1.51, m 1.51, m
7 1.01, s 1.02, s 1.02, s 1.01, s 1.01, s
8 5.82, dd (17.6, 10.6) 5.81, dd (17.8, 10.5) 5.81, dd (17.8, 10.5) 5.81, dd (17.8, 10.5) 5.81, dd (17.8, 10.5)
9a 4.90, d (10.6) 4.90, d (10.5) 4.90, d (10.5) 4.90, d (10.5) 4.90, d (10.5)
9b 4.90, d (17.6) 4.91, d (17.8) 4.91, d (17.8) 4.90, d (17.8) 4.92, d (17.8)
10a 4.58, s 4.58, s 4.58, s 4.58, s 4.57, s
10b 4.82, s 4.82, s 4.82, s 4.83, s 4.83, s
12 1.70, s 1.70, s 1.70, s 1.71, s 1.71, s
14a 4.75, d (3.3) 4.99, s 4.99, s 4.54, m 4.95, s
14b 5.15, s 5.15, s 4.64, m 5.09, s
15 6.10, d (11.0) 4.62, m 4.62, m 5.31, m 3.31, d (2.2)
16 6.55, dd (15.2, 11.0) 5.66, dd (15.6, 6.5) 5.66, dd (15.6, 6.5) 5.50, m 2.73, ss (5.9, 2.2)
17 5.89, d (15.2) 5.90, d (15.6) 5.90, d (15.6) 5.15, m 2.63, d (5.9)
19 1.35, s 1.33, s 1.33, s 1.73, s 1.35, s
20 1.35, s 1.33, s 1.33, s 1.73, s 1.39, s
22 2.07 s
* Chemical shifts (ppm) refer to CHCl3 (δH 7.26). Assignments were deduced by analysis of 1D and 2D NMR spectra.
Table 3. The 13C NMR Data (125 MHz, δC in ppm) for compounds 1-10 in CDCl3.
No. 1 2 3 4 5 6 7 8 9 10
δC mult. δC mult. δC mult. δC mult. δC mult. δC mult. δC mult. δC mult. δC mult. δC mult.
1 39.7, C 39.9, C 39.9, C 39.9, C 39.9, C 39.9, C 39.9, C 39.9, C 39.9, C 39.8, C
2 52.6, CH 52.8, CH 52.8, CH 52.7, CH 52.8, CH 52.9, CH 53.0, CH 53.0, CH 52.6, CH 52.8, CH
3 31.9, CH2 28.2, CH2 28.5, CH2 28.1, CH2 28.5, CH2 33.3, CH2 34.3, CH2 34.7, CH2 33.1, CH2 33.9, CH2
4 40.5, CH 48.8, CH 48.9, CH 49.5, CH 49.6, CH 41.1, CH 40.9, CH 41.0, CH 37.2, CH 41.1, CH
5 26.0, CH2 22.7, CH2 22.4, CH2 22.6, CH2 22.2, CH2 27.2, CH2 28.7, CH2 28.2, CH2 27.2, CH2 27.1, CH2
6 39.8, CH2 40.0, CH2 39.9, CH2 40.0, CH2 40.0, CH2 40.0, CH2 40.2, CH2 40.1, CH2 39.7, CH2 39.8, CH2
7 16.8, CH3 16.7, CH3 16.7, CH3 16.7, CH3 16.7, CH3 16.8, CH3 16.8, CH3 16.8, CH3 16.7, CH3 16.7, CH3
8 150.4, CH 150.4, CH 150.4, CH 150.5, CH 150.5, CH 150.2, CH 150.3, CH 150.3, CH 150.1, CH 150.1, CH
9 110.1, CH2 110.0, CH2 110.0, CH2 110.0, CH2 110.0, CH2 110.2, CH2 110.1, CH2 110.1, CH2 110.2, CH2 110.3, CH2
10 112.3, CH2 112.2, CH2 112.2, CH2 112.2, CH2 112.2, CH2 112.4, CH2 112.3, CH2 112.4, CH2 112.4, CH2 112.4, CH2
11 147.7, C 148.1, C 148.0, C 148.1, C 148.0, C 147.6, C 147.6, C 147.6, C 147.5, C 147.4, C
12 25.0, CH3 24.9, CH3 24.9, CH3 24.8, CH3 24.9, CH3 24.9, CH3 24.9, CH3 24.9, CH3 24.9, CH3 25.0, CH3
13 143.1, C 75.0, C 75.1, C 76.7, C 76.7, C 140.2, C 156.0, C 156.0, C 145.7, C 149.2, C
14 20.2, CH3 26.2, CH3 26.2, CH3 27.4, CH3 27.5, CH3 61.6, CH2 109.1, CH2 108.9, CH2 75.3, CH2 109.4, CH2
15 124.6, CH 135.3, CH 135.2, CH 133.5, CH 133.4, CH 128.4, CH 75.0, CH 74.9, CH 120.9, CH 56.0, CH
16 122.0, CH 124.4, CH 124.4, CH 125.5, CH 125.5, CH 122.0, CH 128.1, CH 128.2, CH 83.1, CH 58.5, CH
17 139.3, CH 124.8, CH 124.8, CH 121.4, CH 121.5, CH 143.0, CH 139.6, CH 139.6, CH 125.7, CH 63.0, CH
18 71.1, C 137.0, C 137.0, C 137.3, C 137.3, C 71.1, C 70.8, C 70.8, C 135.5, C 58.6, C
19 30.2, CH3 18.5, CH3 18.5, CH3 17.8, CH3 17.8, CH3 29.9, CH3 29.9, CH3 29.9, CH3 18.2, CH3 19.7, CH3
20 30.2, CH3 26.0, CH3 26.1, CH3 26.7, CH3 26.7, CH3 29.9, CH3 30.0, CH3 29.9, CH3 26.0, CH3 24.7, CH3
21 171.3, C
22 21.2, CH3
* Chemical shifts (ppm) refer to CHCl3 (δC 77.2). Assignments were deduced by analysis of 1D and 2D NMR spectra.
Table 4. The 1H NMR Data (600 MHz, δH in ppm, J in Hz) for compounds 11-15 in CDCl3.
No. 11 12 13 14 15
δH mult. (J Hz) δH mult. (J Hz) δH mult. (J Hz) δH mult. (J Hz) δH mult. (J Hz)
1 2.02, m 2.27, m
2 1.82, m 1.25, m 3.10, m 1.79, m
3a 1.34, m 1.50, m1.50, m 1.84, m 1.71, m 1.52, m
3b 1.52, m 2.52, m 1.86, m 1.83, m
4 2.00, m 1.99, m 1.84, m 2.30, m 2.44, m
5a 1.50, m 1.24, m 1.53, m 1.72, m 1.64, m
5b 1.51, m 1.82, m 1.70, m 1.66, m
6a 1.28, m 1.21, m 1.21, m 2.12, m
6b 1.51, m 1.44, m 2.04, m 2.49, m
7 0.73, s 0.89, s 1.03, s 1.15, s
8a 1.28, m 1.10, m 3.49, m 1.52, m 4.70, s
8b 1.44, m 1.39, m 1.57, m 4.71. s
9a 1.59, m 1.55, m 1.53, m 1.55, m 1.72, m
9b 1.64, m 1.70, m 1.82, m 1.83, m
10a 2.00, m 1.37, m 1.97, m 2.30, m 1.72, m
10b 2.31, m 1.79, m 2.17, m 2.39, m 1.76, m
12a 4.42 s 1.11, s 1.59, s 4.75, s 1.18, s
12b 4.70, s 4.87, s
14 1.80, s 1.79, s 1.73, s 1.77, s 1.75, s
15 5.88, d (10.8) 5.87, d (10.8) 5.33, d (8.8) 5.87, d (10.7) 5.90, d (10.7)
16 6.50, dd (15.3, 10.8) 6.48, dd (15.3, 10.8) 4.26, dd (8.8, 7.8) 6.46, dd (15.3, 10.7) 6.45, dd (15.3, 10.7)
17 5.75, d (15.3) 5.75, d (15.3) 2.84, d (7.8) 5.75, d (15.3) 5.75, d (15.3)
19 1.36, s 1.35, s 1.33, s 1.36, s 1.35, s
20 1.36, s 1.35, s 1.35, s 1.36, s 1.35, s
* Chemical shifts (ppm) refer to CHCl3 (δH 7.26). Assignments were deduced by analysis of 1D and 2D NMR spectra.
Table 5. The 13C NMR Data (125 MHz, δC in ppm) for compounds 11-15 in CDCl3.
No. 11 12 13 14 15
δC mult. δC mult. δC mult. δC mult. δC mult.
1 36.1, C 34.7, C 39.6, C 48.6, CH 48.4, CH
2 50.0, CH 55.0, CH 133.4, C 45.3, CH 52.7, CH
3 29.4, CH2 26.7, CH2 30.8, CH2 26.4, CH2 31.5, CH2
4 48.0, CH 48.5, CH 47.7, CH 44.0, CH 45.6, CH
5 26.7, CH2 26.0, CH2 27.3, CH2 40.7, CH2 31.2, CH2
6 41.3, CH2 44.7, CH2 38.9, CH2 81.8, C 37.0, CH2
7 16.5, CH3 18.9, CH3 17.5, CH3 24.1, CH3 153.4, C
8 42.1, CH2 41.2, CH2 78.5, CH 29.0, CH2 107.2, CH2
9 23.6, CH2 20.3, CH2 27.3, CH2 30.0, CH2 26.4, CH2
10 37.0, CH2 43.5, CH2 32.1, CH2 34.8, CH2 40.8, CH2
11 151.1, C 72.4, C 124.4, C 151.5, C 81.1, C
12 105.6, CH2 22.9, CH3 19.2, CH3 109.3, CH2 24.0, CH3
13 144.1, C 143.8, C 145.9, C 143.2, C 143.9, C
14 15.4, CH3 15.5, CH3 15.9, CH3 16.1, CH3 14.7, CH3
15 122.4, CH 122.5, CH 120.9, CH 122.8, CH 123.0, CH
16 123.4, CH 123.3, CH 67.9, CH 123.4, CH 123.2, CH
17 139.3, CH 139.3, CH 67.6, CH 139.5, CH 139.5, CH
18 71.1, C 71.1, C 60.0, C 71.1, C 71.1, C
19 30.1, CH3 30.1, CH3 19.7, CH3 30.1, CH3 30.1, CH3
20 30.1, CH3 30.1, CH3 25.1, CH3 30.1, CH3 30.1, CH3
* Chemical shifts (ppm) refer to CHCl3 (δC 77.2). Assignments were deduced by analysis of 1D and 2D NMR spectra.
Table 6. Antibacterial activities on fish pathogenic bacteria of compounds 1-6, 10-11, 16-18.
Compd. MIC (μg/mL)
Streptococcus parauberis Lactococcus garvieae Streptococcus parauberis Phoyobacterium damselae Aeromonas salmonicida
FP KSP28 MP5245 SP0F3K FP2244 AS42
1 14.4 28.8 7.2 7.2 NA
2 7.2 NA 28.8 14.4 NA
3 7.2 NA NA 14.4 28.8
4 7.2 0.225 NA 28.8 NA
5 7.2 28.8 NA 28.8 NA
6 17.3 NA 17.3 17.3 NA
10 15.1 NA NA NA NA
11 0.9 14.4 NA 7.2 28.8
16 7.2 14.4 3.6 7.2 NA
17 NA NA NA NA NA
18 7.6 NA NA 15.2 NA
Tetr 3.01 0.38 >24.05 0.02 6.11
Oxy 1.55 0.19 12.42 0.02 0.39
Lev 1.24 0.62 1.24 0.02 0.31
AMP 4.64 0.58 0.58 0.02 >18.57
* Tetr, Oxy, Lev and AMP were used as positive control; NA = not active at 30 μg/mL.
Disclaimer/Publisher’s Note: The statements, opinions and data contained in all publications are solely those of the individual author(s) and contributor(s) and not of MDPI and/or the editor(s). MDPI and/or the editor(s) disclaim responsibility for any injury to people or property resulting from any ideas, methods, instructions or products referred to in the content.
Copyright: This open access article is published under a Creative Commons CC BY 4.0 license, which permit the free download, distribution, and reuse, provided that the author and preprint are cited in any reuse.
Prerpints.org logo

Preprints.org is a free preprint server supported by MDPI in Basel, Switzerland.

Subscribe

© 2024 MDPI (Basel, Switzerland) unless otherwise stated