Submitted:
23 May 2023
Posted:
24 May 2023
You are already at the latest version
Abstract
Keywords:
1. Introduction
2. Data and methods
2.1. Data sources
2.1.1. Remote sensing data
2.3. Methods
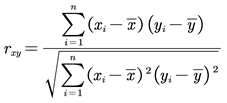


3. Results
3.1. Trends of correlations between vegetation activity and temperature factors
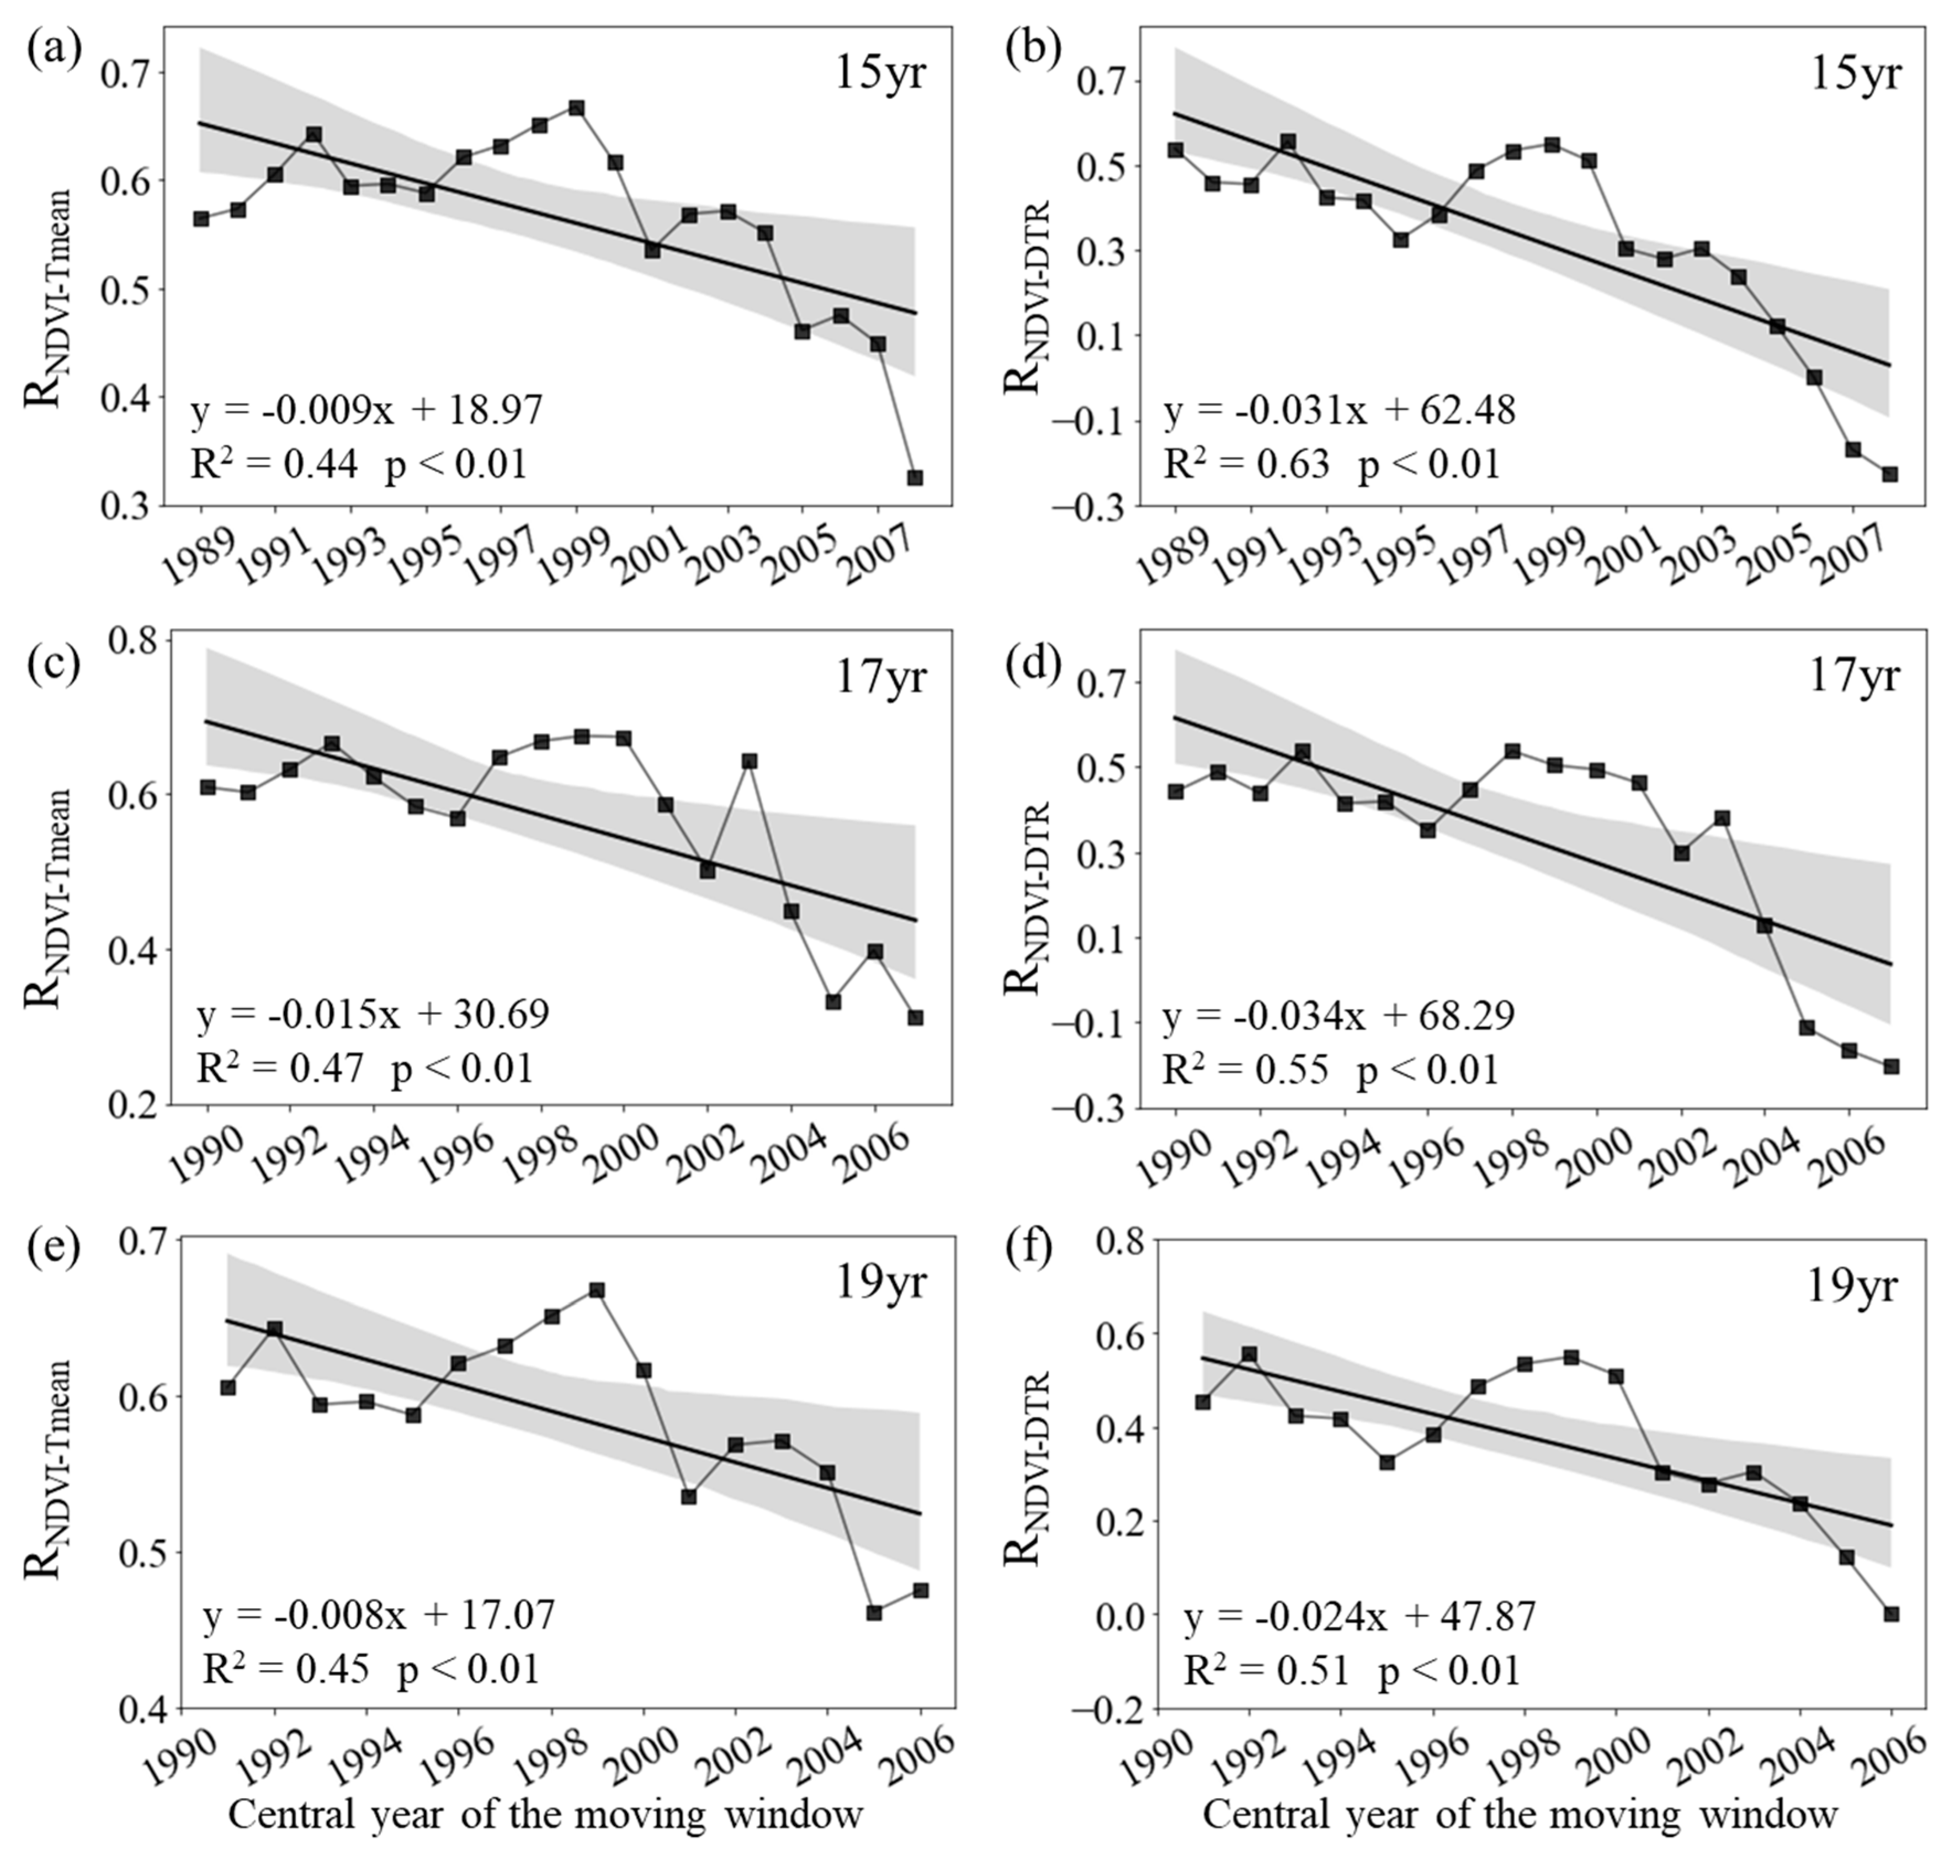
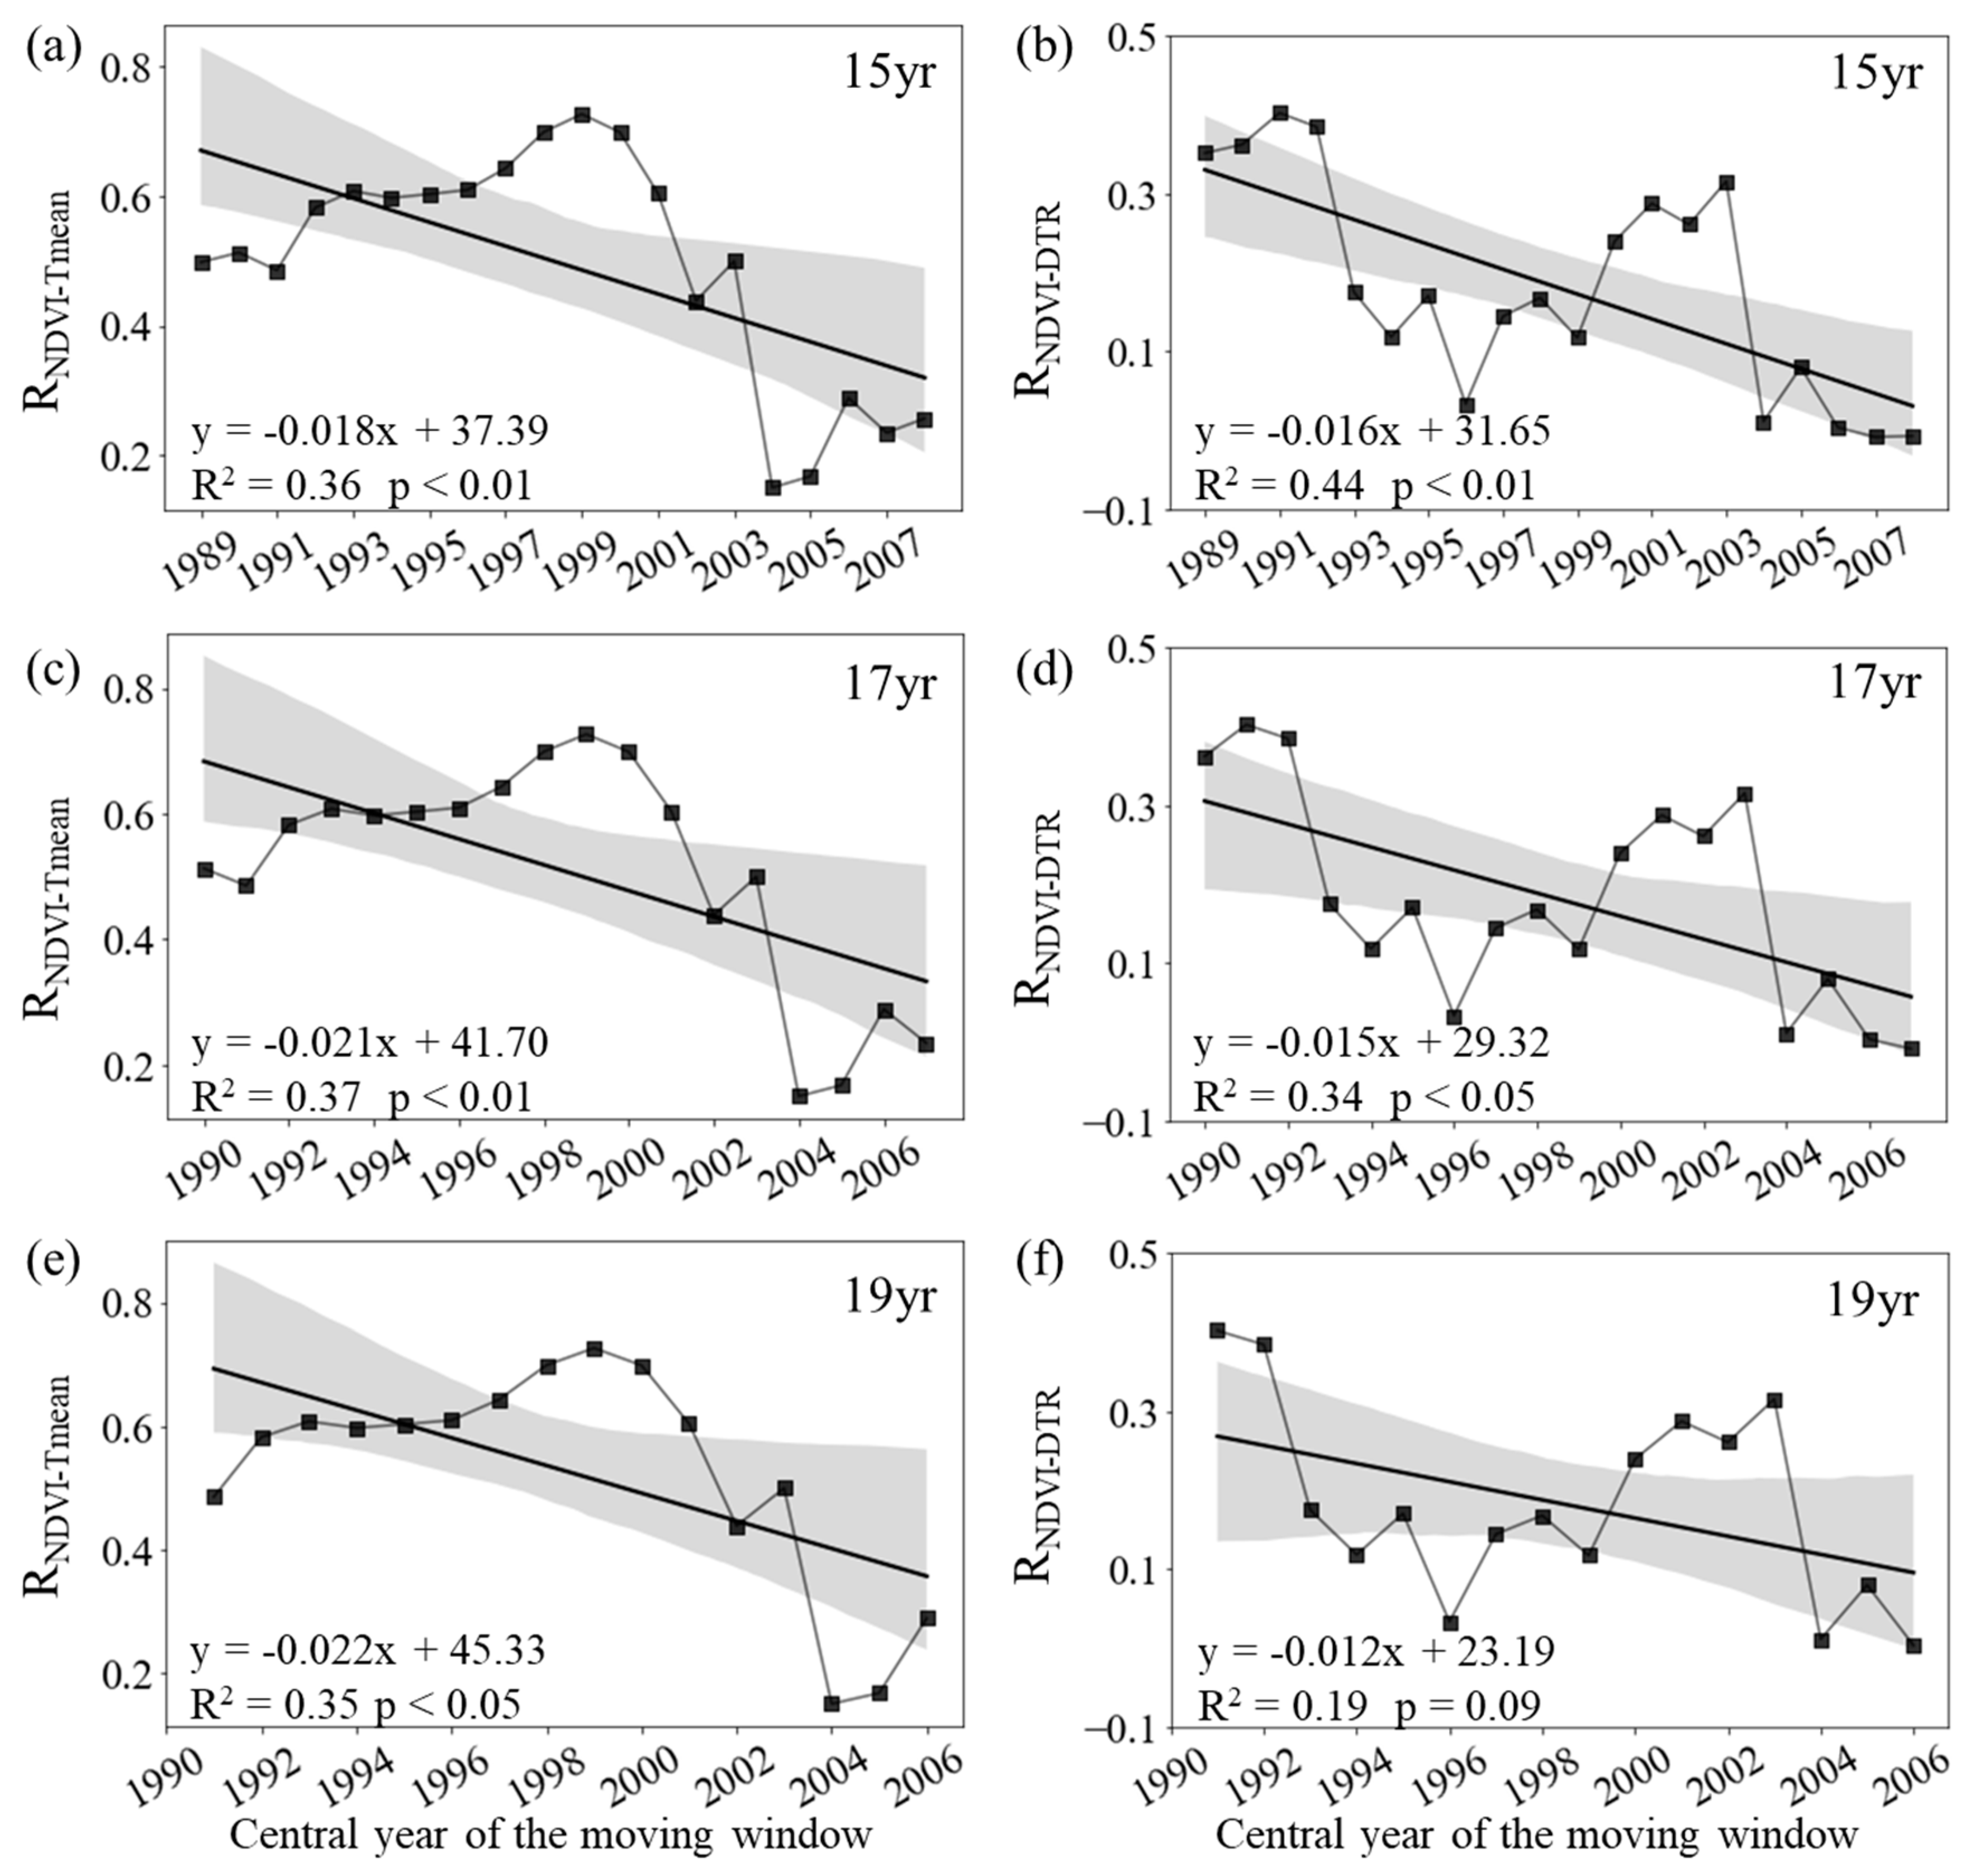
3.1.1. Inter-annual changes in RNDVI-Tmean and RNDVI-DTR
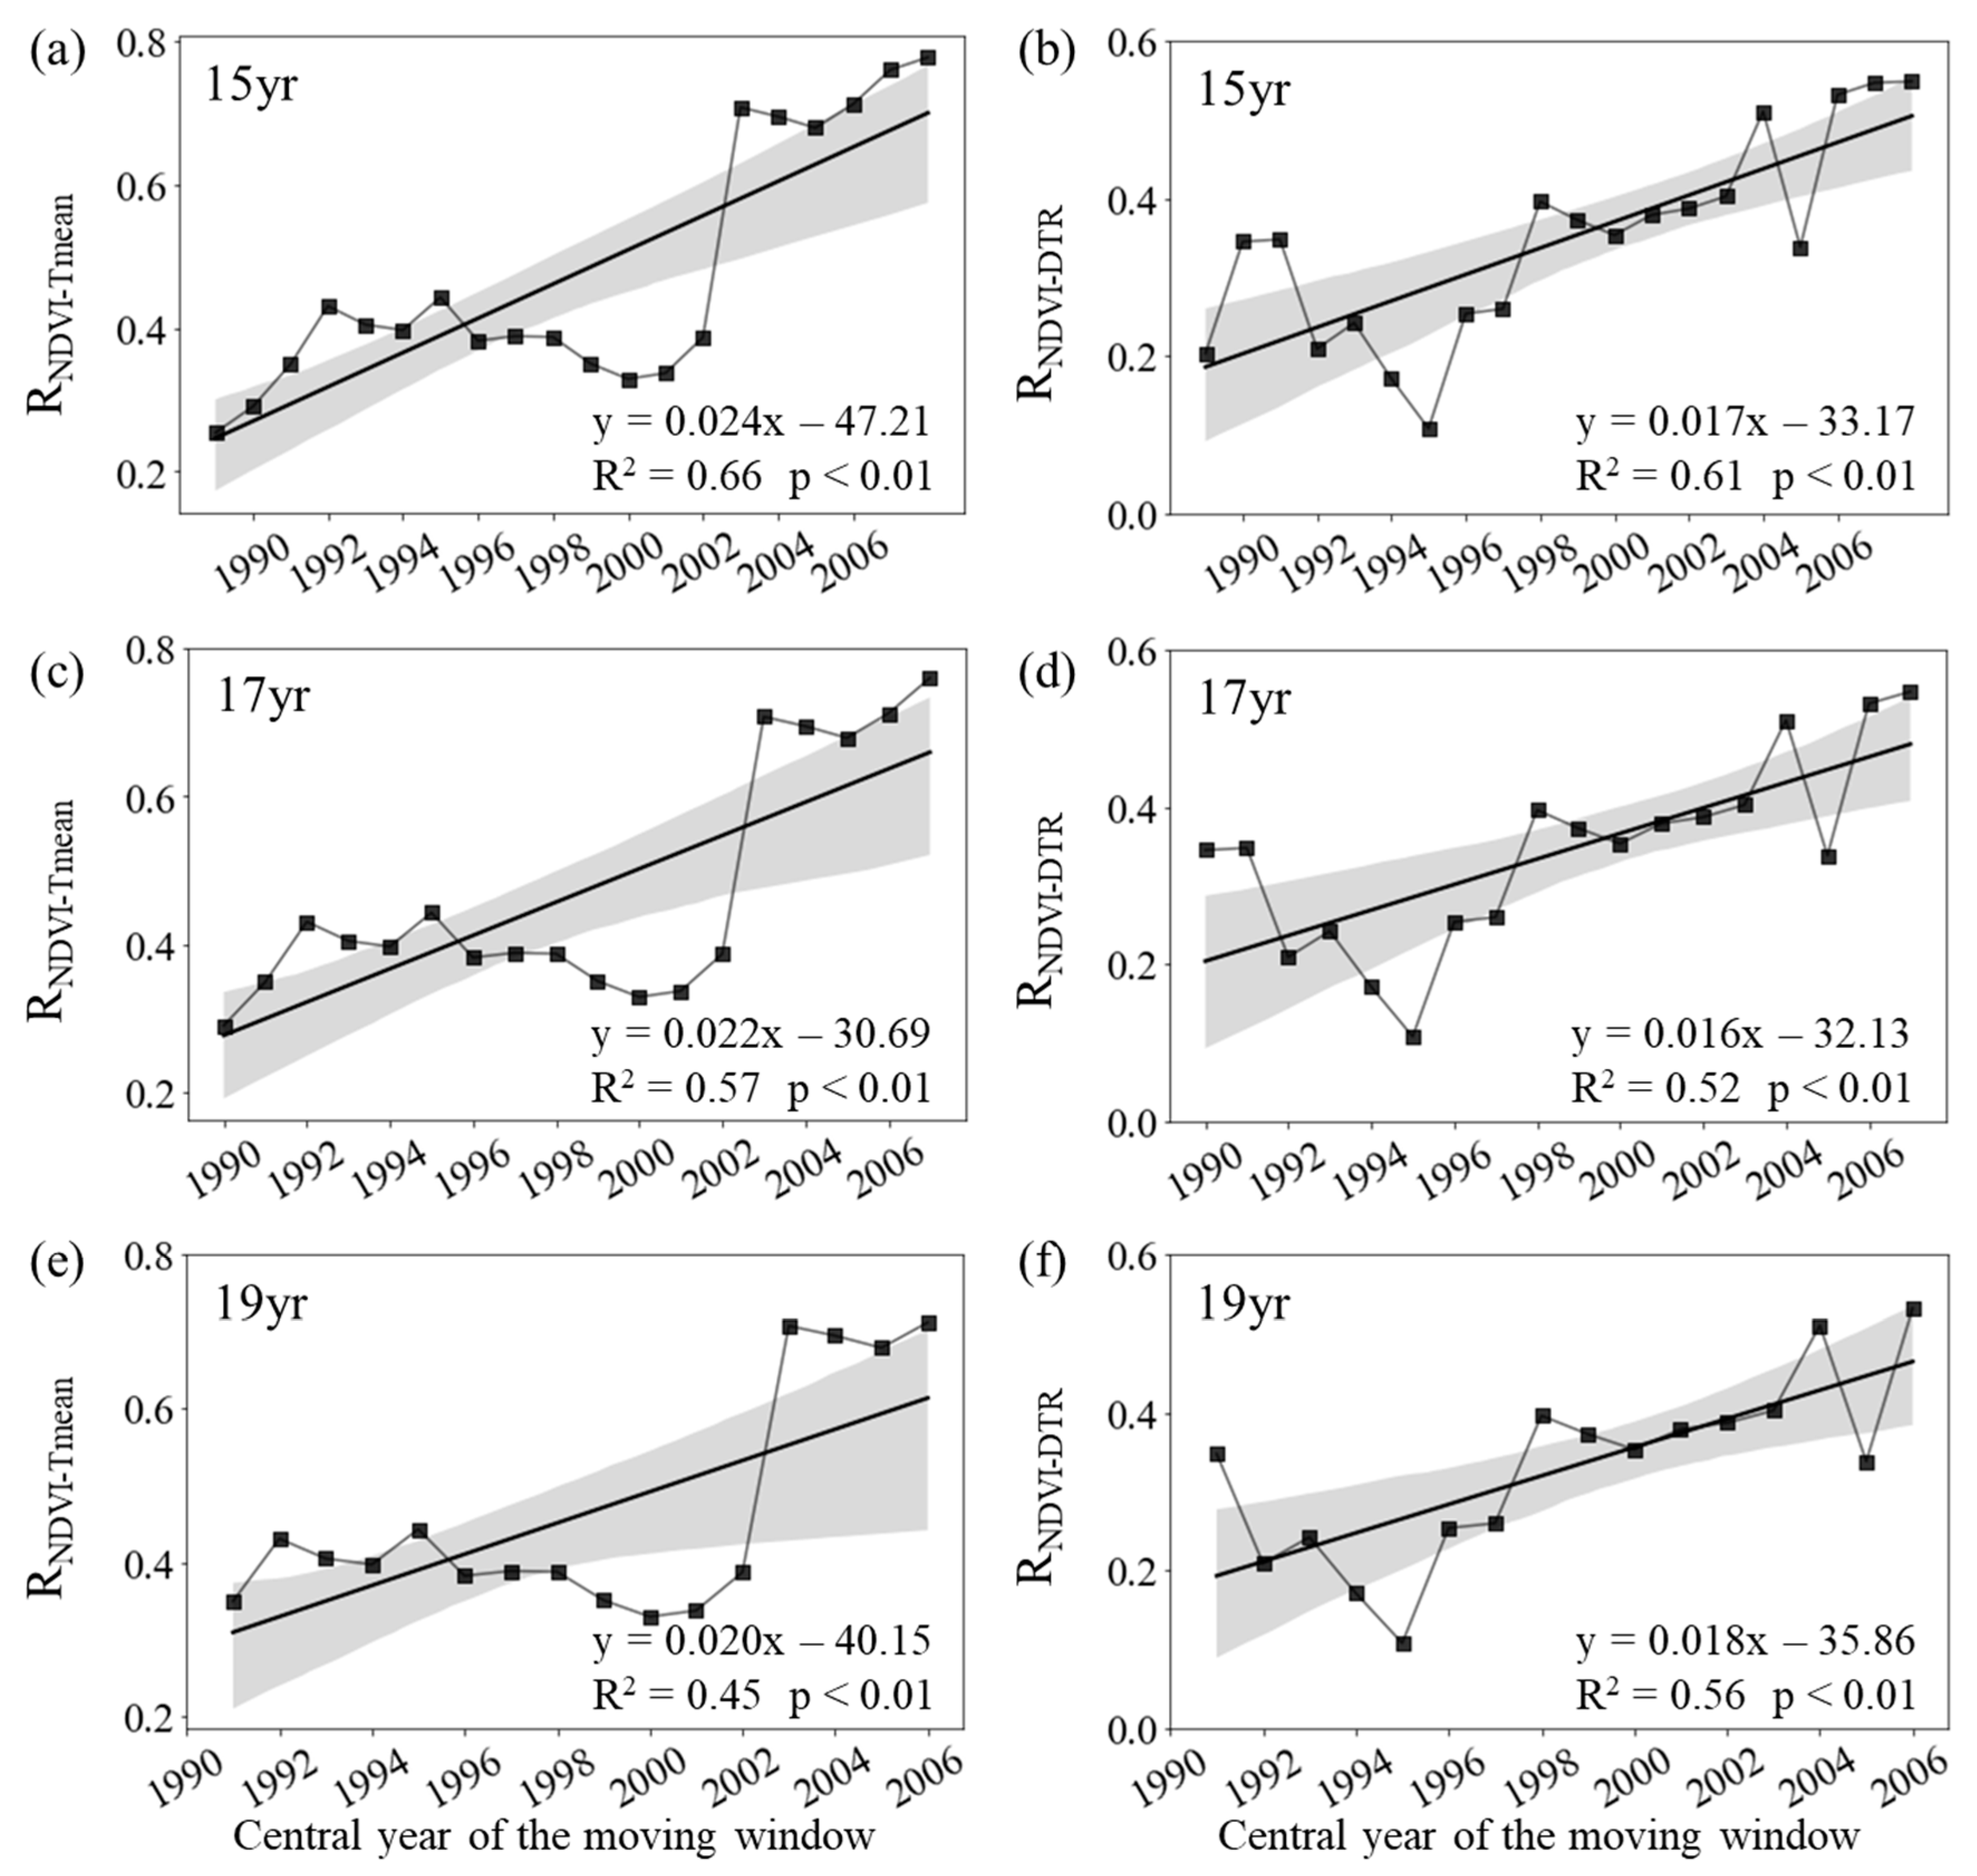
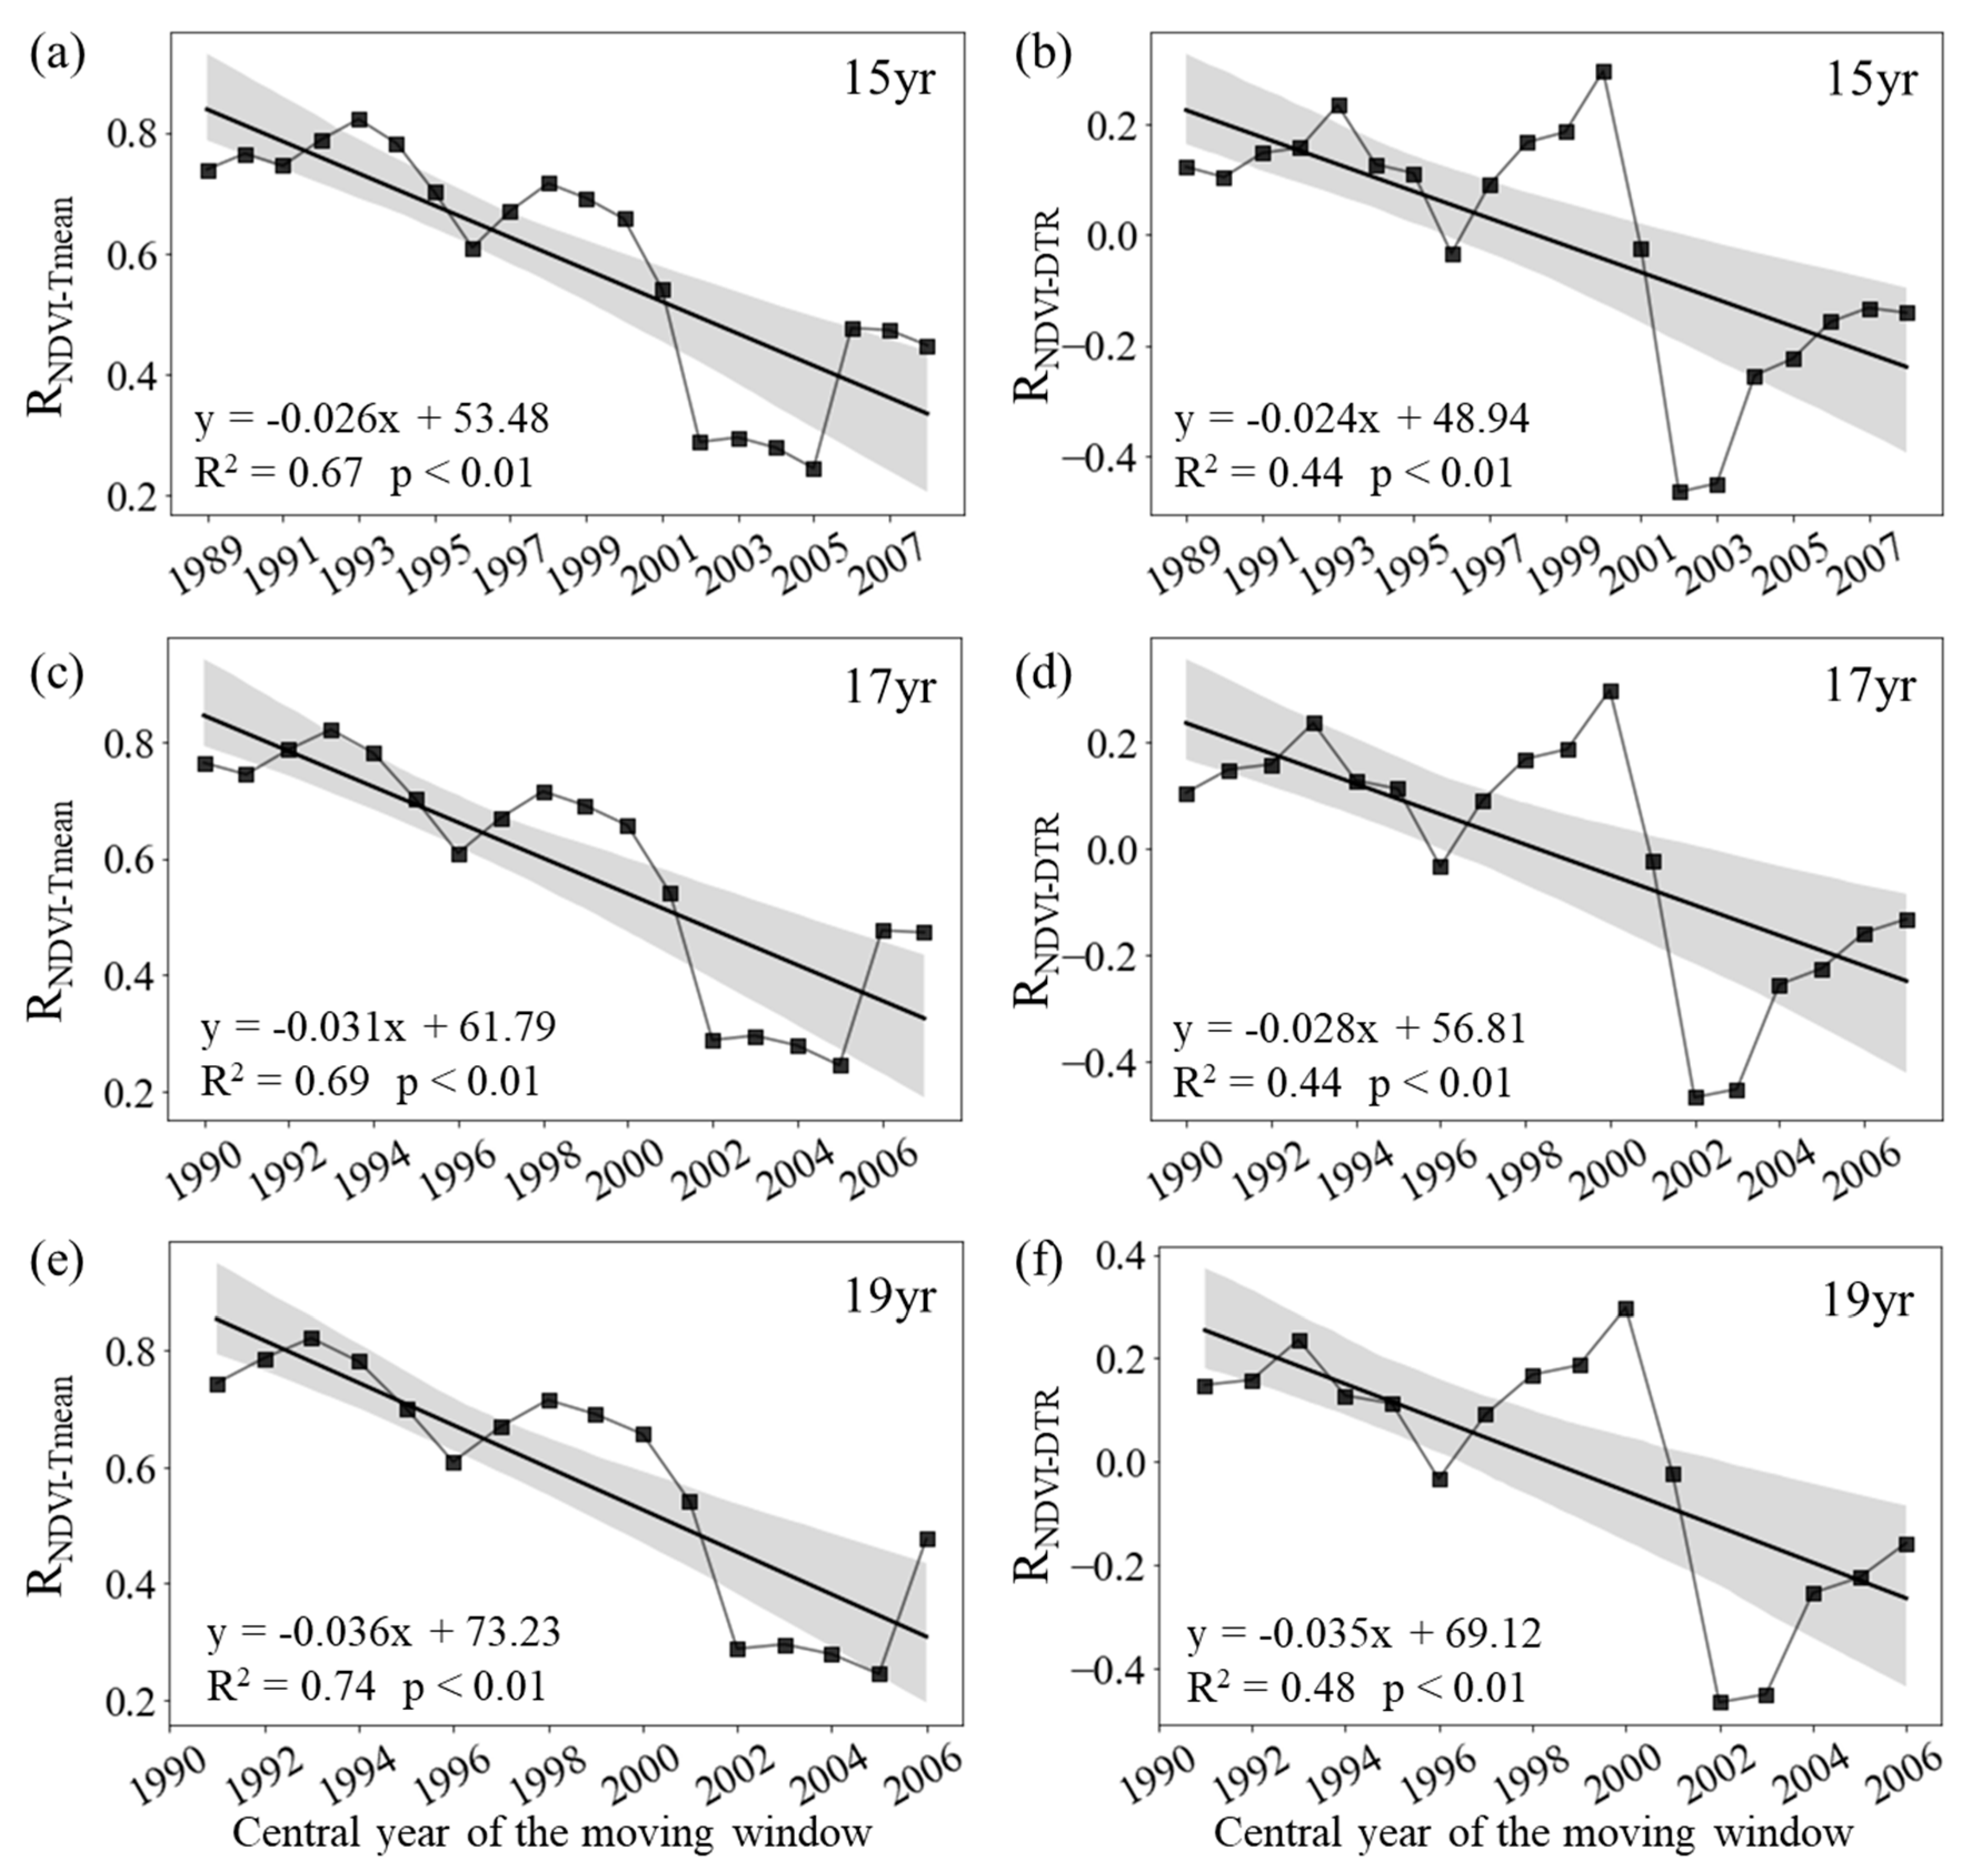
3.1.2. Intra-annual changes in RNDVI-Tmean and RNDVI-DTR
3.2. Spatial patterns of the trends in the correlations between vegetation activity and temperature factors
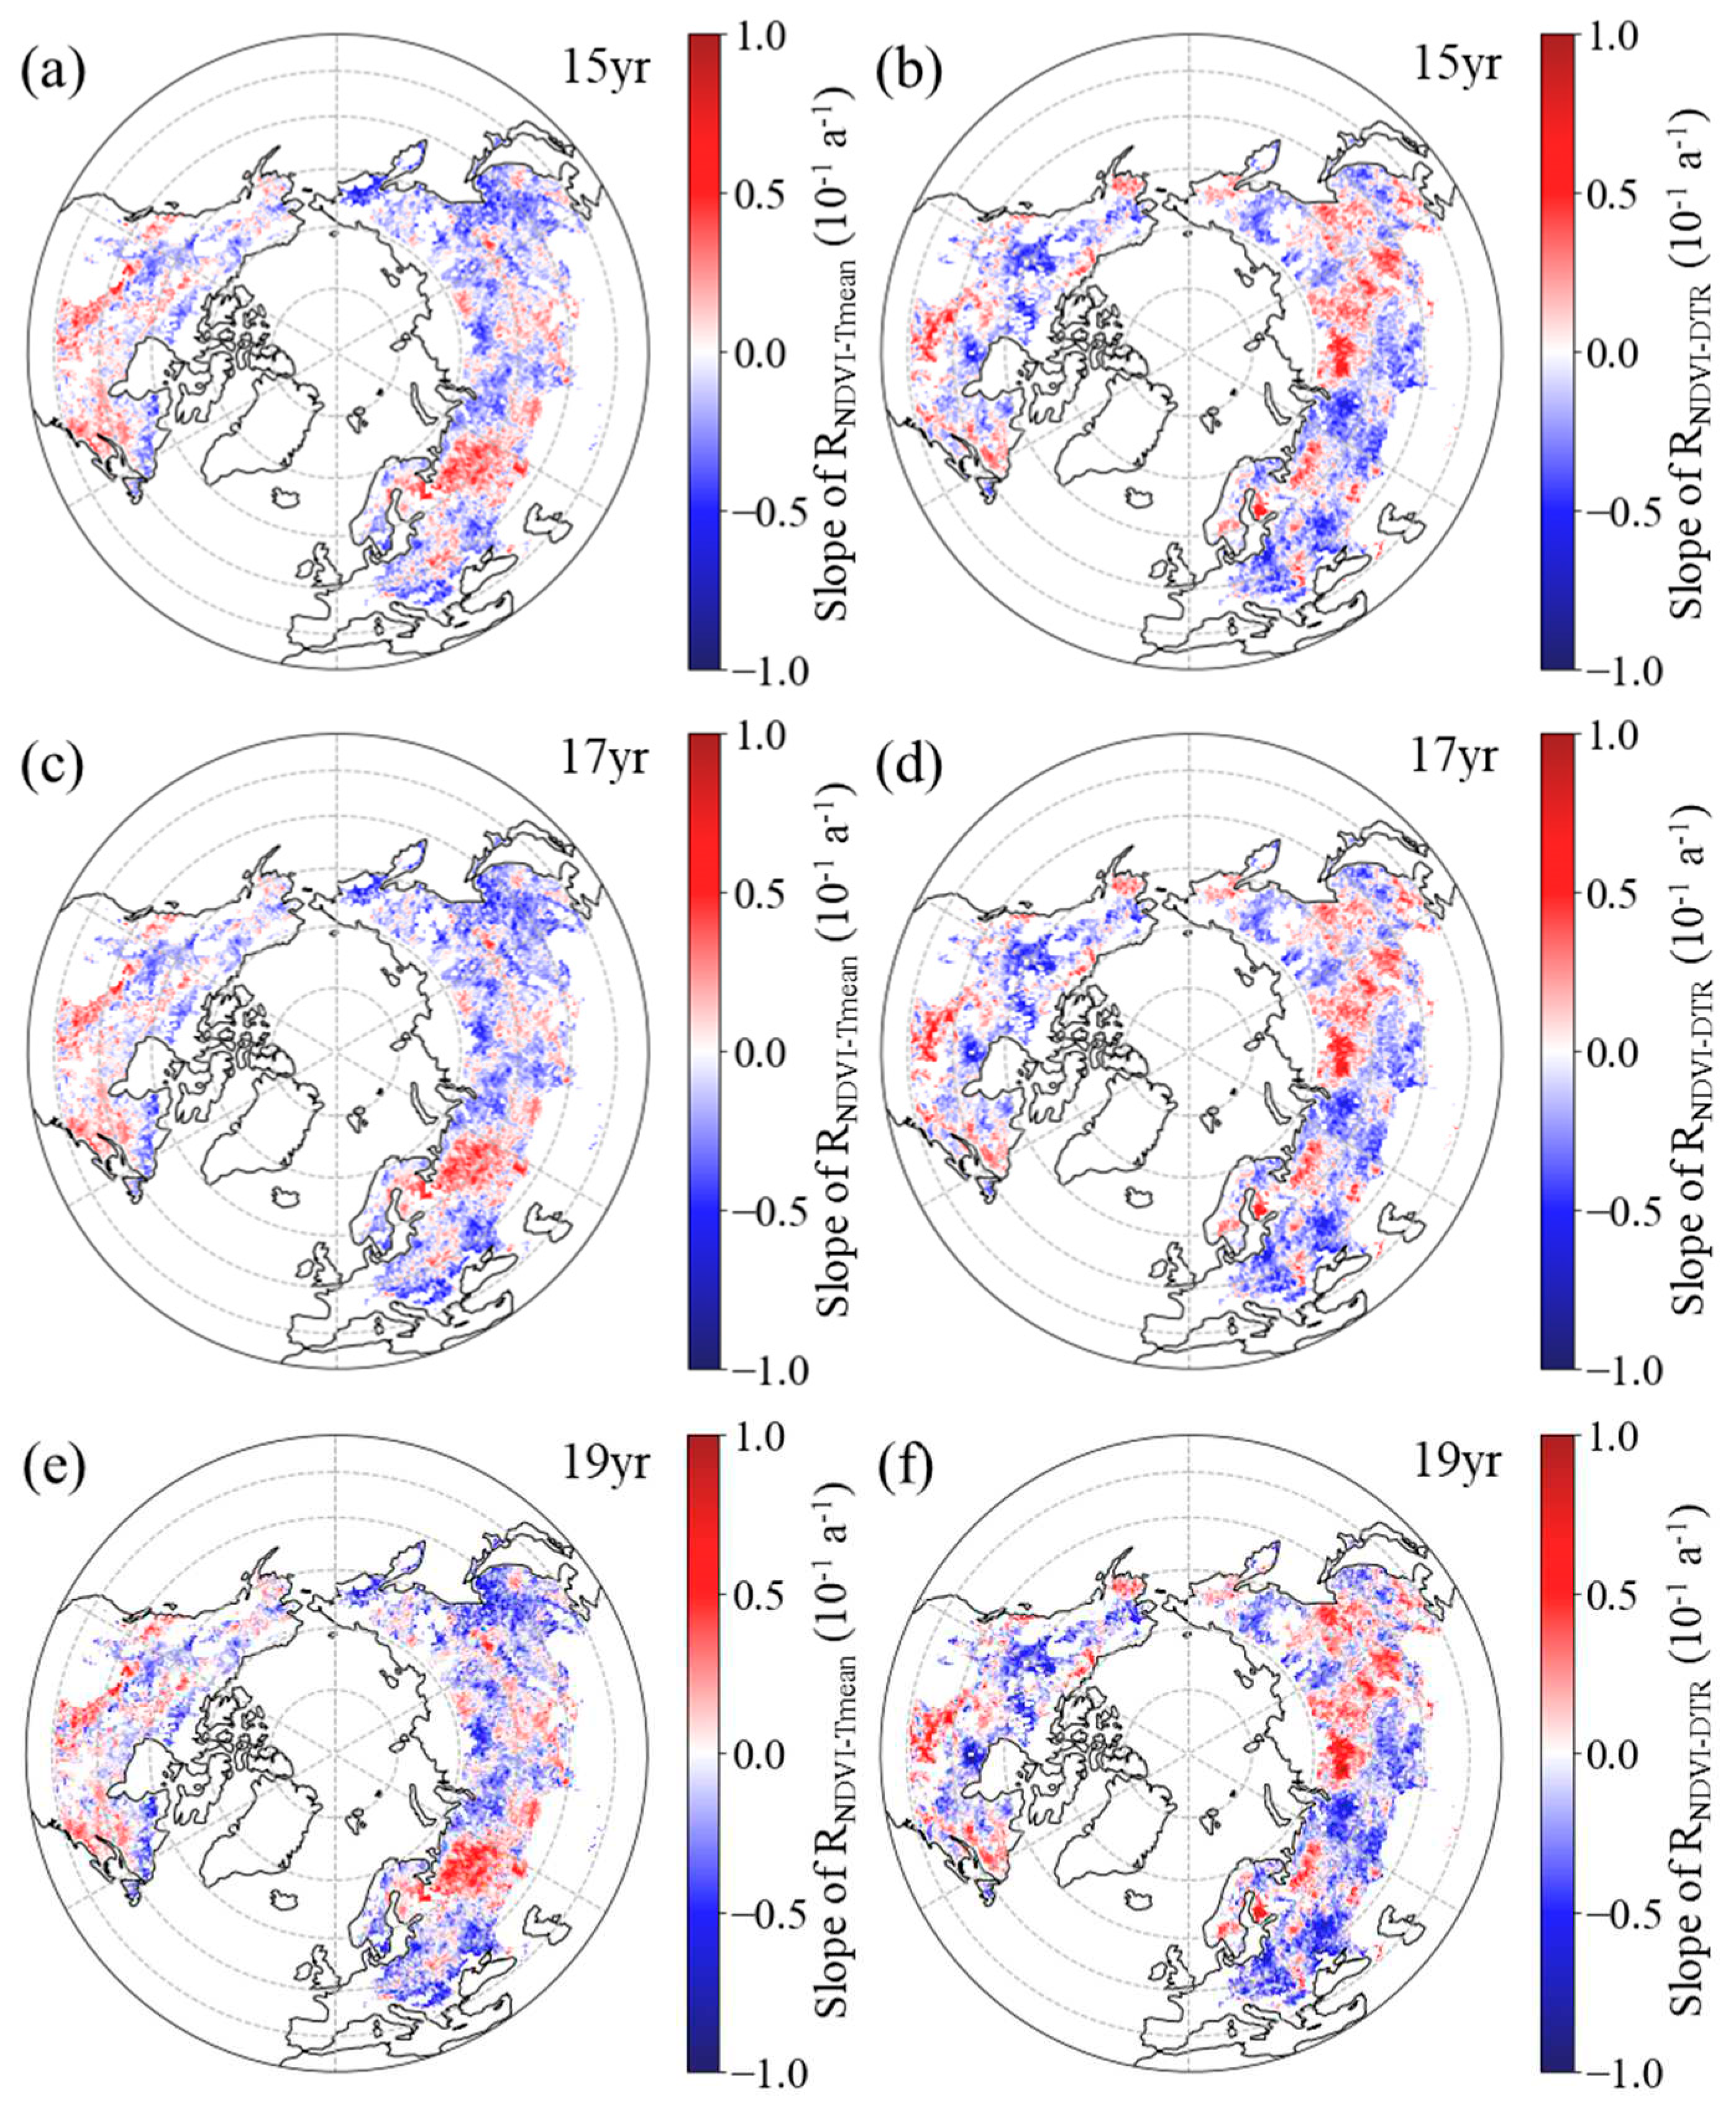
3.2.1. Inter-annual patterns of RNDVI-Tmean and RNDVI-DTR
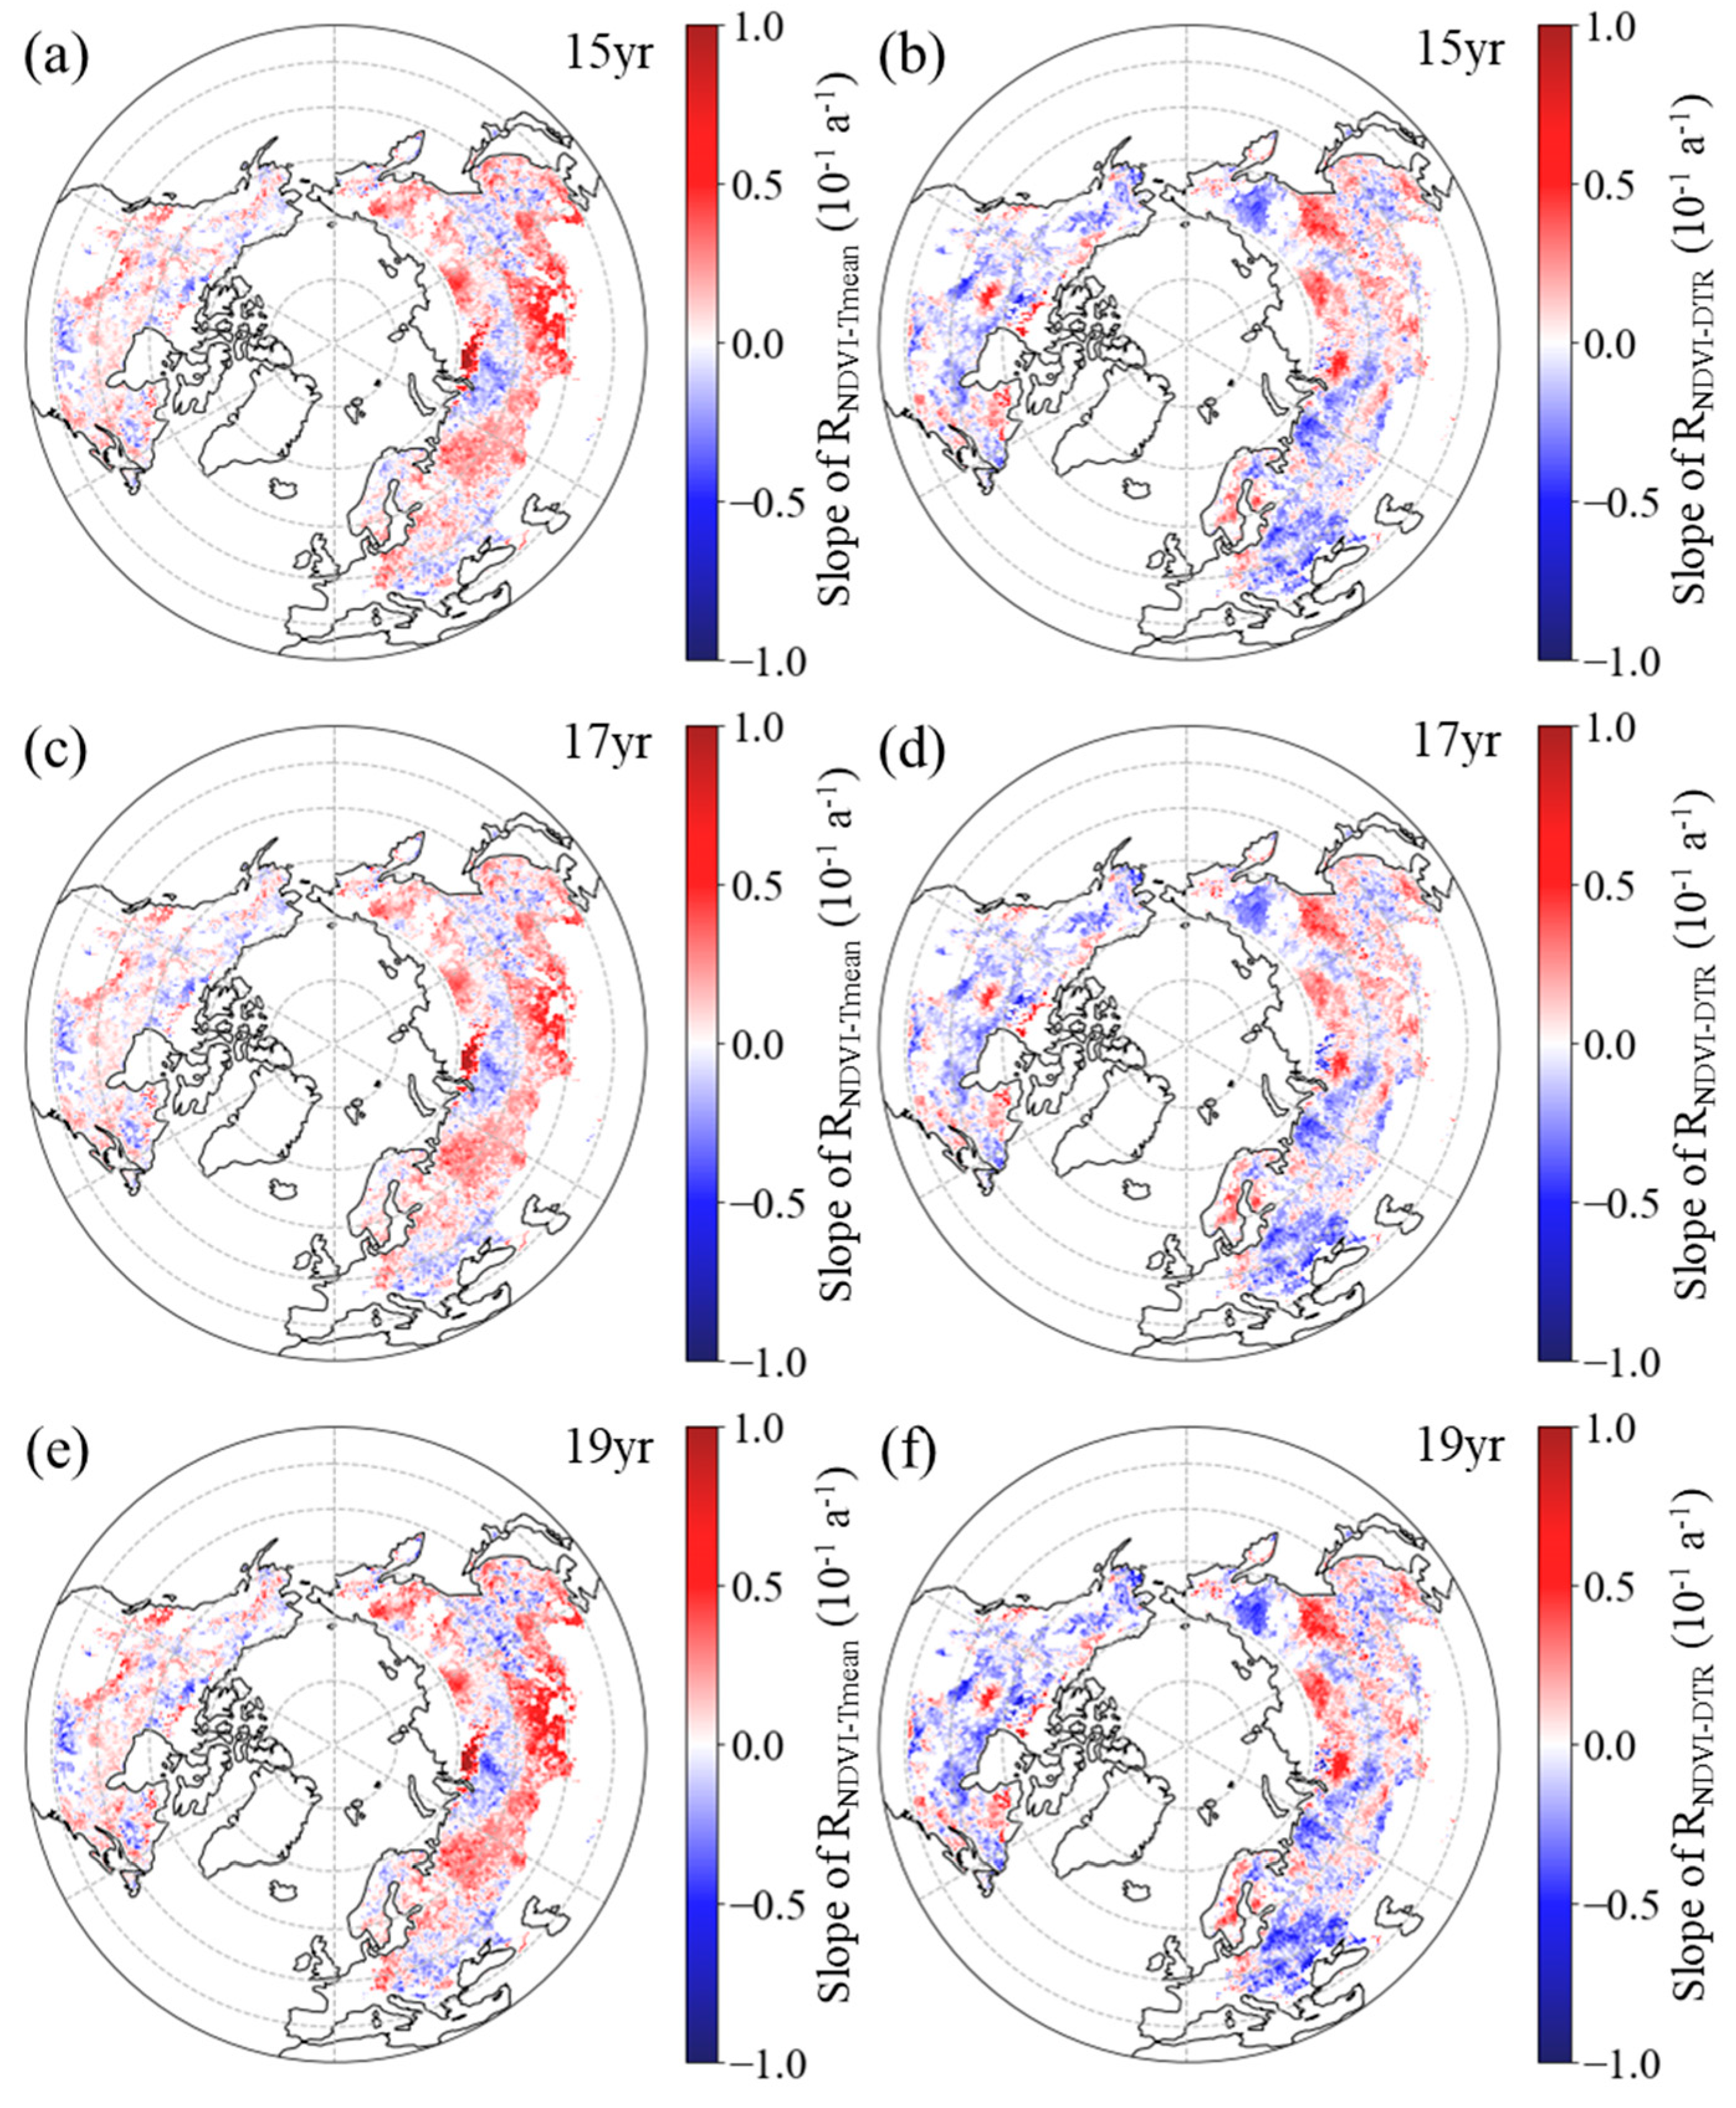
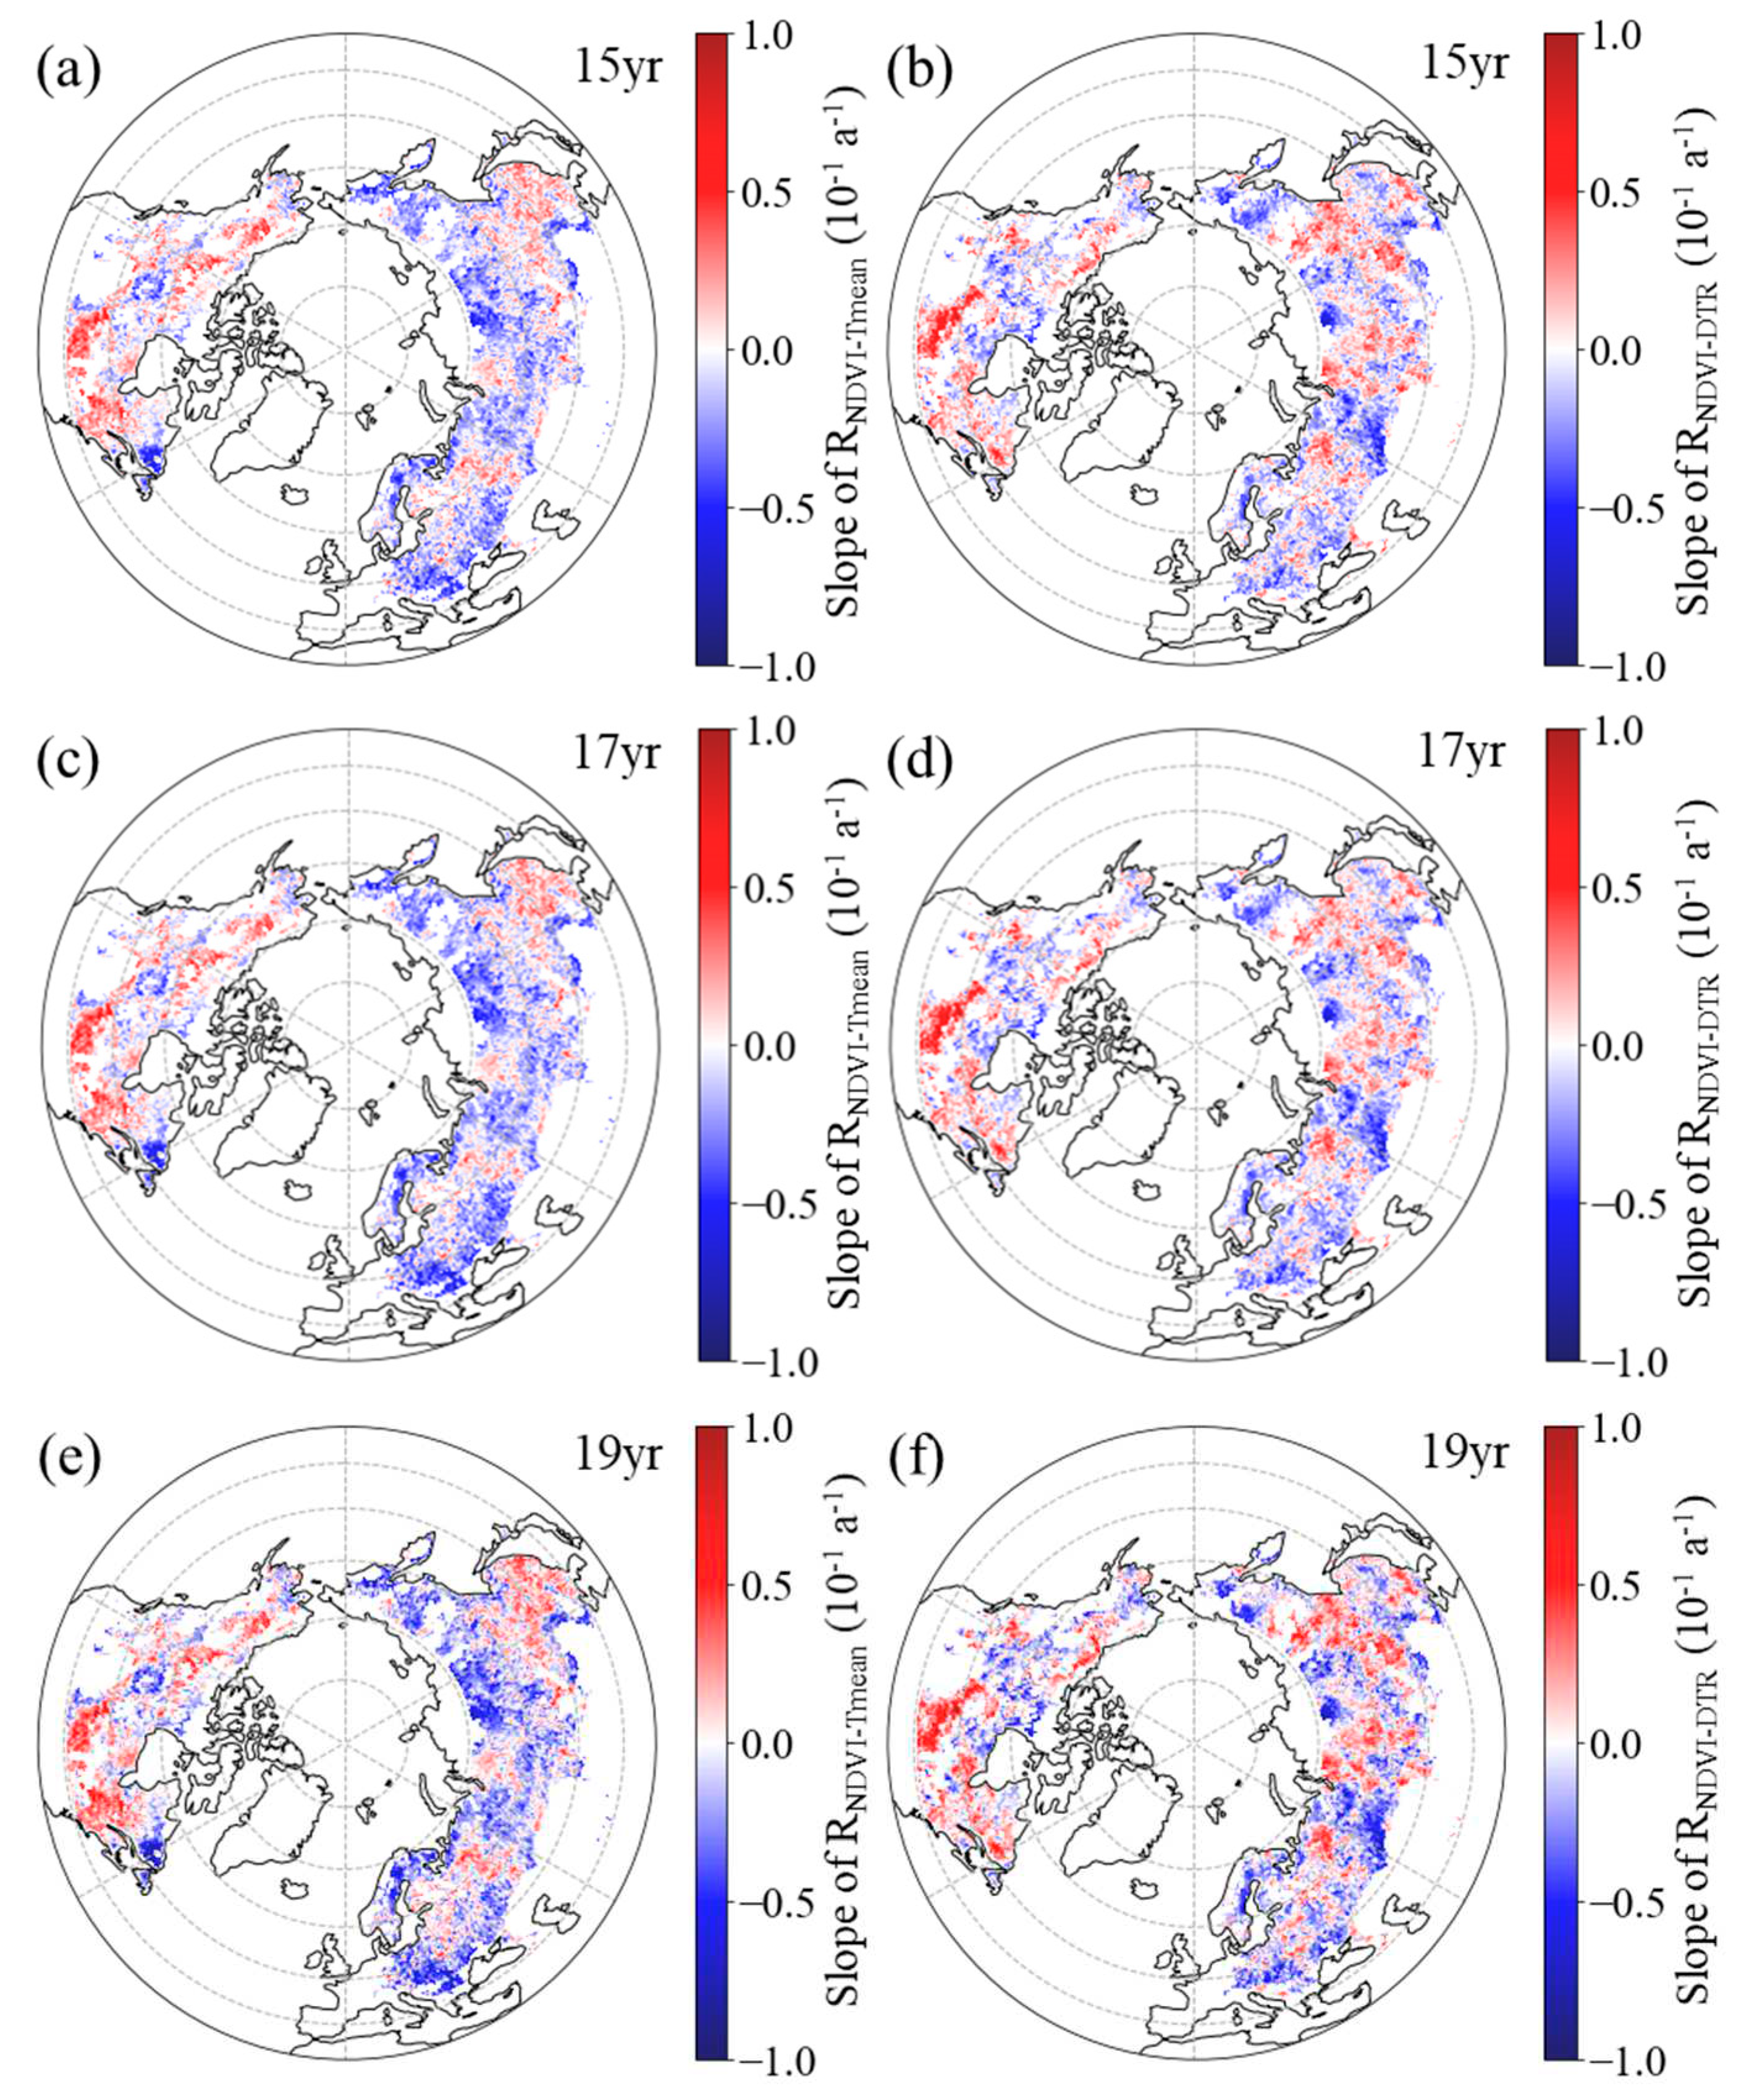
3.2.2. Intra-annual patterns of RNDVI-Tmean and RNDVI-DTR
4. Discussion
5. Conclusions
Author Contributions
Acknowledgments
Conflicts of Interest
References
- Bonan, G.B. , Pollard, D., Thompson, S.L. Effects of boreal forest vegetation on global climate. Nature 1992, 359, 716–718. [Google Scholar]
- Chen, X.; Yang, Y. Observed earlier start of the growing season from middle to high latitudes across the Northern Hemisphere snow-covered landmass for the period 2001–2014. Environmental Research Letters 2020, 15. [Google Scholar] [CrossRef]
- Cong, N.; Shen, M.; Yang, W.; Yang, Z.; Zhang, G.; Piao, S. Varying responses of vegetation activity to climate changes on the Tibetan Plateau grassland. Int J Biometeorol 2017, 61, 1433–1444. [Google Scholar] [CrossRef] [PubMed]
- Deng, G.; Zhang, H.; Zhao, J.; Guo, X.; Biniyaz, E.; Zhao, H.; Guo, D.; Wu, R.; Li, H. Diverse variations in middle and high latitudes of the Northern Hemisphere spring phenology sensitivity to diurnal temperature during 1982–2015. International Journal of Climatology 2022, 42, 9385–9403. [Google Scholar] [CrossRef]
- Du, Z.; Liu, X.; Wu, Z.; Zhang, H.; Zhao, J. Responses of Forest Net Primary Productivity to Climatic Factors in China during 1982-2015. Plants (Basel) 2022, 11. [Google Scholar] [CrossRef] [PubMed]
- Edith, B.A.I.; Xue, B. A review of influences of land use and land cover change on ecosystems. Chinese Journal of Plant Ecology 2020, 44, 543–552. [Google Scholar] [CrossRef]
- Epstein, H.E.; Myers-Smith, I.; Walker, D.A. Recent dynamics of arctic and sub-arctic vegetation. Environmental Research Letters 2013, 8. [Google Scholar] [CrossRef]
- Gauthier, S.; Bernier, P.; Kuuluvainen, T.; Shvidenko, A.Z.; Schepaschenko, D.G. Boreal forest health and global change. Science 2015, 349, 819–822. [Google Scholar] [CrossRef]
- Harris, I.; Osborn, T.J.; Jones, P.; Lister, D. Version 4 of the CRU TS monthly high-resolution gridded multivariate climate dataset. Sci Data 2020, 7, 109. [Google Scholar] [CrossRef]
- Huang, M.; Piao, S.; Janssens, I.A.; Zhu, Z.; Wang, T.; Wu, D.; Ciais, P.; Myneni, R.B.; Peaucelle, M.; Peng, S.; et al. Velocity of change in vegetation productivity over northern high latitudes. Nat Ecol Evol 2017, 1, 1649–1654. [Google Scholar] [CrossRef]
- Huang, Y.; Jiang, N.; Shen, M.; Guo, L. Effect of preseason diurnal temperature range on the start of vegetation growing season in the Northern Hemisphere. Ecological Indicators 2020, 112. [Google Scholar] [CrossRef]
- Kurz, W.A.; Dymond, C.C.; Stinson, G.; Rampley, G.J.; Neilson, E.T.; Carroll, A.L.; Ebata, T.; Safranyik, L. Mountain pine beetle and forest carbon feedback to climate change. Nature 2008, 452, 987–990. [Google Scholar] [CrossRef] [PubMed]
- Lian, X.; Piao, S.; Chen, A.; Wang, K.; Li, X.; Buermann, W.; Huntingford, C.; Penuelas, J.; Xu, H.; Myneni, R.B. Seasonal biological carryover dominates northern vegetation growth. Nat Commun 2021, 12, 983. [Google Scholar] [CrossRef]
- Peng, S.; Piao, S.; Ciais, P.; Myneni, R.B.; Chen, A.; Chevallier, F.; Dolman, A.J.; Janssens, I.A.; Penuelas, J.; Zhang, G.; et al. Asymmetric effects of daytime and night-time warming on Northern Hemisphere vegetation. Nature 2013, 501, 88–92. [Google Scholar] [CrossRef] [PubMed]
- Piao, S.; Friedlingstein, P.; Ciais, P.; Viovy, N.; Demarty, J. Growing season extension and its impact on terrestrial carbon cycle in the Northern Hemisphere over the past 2 decades. Global Biogeochemical Cycles 2007, 21, GB3018. [Google Scholar] [CrossRef]
- Piao, S.; Nan, H.; Huntingford, C.; Ciais, P.; Friedlingstein, P.; Sitch, S.; Peng, S.; Ahlstrom, A.; Canadell, J.G.; Cong, N.; et al. Evidence for a weakening relationship between interannual temperature variability and northern vegetation activity. Nat Commun 2014, 5, 5018. [Google Scholar] [CrossRef] [PubMed]
- Piao, S.; Wang, X.; Ciais, P.; Zhu, B.; Wang, T.A.O.; Liu, J.I.E. Changes in satellite-derived vegetation growth trend in temperate and boreal Eurasia from 1982 to 2006. Global Change Biology 2011, 17, 3228–3239. [Google Scholar] [CrossRef]
- Qin, M.; Jin, N.; Zhao, J.; Feng, M.; Wang, C. Dynamics of the Response of Vegetation Activity to Air Temperature Change in Temperate China. Atmosphere 2022, 13. [Google Scholar] [CrossRef]
- Shen, X.; Liu, B.; Henderson, M.; Wang, L.; Wu, Z.; Wu, H.; Jiang, M.; Lu, X. Asymmetric effects of daytime and nighttime warming on spring phenology in the temperate grasslands of China. Agricultural and Forest Meteorology 2018, 259, 240–249. [Google Scholar] [CrossRef]
- Sulla-Menashe, D.; Woodcock, C.E.; Friedl, M.A. Canadian boreal forest greening and browning trends: an analysis of biogeographic patterns and the relative roles of disturbance versus climate drivers. Environmental Research Letters 2018, 13. [Google Scholar] [CrossRef]
- Sun, X.; Ren, G.; You, Q.; Ren, Y.; Xu, W.; Xue, X.; Zhan, Y.; Zhang, S.; Zhang, P. Global diurnal temperature range (DTR) changes since 1901. Climate Dynamics 2018, 52, 3343–3356. [Google Scholar] [CrossRef]
- Tan, J.; Piao, S.; Chen, A.; Zeng, Z.; Ciais, P.; Janssens, I.A.; Mao, J.; Myneni, R.B.; Peng, S.; Penuelas, J.; et al. Seasonally different response of photosynthetic activity to daytime and night-time warming in the Northern Hemisphere. Glob Chang Biol 2015, 21, 377–387. [Google Scholar] [CrossRef]
- Tucker, C.J.; Pinzon, J.E.; Brown, M.E.; Slayback, D.A.; Pak, E.W.; Mahoney, R.; Vermote, E.F.; El Saleous, N. An extended AVHRR 8-km NDVI dataset compatible with MODIS and SPOT vegetation NDVI data. International Journal of Remote Sensing 2005, 26, 4485–4498. [Google Scholar] [CrossRef]
- Wen, Y.; Liu, X.; Pei, F.; Li, X.; Du, G. Non-uniform time-lag effects of terrestrial vegetation responses to asymmetric warming. Agricultural and Forest Meteorology 2018, 252, 130–143. [Google Scholar] [CrossRef]
- Wolkovich, E.M.; Cook, B.I.; Allen, J.M.; Crimmins, T.M.; Betancourt, J.L.; Travers, S.E.; Pau, S.; Regetz, J.; Davies, T.J.; Kraft, N.J.; et al. Warming experiments underpredict plant phenological responses to climate change. Nature 2012, 485, 494–497. [Google Scholar] [CrossRef]
- Wu, Z.; Dijkstra, P.; Koch, G.W.; PeÑUelas, J.; Hungate, B.A. Responses of terrestrial ecosystems to temperature and precipitation change: a meta-analysis of experimental manipulation. Global Change Biology 2011, 17, 927–942. [Google Scholar] [CrossRef]
- Zhao, J.; Wang, L.; Hou, X.; Li, G.; Tian, Q.; Chan, E.; Ciais, P.; Yu, Q.; Yue, C. Fire Regime Impacts on Postfire Diurnal Land Surface Temperature Change Over North American Boreal Forest. Journal of Geophysical Research: Atmospheres 2021, 126. [Google Scholar] [CrossRef]
- Zhao, J.; Xiang, K.; Wu, Z.; Du, Z. Varying Responses of Vegetation Greenness to the Diurnal Warming across the Global. Plants (Basel) 2022, 11. [Google Scholar] [CrossRef]
- Zheng, B.; Ciais, P.; Chevallier, F.; Chuvieco, E.; Chen, Y.; Yang, H. Increasing forest fire emissions despite the decline in global burned area. Science Advances 2021, 7, eabh2646. [Google Scholar] [CrossRef]
Disclaimer/Publisher’s Note: The statements, opinions and data contained in all publications are solely those of the individual author(s) and contributor(s) and not of MDPI and/or the editor(s). MDPI and/or the editor(s) disclaim responsibility for any injury to people or property resulting from any ideas, methods, instructions or products referred to in the content. |
© 2023 by the authors. Licensee MDPI, Basel, Switzerland. This article is an open access article distributed under the terms and conditions of the Creative Commons Attribution (CC BY) license (http://creativecommons.org/licenses/by/4.0/).


