1. Introduction
Soft soil, as a type of special soil, has poor seismic performance, which causes serious impacts on engineering construction [
1,
2]. With the increasing number of subway construction projects in China, many subway lines are located above soft soil layers, which poses challenges for the seismic design of subway construction projects.Earthquakes, as a common type of geological hazard, have a tremendous impact on soft soil areas. The presence of soft soil causes uneven settlement and increased longitudinal curvature of tunnels located in the seismic subsidence area, seriously affecting their normal use [
3,
4,
5,
6]. According to reports on examples of tunnel damage caused by earthquakes [
7], it can be seen that in 1923, the Kanto earthquake with a magnitude of 7.9 in Japan destroyed 150 tunnels, with cracks in the tunnel lining and sinking of the arch. In 1952, the 7.2-magnitude earthquake in California, USA, severely damaged four tunnels on the South Pacific Railway, with a series of phenomena such as cracks and lining fractures and peeling on the tunnel surface [
8]. In 1975, an earthquake occurred in Haicheng City, China. The tunnel site was located in a soft soil layer, and under the seismic effect, the tunnel experienced significant settlement, affecting normal operation. The experience of previous earthquakes has shown that the geological conditions of tunnel sites have an extremely important impact on seismic damage, but progress in research in this area has not been significant in recent years.
The main characteristics of earthquake activity in China are frequent earthquakes, high intensity, and shallow epicenters, making the impact of earthquake disasters in China very severe. Using the three-dimensional finite element method and the equivalent variable stiffness method to simulate the hardening of grouting materials, Fang et al. [
9] calculated and analyzed the effects of cross-tunnel shield construction on the settlement of existing tunnels under different construction parameters such as shield thrust, tail grouting, and jack pushing force, as well as different tunnel crossing angles. Zhang et al. [
10], based on a subway engineering project in Hangzhou, analyzed the settlement effects of the cut-off pile foundation of shield tunneling under an electric power tunnel, combining three-dimensional numerical simulation and measured settlement data, and conducted numerical analysis of construction parameters such as the face pressure and synchronous grouting pressure. Moore and Guan [
11] used the continuous reflection method to study the response of double-hole tunnels in semi-infinite media under seismic action, obtained the tunnel response formula under different incident waves, and compared it with the two-dimensional analysis. Hamid [
12] studied the factors affecting tunnel settlement through numerical simulation, and the results showed that the fault zone thickness and tunnel strata properties significantly affect the maximum settlement of the tunnel, and the fault affects the longitudinal settlement of the ground within 25 meters on both sides of the fault center. Yang et al. [
13] studied the soft soil foundation in Shanghai, simulated the vibration response of the soft soil foundation under seismic action, and preliminarily summarized the dynamic characteristics of the soft soil in the area, accumulating some data and experience for future research. Milind Patil et al. [
14] studied the seismic response of shallow-buried tunnels under soft soil foundation and obtained the seismic response law of tunnels under different working conditions of soft soil foundation. Samanta et al. [
15] studied the structural response of a 15-story building using SAP2000 for modeling and performing nonlinear time-history analyses. They used four different ground motion modification methods to analyze the response of the structure to both short and long-term earthquake motions.
Xia et al. [
16] used the soft soil in a certain area of Tianjin Binhai as the research object. They applied three levels of earthquake waves, strong, medium, and weak, to the soft soil site. The experimental results showed that the seismic motion of the soft soil was very little affected by the intensity of the earthquake waves. However, when the dynamic shear modulus of the soft soil changed, the dynamic characteristics of the soft soil site changed significantly. Zuo et al. [
17] conducted vibration table tests based on soft clay conditions, focusing on the vibration response of subway stations under seismic action in far-field and near-field sites, and analyzed the changes in dynamic response parameters of underground structures.
The above-mentioned research is mainly conducted from the perspectives of statics and dynamics to study the characteristics of soft soils and the response of metro tunnels passing through soft soil layers. However, there are few studies on the problem of surface settlement of the construction site of the overlying soft soil layer of the metro tunnel under seismic action. Therefore, as shown in
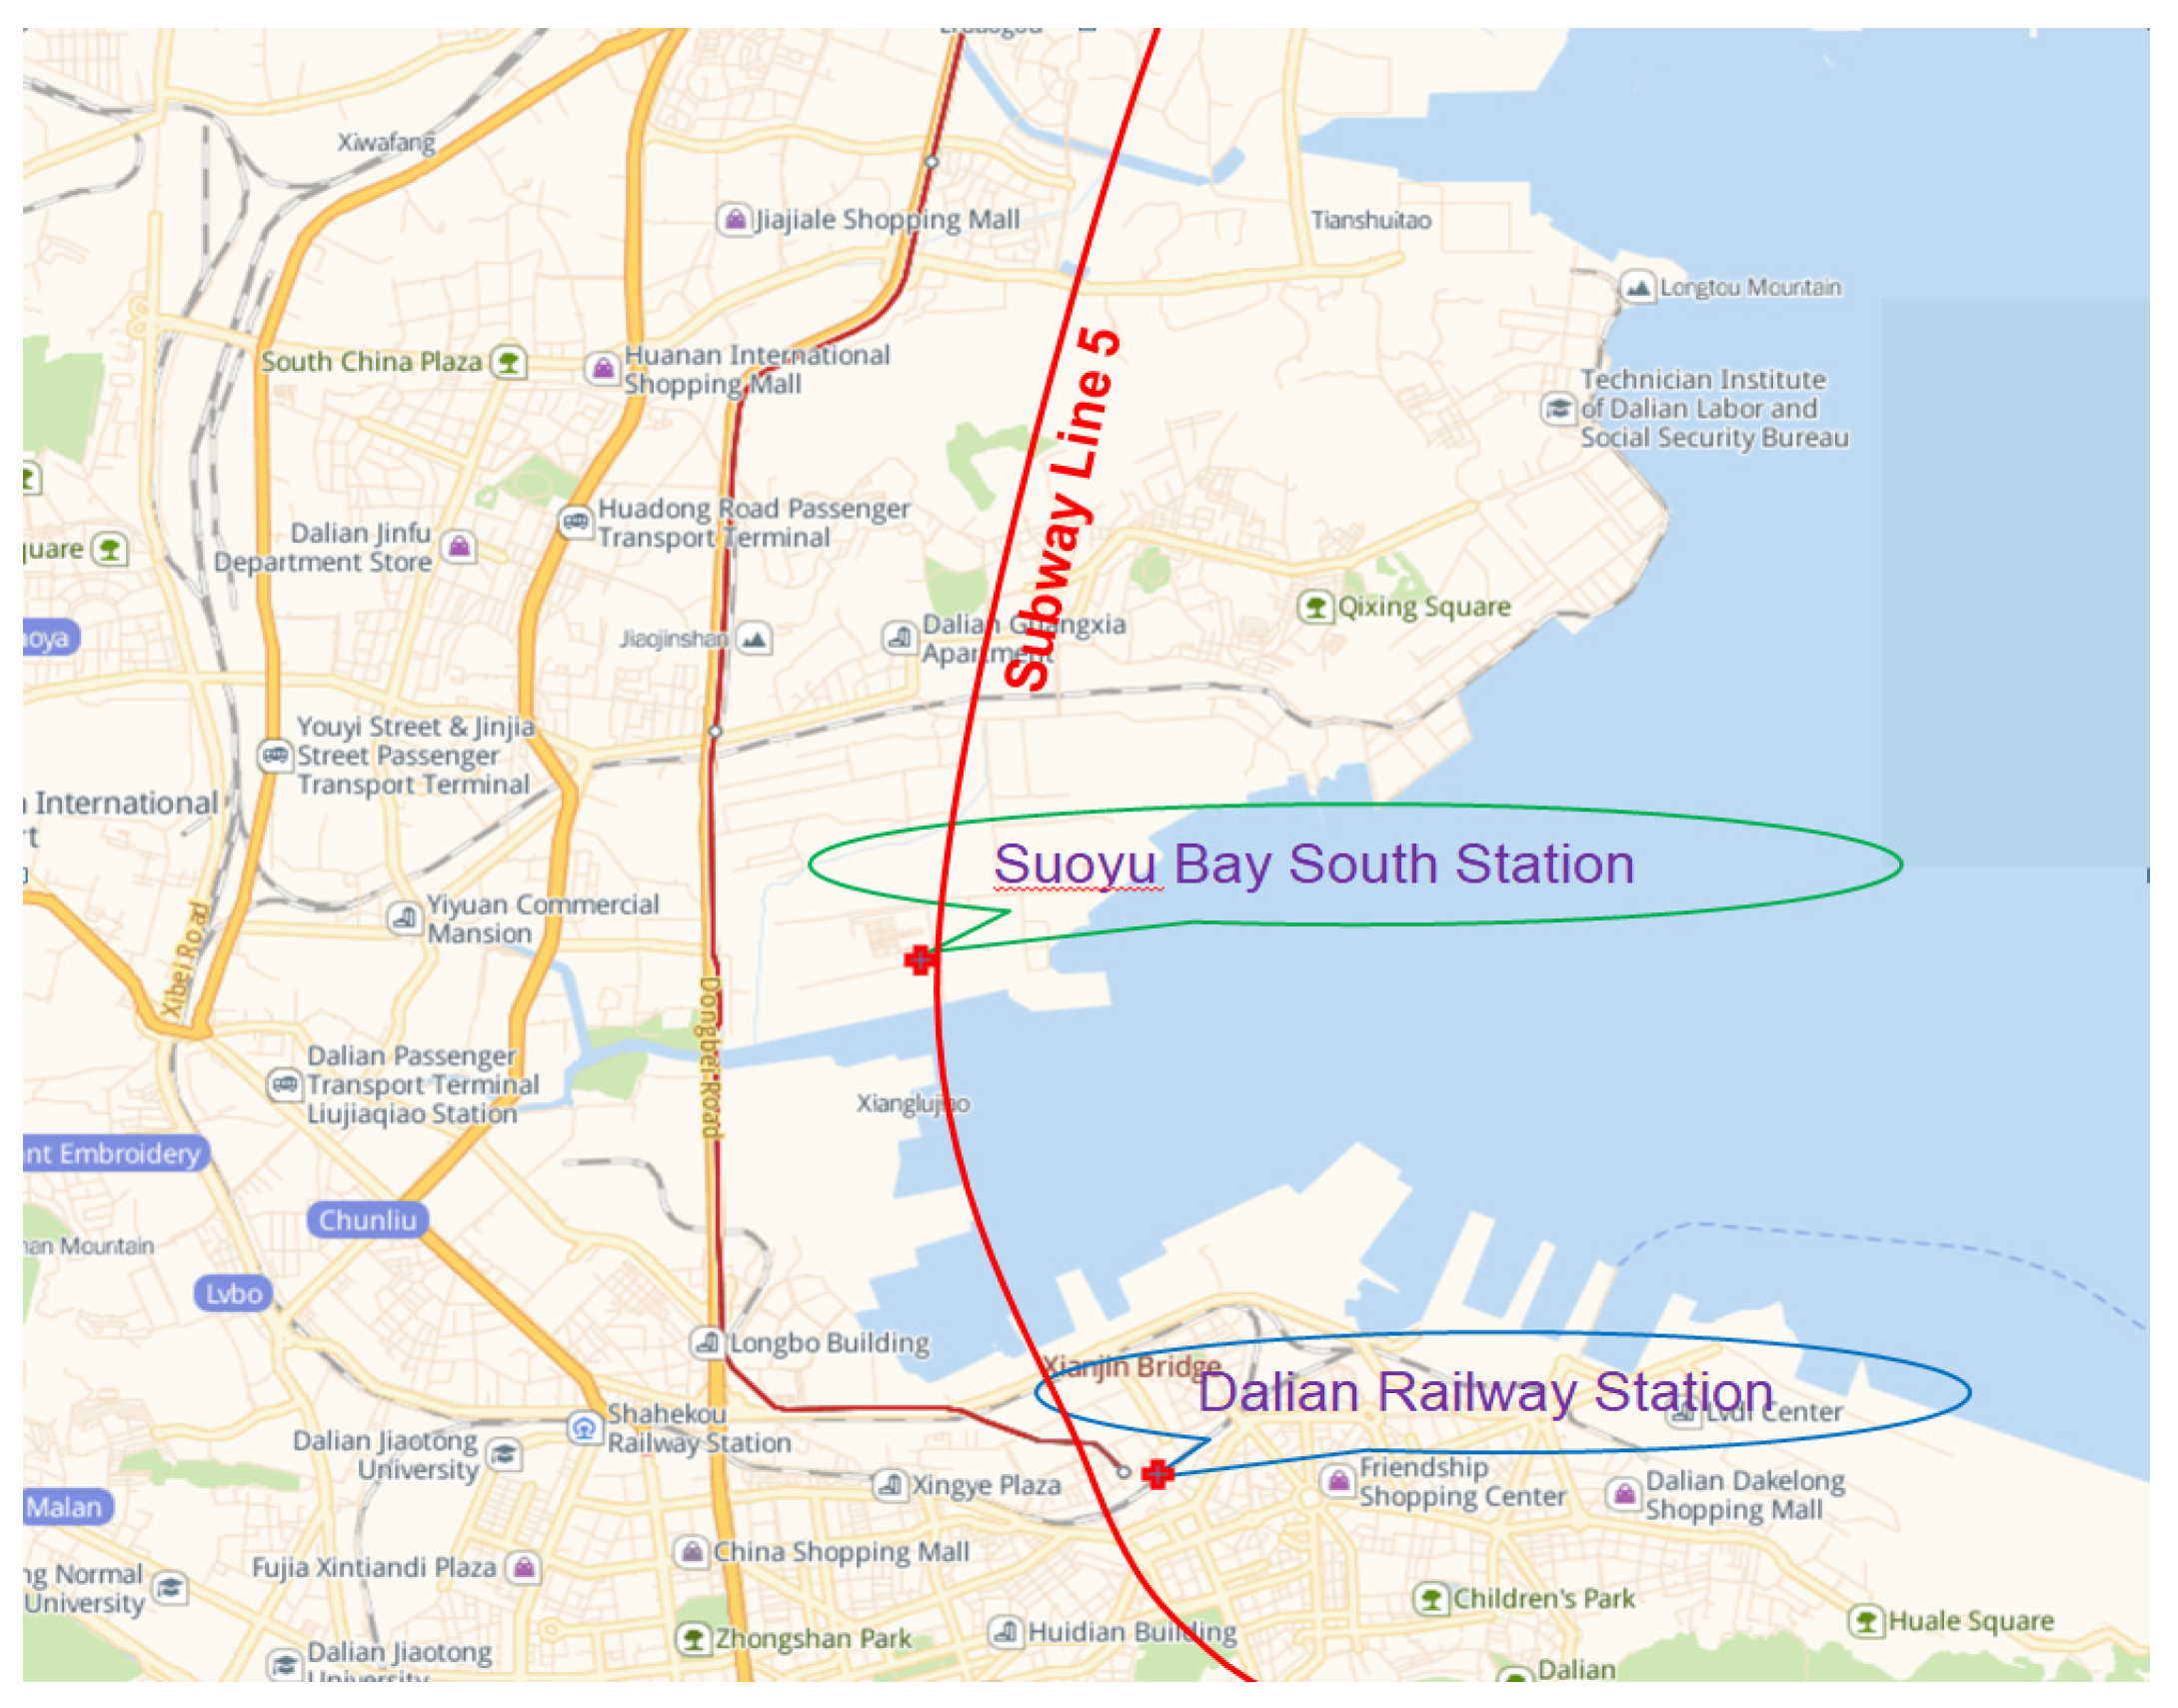
Figure 1, the Dalian Metro Line 5 Section 04, from the Railway Station Station to Suoyu Bay South Station, with overlying soft soil layer, was taken as case of study. Using ABAQUS finite element analysis software, the surface settlement characteristics of the subway tunnel construction site under seismic action in the overlying soft soil layer were deeply explored and theoretically analyzed. Then, based on the El-Centro wave and the soft soil parameters, the settlement characteristics of the tunnel roof surface were studied. Finally, the sensitivity analysis of soft soil parameters to the settlement of the tunnel roof surface was conducted using the orthogonal test method.
2. Numerical Model of the Metro Tunnel with an Overlying Soft Soil Layer
2.1. Convergence-Confinement Method Based on Elastic-Plastic Analysis
Elastic-plastic analysis, also known as elastic limit equilibrium analysis, is based on Coulomb's theory and assumes that the rock mass does not change after failure. Using an ideal elastic-plastic model, it can well describe the deformation and failure characteristics of underground chambers and surrounding rocks. Through the analysis of Fenner and H. Kastner, the characteristic curve of the surrounding rock of the tunnel was obtained. The study shows that under the condition of low support resistance, the self-supporting force of the surrounding rock can be used to achieve stability [
18]. This achievement has been widely promoted and adopted by the New Austrian Method and the convergence-confinement method. With the continuous improvement of tunnel construction monitoring level, the convergence-confinement method theory has gradually been applied to practical tunnel engineering, mainly reflected in the design and stability analysis of tunnels. According to the measured deformation of the tunnel section during construction, the excavation of the tunnel is regarded as a process of re-distribution of the stress of the surrounding rock [
19]. Therefore, it is particularly important to scientifically and reasonably simplify the tunnel construction model, especially the simulation of stress release of the surrounding rock during excavation.
Using the convergence-confinement method, the nodal forces of the excavation face were studied, and the nodal forces adapted to the initial stress were obtained. Based on this, nodal forces were applied to each node, and the amplitude of the nodal forces decreased over time. When it drops to a certain level, the lining unit is activated, and then the remaining load decays. Based on this, an orthogonal experimental model with convergence-confinement focusing on the stress release of the surrounding rock during excavation was established using ABAQUS, which systematically discussed the settlement of the top surface of the soft soil layer under the seismic action of various parameters of the soft soil layer (elastic modulus, cohesive force, Poisson's ratio, and internal friction angle).
2.2. Calculation of Geometric Dimensions and Parameters of the Model
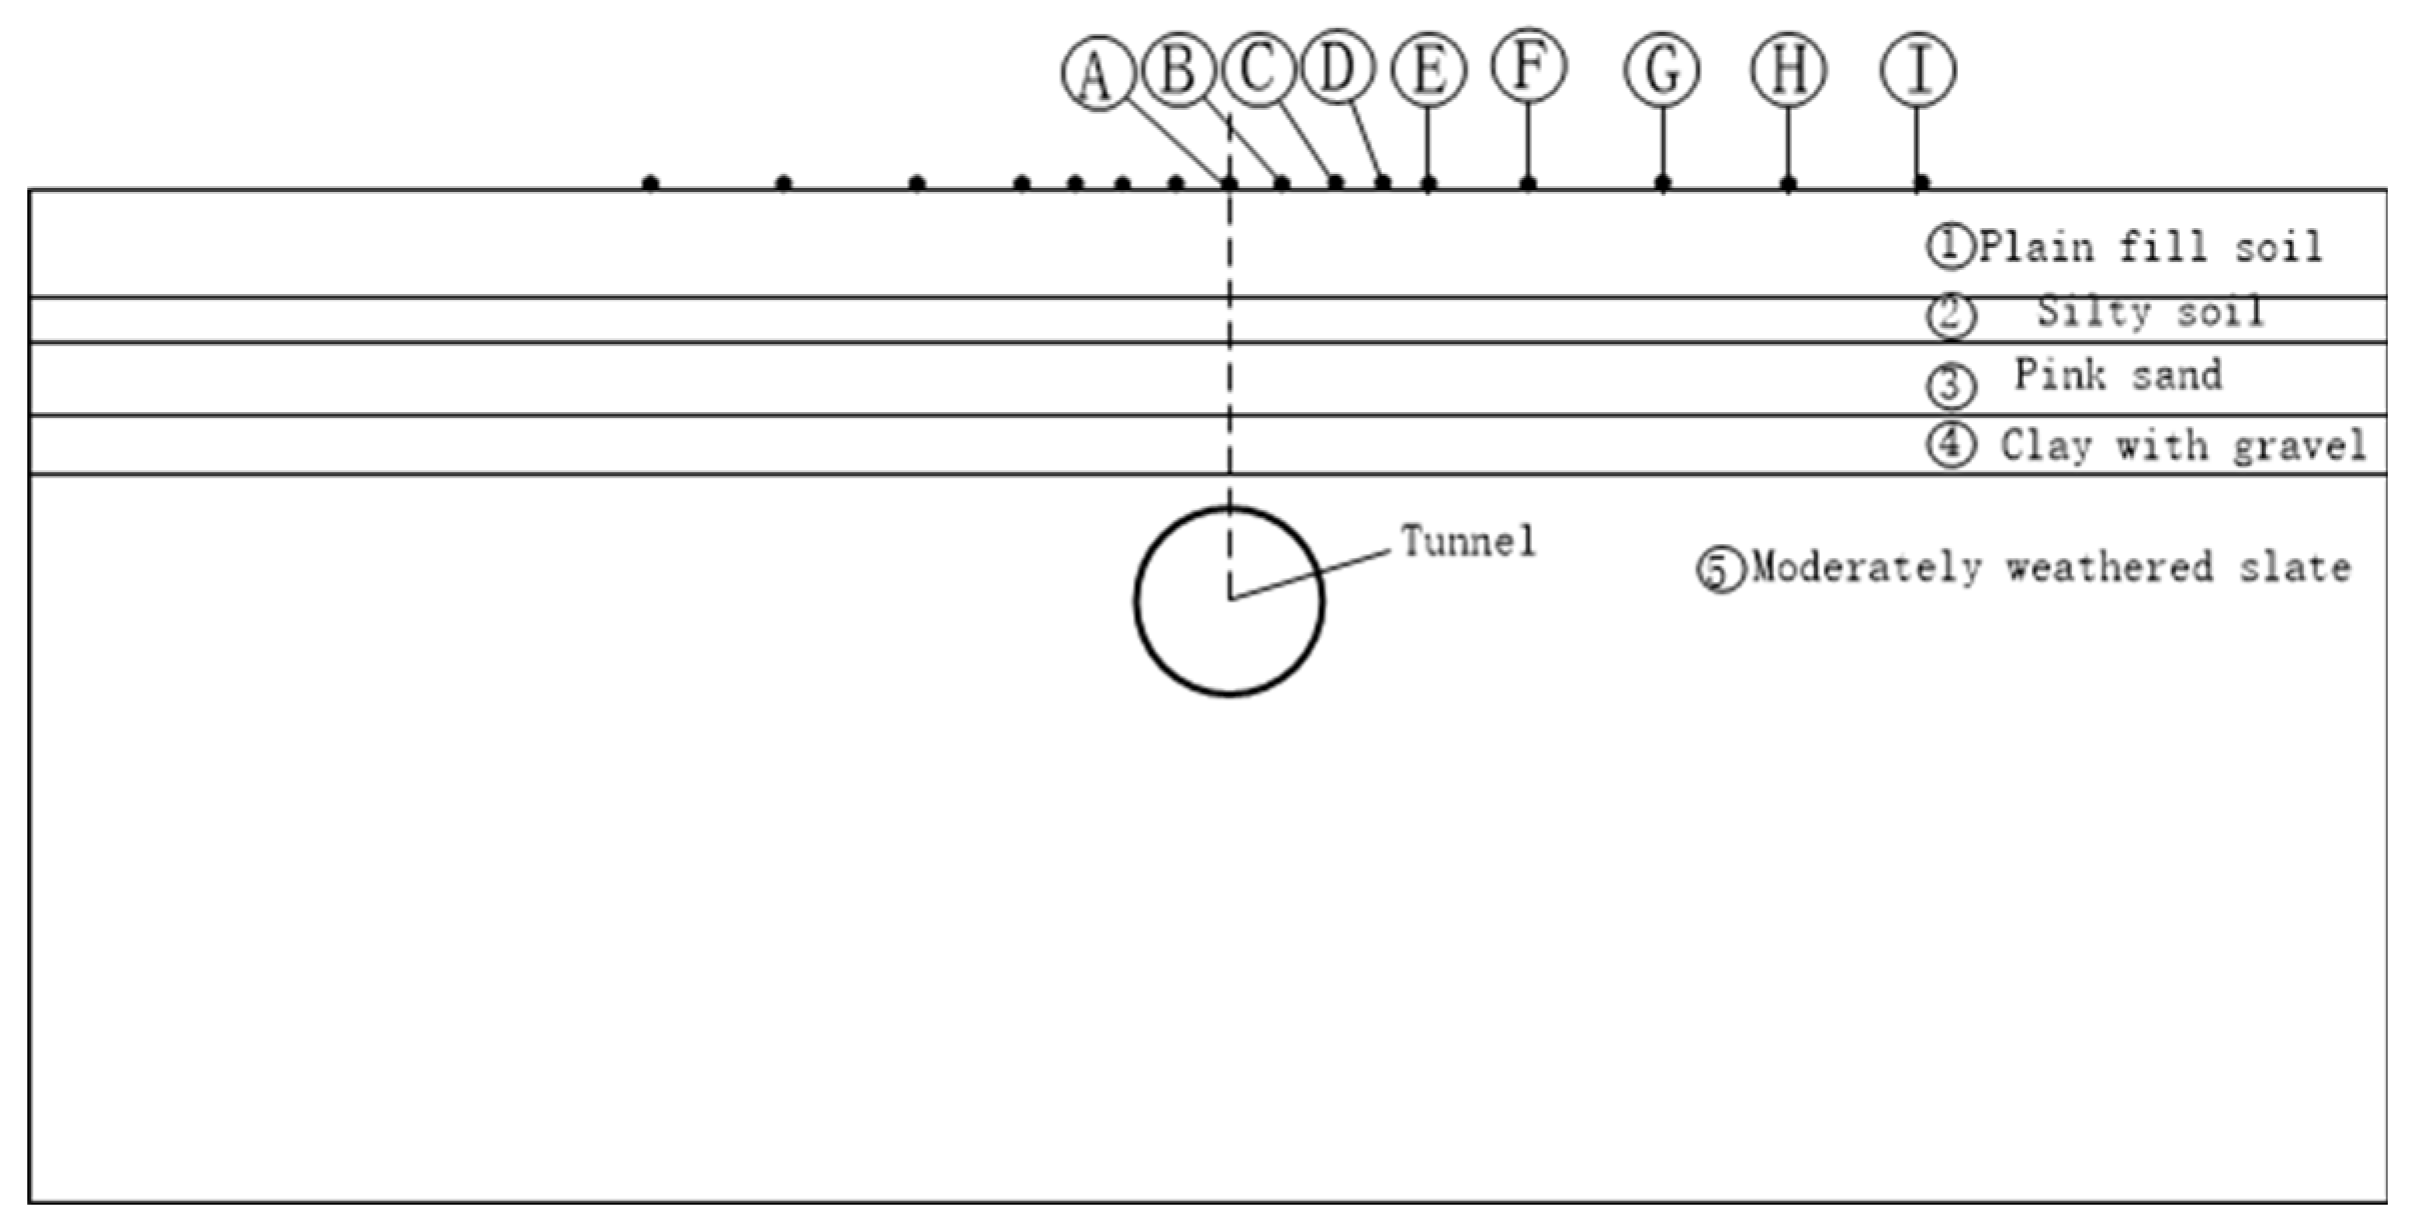
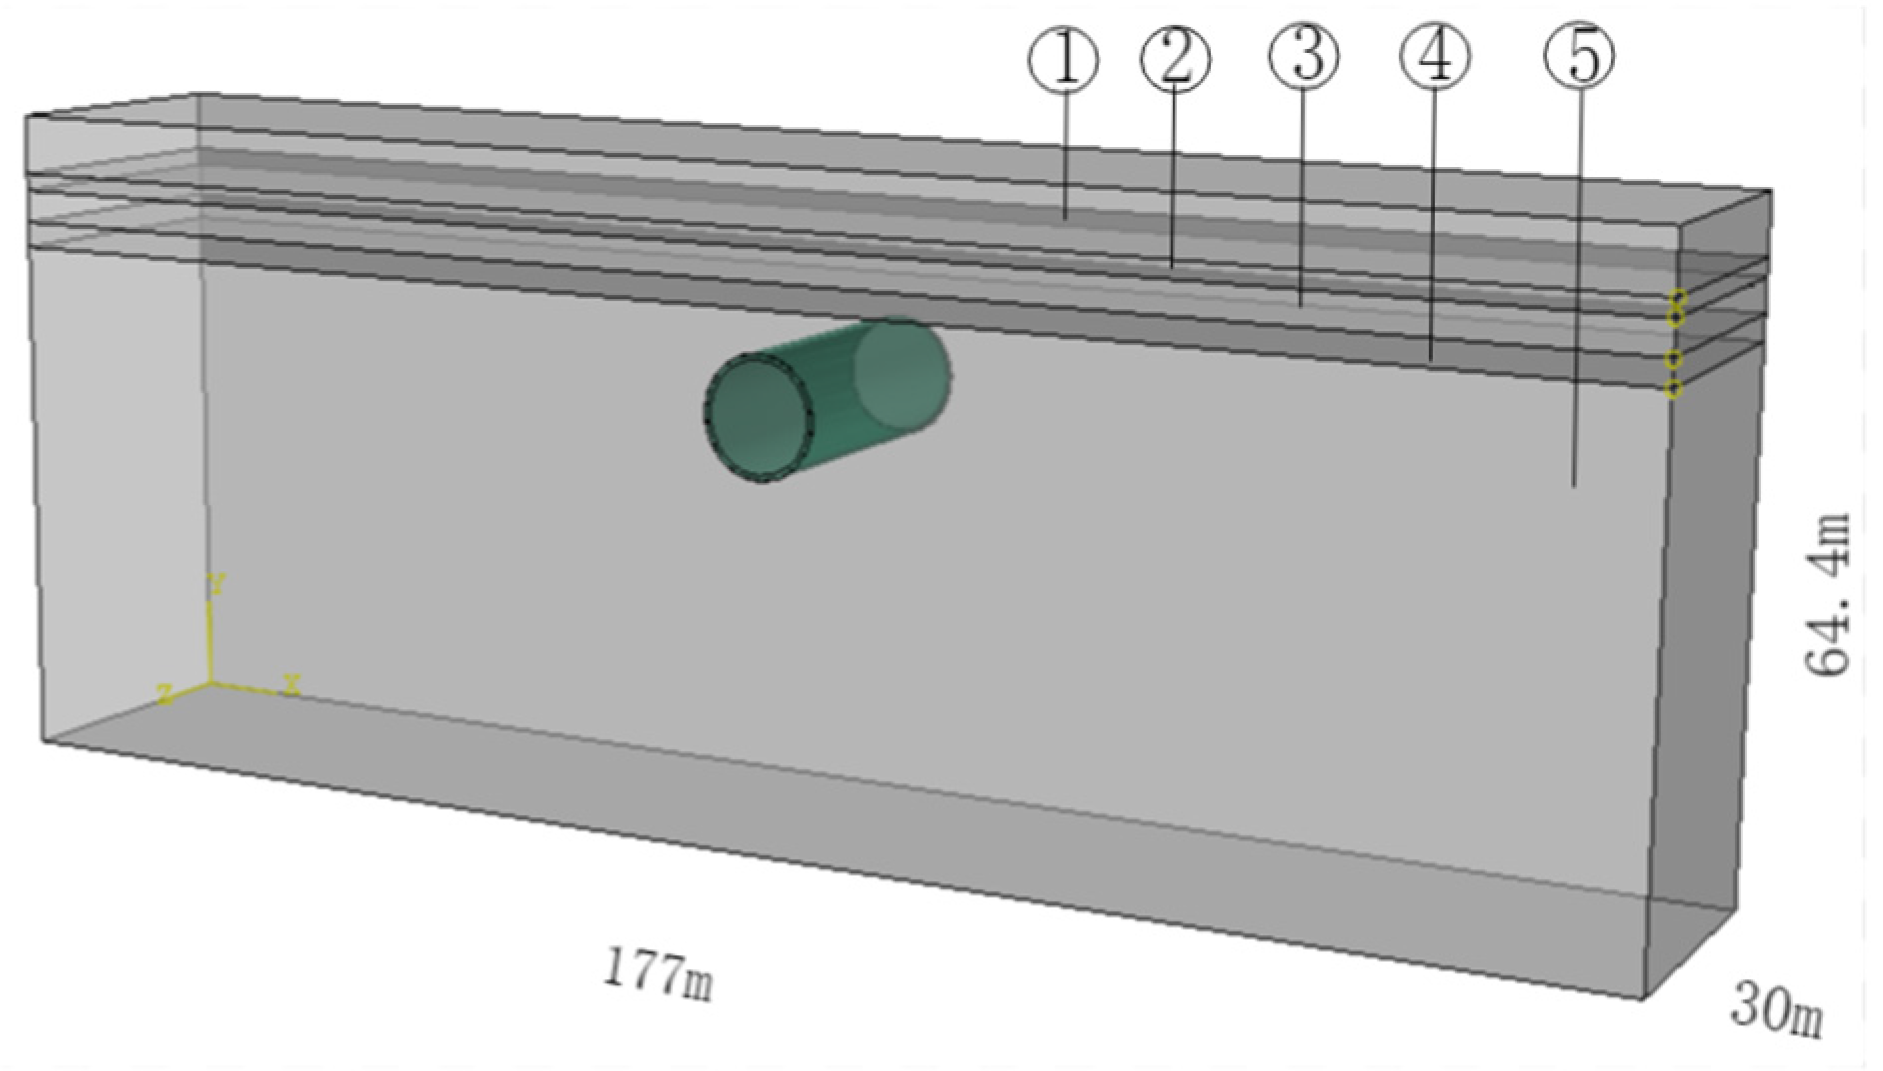
Numerical simulation is based on the construction of the Dalian Metro Line 5. According to the survey report and design information, the stratigraphic layers are described as follows: ①Plain fill soil: layer thickness of 5.8m; ②Silty soil: layer thickness of 1.7m; ③Pink sand: layer thickness of 3.2m; ④Clay with gravel: layer thickness of 2.5m; ⑤Moderately weathered slate: layer thickness of 51.2m. The distance from the top of the tunnel to the ground net distance is 17.2m. To overcome the influence of boundary conditions, the width of the tunnel is set to 3~5 times the length of the tunnel. Therefore, the model's length, width, and height are 177m×30m×64.4m, as shown in
Figure 2. The physical and mechanical parameters of the soil layers in the model are calculated and shown in
Table 1. The initial lining material of the supporting structure is C60, with a thickness of 30 cm, and the parameters of the model's initial lining are shown in
Table 2.
The existence of soft soil poses a significant risk of settlement to the top of the tunnel's ground surface. This article establishes a three-dimensional finite element model using ABAQUS. The model is symmetrically distributed along the midpoint A, and the measurement points B1~I1 on the left side of point A of the top of the tunnel's ground surface correspond to measurement points B~I on the right side, respectively. The distance between points A and E is 3.3m, the distance between points E and F is 6.6m, and the distance between the remaining points is 9m, as shown in
Figure 1. To explore the impact of the parameters of the silts on the settlement of the top of the tunnel's ground surface under seismic action, the average settlement values of the top of the tunnel's ground surface at measurement points A~I and B1~I1 under three seismic waves were analyzed, with the maximum settlement not exceeding the specification value of 30 mm. The relationship between the parameters of the soft soil (
E,
c,
φ,
ν) and the maximum settlement of the top of the tunnel's ground surface was studied.
2.3. Model Materials and Boundary Conditions
Based on the construction of the Dalian Metro Line 5, a numerical model was established using finite element software ABAQUS, with a local damping coefficient of 0.1491. In the load setting options, the displacement and rotation of the four sides of the soil model's front, rear, left, and right were constrained; in step one of the analysis, the rotation and displacement of the bottom of the soil model were constrained, and the bottom of the model was fixed. In step two of the analysis, the normal and tangential displacement of the bottom of the model were limited. To obtain the best calculation accuracy, the mapped mesh division method was used to ensure the regularity of the mesh structure. The final model is shown in
Figure 3, where layers ① to ⑤ are loess, silts, fine sand, clay with gravel, and Moderately weathered slate, respectively. The soil is modeled using the Mohr-Coulomb constitutive model.
According to previous research [
20], a circular tunnel model was established in a uniform and elastic semi-infinite region, and the variations in stress and displacement were around 5% within 3 times the diameter range and less than 1% beyond 5 times. To overcome the influence of boundary conditions, the width of the tunnel was set to 3~5 times the length of the tunnel. Therefore, the model had a length, width, and height of 177m × 30m × 64.4m in order to overcome the influence of the boundary on the calculation results. A hybrid mesh was used, consisting of a total of 12500 mesh elements.
2.4. Selection of Seismic Loads
Based on the engineering background of Dalian Metro Line 5, the seismic activity in Dalian was analyzed according to the "China Seismic Ground Motion Parameter Zonation Map" (GB 18306-2015) at a scale of 1:4 million [
21], and simulated seismic inputs were obtained using the 0.1g El-Centro wave, 0.1g Kobe wave, and an artificial earthquake wave with a probability of exceedance of 10% to simulate the effect of the earthquake in Dalian. The acceleration time history curves of the three types of earthquake waves are shown in
Figure 4.
3. Results and Discussion
3.1. Settlement Deformation Law of the Tunnel Roof Strata
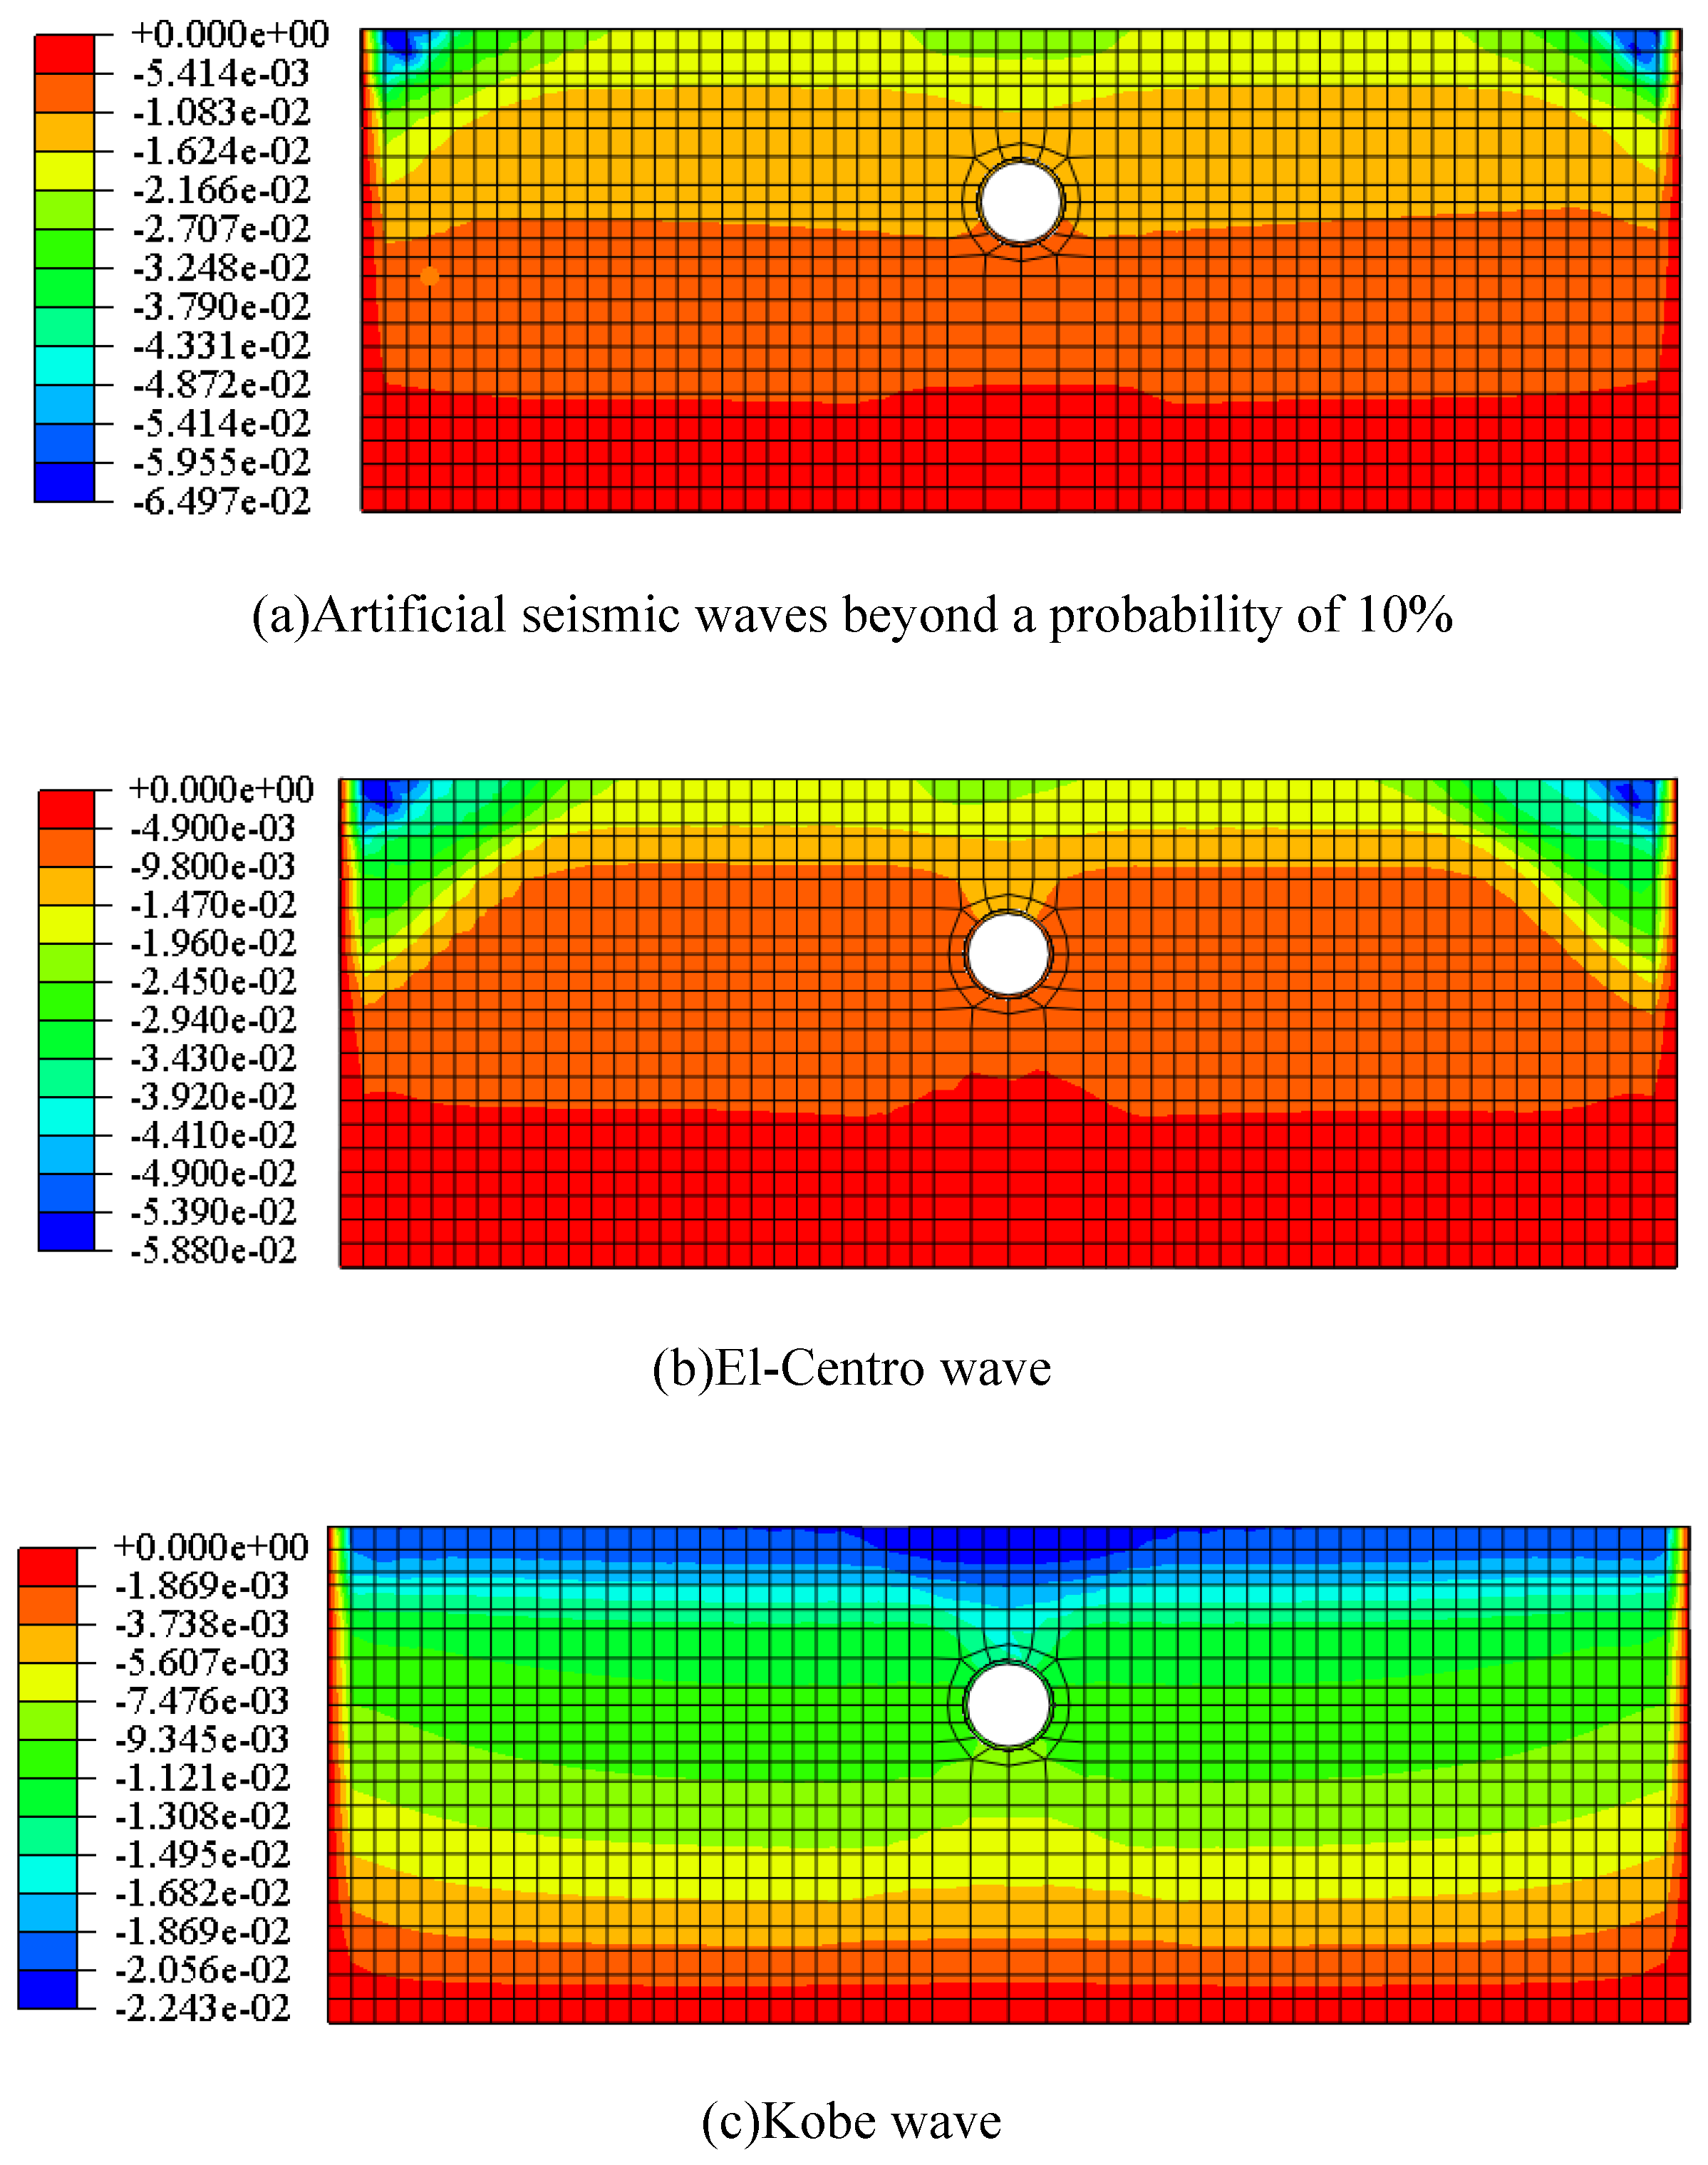
The displacement cloud diagram in the vertical direction of the model after the earthquake was calculated using ABAQUS, as shown in
Figure 5. The unit for the horizontal direction Y-axis is in meters.
From the figure, it can be seen that there is significant differential settlement in the soft soil strata, and the strata directly above the tunnel settle significantly higher than the surrounding strata under earthquake action, forming a settlement trough, with the maximum settlement located directly above the tunnel. Comparing the results under the three different earthquake waves, it was found that the width of the settlement trough was the largest under the El-Centro wave, at about 19.6m, followed by the artificial earthquake wave with a probability of exceedance of 10%, at about 15.6m, while the width of the settlement trough was the smallest under the Kobe earthquake wave, at about 8.5m.
3.2. Analysis of Ground Settlement Theory
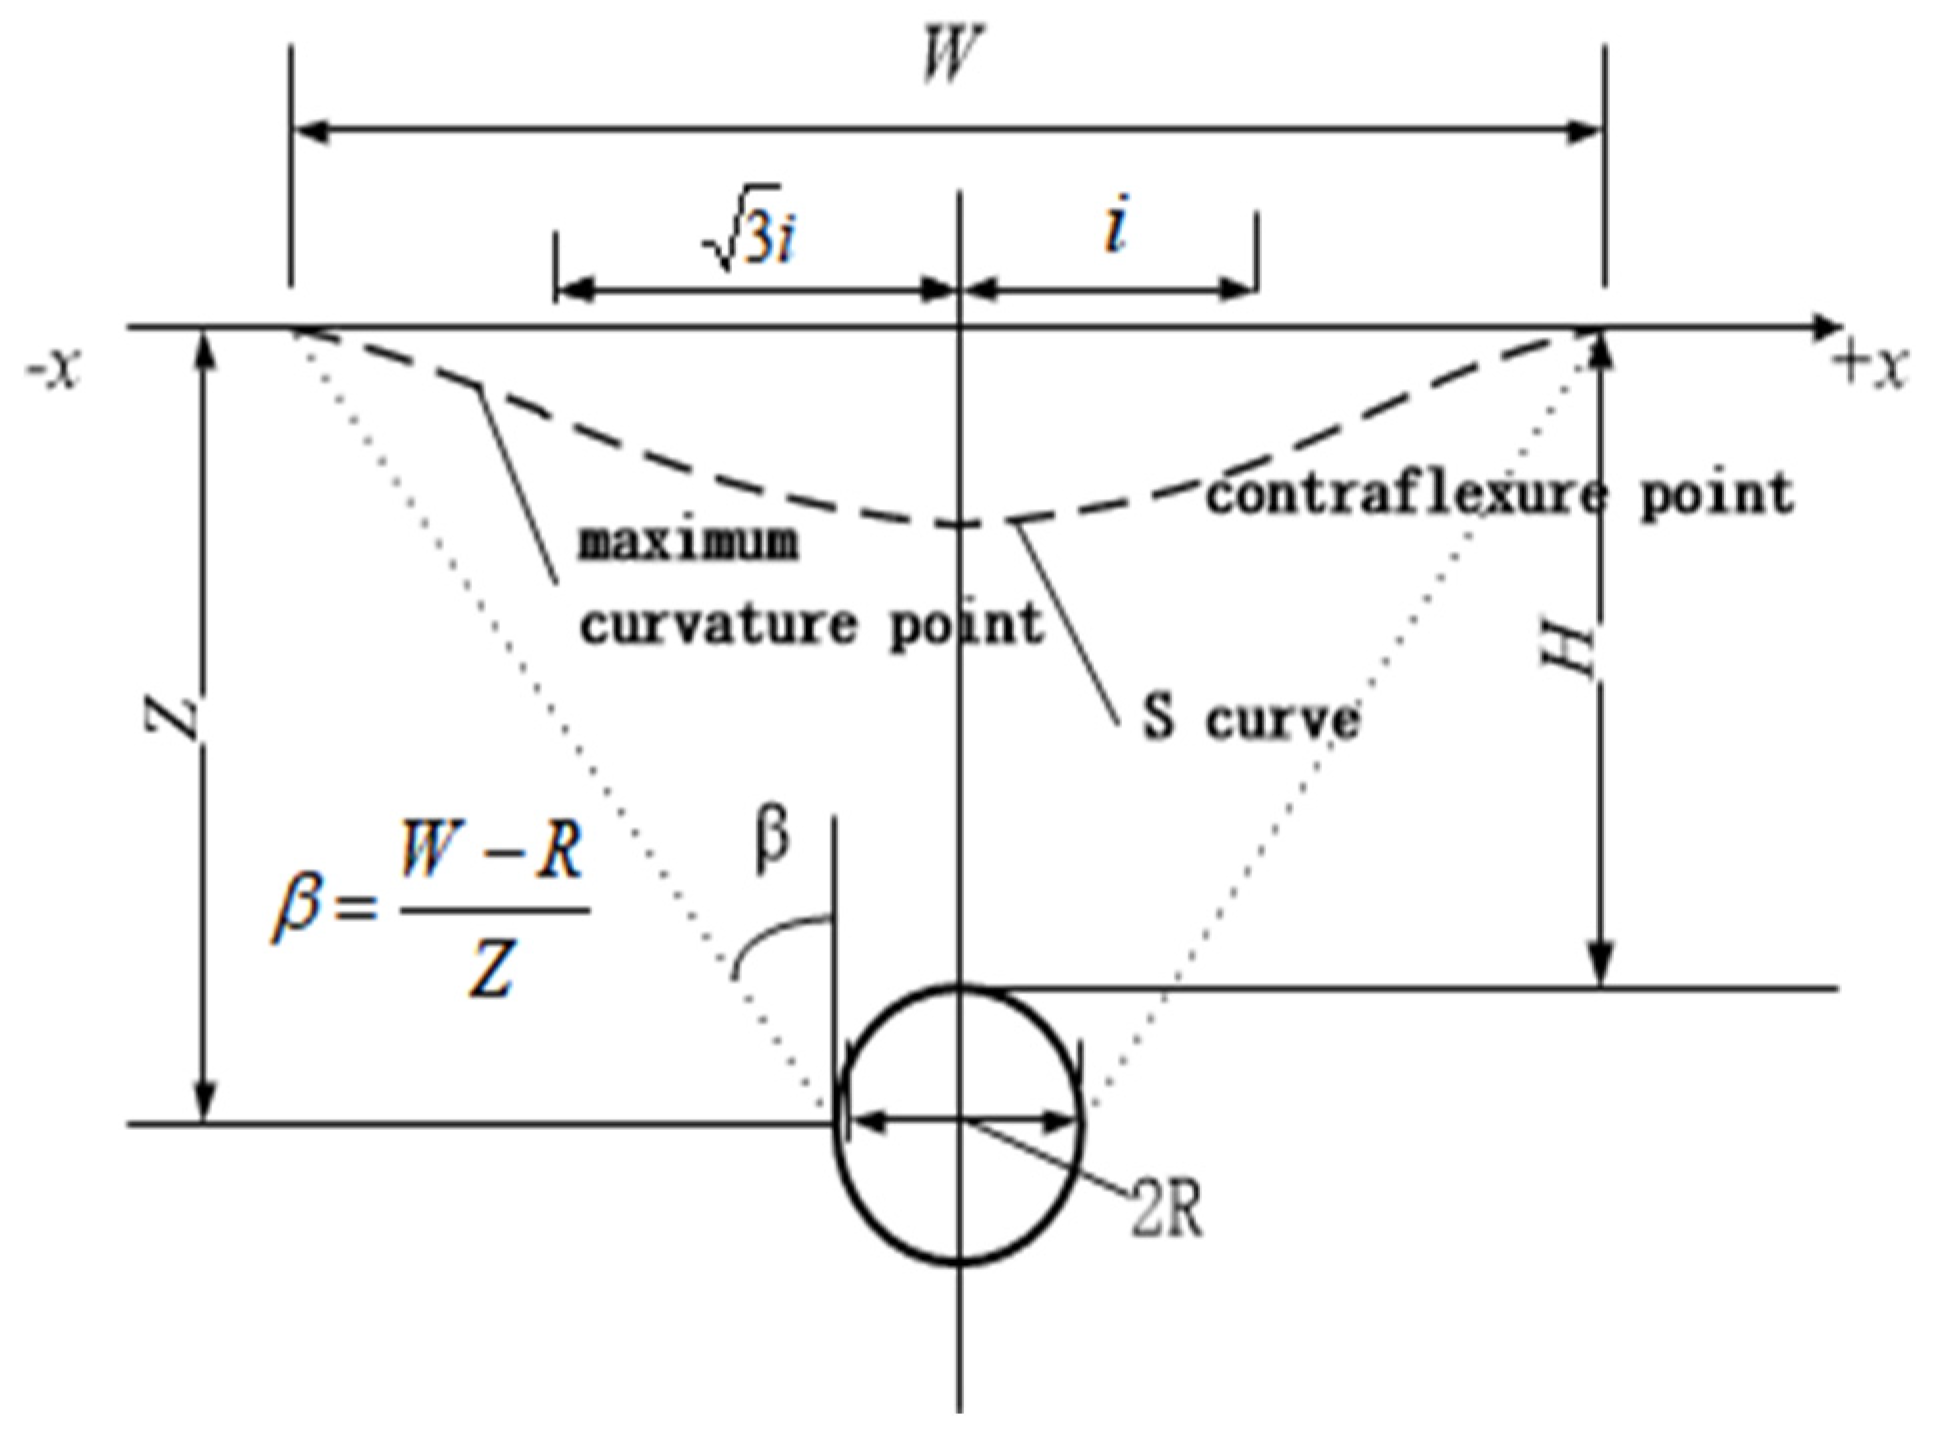
When an earthquake occurs, soft soil layers are easily compressed, causing uneven settlement of the ground. The pattern and amount of deformation due to uneven settlement can be provided by the earthquake department, but the data provided by them are not universal and often only applicable to the study of ground subsidence in small seismic zoning areas, as shown in
Figure 6. In analytical analysis, it is generally assumed that the ground settlement below the interval tunnel conforms to the Peck formula [
22]:
where Smax is the maximum settlement of the ground surface at the tunnel axis position in meters, Vi is the ground loss of the unit length of the tunnel in cubic meters per meter, x is the distance from the tunnel axis to the calculation point in meters, and i is the width coefficient of the settlement trough, which represents the distance from the center point of the settlement curve to the inflection point in meters.
The distance
i between the center of the tunnel and the inflection point of the settlement curve is calculated using the following empirical formula:
where
H is the overburden thickness,
R is the hydraulic radius of the tunnel, and
φ is the internal friction angle of the ground.
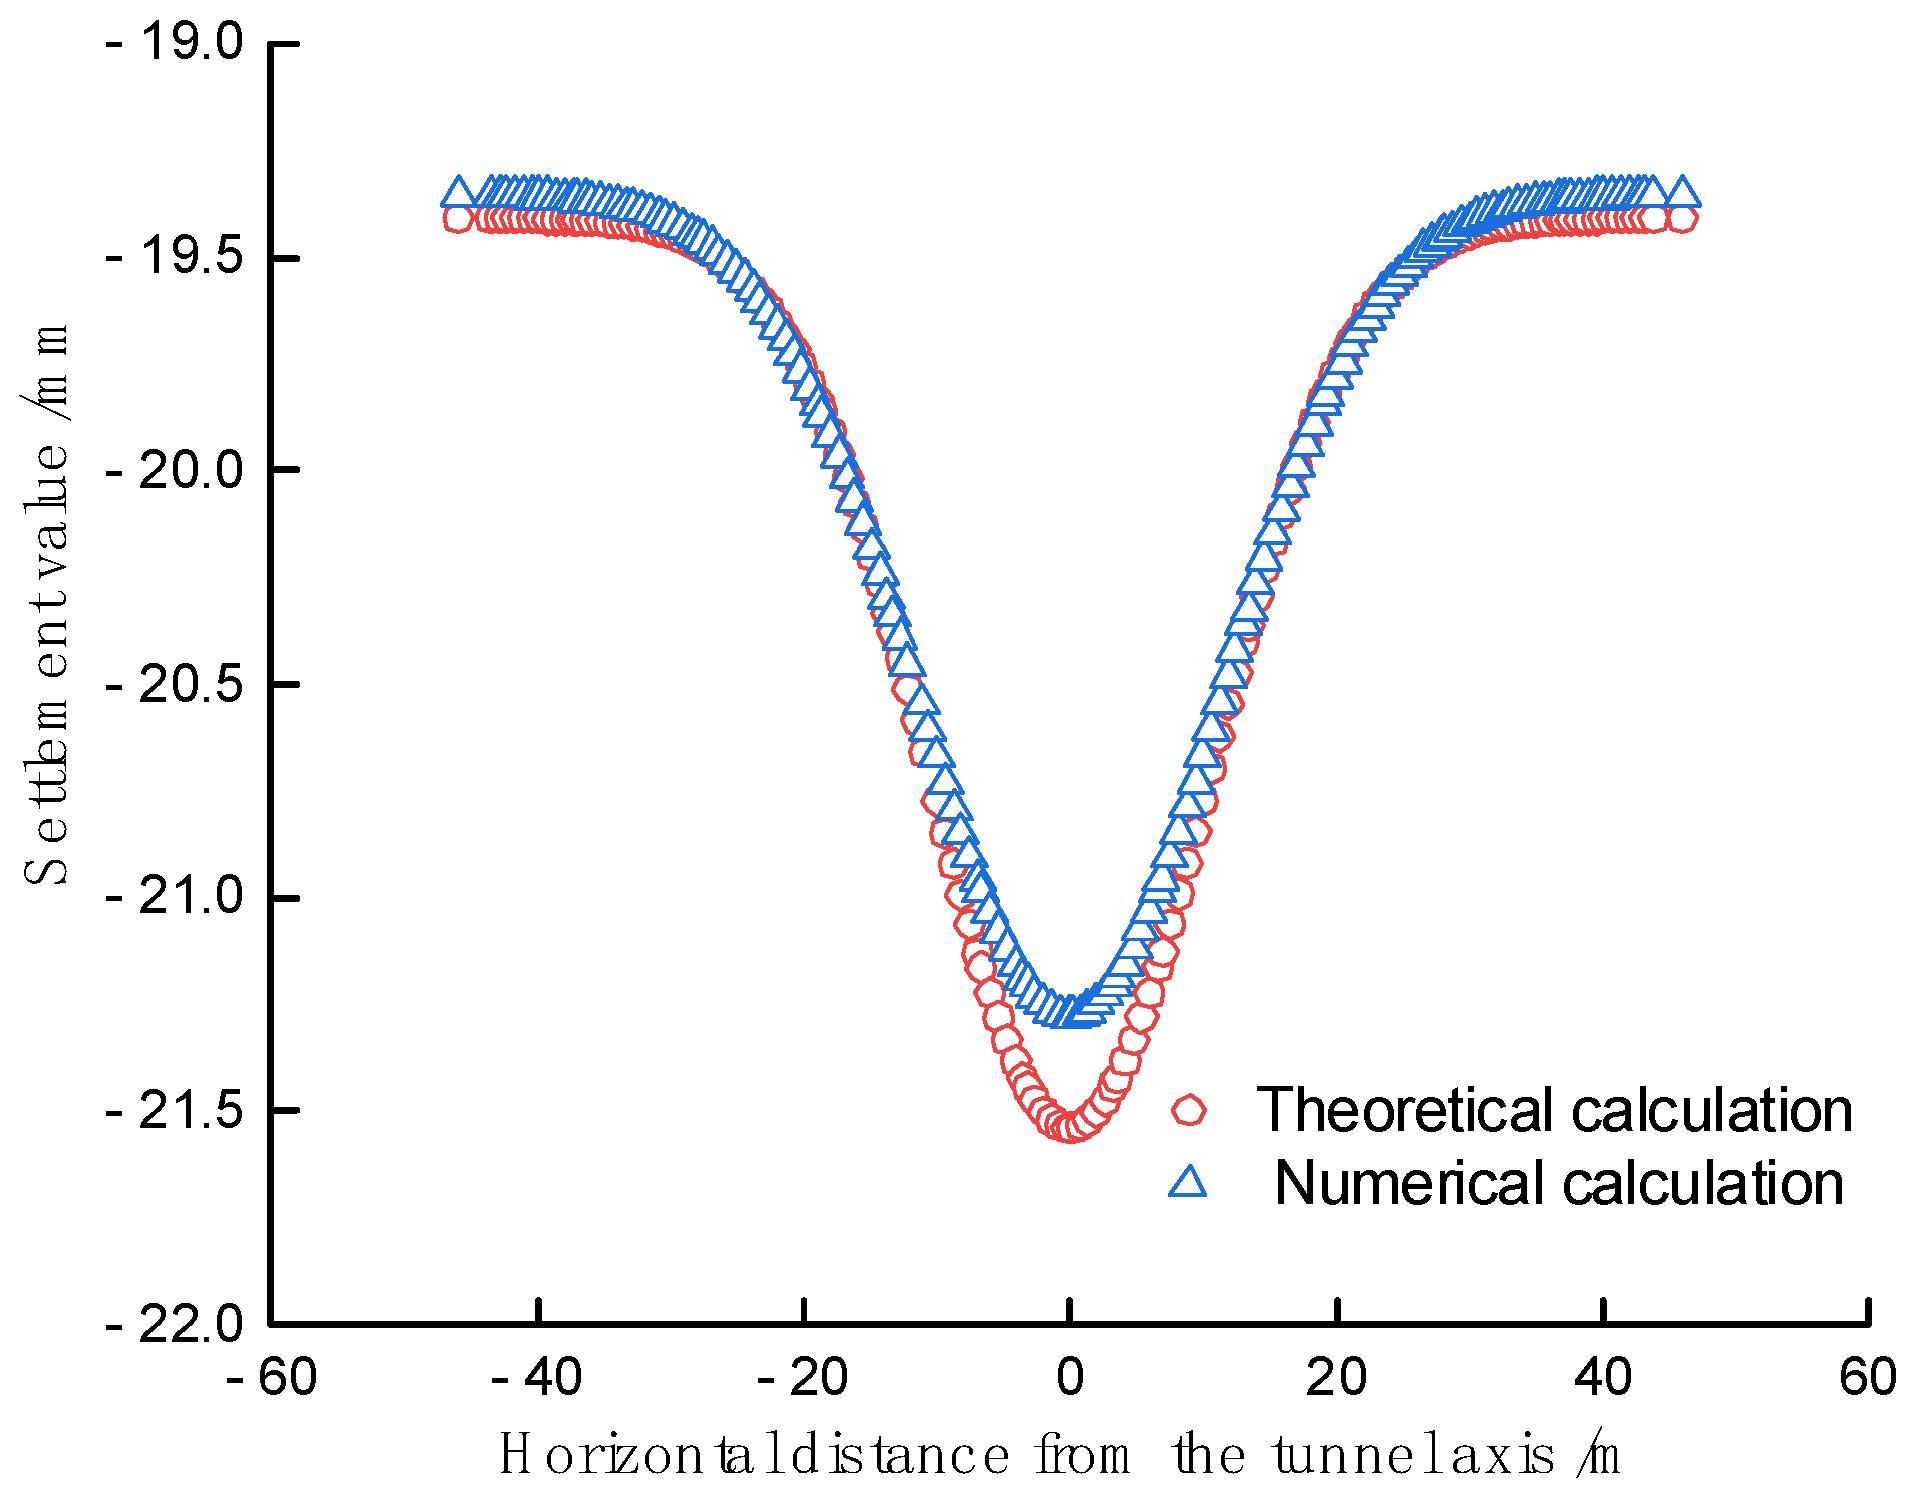
The maximum simulated value of ground settlement at the top of the tunnel is 21.02mm; the maximum settlement value calculated by the formula is 21.5. Within the range of 0~40m from the tunnel axis, the simulated value of ground settlement at the top of the tunnel is very close to the result obtained from the formula, as shown in
Figure 7. Therefore, this model can reasonably reflect the impact of earthquakes on the ground settlement at the top of the tunnel.
4. Analysis of the Impact of Soft Soil Parameters on Ground Settlement at the Top of the Tunnel
4.1. The Impact of Elastic Modulus on Ground Settlement at the Top of the Tunnel
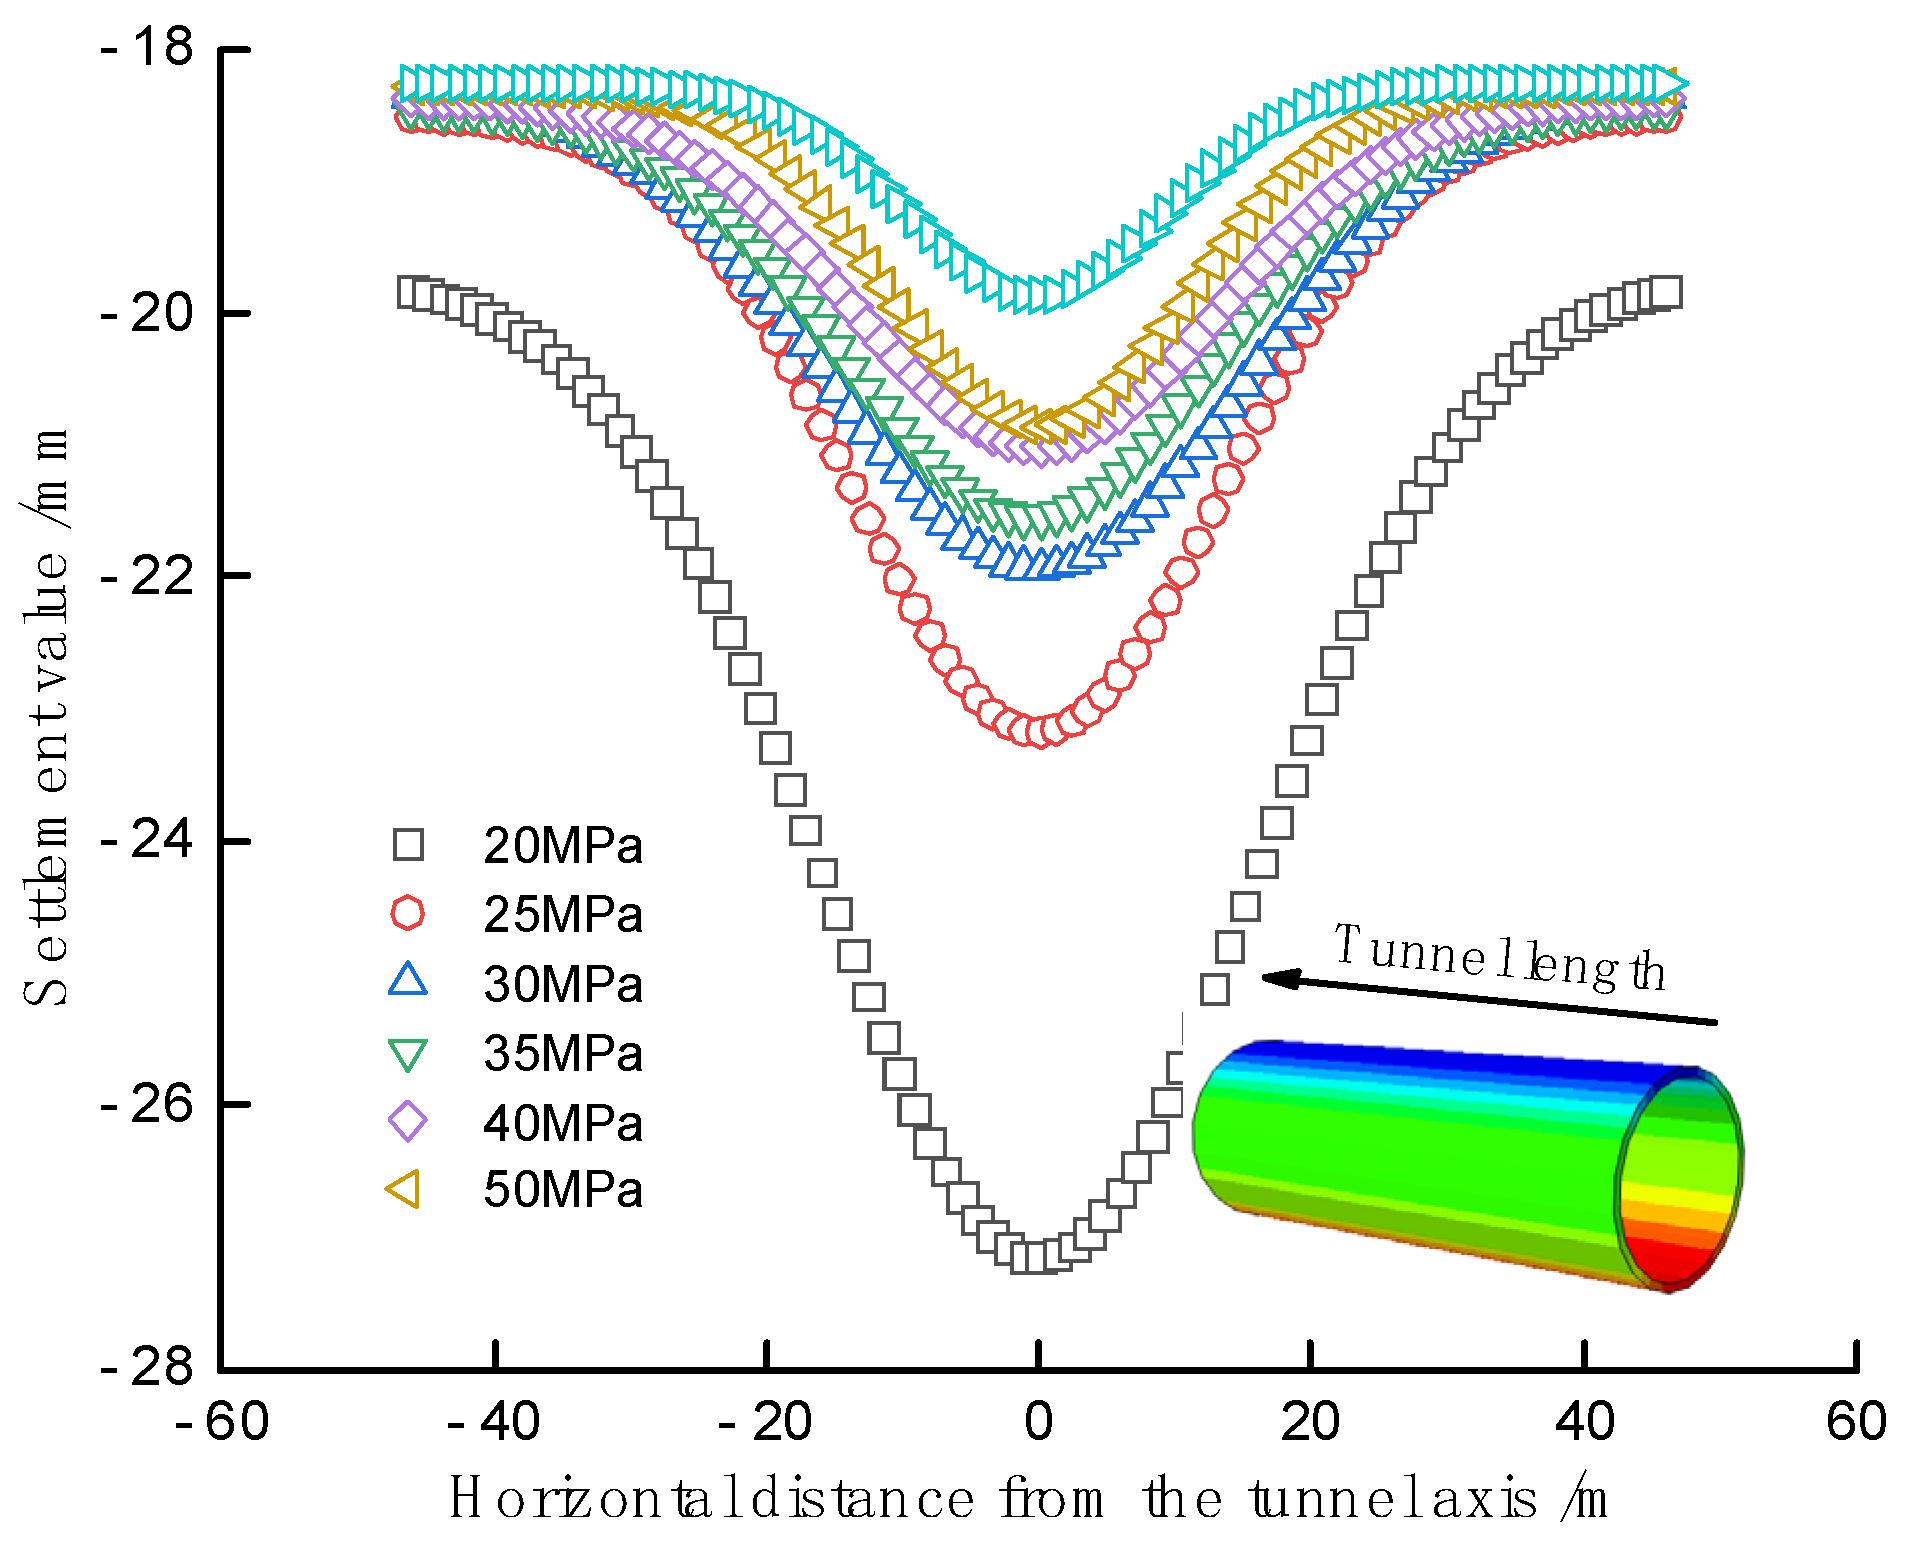
Under the action of earthquakes, the presence of soft soil layers has a significant impact on the ground settlement at the top of the tunnel. Based on the existing engineering experience and using El-Centro waves, the ground settlement curves at the top of the tunnel were simulated and data were organized for elastic moduli of 20MPa, 25MPa, 30MPa, 35MPa, 40MPa, and 50MPa for silty clay, as shown in
Figure 8. It can be seen that the ground settlement curve at the top of the tunnel reaches its maximum value at the tunnel center axis, and the maximum settlement decreases from the middle to the sides. As the elastic modulus increases, the width of the settlement trough changes less, the depth of the settlement trough decreases, and the settlement of the tunnel decreases. The influence of the elastic modulus of soft soil on the ground settlement at the top of the tunnel under earthquake action is quite obvious. In practical engineering, it is necessary to reinforce the soft soil and increase the elastic modulus of the soil to control the settlement of the tunnel roof surface.
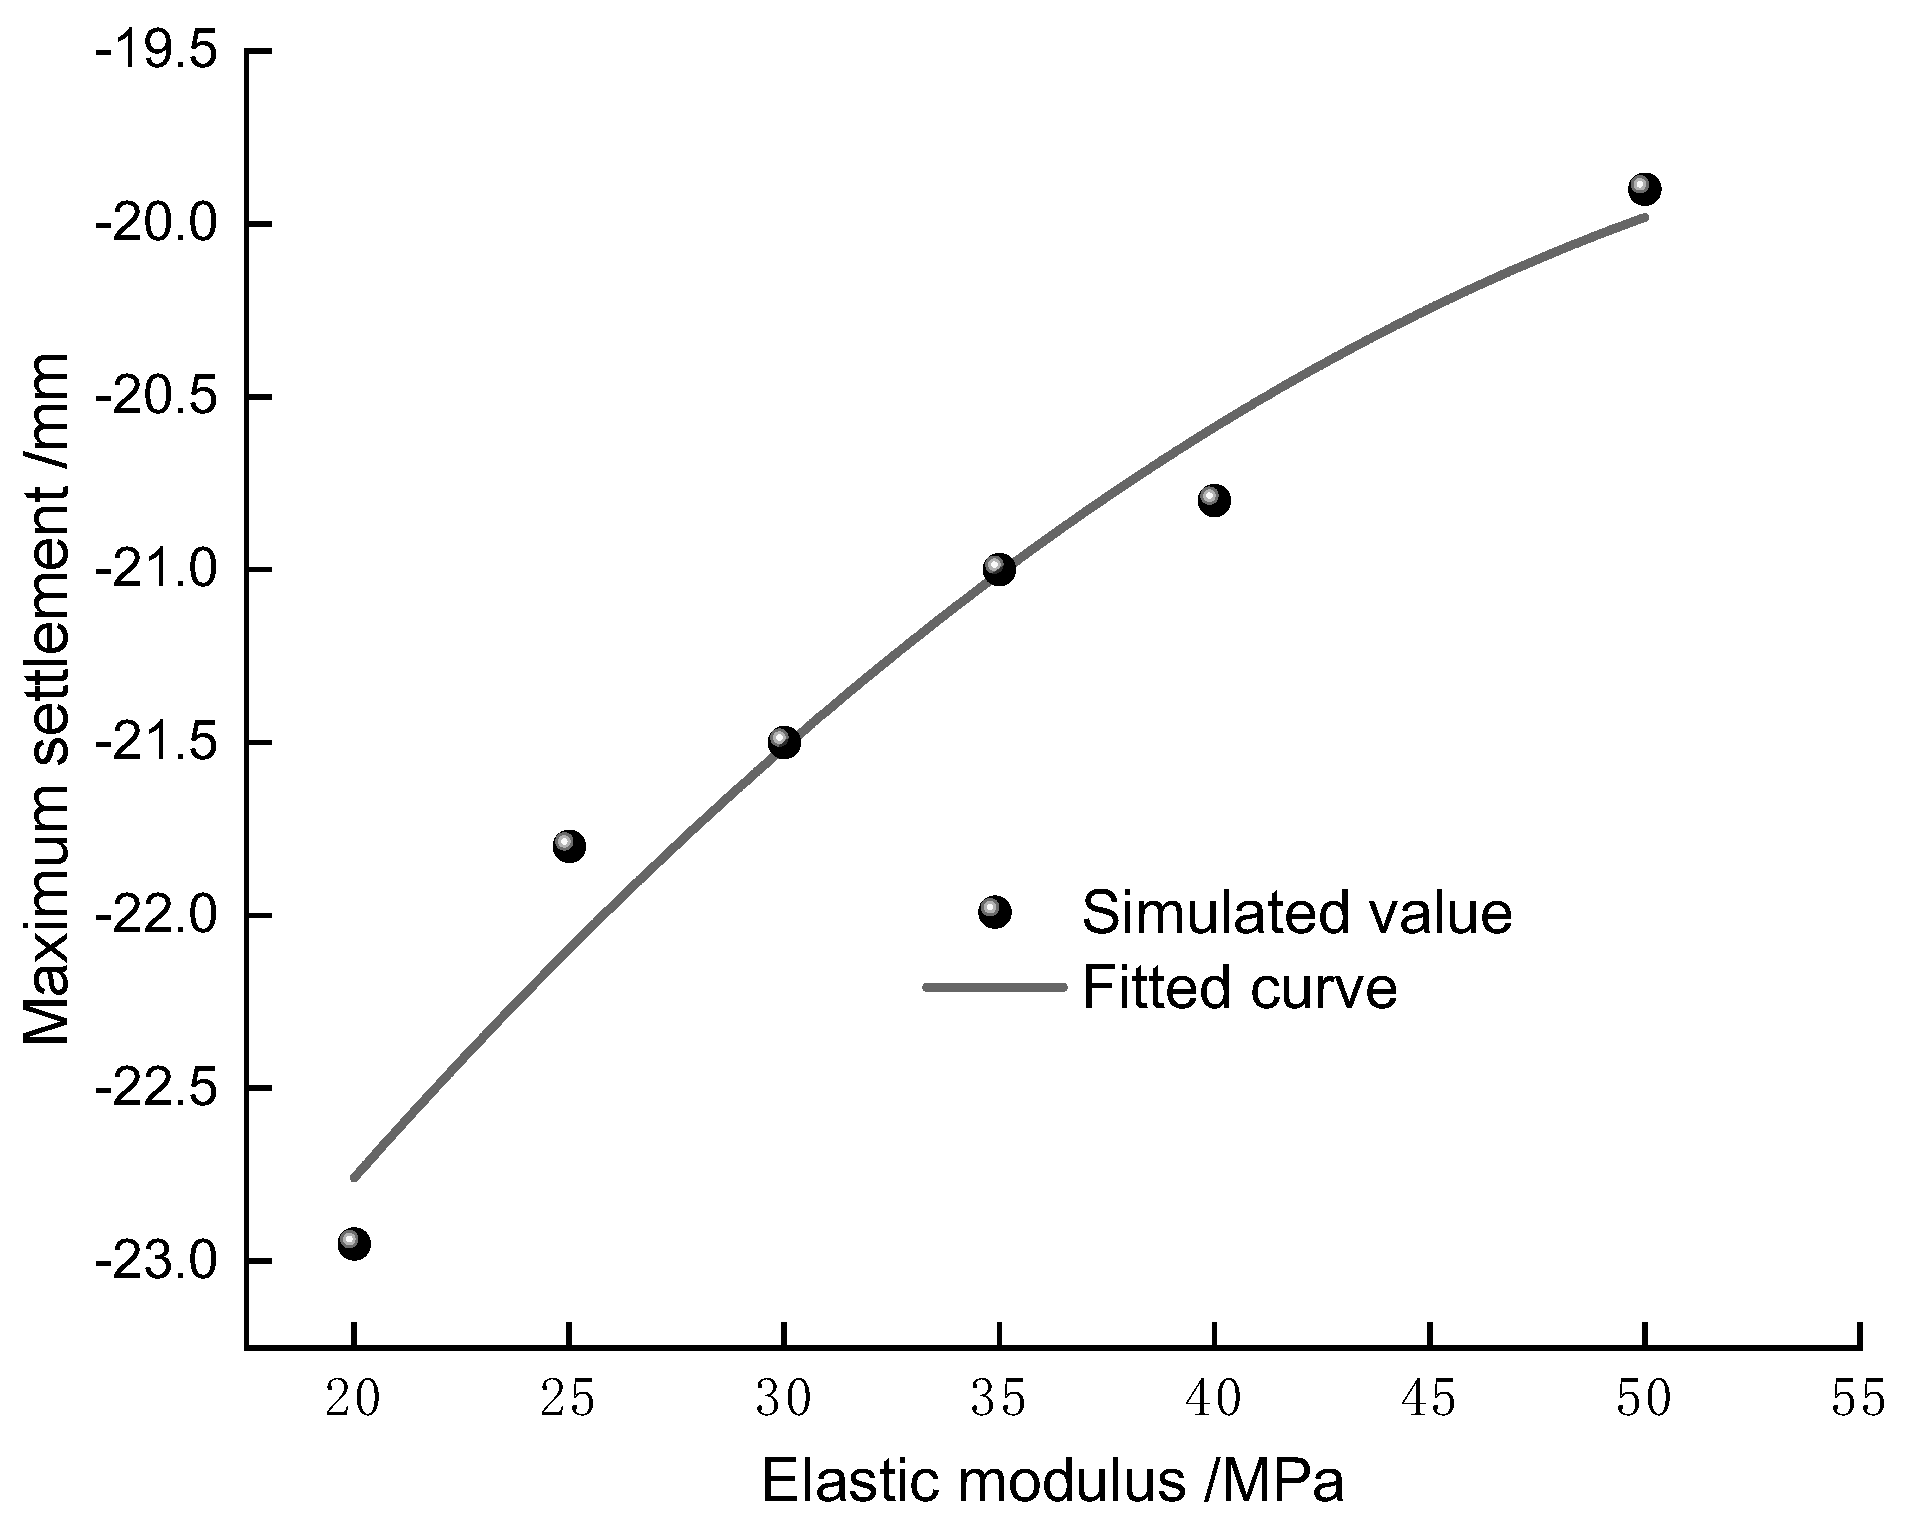
Data processing was carried out on the elastic modulus and maximum surface settlement of the tunnel roof in cohesive soil, and the results are shown in
Figure 9. From the figure, it can be seen that under earthquake action, the elastic modulus of cohesive soil and the maximum surface settlement of the tunnel roof vary in a parabolic relationship. With the increase of the elastic modulus, the maximum surface settlement of the tunnel roof gradually decreases. This is because the increase in the elastic modulus of the soil layer leads to an increase in its stiffness index, and the deformation of the soil layer is smaller under earthquake action. The elastic modulus and maximum settlement value of cohesive soil are shown in
Figure 8. For every 5 MPa increase in the elastic modulus, the corresponding maximum surface settlement of the tunnel roof decreases by about 1 mm. The fitting formula is organized as follows:
Where Sx is the maximum settlement value in mm, and A is the elastic modulus in MPa. The coefficient R2 obtained from equation (3) is 0.94465, indicating a high degree of fit. The quadratic function relationship between the maximum settlement value of the tunnel roof (mm) and the elastic modulus (MPa) is very obvious, and the parabola opens downward. With the increase of the elastic modulus, the maximum settlement of the tunnel roof continuously decreases.
4.2. The Impact of Cohesion on Ground Settlement at the Top of the Tunnel
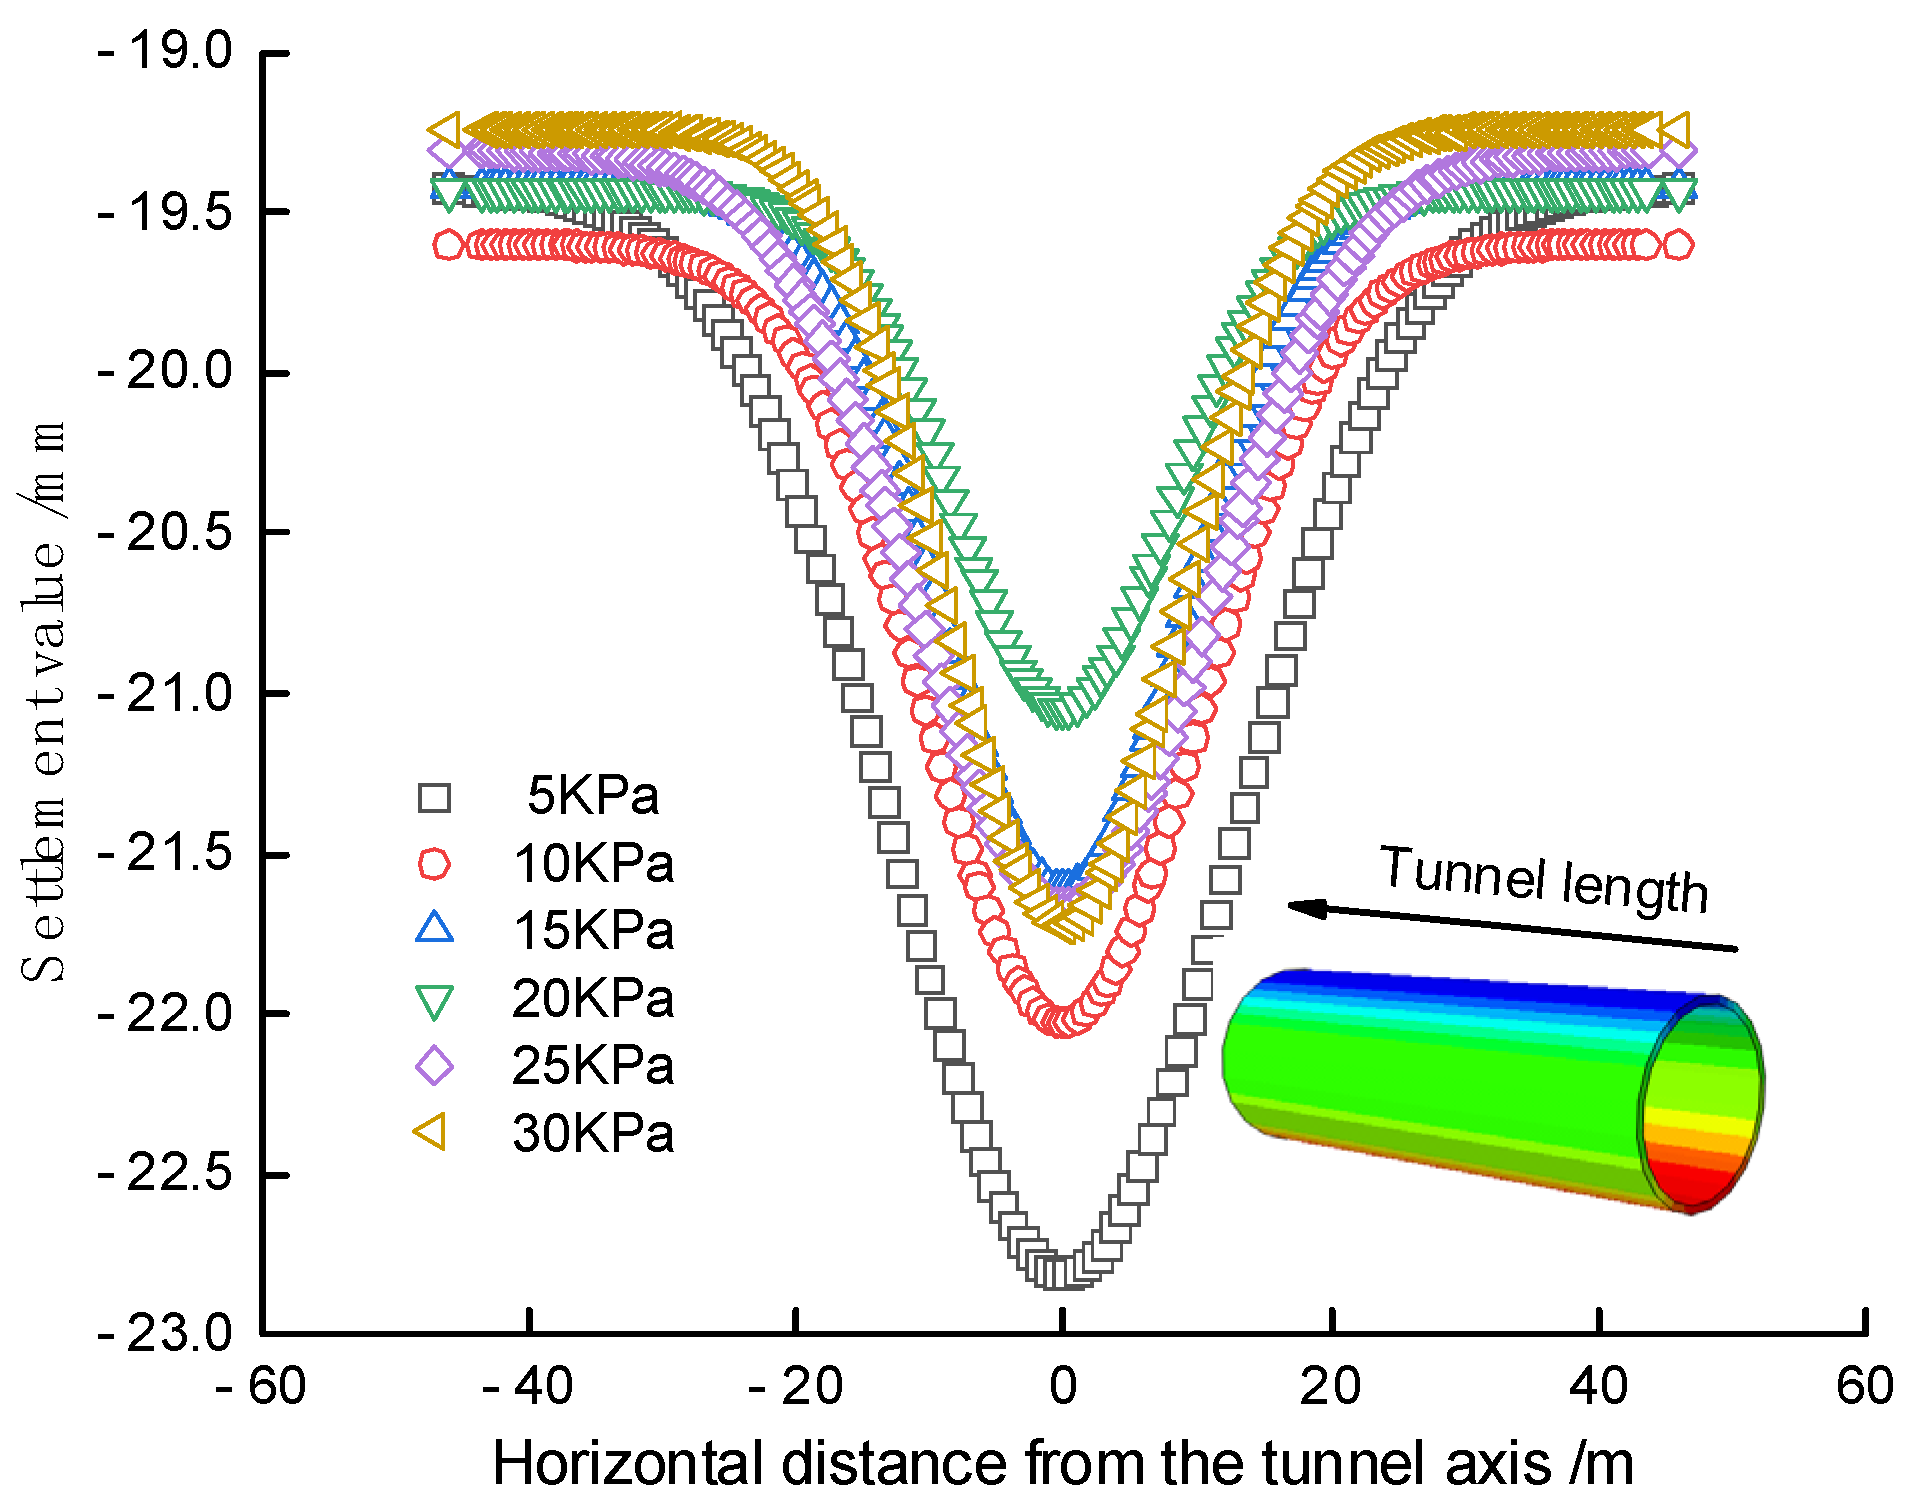
The influence of cohesion on the surface settlement of the tunnel roof was studied by changing only the cohesion of the soft soil under earthquake conditions. The cohesion of the soft soil was set to 5kPa, 10kPa, 15kPa, 20kPa, 25kPa, and 30kPa respectively. By analyzing the calculation results, the variation law of the surface settlement of the tunnel roof with the cohesion of the soft soil under El-Centro wave action was studied. The influence of cohesion on the surface settlement of the tunnel roof is shown in
Figure 9.
From
Figure 10, it can be seen that the curve of the surface settlement of the tunnel roof is symmetrical and U-shaped, and the settlement gradually tends to be horizontal along the center axis of the tunnel. With the increase of the cohesive force of the soil layer, the surface settlement of the tunnel roof continuously decreases. Under different cohesive forces, the surface settlement of the tunnel roof is larger in the middle and smaller on both sides. However, the change in settlement is relatively small. In the range of 25kPa to 30kPa, the surface settlement of the tunnel roof basically does not change with the increase of the cohesive force.
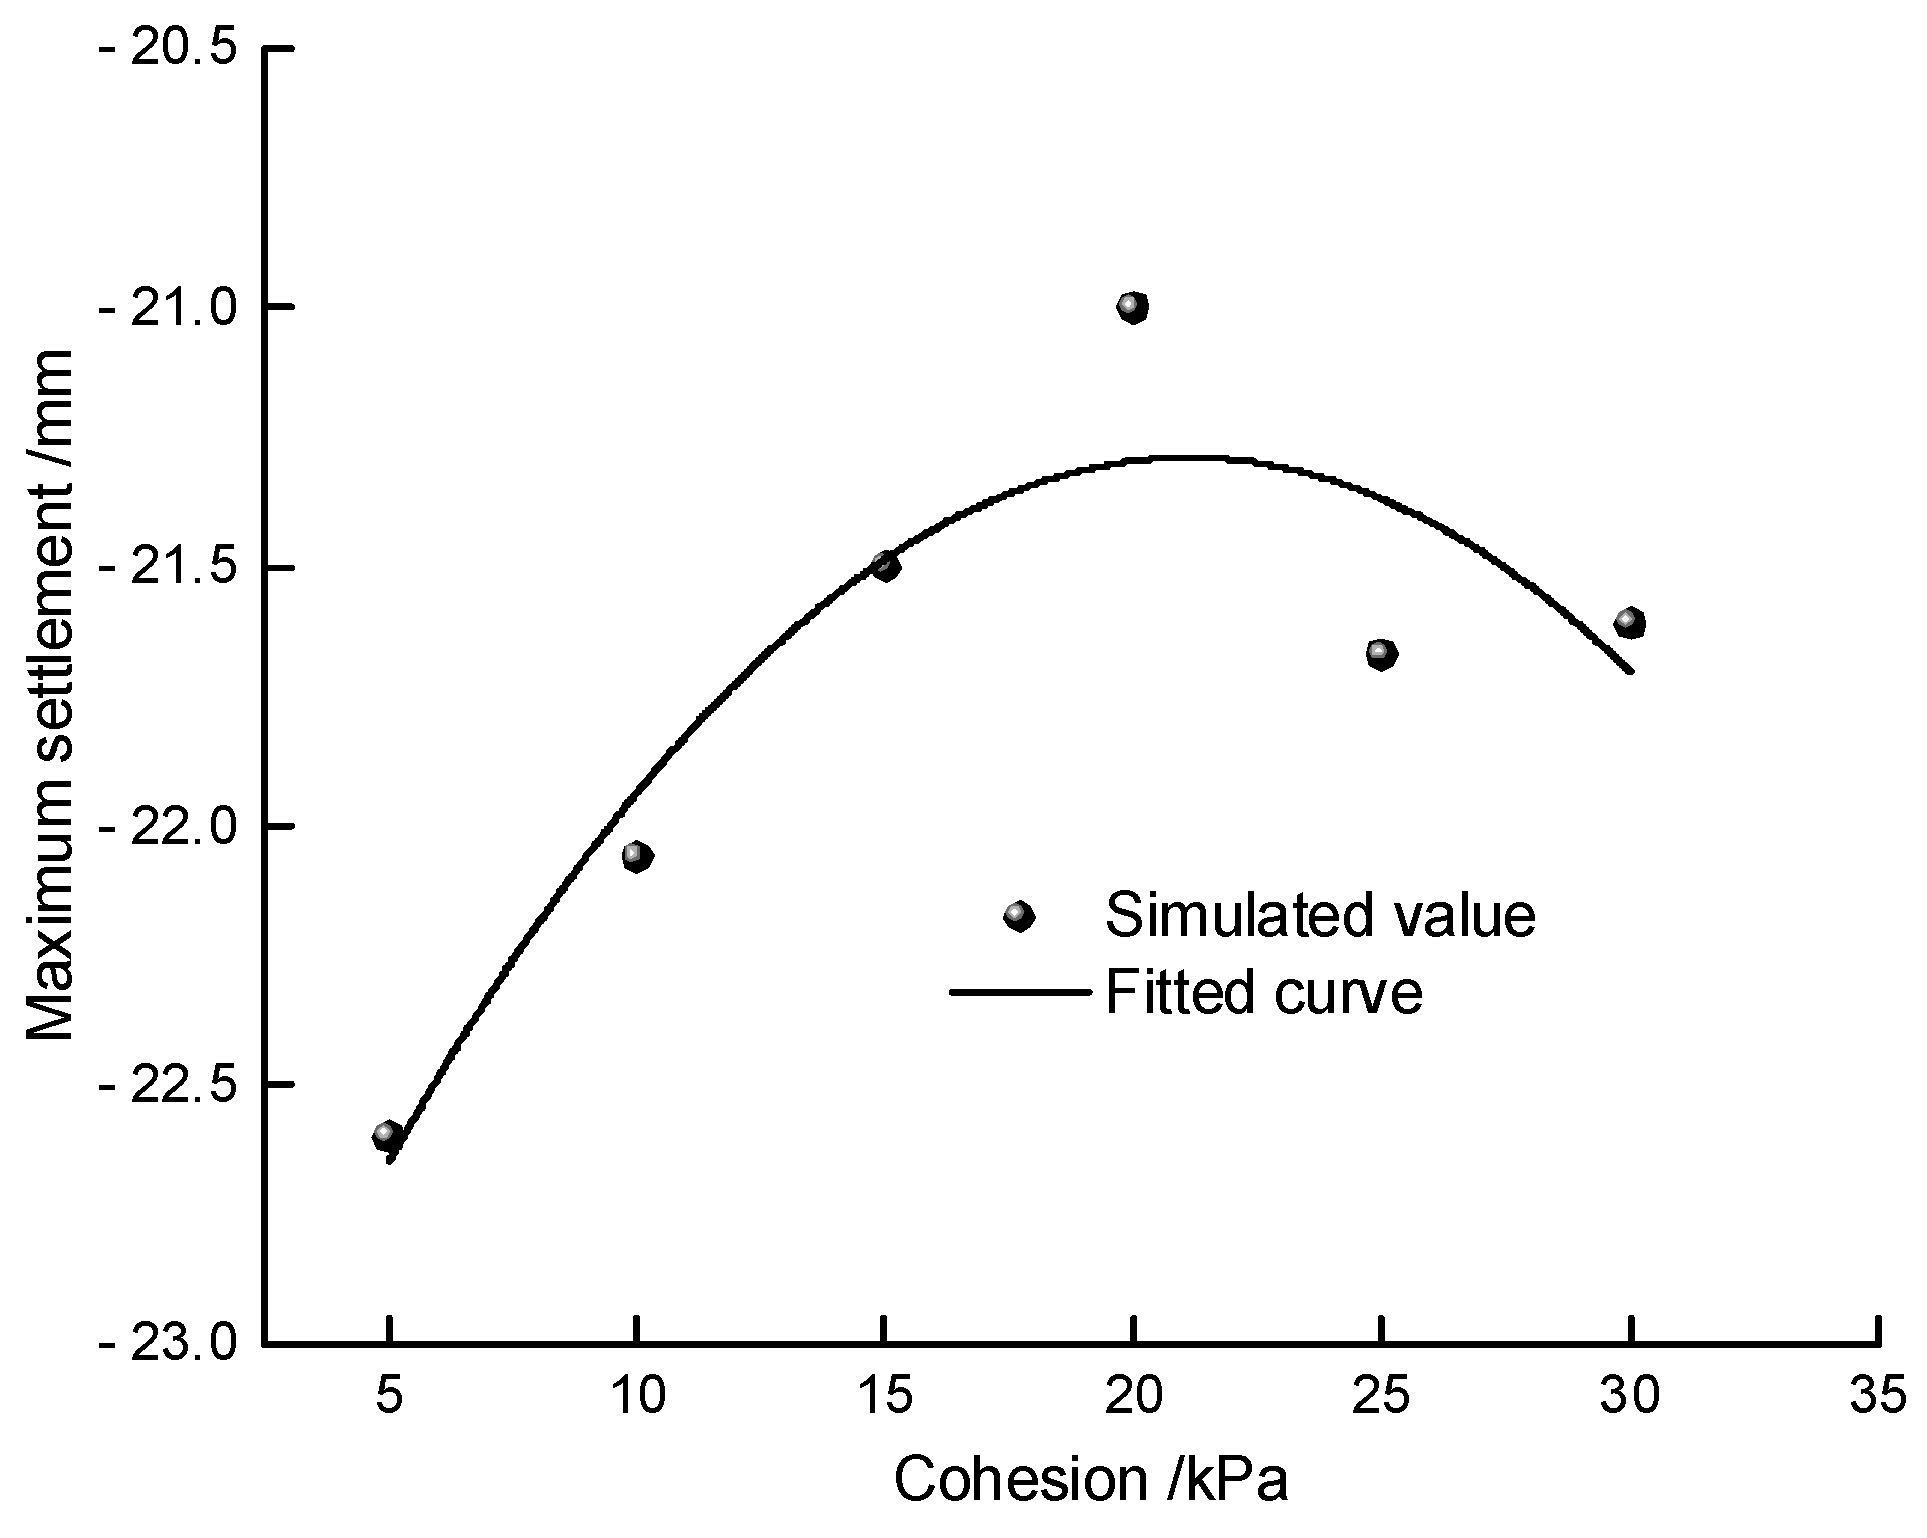
Data processing was carried out on the cohesive force of the silty clay and the maximum settlement value of the tunnel's top surface, and the results are shown in
Figure 11. As shown in the figure, the maximum settlement value of the tunnel's top surface decreases as the cohesive force increases for cohesive forces of 5kPa, 10kPa, 15kPa, and 20kPa, and it remains stable for cohesive forces of 25kPa and 30kPa. Therefore, the optimal cohesive force for controlling the maximum settlement value of the tunnel's top surface is approximately 20kPa. The fitting formula obtained from the organized data is:
where
Sx is the maximum settlement value in mm, and
B is the cohesive force in kPa.
Formula (4) is a quadratic function that represents the maximum settlement value of the tunnel's top surface under seismic action and the cohesive force of the silty clay. The determination coefficient of the fitting, R2, is 0.76736, which is lower than the linear fitting of the elastic modulus.
4.3. The Impact of Poisson's Ratio on Ground Settlement at the Top of the Tunnel
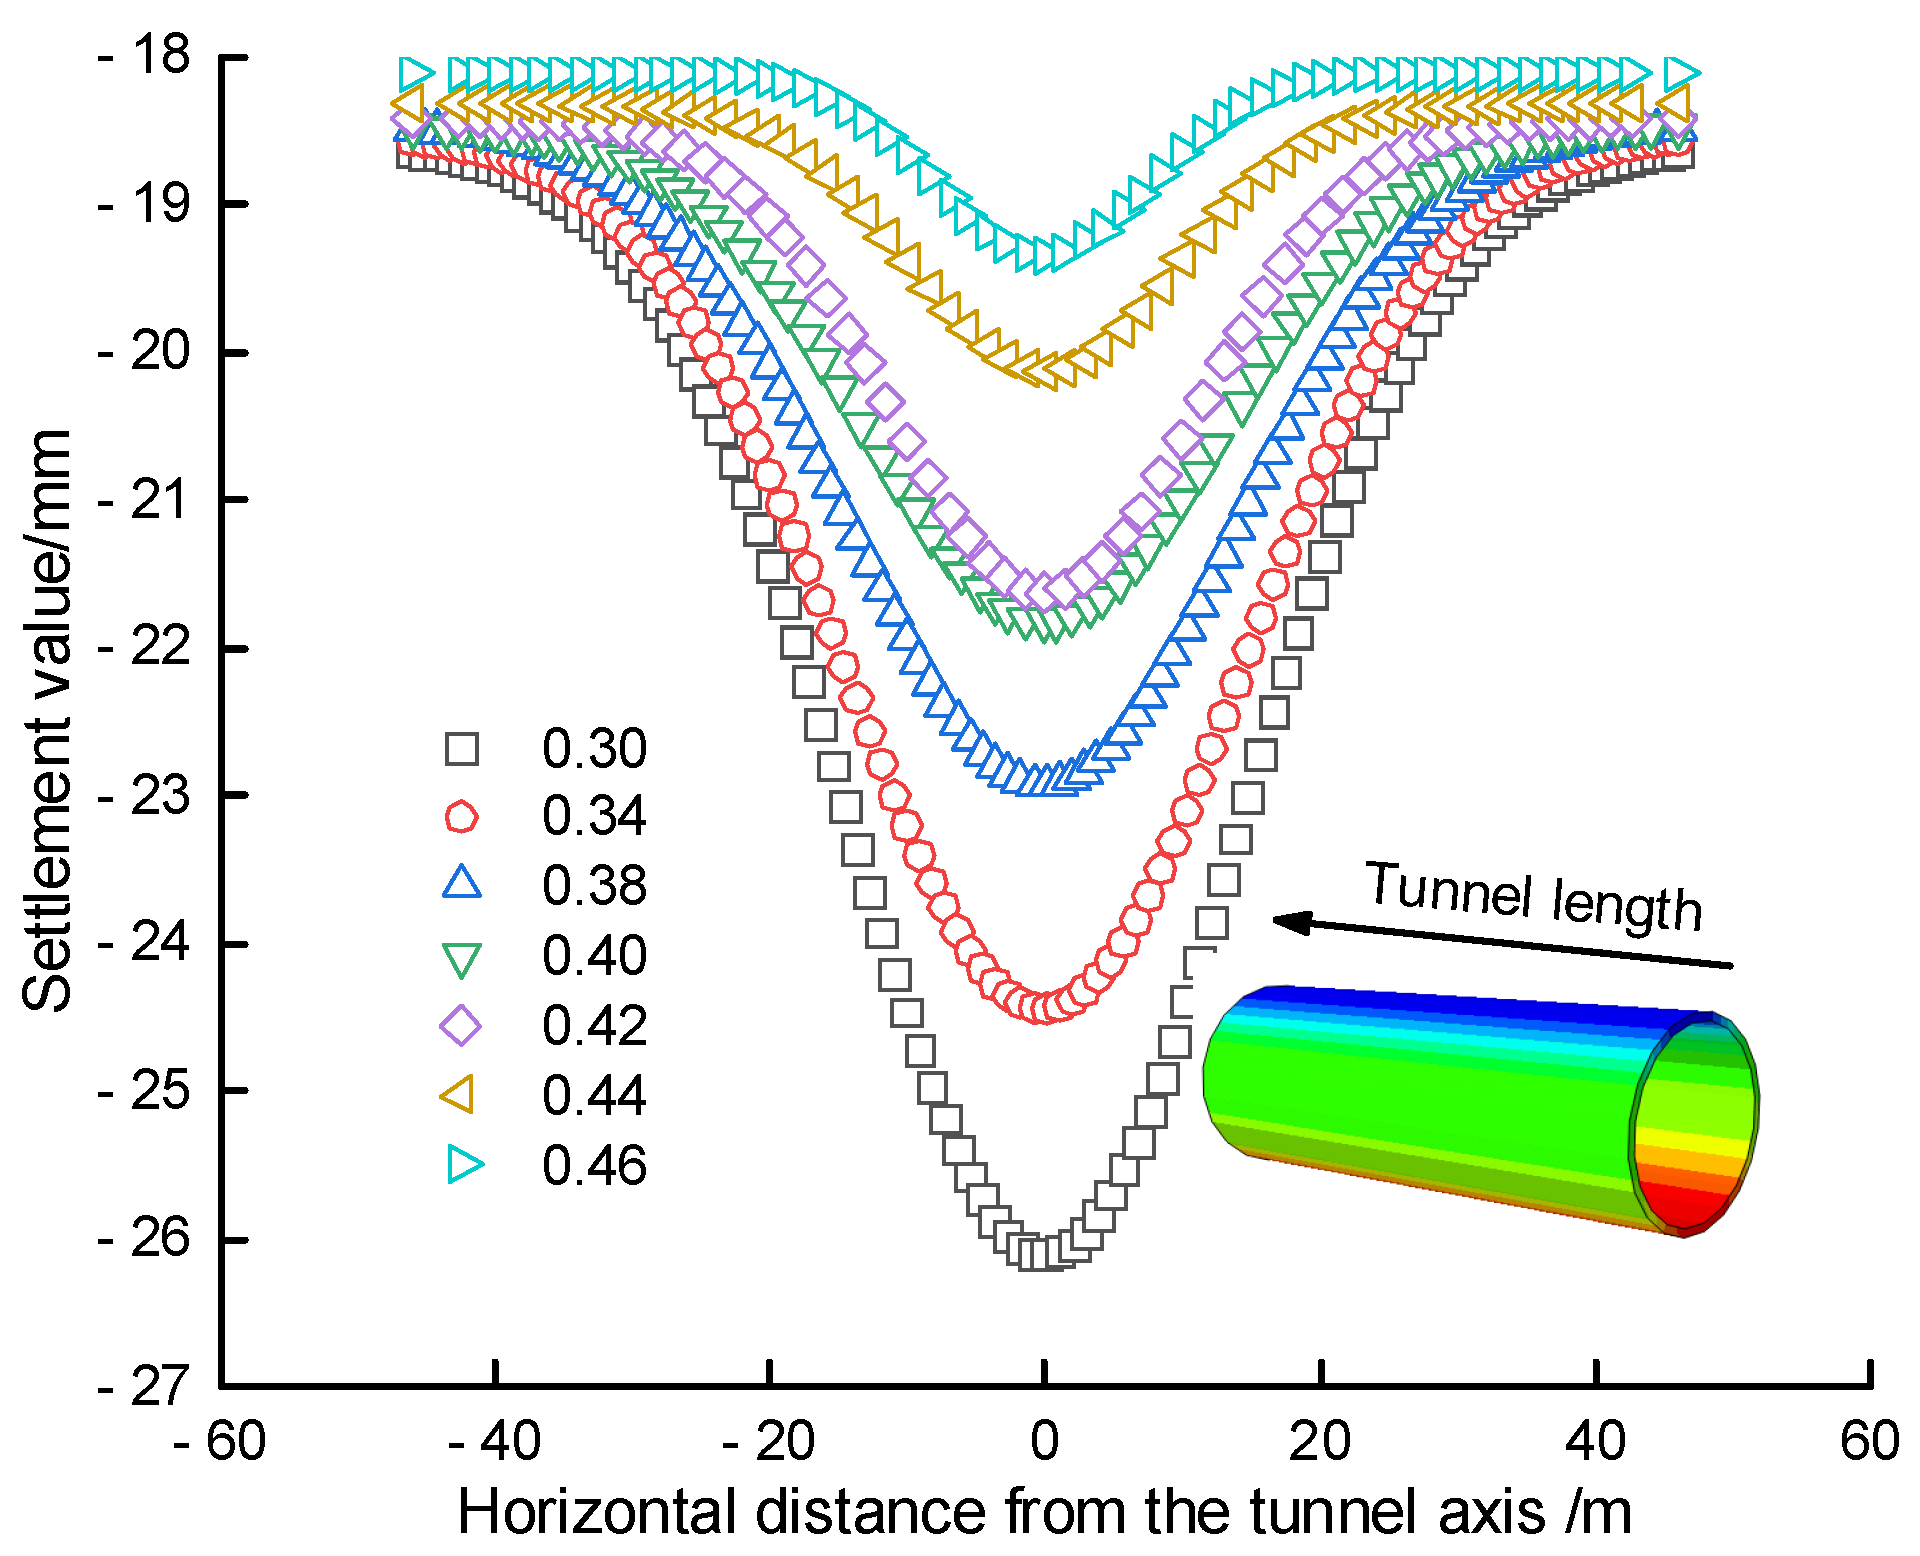
The soil's Poisson's ratio is an important physical property index that reflects the initial density of the soil and to some extent, its ability to resist deformation. By only changing the Poisson's ratio of the silty clay and keeping other parameters constant, the results were calculated for Poisson's ratios of 0.30, 0.34, 0.38, 0.40, 0.42, and 0.46. The results were analyzed to study the changes in the settlement of the tunnel's top surface with the change in the Poisson's ratio of the silty clay under the action of the vertical self-weight and El-Centro wave. The simulated and organized data are shown in
Figure 12.
It can be observed that under seismic action, the maximum settlement of the tunnel's top surface gradually decreases with the increase in the Poisson's ratio. The settlement at Poisson's ratios of 0.3 and 0.34 differ significantly, while the settlement at Poisson's ratios of 0.4 and 0.42 differ slightly. The settlement of the tunnel's top surface varies significantly for Poisson's ratios between 0.38 and 0.42, meeting the settlement requirements.
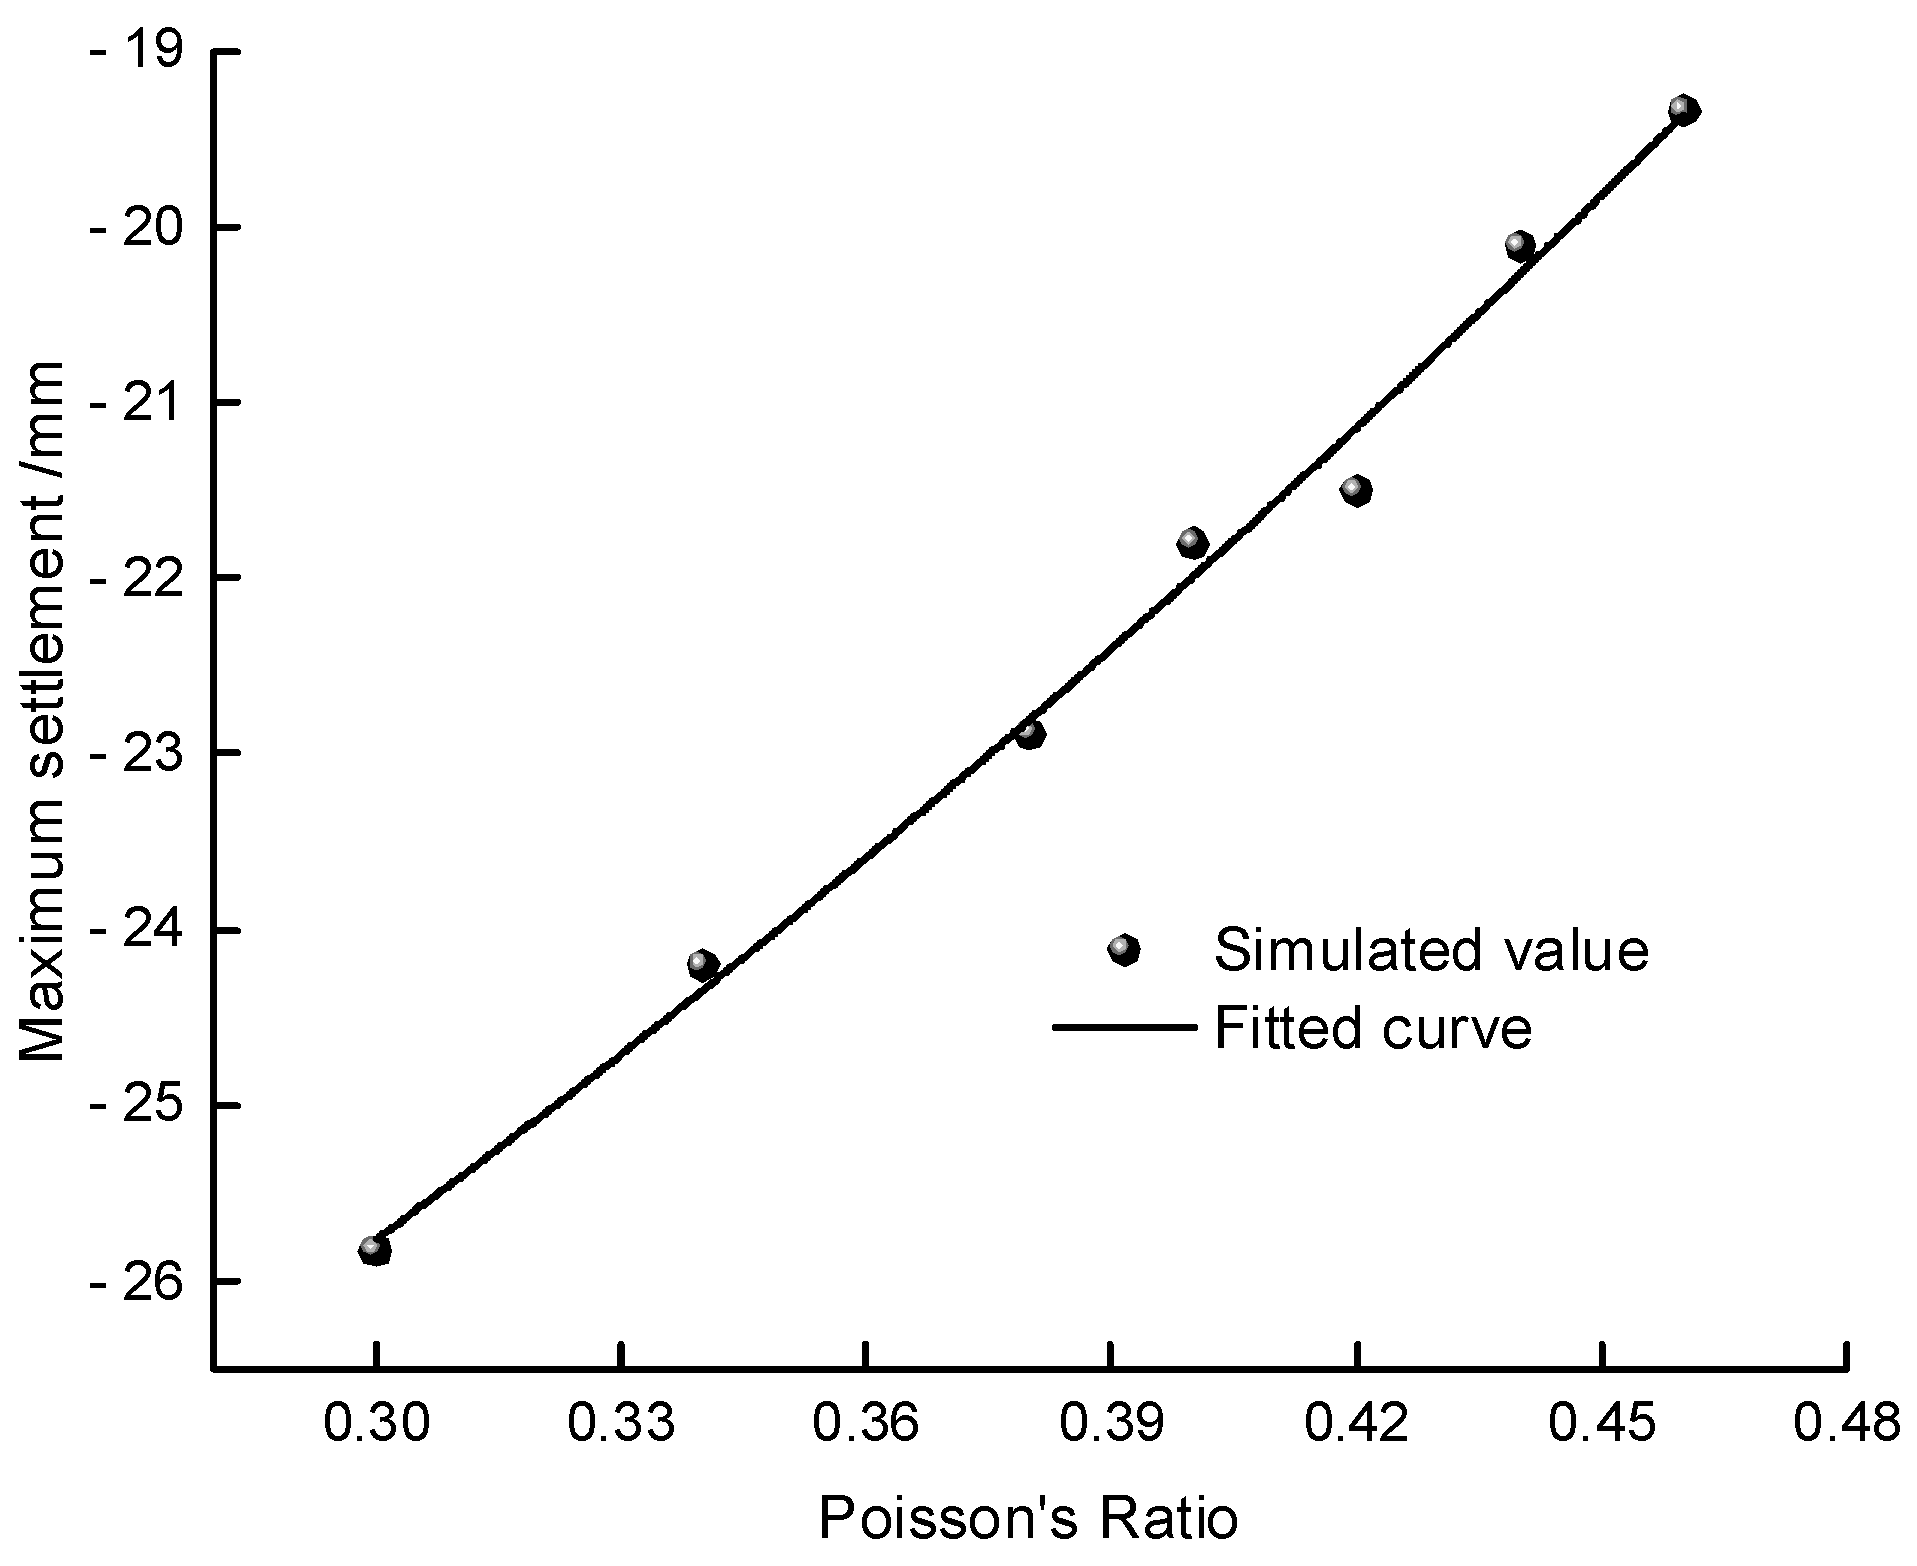
The data processing was carried out on the Poisson's ratio of the silty clay and the maximum settlement value of the tunnel's top surface, and the results are shown in
Figure 13. It can be observed that the maximum settlement value of the tunnel's top surface gradually decreases as the Poisson's ratio increases. As the Poisson's ratio increases from 0.3 to 0.46, the maximum settlement value decreases sequentially, and the value changes significantly from 25.83mm to 19.34mm, indicating that the Poisson's ratio has a significant impact on the settlement value. The fitting formula is:
where
Sx is the maximum settlement value in mm, and
C is the Poisson's ratio.
From formula (5), it can be derived that the Poisson's ratio and the maximum settlement of the tunnel roof surface are in a quadratic function relationship. Therefore, the optimal Poisson's ratio for controlling the maximum settlement of the tunnel roof surface in soft soil is approximately 0.46. The surface settlement value increases with the increase of the Poisson's ratio, and the determined coefficient R2 of the fitting is 0.98926, which is higher than the linear fitting of the elastic modulus.
4.4. The Impact of Internal friction angle on Ground Settlement at the Top of the Tunnel
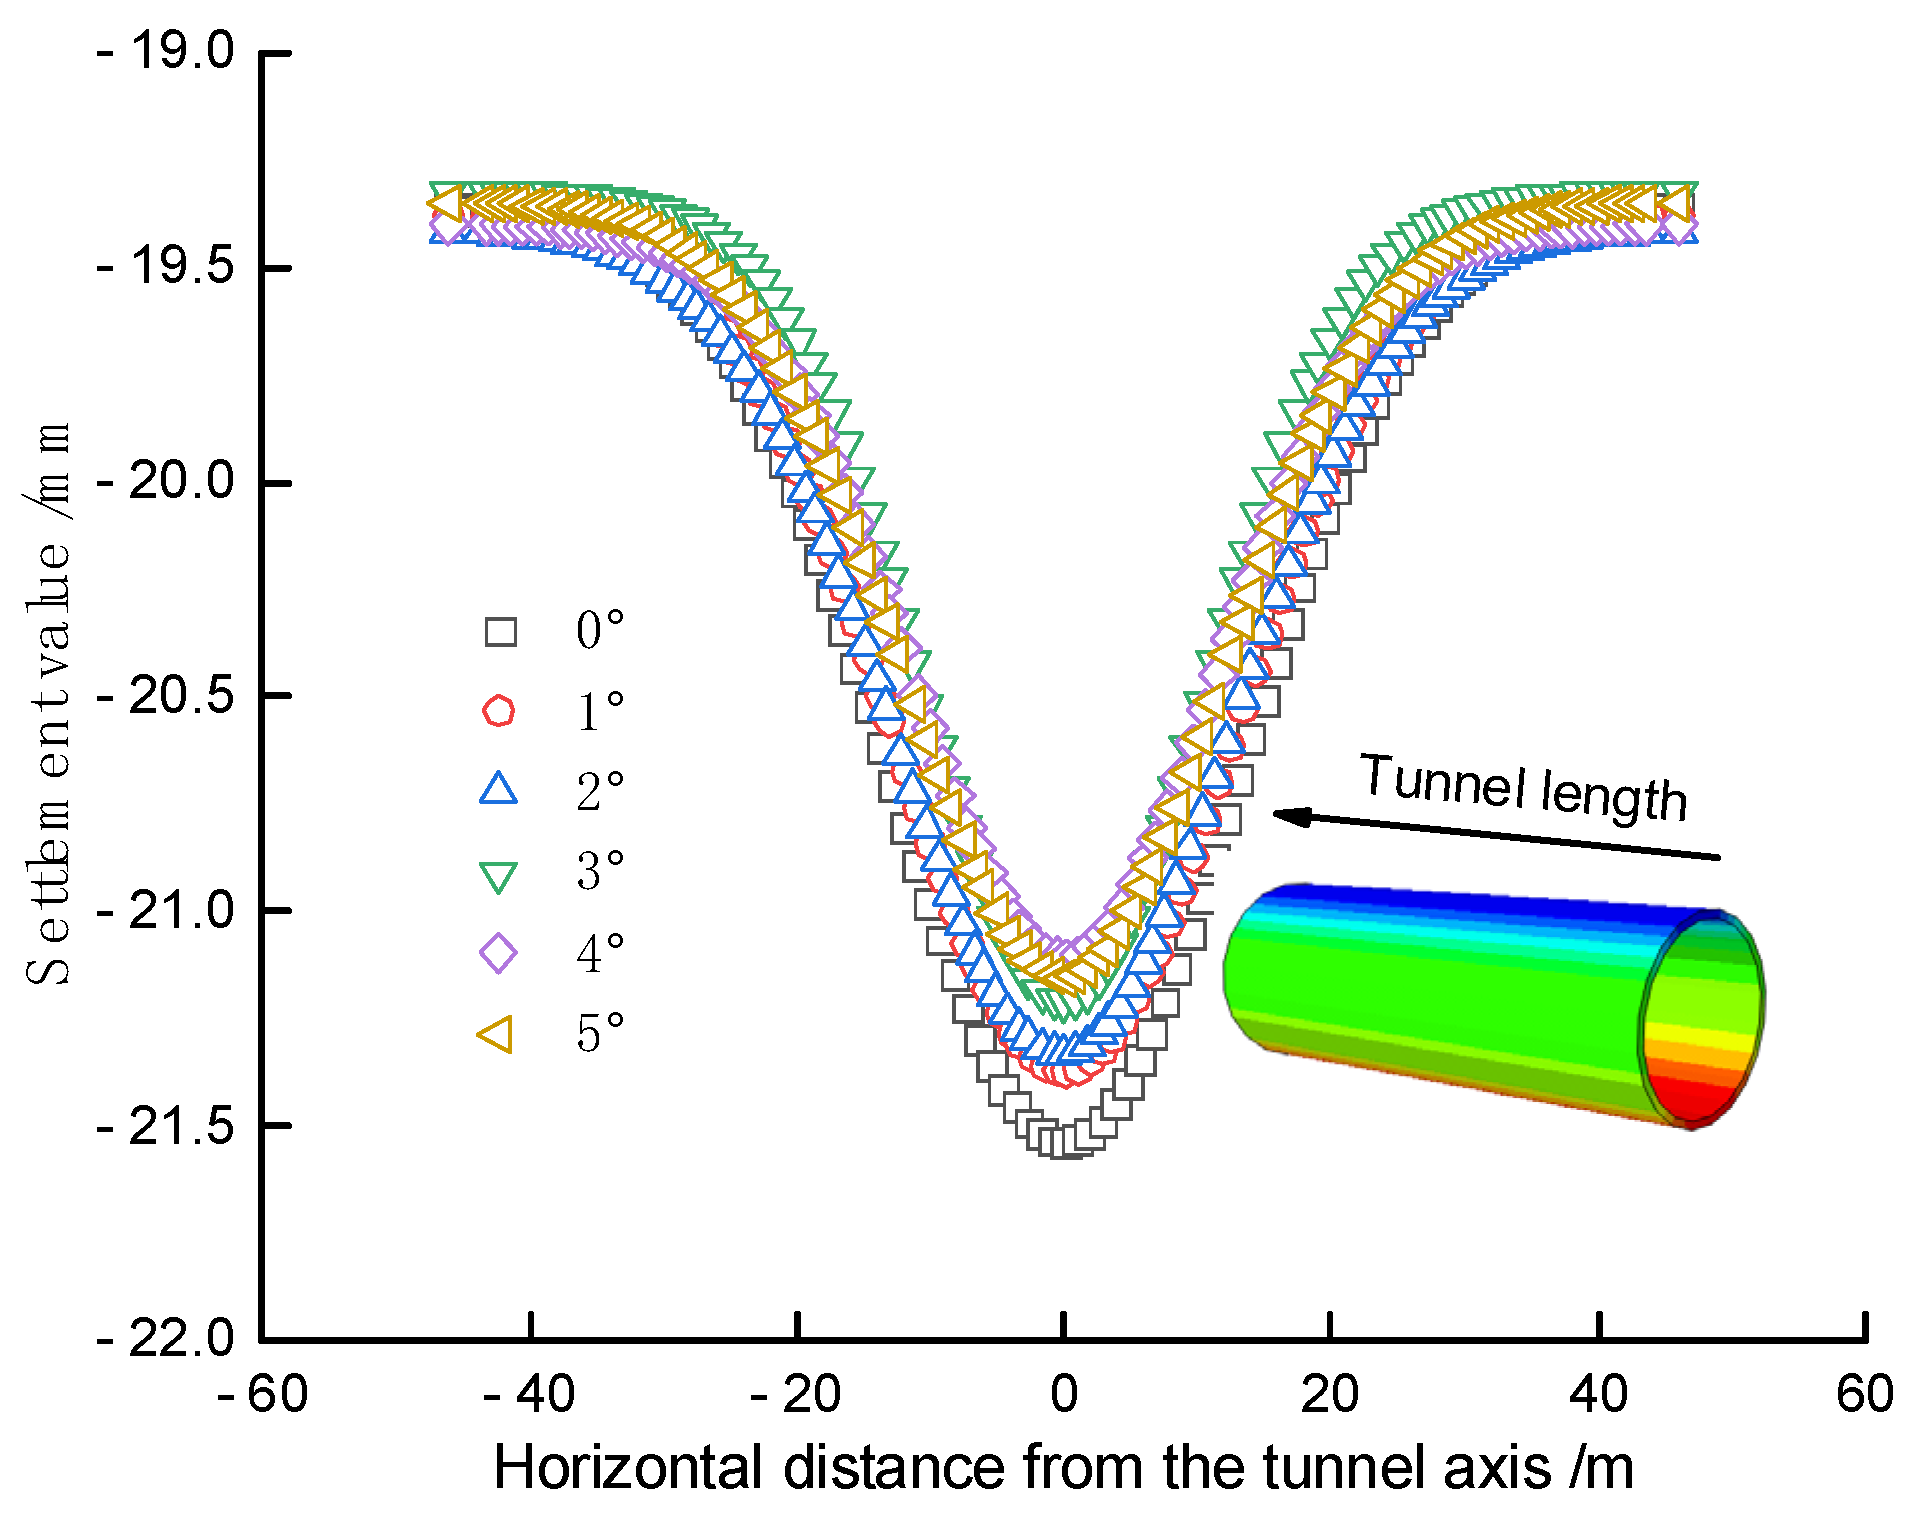
The internal friction angle is one of the parameters that affect the performance of soft soil. Keeping other parameters constant and only changing the internal friction angle of the soft soil, the situations with internal friction angles of 0°, 1°, 2°, 3°, 4°, and 5° are calculated, and the simulation results are shown in
Figure 14. The results show that changing the internal friction angle of the silty soil has no significant effect on the settlement of the tunnel roof surface.
4.5. The Impact of Various Factors on Ground Maximum Settlement at the Top of the Tunnel
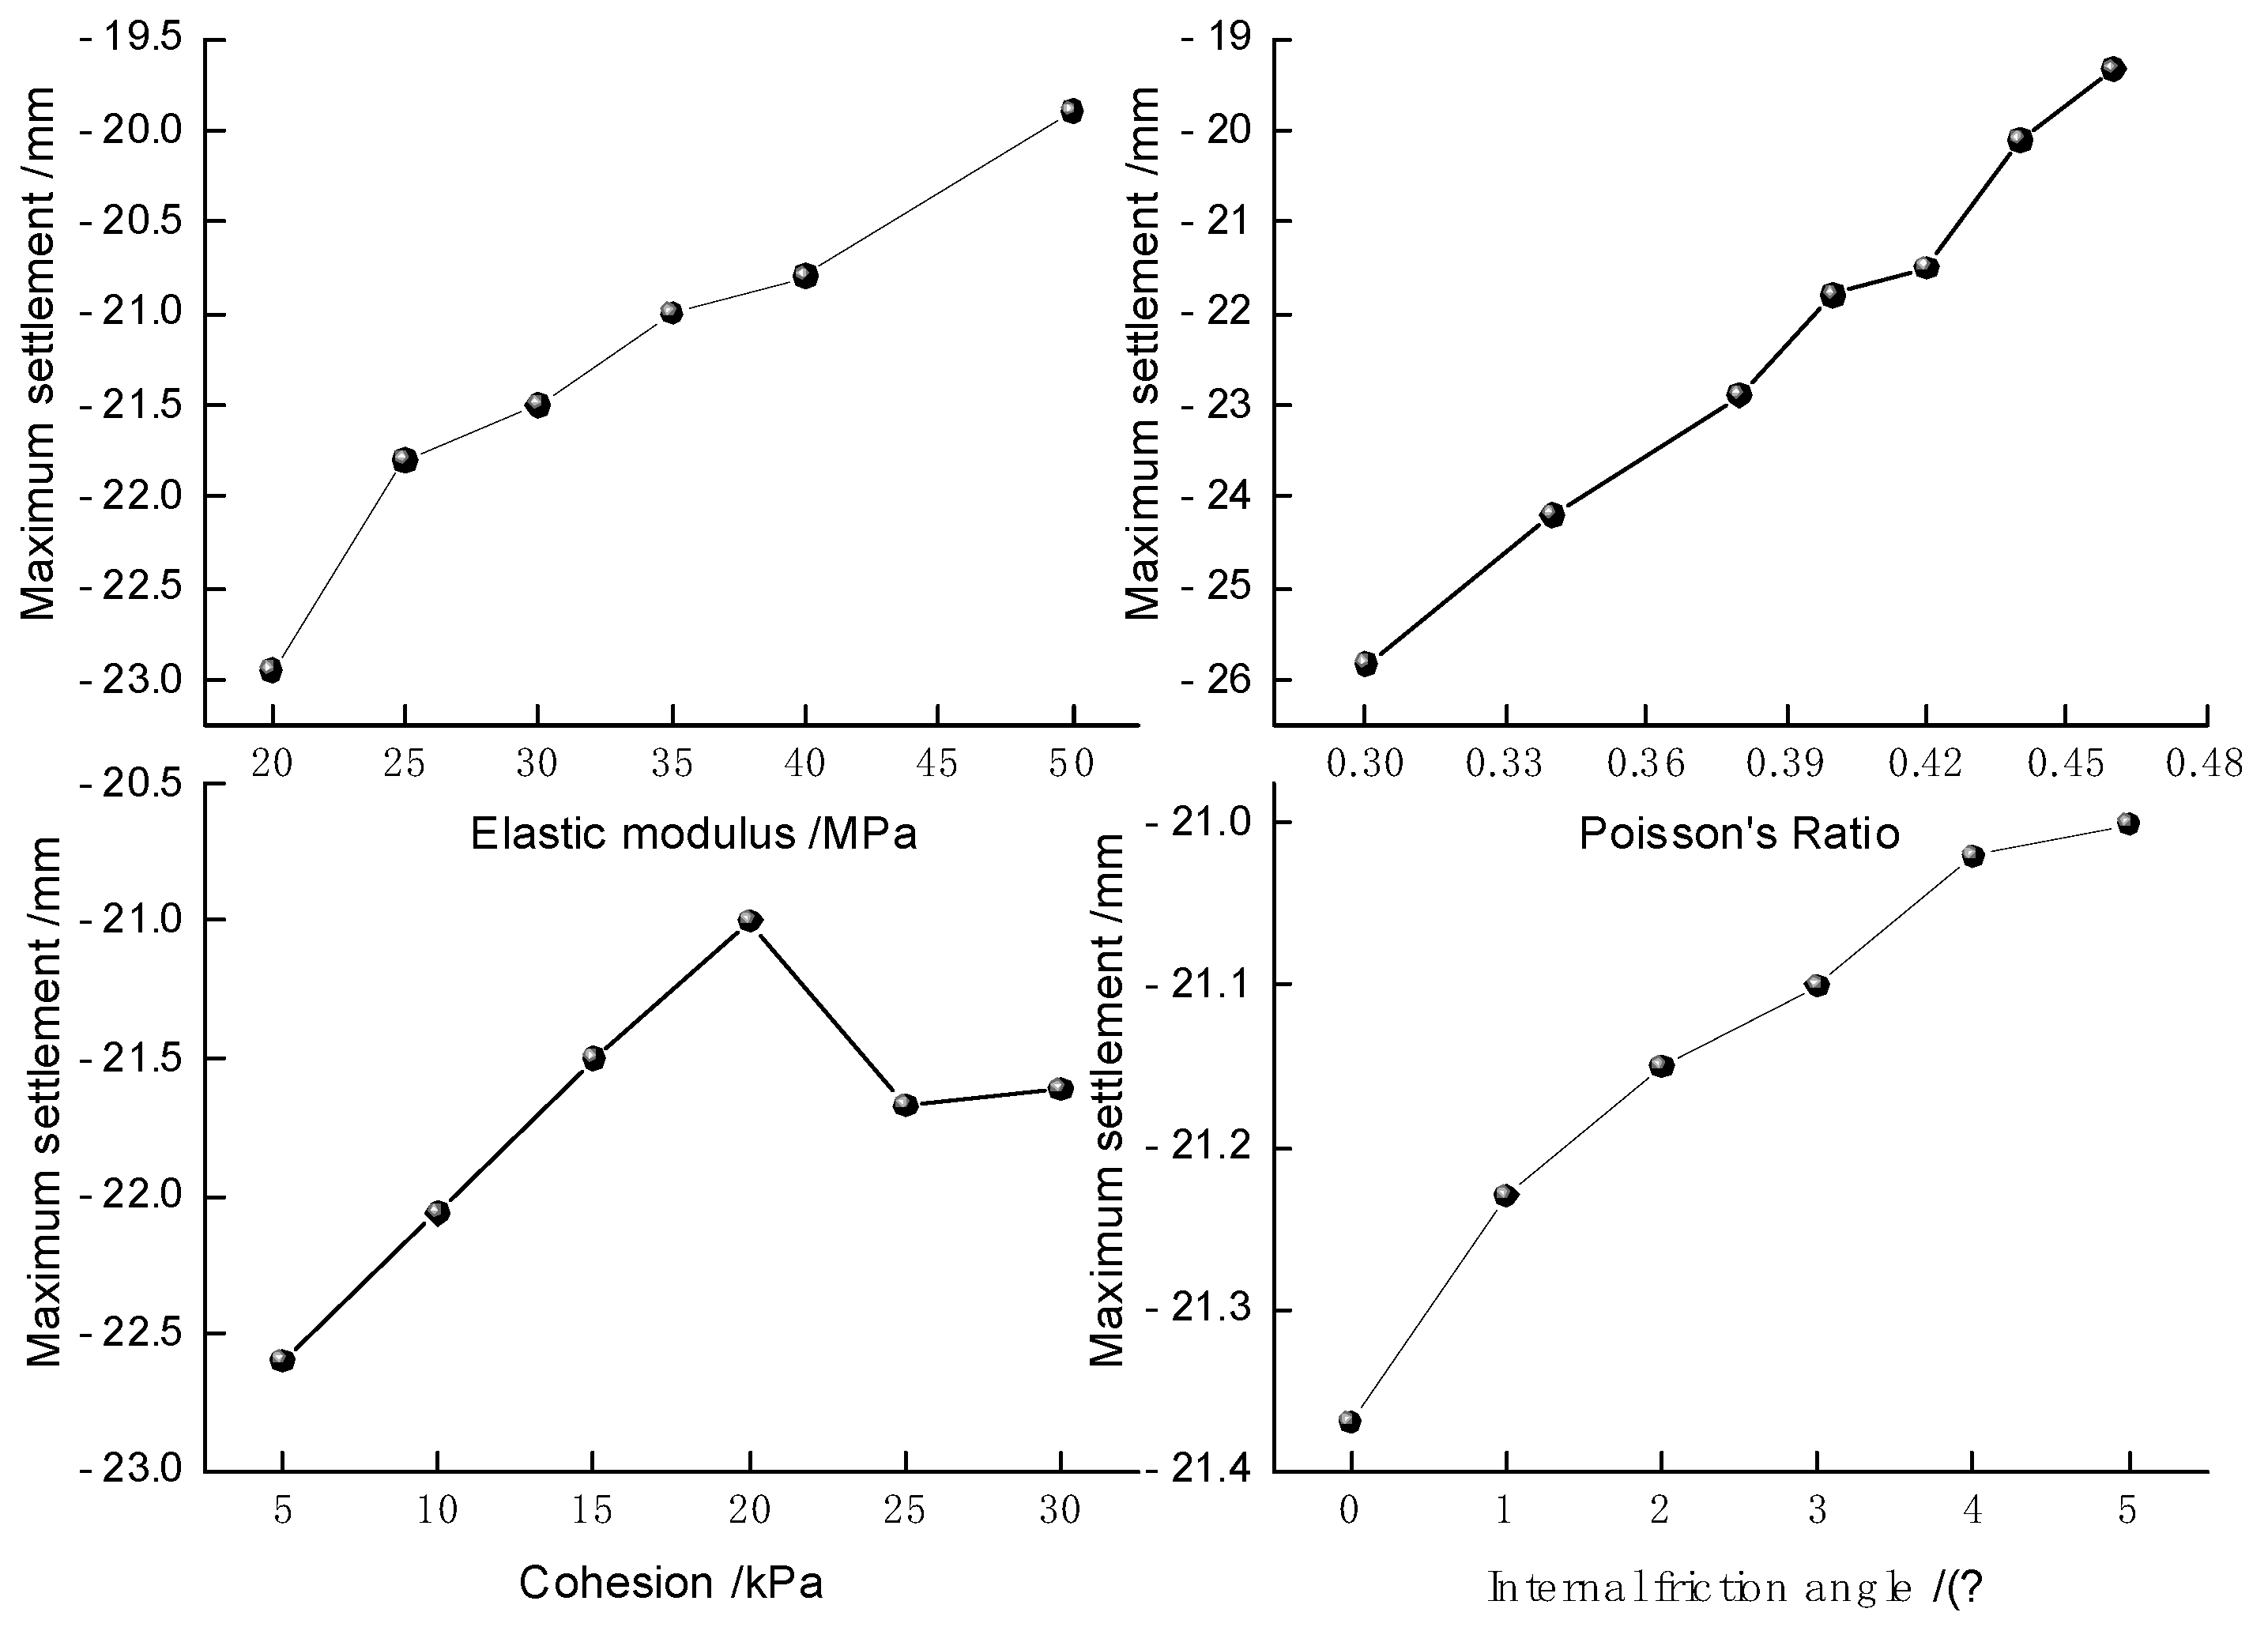
The influence of various factors on the maximum settlement of the tunnel roof surface is shown in
Figure 15 under seismic action. From the figure, it can be seen that when the elastic modulus of the soft soil is 20MPa, the maximum settlement value of the tunnel roof surface is -22.96mm; when the elastic modulus is 25MPa, the maximum settlement value is -21.88mm; when the elastic modulus is 50MPa, the maximum settlement value is -19.9mm; when the elastic modulus of the soft soil is 30MPa, 35MPa, and 40MPa, the maximum settlement does not exceed the standard value of 30mm. The relationship between the cohesive force of the soft soil and the settlement of the tunnel roof surface is: when the cohesive force is 5KPa, the maximum settlement of the tunnel roof surface is -22.6mm; when the cohesive force is 25KPa, the maximum settlement is -21.67mm; when the cohesive force is 30KPa, the maximum settlement is -21.61mm. The settlement of the tunnel roof surface under soft soil cohesive forces of 15KPa, 25KPa, and 30KPa varies little. When the cohesion is between 5 kPa and 20 kPa, the settlement of the tunnel roof surface tends to decrease as the cohesion increases. However, when the cohesive force increases to 20KPa, the maximum settlement value of the tunnel roof surface stabilizes.
In summary, increasing the cohesive force of the soft soil reduces the settlement of the tunnel roof surface, and after reaching a certain value, the maximum settlement tends to stabilize. In addition, the influence of the cohesive force of the soft soil on the settlement of the tunnel roof surface is lower than that of the elastic modulus of the soil layer. Therefore, blindly increasing the cohesion of soft soil to reduce the settlement of the tunnel roof surface is not feasible. Instead, a reasonable treatment of the soft soil layer should be carried out based on the actual project. The maximum settlement of the tunnel roof surface decreases continuously with the increase of the soft soil's Poisson's ratio, indicating that the Poisson's ratio of soft soil has the greatest impact on the settlement of the tunnel roof surface. As the internal friction angle increases from 0° to 5°, the range of maximum settlement values of the tunnel roof surface changes between 21mm and 21.4mm, and the settlement of the tunnel roof surface does not change significantly with the variation of the internal friction angle.
5. Orthogonal Experiment
5.1. Orthogonal Experimental Design
The orthogonal experimental design uses the method of "uniform distribution and comparability" to greatly simplify the experimental scheme, thereby reflecting the advantages of orthogonal experimental design. Orthogonal experimental design can obtain more scientific results and provide an effective calculation method for solving multi-factor optimal problems [
23,
24,
25]. There are many factors that affect the surface settlement of tunnel top under seismic action. According to the survey report of Dalian Metro Line 5 and the analysis results of Chapter 3, this section selects
E,
c, and
ν of silty clay soil parameters as the three factors of orthogonal experiment to establish a three-factor and three-level table, as shown in
Table 3. The specific orthogonal experimental scheme is shown in
Table 4.
5.2. Orthogonal Experimental Results
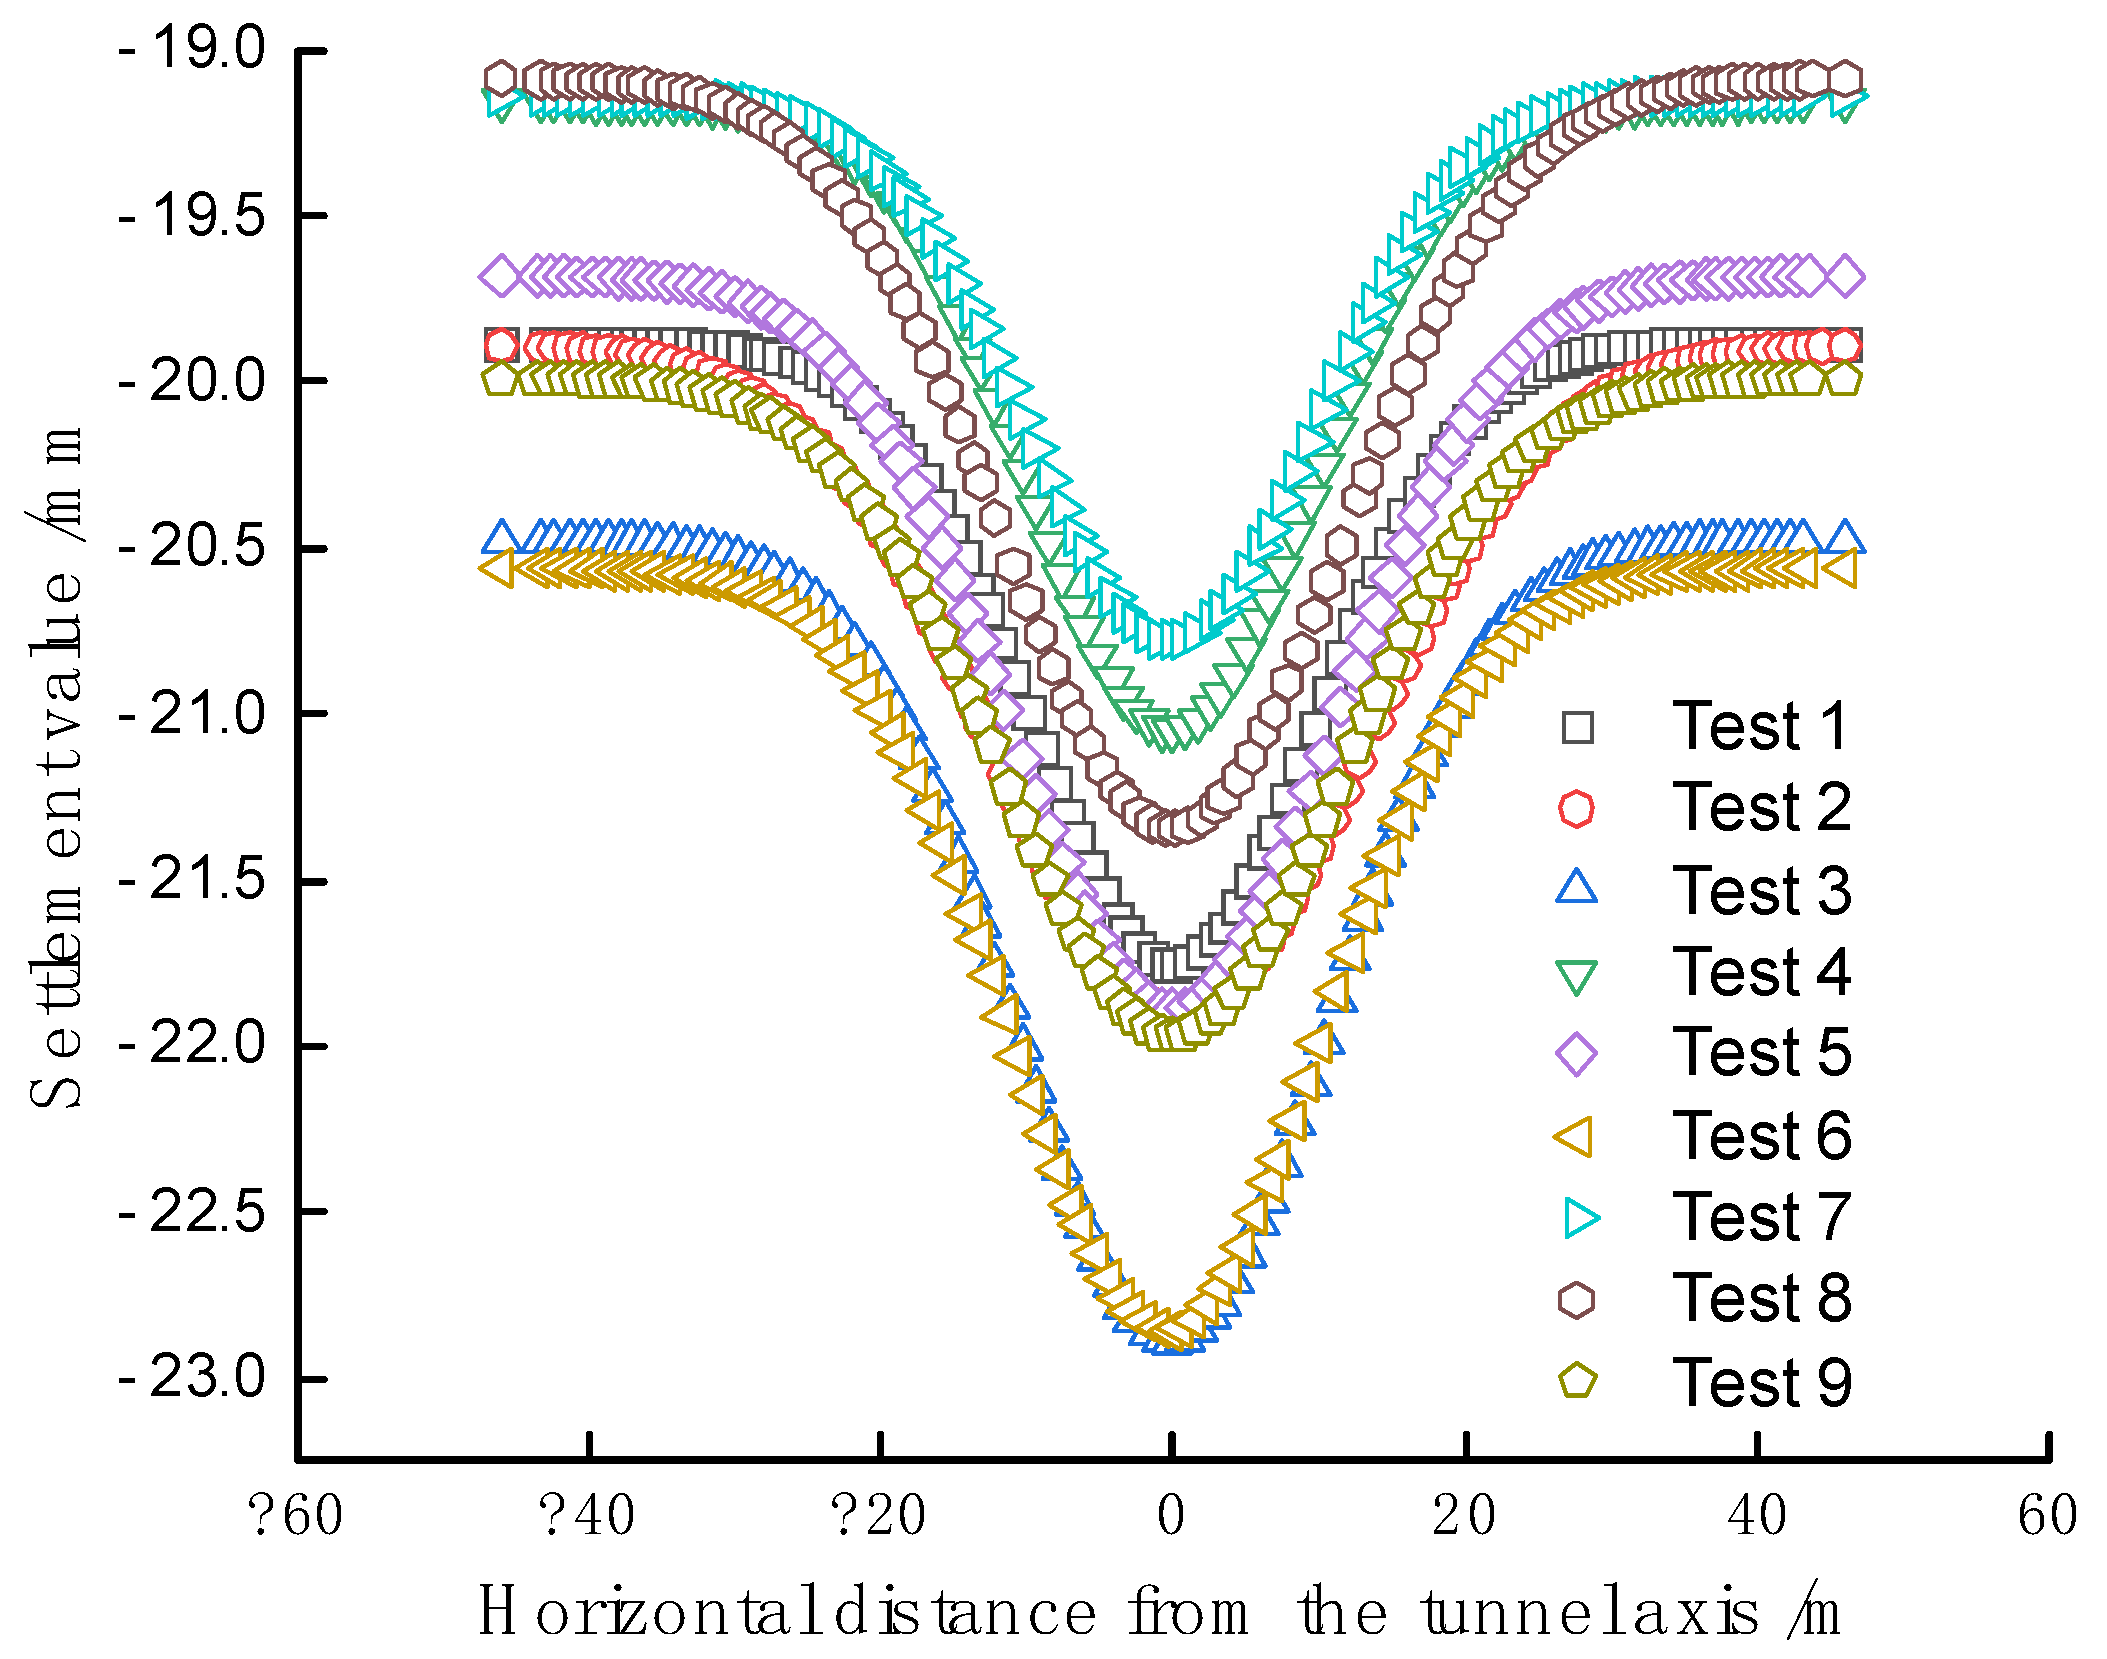
In order to ensure the credibility of the experimental results and reduce the influence of engineering unrelated factors, the orthogonal table was analyzed by modulus analysis using ABAQUS software for 9 times. The surface settlement curve of tunnel top is shown in
Figure 16. The maximum settlement meets the design requirements.
5.3. Sensitivity Analysis
The range analysis method is a simple, intuitive, and easy-to-understand algorithm. The range
Rj is used to analyze the influence of each factor on the evaluation index. The higher the
Rj value, the greater the corresponding factor's influence on the target parameter, and the higher its importance.
Where ki is the average value of the index corresponding to the i-th level and Ki, that is, ki=Ki/r, where r is the number of occurrences of any column at the same level.
By using the finite element software ABAQUS to perform numerical simulation analysis on the orthogonal experimental scheme, and taking the maximum surface settlement value of tunnel top in the analysis results as the evaluation index, the range analysis is conducted on the index. The specific results are shown in
Table 5.
Due to changes in the elastic modulus and Poisson's ratio, the settlement of the tunnel's top surface has undergone significant changes. Therefore, in practical engineering, the influence of soft soil on the settlement of the tunnel's top surface should be emphasized. The degree of influence of soft soil on the settlement of the tunnel's top surface under earthquake loading is in the order of ν, E, c.
6. ConclusionS
The aim of this study is to investigate the surface settlement of the overlying soft soil layer of subway tunnels under seismic loading. Using the Dalian Metro Line 5 as a case study, ABAQUS finite element analysis method was employed to simulate the ground motion induced by EL Centro wave, Kobe wave, and an artificial earthquake wave with 10% exceedance probability. The surface settlement was studied based on El-Centro wave and four soft soil parameters. Orthogonal experiments and range analysis were conducted to analyze the soft soil parameters, and the main conclusions were obtained.(1) The settlement of the strata within a certain range of the tunnel's top surface is significantly greater than that of the surrounding strata, forming a settlement trough with a width of about 8~20 meters. Under the El-Centro wave, the width of the settlement trough is the largest, about 19.6 meters, followed by the artificially synthesized earthquake wave with an exceedance probability of 10%, about 15.6 meters, while under the Kobe wave, the width of the settlement trough is the smallest, about 8.5 meters.
(2) Within a range of about 20 meters of the tunnel's top surface, the seismic and special rock-soil layers of the overlying soft soil have the strongest impact on the surface settlement, and the settlement law of the overlying strata conforms to Peck's formula.
(3) Increasing the elastic modulus of the silty soil can reduce the settlement of the tunnel's top surface, while increasing the Poisson's ratio can increase it. When the cohesive force reaches 20kPa, the settlement of the tunnel's top surface is basically stable. Increasing the internal friction angle has little effect on the settlement of the tunnel's top surface.
(4) The sensitivity of soft soil parameters to the settlement of the tunnel's top surface under earthquake loading is in the order of Poisson's ratio, elastic modulus, cohesive force, and internal friction angle. The research findings of this paper provide scientific support for earthquake-resistant and disaster-reduction measures for underground metro tunnel engineering sites with overlying soft soil layers, and have sustainability and practicality. However, due to the limitation of the paper length, the indoor vibration table test under this engineering background could not be further explored. This study has significant theoretical and practical significance in the field of sustainability.
Funding
National Natural Science Foundation of China (51474045).
References
- Jin, H.; Yuan, D.J.; Zhou, S.X.; Zhao, D. Short-Term and Long-Term Displacement of Surface and Shield Tunnel in Soft Soil: Field Observations and Numerical Modeling. J. Applied Sciences 2022, 12, 3564. [Google Scholar] [CrossRef]
- Tsinidis, G. Response characteristics of rectangular tunnels in soft soil subjected to transversal ground shaking. J. Tunnelling and Underground Space Technology 2017, 62, 1–22. [Google Scholar] [CrossRef]
- Shahidi, A.R.; Vafaeian, M. Analysis of longitudinal profile of the tunnels in the active faulted zone and designing the flexible lining (for Koohrang-III tunnel). J. Tunnelling and underground space technology 2005, 20, 213–221. [Google Scholar] [CrossRef]
- Oreste, P.P. The importance of longitudinal stress effects on the static conditions of the final lining of a tunnel. J. Tunnelling and underground space technology 2002, 17, 21–32. [Google Scholar] [CrossRef]
- Takada, S.; Hassani, N.; Fukuda, K. A new proposal for simplified design of buried steel pipes crossing active faults. J. Earthquake engineering & structural dynamics 2001, 30, 1243–1257. [Google Scholar] [CrossRef]
- Hashash, Y.M.A.; Tseng, W.S.; Krimotat, A. Seismic soil-structure interaction analysis for immersed tube tunnels retrofit. J. Geotechnical Special Publication 1998, (75 II), 1380–1391. [Google Scholar] [CrossRef]
- Li, J.; Li, G.Q. Introduction to Earthquake Engineering. M. Beijing: Earthquake Publishing House, 1992.
- Xu, Y. Finite-underground tunnel under seismic action. D. Tianjin: Tianjin University, 1999.
- Fang, M.; Zhou, C.Y.; Liu, Z. Effect of crossing tunnel shield construction parameters and crossing Angle on the settlement of existing tunnels. J. Engineering mechanics 2011, 28, 133–138. [Google Scholar]
- Zhang, J.H.; Wang, H.W.; Chen, P.X.; Xu, F.; Wu, J. Analysis of direct cutting pile settlement under shield tunneling of Hangzhou Metro Line 4. J. Engineering mechanics 2022, 39, 144–152. [Google Scholar]
- Moore, I.D. and Guan, F. Three-Dimensional Dynamic Response of Lined Tunnels due to Incident Seismic Waves. Earthquake Engineering & Structural Dynamics 1996, 25, 357–369. [Google Scholar] [CrossRef]
- Chakeri, H.; Ozcelik, Y.; Unver, B. Investigation of ground surface settlement in twin tunnels driven with EPBM in urban area. J. Arabian Journal of geosciences 2015, 8, 7655–7666. [Google Scholar] [CrossRef]
- Yang, C.; Yang, L.D.; J, Q.Q. Study on Numerical Calculation of Earthquake Response in Soft Land Railway Station. J. Journal of Underground Space and Engineering 2006, 2, 87–91. [Google Scholar] [CrossRef]
- Patil, M.; Choudhury, D.; Ranjith, P.G.; Zhao, J. Behavior of shallow tunnel in soft soil under seismic conditions. Tunnelling and Underground Space Technology incorporating Trenchless Technology Research 2018, 75, 30–38. [Google Scholar] [CrossRef]
- Samanta, A.; Pandey, P. Effects of ground motion modification methods and ground motion duration on seismic performance of a 15-storied building. J. Journal of Building Engineering 2018, 15, 14–25. [Google Scholar] [CrossRef]
- Xia, F.; Guo, B.Z.; Yu, D.X. Effect of dynamic parameters of thick silty clay on surface seismic parameters. J. Earthquake Engineering Journal 2016, 38, 391–397. [Google Scholar] [CrossRef]
- Zuo, X.; Chen, G.X.; Wang, Z.H.; Du, X.L.; Hong, X.X.; Li, F.M. Vibration platform test of the near and far field seismic response characteristics of the subway station structure on the weak site. J. Journal of Civil Engineering 2010, 43, 299–305. [Google Scholar]
- Liu, G. 2001. Stability analysis of structural variable surrounding rock in high ground stress area. D. Chengdu: Chengdu University of Technology (Chengdu).
- Xia, Y.X.; Wang, W.Z.; Hu, Q.A. Effect of Round Rock Stress Release Rate on Construction of Double Arch Tunnel. J. Modern Tunnel technology 2005, 42, 1–4. [Google Scholar]
- Wang, G.C; Ma, D.J.; Yang, Y.; Zhang, J. Three-dimensional finite element analysis of surface subsidence caused by subway shield construction in soft land layer. J. Geotechnical Engineering Journal 2011, 33 (added 1). [Google Scholar]
- General Administration of Quality Supervision, Inspection and Quarantine of the People's Republic of China, Standardization Administration of China. GB 18306-2015 Seismic Ground Motion Parameter Zoning Map of China. S. Beijing: China Standard Press, 2015.
- Peck R., B. Deep excavations and tunnelling in soft ground. A. Proc. 7th Int. Conf. SMFE. Mexico City. State of the Art Volume. C. 1969. 225-290.
- Zhou, Y.; Zhu, Y. Study on dynamic stability of grillage flexible slope supporting structure with pre-stressed anchors under rainfall infiltration. C. ICETCE. IEEE, 2011: 2616-2620. [CrossRef]
- Sun, H.X.; Zhang, K.; Chen, S.L. Numerical simulation of foundation pit deformation considering the influence of precipitation and distribution of excavation. J. Journal of Shenyang University of Technology 2014, 36, 711–715. [Google Scholar] [CrossRef]
- Zhu, H.B.; Xi, K.Q. Orthogonal trial design and data analysis in SPSS 17.0. J. Journal of Capital Sports College 2013, 25, 283–288. [Google Scholar] [CrossRef]
Figure 1.
Tunnel between the Dalian Metro Line 5 Section 04, Train Station Station to Souyuan Bay South Station.
Figure 1.
Tunnel between the Dalian Metro Line 5 Section 04, Train Station Station to Souyuan Bay South Station.
Figure 2.
Map of soil layer distribution.
Figure 2.
Map of soil layer distribution.
Figure 3.
3D finite element analysis model.
Figure 3.
3D finite element analysis model.
Figure 4.
Earthquake wave acceleration time course curve.
Figure 4.
Earthquake wave acceleration time course curve.
Figure 5.
Vertical displacement of the cloud map under different seismic waves.
Figure 5.
Vertical displacement of the cloud map under different seismic waves.
Figure 6.
Schematic diagram of lateral prediction of surface settlement.
Figure 6.
Schematic diagram of lateral prediction of surface settlement.
Figure 7.
Comparison of tunnel settlement value under El-Centro wave.
Figure 7.
Comparison of tunnel settlement value under El-Centro wave.
Figure 8.
Influence of elastic modulus on surface settlement of tunnel top.
Figure 8.
Influence of elastic modulus on surface settlement of tunnel top.
Figure 9.
The modulus of elasticity fits the maximum settlement value to the curve.
Figure 9.
The modulus of elasticity fits the maximum settlement value to the curve.
Figure 10.
Influence of cohesion on surface settlement of tunnel top.
Figure 10.
Influence of cohesion on surface settlement of tunnel top.
Figure 11.
The cohesion fits the curve to the maximum settlement value.
Figure 11.
The cohesion fits the curve to the maximum settlement value.
Figure 12.
Influence of Poisson's ratio on ground settlement of tunnel top.
Figure 12.
Influence of Poisson's ratio on ground settlement of tunnel top.
Figure 13.
The Poisson ratio fits the curve to the maximum settlement value.
Figure 13.
The Poisson ratio fits the curve to the maximum settlement value.
Figure 14.
Influence of internal friction angle on surface settlement of tunnel top.
Figure 14.
Influence of internal friction angle on surface settlement of tunnel top.
Figure 15.
Maximum ground settlement of tunnel top under different factors.
Figure 15.
Maximum ground settlement of tunnel top under different factors.
Figure 16.
Orthogonal test settlement curve.
Figure 16.
Orthogonal test settlement curve.
Table 1.
Physical and mechanical parameters of soil layer.
Table 1.
Physical and mechanical parameters of soil layer.
Stratigraphic
(Genetic) |
Layer thickness /m |
Density /kg·m-3
|
Elasticity modulus E/MPa |
Cohesion c/KPa |
Internal friction angle φ/° |
Poisson's ratio
ν
|
| ①Plain fill soil |
5.8 |
1850 |
60 |
12 |
10 |
0.38 |
| ②Silty soil |
1.7 |
1800 |
30 |
15 |
3 |
0.42 |
| ③Pink sand |
3.2 |
1900 |
200 |
5 |
29.2 |
0.20 |
| ④Clay with gravel |
2.5 |
1950 |
280 |
30 |
25 |
0.25 |
| ⑤Moderately weathered slate |
51.2 |
2500 |
5000 |
50 |
40 |
0.15 |
Table 2.
Mechanical parameters of lining structure.
Table 2.
Mechanical parameters of lining structure.
| Density/kg·m-3
|
Thickness/m |
Elasticity modulus E/Mpa |
Poisson's ratio v
|
| 2450 |
0.3 |
36500 |
0.23 |
Table 3.
Factor and level.
Table 3.
Factor and level.
| |
Factor |
A
Elastic modulus E/MPa |
B
Poisson's Ratio ν
|
C
Cohesion c/kPa |
| Level |
|
| 1 |
30 |
0.42 |
10 |
| 2 |
35 |
0.4 |
15 |
| 3 |
40 |
0.38 |
20 |
Table 4.
Orthogonal test.
Table 4.
Orthogonal test.
| Test number |
A |
B |
C |
| 1 |
1 |
1 |
1 |
| 2 |
1 |
2 |
2 |
| 3 |
1 |
3 |
3 |
| 4 |
2 |
1 |
2 |
| 5 |
2 |
2 |
3 |
| 6 |
2 |
3 |
1 |
| 7 |
3 |
1 |
3 |
| 8 |
3 |
2 |
1 |
| 9 |
3 |
3 |
2 |
Table 5.
Results of extreme analysis.
Table 5.
Results of extreme analysis.
| Test number |
Maximum settlement /mm |
| A |
B |
C |
| K1 |
66.26 |
63.4 |
65.61 |
| K2 |
65.47 |
64.84 |
64.73 |
| K3 |
63.96 |
67.45 |
65.35 |
| k1 |
22.087 |
21.33 |
21.87 |
| k2 |
21.823 |
21.613 |
21.577 |
| k3 |
21.32 |
22.483 |
21.783 |
| Rj |
0.767 |
1.153 |
0.223 |
|
Disclaimer/Publisher’s Note: The statements, opinions and data contained in all publications are solely those of the individual author(s) and contributor(s) and not of MDPI and/or the editor(s). MDPI and/or the editor(s) disclaim responsibility for any injury to people or property resulting from any ideas, methods, instructions or products referred to in the content. |
© 2023 by the authors. Licensee MDPI, Basel, Switzerland. This article is an open access article distributed under the terms and conditions of the Creative Commons Attribution (CC BY) license (http://creativecommons.org/licenses/by/4.0/).

