Introduction
Chronic pain is a complex condition that is burdensome at an individual and societal level. It impacts approximately 20% of the global population with significant mobility restrictions, emotional distress, social isolation and financial difficulty.1,2 The impact on society is significant with health care expenses and lost productivity costing European economies over 200 billion dollars and the US economy 635 billion dollars each year.3 Reaffirmed by The Global Burden of Disease study 2016 which highlighted high prevalence of pain and pain-related comorbidities as a significant source of disability and disease burden globally.4,5 Chronic pain populations are heterogeneous and this presents many challenges to patients, clinicians, clinical researchers and policy makers to design healthcare services that can meet the complex demands. Chronic pain prevalence and incidence varies by gender, biological sex and other social determinants. Epidemiological studies show older women, people from lower socioeconomic backgrounds and those with physical and psychological comorbidities are more likely to be at risk of long-term chronic pain.6 Aging population means the risk of long-term chronic pain management is ever increasing due to increased exposure to comorbidities.7
These statistics are further impacted by changes to the global migratory patterns between developed, emerging and developing countries. Lack of government policy, inadequate resources precluding the formation of chronic pain clinics and limited access to effective treatments lead to inadequate management of chronic pain in low-income countries.8,9,10 Overcoming this disparity required focus on education of health care professionals, building research capacity, addressing cultural beliefs and stigmas related to pain and increasing availability of pharmacological therapies and medical devices. In high-income countries, migratory patterns change, making the eminent tracking of changes in prevalence and incidence of those with chronic pain challenging. The UK experienced high levels of total long-term immigration estimated at 1.1 million in 2022.11 Of the 10 million people in the UK born overseas, approximately 37% are European, 24% Asian, 9% Black and 2% Middle Eastern.12,13 Data from Public Health England reveals that black ethnic groups have a significantly higher prevalence of chronic pain (44%) compared to white ethnic groups (34%), with Asian ethnic groups having comparable levels of chronic pain (35%).14 Whilst data showing prevalence of pain in different ethnicities is applicable, data showing prevalence of pain in the different countries which people have migrated from isn’t available. In comparison with host populations, immigrants may display greater multimorbidity, strongly associated with chronic pain. 15,16,17 Forced displacement, loss of social support networks and uncertainty in future employment result in heightened emotional distress and worsening mental health contributing to poorer responses to treatment.18
Pharmacological therapies have remained the cornerstone of pain management which influenced non-cancerous chronic pain. In particular, the current opioid epidemic indicates global consumption of pharmacological regimens doubling from 3.01 billion defined daily doses each year to 7.35 billion defined daily doses between 2001 and 2013.19 Increases in opioid addiction and vulnerabilities to overdosing have led to increased global mortality rising to approximately 350,000 deaths per annum.20
Therefore, non-pharmacological techniques have become more attractive to all stakeholders. Non-pharmacological treatments for chronic pain can be categorised into two primary categories of medical devices and complex or combination treatments. Medical devices for chronic pain management in particular is based upon gate-control theory proposed by Melzack and Wall, especially for those applying neuromodulation principles. Stimulation of both peripheral and central nervous somatosensory fibres may attribute to inhibiting chronic pain.21 One of the first medical devices used for chronic pain management are those used for spinal cord stimulation (SCS).22
Methods
A systematic methodology was developed, peer reviewed and published in PROSPERO (CRD42021235384). The systematic methodology included an eligibility criterion and the use of statistical method to evaluated pooled mean differences (MD) along with a 95% confidence intervals (CI)s.
Aims
The aim of the study was to explore the prevalence of medical device use and their treatment efficacy in non-cancer pain management.
Search strategy and eligibility criteria
The search strategy used key words of medical device, pain management devices, chronic pain, lower back pain, back pain, leg pain and chronic pelvic pain using Science direct, PubMed, Web of Science, PROSPERO, MEDLINE, EMBASE, PorQuest and ClinicalTrials.gov.
All clinical trials, epidemiology and mixed methods studies that reported the use of medical devices for non-cancer chronic pain management published between the 1st of January 1990 and the 30th of April 2022 were included. Commentaries, editorials and opinions were excluded along side of all publications published in any other language than English.
[PRISMA diagram]
Outcome measures
Outcomes were reported as median, standard deviation (SD), mean and confidence intervals (CI). Mean and standard deviation were extracted as the main outcomes including pre-treatment pain scores at baseline, post-treatment pain scores and pain score changes of each group.
A variety of interventional tools were used to assess the severity and progress of chronic pain. These include visual analogue scale (VAS), 0-10 or 0-100), numeric rating scale (NRS), 0-10), Brief Pain Inventory interference scale (BPI), 0-10), McGill Pain Questionnaire (MPQ), Face Pain Rating Scale (FPRS), Oswestry Disability Index (ODI), Supine Bridge Test (SBT ) , Passive Straight Leg Raise (PSLR), Pittsburgh Sleep Quality Index (PSQI), Beck depression index (BDI), Short Form of the Brief Pain Inventory (SF-BPI), SF-BPI pain interference with sleep. There are also other multiple tools we did not obtain numerical results in our analysis, such as EQ-5D index , SF-36 (PCS, MCS), Pain Acceptance Questionnaire (CPAQ).
As most widely used tools for assessing pain such as VAS, NRS use a 11-point numeric rating scale from 0 to 10, the following standardisation formula was used to unify all pain scores into the same scale:
As all outcomes of interest were continuous, the calculation based on pain scores was performed by using mean differences (MD) with a 95% confidence interval (CI) to report the effects between the group comparisons.
Exposures
The exposures of interest were selected based on the key features of medical device interventions used to treat non-cancer chronic pain, including and not limited to a pain condition being the primary or the secondary condition. Neurological and psychological symptoms leading up to the use of medical device within the included population were also considered.
Statistical analysis plan
A meta-analysis (MA) is a statistical combination of the results of two or more independent studies comparing two interventions. MA produces one estimate of pooling effects from the selected pair of interventions in different 2-arm studies. Studies included in our analysis used a medical device or device-assisted intervention in Experimental group, while placebo or non-active treatment (Sham stimulation) in Control group. To estimate the efficacy of managing non-cancerous chronic pain with the use of medical devices currently available, PMA was conducted based on different subset of studies and clinical assessments. Firstly, PMA was used on studies with the same medical device as the treatment group to see the specific efficacy of each type. However, due to the limited studies of a certain medical device, all included interventions here in Experimental group could be regarded as a whole of “Medical device”, and all extracted studies were included for meta-analysis.
The primary aim of this study was to provide a comprehensive understanding on use of medical devices and their treatment effects. There are multiple outcomes associated Pain level, Motor function, General health status and Quality of life, such as Pain intensity, Disability Index, EQ-5D index and Sleep Quality Index. The difference in efficacy of medical device in a variety of contexts such as age groups, gender groups, study duration and geographical location were also explored.
and p-value were commonly used to detect statistical heterogeneity. A value of larger than 50% with a much smaller p-value indicates strong heterogeneity. Correspondingly, less than 50% with a large p-value indicates fairly weak heterogeneity.23 A random effects model was chosen when there was high heterogeneity, whereas a fixed effects model was used if weak or no heterogeneity was detected .24 In the presence of high heterogeneity, subgroup analysis was carried out to identify the sources of heterogeneity. To assess the robustness of the pooled results under meta-analysis, sensitivity analysis was applied. Finally, publication bias was evaluated with funnel plots and Egger tests.25 All results of statistical analyses were produced by R and packages were used to provide outputs in compliance with best practice and reporting guidelines.26
Results
Summary of studies included in systematic review
Table 1 presented the characteristics of the 13 studies included in systematic review with 875 participants enrolled. There are a case series study, single-arm repeated measures study, randomized feasibility trial, randomized crossover study and the left 9 randomized controlled trials (RCTs). Chronic low back pain was the most common pain among enrolled patients with 5 studies testing on 222 patients. 7 studies with medical devices used Nerve stimulation among 296 participants and 4 studies used Mobile Device to assist treatment for 437 participants. One study used Extracorporeal Shock Wave Therapy and one study tested the feasibility of a newly developed activity pacing framework.
Subgroup analysis for pain level
Subgroup analysis with geographical locations
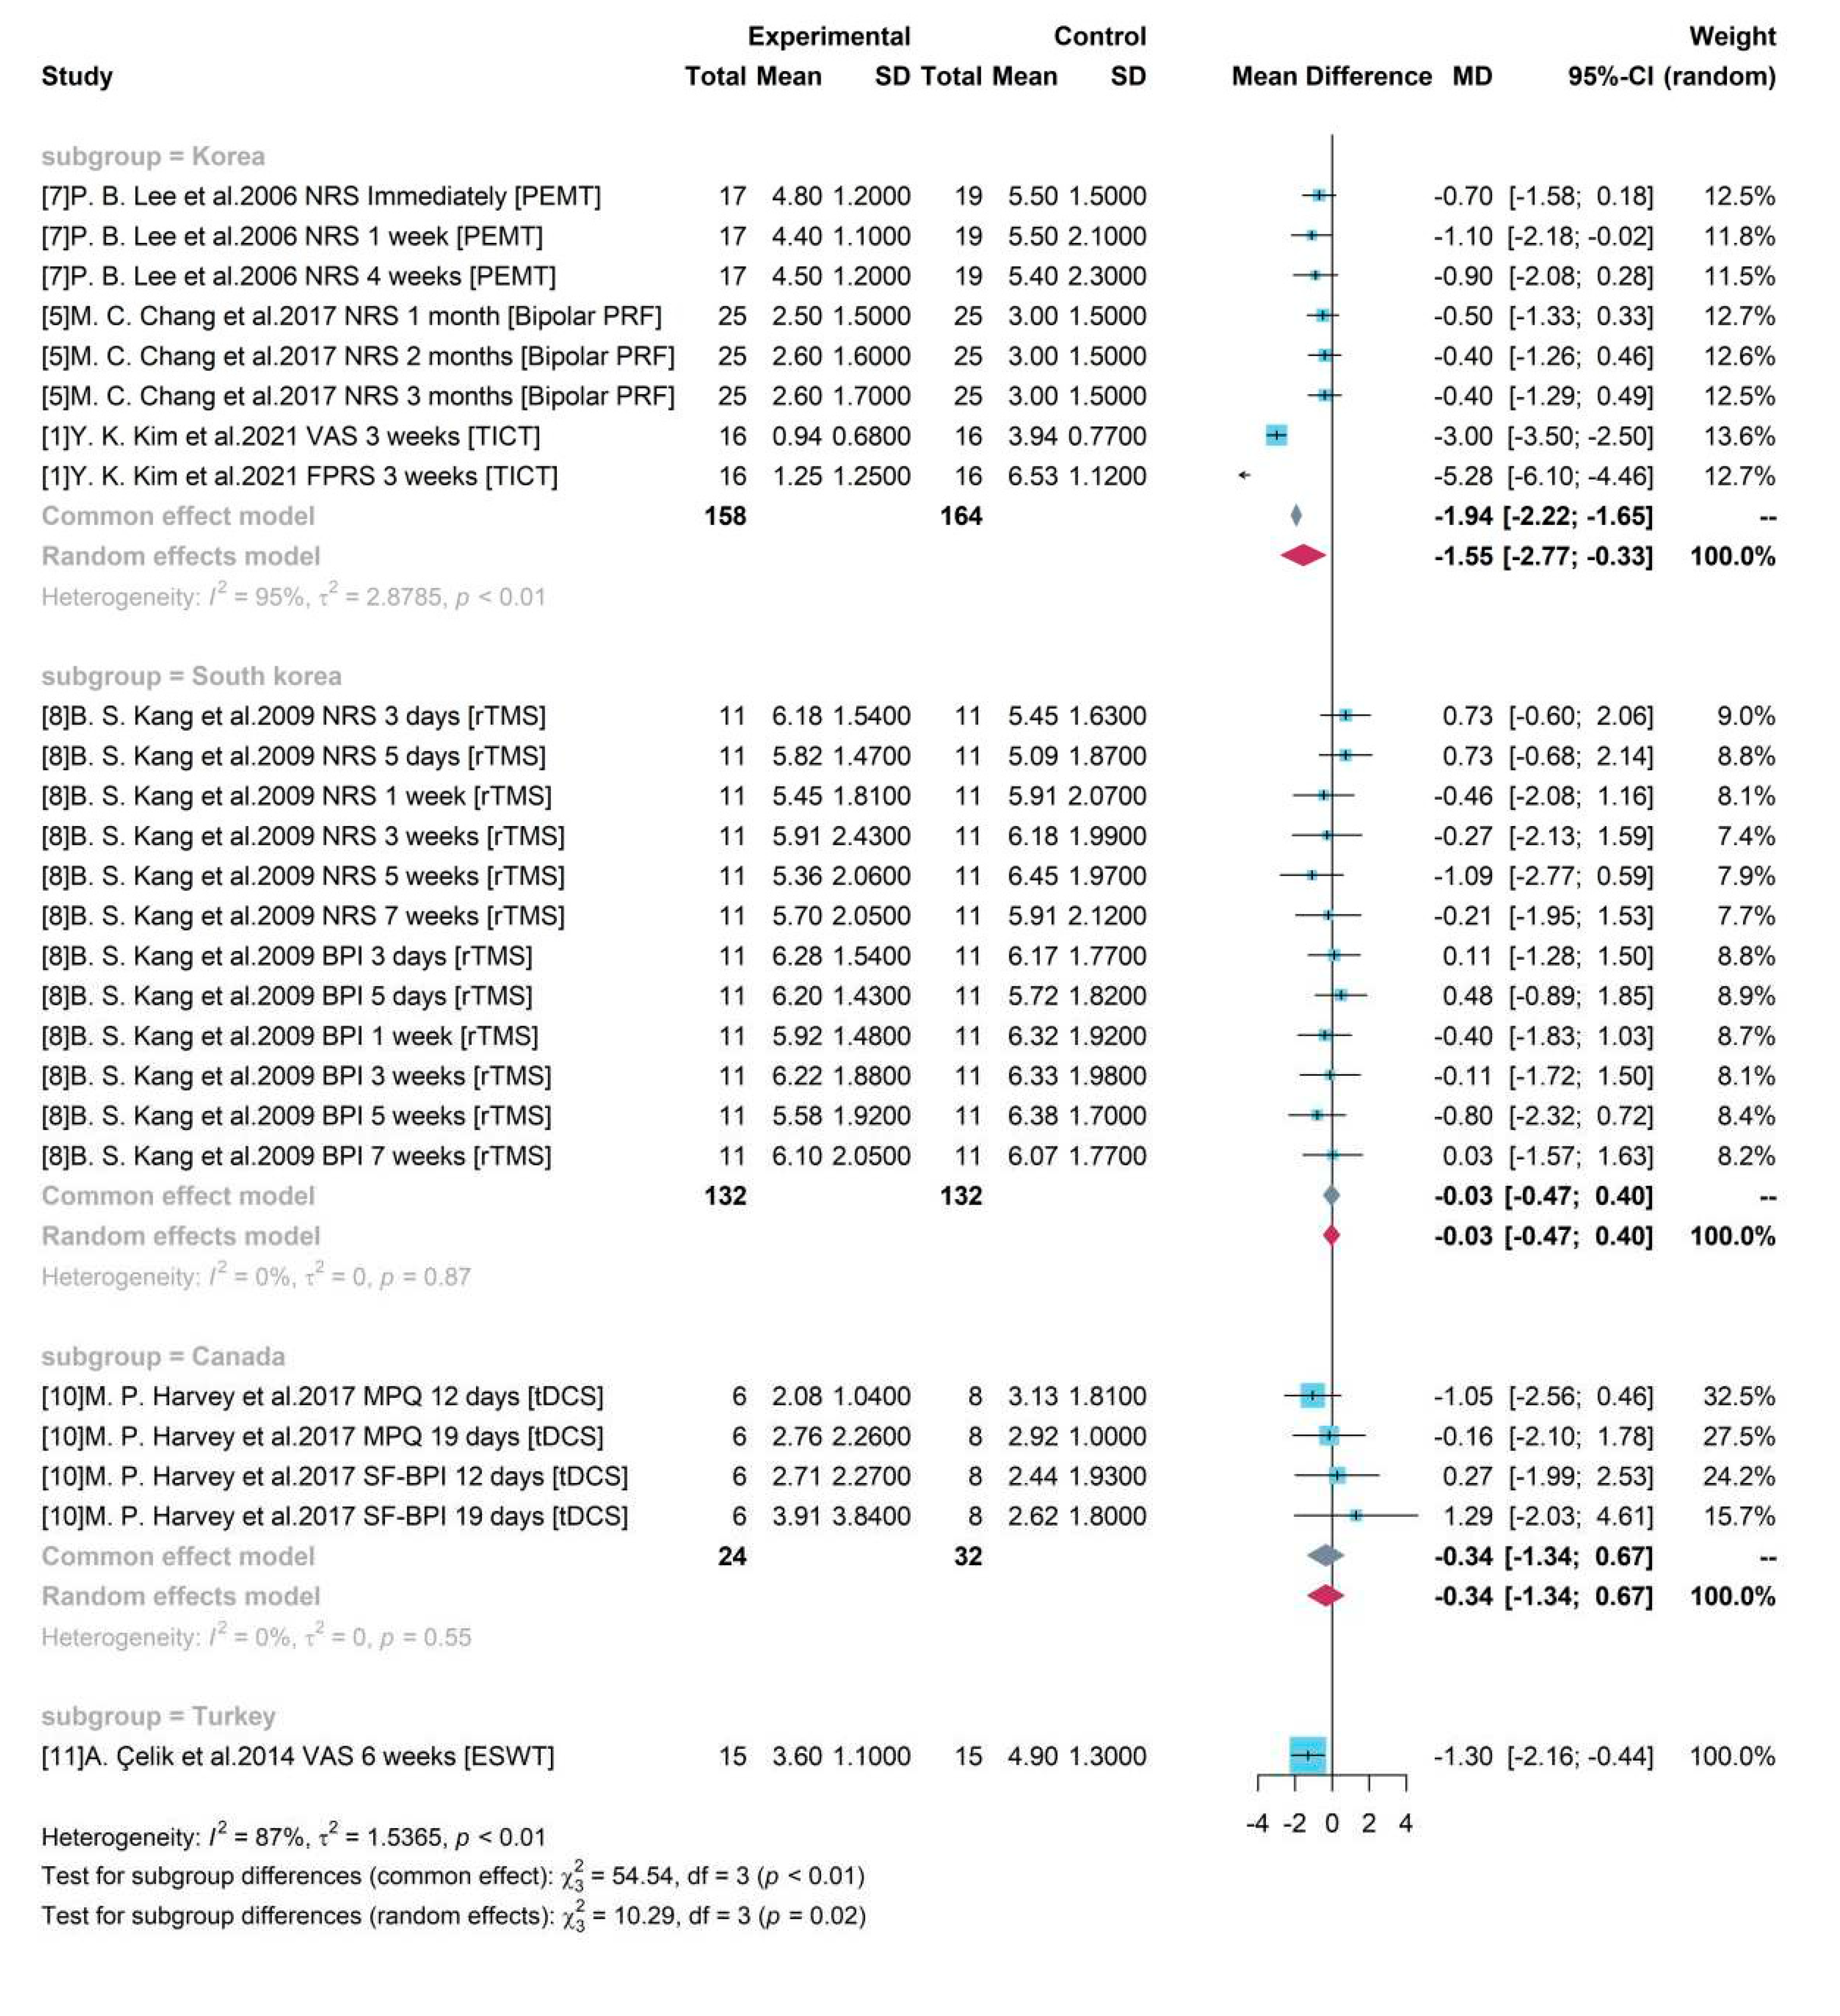
To explore the sources of heterogeneity, a subgroup analysis was conducted using the geographical locations of the studies and demonstrated in a forest plot (
Figure 5). Only study 1, 5, 7 were included in one group “Korea” and other studies did not merge with each other. A statistically significant difference (p-value < 0.05) was identified between group “Korea” and other groups conducted in different countries. The pooled treatment efficacy of studies conducted in Korea was -1.55 (95% CI = [-2.77, -0.33]) and it was significant without covering 0.
Figure 5 also showed that heterogeneity was high in group “Korea” (
= 95%, p-value< 0.01) and low in group South korea and Canada (
= 0%, p-value =0.87 and 0.55 respectively), indicating that the identified heterogeneity was not geographical location influenced.
Subgroup analysis with different Age groups
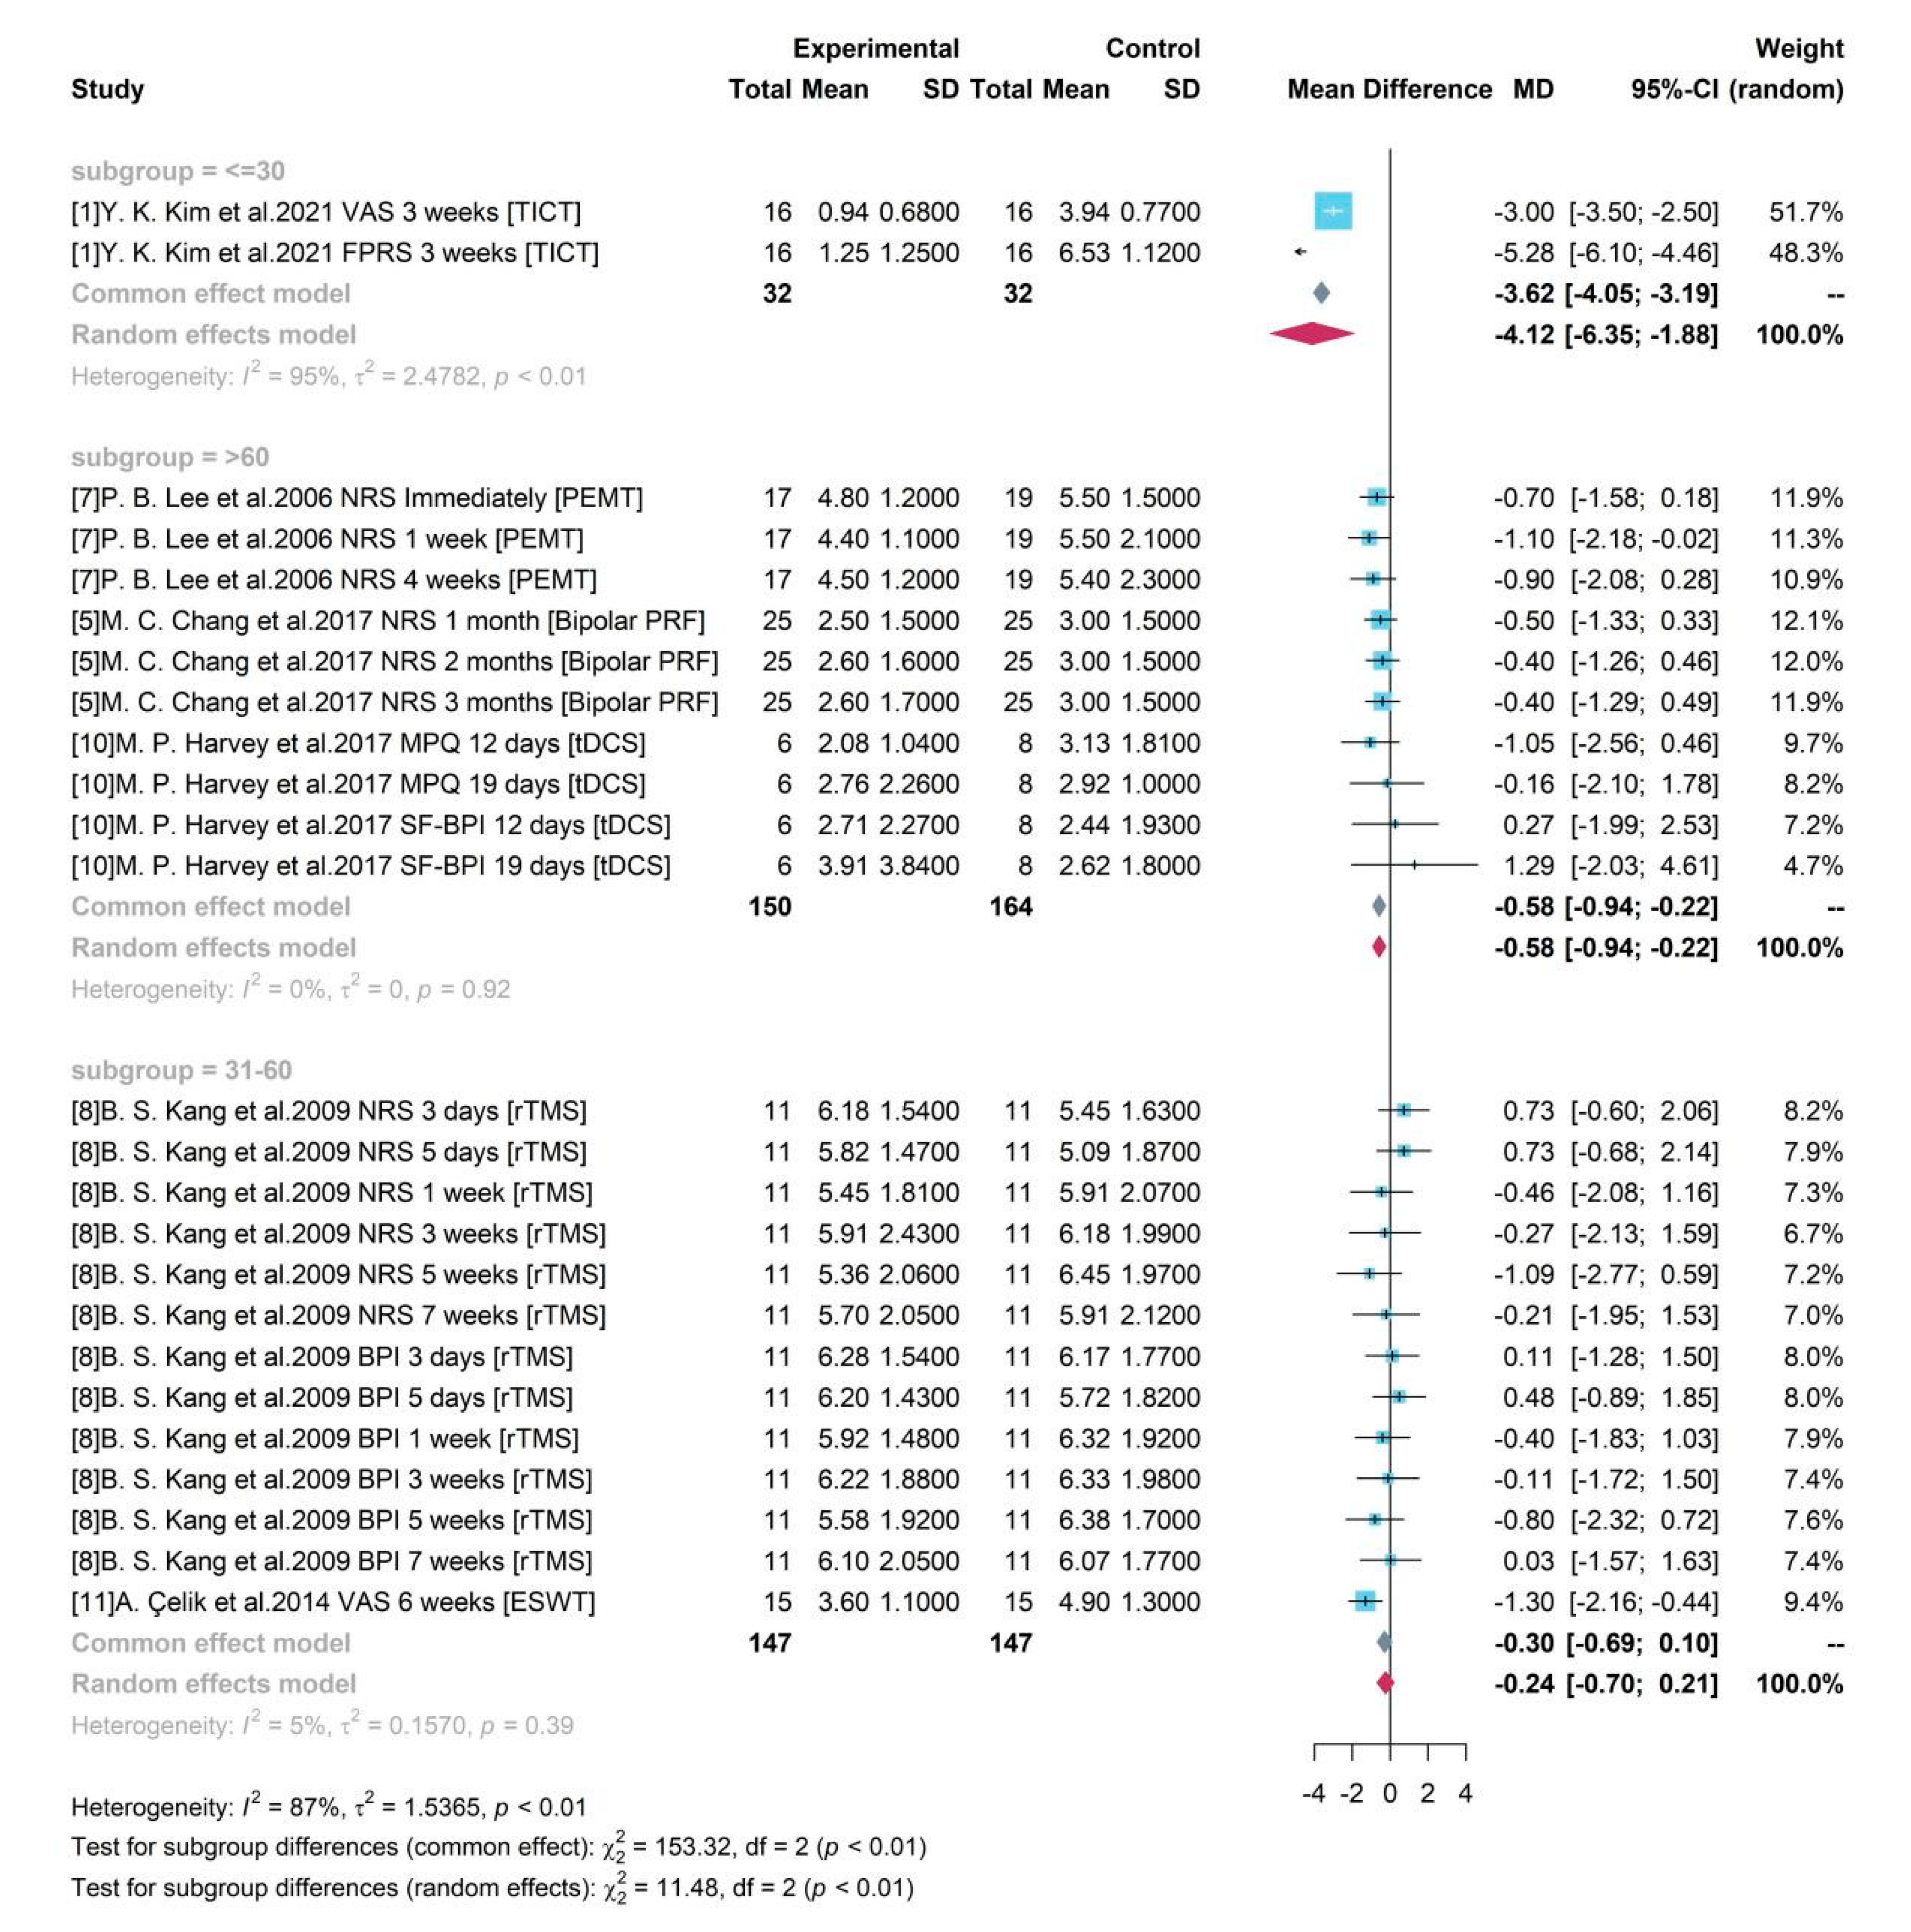
As shown in
Figure 6, according to the mean age of enrolled participants, 3 groups were divided as “<=30”, “31-60”, and “>60”. Although both of groups “<=30” and “>60” produced significant results, the high heterogeneity (
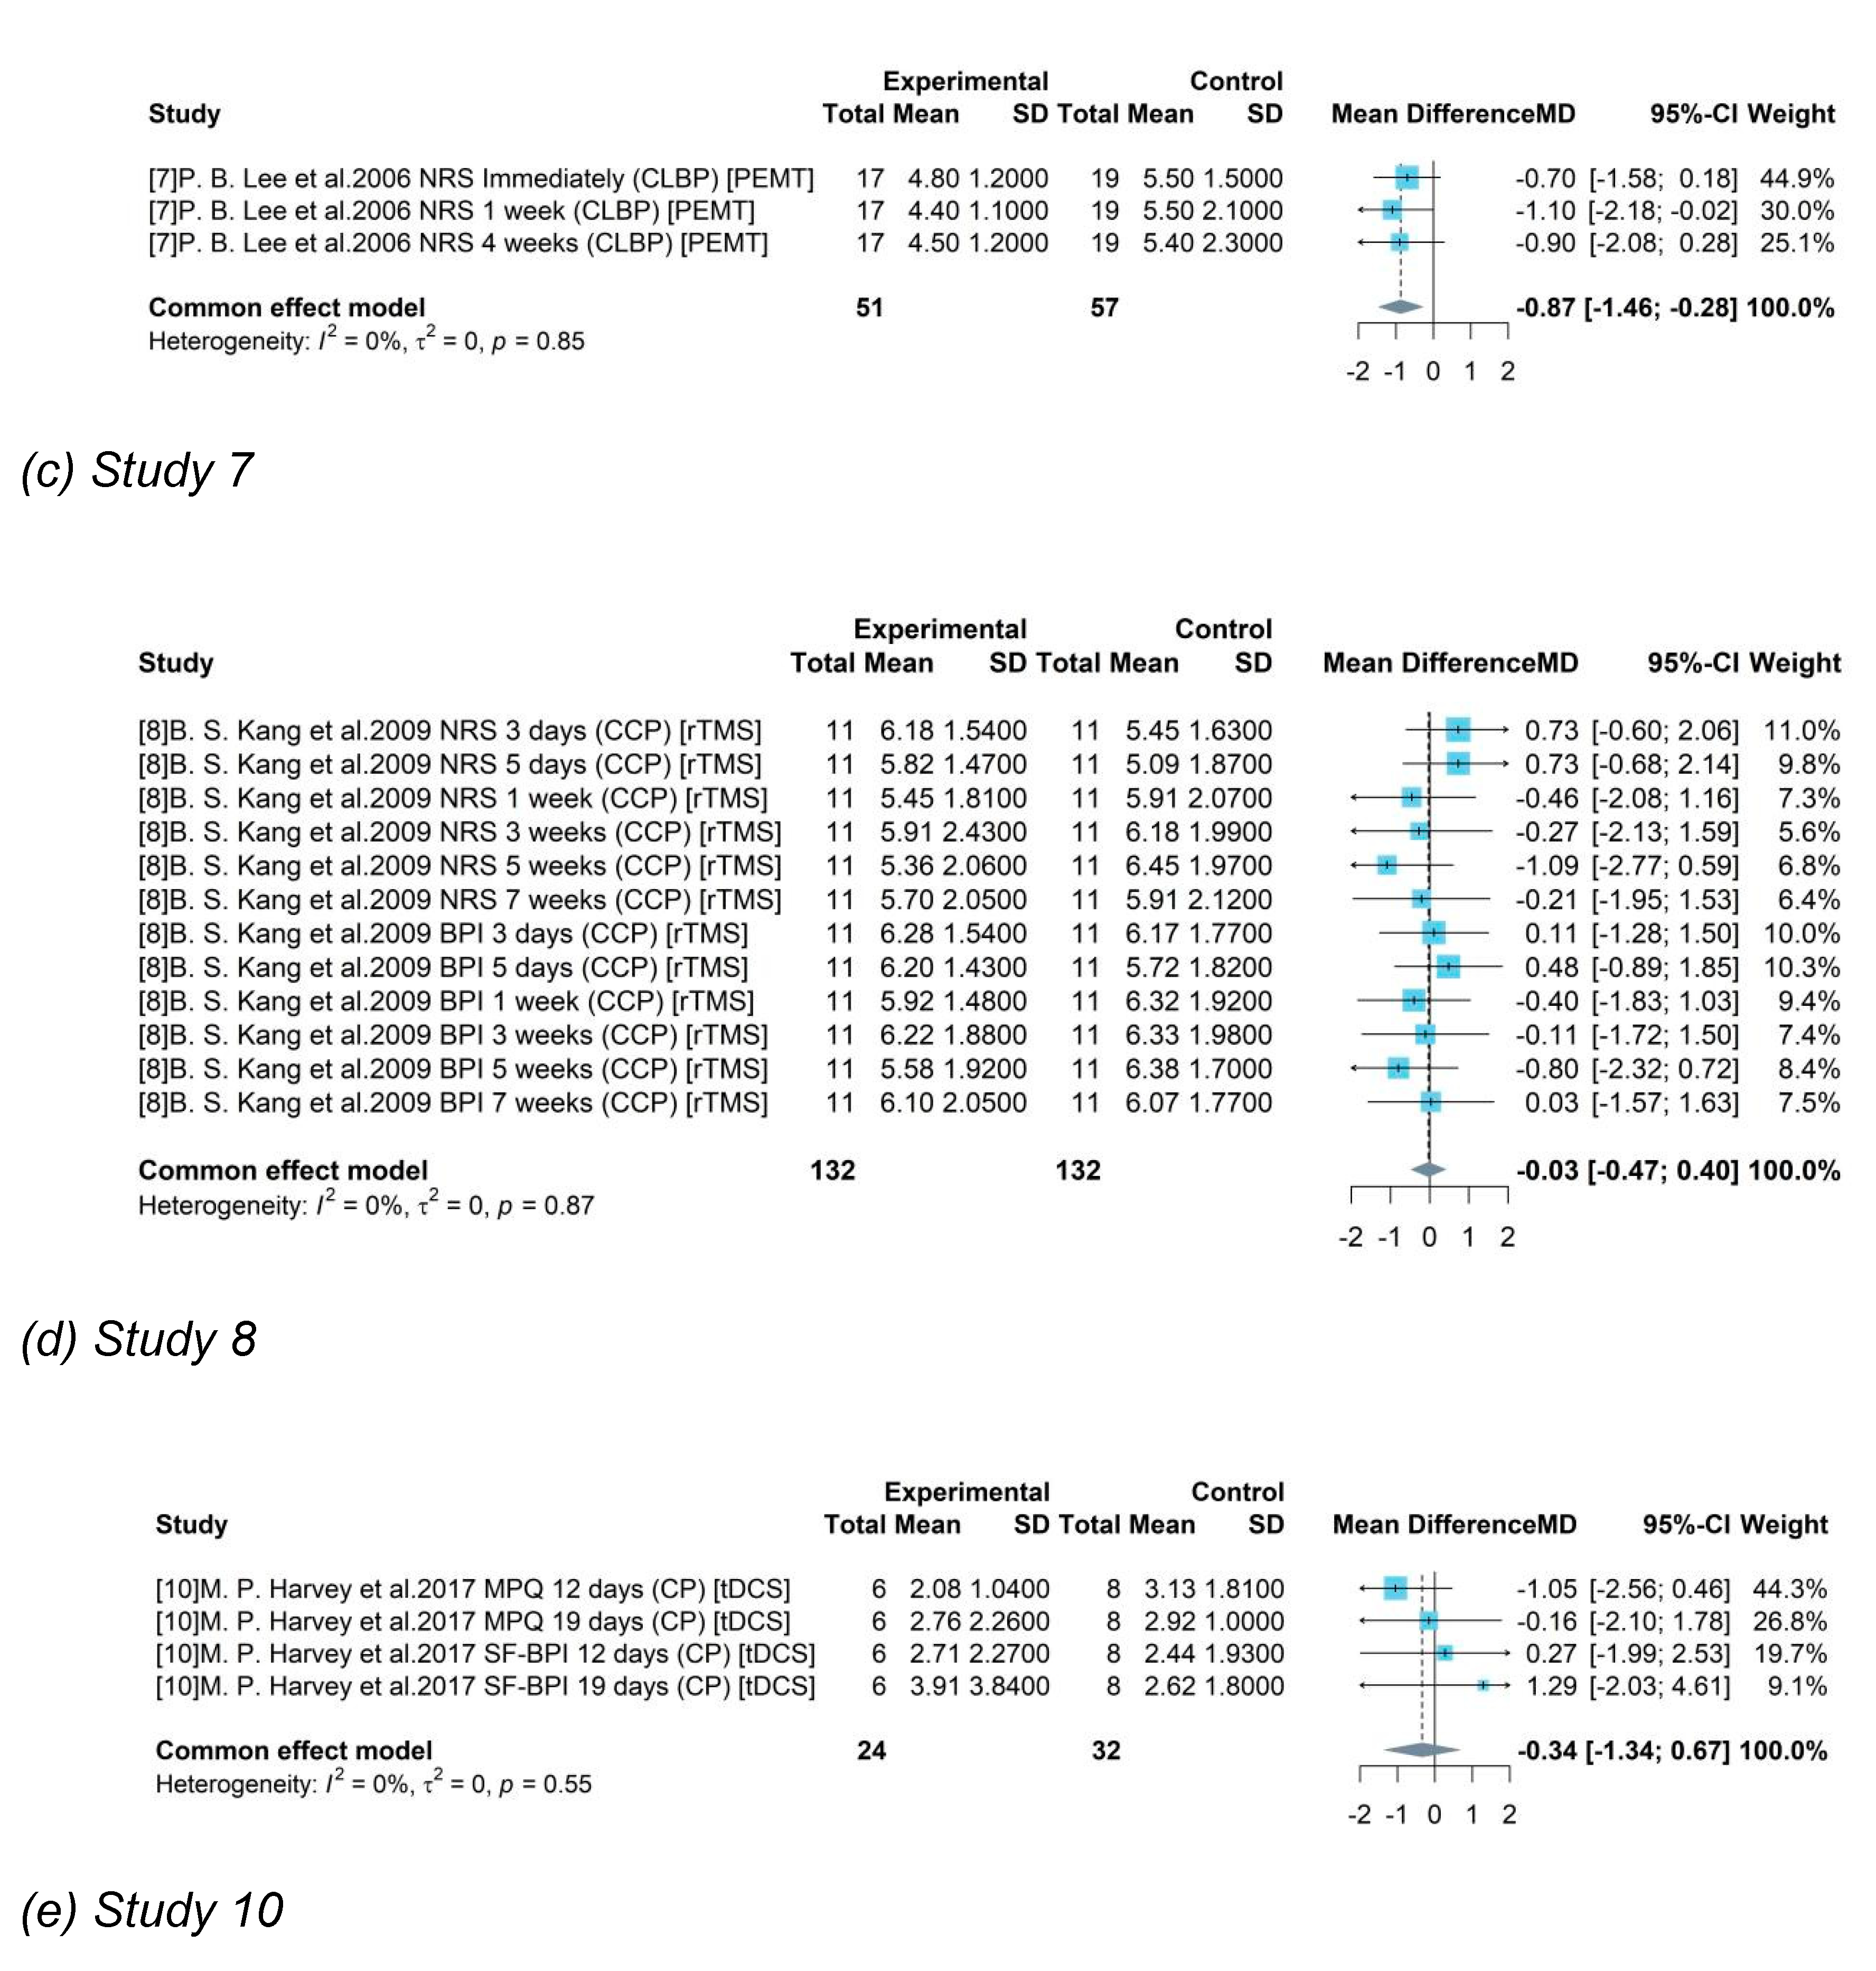
= 95%, p-value< 0.01) in group “<=30” caused by two different assessment tools and single source from one study made the result doubtful. For studies with mean age of participants older than 60, the pooled efficacy estimate of medical device-related interventions was -0.58, where PEMT, Bipolar PRF, and tDCS were included. The 95% CI ([-0.94, -0.22]) without covering 0 indicated a significant treatment effect of a 0.58-degree pain reduction. The pooled result of group with participant between 31 and 60 years old was not significant by combining results of study 8 and 11.
Subgroup analysis with Gender
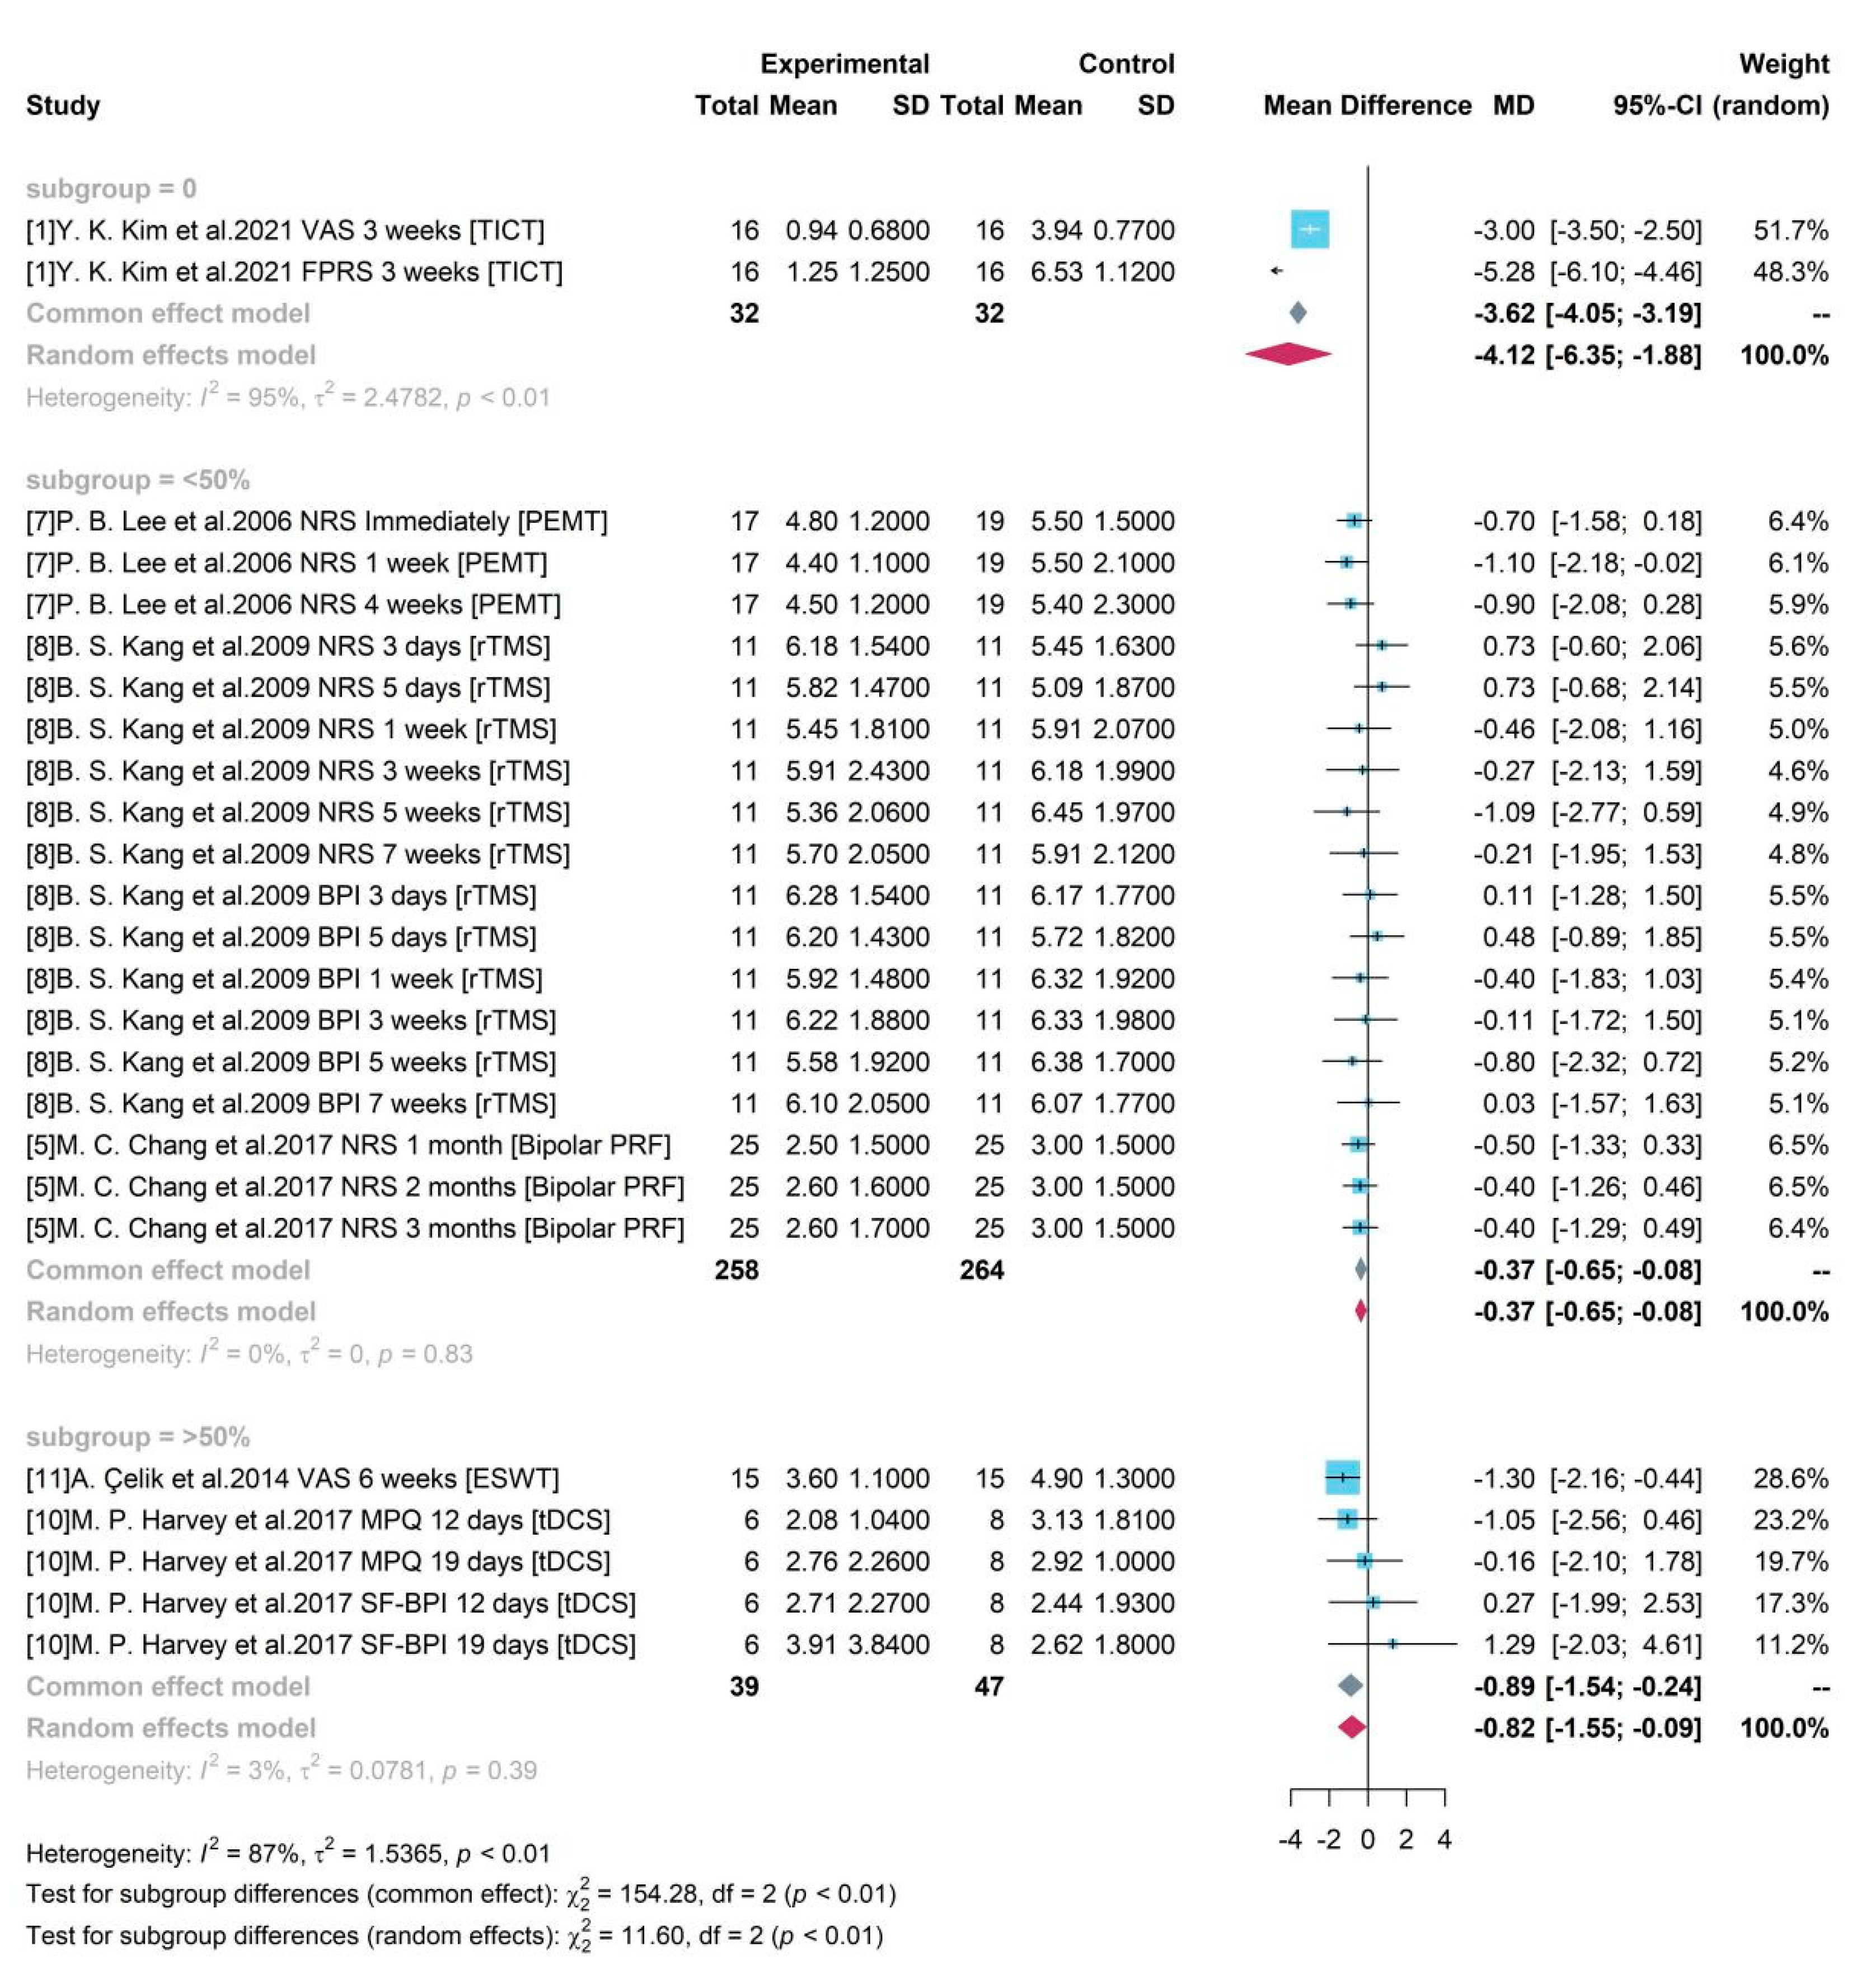
We determined the sample size relevant to women by dividing the 3 groups based on their gender percentage of 0%, <50% and >50% which indicated these did not have representation from women predominantly.
Figure 7 indicates all 3 groups were significant with a zero-free 95% CI.
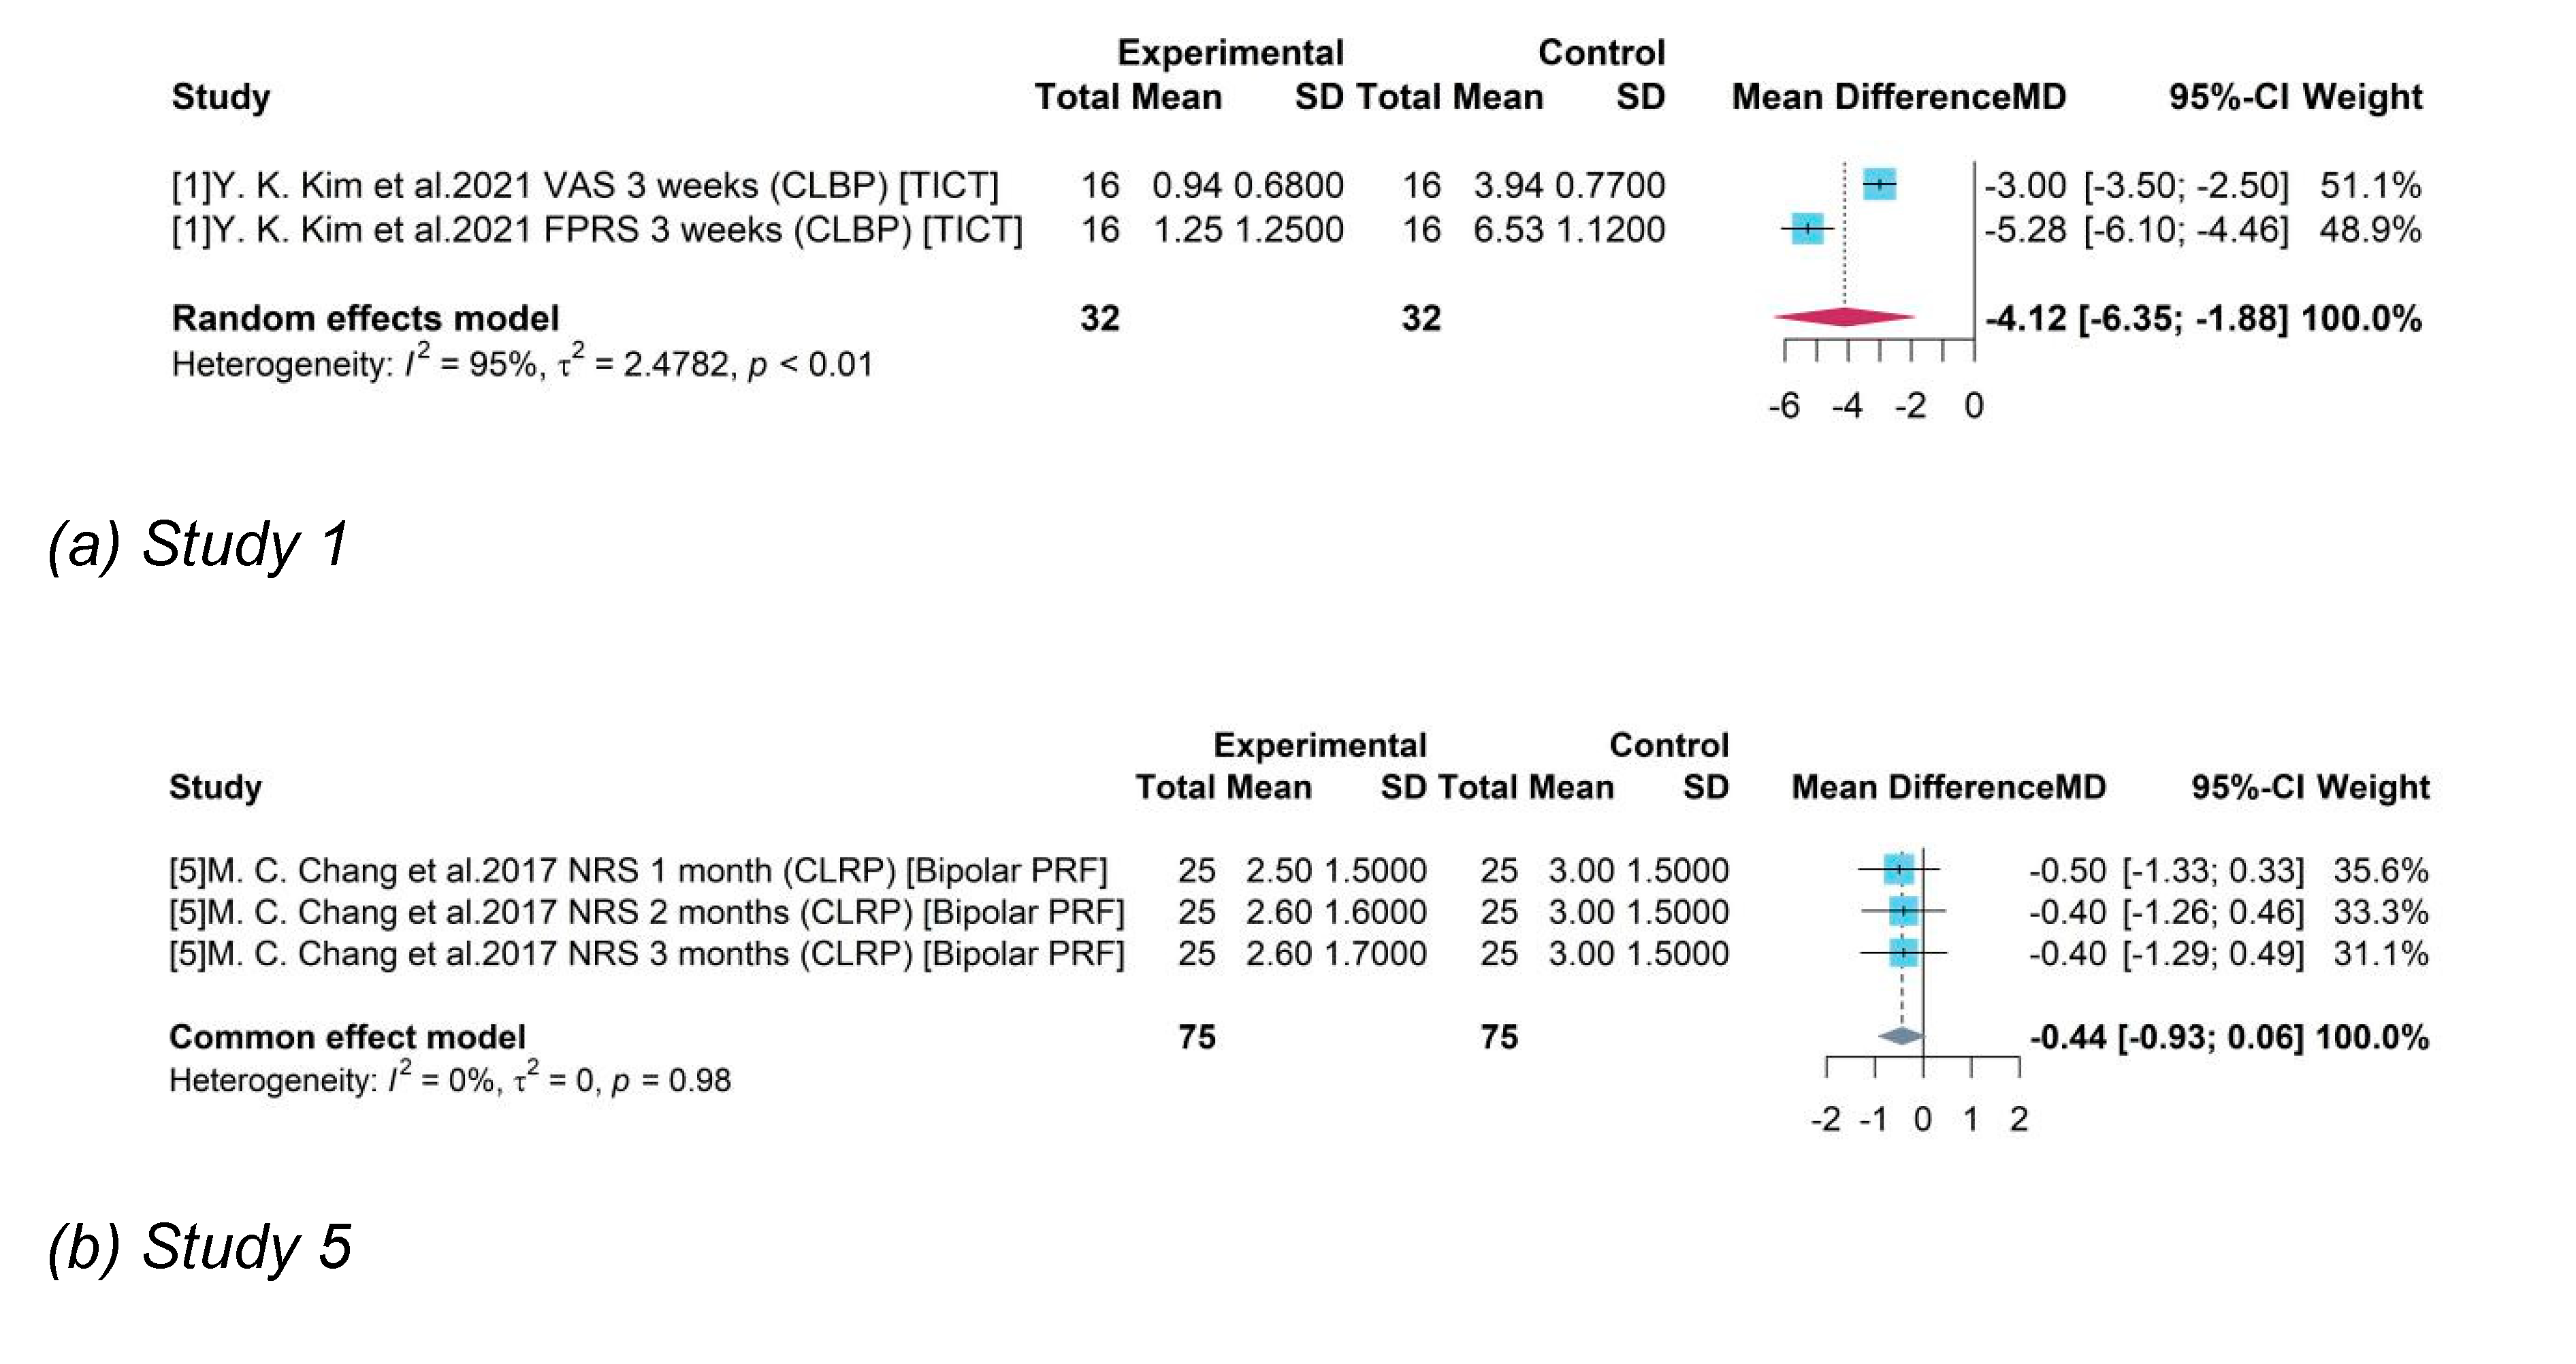
Study 1 was an all-male study and produced a mean difference of -4.12 between TICT and control group with 95% CI = [-6.35, -1.88]. Studies 5, 7, 8 enrolled women accounting for less than 50% and the pooled efficacy of PEMT, rTMS, Bipolar PRF was -0.37 (95% CI = [-0.65, -0.08]). Studies 10 and 11 enrolled both male and female and female accounts for over 50%. Their pooled result of ESWT and tDCS compared to control group was -0.82 (95% CI = [-1.55, -0.09]).
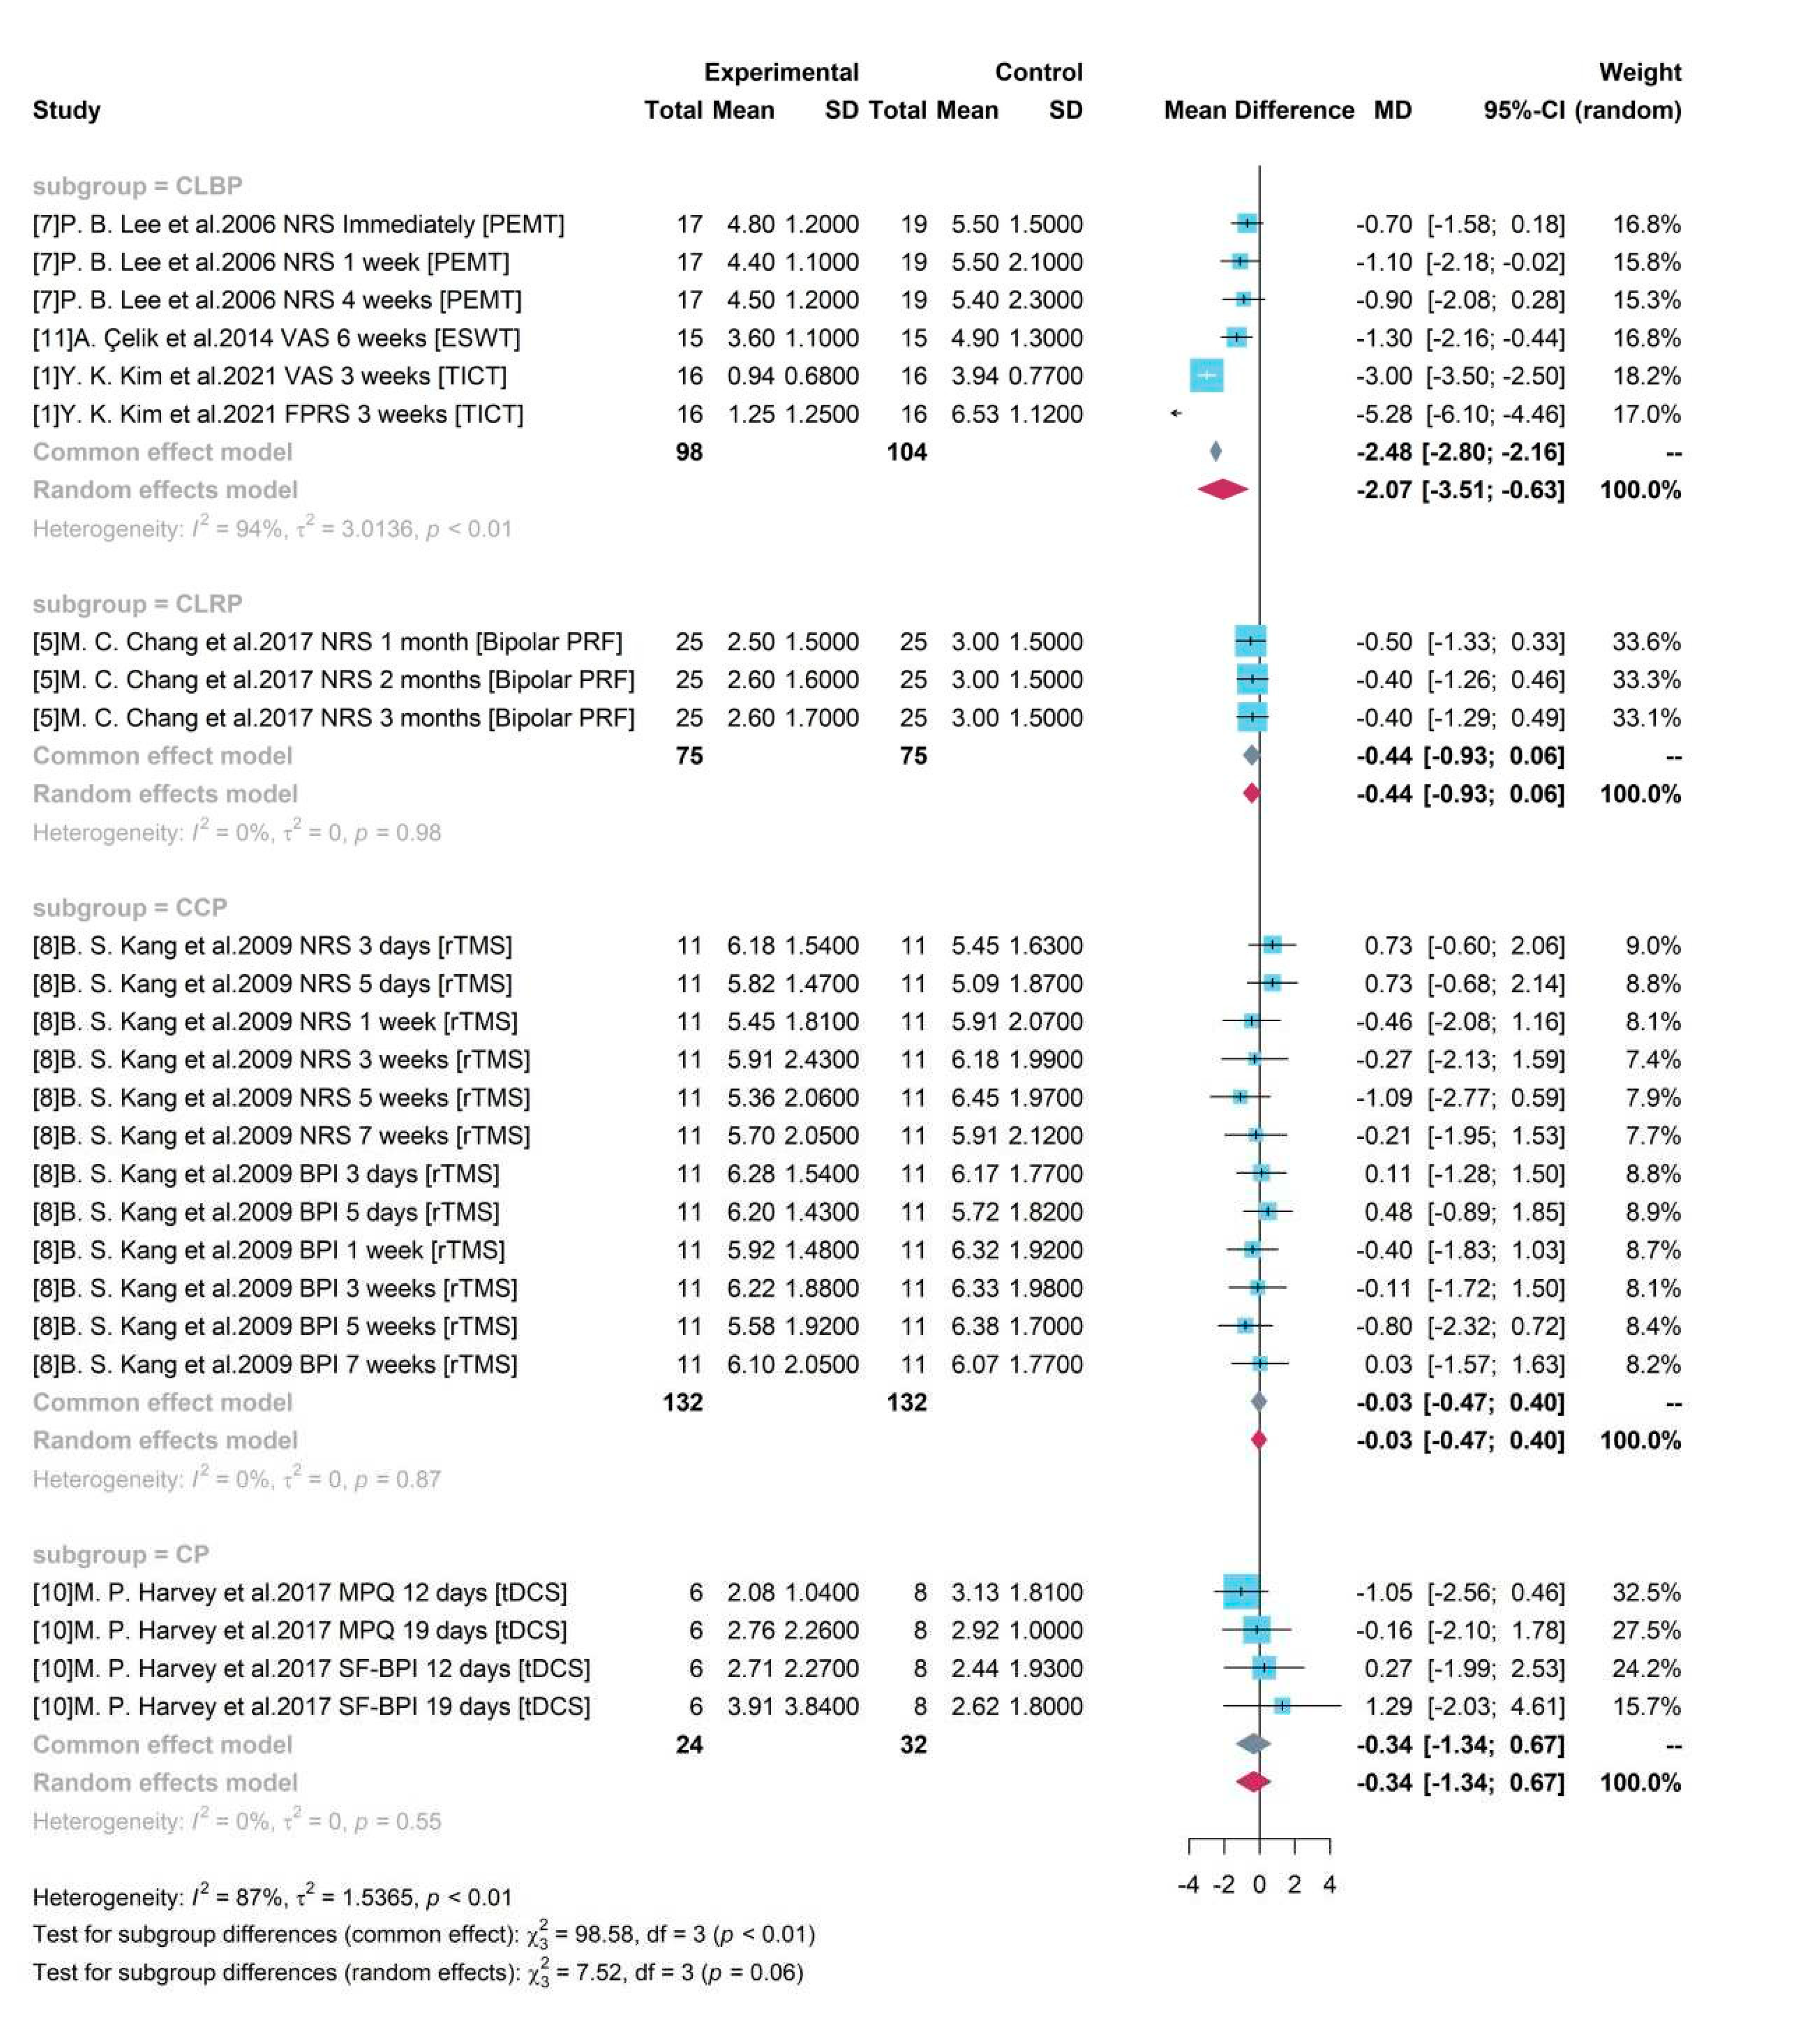
Subgroup analysis with Pain types
Based on different pain types, 4 groups were divided as CLBP, CLRP, CCP and CP. Only studies testing medical device among patients with CLBP produced a significant result. A high heterogeneity was detected with = 94% and p-value < 0.01. The random effects model reported the overall mean difference of medical device compared to control group was -2.07. It showed that included medical device-related interventions might produce an averagely 2.07-degree pain reduction on CLBP and a 95% CI ([-3.51, -0.63]) without covering 0 indicated the significance. However, for other groups, only one single study was included for testing the treatment efficacy of medical device on other pain types. And the insignificant results were consistent to the reported results in each study.
Subgroup analysis with study duration
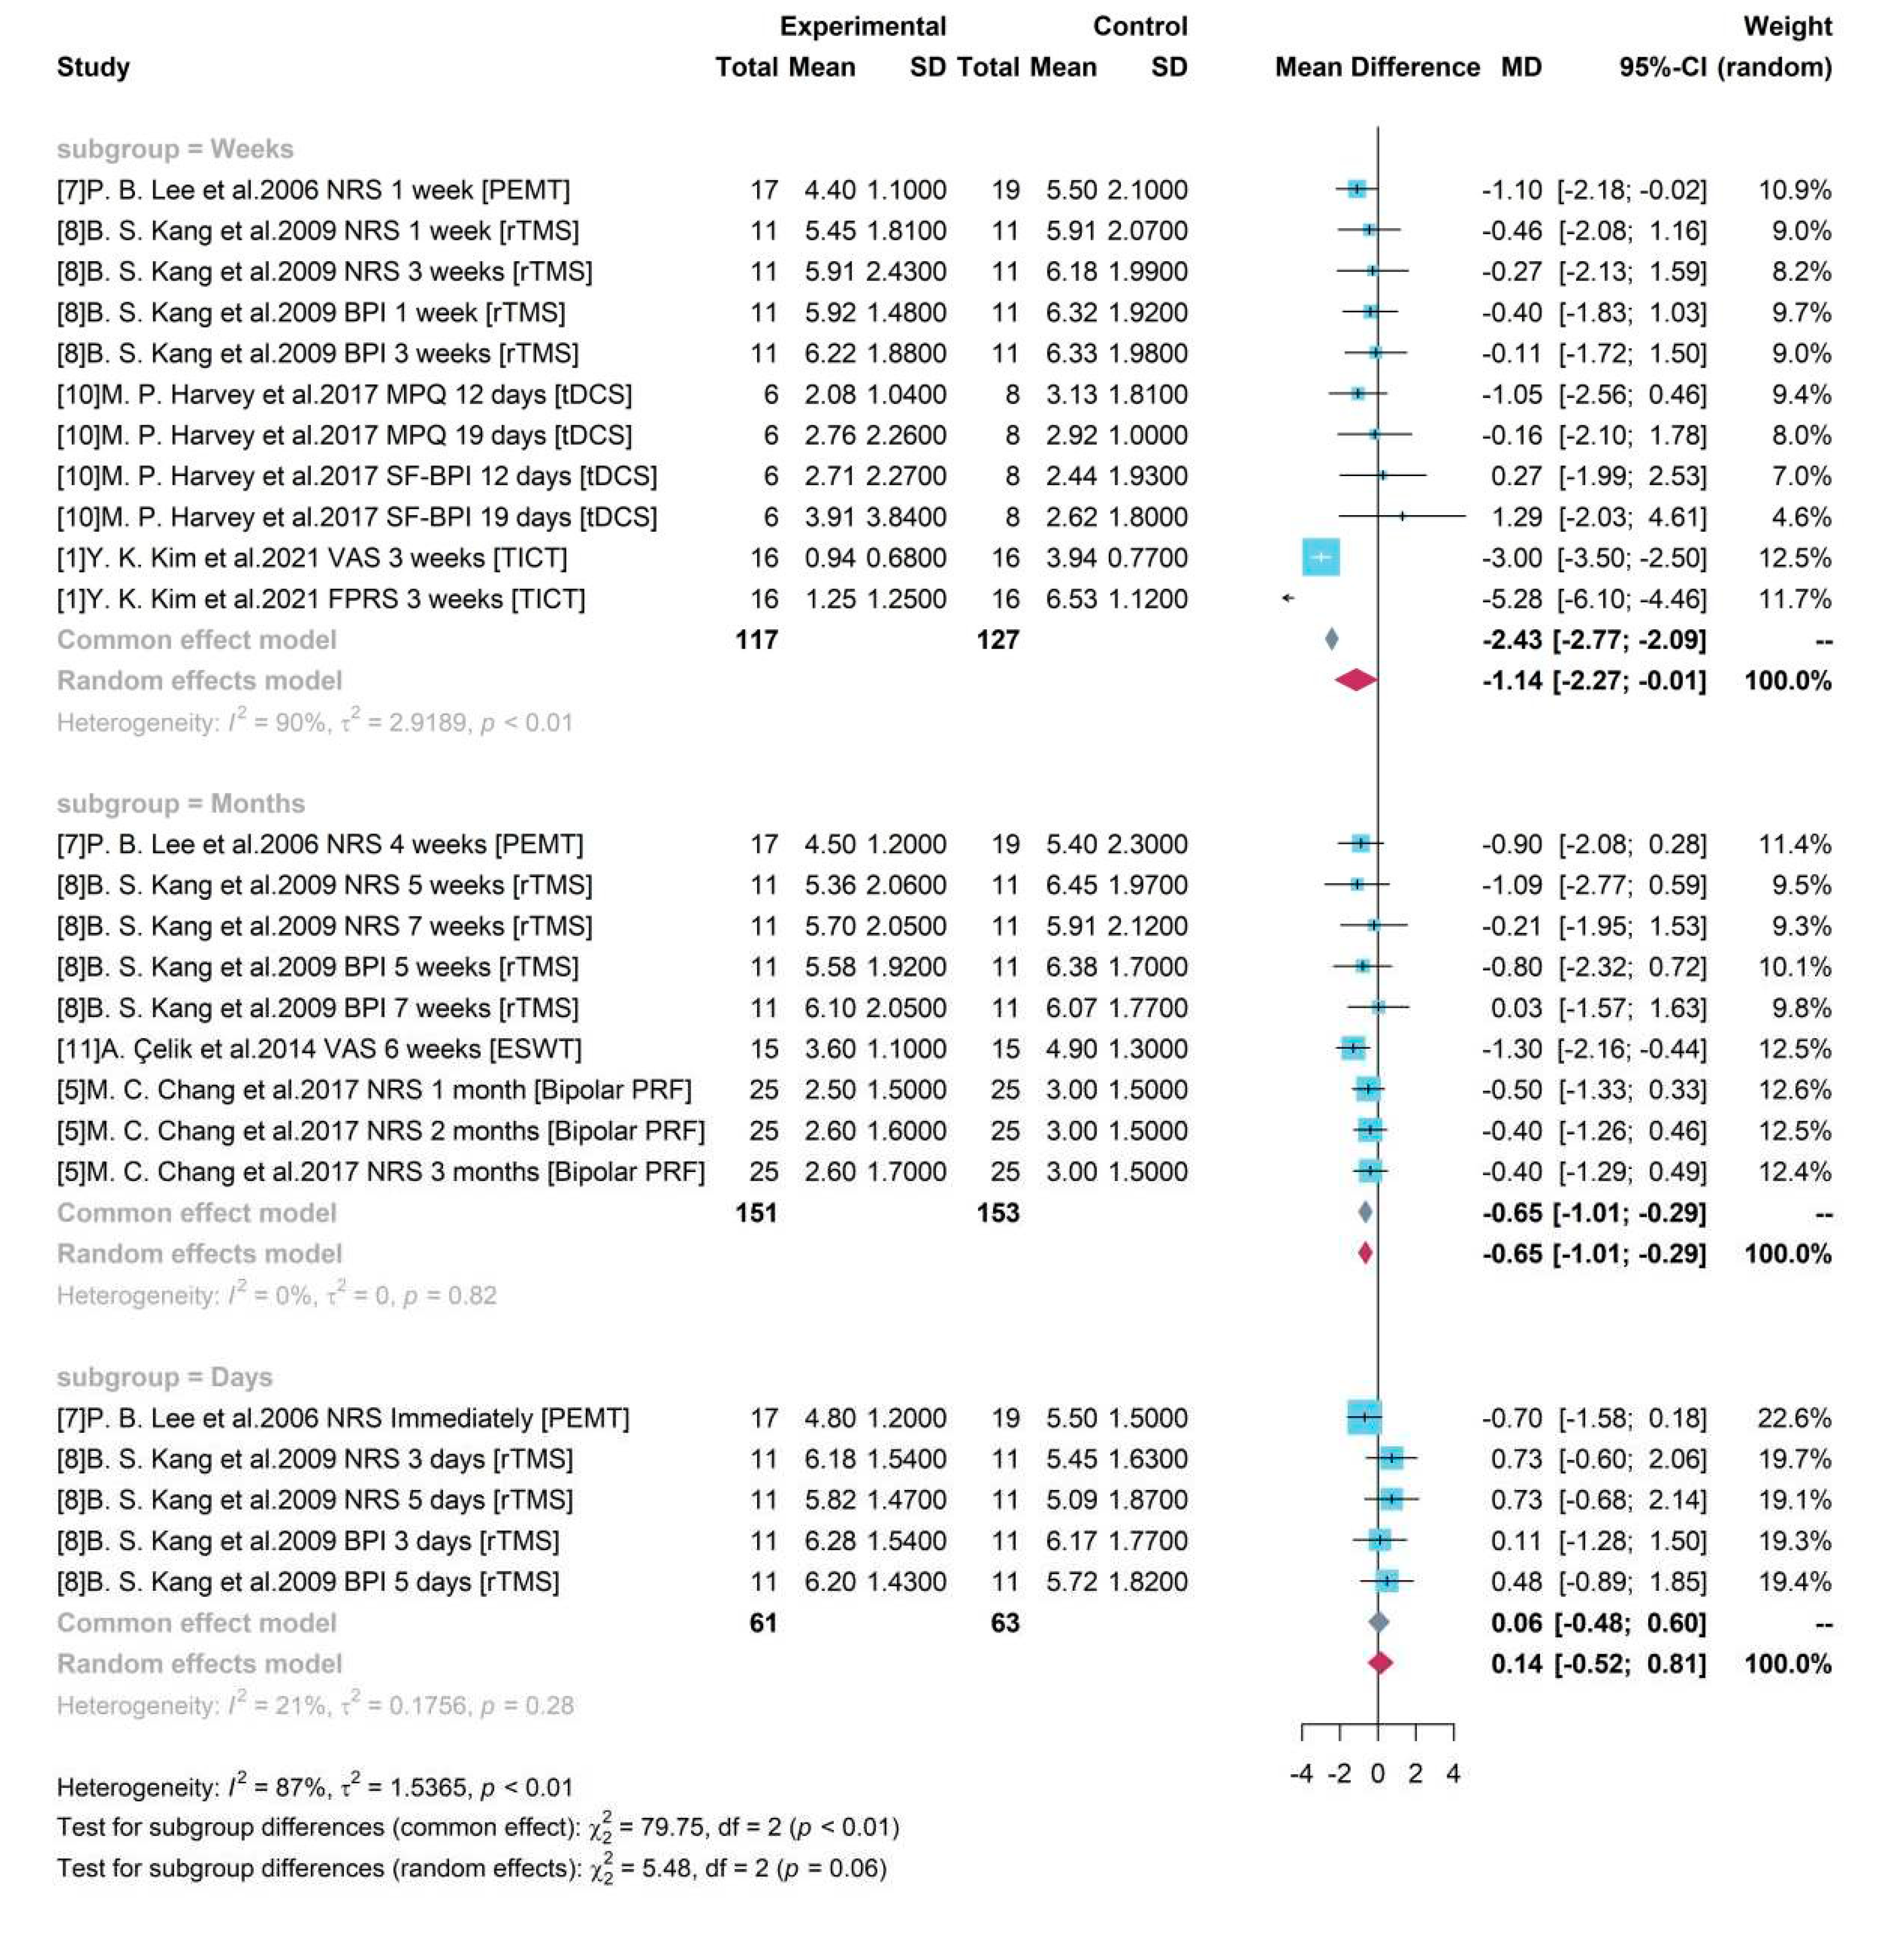
Based on the duration of each study, 3 groups were divided as “Days”, “Weeks”, and “Months”. As presented in
Figure 9, an increased heterogeneity (
= 90% and p-value < 0.01) was detected among studies with testing gap lasting for weeks (including a week) but a decreased heterogeneity in group “Days” and “Months”. It showed that study duration might be one of sources for heterogeneity. The random effects model was used for group “Weeks” and a pooled estimate of device-related treatment effect was -1.14 and the 95% CI [-2.27, -0.01] did not cover 0, showing the significance. The common effect model was used for other two groups. For studies with a gap duration of moths between pre- treatment and post- treatment, a pooled result of -0.65 ([-1.01, -0.29]) was produced. It revealed a pooled efficacy of PEMT, rTMS, ESWT, and Bipolar PRF, the commonly used neural stimulation treatment on chronic pain, was a 0.65-degree pain reduction under a 10-score scale.
Sensitive analysis
Sensitive analysis for all studies used in MA for pain level
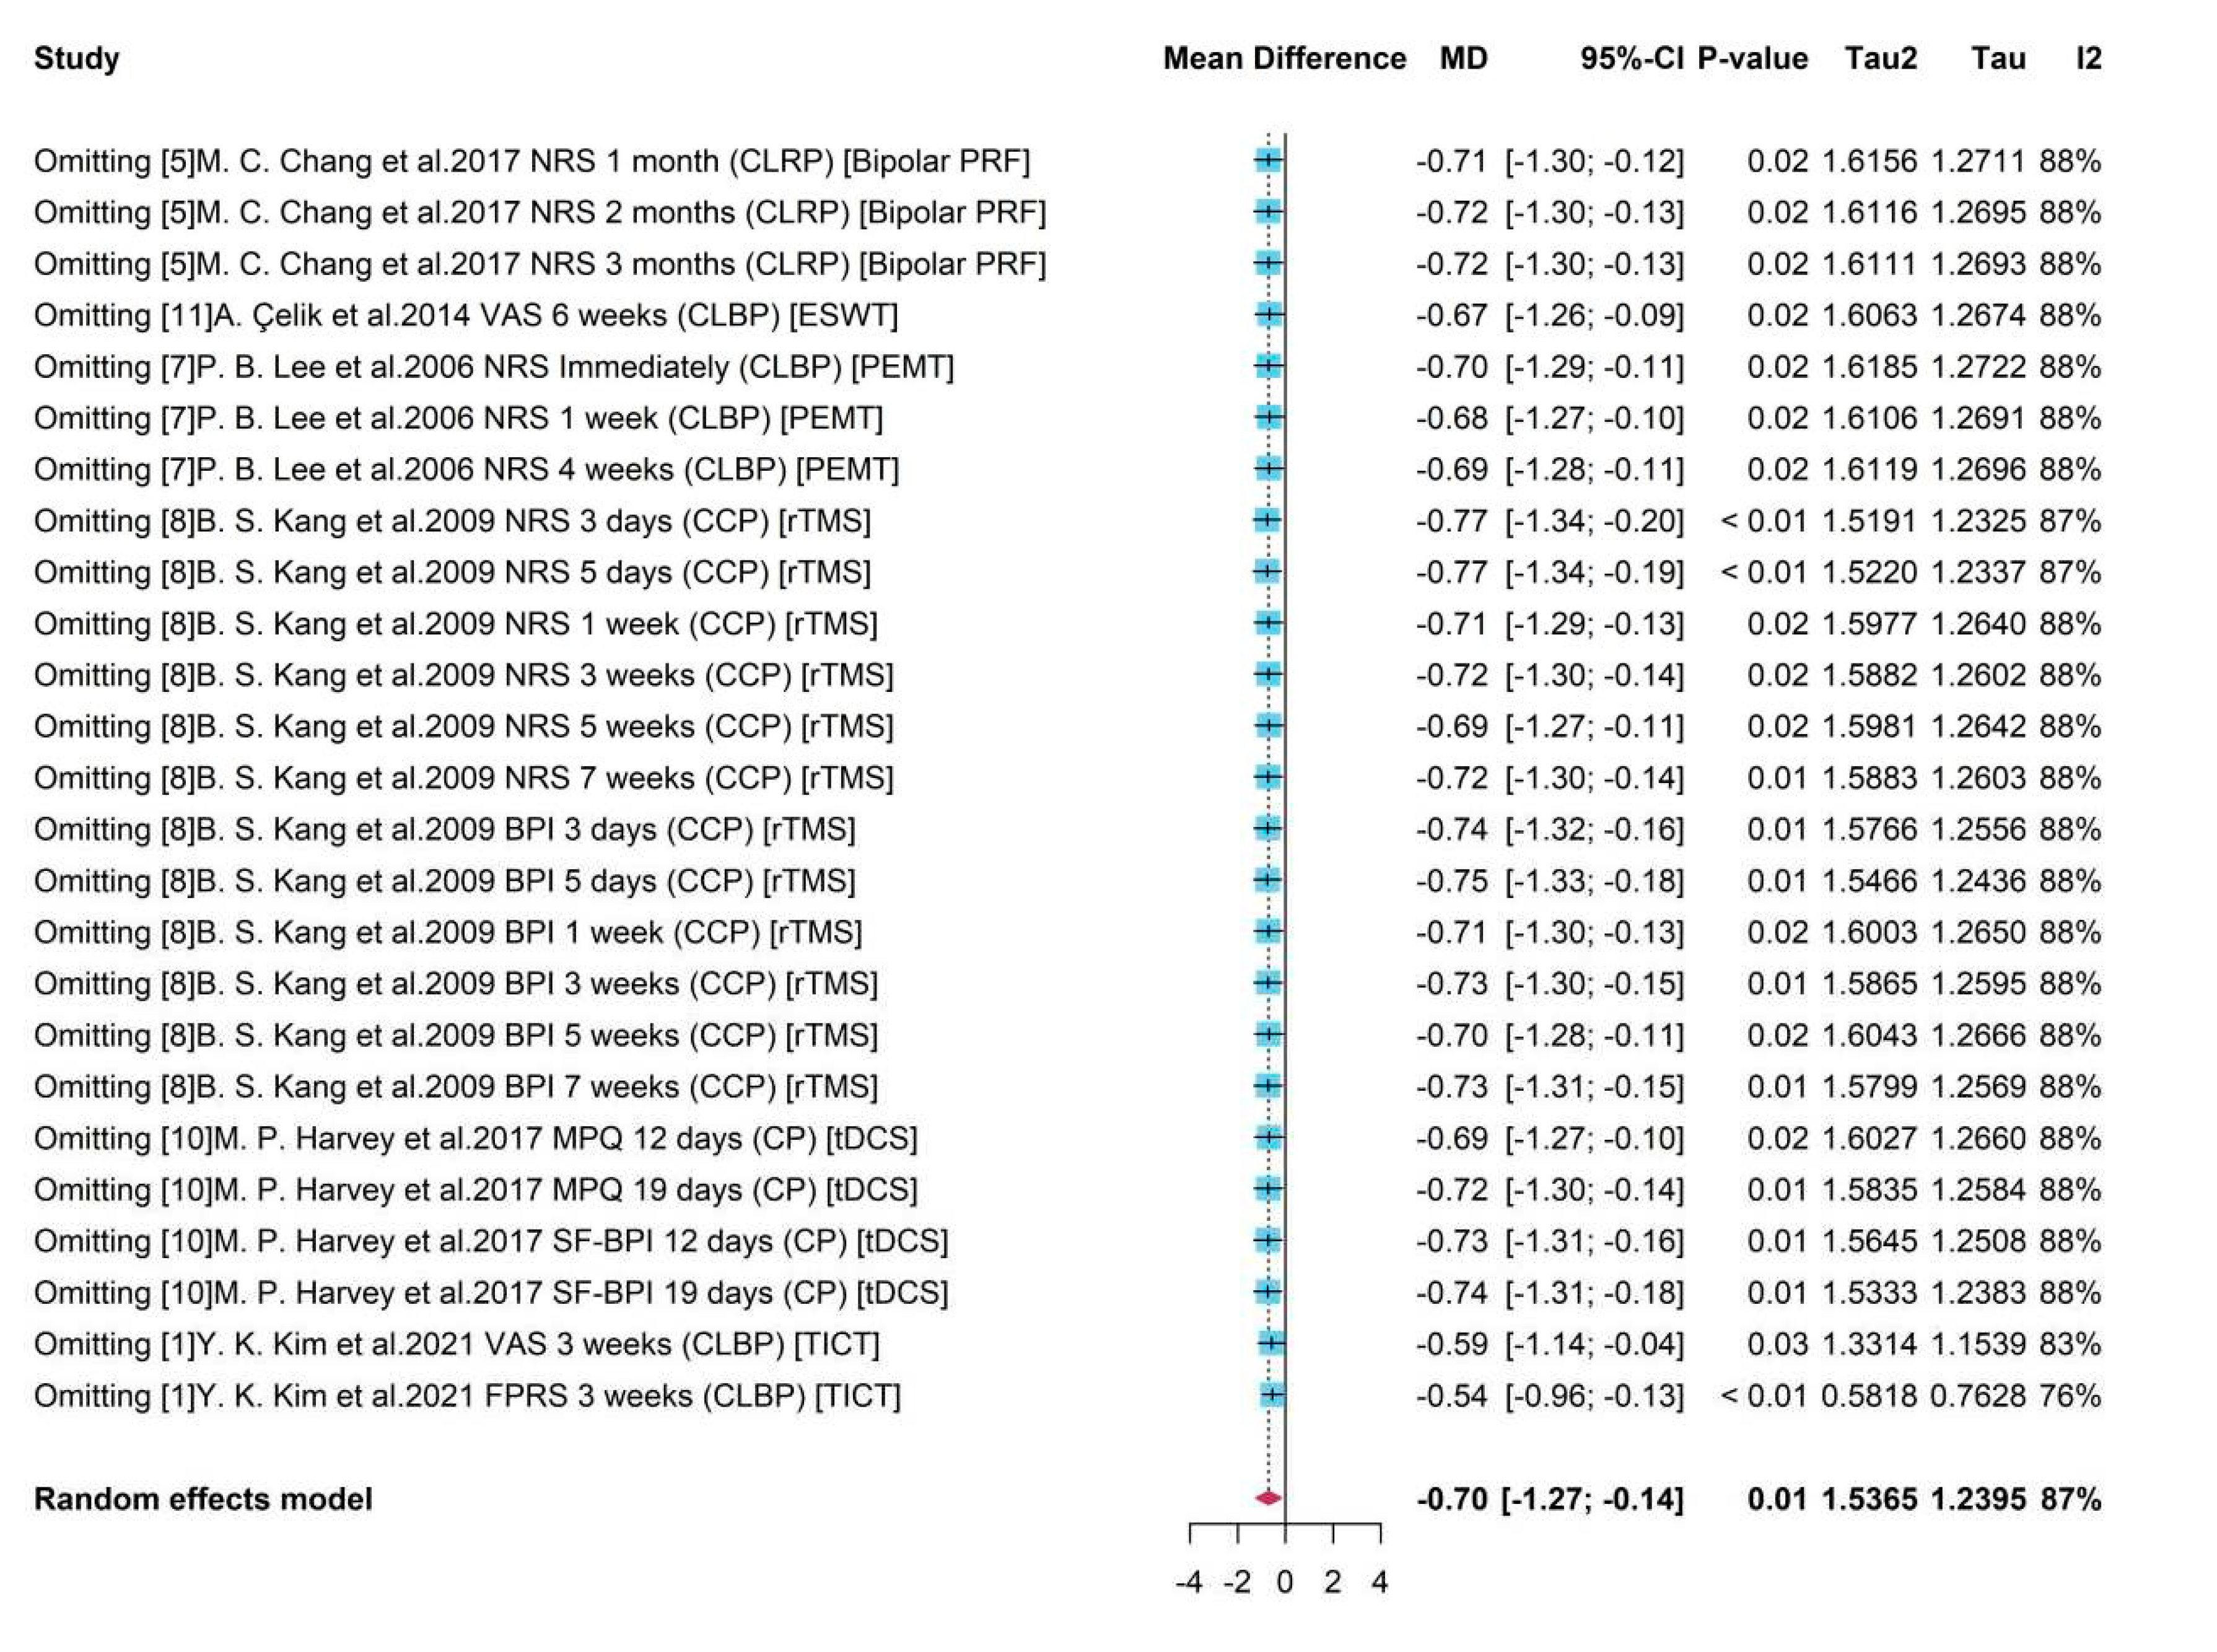
To see the robustness of pooled results and detect the possible bias induced by certain studies, Sensitivity Analysis was conducted for studies in MA for pain level. As presented in
Figure 10, on the left were the deleted studies, and on the right were the meta-results of the remaining studies after omitting each study.
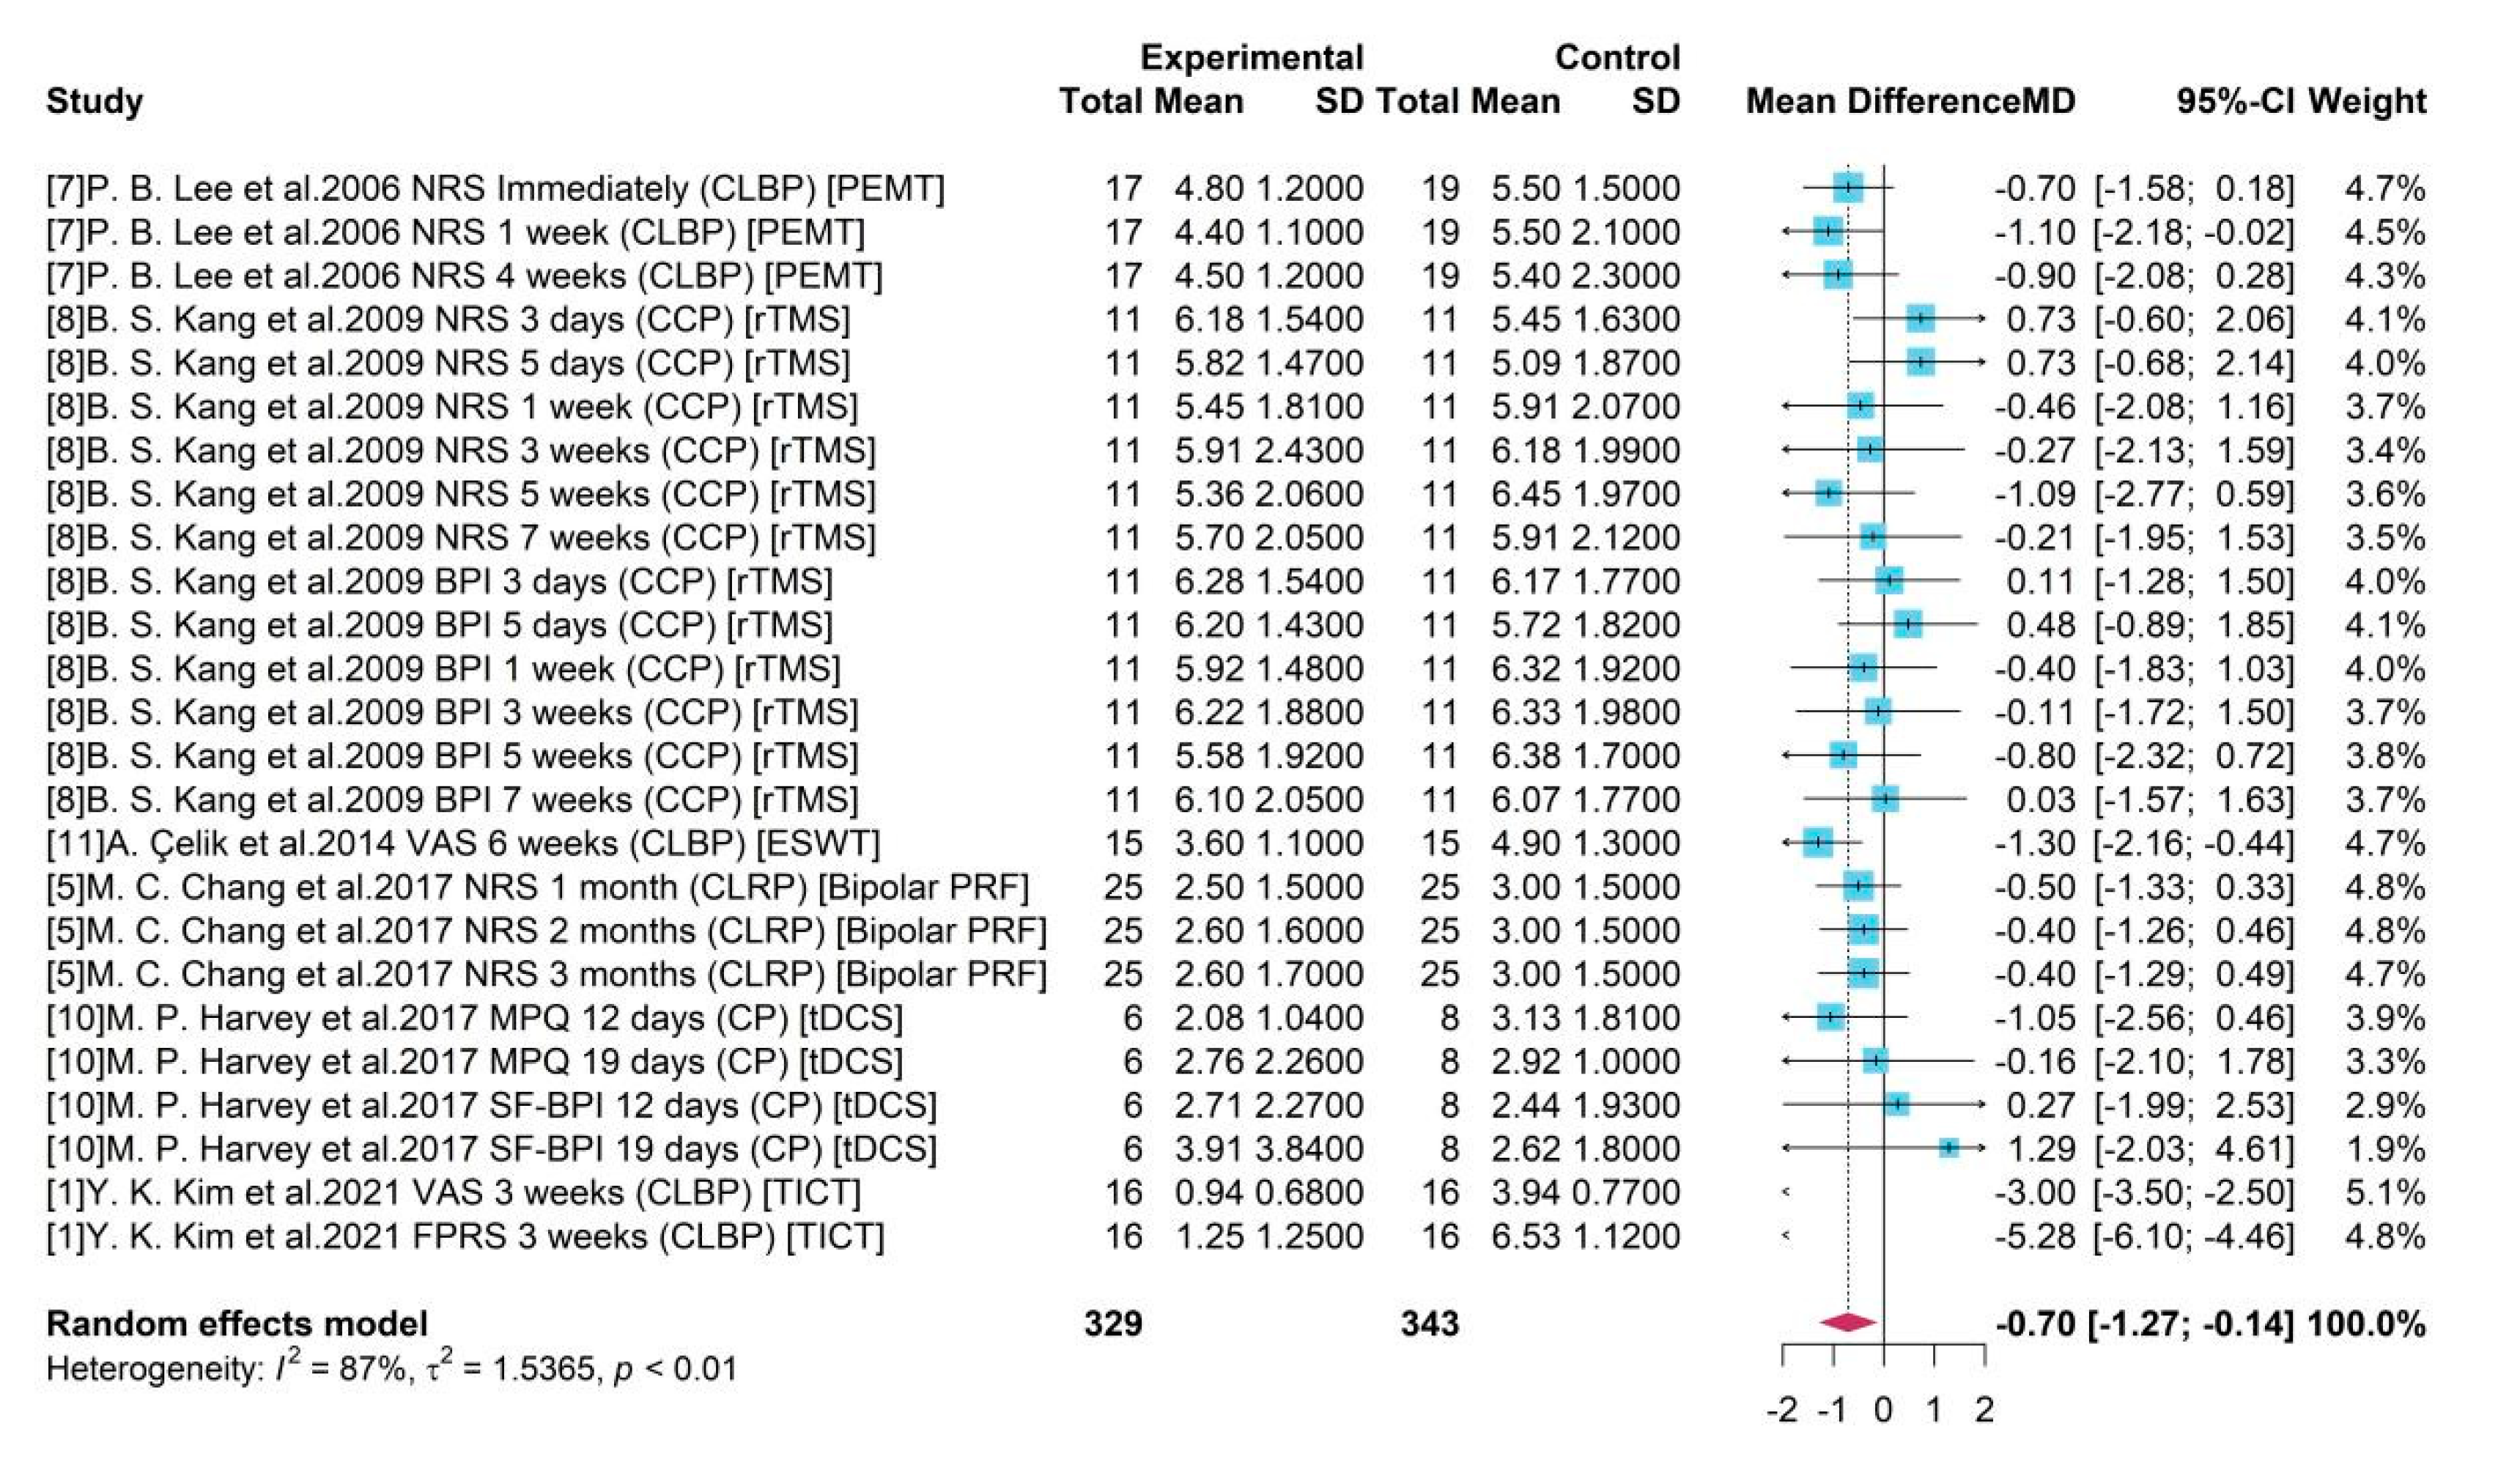
It showed that the existence of some studies would influence the pooled result compared to the overall estimation -0.70 with all studies by MA (
Figure 2). For example, after omitting study 8 the new pooled results like -0.75 and -0.77 would be higher (absolute value) than the overall one. However, without studies 1, an underestimate -0.54 or -0.59 was obtained. It also presented that sub-studies with a duration within a week from study 8 would produce unreliable treatment results, and the absence of them leaded to overestimates of -0.77. The heterogeneity decreased from 87% to 76% after omitting study 1 with assessment FPRS, indicating a potential source of heterogeneity. As a whole, the high heterogeneity (
= 87%, p-value = 0.01) was stable and a robust treatment effect with negative mean difference and a significant 95% CI was remained.
Publication bias
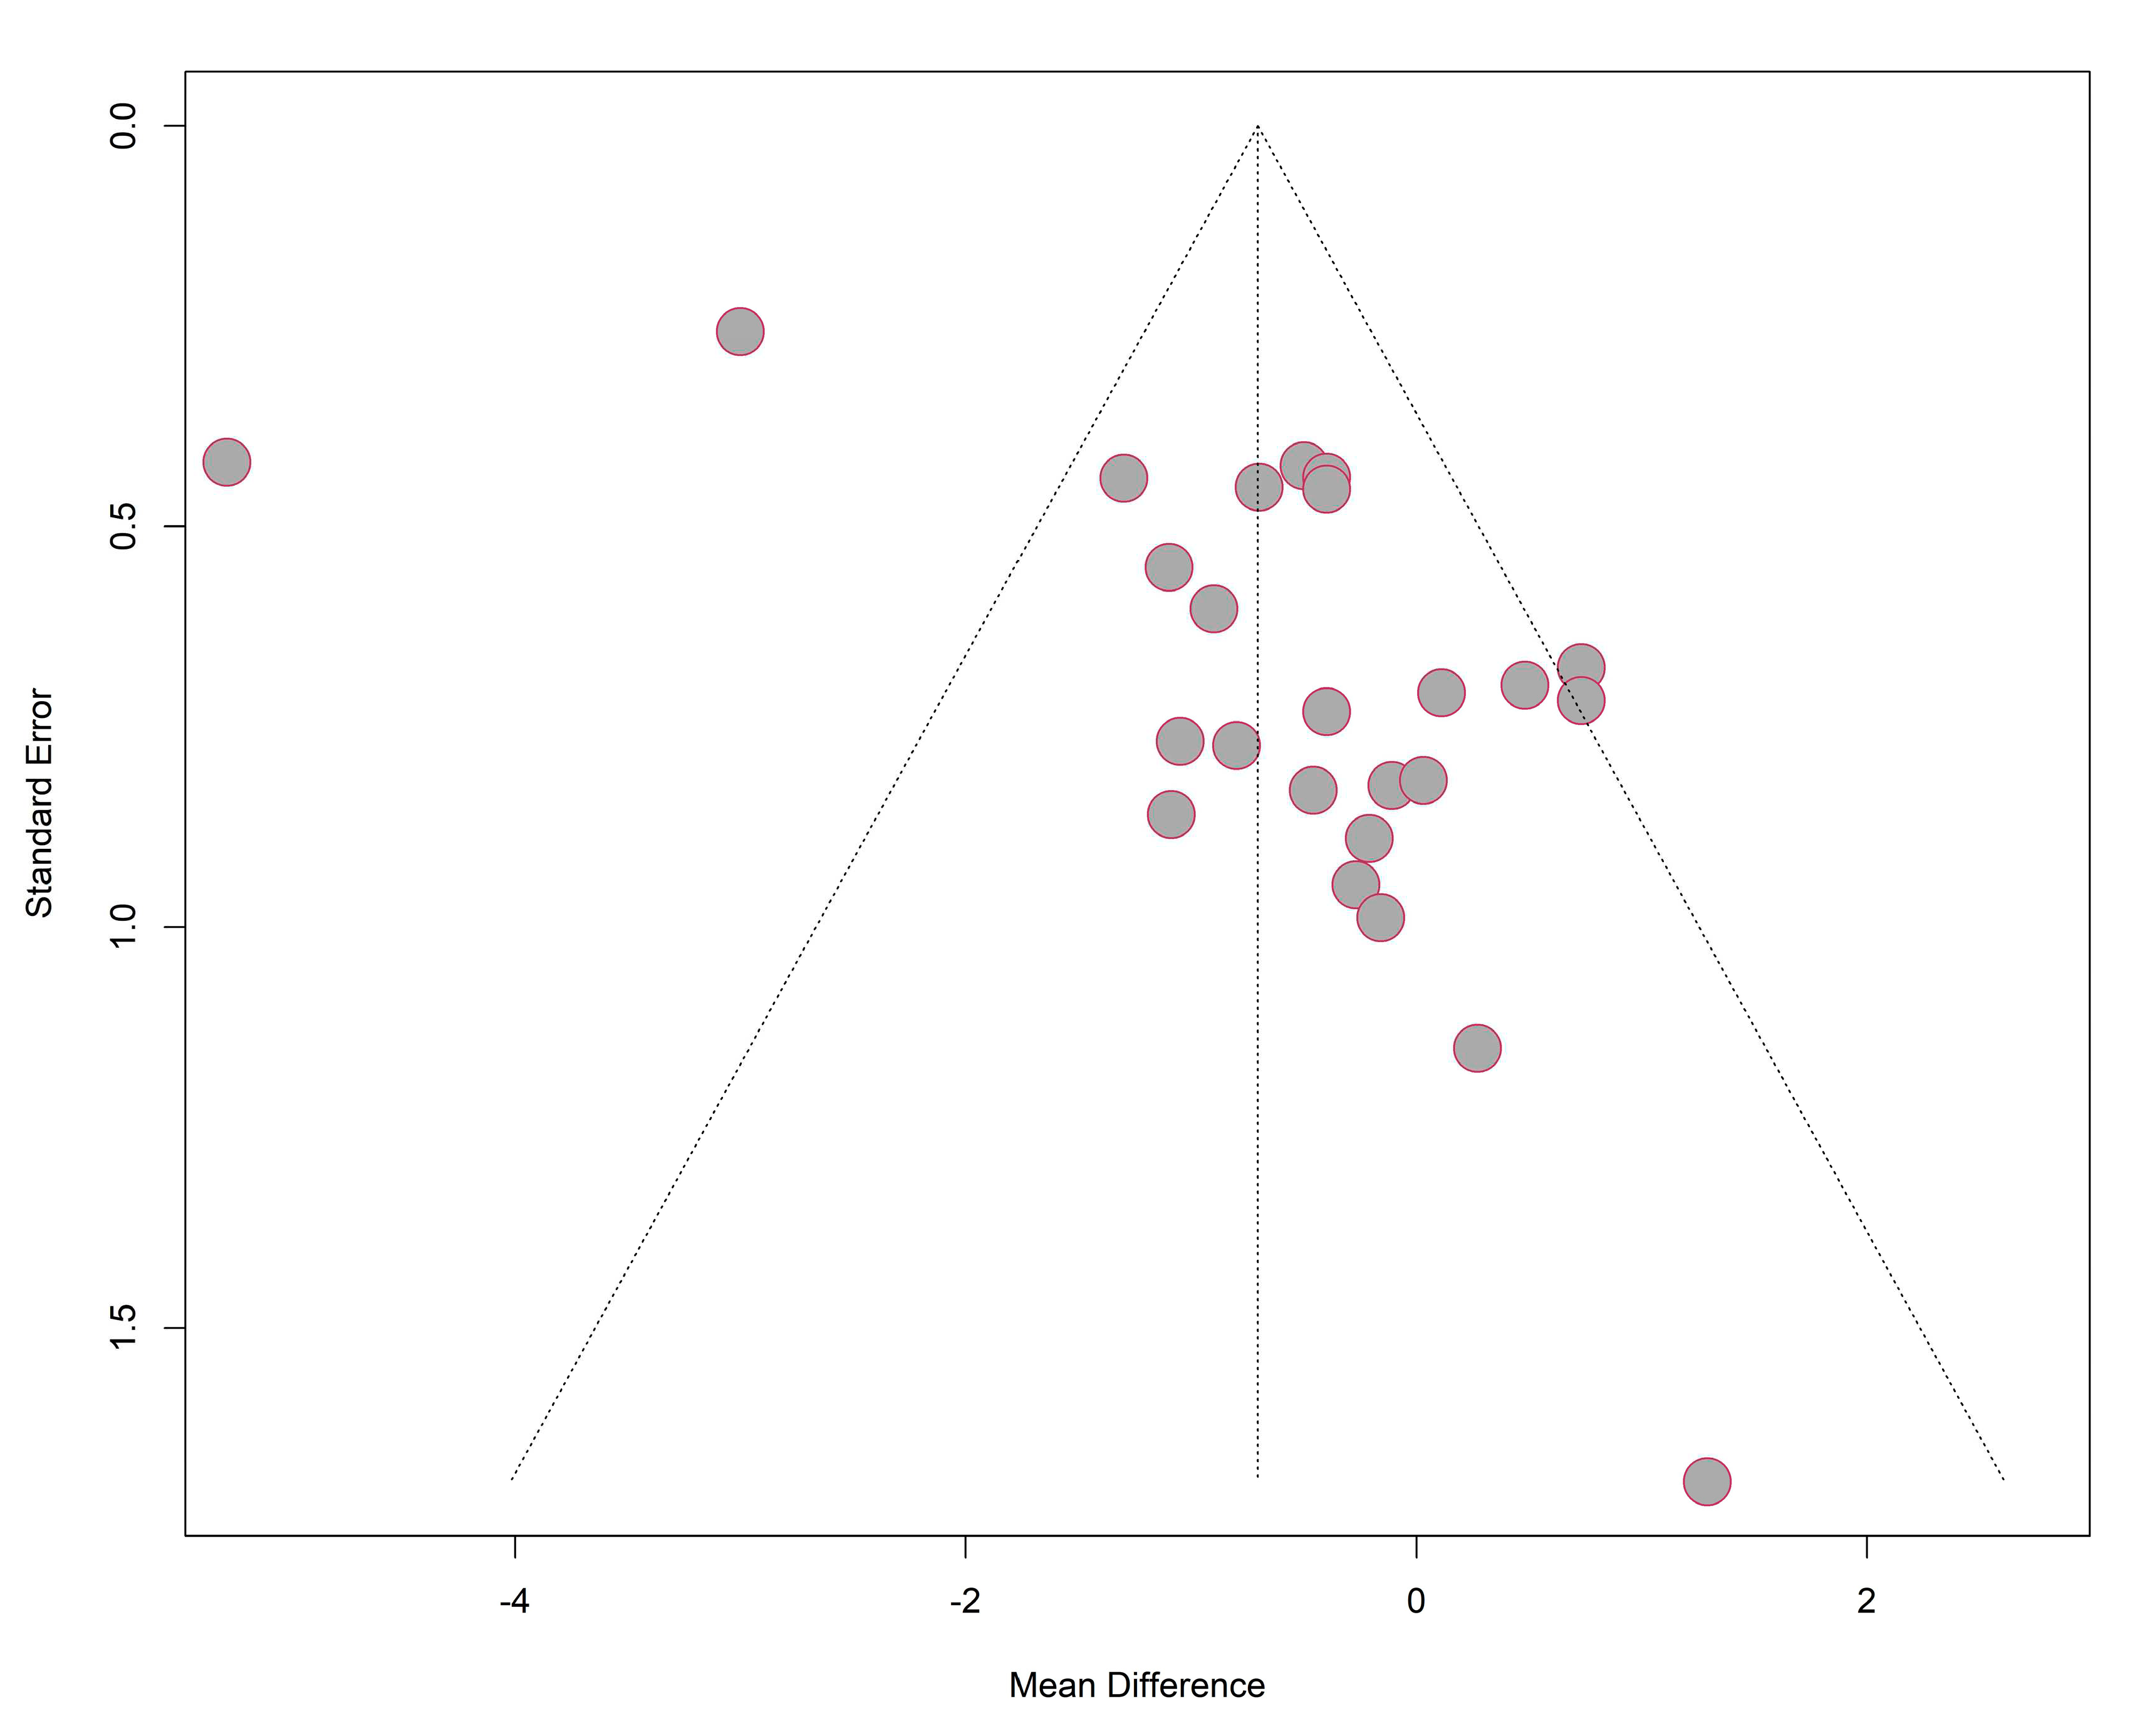
As presented in
Figure 11, most studies were included under the funnel but the funnel plot for studies used in MA was not symmetric in general. It showed that more studies reported a mean difference closer to 0 but fewer in the left side of the pooled result. The results of Egger test with p value (0.0015) smaller than 0.05 indicated that small-study effects were detected. It can be explained the limited number of studies included in our analysis and most of them had a small sample size. Also, studies with negative results (insignificant treatment effect) reported more stages of study and were extracted into more sub-studies, resulting the more contribution of insignificant results. Therefore, a more reliable and robust result can be produced from more studies testing on medical device with a larger sample size and multiple types of study designs.
Limitations
Better study designs should be considered for future clinical trials. Sample sizes for future clinical trials should reflect the disease and future populations. Some studies had multiple arms and the analysis was performed across the arms to ensure problems arising from the same trial can be examined effectively.
The provenance of evidence described in the findings did not clearly indicate the clinical trial teams comprised of multidisciplinary teams. Official discloses in relation to these studies were also not considered as standard procedure based on the timelines and current research practice guidelines.
Discussion
The findings of this study indicate that most common medical device clinical trials explore lower back pain although the pooled sample size of 875 patients. Pain reduction was a key outcome in the pooled study sample. Physical therapy is considered as an important facet of strengthening muscles, posture and flexibility. The contextual definition of lower back pain differed across all studies although the reference time was typically defined as pain lasting over 12 weeks. A pathological cause is not always identified although the North American Spine Society defined this as musculoskeletal pain extending from the lowest rib to the gluteal fold that could extend as somatic referred pain into the thigh. Whilst chronic pain localised to the lower back is defined as axial lower back pain, radicular pain is classified as pain that extend to the buttocks and legs. Chronic pain can be further classified into lower back pain post-laminectomy for example and those with non-surgical refractory lower back pain.
The most common pain condition that was treated based on the gathered evidence was lower back pain. All studies did not report demographic data, physical examinations and medical histories. For example, body mass index, weight, smoking status and height was not reported by all studies. These are important aspects to understand both direct and indirect relationships patients may have with pain management. The routine physical examinations performed during the clinical trial eligibility visit is equally useful to understand the neurological origin of the lower back or chronic pelvic pain reported. This is also important to understand if patients in the trials were taking any other medications as the presence of polypharmacy could impact outcomes such as pain intensity and thereby quality of life. The treatments for chronic back pain can be challenging and refractory to a variety of interventions. Spinal cord stimulation (SCS) has shown much promise although the pooled evidence in this study shows immediate relief, most clinical trials did not include longitudinal data. In a clinical setting, SCS is attractive for its ability to improve quality of life, safety, cost and clinical efficacy. This study findings show pain reduction was observed with TICT and PEMT for chronic lower back pain.
The pain disability scores showed significant improvement indicating notable treatment effect. The pooled mean difference of ODI between the medical device and control group was -7.44, indicating a medical device could produce 7.44 degree reduction in disability level compared to a placebo using a 50 score range. The pooled efficacy estimates of the device associated intervention tDCS was found to be insignificant in improving sleep quality. Although the systematically included studies did not indicate if the patients had any pre-existing sleep disorders or any other comorbidity that could lead to poor quality of sleep.
Mobile applications have become a useful application in clinical practice. Whilst some applications are within the medical devices regulations framework, some act as non-clinical support systems for patients with long term conditions. Mobile application based devices are gaining popularity in pain management in migraine, back pain, pelvic pain and fibromyalgia.27 Of the systematically included studies, 4 studies used mobile applications that are clinician aids to assist with managing pain among 437 patients. Most of the applications identified were able to provide health metrics, symptoms and medical use patterns.28 Goldstein et al. demonstrated how mobile applications can be used as decision making tools, incorporating machine learning to process large datasets and using this to formulate informed predictions of future pain. The evolution of machine learning and artificial intelligence based systems enabled analysis could emphasise the use of personalised patient management plans in the future. This can be a useful method of long-term management of chronic pain.29 Despite perceived accessibility and potential for widespread use at minimal cost to healthcare systems it is important to consider the availability of smartphones and the internet in low resource settings.30
The subgroup analysis conducted based on gender and pain types showed a disparity between biological gender representation. The subgroup analysis in relation to gender showed studies exploring TICT excluded women and other intervention trials underrepresented women. Whilst this is a common issue noted in clinical trials conducted across most clinical areas, the lack of gender parity is a concern to evaluate clinical efficacy and effectiveness. Equally, physiological differences between genders play a role in reporting pain inference and intensity which is an indicator for patient reported and health reported outcomes that impact cost efficiency.31 In addition, the lack of gender parity in clinical trials is particularly important to consider in chronic pain management, where women have an increased prevalence in addition to lower pain thresholds, lower pain tolerances and different analgesic sensitivities.32,6
Geographical representation is another important facet for understanding the generalisability of the findings. Of the pooled studies, 4 were conducted in Korea and 1 each in Canada and Turkey. The identified heterogeneity was not influenced by geographical location although there may be an indirect link due to differences in clinical practice. An awareness of variations in pain thresholds33 and disparities in responses to pain treatment amongst different ethnicities remains important although these details were not reported within the identified studies.34,35
It is evident, there is a need for robust clinical trials to better assess medical devices where the findings can be generalisable as indicated by the sensitivity analysis. For example, omitting studies 1 and 8 had a significant effect on the overall mean differences in pain reduction. Whilst, standardizing study designs are not possible, using core outcomes to assess the similar categories of chronic pain may provide better insight to medical device efficacy. The primary outcome measures varied across clinical trials. Pain was also assessed with self-reported measures that could be impacted by factors such as mood, disturbed sleep and medications that may influence the pain scores documented. Further biases may rise from recall period, selective recall, social desirability, or sampling approaches. The pooled sample of studies mostly used descriptive statistics and causal inferences were often not reported. This further purport the self-reported bias could have a difference between the true values versus the self-reported for the same measures.
Conclusion
The evidence generation to demonstrate efficacy and effectiveness of medical devices in chronic pain management requires extensive changes. Current evidence shows a variety of limitations including restriction to lower back pain when there is a variety of other pain conditions where medical devices are used for such as chronic pelvic pain. Minimally invasiveness in medical devices used in pain management can be a compelling reason for clinicians and patients to continue to use the technique in a cost effective manner. However, to optimally use medical devices in a sustainable manner, robust evidence based practice should be regarded as a key step.
Funding
Internal funding.
Author contributions
AS and GD developed the study protocol and embedded this within the POP project. GD and JQS designed the statistical analysis plan. GD, JQS, XY and CD completed the analysis. The first draft was written by GD and AT and, furthered by AS, AB and YB. All authors critically appraised and commented on previous versions of the manuscript. All authors read and approved the final manuscript.
Availability of data and material
The authors will consider sharing the dataset gathered upon receipt of reasonable requests.
Code availability
The authors will consider sharing the dataset gathered upon receipt of reasonable requests.
Ethics approval
Not applicable
Consent to participate
Not applicable
Consent for publication
All authors consented to publish this manuscript.
Conflicts of interest
AS has received funding from Nevro and Medtronic. PP has received research grant from Novo Nordisk, and other, educational from Queen Mary University of London, other from John Wiley & Sons, other from Otsuka, outside the submitted work. GD has received funding from GSK and NIHR for other projects. All other authors report no conflict of interest. The views expressed are those of the authors and not necessarily those of the NHS, the National Institute for Health Research, the Department of Health and Social Care or the Academic institutions.
References
- Dahlhamer, J. et al. Prevalence of Chronic Pain and High-Impact Chronic Pain Among Adults - United States, 2016. MMWR Morb Mortal Wkly Rep; 67:1001–1006 (2018). [CrossRef]
- Merskey, H., Bogduk, N. IASP task force on taxonomy, Part III: Pain Terms, A Current List with Definitions and Notes on Usage. IASP Press; Seattle, WA: 209–214 (1994).
- Chronic pain (primary and secondary) in over 16s: assessment of all chronic pain and management of chronic primary pain. NICE Guideline NG193. April 2021.
- Steglitz, J., Buscemi, J., Ferguson, M.J. The future of pain research, education, and treatment: a summary of the IOM report “Relieving pain in America: a blueprint for transforming prevention, care, education, and research” Transl Behav Med, 2. 6-8 (2012).
- Vos, T. et al. Global, regional, and national incidence, prevalence, and years lived with disability for 328 diseases and injuries for 195 countries, 1990–2016: a systematic analysis for the Global Burden of Disease Study 2016. Lancet; 390: 1211-12599 (2017).
- Van Hecke, O., Torrance, N., Smith, B. Chronic pain epidemiology and its clinical relevance. Br J Anaesth;111:13–18 (2013). [CrossRef]
- Juni M, H. Ageing population: a public health implications. International Journal of Public Health and Clinical Sciences, (2015).
- Kopf ,A,. Patel, N, B,. Guide to Pain Management in Low-Resource Settings, International association for the study of pain, (2010).
- Qin, V. et al. Rural and urban differences in health system performance among older Chinese adults: cross-sectional analysis of a national sample,BMC Health Services Research 20:372(2020).
- Morriss, W, W,. Roques C, J. Pain management in low and middle-income countries BJA Educ. 18(9): 265–270. (2018). [CrossRef]
- Long-term international migration, provisional: year ending June 2022, Office for national statistics (2022).
- International migration, England and Wales: census 2021, Office for national statistics (2021).
- Population by country of birth and nationality, Office for national statistics (2021).
- Chronic pain in adults 2017 Health Survey for England, Public Health England (2017).
- Uitewaal, P, J., Manna, D, R., Bruijnzeels, M, A., Hoes, A, W., Thomas, S. Prevalence of type 2 diabetes mellitus, other cardiovascular risk factors, and cardiovascular disease in Turkish and Moroccan immigrants in North West Europe: a systematic review. Prev Med.;39(6):1068–76.(2004).
- Newbold, B., Danforth, J. Health status and Canada's immigrant population, Social Science & Medicine, Nov;57(10):1981-95. (2003).
- McQueenie, R. et al. Prevalence of chronic pain in LTCs and multimorbidity: A cross-sectional study using UK Biobank, J Multimorb Comorb, Dec 21;11:26335565211005870 (2021). [CrossRef]
- Missinne, S, Bracke, P,. Depressive symptoms among immigrants and ethnic minorities: a population based study in 23 European countries. Soc Psychiatry Psychiatry Epidemiol;47(1):97–109 (2012). [CrossRef]
- Berterame, S. et al. Use of and barriers to access to opioid analgesics: a worldwide, regional, and national study Lancet. Apr 16;387(10028):1644-56 (2016). [CrossRef]
- Opioid overdose. Who.int : www.who.int/news-room/fact-sheets/detail/opioidoverdose.
- Melzack, R., Wall, P. Pain Mechanisms: A New Theory: A gate control system modulates sensory input from the skin before it evokes pain perception and response. Nov 19;150(3699):971-9 (1965).
- Shealy, C, N., Mortimer, J, T., Reswick, J, B. Electrical inhibition of pain by stimulation of the dorsal columns: preliminary clinical report. Anesth Analg Jul-Aug;46(4):489-91 (1967).
- Higgins, J, P,T., Thompson, S, G. Quantifying heterogeneity in a meta-analysis. Stat. Med. 21, 1539–1558 (2002). [CrossRef]
- Borenstein, M., Hedges, L, V., Higgins, J, P., Rothstein, H, R. A basic introduction to fixed-effect and random-effects models for meta-analysis. Research Synthesis Methods, 1, 97–111(2010).
- Rothstein, H.R., Sutton, A.J., Borenstein, M.: Publication Bias in Meta Analysis: Prevention, Assessment and Adjustments. Wiley, Chichester (2005).
- Schwarzer, G., Carpenter, J, R., Rücker, G. Meta-Analysis with R by (auth.)https://link.springer.com/book/10.1007/978-3-319-21416-0.
- Shetty, A et al. A systematic review and meta-analysis of digital application use in clinical research in pain medicine Front Digit Health Nov 2;4:850601 (2022).
- Verma, R. Role of Machine Learning in Data Science Simplified 101.. Role of Machine Learning in Data Science Simplified 101 hevodata.com (2021).
- T. et al. Effects of an Artificial Intelligence-Assisted Health Program on Workers With Neck/Shoulder Pain/Stiffness and Low Back Pain: Randomized Controlled Trial JMIR Mhealth Uhealth Sep 24;9(9):e27535 (2021).
- Bastawrous, A., Armstrong J. M,. Mobile health use in low- and high-income countries: an overview of the peer-reviewed literature, J R Soc Med. Apr; 106(4): 130–142 (2013). [CrossRef]
- Liu, K, A., Mager, N, A, D. Women’s involvement in clinical trials: historical perspective and future implications Pharm Pract (Granada). Jan-Mar; 14(1): 708 (2016).
- Wiesenfeld-Hallin, Z,. Sex differences in pain perception, Gend Med, 2,137-145 (2005). [CrossRef]
- Wyatt, R. Pain and Ethnicity, Virtual Mentor, May 1;15(5):449-54 (2013).
- Merry, B., et al. Ethnic group differences in the outcomes of multidisciplinary pain treatment. J Musculoskelet Pain.;19(1):24–30 (2011). [CrossRef]
- Campbell, C, M., Edwards R, R. Ethnic differences in pain and pain management, Pain Manag. May; 2(3): 219–230. (2012).
|
Disclaimer/Publisher’s Note: The statements, opinions and data contained in all publications are solely those of the individual author(s) and contributor(s) and not of MDPI and/or the editor(s). MDPI and/or the editor(s) disclaim responsibility for any injury to people or property resulting from any ideas, methods, instructions or products referred to in the content. |
© 2023 by the authors. Licensee MDPI, Basel, Switzerland. This article is an open access article distributed under the terms and conditions of the Creative Commons Attribution (CC BY) license (http://creativecommons.org/licenses/by/4.0/).
