Submitted:
23 May 2023
Posted:
25 May 2023
You are already at the latest version
Abstract
Keywords:
1. Introduction
- compliance to the EU 2010/31/EU;
- achievement of 60% energy savings in terms of primary energy;
- evaluation of benefits for each intervention and action, assessed in terms of energy balance.
2. Materials and Methods
2.1. Background
- Electricity needs: primary energy associated to energy needs is calculated using standard national coefficients (i.e. based on the average proficiency related to the transformation of primary energy into electricity, based on the plants operating in the country);
- Thermal needs for heating: by considering the energy vectors involved in the transformation processes (i.e. hot water, air, etc.) and from information from energy bills and/or specific analysis considering a quasi-steady state heat exchange between building envelope during winter;
- Hot water demand: estimated based on the typology of the building, its usage and the efficiency of the plants installed;
- Thermal needs for cooling: extrapolated for electric consumptions, from which the needs referred to cooling consumptions have been isolated.
| Thermal requirements (heating and hot water) |
Thermal requirements (cooling) |
Electricity requirements |
|---|---|---|
| Qpa=Qta/Ƞca | COMPRESSION CHILLER Qpcool= Qtcool/ Ƞel-n * COP |
GRID CONNECTION QPea = QEa/ Ƞel-n |
| cc | CHP QPeβ = QEβ nE |
- if district heating is fed by CHP plants, it is necessary to assess an appropriate procedure for the allocation of both primary energy and emission from electric and thermal energy production in the general evaluation;
- if district heating is fed by different typology of plants, a feasible solution for the computation may be considered as a unique plant supplied by different fuels, and to evaluate its thermal and electrical energy production as a sum of input and output of each power plant. Energy information of these type of system might be difficult to find.
2.2. Energy performance baseline
- to evaluate and control product and process innovation based on live demonstration buildings;
- to present recommendations to obtain the 60% reduction of primary energy needs;
- to optimize and standardize technical solution for 60% reduction of energy consumptions;
- to provide a validation of each energy assessment:
- to reduce of about 15% costs of construction of about 50% time of construction and to provide high level of IEQ (Indoor Environmental Quality);
- to provide inhabitant of advanced tools to monitor the performance of the building after deep renovation.
| BUILDING | ENERGY NEEDS | ACTIVITY USE | |
|---|---|---|---|
| LEVEL 1- DATA COLLECTION | Plans | Bills | Internal zoning |
| LEVEL 2-AUDIT AND CONSUMPTION PROFILE | Stratigraphy of components | Installed systems, set points | Usage time pattern |
| LEVEL 3- BUILDING BEHAVIOUR | Digital model and energy simulation | ||
2.3. Calculation of primary energy consumption
- Efficiency: The entire process does not require excessive time to provide result; it is also possible to immediately correct possible inaccuracy.
- Accuracy: Using internal libraries for weather information and location, the latest software provide very accurate results with the essential data required as input. The heat gains provided by transparent elements are taken into consideration by the software.
- Results could be less precise due to the lack of energetic simulation in dynamic regime.
- Standardisation of the building to existing class and typology.
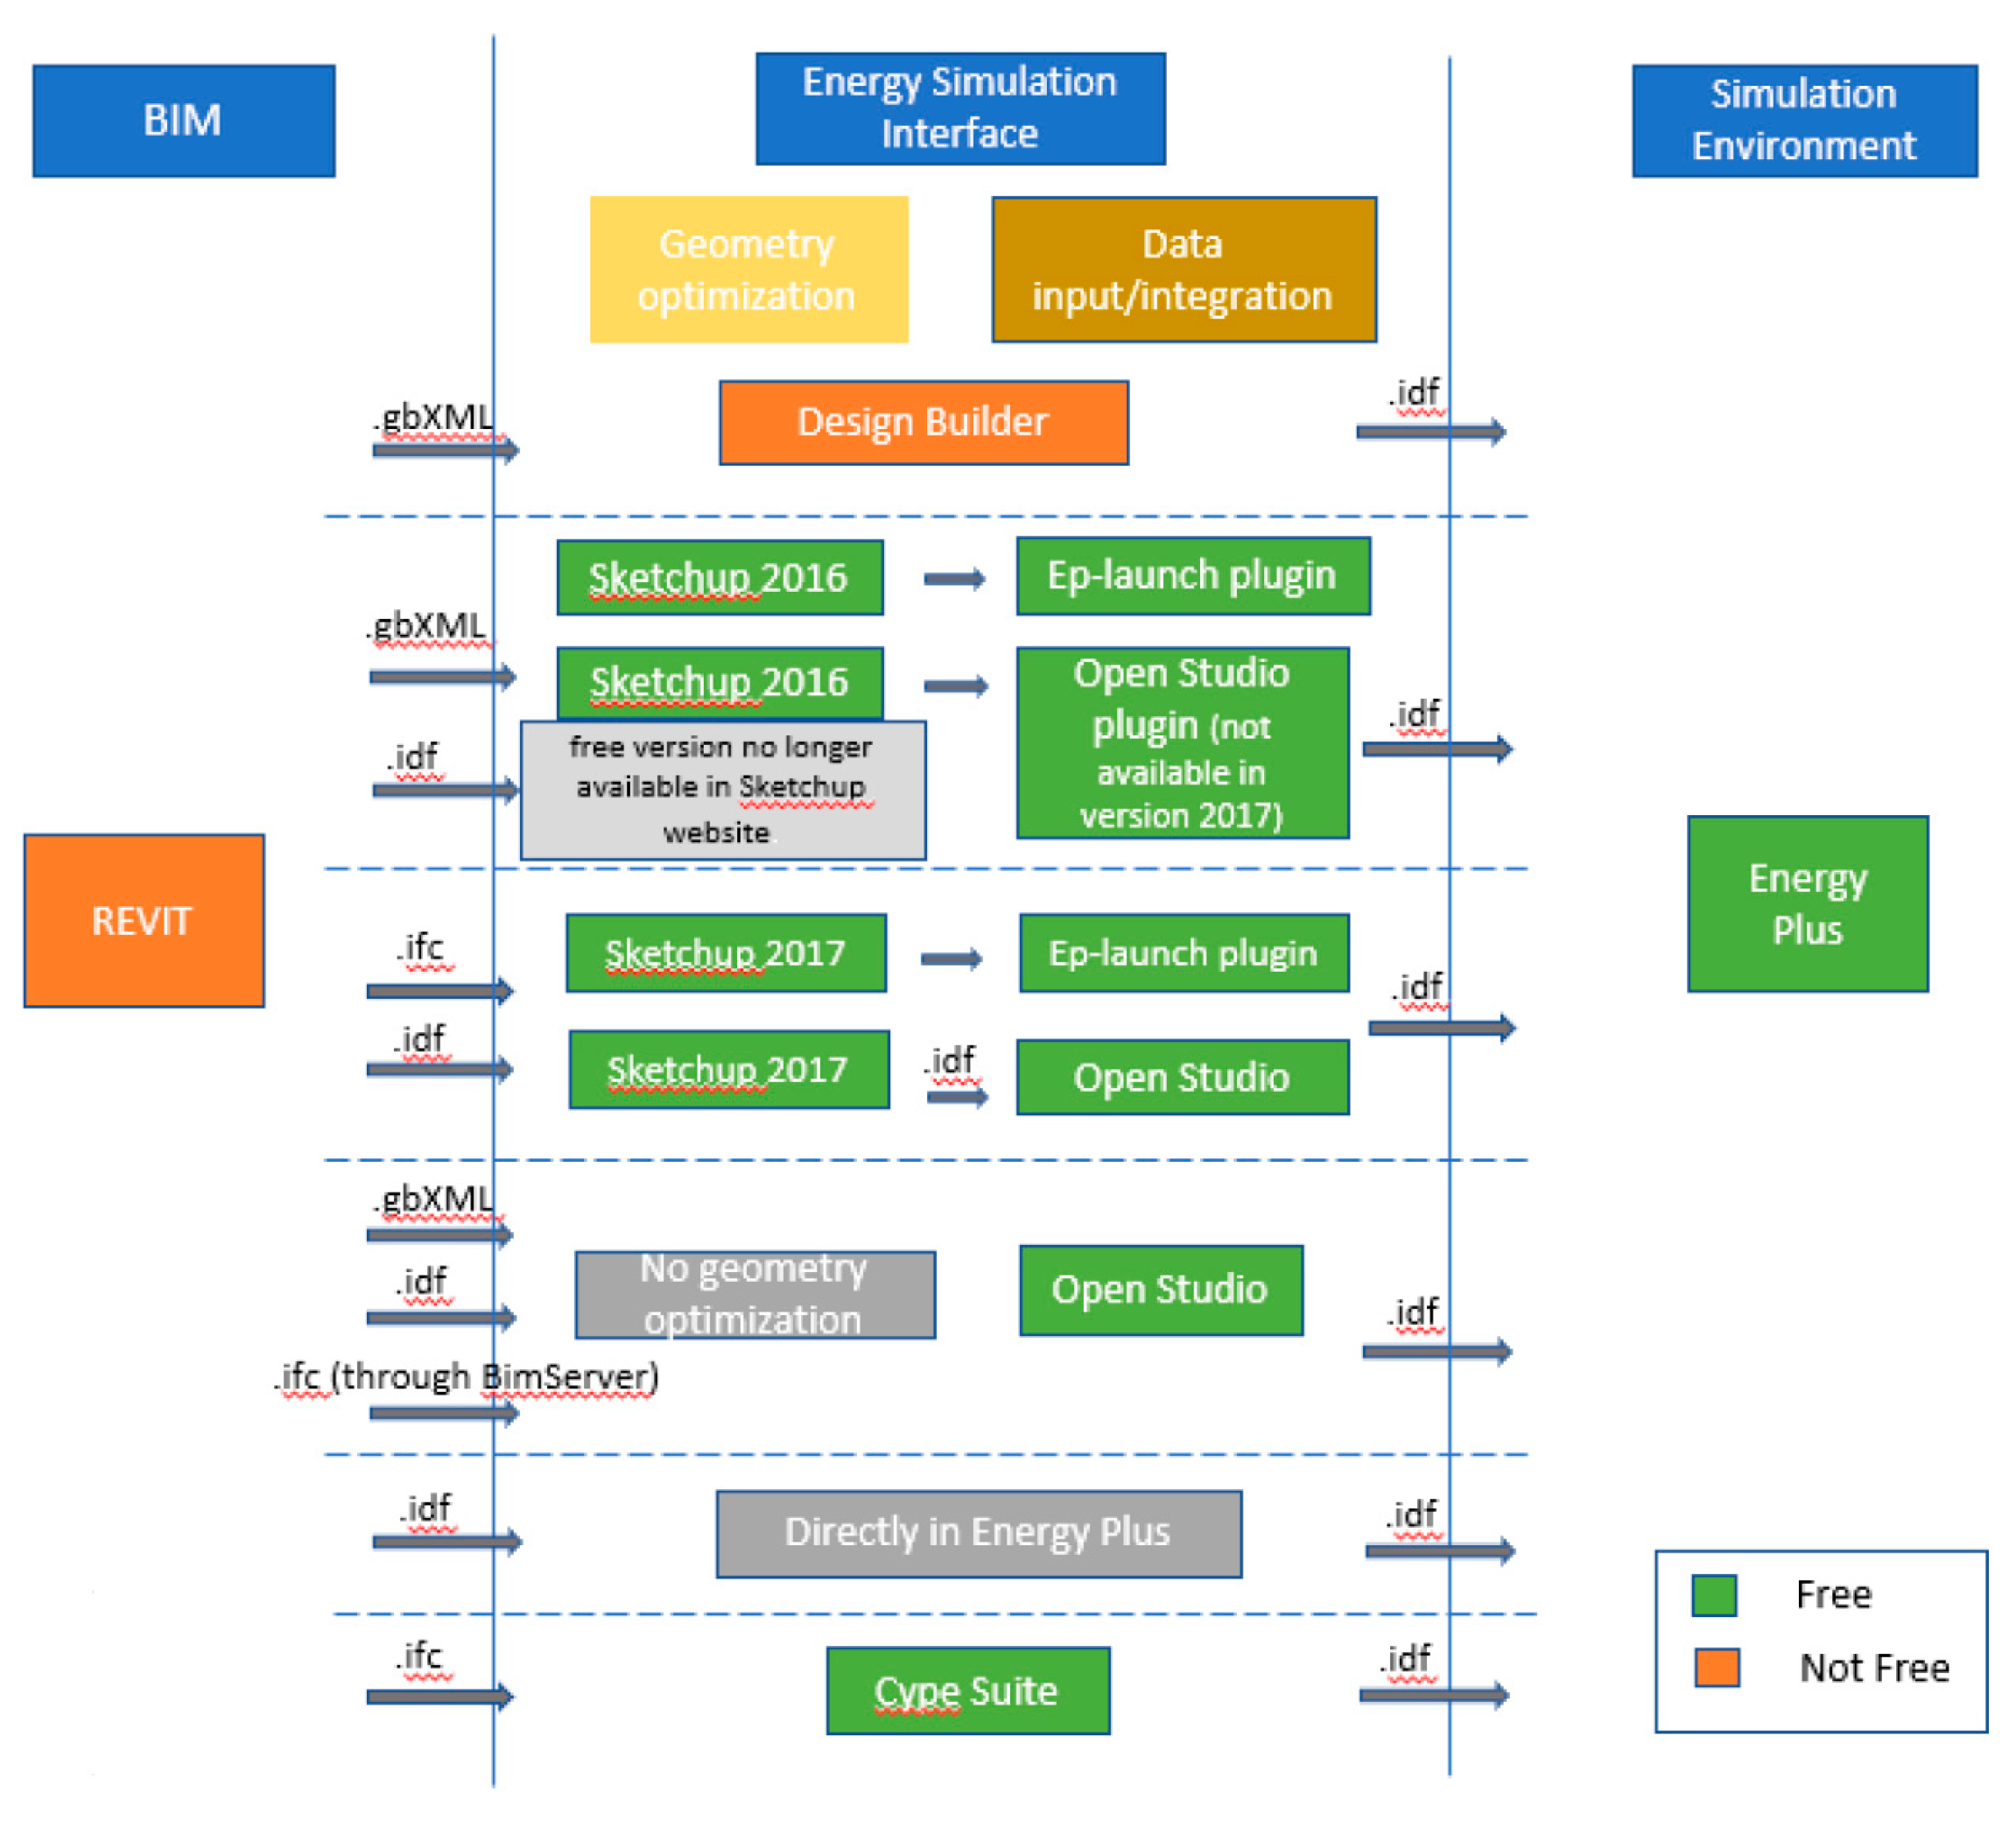
- Freeware approach: license is not required, contents are freely accessible;
- Not freeware approach: a license is needed to use the software; a free trial version might be available [13].
2.4. Renovation process methodology
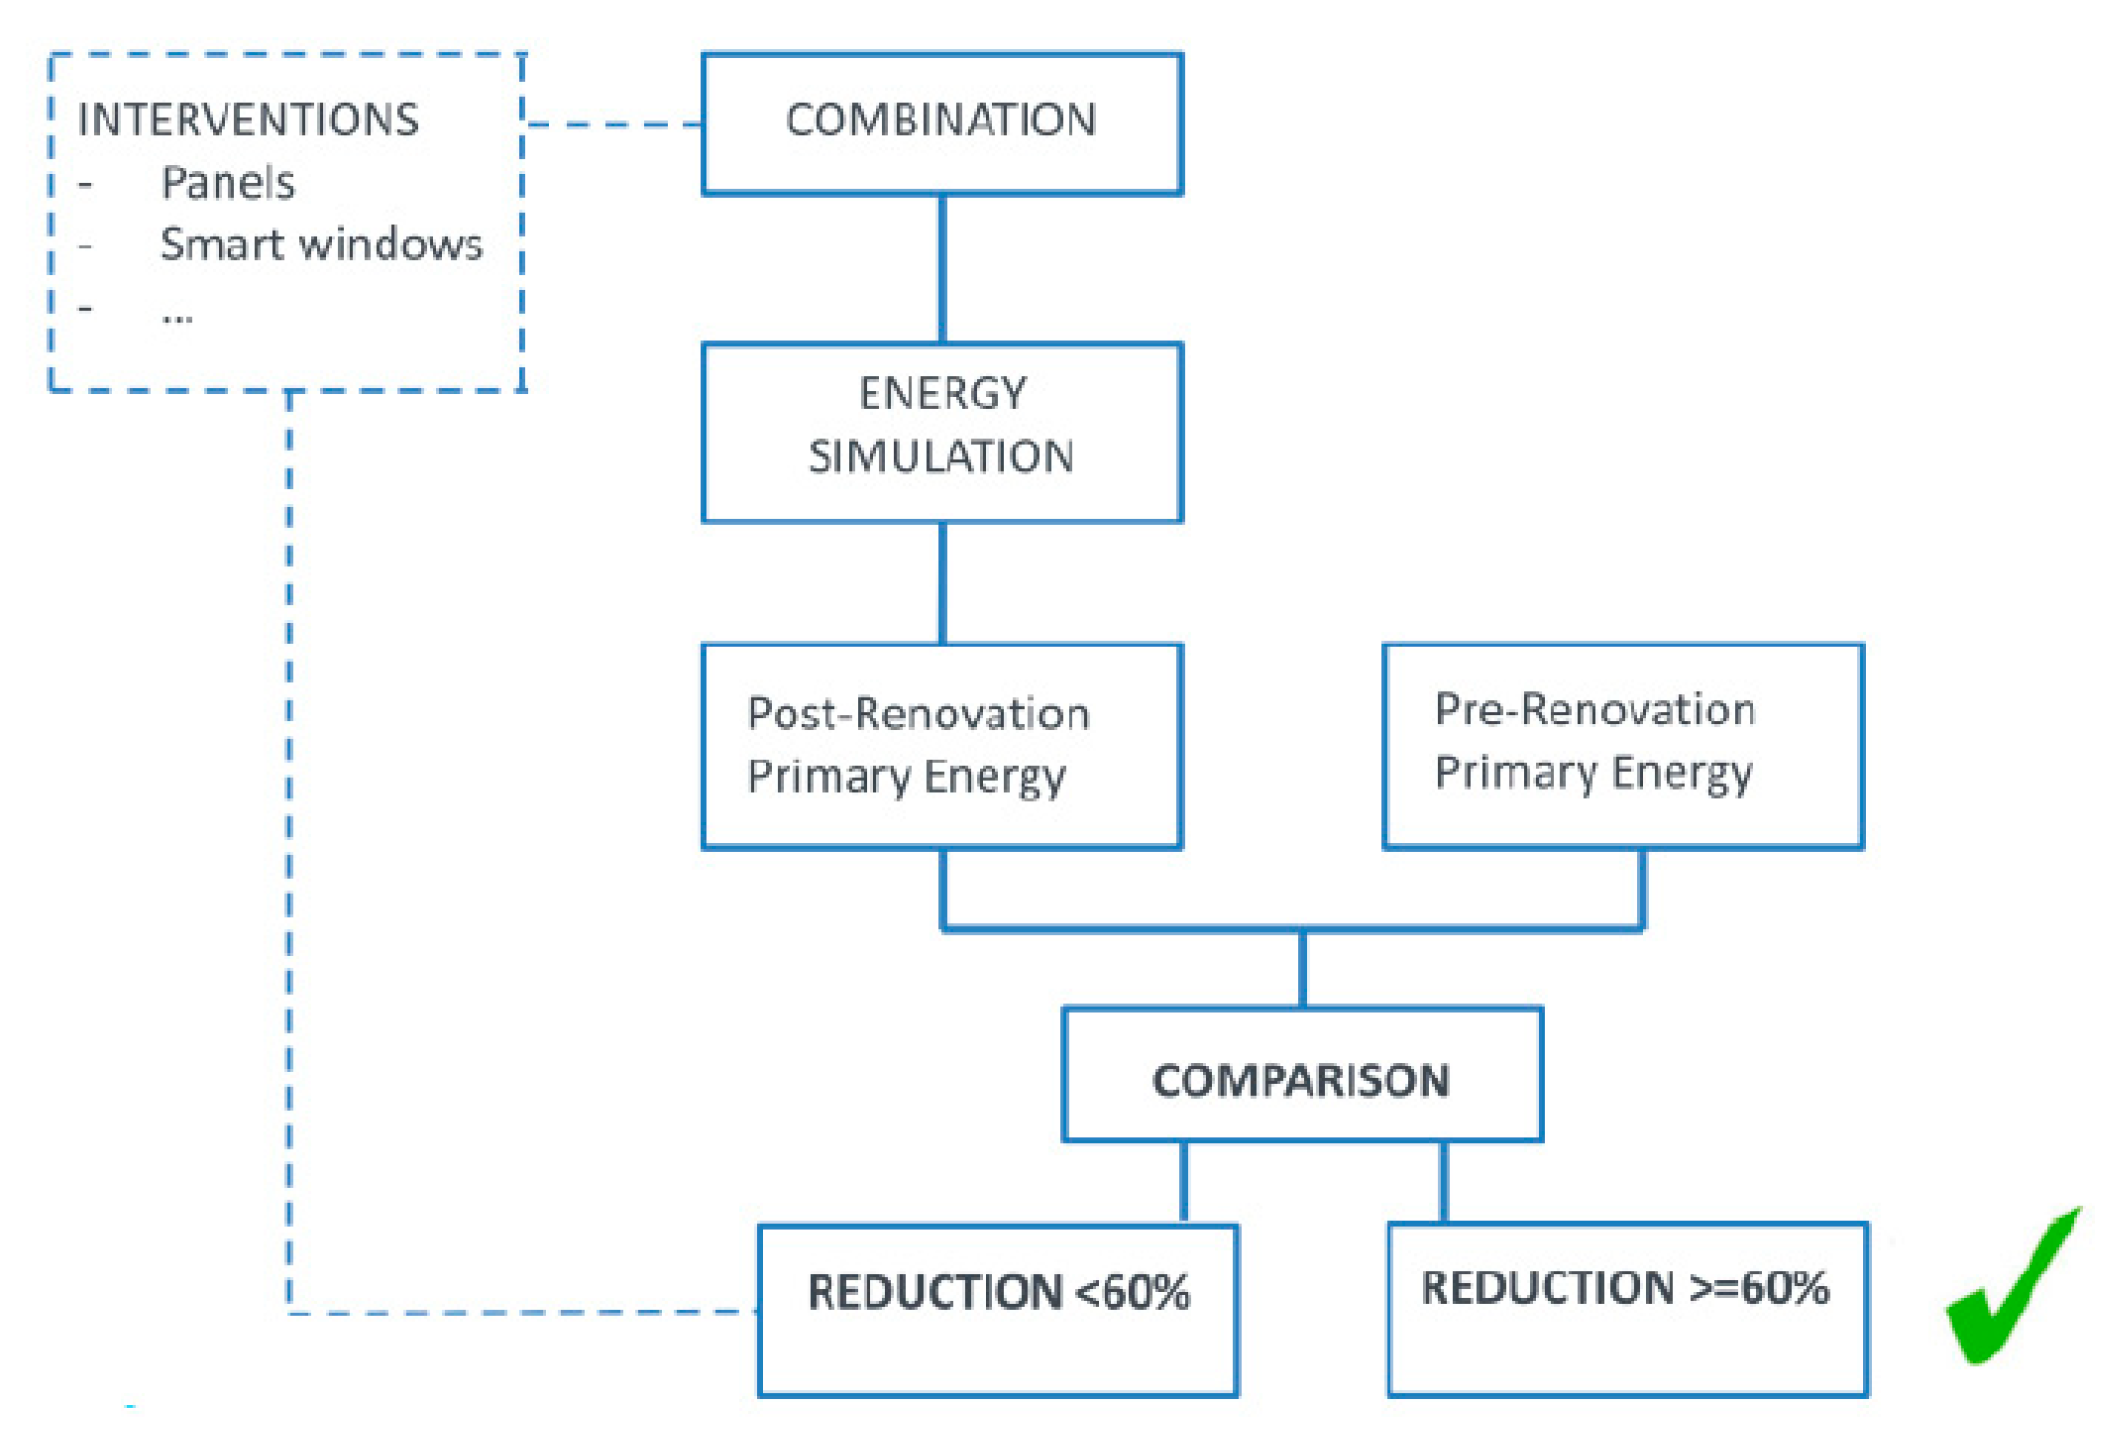
3. Results. Effectiveness of the retrofit interventions
3.1. Pre-renovation scenario
- Geometrical data: plans, components stratigraphy;
- Existing documents that have been considered as reference for the baseline;
- Energy audit;
- Energy use of the buildings in the past years;
- Existing energy models.
- Energy and indoor environmental data:
- Transmittance of components;
- Usage time pattern and indoor operating temperature:
- Details of existing systems: HVAC, lighting, power, others.
3.3. Energy simulation and validation results
4. Discussion
5. Conclusions
6. Patents
Funding
Acknowledgments
Conflicts of Interest
Nomenclature
| BIM | Building Information Model |
| BEM | Building Energy Model |
| CHP | Combined heat power generation |
| COPCC | COP of the compression chiller |
| HVAC | Heating Ventilation Air Conditioning |
| IEQ | Indoor Environment Quality |
| MEP | Mechanical Electrical Plumbing |
| PnP | Plug and Play |
| Qp | Primary energy requirements for buildings |
| Qt | Thermal energy requirements for buildings |
| Qpcool | Primary energy requirements for cooling |
| Qtcool | Thermal energy requirements for cooling |
| Qpea | Primary energy requirements for electricity requirements (Grid connected) |
| Qhea | Building electricity requirements (grid connected) |
| QPEβ | Primary energy requirements for electricity requirements (CHP) |
| QEβ | Building electricity requirements (CHP) |
| αg | Exergy allocation coefficient of CHP systems (same procedure of district heating |
| Ƞca | Thermal efficiency of the gas-fired boilers providing heating to household |
| Ƞel-n | Average national efficiency associated to the production of electric energy (country specific) |
References
- IBallarini, V. Corrado, Application of energy rating methods to the existingbuilding stock: analysis of some residential buildings in Turin, Energy Build. 41(2009) 790–800.
- Belpoliti V., Bizzarri G. , A parametric method to assess the energy performance of the social housing stock and simulate suitable retrofit scenarios: An Italian case study, Energy and Buildings 96 (2015) 261–271. [CrossRef]
- Bizzarri G. , On energy requirements and potential energy savings in Italian hospital buildings, Fourth International Conference on Urban Regeneration and Sustainability -The sustainable city 2006, Tallin, Estonia, 17-19 July 2006, Conference Proceedings “The sustainable city 2006”, WITT PRESS, Southampton, Boston.
- Elbeltagi E., Wefki H., Abdrabou S., Dawood M., Ramzy A.: "Visualized strategy for predicting buildings energy consumption during early design stage using parametric analysis" J. Build. Eng., 13 (2017), pp. 127-136.
- Eui-Jong Kim,Gilles Plessis,Jean-Luc Hubert,Jean-Jacques Roux, Urban energy simulation: Simplification and reduction of building envelope models, Energy and Buildings, Volume 84, December 2014, Pages 193-202.
- Fabbri K., Planning a Regional Energy System in Association with the creationof Energy Performance Certificates (EPCs). Statistical analysis and energy effi-ciency measures: an Italian case study, Buildings 3 (2013) 545–569.
- Farzaneh A., Carriere J., Forgues D., Monfet D. "Framework for using building information modeling to create a building energy model" Journal of Architectural Engeneering , 24 (2) (2018), pp. 1-13.
- Fracastoro G.V., Serraino M., A methodology for assessing the energy perfor-mance of large scale building stocks and possible applications, Energy Build. 43(2011) 844–852.[6] M. Kavgic, A. Mavrogianni.
- Hens H, Verbeeck G, Verdonck B. Impact of energy efficiency measures on the CO2 emissions in the residential sector, a large scale analysis. Energy and Buildings 2001;33:275–81. [CrossRef]
- Hong T., Kim J., Jeong J., Lee M., Ji C. "Automatic calibration model of a building energy simulation using optimization algorithm" Energy Procedia, 105 (2017), pp. 3698-3704.
- Jafari A., Valentin V., An optimization framework for building energy retrofits decision-making, Building Environment, 115 (2017), pp. 118-129. [CrossRef]
- Kavgic M., Mavrogianni A., Mumovic D., Summerfield A.,. Stevanovic Z, Djurovic-Petrovic M., A review of bottom-up building stock models for energy consumption in the residential sector, Building and Environment 45 (2010) 1683–1697.
- Lara R.A., Naboni E., Pernigotto G., Cappelletti F., Zhang Y., Barzon F., et al. "Optimization tools for building energy model calibration" Energy Procedia, 111 (2017), pp. 1060-1069.
- DIRECTIVE 2010/31/EU OF THE EUROPEAN PARLIAMENT AND OF THE COUNCIL of 19 May 2010 on the energy performance of buildings.
- Standard UNI TS 11300. Part 1: Energy Performance of Buildings – Part 1: Cal-culation of Energy Use for Space Heating and Cooling; UNI TS 11300. Part 2:Energy Performance of Buildings – Part 2: Calculation of Energy Primary andEnergy Performance for Heating Plant and Domestic Hot Water Production.Available http://11300.cti2000.it/ (accessed 09.02.15).
- Italian Decree 26 06 2015 on energy performance of buildings, “Minimum requirements for energy efficiency!
| GEO-CLUSTER | ||||
|---|---|---|---|---|
| Nordic EU | Mediterranean EU | Central EU | West EU | |
| n. Case Studies | 1 | 4 | 2 | 5 |
| Countries | Denmark | Italy | Poland | Germany, The Netherland |
| Buildings typology | residential | n.2 Residential, n.1 office, n.1 educational | Educational | n.1 Office, n.4 educational |
| PRE-RENOVATION | |||||||||||||||
|---|---|---|---|---|---|---|---|---|---|---|---|---|---|---|---|
| Country and location | Energy Assessment - Primary energy consumption | Geometric data and modelling | Energy and Indoor environmental data | energy consumption | |||||||||||
| reference of baseline | BIM-to-BEM | transmittance | indoor usage | systems | kWh/m2y | ||||||||||
| bills | energy audit | energy model | Completed | Validated | envelope | interior | indoor operating temperature | time pattern | HVAC | lighting | power | other | |||
| DE | Menden | N | Y | N | Y | Y | Y | N | Y | Y | Y | Y | Y | N | 255 |
| DK | Korsløkken | N | Y | N | N | N | N | N | N | N | N | N | N | N | 231 |
| IT | Ancona | Y | Y | Y | Y | Y | Y | Y | N | N | Y | Y | Y | N | 85.8 |
| IT | Firenze | N | Y | N | Y | Y | Y | N | Y | N | N | N | N | N | 366.3 |
| IT | Genoa | Y | N | Y | Y | Y | Y | Y | Y | Y | Y | Y | Y | N | 161 |
| IT | Reggio E. | N | Y | Y | Y | Y | Y | N | Y | Y | N | Y | Y | N | 117 |
| NL | Enschede | Y | Y | N | Y | Y | Y | Y | Y | Y | Y | Y | Y | N | 300 |
| NL | Lekkerkerk | Y | Y | Y | Y | Y | Y | Y | N | N | N | N | N | N | 211 |
| NL | Tilburg | Y | Y | N | Y | Y | Y | Y | Y | Y | Y | Y | Y | N | 428 |
| NL | Utrecht | Y | Y | Y | Y | Y | Y | Y | Y | N | N | Y | Y | N | 128 |
| PL | Gdynia | Y | Y | Y | Y | Y | Y | Y | Y | Y | Y | Y | Y | N | 120.5 |
| PL | Warsaw | Y | Y | Y | Y | Y | Y | Y | Y | Y | N | Y | Y | N | 137.3 |
| Proposed Solutions | Technical innovations | |
|---|---|---|
| Innovative P2ENDURE architectural components | Multifunctional panel for façades | Lightweight Textile Reinforced Concrete in the external and internal layer with insulation core made of expandable polystyrene. |
| Smart windows | Windows that can be rotated by 180° that keep out heat in summer and retain warmth in winter. | |
| Rooftop retrofit modules | Rooftop retrofit solutions and process models | |
| PnP smart connectors | Smart connectors for mechanical, hydraulic, electrical, air and ICT joints | |
| Innovative P2ENDURE technical systems | PnP HVAC systems | A complete PnP MEP/HVAC engine for deep renovation. This solution includes air- heat pump, storage capacity for domestic hot water (DHW), mechanical ventilation system, expansion barrel, and control systems. |
| IEQ control systems | Real-time monitoring of indoor thermal comfort based on a microcontroller and a set of sensors and embedded algorithms. | |
| Connection to energy grid and RES production | Building as active component of the district energy grid; Energy needs fulfilled by a renewable energy plant. | |
| Geocluster: West EU Building typology: Office Location: Germany, Menden |
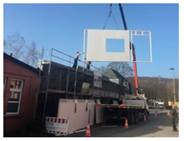 |
Scenarios | Applied technologies | Savings |
| 1 | Façade system | 14% | ||
| 2 | Roof insulation | 28% | ||
| 3 | triple glazing | 8% | ||
| 4 | basement ceiling insulation | 11% | ||
| Final | Façade system, Roof insulation, triple glazing, basement ceiling insulation | 61% | ||
| Geocluster: Nordic EU Building typology: Residential Location: Denmark, Korslokke |
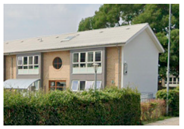 |
Scenarios | Applied technologies | Savings |
| 1 | Façade system and roof insulation | 67% | ||
| 2 | Heat recovery ventilation | 70% | ||
| Final | Façade system, roof insulation, heat recovery ventilation | 39% | ||
| Geocluster: Mediterranean EU Building typology: Residential Location: Italy, Ancona |
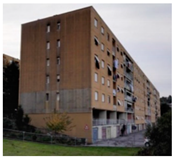 |
Scenarios | Applied technologies | Savings |
| 1 | Smart windows | 30.2% | ||
| 2 | Roof and wall insulation | 22.8% | ||
| 3 | condensing boiler/dwelling | 32.4% | ||
| Final | Smart windows, roof and wall insulation, condensing boiler/dwelling | 68.1% | ||
| Geocluster: Mediterranean EU Building typology: Residential Location: Italy, Florence |
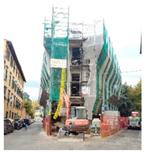 |
Scenarios | Applied technologies | Savings |
| 1 | Roof insulation | 3.2% | ||
| 2 | Wall insulation | 22.9% | ||
| 3 | Smart windows | 14.5% | ||
| Final | Roof and wall insulation, smart windows, condensing boiler | 60.2% | ||
| Geocluster: Mediterranean EU Building typology: Educational Location: Italy, Genoa |
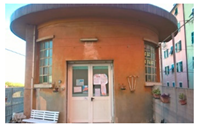 |
Scenarios | Applied technologies | Savings |
| 1 | Smart windows | 21.7% | ||
| 2 | Wall insulation | 26.7% | ||
| 3 | Condensing boiler | 9.5% | ||
| 4 | LED illumination | 12.9% | ||
| Final | Smart windows, wall insulation, condensing boiler, LED illumination | 60.2% | ||
| Geocluster: Mediterranean EU Building typology: Residential Location: Italy, Reggio Emilia |
 |
Scenarios | Applied technologies | Savings |
| 1 | Smart windows | 28% | ||
| 2 | Floor heating | 25% | ||
| 3 | Heat pump | 63% | ||
| Final | Smart windows, floor heating, heat pump | 91% | ||
| Geocluster: West EU Building typology: Residential Location: The Netherland, Enschede |
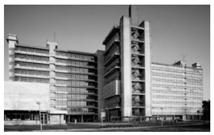 |
Scenarios | Applied technologies | Savings |
| 1 | Insulation, district heating (phase 1) | 50% | ||
| Final | Insulation, district heating (phase 2) | 62% | ||
| Geocluster: West EU Building typology: Residential Location: The Netherland, Lekkerkerk |
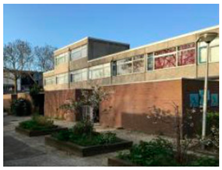 |
Scenarios | Applied technologies | Savings |
| 1 | Façade system, roof insulation | 52% | ||
| Final | Façade system, roof insulation | 46% | ||
| Geocluster: West EU Building typology: Residential Location: The Netherland, Tilburg |
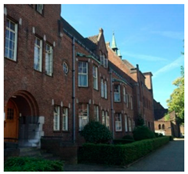 |
Scenarios | Applied technologies | Savings |
| 1 | Triple glazing | 9% | ||
| 2 | Insulation | 26% | ||
| 3 | Heat-pump and ventilation | 44% | ||
| 4 | Sanitary units with shower heat | 4% | ||
| 5 | Solar panels | 7% | ||
| Final | Triple glazing, insulation, heath-pump and ventilation, sanitary units with shower heat, solar panels | 71% | ||
| Geocluster: West EU Building typology: Residential Location: The Netherland, Utrecht |
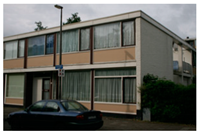 |
Scenarios | Applied technologies | Savings |
| 1 | Façade system and roof insulation | 42% | ||
| 2 | HVAC heat-pump and heat recovery ventilation | 76% | ||
| Final | Façade system, roof insulation, HVAC heat-pump and heat recovery ventilation | 66% | ||
| Geocluster: Central EU Building typology: Educational Location: Poland, Gdynia |
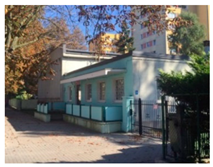 |
Scenarios | Applied technologies | Savings |
| 1 | Façade system | 50% | ||
| 2 | Smart windows | 11% | ||
| 3 | Basement insulation | 23% | ||
| Final | Façade system, smart windows, basement insulation | 67% | ||
| Geocluster: Central EU Building typology: Educational Location: Poland, Warsaw |
 |
Scenarios | Applied technologies | Savings |
| 1 | Façade system | 40% | ||
| Final | Façade system, rooftop extension | 40% |
| PRE RENOVATION | INTERVENTIONS | POST RENOVATION | ||||||||
|---|---|---|---|---|---|---|---|---|---|---|
| Country and location | energy needs | 1st SCEN. | 2nd SCEN. | 3rd SCEN. | 4th SCEN. | 5th SCEN. | FINAL SCENARIO | savings | ||
| kWh/m2y | savings %] | savings %] | savings %] | savings %] | savings [%] | P2ENDURE TECHNOLOGIES | OTHER TECHNOLOGIES | [%] | ||
| DE | Menden | 255 | 14 | 28 | 8 | 11 | - | Fermacell system | Roof insulation, triple glazing, thermal insulation of basement ceiling | 61 |
| DK | Korsløkke | 231 | 67 | 70 | - | - | - | Facade and roof insulation, heat recovery ventilation | 39 | |
| IT | Ancona | 85.8 | 30.2 | 22.8 | 32.4 | - | - | Smart Windows | Roof and exterior insulation system, condensing boiler serving an apartment block | 68.1 |
| IT | Firenze | 366.3 | 3.2 | 22.9 | 14.5 | - | - | PnP Windows | Roof and walls insulation and condensing boiler | 60.2 |
| IT | Genoa | 161 | 21.7 | 26.7 | 9.5 | 12.9 | - | Smart Windows | Internal insulation, condensing boiler, LED lamps | 60.2 |
| IT | Reggio E. | 117 | 28 | 25 | 63 | - | - | PnP Windows | Heat pump and floor heating | 91 |
| NL | Enschede | 300 | 50 | - | - | - | - | Insulation and district heating | 62 | |
| NL | Lekkerkerk | 211 | 52 | - | - | - | - | Cocoonz façade | Roof insulation | 46 |
| NL | Tilburg | 428 | 9 | 26 | 44 | 4 | 7 | Sanitary units, windows, insulation, semi-collective heatpump, solar panels | 71 | |
| NL | Utrecht | 128 | 42 | Beam façade and HVAC-engine | Roof and floor insulation | 76 | ||||
| PL | Gydnia | 120.5 | 50 | 11 | 23 | Multifunctional panels and Smart windows | Basement external walls insulation | 67 | ||
| PL | Warsaw | 137.3 | 40 | - | - | - | - | Multifunctional panels | Rooftop extension | 40 |
Disclaimer/Publisher’s Note: The statements, opinions and data contained in all publications are solely those of the individual author(s) and contributor(s) and not of MDPI and/or the editor(s). MDPI and/or the editor(s) disclaim responsibility for any injury to people or property resulting from any ideas, methods, instructions or products referred to in the content. |
© 2023 by the authors. Licensee MDPI, Basel, Switzerland. This article is an open access article distributed under the terms and conditions of the Creative Commons Attribution (CC BY) license (http://creativecommons.org/licenses/by/4.0/).


