Submitted:
24 May 2023
Posted:
25 May 2023
You are already at the latest version
Abstract
Keywords:
1. Introduction
2. Literature research and overview of simulation software
| Literature | Grid | PV | Electro-lyser | Com-pressor & Storage | Additional components | Amount of H2 produced | Electrolyser size | LCOH [€/kg H2] |
|---|---|---|---|---|---|---|---|---|
| Artuso et al., 2010 [41] | ✓ | ✓ | 840.15 kgyear | 26 kW | 17.71 | |||
| Parra and Patel, 2016 [42] | ✓ | ✓ | ✓ | 1 GW | 2.55 | |||
| Ferrero et al., 2016 [43] | ✓ | ✓ | ✓ | 10 MW | 3.8 | |||
| Yates et al., 2020 [44] | ✓ | ✓ | 1 MW | 2.39 | ||||
| Grimm et al., 2020 [45] | ✓ | ✓ | 10.000 kg/day | 5.14 | ||||
| Gutiérrez-Martín et al., 2020 [46] | ✓ | ✓ | ✓ | Battery storage | 522.8 kg/year | 7.97 kW | 5.89 | |
| Gutiérrez-Martín et al., 2020 [46] | ✓ | ✓ | ✓ | 522.8 kg/year | 10.9 kW | 6.42 | ||
| Nicita et al., 2020 [5] | ✓ | ✓ | ✓ | 12.7 kg/day | 180 kW | 38.59 | ||
| Minutillo et al., 2020 [30] | ✓ | ✓ | ✓ | ✓ | Refrigeration and H2 dispensing unit | 200 kg/day | 472 kW | 9.29 |
3. Methodology
3.1. Model description
3.2. Detail of system components
| WWTP size | Number of inhabitants |
Specific power consumption [kWh/PE*a] |
| Size class 1 | < 1,000 | 75 |
| Size class 2 | 1,001 - 5,000 | 55 |
| Size class 3 | 5,001 - 10,000 | 44 |
| Size class 4 | 10,001 - 100,000 | 35 |
| Size class 5 | > 100,000 | 32 |
- -
- Delivery parameter: 70 MPa @ -40 °C (H70-T40)
- -
- Ambient temperature: 20 °C
- -
- Initial pressure in the vehicle tank: 10 MPa
- -
- Refuelling level to be achieved: 95 %
| Very small | Small | Medium | Large | |
| Numbers of dispensers | 1 | 1 | 2 | 4 |
| Allowed waiting time between two refuelling events in min | 20 | 5 | 5 | 0 |
| Max. number of refuelling events per dispenser and hour | 2.5 | 6 | 6 | 10 |
| Number of refuelling events per day (average/max) | 10/20 | 30/38 | 60/75 | 125/180 |
| Max. dispensed H2 in kg/h | 18 | 33.6 | 67.5 | 224 |
| Dispensed H2 in kg/d (average/max) | 56/80 | 168/212 | 336/420 | 700/1000 |
3.3. Levelized Cost of Hydrogen
4. Results and discussion
| Simulation Scenarios | Grid | PV | Electro-lyser | Com-pressor & Storage | Additional components | Amount of H2 produced | Electrolyser size | LCOH [€/kg H2] | LCOHO2 [€/kg H2] |
||||
|---|---|---|---|---|---|---|---|---|---|---|---|---|---|
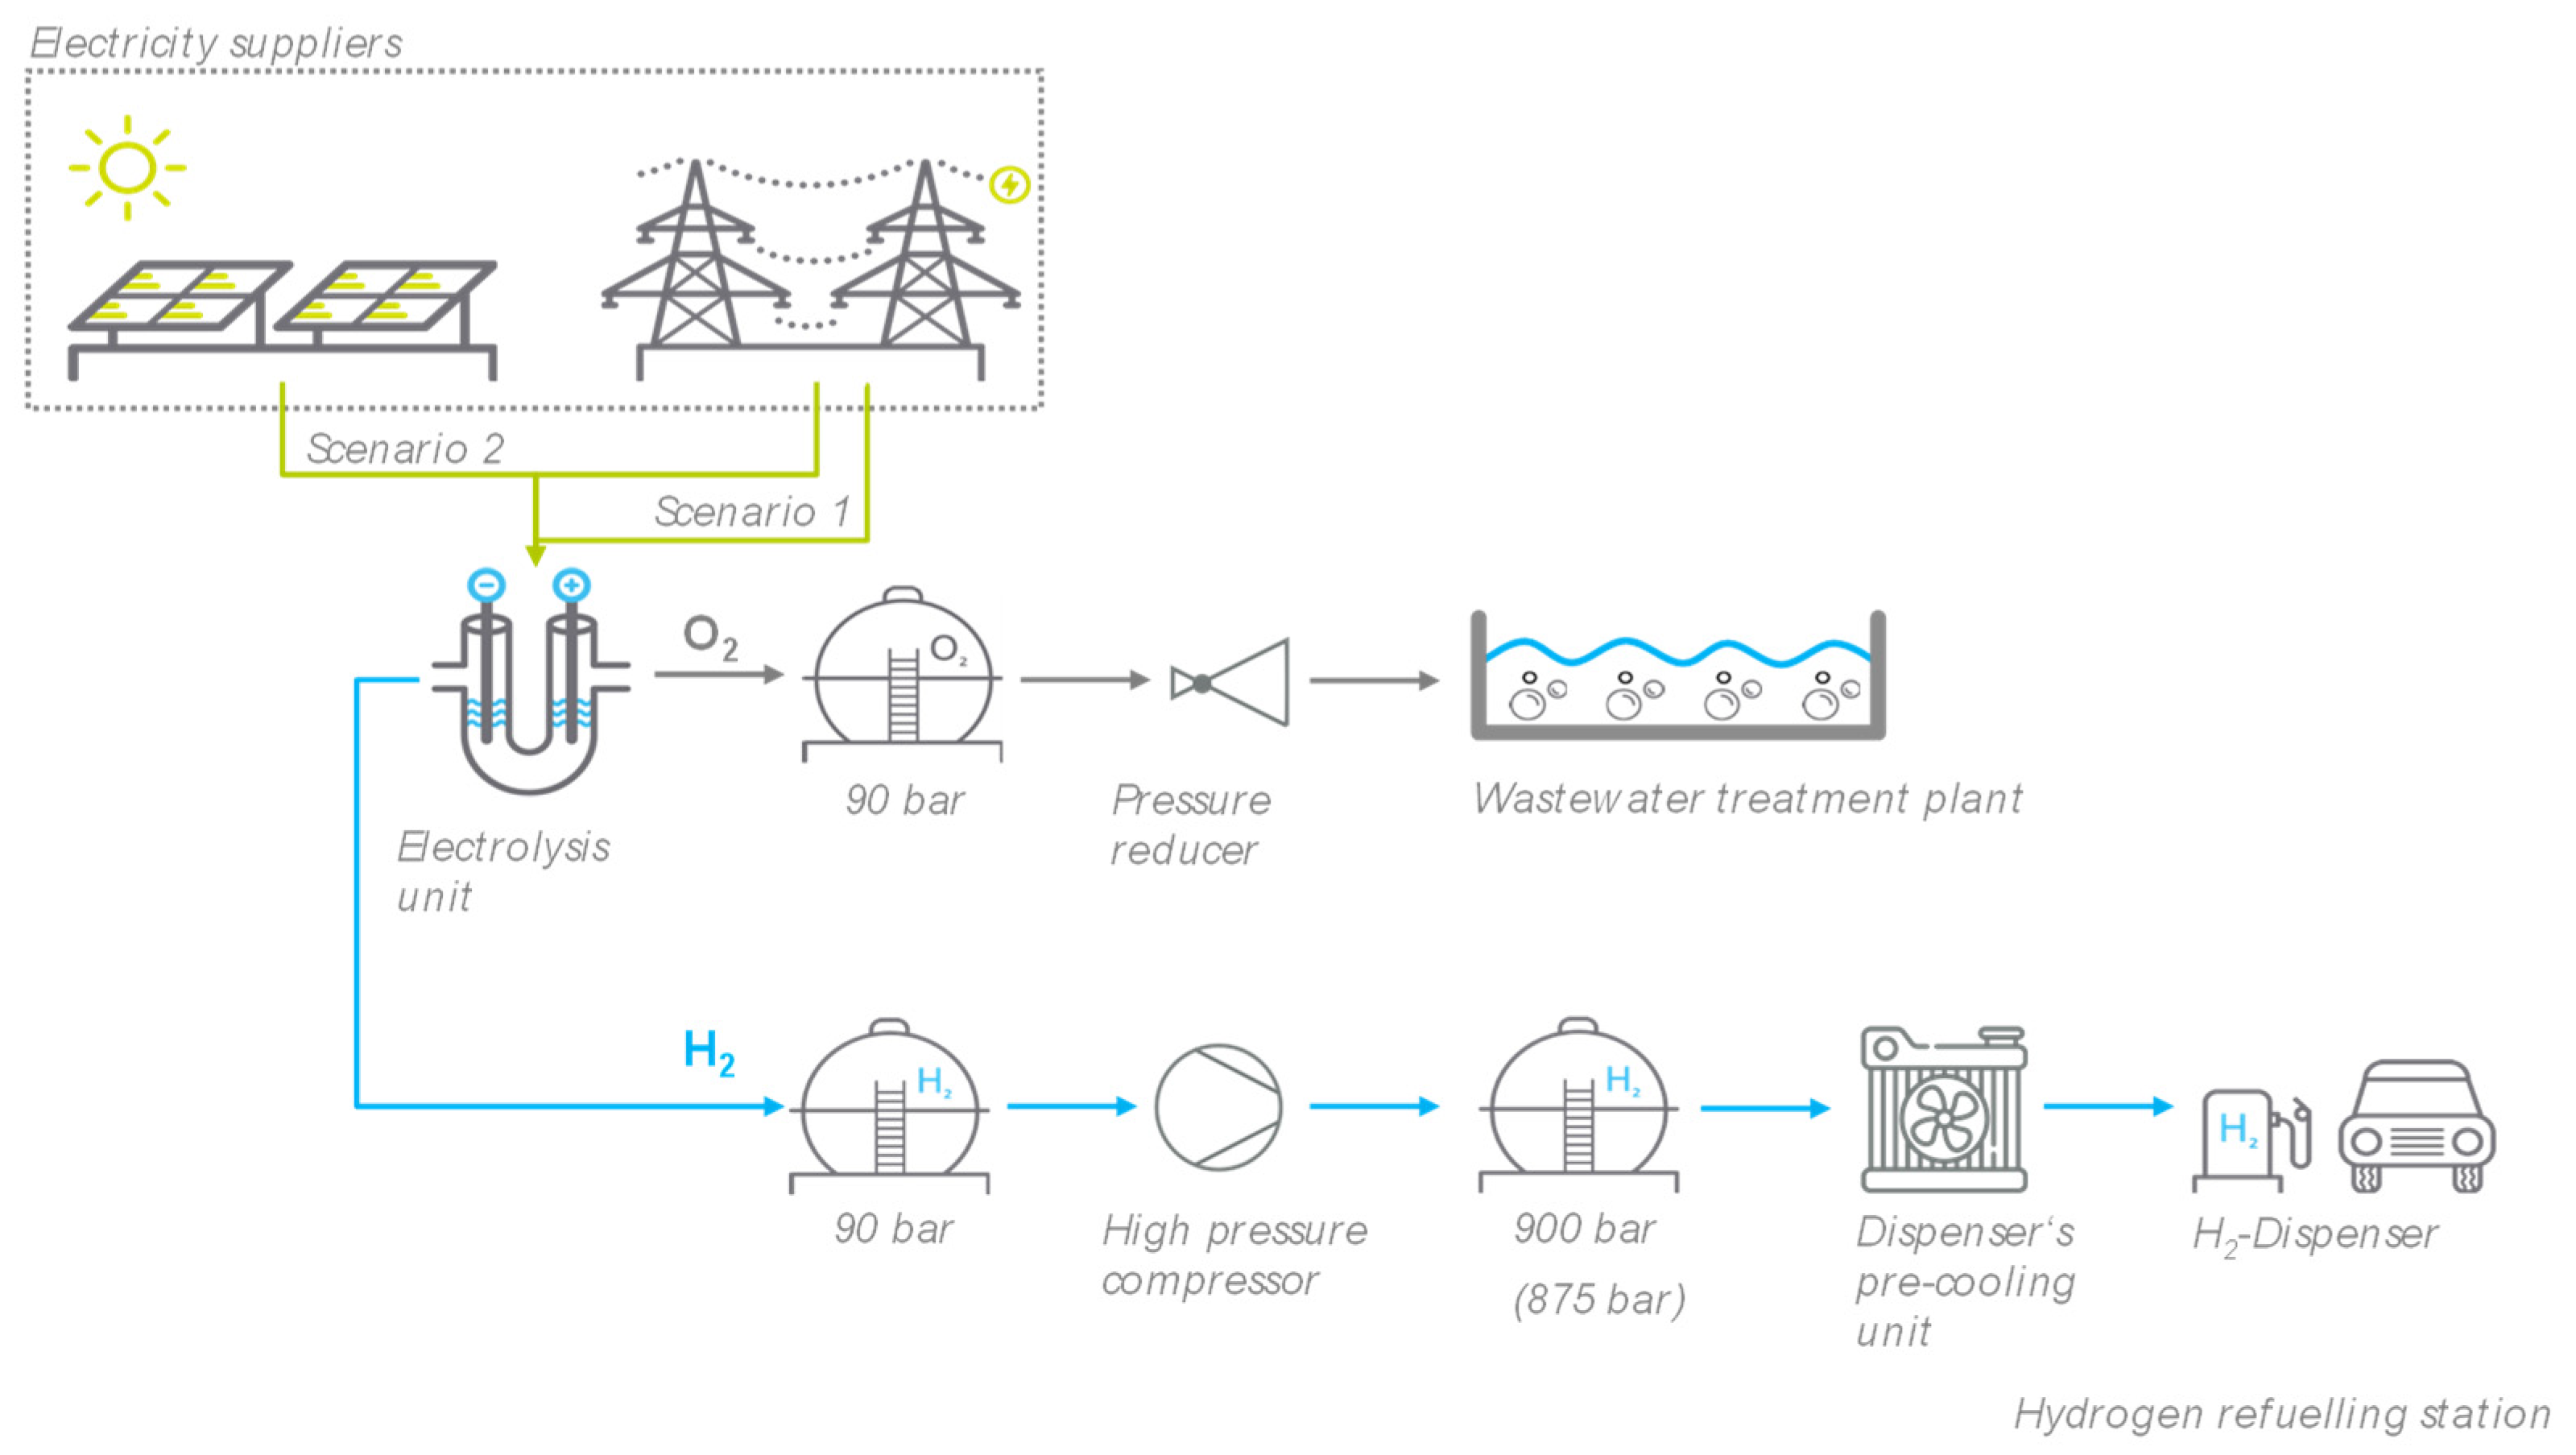
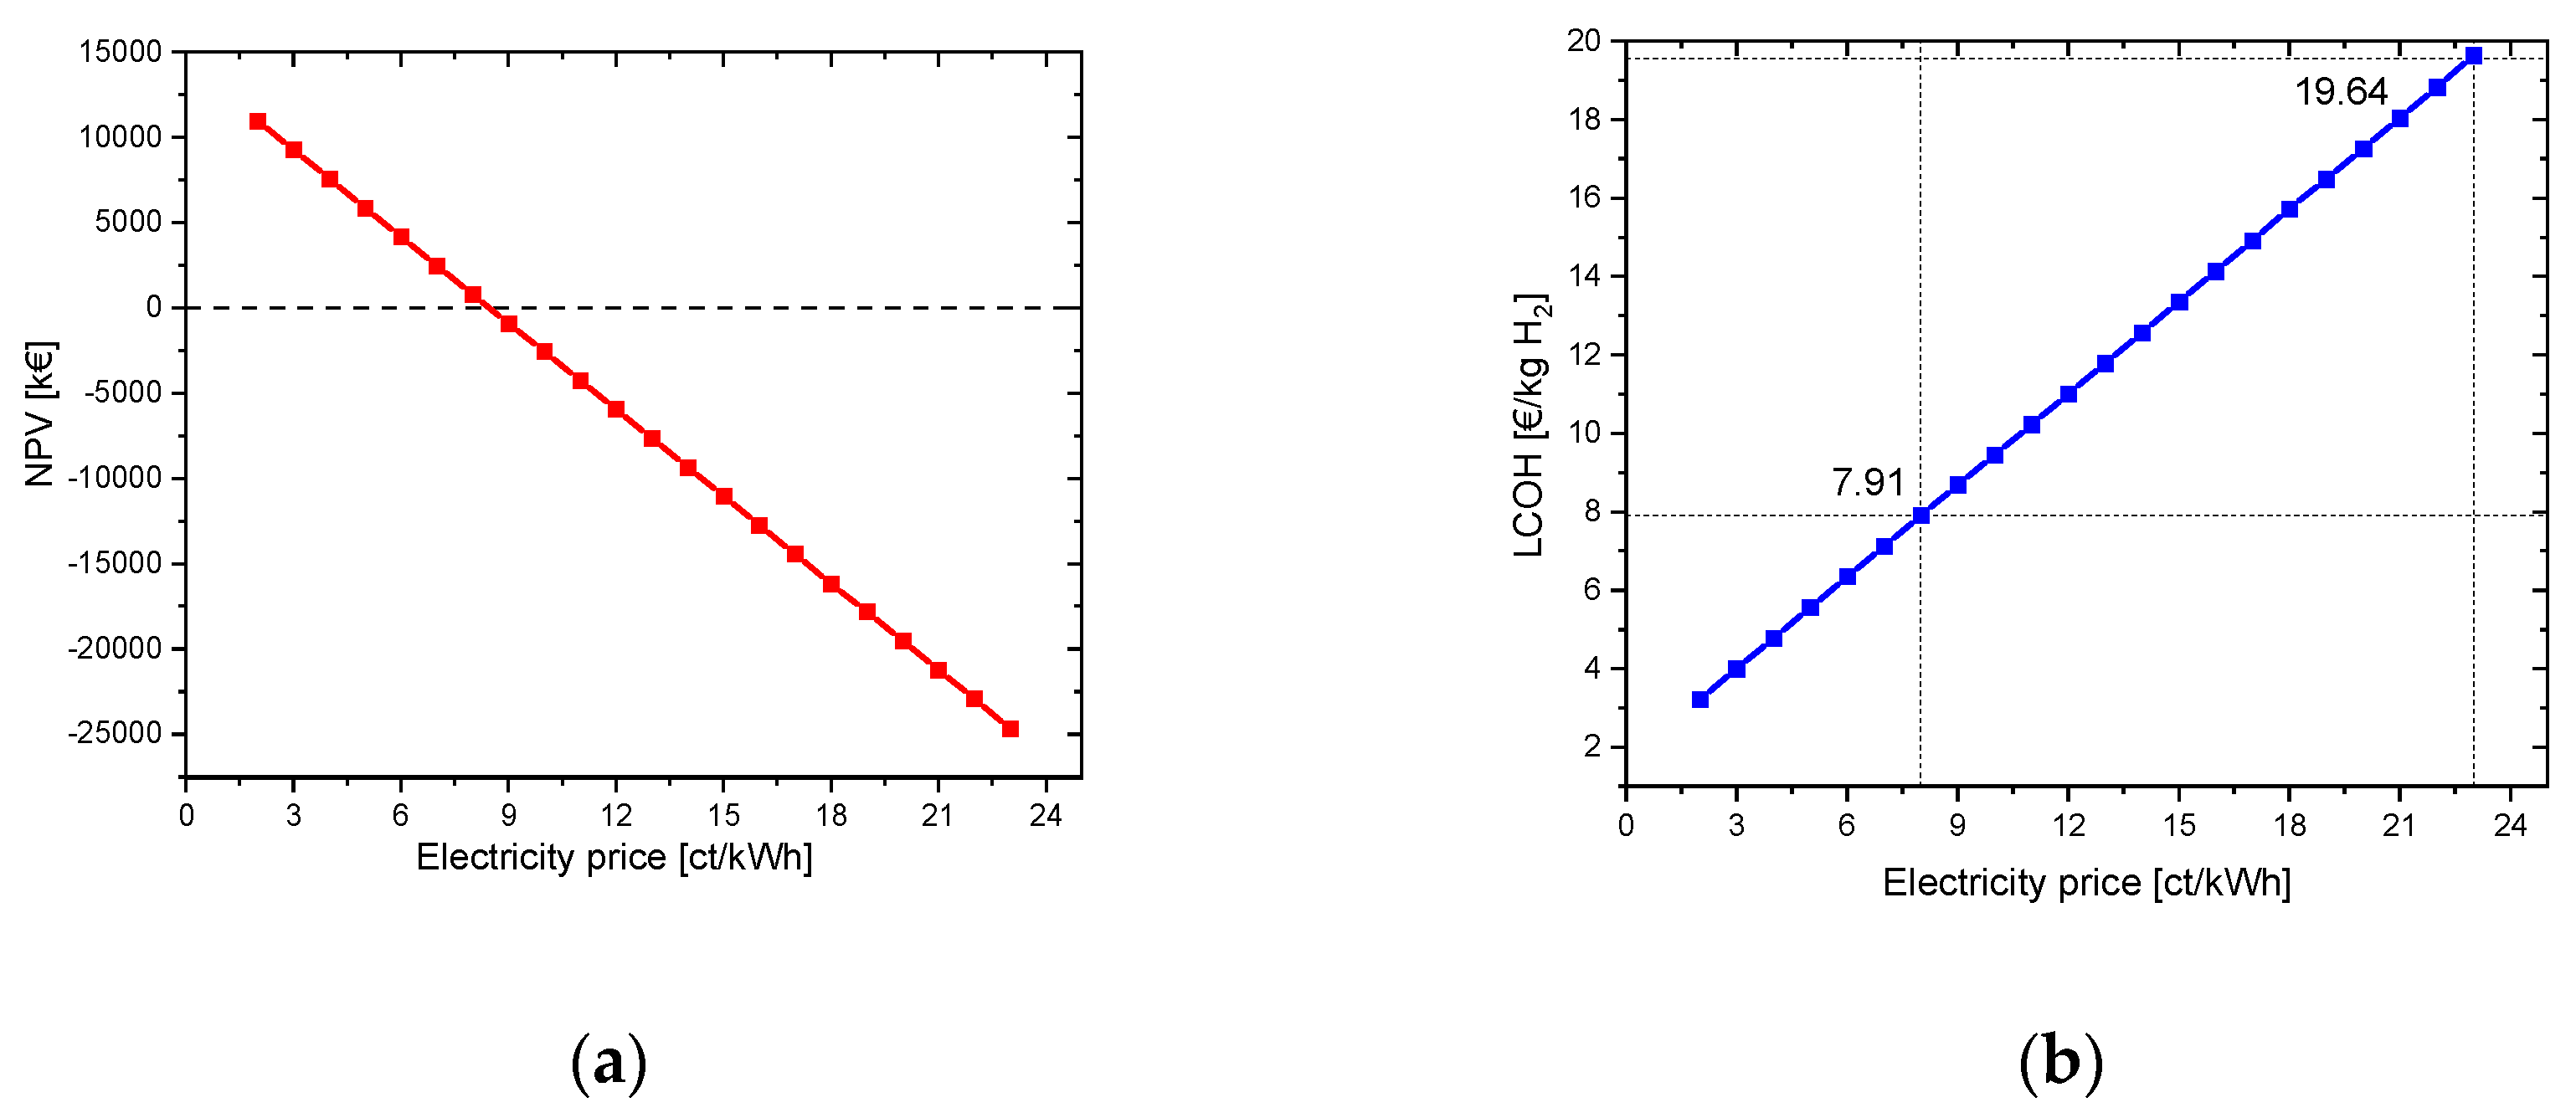
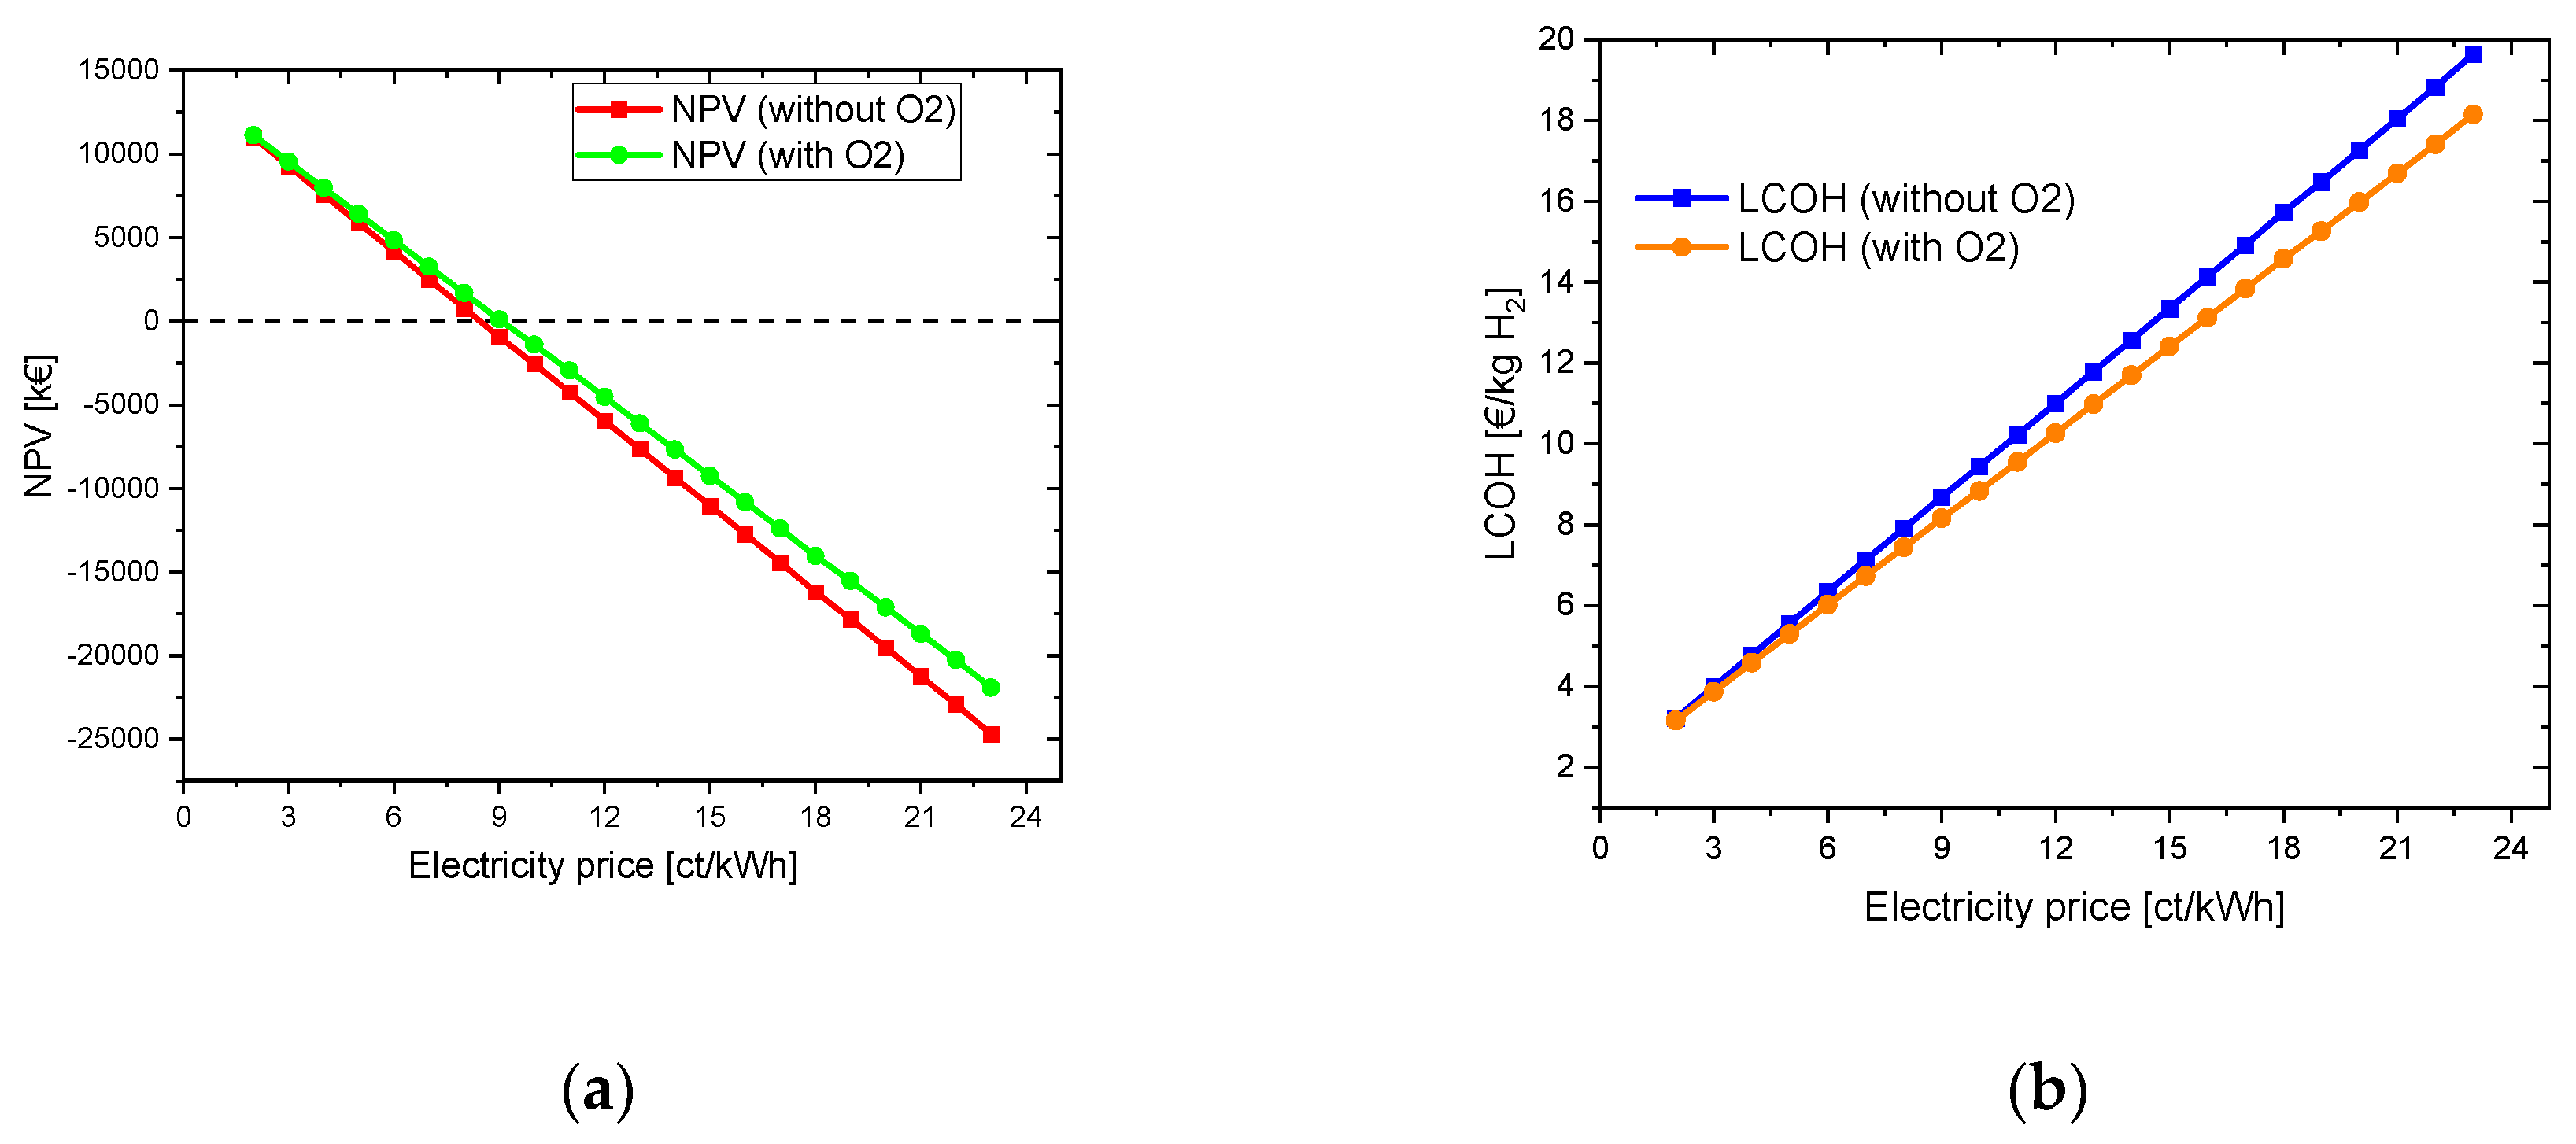
| Scenario 1 | ✓ | ✓ | ✓ | Refrigeration and H2 dispensing unit | 407 kg/day | 1. 125 MW | 7.91 | 7.44 | |||||
| Scenario 2 | ✓ | ✓ | ✓ | ✓ | Refrigeration and H2 dispensing unit | 407 kg/day | 1. 125 MW | 6.75 | 6.28 | ||||
4.1. Simulation with grid power only (Scenario 1)
4.1.1. Electricity price variation
4.1.1.1. Without oxygen use
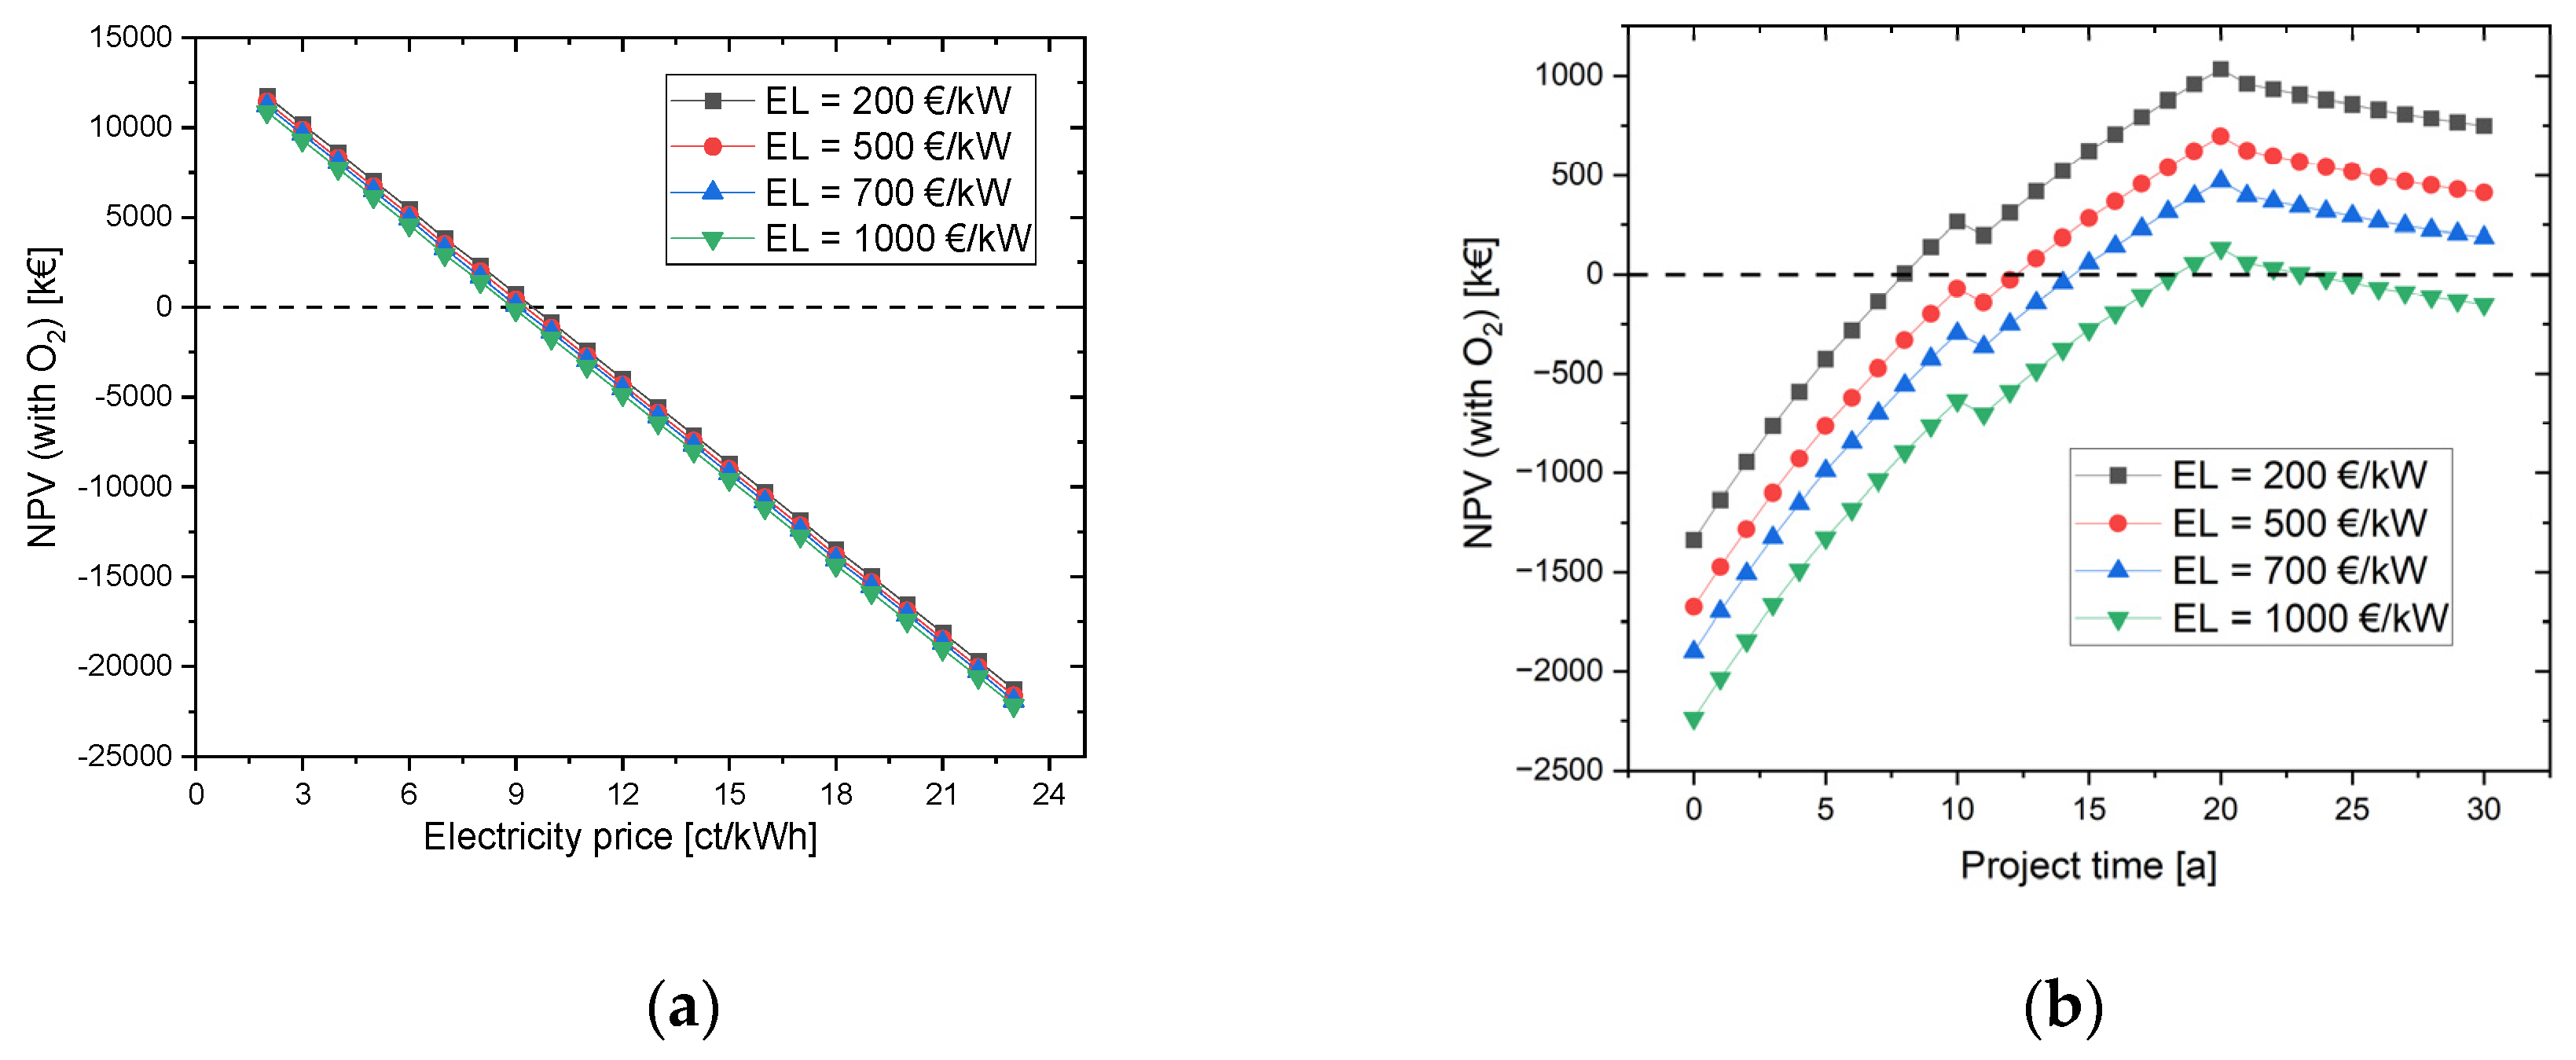
4.1.1.2. With oxygen use
4.1.2. Variation of the CAPEX of electrolyser
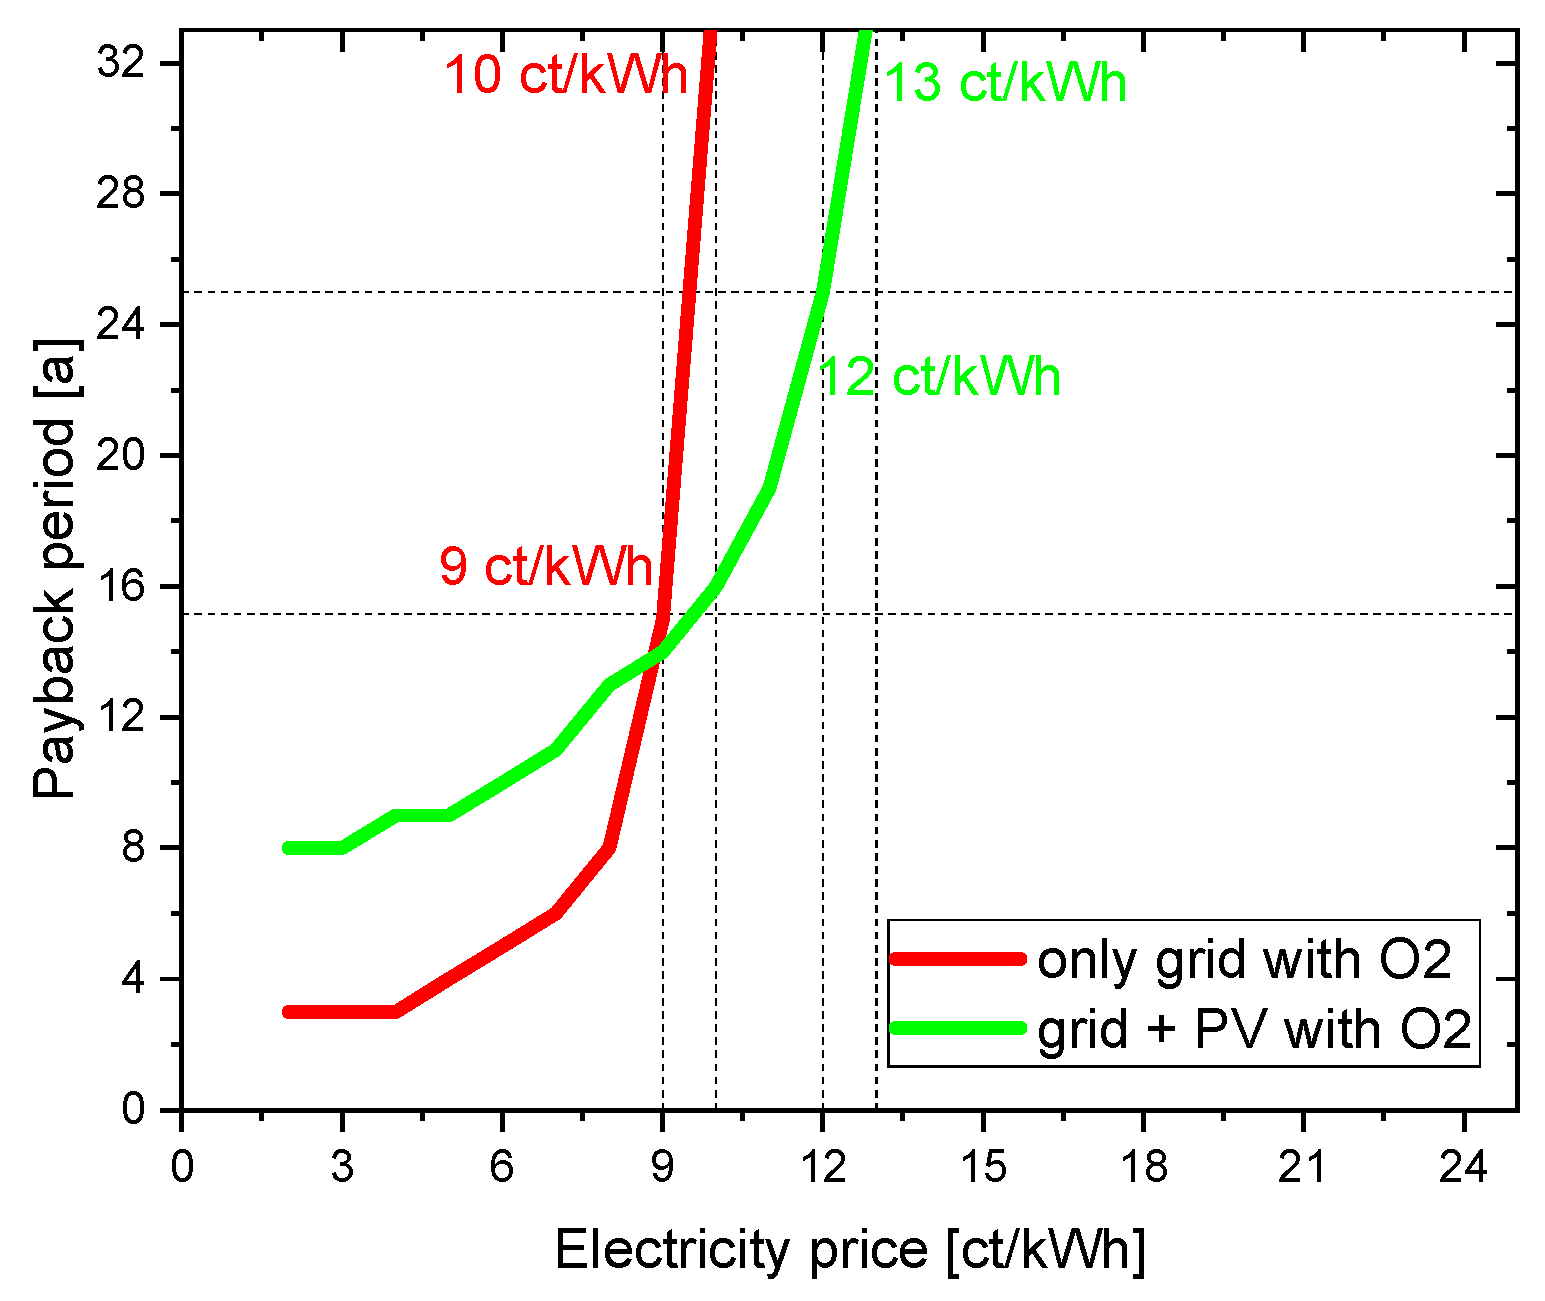
4.2. Simulation with grid and PV power (Scenario 2) with oxygen use
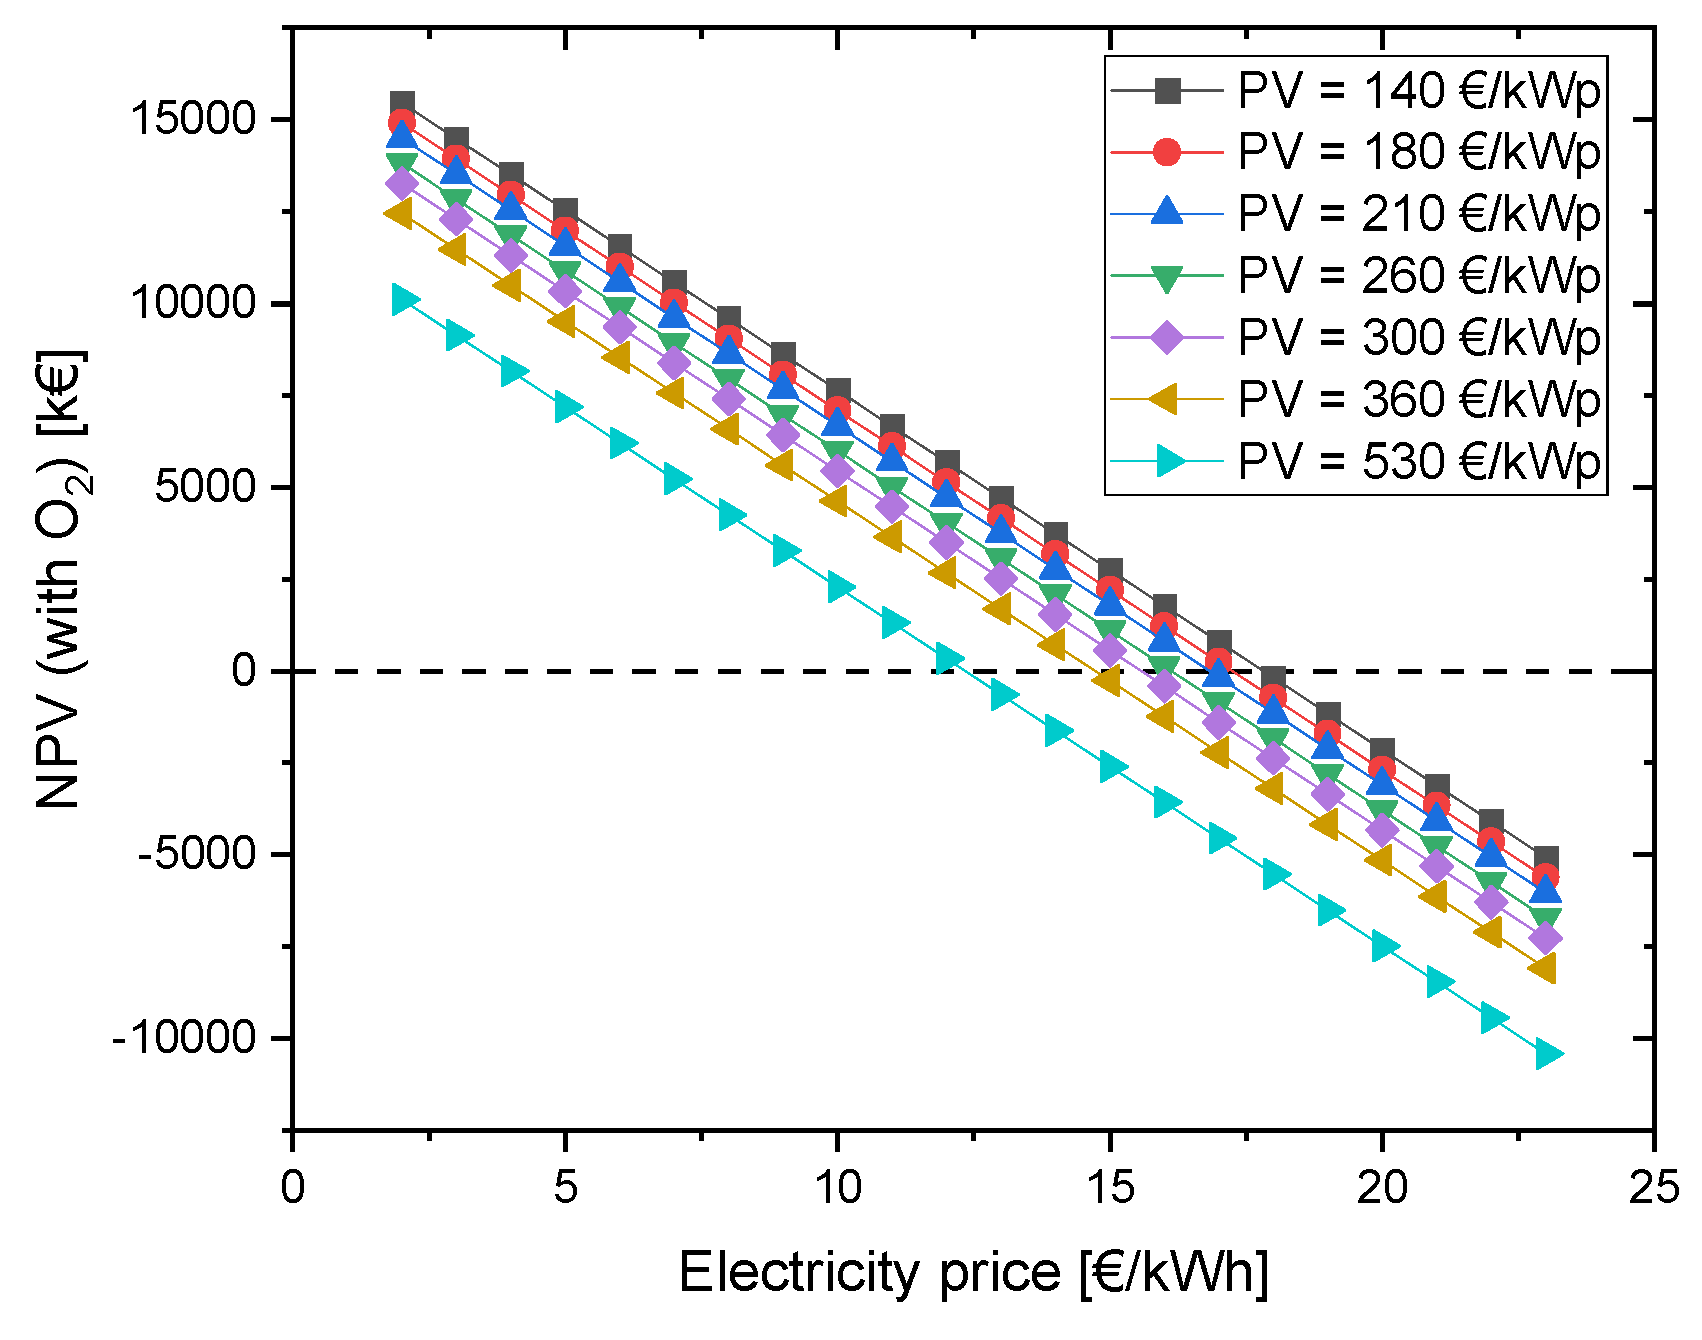
4.2.1. Variation of CAPEX of the PV system
4.2.2. Direct sale of oxygen

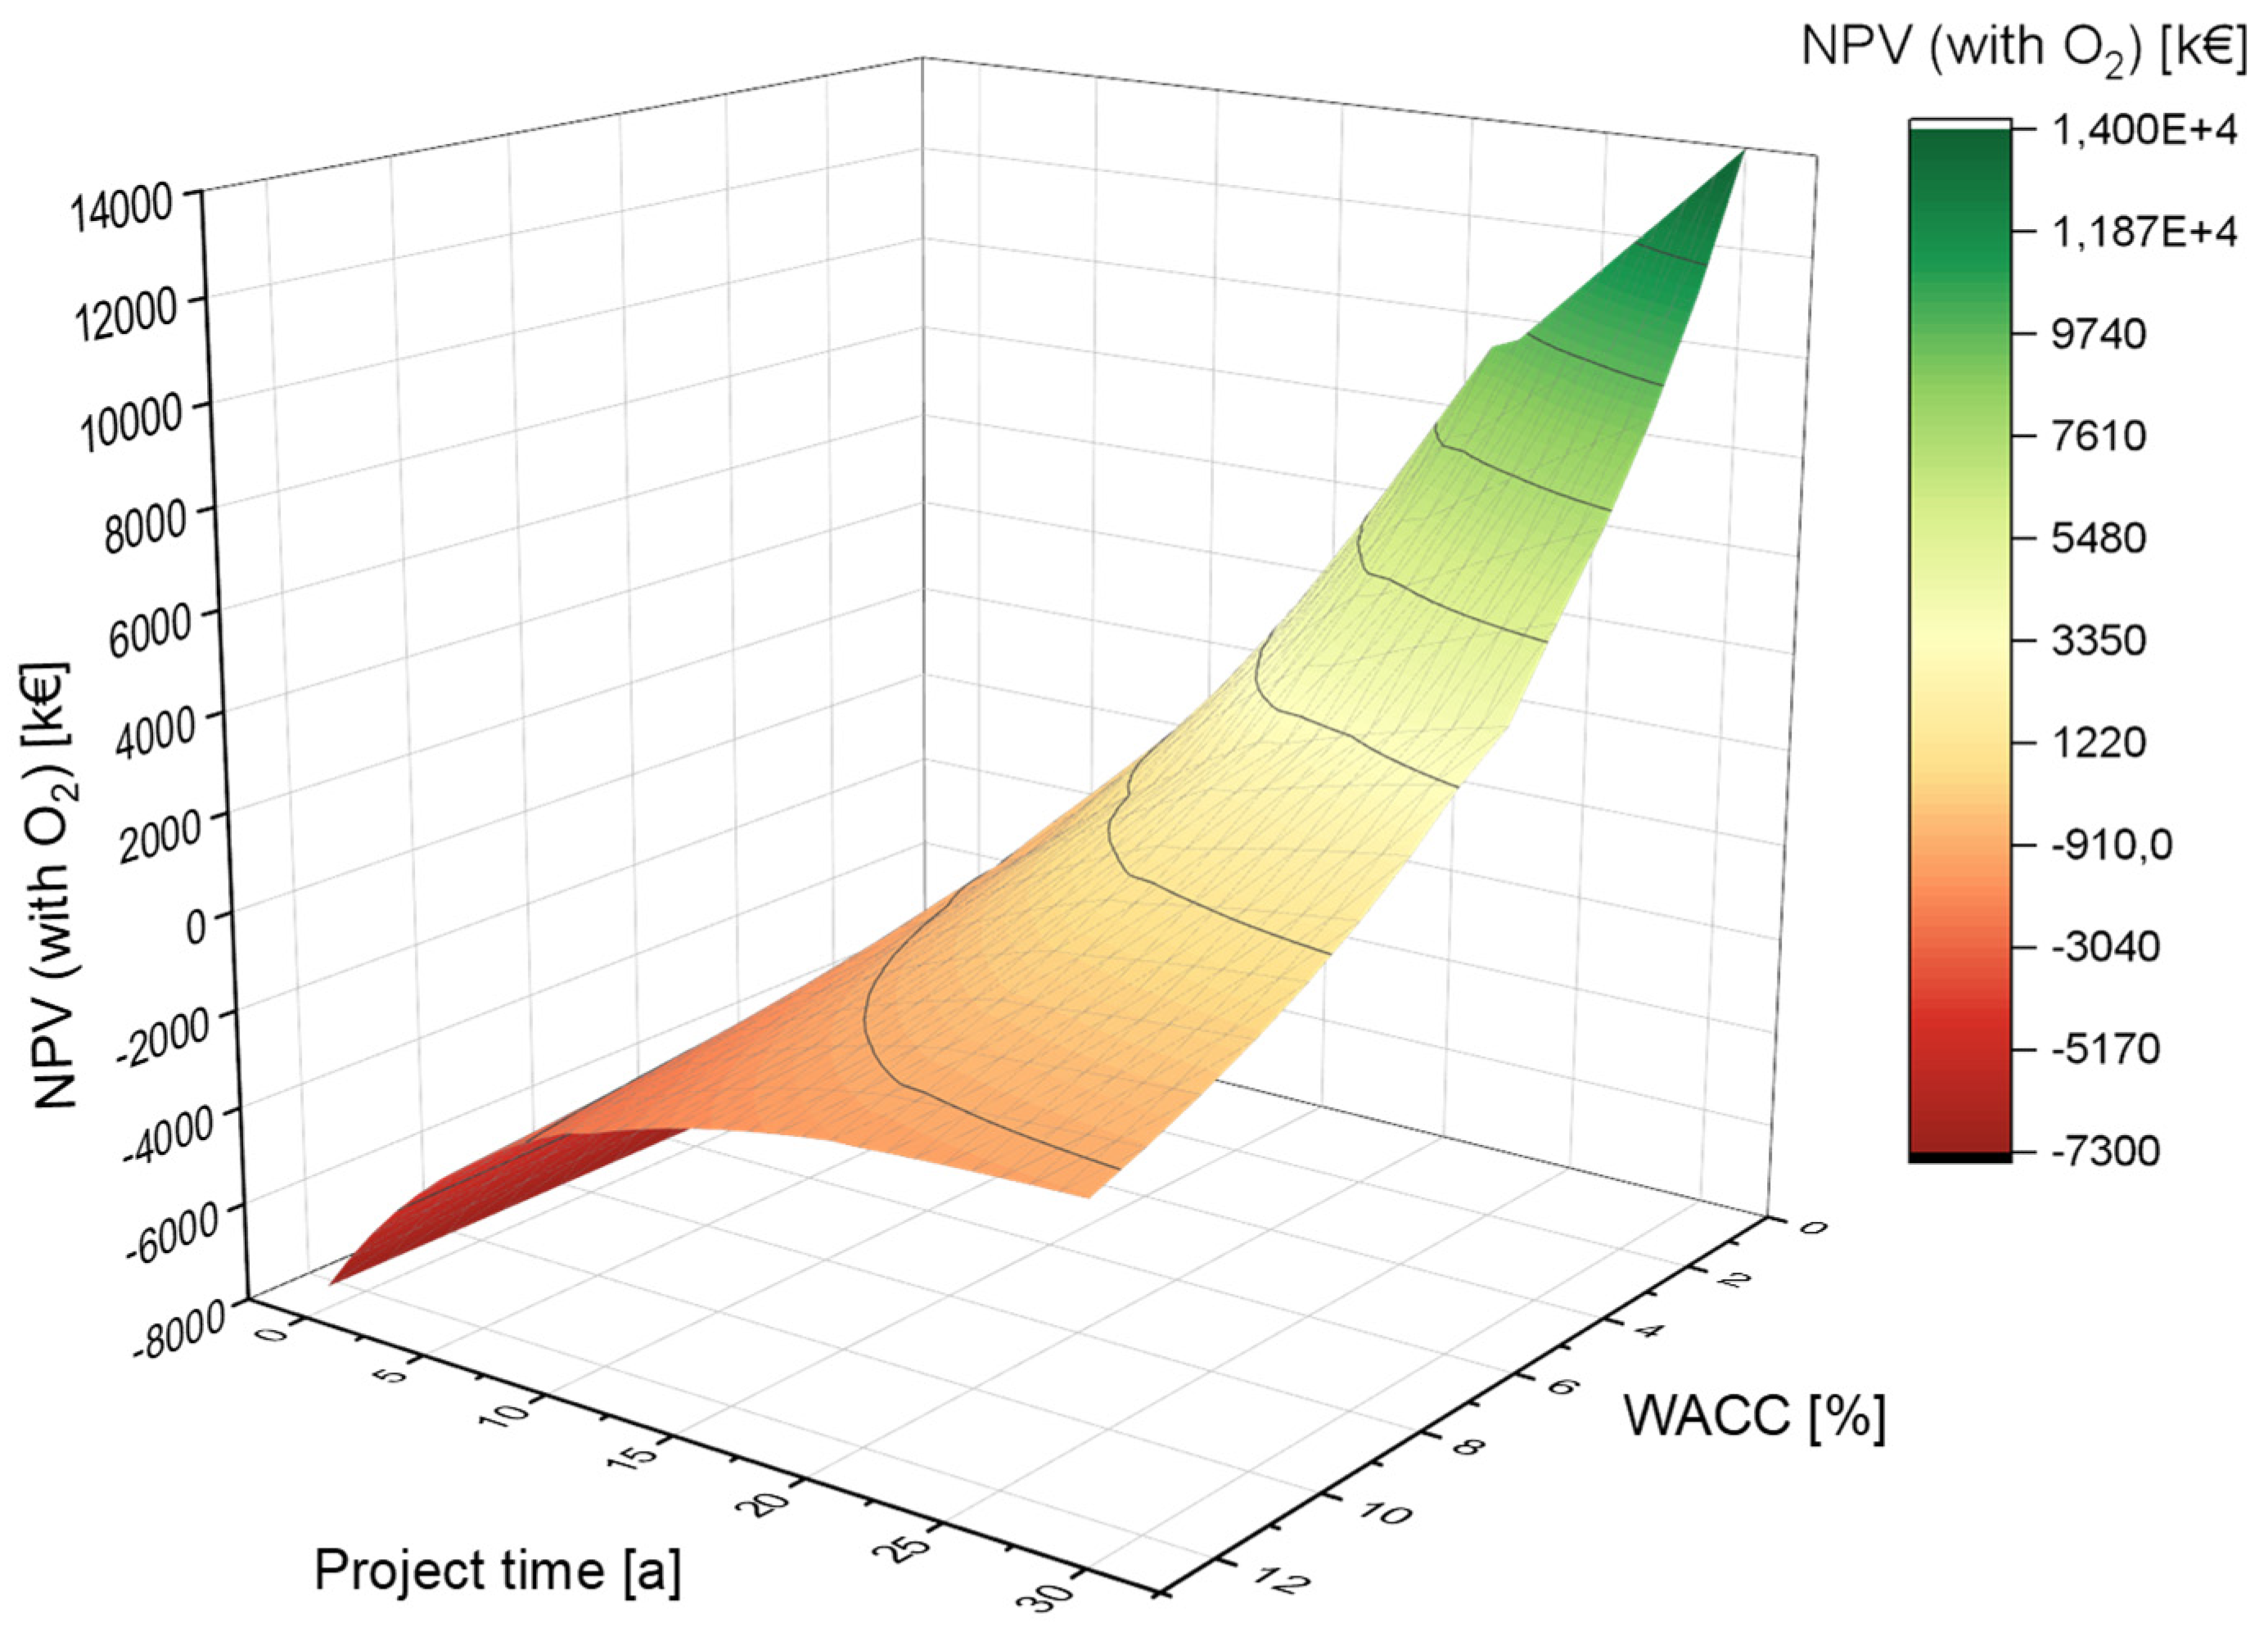
4.2.3. Variation of the Weighted Average Cost of Capital (WACC)
5. Conclusion
Author Contributions
Funding
Conflicts of Interest
Appendix A
| Parameter | Value | Unit | References |
|---|---|---|---|
| Project time (Plant lifetime) PV plant peak power Total power generation by PV plant PV degradation rate AEL Electrolyser power (without rectifier) Efficiency rectifier Stack lifetime Annual operation |
30 10 10,427,714.80 0.25 1,125 89 10 8,759 |
years MWp kWh/a % kW % a h/a |
[73] [50] [49] [73] [11] [72] |
| Deionised water Hydrogen outputa Oxygen outputa H2 storage (90 bar) |
10 406.8 2,682 19.62 |
kg/kg H2 kg/day kg/day kg |
[72] |
| H2 storage (875 bar) O2 storage (90 bar) |
1,048.3 1,417.95 |
kg kg |
|
| Long term storage rental System base load compressor Energy consumption per compression operation H2 fixed refuelling volume O2 demand |
10 1.25 60 110,000 1,123,142 |
years kW kWh kg H2/a kg O2/a |
[11] [47] [47] [11] |
| a after deduction of losses |
| Parameter | Value | Unit | References |
|---|---|---|---|
| Discount rate (equal to WACC) | 5.3 | % | [68] |
| PV plant specific cost (CAPEX) | 530 | €/kWp | [73] |
| PV plans OPEX fix Feed-in remuneration for surplus PV electricity Grid connection cost Electricity cost AEL Electrolyser CAPEXb |
2.5 0.05221 1,000 0.23 700 |
% of CAPEX p.a. €/kWh € €/kWh €/kW |
[73] [51] [11] [74] [7] |
| AEL Electrolyser OPEX fix AEL Electrolyser OPEX var (stack exchange) Deionised water H2 storage (90 bar) H2 storage (875 bar) O2 storage (90 bar) HRS CAPEXc HRS OPEX fix HRS OPEX var (inspection) Hydrogen selling price at the HRS Hydrogen selling price for industry |
19 45 0.01 22,500 180,000 90,000 738,850 2 2.3 9.5 4.5 |
€/kW*a % of CAPEX every 10 years €/litre €/10 years €/10 years €/10 years € % of CAPEX p.a. % of CAPEX every 5 years €/kg H2 €/kg H2 |
[7] [7] [63] [11] [11] assumption [11] [47] assumption [47] assumption [47] assumption [62] [75,76] |
| Aeration system for pure oxygen for aeration basins (CAPEX) Aeration system OPEX |
81,024 2 |
€ % of CAPEX p.a. |
[11] [11] |
|
b all peripheral components (rectifier, electrics, gas equipment, safety system and control system) included c compressor, dispenser’s pre-cooling unit, remote monitoring and control system and two H2-dispensers included | |||
References
- Bundesverband WindEnergie. Wasserstoff ist der Champagner der Energiewende; 2021 2021 Sep 30. Available from: URL: https://www.windindustrie-in-deutschland.de/expertenwissen/politik/wasserstoff-ist-der-champagner-der-energiewende [cited 2023 Apr 12].
- BMWi. Nationales Reformprogramm 2020: Die Nationale Wasserstoffstrategie.
- Maggio G, Nicita A, Squadrito G. How the hydrogen production from RES could change energy and fuel markets: A review of recent literature. International Journal of Hydrogen Energy 2019; 44(23): 11371–11384. [CrossRef]
- DVGW. Wo aus Wind und Sonne grünes Gas wird…: Eine Übersicht der Power-to-Gas-Projekte in Deutschland; 2020. Available from: URL: https://www.dvgw.de/themen/energiewende/power-to-gas [cited 2023 Apr 23].
- Nicita A, Maggio G, Andaloro APF, Squadrito G. Green hydrogen as feedstock: Financial analysis of a photovoltaic-powered electrolysis plant. International Journal of Hydrogen Energy 2020; 45(20): 11395–11408. [CrossRef]
- SPD; BÜNDNIS 90/DIE GRÜNEN; FDP. Koalitionsvertrag 2021 - 2025: Mehr Fortschritt wagen: Bündnis für Freiheit, Gerechtigkeit und Nachhaltigkeit; 2021.
- Smolinka T, Wiebe N, Sterchele P, Palzer A. Studie IndWEDe – Industrialisierung der Wasserelektrolyse in Deutschland: Chancen und Herausforderungen für nachhaltigen Wasserstoff für Verkehr, Strom und Wärme; 2018.
- Kato T, Kubota M, Kobayashi N, Suzuoki Y. Effective utilization of by-product oxygen from electrolysis hydrogen production. Energy 2005; 30(14): 2580–2595. [CrossRef]
- Deutsche Energie-Agentur GmbH (dena). Baustein einer Integrierten Energiewende: Roadmap Power to Gas; 2017.
- donner+friends UG (haftungsbeschränkt) & Co. KG. LocalHy - the real energy transition. Available from: URL: https://donnerandfriends.de/projekte/localhy.html [cited 2023 May 12].
- Hydrogen Power Storage & Solutions East Germany e.V. (HYPOS). LocalHy: Dezentrale Wasserelektrolyse mit kombinierter Wasserstoff- und Sauerstoffnutzung aus Erneuerbarer Energie; 2015-2020. Available from: URL: https://www.hypos-eastgermany.de/wasserstoffprojekte/zwanzig20/chemische-umwandlung/localhy/ [cited 2023 Apr 12].
- Rao P, Muller M. Industrial oxygen: its generation and use. ACEEE Summer Study on Energy Efficiency in Industry 2007; Ind. 6: 124–135.
- Hurskainen M. Industrial oxygen demand in Finland. Research Report VTT-R-06563-17 2017.
- Rivarolo M, Magistri L, Massardo AF. Hydrogen and methane generation from large hydraulic plant: Thermo-economic multi-level time-dependent optimization. Applied Energy 2014; 113(6): 1737–1745. [CrossRef]
- Alsultannty YA, Al-Shammari NN. Oxygen Specific Power Consumption Comparison for Air Separation Units. EJ 2014; 18: 67–80. [CrossRef]
- Büttner S. Interview. Oxygen purity; 2021 May 18. Personal communication.
- Saleem MS, Abas N, Kalair AR, et al. Design and optimization of hybrid solar-hydrogen generation system using TRNSYS. International Journal of Hydrogen Energy 2020; 45: 15814–15830. [CrossRef]
- Riedl SM. Development of a Hydrogen Refueling Station Design Tool. International Journal of Hydrogen Energy 2020; 45: 1–9. [CrossRef]
- Colbertaldo P, Gómez Aláez SL, Campanari S. Zero-dimensional dynamic modeling of PEM electrolyzers. Energy Procedia 2017; 142: 1468–1473. [CrossRef]
- Sánchez M, Amores E, Abad D, Rodríguez L, Clemente-Jul C. Aspen Plus model of an alkaline electrolysis system for hydrogen production. International Journal of Hydrogen Energy 2020; 45: 3916–3929. [CrossRef]
- INSEL: Integrated Simulation Environment Language. Quebec Canada, Stuttgart: doppelintegral GmbH. Available from: URL:https://insel.eu/de/.
- EDGAR. Freiberg. Available from: URL:https://www.freiberg-institut.de/leistungen/simulation-und-optimierung/.
- Lund H, Thellufsen JZ, Østergaard PA, Sorknæs P, Skov IR, Mathiesen BV. EnergyPLAN – Advanced analysis of smart energy systems. Smart Energy 2021; 1: 100007. [CrossRef]
- Hönig F, Ebert M, Blum U. Kläranlagen in Kombination mit der Wasserelektrolyse als neue Anbieter von Regelenergieprodukten. In: Neue Energie für unser bewegtes Europa: 15. Symposium Energieinnovation : 14.-16. Februar 2018, TU Graz, Österreich. Graz: Verlag der Technischen Universität Graz; 2018. Available from: URL:https://www.tugraz.at/fileadmin/user_upload/Events/Eninnov2018/files/lf/Session_F6/766_LF_Hoenig.pdf. DOI 10.3217/978-3-85125-586-7.
- Hönig F, Duque-Gonzalez D, Schneider J, Ebert M, Blum U. Auslegung von dezentralen Wasserelektrolyseanlagen gekoppelt mit Erneuerbaren Energien. In: Luschtinetz T, Lehmann J, editors. Nutzung Regenerativer Energiequellen und Wasserstofftechnik 2019. Stralsund: HOST - Hochschule Stralsund; 2019. p. 110–120 Available from: URL:https://www.hochschule-stralsund.de/regwa/.
- Hönig F, Duque-Gonzalez D, Hafemann M, Schneider J, Ebert M, Blum U. Ermittlung der CO2-Emissionen von Power-to-Gas-Projekten mittels GHOST und Validierung mit EnergyPLAN. In: Energy for future - Wege zur Klimaneutralität: 16. Symposium Energieinnovation : 12.-14. Februar 2020, TU Graz, Österreich. Graz: Verlag der Technischen Universität Graz; 2020. Available from: URL:https://www.tugraz.at/fileadmin/user_upload/tugrazExternal/4778f047-2e50-4e9e-b72d-e5af373f95a4/files/lf/Session_F1/614_LF_Hoenig.pdf. DOI 10.3217/978-3-85125-734-2.
- Büttner S. Warum kommunale Kläranlagen Wasserstoff mittels Elektrolyse produzieren sollten. gwf-Wasser 2020; 12: 14–17.
- Büttner S, Jentsch MF, Hörnlein S, Hubner B. Sektorenkopplung im Rahmen der Energiewende - Einsatz von Elektrolyseursauerstoff auf kommunalen Kläranlagen. In: Luschtinetz T, Lehmann J, editors. Nutzung Regenerativer Energiequellen und Wasserstofftechnik 2018. Stralsund: HOST - Hochschule Stralsund; 2018. p. 22–41 Available from: URL:https://www.hochschule-stralsund.de/regwa/.
- Jentsch MF, Büttner S. Dezentrale Umsetzung der Energie- und Verkehrswende mit Wasserstoffsystemen auf Kläranlagen. gwf Gas + Energie 2019; 160: 28–39.
- Minutillo M, Perna A, Forcina A, Di Micco S, Jannelli E. Analyzing the levelized cost of hydrogen in refueling stations with on-site hydrogen production via water electrolysis in the Italian scenario. International Journal of Hydrogen Energy 2020. [CrossRef]
- Viktorsson L, Heinonen J, Skulason J, Unnthorsson R. A Step towards the Hydrogen Economy: A Life Cycle Cost Analysis of A Hydrogen Refueling Station. Energies 2017; 10(6): 763. [CrossRef]
- Squadrito G, Nicita A, Maggio G. A size-dependent financial evaluation of green hydrogen-oxygen co-production. Renewable Energy 2021; 163(2): 2165–2177. [CrossRef]
- Fasihi M, Breyer C. Baseload electricity and hydrogen supply based on hybrid PV-wind power plants. Journal of Cleaner Production 2020; 243(306): 118466. [CrossRef]
- Salzgitter AG. WindH2: Windwasserstoff Salzgitter. Available from: URL:https://salcos.salzgitter-ag.com/de/windh2.html [cited 2023 Apr 28].
- Salzgitter Mannesmann Forschung GmbH. GrInHy2.0: Green Industrial Hydrogen. Available from: URL:https://www.green-industrial-hydrogen.com/ [cited 2023 Apr 28].
- Fraunhofer-Institut für Mikrostruktur von Werkstoffen und Systemen IMWS. Großelektrolyseur Leuna Gewinner im Ideenwettbewerb Reallabore der Energiewende: GreenHydroChem Mitteldeutschland wird gefördert; 2019 Jul 18. Available from: URL: https://www.imws.fraunhofer.de/de/presse/pressemitteilungen/reallabor-leuna-elektrolyse-wasserstoff.html [cited 2023 Apr 28].
- Raffinerie Heide GmbH. Westküste 100: Sektorenkopplung komplett: Grüner Wasserstoff und Dekarbonisierung im industriellen Maßstab. Available from: URL: https://www.westkueste100.de/ [cited 2023 Apr 28].
- ARGE Wasserstoff-Initiative-Vorpommern. Solarer Wasserstoff in Mecklenburg-Vorpommern: Utopie oder Zukunftstechnologie; 2002.
- Forschungsinstitut für Wasser- und Abfallwirtschaft an der RWTH Aachen (FiW) e.V. WaStraK NRW "Einsatz der Wasserstofftechnologie in der Abwasserbeseitigung" - Phase I: Abschlussbericht: 1–178.
- Schäfer M, Gretzschel O, Steinmetz H. The Possible Roles of Wastewater Treatment Plants in Sector Coupling. Energies 2022; 13(8): 2088. [CrossRef]
- Artuso P, Zuccari F, Dell’Era A, Orecchini F. PV-Electrolyzer Plant: Models and Optimization Procedure. Journal of Solar Energy Engineering 2010; 132(3): 1951. [CrossRef]
- Parra D, Patel MK. Techno-economic implications of the electrolyser technology and size for power-to-gas systems. International Journal of Hydrogen Energy 2016; 41(6): 3748–3761. [CrossRef]
- Ferrero D, Gamba M, Lanzini A, Santarelli M. Power-to-Gas Hydrogen: Techno-economic Assessment of Processes towards a Multi-purpose Energy Carrier. Energy Procedia 2016; 101: 50–57. [CrossRef]
- Yates J, Daiyan R, Patterson R, et al. Techno-economic Analysis of Hydrogen Electrolysis from Off-Grid Stand-Alone Photovoltaics Incorporating Uncertainty Analysis. Cell Reports Physical Science 2020; 1(10): 100209. [CrossRef]
- Grimm A, Jong WA de, Kramer GJ. Renewable hydrogen production: A techno-economic comparison of photoelectrochemical cells and photovoltaic-electrolysis. International Journal of Hydrogen Energy 2020; 45(43): 22545–22555. [CrossRef]
- Gutiérrez-Martín F, Amodio L, Pagano M. Hydrogen production by water electrolysis and off-grid solar PV. International Journal of Hydrogen Energy 2020; 44: 11371. [CrossRef]
- H2 POWERCELL GmbH. Interview. Components of a hydrogen refueling station. Wettringen; 2021 Sep 22. Personal communication.
- Smolinka T, Günther M, Garche J. NOW-Studie: "Stand und Entwicklungspotenzial der Wasserelektrolyse zur Herstellung von Wasserstoff aus regenerativen Energien": Kurzfassung des Abschlussberichts; 2011. Available from: URL:https://www.now-gmbh.de/projektfinder/studie-wasserelektrolyse/.
- PV*SOL premium: Die Planungs- und Simulationssoftware für Photovoltaik-Systeme. Berlin. Available from: URL:https://valentin-software.com/produkte/pvsol-premium/.
- BMWi. Verordnung zur Einführung von Ausschreibungen der finanziellen Förderung für Freiflächenanlagen sowie zur Änderung weiterer Verordnungen zur Förderung der erneuerbaren Energien: Freiflächenausschreibungsverordnung - FFAV; 2015: 1–105.
- Bundesnetzagentur. Solar Freifläche: Beendete Ausschreibungen / Statistiken. Available from: URL: https://www.bundesnetzagentur.de/DE/Sachgebiete/ElektrizitaetundGas/Unternehmen_Institutionen/Ausschreibungen/Solaranlagen1/BeendeteAusschreibungen/BeendeteAusschreibungen_node.html [cited 2023 Apr 25].
- Fricke K, Umweltbundesamt (Hg.). Energieeffizienz kommunaler Kläranlagen; 2009.
- Dettmar J, Brombach H. Im Spiegel der Statistik: Abwasserkanalisation und Regenwasserbehandlung in Deutschland. Korrespondenz Abwasser 2019; 66(5).
- Büttner S. Interview. Disproportionately high oxygen demand; 2021 Apr 27. Personal communication.
- SAE International. SAE J2601 Fueling Protocols for Light Duty Gaseous Hydrogen Surface Vehicles: J2601_202005. 2020th ed.
- Landesagentur für Elektromobilität und Brennstoffzellentechnologie Baden-Württemberg GmbH (e-mobil BW) in Kooperation mit dem Fraunhofer-Institut für Solare Energiesysteme ISE. Wasserstoff-Infrastruktur für eine nachhaltige Mobilität: Entwicklungsstand und Forschungsbedarf 2013.
- NOW GmbH. Einführung von Wasserstoffbussen im ÖPNV: Fahrzeuge, Infrastruktur und betriebliche Aspekte; 2018.
- Bauer A, Mayer T, Semmel M, Guerrero Morales MA, Wind J. Energetic evaluation of hydrogen refueling stations with liquid or gaseous stored hydrogen. International Journal of Hydrogen Energy 2019; 44(13): 6795–6812. [CrossRef]
- Reddi K, Elgowainy A, Sutherland E. Hydrogen refueling station compression and storage optimization with tube-trailer deliveries. International Journal of Hydrogen Energy 2014; 39(33): 19169–19181. [CrossRef]
- Ozsaban M, Midilli A, Dincer I. Exergy analysis of a high pressure multistage hydrogen gas storage system. International Journal of Hydrogen Energy 2011; 36(17): 11440–11450. [CrossRef]
- H2 MOBILITY. 70MPa Hydrogen Refuelling Station Standardization: Functional Description of Station Modules; 2010. Available from: URL: https://www.now-gmbh.de/wissensfinder [cited 2023 Apr 25].
- Filling up with H2: Hydrogen mobility starts now; 2023. Available from: URL: https://h2.live/ [cited 2023 Apr 25].
- Kuckshinrichs W, Ketalaer T, Koj JC. Economic analysis of improved Alkaline Water Electrolysis. Frontiers in Energy Research 2017; 5:1. [CrossRef]
- Blohm H, Lüder K, Schaefer C, editors. Investition: Schwachstellenanalyse des Investitionsbereichs und Investitionsrechnung. 9th ed. München: Vahlen 2006.
- Wöhe G, Döring U, editors. Einführung in die Allgemeine Betriebswirtschaftslehre. 24th ed.: Vahlen 2010.
- Kruschwitz L, editor. Investitionsrechnung. 12th ed. München: Oldenbourg Wissenschaftsverlag 2009.
- Fraunhofer ISE. Current and Future Cost of Photovoltaics: Long-term Scenarios for Market Development, System Prices and LCOE of Utility-Scale PV Systems; 2015.
- KPMG. Cost of Capital Study 2020: Global economy - search for orientation? 2020.
- United Nations. Transforming our world: the 2030 Agenda for Sustainable Development 2015.
- Die Bundesregierung. Deutsche Nachhaltigkeitsstrategie: Weiterentwicklung 2021.
- Stratmann K. Energieintensive Industrie fordert radikalen Schnitt beim Strompreis: Große Energieverbraucher kämpfen dafür, dass die Strompreise auf ein wettbewerbsfähiges Niveau gesenkt werden. Sie wissen den Bundeskanzler auf ihrer Seite.; 2022. Available from: URL: https://www.handelsblatt.com/politik/ [cited 2023 Apr 25].
- Koj J, Wulf C, Schreiber A, Zapp P. Site-Dependent Environmental Impacts of Industrial Hydrogen Production by Alkaline Water Electrolysis. Energies 2017; 10(7): 860. [CrossRef]
- Fraunhofer Institute for Solar Energy Systems ISE. Levelized Cost of Electricity: Renewable Energy Technologies 2021.
- Statista. Strompreise für Gewerbe- und Industriekunden in Deutschland in den Jahren 2011 bis 2021; 2021. Available form: URL: https://de.statista.com/statistik/daten/studie/154902/umfrage/strompreise-fuer-industrie-und-gewerbe-seit-2006/ [cited 2023 May 10].
- statista. Forecast hydrogen selling price of selected giga-scale projects worldwide by 2021 wind and solar costs; 2021. Available from: URL:https://www.statista.com/statistics/1260117/projected-selling-prices-of-large-scale-hydrogen-green-projects/ [cited 2023 May 05].
- IRENA. Hydrogen: A renewable energy perspective, Report prepared for the 2nd Hydrogen Energy Ministerial Meeting; 2019.
| 1 | The hydrogen price at the H2 MOBILITY filling stations has risen to 13.85 €/kg H2 for 700 bar refuelling in June 2022. The simulation still uses the previous price of 9.50 €/kg. [62] |
Disclaimer/Publisher’s Note: The statements, opinions and data contained in all publications are solely those of the individual author(s) and contributor(s) and not of MDPI and/or the editor(s). MDPI and/or the editor(s) disclaim responsibility for any injury to people or property resulting from any ideas, methods, instructions or products referred to in the content. |
© 2023 by the authors. Licensee MDPI, Basel, Switzerland. This article is an open access article distributed under the terms and conditions of the Creative Commons Attribution (CC BY) license (http://creativecommons.org/licenses/by/4.0/).


