Preprint
Article

Nanometric and Thermogravimetric Evaluation of Volcanic Clays With Industrial Interest (Ecuador)

Altmetrics

Downloads

83

Views

37

Comments

0

Submitted:

24 May 2023

Posted:

25 May 2023

You are already at the latest version

Alerts
Abstract
Ecuador has 4000 Km2 of volcanic nanoclay reserves that could be industrialized. An immediate application is to modify the local AC-20 asphalt with this aggregate. This resource was characterized with FTIR, XRD, FRX, SEM, BET, Laser Granulometry, SPECMIN, TSG, TGA, DTG, DSC and Atmospheric Adsorption. FTIR showed vibration peaks Si and Al. X-ray diffraction indicated the presence of silicates and alumina, BET measured particle size (30 to 250 nm), and the SSA property measured the specific surface area (280.38 m2/g). Chip rock (natural clay) was treated with H2O2 or NaOH or NH3 and evaluated with SPECMIN -TSG obtaining spectra close to vermiculite, allophane and bentonite minerals. At 1000 °C additional samples were calcined in Thermogravimetry (TGA), Differential Thermogravimetry (DTG), Differential Thermal Analysis (DCS), with mass loss around 40%, corresponding to organic matter, hydroxyl (OH) and destruction of its structure with spicule formation at 956 °C. With the DSC there were endothermic and exothermic manifestations. The Si/Al layers would have micro and meso porosity, it was also found to be a nanoparticulate material, with high adsorption capacity. At temperatures above 350 °C, its structure collapsed. Thus, this synthesized nanoclay will be used as an additive to form new materials.
Keywords: 
Subject: Engineering  -   Industrial and Manufacturing Engineering

1. Introduction

The present study begins by reviewing the most important events chronologically, of the investigations of clay minerals. This material is very important and used in the world, since ancient times, different cultures have used ceramics; it is used as raw material for the elaboration of various elements, articles, and to generate new chemical substances for use in human life,(1). In 1898 Knight discovered bentonite, in 1917 it was confirmed that bentonite was volcanic ash,(2), in 1925 the compounds of montmorillonite (MMT) were known,(3), in 1927 X-ray diffraction (XRD) was applied to know the chemical constitution,(4), in 1930 the atomic structure of layers of clay silicates was investigated,(5), in 1931 the crystalline constitution of clays was studied,(6), in 1932 it was investigated a structure for kaolinite,(7), in 1935 the thermal behavior of kaolin was evaluated, (8), in 1942 the electron microscope was used as a tool for investigating clay,(9), in 1945 the Committee for the Study of Clay Minerals in the USA,(10), in 1949 the MMT Organ was used industrially,(11), in 1978 it was proposed to bring bentonite to a commercial level,(12), in 1987 physical, mechanical and thermal properties were defined to synthesize nanocomposite polymers,(13) , since 1993 the polymer was widely used and the first hybrid Nylon-6/clay exfoliation was carried out,(14), in 2002 clay nanocomposites were prepared and rheological, thermal and mechanical properties were evaluated,(15), in 2007 was used as a reinforcing agent in the impact toughness of polyethylene-clay and polypropylene-clay nanocomposite systems,(16). In 2009 and 2010, a German scientific mission carried out nanometric measurements of clays and calculated the commercial volumes of these deposits in Ecuador,(17), in 2010 nanoclay was used in asphalt mixtures,(18) , in 2012 the use of nanoclay in mixtures was evaluated, economically reasonable,(19), in 2013 progress was made for the Hot Mix Asphalt (HMA) with nanoclay,(20), in 2017 the performance of modified asphalt, was studied,(21).
In Ecuador, in the province of Santo Domingo de Tsáchilas, 120 km south of Quito, there are important accumulations of weathered clayey materials, coming from ash, volcanic breccia, and pyroclastic flows. All these materials were the result of the eruptions of the Ninahuilca, Illiniza and Quilotoa volcanoes, in the Andean royal range; that is, they constitute the San Tadeo geological formation, in an area greater than 4000 km2, (22). The current objective is to present a study of the nanotechnological and thermal characteristics of this material. For our purposes, the work is directed exclusively to the knowledge of 4 types of clays: kaolinites, montmorillonites, illites and chlorites, and their subdivisions, each branch of these minerals has specific properties with different industrial applicability,(23). Several nanometric properties were measured, such as the specific surface area of the clay, and it was found that the material has a great covering capacity; chemical analyzes showed the presence of aluminosilicate functional groups with a Si/Al ratio of 1.6, nanometric particle size, significant adsorption levels, etc.,(22). In additional studies, this previously synthesized material was used as a nanometric modifier additive for AC-20 Asphalt from the Esmeraldas State Refinery in Ecuador, and a considerable improvement was achieved in the performance of the new binder, work explained in an additional research article. In the world there are some deposits of clay rich in allophane such as in Chile, Costa Rica, Russia, New Zealand, and Ecuador, (24). However, to date in this country, these natural resources are not used or exploited, so it is necessary to advance in a proposal for its techno-scientific and industrial development, (25).

2. Materials and Methods

2.1. Clay Samples

The samples were taken from the different geological horizons (Figure 1) in the San Tadeo formation (0°14’14.13’’S; 79°14’27.05’’E, elevation 443 m ASL), using the Panel method (26). The basic equipment needed in rock sampling is Map of the region, compass, hammer, magnifying glass, pocketknife, acid (10 % HCl), indelible marker, nylon bags, notebook, ruler, gloves, safety glasses, 12-pound hammer, 20 cm long chisels, and boxes for the safe transport of samples. The collected samples were preserved in correctly labeled and geo-referenced containers to avoid these materials be contaminated. Samples of 10 kg were taken the following depths: sample A1 at 1 m, A2 at 3 m, A3 at 4.5 m, A4 at 6 m, A5 at 11 m and A6 at 16 m. The upper levels were of greater geological interest for this research, according to previous studies (27).

2.2. Organic matter and carbonate removal treatment

Different clay samples of different levels were prepared. The material was diluted in distilled water, decanted and the supernatant of larger amorphous solids was separated (pH of the solution was 6,851). In order to eliminate organic matter, they were treated with H2O2 at 50 % and 10 % in concentration and in a 1:1 ratio by weight, subsequently washed with distilled water, and then they were dehydrated for 12 h at a nominal temperature of 105 °C, additionally they were grinding in an Agate mortar to achieve maximum disaggregation, until particles less than 0.005 mm are achieved, in this monomodal phase (28). Two types of samples were prepared for nanometric tests: a) samples not treated with electrolytic chemicals and b) treated with HCl, NaOH or NH3 (in aqueous solutions of 5M concentration), to remove impurities such as carbonates and carbonaceous material, and washed until obtaining a pH value between 6.7 to 7.1 (29). The colloidal mass of the supernatant was dried at the temperature of 105 °C, for a period of 12 h (30). Representative samples were selected for laboratory analysis in electron microscopy, radiation, and thermogravimetry. The chemicals used comply with quality standards and certifications and were supplied by Lenntech USA LLC Laboratories (30).

2.3. Infrared Spectrometer, FTIR

The sample was placed in a container and previously dried in an oven at a nominal temperature of 105 °C, each sample was treated with potassium bromide (KBr), then analyzed by infrared, FTIR, with a VERTEX Model: 70 equipment, that it has the spectral range of 400 to 10000 cm-1; it was evidenced the existence of functional groups of Si, Al, Fe and OH, characteristic elements of volcanic clays (31).

2.4. X-ray diffraction, XRD

The X-ray diffraction of the A1 level samples was investigated with the D8 ADVANCE kit (Bruker), at 40 kV and 40 mA, Cu Kα source radiation (λ =1.5418). The diffraction angle 2θ was scanned from 2° to 65° at a speed of 2°/min and step size of 0.05°. Bragg´s law was used to calculate the distance between the silicate layers.

2.5. X ray fluorescence, XRF

Samples of the processed mineral were taken, dried at 105 °C and grounded in an agate mortar, until obtaining a grain size of less than 0.005 mm on average, and 40 mg of sample + 100 mg of boric acid were mixed in the container until having a totally homogeneous material, used to fabricate briquettes of the mineral at 30 mg/cm2, and; with the appropriate pressure, it was verified that the surface is isotropic; which allowed to make correct measurements with the X-ray equipment S8 Tiger (XRF) (32).

2.6. Scanning electron microscope, SEM

To observe the grain contours of the clay sample and to identify the characteristics of the μm and nm scale on the surface of the grain, the laminar samples were covered with a thin gold film. The sample holder was placed in a rotation stage on the cartesian x, y and z axes in the SEM vacuum chamber. A heated tungsten filament generates and accelerates the electrons to a constant emission flow of 100 μA and variable voltages from 15 to 30 kV. The magnification of 100 × up to 25000 of the ZEISS brand ULTRA 55 equipment (SEM) must be varied, and lobular accumulations of different diameter were observed (33).

2.7. BET Isotermhemical

The methodology indicated was used to prepare a 0.05 g sample of particulate clay where the organic matter was previously chemically removed. The sample was exposed to a nitrogen N2 atmosphere and at a temperature of 300 °C, for 3 h, the specific surface area of the sample was evaluated. The technology used was Multi Point BET and the collected data of the adsorption and desorption isotherms of the sample was determined (34).

2.8. Laser granulometry

The particle size of the nanoclay was investigated, to this end, 0.025 g of the previously dehydrated sample was taken at 105 °C. Nanometric particles tend to rise towards the top of the calcination chamber and the heaviest ones accumulated in the bottom of the container; consequently, the sample was taken at three points in the container. The diameter of the particles and their size distribution were obtained by the device called Laser Scattering Particle Size Distribution Analyzer LA-950V2 (35).

2.9. SPECMIN, TSG

SPECMIN software processed the spectral data and the images obtained by the HyLogger3, identifying the minerals through its algorithms, same TSG. The physical phenomenon is due to the reflectance of the incoming sample, and in contrast to the patterns of the mineral libraries embedded in the equipment. The deflection intervals of the curves and their specific depths were determined. Therefore, the evaluated clays were adjusted with 3 standards (36).

2.10. Thermogravimetry, TGA

Six samples (0.0722 mg) were tested by the TGA at the different levels A1-A6 indicated before, the same ones that were previously dehydrated at 105 °C. With the DSC-TGA equipment (mod. SDT Q 600), tests were carried out on the clay samples, which suffered a continuous loss of mass at variable speed, with a nitrogen atmosphere and over the range of 600 to 1000 °C, air; with a heating rate of 10 °C/min (37); on the other hand, the thermogravimetric differential (DTG) allowed the evaluation of the temperature differential of the TGA as a function of time, therefore, evidenced the variation in the physical and chemical properties of the calcined samples, denoting endothermic and exothermic behaviors in the heating process until reaching 1000 °C (38).

2.11. Differential scanning calorimeter, DSC

The tests of the thermal differentials of the samples were carried out with the DSC-TGA equipment (mod. SDT Q 600). 12–15 mg of sample was used, and heated between 1 and 1000 °C, under an atmosphere of N2 and air above 600 °C; the heating rate was 10 °C/ min. For materials such as polymers, the kit can display glass transition, melting, and crystallization temperatures; as well as the enthalpy of fusion and crystallization (39)(40).

2.12. Atmospheric Adsorption Test

For this test, seven samples (30 mg) were taken, which were cooked at a controlled temperature up to 325 °C at 10 °C/min and left to rest in an air atmosphere with humidity of 80 %. Observations were obtained from the BOECO-Germany-Instruments high precision balance system (0.001 g sensitivity), which measured the increase in mass as a function of time, the readings were recorded every 5 min until reaching 2500 min (41)(34).

3. Results and Discussion

3.1. Characterization of volcanic clays from Santo Domingo de los Tsáchilas

It was essential to verify the composition, chemical and radiological properties, particle size, structure, and more characteristics of the nanoclay in Ecuador, in order to develop the project for the use of this material as an asphalt modifying additive. For this, level A1 samples were selected for spectral characterization, since they contain allophane fractions at 65% concentration. We will start by evaluating the following elements:
1.-Determination of functional groups of the clay, in 2 samples, A1 and its modified A1+NaOH.
FTIR was used, in Figure 2a,b the respective spectra are shown: (a) clay sample treated with NaOH and (b) untreated sample (fragments of natural rock). In (a) the values ​​of the depressed peaks were found at 3249.66, 1585.54, 1280.39, 918.20, 791.30 and 603.95 cm-1. The interpretation indicated that the value 3249.66 cm-1 corresponds to the possibility of the existence of OH groups of the Si-OH and Al-OH structures. The value of 1585.54 cm-1 was found to be deeper due to the treatment of the sample with H2O2, proving the existence of OH groups within the molecules of the structure. At 1280.39 cm-1 it showed the manifestation of the typical vibrations of the OH-Al bonds. The peaks 918.20, 899.26 and 791.30 cm-1, are the result of the energy absorption of the Si-O-Si, Si-OH-Al and Si-O-Al molecules within the framework of the octahedron. In sample (b) depressed peaks were found at 3255.25, 1597.00 and 899.26 cm-1; the value of 3255.25 cm-1 showed the existence of Al-OH and Gibbsite groups that constitute the allophane planes. In 1597.00 cm-1 the existence of OH radicals belonging to the octahedral structures of laminar Al was demonstrated. In 899.26 cm-1 the existence of the Si and Al, Si-O-Si and Si-OH-Al structures was indicated. Values ​​less than 500 cm-1 indicated the absence of volcanic ash, and it is a typical wall with a clayey structure such as (OH) Si (OAl)3; the definition of each functional group is approximate(42).
2. Determination of the clayey minerals present in the A1 samples.
XRD was used and the results are obtained in Figure 2c, the intensity of the 2θ = 26.55° peak indicates the presence of quartz and silicon elements, the allophane has mixed quartz at 2θ = 28.15° and 18.65° with non-crystalline material. Low peaks with angles of 2θ = 10.58° correspond to actinolite and in values ​​of 2θ = 5.0° montmorillonite, typical of volcanic soils and sedimentary bodies. The sample presented different clay minerals that make up the nature of an amorphous material,(43).
3.- Determination of the size and dimensions of the particle of the sample A1
With the SEM the arrangement of the structure of the clay particles was observed; in Figure 2d the accumulations of particles with a diameter of 152.67 nm (a) and 243.74 nm (b) were verified. The clays are almost “nano” in size in this image and can be seen as globules. It is a typical characteristic of nanoclay to organize themselves in a circular or annular structure. Other researchers have determined, with TEM transmission electron microscopy tests, particles with a diameter between 3.0 to 5.5 nm within the spheroidal or annular structure. The particle size is nanometric,(44).
4.-Chemical analysis (XRF) and results of adsorption and desorption tests (BET) of sample A1
In Table 1, the results of the calcination at 956 °C of 3 samples of the material of level A1 are presented. Chemical analysis was carried out with XRF, where was found that the largest fraction of atoms were Si and Al, with respect to unity; the other fractions in lower magnitudes were found from the chemical elements of Fe, Na, Ca, Ti, Mg, K, Mn, P and S,(45). Additionally, BET tests were performed, and the adsorption and desorption isotherms of the activity between the nanoclay and a fraction of N2 were presented
It was observed that the curves do not coincide, that is, there is hysteresis in the adsorption phenomenon, which means that the N2 content in desorption is greater than absorption, because molecular interactions occur between the components of the clay,(43).
The clays are agglomerated and have a mesopore between slit-shaped plates where some of the gas was possibly retained. The Kelvin equation can be used to calculate the pore size distribution, based on adsorption-desorption isotherms. According to the Brunauer – Deming, - Deming – Teller classification, specific surface area was determined in various samples, whose average value is 280.38 m2/g (very acceptable value) (46) (47).
5.-Determination of laser granulometry, and match with clay mineral standards with TSG and SPECMIN
On the other hand, the Laser Granulometry test was performed, which allowed to know the diameter of the clay particles and their distribution of their sizes 71.2 % of particles had a maximum diameter of 200 nm, 43.3 % reached 100 nm, and the total of particles did not exceed 250 nm (it has micro and meso porosity),(48).
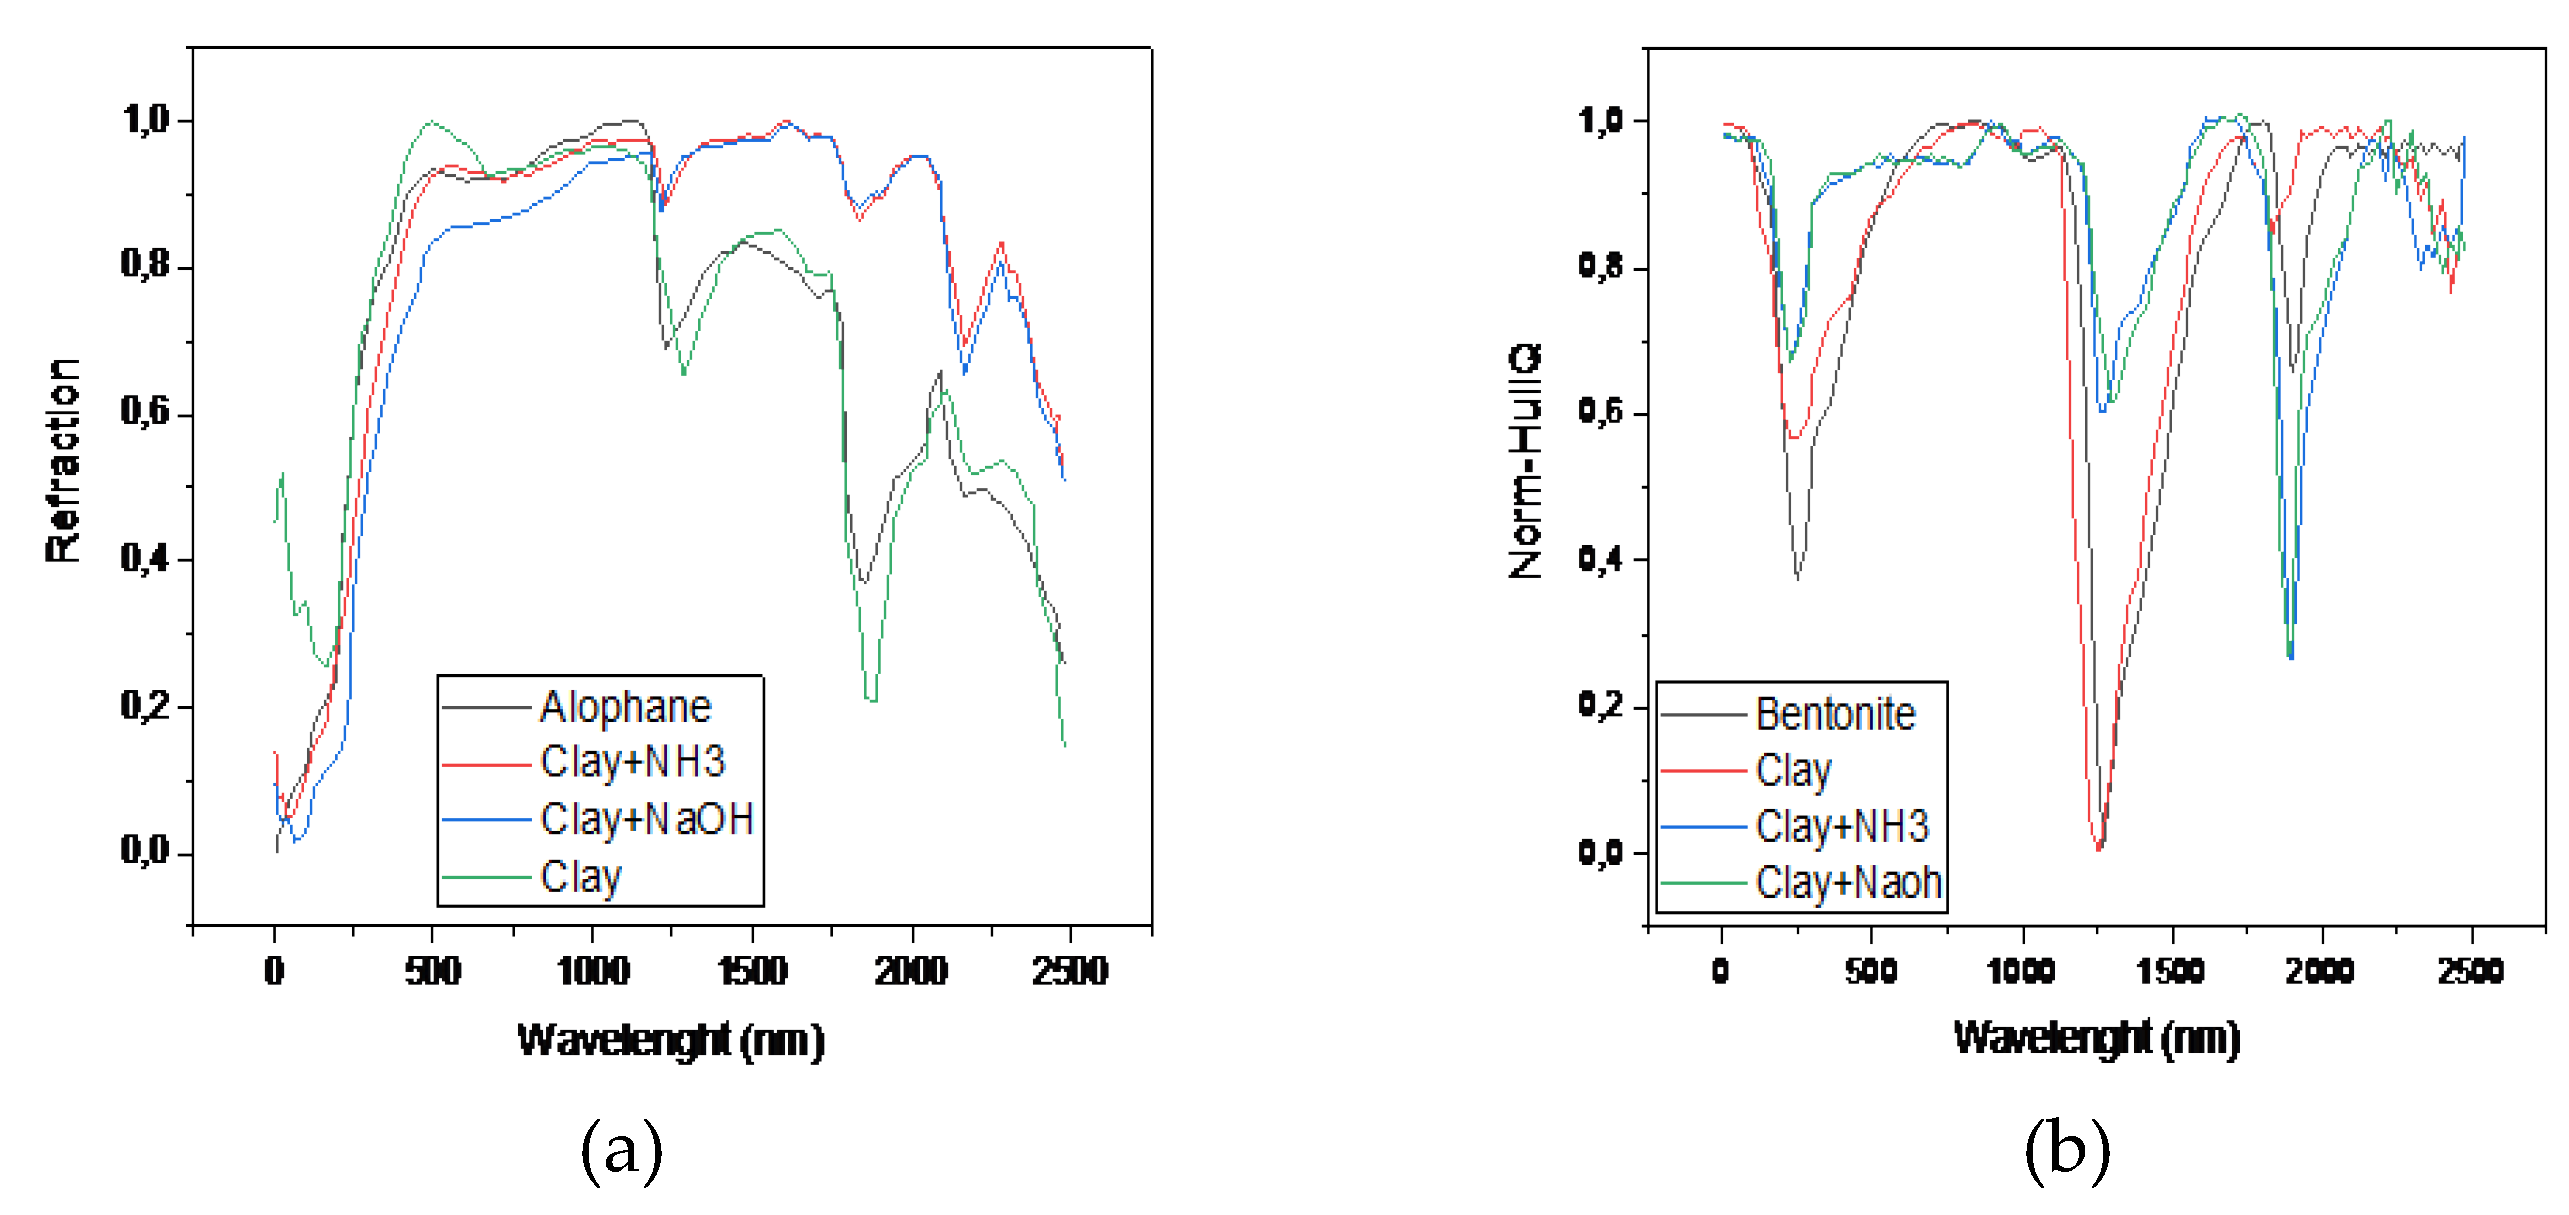
With the SPECMIN, the absorption ranges of the 3 samples treated with ammonia, sodium hydroxide and natural rock chips were evaluated Figure 3a. Samples of added NaOH and NH3+ clay agreed with the wavelength of the allophane standard (Pattern is AlloJP2f.002), although the low values differ from the water absorptions (1400 nm and 1910 nm). It is presumed that this difference in depth in the absorptions between the standard spectrum and the sample is due to chemical treatment, especially in the content of surface and hydroxylic water. Regarding the absorption characteristics of the untreated sample (natural rock chip), they coincide in wavelength and absorption depth with the allophane standard sample and have a 90 % similarity (36). With the TSG, the reflectance images were adjusted with bentonite patterns (Figure 3b) and two more for kaolinite and vermiculite.
For the natural rock chip sample, the absorption ranges were found to coincide with vermiculite, resembling both wavelength and depth of absorption primarily in water (1900 nm); Furthermore, the spectrum obtained is also coincident with the bentonite spectrum. Wavelengths varied because smectites have a wide compositional range without ruling out the possibility of having minerals in admixture. With these considerations, the spectrum obtained would indicate its adjustment with vermiculite and bentonite. The spectra of the treated sediment samples: a) Clay + NH3 and, b) Clay + NaOH, does not coincide with vermiculite, but with the bentonites-smectites. Although as in the Specmin Pro, the values different in the absorption of water (1400 and 1910 nm) mainly due to the previous dehydration of the samples.
Absorption peaks in sediment spectra are also coincident with kaolinite WX (Well crystallized by its acronym in English), which is possibly consistent from the previous chemical treatment, because they do not coincide with the other features of the standard spectrum. In this case, the existence of bentonites, montmorillonite, with kaolinite content is indicated Al2 Si2O5 (OH)4. Therefore, the samples of the material evaluated according to the SPECMIN methodology, showed that the refractory characteristics of the sample of the rock chip (natural clay), coincided with allophane.
With the TSG methodology corresponded to Bentonite and Vermiculite. Thus, basic elements of these found minerals were reviewed: a) Allophanes ((Al2O3 (SiO2) 1.3-2.0) have different shades depending on the element associated with the mineral such as Fe, Mg, Ca, Na, K; b) Silica (SiO2) that can change its morphology by increasing the temperature to type a and b quartz and then to tridymite b and cristobalite b; c) Bentonite (SiO3 *H2O), is composed of little compact sheets, ribbons or needle bundles and whose sodium, calcium or magnesium are interchangeable; d) Actinolite (Ca2 (Mg, Fe2+) Si8O22 (OH) 2), has Mg and Fe ions that can be freely exchanged in the crystal structure; f) Vermiculite ((Mg, Fe, Al)6 (Si, Al)8 O20 (OH)4 .8H2O), has a high proportion of magnesium in octahedral coordination, and has a high cation exchange capacity with Mg2+ and Ca2+, magnesium generates a high negativity more than MMT,(49).
6.-Variation of mass parameters and structure of samples A1-A6, submitted under TGA and DCS techniques.
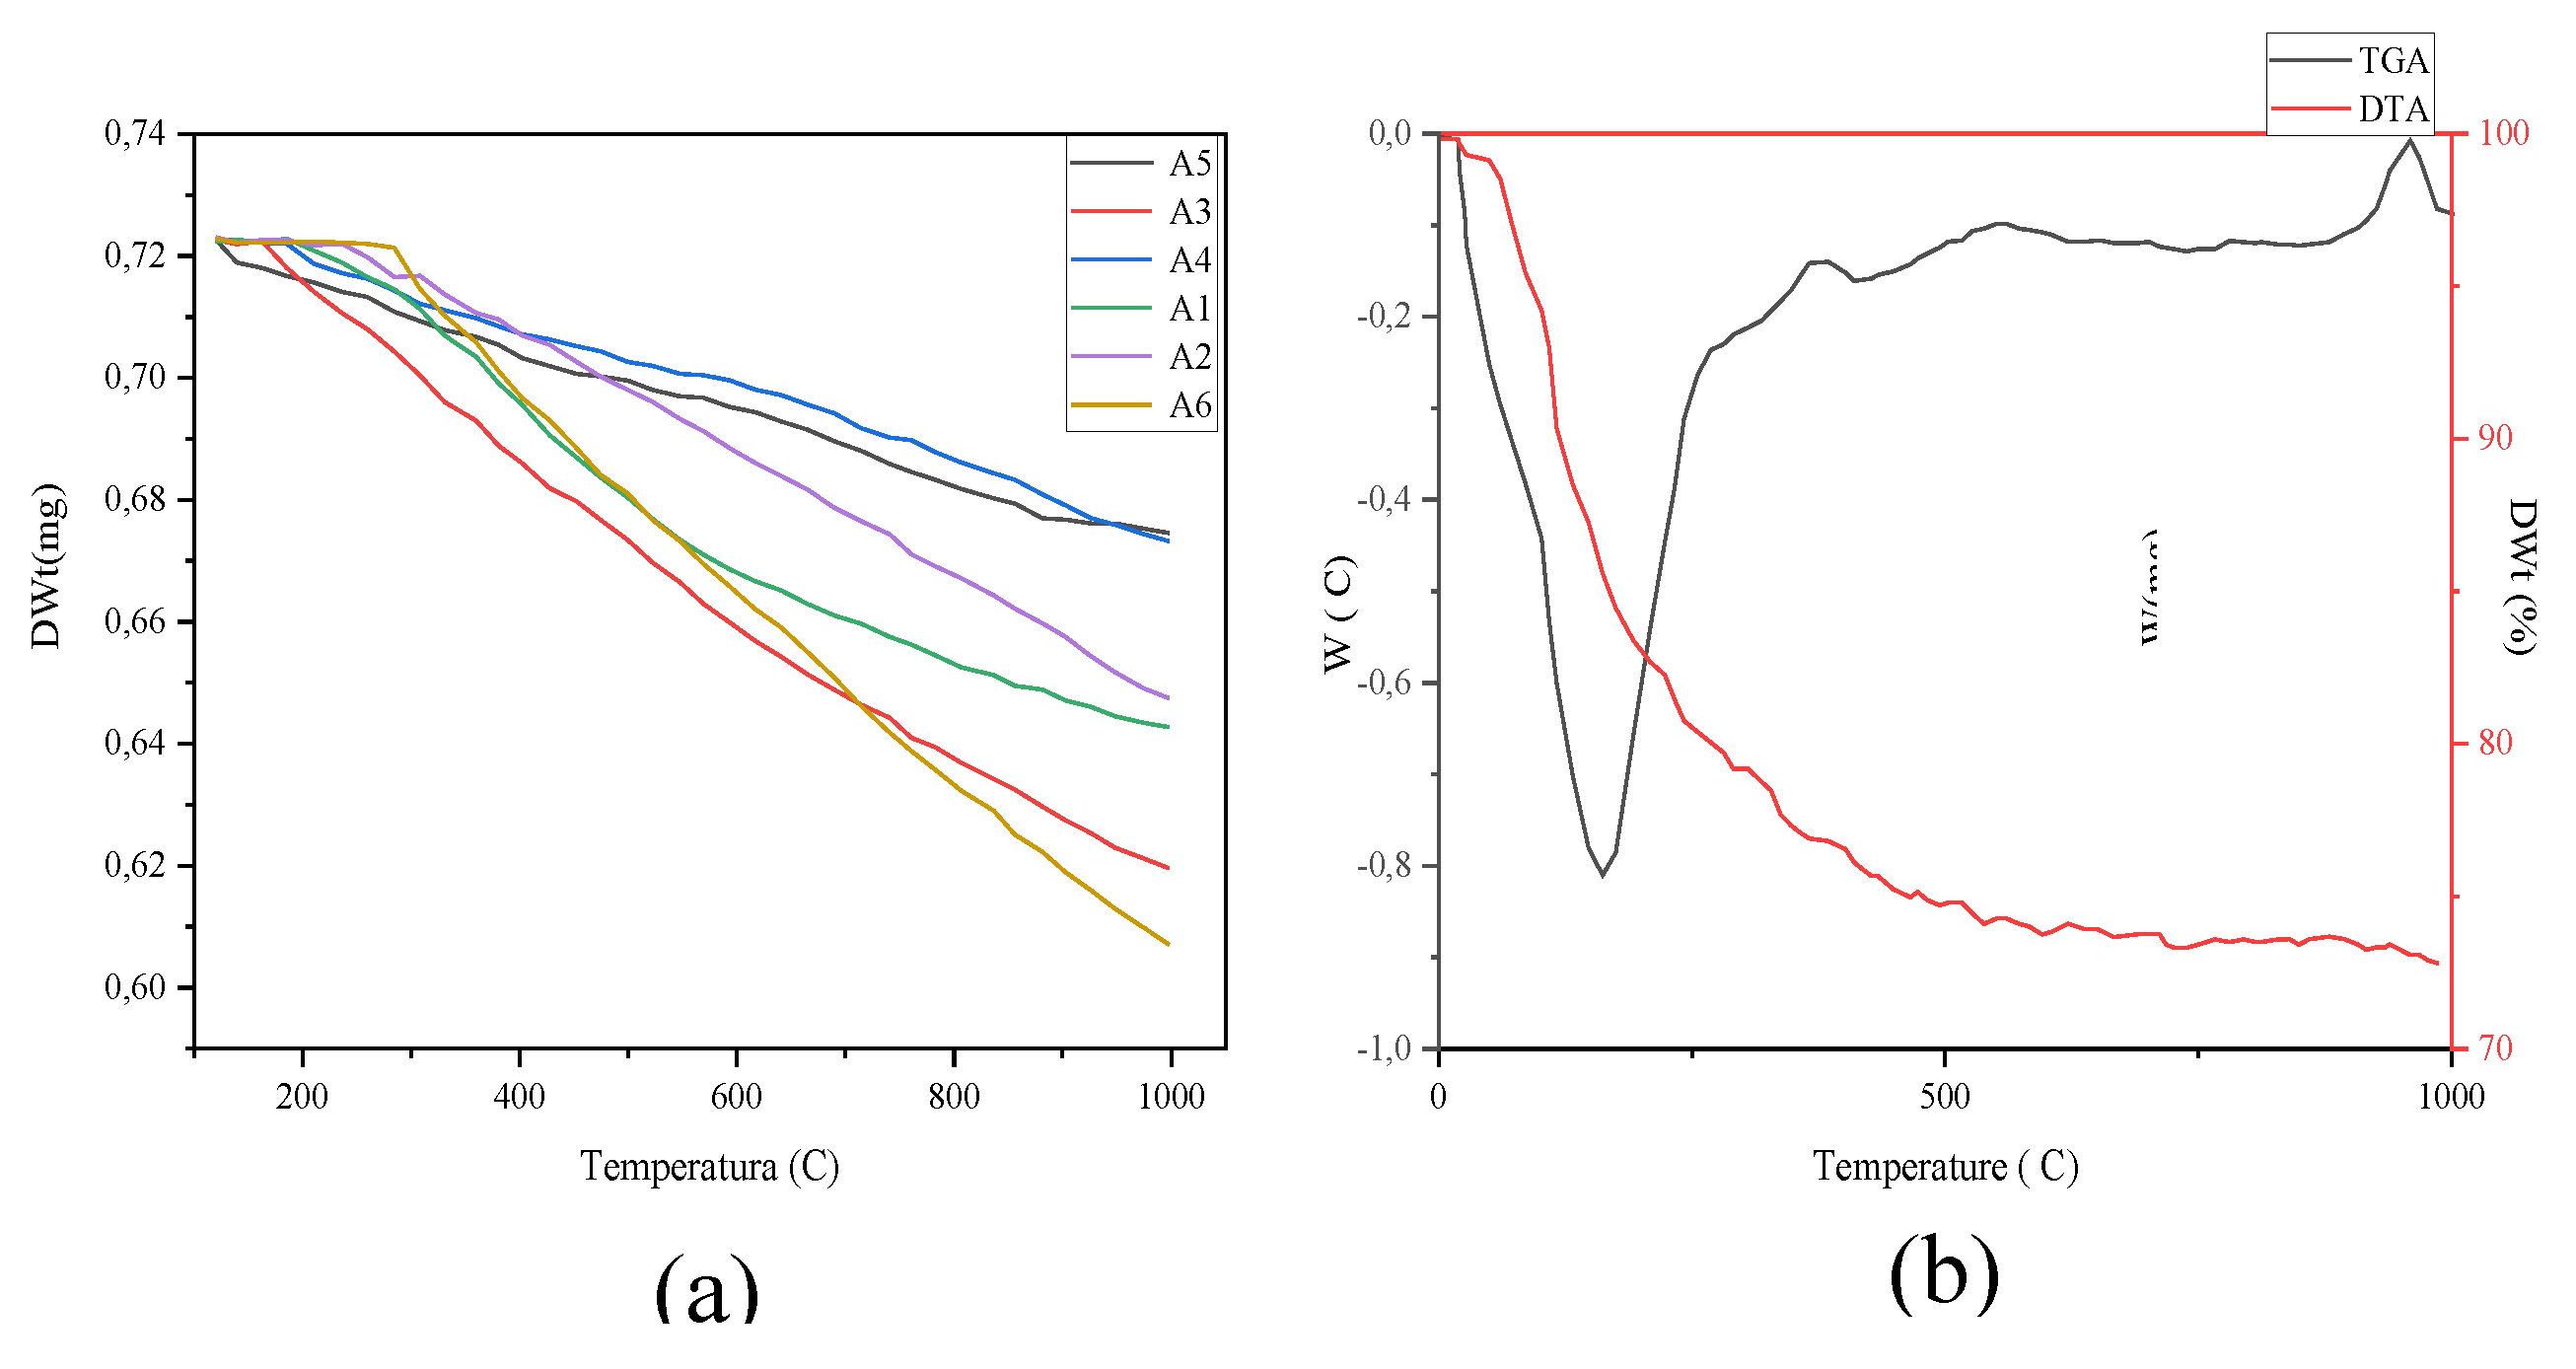
Additional samples were examined at level A1 with thermogravimetry, thus, the TGA measured the loss of mass due to the volatilization of certain constituent elements of oxygen, hydrogen and carbon, when the temperature gradually up to 1000 °C, the thermal behavior of clays of levels A1-A6 (Figure 4a), are variable, since they are constituted by silicon and aluminum oxides in different chemical composition and additional amorphous materials (50). Table 2 shows the results of the decrease in mass, which corresponds to the removal of organic and inorganic matter in gas manifestations of O2, H2, C and nanoparticles in suspension (51).
The Table 2 above presents the weights Wt(g) of each sample analyzed, corresponding a) name of the stratum, b) mass at time zero to, c) total mass lost at tf, d) remaining mass at tf and e) the percentage of total loss. The sample A1 lost the most mass in the order of 42.5 %. Samples A1, A2 and A3 showed higher mass losses and generated appreciable amounts of highly volatile particles that are emitted from the equipment chamber in the calcination process into the atmosphere (very fine nano-sized particles). At high temperatures above 850 °C, curves A1, A2, A3, A4 and A5 (clays) show an exothermic peak value and A6 (halloysite) had an additional loss of mass and the formation of spicules at 1000 °C (52). The high mass loss corresponds to the elimination of moisture from the sample, organic matter, hydroxyls, destruction of the structure and volatilization (53).
Thermogravimetric differential analysis (DTG) determined a thermal variability in the calcined samples during the gradual loss of their respective masses.
This phenomenon showed the endothermic and exothermic changes that gave rise to an oscillatory behavior of the results, contrasted in Table 3a, whose data are a) Initial temperature of the loss (to) and b) mean endothermic temperatures (tm), in the calcination process at 1000 °C (39).
The tabulated data (to (°C)) refers to the temperature at which the loss of the first tenth of a milligram of mass (0.0001 g) occurred; the minimum temperature value to, was recorded for the A5 level at 167 °C and the highest of A6 at 258 °C; verifying that A6 corresponds to halloysite and chemically it is a hydroxylated aluminosilicates (Al, 20.90 %; Si, 21.76 %; H2, 1.56 %).
In the differential analysis of the TGA data, they presented positive and negative inflections that denote the thermal variations and the speed of loss of mass as a function of time (thermal variability)(40,50). Table 3b shows the calcination of samples of the 6 levels A1-A6 (a) start of mass loss, (b) in process and (c) total; disaggregated in columns (x) parameter of mass loss in magnitude and (y) in percentage of loss until reaching 100 %. Significant mass losses were also attributed to volatile particles not affected by gravity, and abandoned the solid; Another element is carried out by high temperatures that affect its molecular structure and the chemical reorganization of tetrahedra, octahedra in new minerals, as the pillars disappear, e.g. Ca +, Na + or Mg+ (54). At temperatures above 350 °C, the structural pillars begin to oscillate significantly and above 500 °C there is a collapse and destruction of the laminar structure indicated above(55,56). Increasing the temperature to a maximum value of 1000 °C, the samples reached the highest number of endothermic points registered in the number of 5 was A1, followed by samples A2, A4 and A5 in the number of 4. For the sample A1, it was determined that the low inflection points (endothermic) were 328 °C, 544 °C, 656 °C and 723 °C; and high points, exothermic 476 °C, 679 °C and 948 °C, additionally showing a high capacity to break down (disintegrate) its mass by thermal action exerted on it, in smaller particles (40); additionally, thermal behavior patterns were defined for each clay and it was noted that controlled calcination collaborated directly with the disintegration and monomodal disaggregation of this type of mineral.
The DSC indicates the behavior of thermal changes in each sample that influence molecular and nanometric terms (10-9 m) Figure 4b shows the result of the A1 level sample, calcined at 20 °C to 1000 °C (57), which showed endothermic and exothermic behavior; the most important points observed were: a) the loss of mass began at the temperature of 178 °C under endothermic conditions, b) between 380 °C and 555 °C the elimination of organic matter and hydroxyl (OH) was corroborated, c ) at 956 °C spicules were formed in a process of diagenesis of the mineral, under exothermic conditions (58). The first endothermic manifestation generated a loss of mass of approximately 13.2 % (Table 3b). The second result corresponded to the expulsion of water from the network and the destruction of the interlaminar structure, which led to a cumulative loss of 36.8 %, and the total loss amounted to 42.5 %. The samples of the other levels are tabulated in the same table.
7.-Evaluation of the Atmospheric Adsorption capacity of samples A1-A6
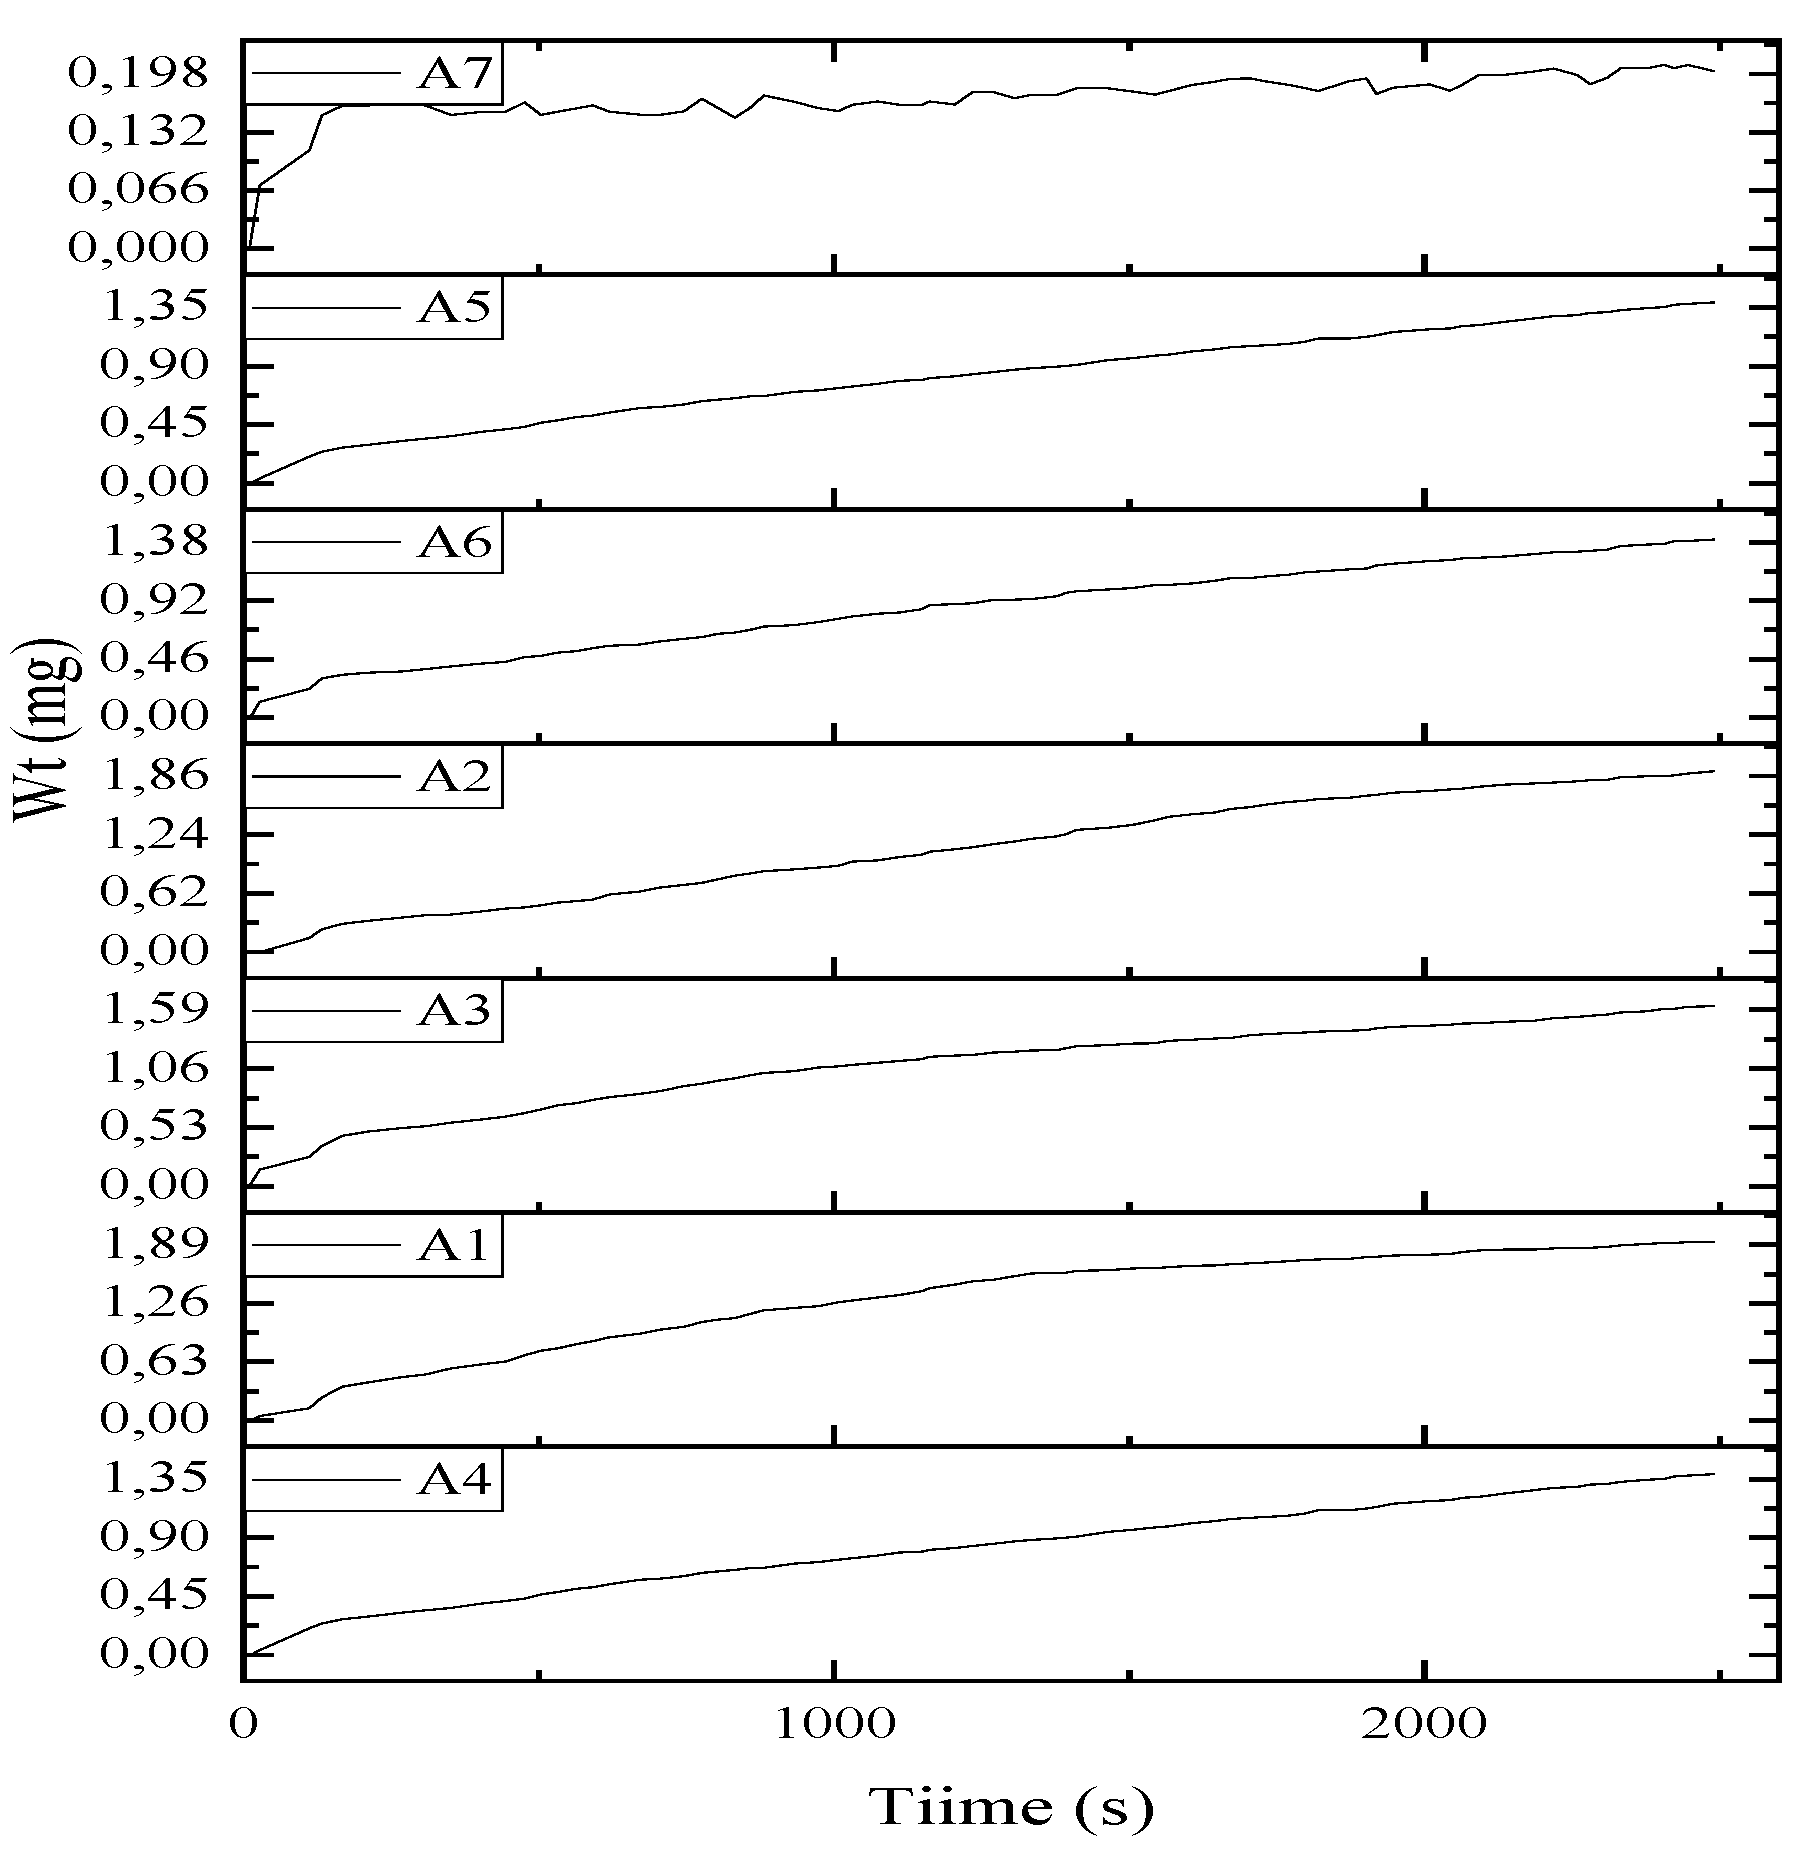
Additionally, the Atmospheric Adsorption test (41), was performed at all 6 levels, including halloysite (A1-A6). The calcination temperature was controlled to a maximum of 325 °C, and then it was left to rest in the air and the team measured the results that are in Figure 5. The samples of levels A1, A2 and A3 gained more mass, and their adsorption power was higher, which meant the capture of hydrogen and oxygen atoms, thus resuming the integration of hydroxyl and molecular water in its structure (59). It was then possible to observe the thermal behavior versus the adsorption of H2, O2, OH and H2O in the clayey lamellar structure. This compulsory hydration behavior of the mineral after its set heating can also be exploited and used as a mobile for integration with other organic or polymeric materials. Thus, it is also noted that the hydration process is superficial and interlaminar, considering that at this temperature the pillaring ions did not undergo major alteration and therefore only the elimination of H2O and OH. At higher temperatures, that is to say 475 °C the texture of the clays changed, which meant the destruction of the pillars (Na+, Fe2+, Mg2+, Li+ ions) of the structures (Si-Al-Si). Samples from layers A4, and A5 presented a low adsorption index (60).
A further development in research in this line may allow developing economic methods of integrating this type of volcanic clays as filling and modification of new material calcinations based on thermal excitation (52,61–63).
The high swelling capacity, and interaction with organic compounds and H2O, is of additional investigative interest in subsequent studies from the point of view of calorimetry, taking advantage of discovering new ways in the integration of these example added to polymers and asphalt (40).
For sample A1, the property of specific surface area (AES) obtained with the BET tests had a direct relationship with the evaluated adsorption capacity, thus, a clay with high AES is exposed to a great extent and can be contacted with substances. of your environment. In the TGA-DCS test, A1 was calcined, and an episode of accelerated mass loss occurred, above the nominal temperature (325 °C, beginning of the collapse of the clayey structure). An additional sample A1 was calcined at 1000 °C, the result of which was sample A7; This clay underwent expected structural changes (the tetrahedral and octahedral structures were eliminated) and, in the Adsorption test, it showed a total decrease in its capacity (99.117) (74.92).
There is a great opportunity to try exfoliating this calcined clayey additive under control (at temperatures between 250 °C and 300 °C), with a hot mix asphalt, where its cohesive clayey structure and only the organic matter has been removed from it. The ionic exchange potential is characteristic of aluminosilicates (Al2 SiO3), and equally when it is added to another material. These parameters must be explored with multiple laboratory tests and the existing experience in this matter, to define an intelligent way to successfully integrate the organic molecules of polymers or bitumen into the nanoclay.

3.2. Application

Consequently, to the important nanometric and thermal properties found in these materials, it is necessary to deepen the knowledge on such benefits. It is then possible to integrate this nanoparticulate material (from Ecuador) by preparing it thermally and then integrate it with chains (H-C) of hydrocarbons, which is to say asphalt, by means of exfoliation processes, dispersion by means of high-shear mixing and complementary shear. Then there is e.g. the hope and possibility of generating atomic interactions of the aggregate with the polymers or substances involved.

4. Conclusion

The study carried out allowed us to know the properties of the existing clays in Ecuador, with an area of approximately 4000 km2, which constitute reserves of the material that can be industrialized, depending on their chemical and nanometric properties and economic factors. 6 samples (A1 - A6) were characterized by applying the following methods: FTIR, XRD, FRX, SEM, BET, Laser Granulometry, SPECMIN, TSG, TGA, DTG, DSC and Atmospheric Adsorption. The FTIR revealed vibration peaks for the elements 3249.66 cm-1 corresponds to the possibility of the existence of OH groups of the Si-OH and Al-OH structures. XRD determined the presence of allophane with quartz at 2θ = 28.15° and 18.65° with non-crystalline material (presence of silicates and alumina). The FRX reflected that 60% by mass are aluminosilicate materials, with respect to 100%; the other fractions in lower magnitudes were found from the chemical elements of Fe, Na, Ca, Ti, Mg, K, Mn, P and S. The SEM allowed to determine accumulations of particles with a diameter of 152.67 nm and 243.74 nm. With the BET, the particle size was measured between 30 to 250 nm, and the SSA, property measured the specific surface area at 280.38 m2/g. With SPECMIN-TSG the Chip Rock (natural clay) was evaluated, it was treated with H2O2 or NaOH or NH3, however its radiogram response was adjusted, with the standard spectra of vermiculite, allophane and bentonite. With thermogravimetry (TGA), a sample of A1 clay was calcined at 1000 °C, generating the mass loss around 40%, corresponding to organic matter, hydroxyls (OH) and destruction of the atomic structure, loss of gases and elements. With the DSC the loss of mass began at the temperature of 178 °C under endothermic conditions; between 380 °C and 555 °C the elimination of organic matter and hydroxyl (OH) was corroborated, and at 956 °C spicules were formed in a process of diagenesis of the mineral, under exothermic conditions. In addition, it was found that it is a nanoparticulate material, it has a high adsorption capacity. At temperatures above 350 °C, its clayey structure collapsed. In Figure 5 the totally inert behaviour of the A7 sample was observed, after the clay was calcined at 1000 °C, its low adsorption capacity only retained 0.198 mg in a time of 2500 seconds, demonstrating the total collapse of its clayey structure. Under similar conditions, sample A1 captured 1.89 mg, which represents the upper 954.5%. Therefore, this clay is a nanometric material and could be integrated with other materials to generate new elements. The immediate application of this previously synthesized nanoclay can modify the local asphalt AC-20.

Author Contributions

The Conceptualization, Bladimir Ceron; methodology, Bladimir Ceron y Giovanni Saenz; software, Bladimir Ceron and Maria Jose Ceron; validation, Giovanni Saenz; formal analysis, Bladimir Ceron and Giovanni Saenz; investigation, Bladimir Ceron; resources, Bladimir Ceron; data curation, Bladimir Ceron and Cristian Lemos; writing—original draft preparation, Bladimir Ceron.; writing—review and editing, Bladimir Ceron, Marcelo Salvador and Giovanni Saenz; visualization, Bladimir Ceron; supervision, Giovanni Saenz and Guillermo Loria; project administration, Bladimir Ceron; funding acquisition, Bladimir Ceron. All authors have read and agreed to the published version of the manu-script.

Funding

The National Polytechnic School has collaborated with the laboratories and salary of the researcher and the National University of Costa Rica will finance its publication. The research is developed under the doctoral project of the Docinade de Costa Rica. The Polytechnic School of the Army and the Ministry of Public Works and Transportation of Ecuador collaborated with additional Laboratories

Data Availability Statement

In this section, please provide details regarding where data supporting reported results can be found, including links to publicly archived datasets analyzed or generated during the study. Please refer to suggested Data Availability Statements in section “MDPI Research Data Policies” at https://www.mdpi.com/ethics. If the study did not report any data, you might add “Not applicable” here.

Acknowledgments

To the National University of Costa Rica for the DOCINADE Doctoral Program; the National Polytechnic School, for facilitating laboratories, support and facilities in Quito, Ecuador; to the University of Isaac Newton, for the Tutor in Research; to the National University of Costa Rica, for reviewing the document. To the different Co-authors and Collaborators of the Investigative Team, who gave their contribution along the way.

Conflicts of Interest

The authors declare no conflict of interest; the funders had no role in the design of the study; in the collection, analyses, or interpretation of data; in the writing of the manuscript; or in the decision to publish the results.

References

  1. Hunt, A. The Oxford handbook of archaeological ceramic analysis. 2017 [cited 2022 Dec 3]; Available from: https://books.google.com.ec/books?hl=es&lr=&id=RQ-DDQAAQBAJ&oi=fnd&pg=PP1&dq=The+Oxford+Handbook+of+Archaeological+Ceramic+Analysis+-+Google+Libros+%5BInternet%5D.+%5Bcited+2022+Nov+30%5D.+Available+from:+https://books.google.es/books%3Fhl%3Des%26lr%3D%26id%3DRQ-DDQAAQBAJ%26oi%3Dfnd%26pg%3DPA148%26dq%3Dclay,%2B%2Braw%2Bmaterial%2Bfor%2Bthe%2Belaboration%2Bof%2Bvarious%2Belements,%2B&ots=jsHe9Rcr-W&sig=tKsqEhJMx6uf-Pq9zhAdA4MnBC4.
  2. Ross, C.S.; Shannon, E.v. THE MINERALS OF BENTONITE AND RELATED CLAYS AND THEIR PHYSICAL PROPERTIES1. Journal of the American Ceramic Society 1926, 9, 77–96, Available from: https://onlinelibrary.wiley.co. [Google Scholar] [CrossRef]
  3. Bergaya, F.; Beneke, K.; Lagaly, G. History and Perspectives of Clay Science.
  4. Jozanikohan, G.; Sahabi, F.; Hossain Norouzi, G.; Memarian, H. Thermal Analysis: A Complementary Method to Study the Shurijeh Clay Minerals. Int J Min & Geo-Eng. 2015, 49, 33–45. [Google Scholar]
  5. Grim, R.E. Clay Mineralogy. Science (1979). 1962, 135, 890–8, Available from: https://www.science.or. [Google Scholar] [CrossRef] [PubMed]
  6. Ross, C.S.; Kerr, P.F. The clay minerals and their identity. Journal of Sedimentary Research 1931, 1, 55–65. [Google Scholar]
  7. Gruner, J.W. The Crystal Structure of Kaolinite. Z Kristallogr Cryst Mater. 1932, 83, 75–88, Available from: https://www.degruyter.com/documen. [Google Scholar] [CrossRef]
  8. Insley H, of REJ of R of the NB, 1935 undefined. Thermal behavior of the kaolin minerals. nvlpubs.nist.gov 1935, 14. Available from: http://nvlpubs.nist.gov/nistpubs/jres/14/jresv14n5p615_A1b.pdf. [Google Scholar]
  9. Shaw, B.T. The nature of colloidal clay as reve aled by the electron microscope. Journal of Physical Chemistry 1942, 46, 1032–43, Available from: https://pubs.acs.or. [Google Scholar] [CrossRef]
  10. Grim, R.E.; Bradley, W.F. A UNIQUE CLAY FROM THE GOOSE LAKE, ILLINOIS, AREA. Journal of the American Ceramic Society 1939, 22, 157–64, Available from: https://www.researchgate.net/publication/229994475_A_unique_clay_from_the_Goose_Lake_Illinois_area. [Google Scholar] [CrossRef]
  11. Jordan, J.W. Organophilic bentonites. I: Swelling in organic liquids. Journal of Physical and Colloid Chemistry 1949, 53, 294–306, Available from: https://pubs.acs.or. [Google Scholar] [CrossRef]
  12. Richardson, L.L. Use of bleaching, clays, in processing edible oils. Journal of the American Oil Chemists’ Society 1978, 55, 777–80, Available from: https://link.springer.com/article/10.1007/BF02682647. [Google Scholar] [CrossRef]
  13. Chauhan, R.S.; Chaturvedi, R.; Gutch, P.K. Polymer-clay Nano Composites. Def Sci, J. 2006, 56, 649. [Google Scholar] [CrossRef]
  14. Kojima, Y.; Usuki, A.; Kawasumi, M.; Okada, A.; Kurauchi, T.; Kamigaito, O. Synthesis of nylon 6–clay hybrid by montmorillonite intercalated with ϵ-caprolactam. J Polym Sci A Polym Chem 1993, 31, 983–6, Available from: https://onlinelibrary.wiley.co. [Google Scholar] [CrossRef]
  15. Lepoittevin, B.; Devalckenaere, M.; Pantoustier, N.; Alexandre, M.; Kubies, D.; Calberg, C.; et al. Poly (ε-caprolactone)/clay nanocomposites prepared by melt intercalation: mechanical, thermal and rheological properties. Elsevier 2002, 43. Available from: https://www.sciencedirect.com/science/article/pii/S003238610200229X. [Google Scholar] [CrossRef]
  16. Deshmane, C.; Yuan, Q. , … RPMS and, 2007 undefined. On striking variation in impact toughness of polyethylene–clay and polypropylene–clay nanocomposite systems: the effect of clay–polymer interaction. Elsevier [cited 2022 Dec 1]; Available online: https://www.sciencedirect.com/science/article/pii/S0921509306027183.
  17. Kaufhold, S.; Ufer, K.; Kaufhold, A.; Stucki, J.W.; Anastácio, A.S.; Jahn, R.; et al. Quantification of Allophane from Ecuador. Clays and Clay Minerals 2010, 58, 707–16, Available from: https://link.springer.com/article/10.1346/CCMN.2010.0580509. [Google Scholar] [CrossRef]
  18. EBSCOhost | 54292474 | ENGINEERING PROPERTIES OF NANOCLAY MODIFIED ASPHALT CONCRETE MIXTURES. [Internet]. [cited 2022 Dec 1]. Available online: https://web.p.ebscohost.com/abstract?direct=true&profile=ehost&scope=site&authtype=crawler&jrnl=2193567X&asa=Y&AN=54292474&h=W6omaecdNYnpwIFB3%2fW4riTg%2bUGgqBCwmoeEAfZEI87M5OBOXlt%2bpI7LXD8IbpR%2bME7VUz%2fppQgk%2bxGusTcZEw%3d%3d&crl=c&resultNs=AdminWebAuth&resultLocal=ErrCrlNotAuth&crlhashurl=login.aspx%3fdirect%3dtrue%26profile%3dehost%26scope%3dsite%26authtype%3dcrawler%26jrnl%3d2193567X%26asa%3dY%26AN%3d54292474.
  19. Sangeetha, V.H.; Deka, H.; Varghese, T.O.; Nayak, S.K. State of the art and future prospectives of poly(lactic acid) based blends and composites. Polym Compos 2018, 39, 81–101, Available from: https://onlinelibrary.wiley.co. [Google Scholar] [CrossRef]
  20. Yang, J.; Tighe, S. A Review of Advances of Nanotechnology in Asphalt Mixtures. Procedia Soc Behav Sci. 2013, 96, 1269–76. [Google Scholar] [CrossRef]
  21. Martinho, F.C.G.; Farinha, J.P.S. An overview of the use of nanoclay modified bitumen in asphalt mixtures for enhanced flexible pavement performances. Road Materials and Pavement Design. 2019, 20, 671–701. [Google Scholar] [CrossRef]
  22. Kaufhold, S.; Kaufhold, A.; Jahn, R.; Brito, S.; Dohrmann, R.; Hoffmann, R.; et al. A New Massive Deposit of Allophane Raw Material in Ecuador. Clays Clay Miner. 2009, 57, 72–81. [Google Scholar] [CrossRef]
  23. Clay Minerals in Nature: Their Characterization, Modification and Application - Google Libros [Internet]. [cited 2022 Dec 1]. Available online: https://books.google.com.ec/books?hl=es&lr=&id=S9mgDwAAQBAJ&oi=fnd&pg=PR11&dq=Kaolinites,+Montmorillonites,+Illites+and+Chlorites,+and+their+subdivisions&ots=s6jEafivA0&sig=H0FGP1KpNwgM0PhNt83vpUjBzRs#v=onepage&q&f=false.
  24. Neall, VE. VOLCANIC SOILS.
  25. Schaming, D.; Remita, H. Nanotechnology: from the ancient time to nowadays. Foundations of Chemistry 2015, 17, 187–205, Available from: https://link.springer.com/article/10.1007/s10698-015-9235-y. [Google Scholar] [CrossRef]
  26. Mendoza, R.; Espinoza, A. Guía Técnica para muestreo de suelos. Asa Available online: https://core.ac.uk/download/pdf/151729876.pdf%0Ahttp://repositorio.una.edu.ni/3613/1/P33M539.pdf. 2017, 13–21. [Google Scholar]
  27. Kaufhold, S.; Ufer, K.; Kaufhold, A.; Stucki, J.W.; Anastácio, A.S.; Jahn, R.; et al. Quantification of allophane from Ecuador. Clays Clay Miner. 2010, 58, 707–16. [Google Scholar] [CrossRef]
  28. Mondragón, R.; Juliá, J.E.; Barba, A.; Jarque, J.C. Preparación y caracterización de nanofluidos: Influencia de variables sobre su estabilidad, estado de aglomeración y propiedades físicas. Boletin de la Sociedad Espanola de Ceramica y Vidrio. 2014, 53, 101–10. [Google Scholar] [CrossRef]
  29. el Hafid, K.; Hajjaji, M.; el Hafid, H. Influence of NaOH concentration on microstructure and properties of cured alkali-activated calcined clay. Journal of Building Engineering 2017, 11, 158–65. [Google Scholar] [CrossRef]
  30. Önal, M.; Sarikaya, Y. Some physicochemical properties of a clay containing smectite and palygorskite. Appl Clay Sci. 2009, 44, 161–5. [Google Scholar] [CrossRef]
  31. Mishra, A.; Allauddin, S.; Narayan, R. TAC, 2012 undefined. Characterization of surface-modified montmorillonite nanocomposites. Elsevier [Internet]. [cited 2020 May 23]; Available online: https://www.sciencedirect.com/science/article/pii/S027288421100722X.
  32. Allegretta, I.; Ciasca, B.; Pizzigallo, M.D.R.; Lattanzio, V.M.T.; Terzano, R. A fast method for the chemical analysis of clays by total-reflection x-ray fluorescence spectroscopy (TXRF). Appl Clay Sci. 2019, 180, 105201. [Google Scholar] [CrossRef]
  33. Bohor, B.F.; Hughes, R.E. Scanning electron microscopy of clays and clay minerals. Clays Clay Miner 1971, 19, 49–54, Available from: https://link.springer.com/article/10.1346/CCMN.1971.0190105. [Google Scholar] [CrossRef]
  34. Hatch, C.D.; Wiese, J.S.; Crane, C.C.; Harris, K.J.; Kloss, H.G.; BaltrusaitisJ. Water adsorption on clay minerals as a function of relative humidity: Application of BET and Freundlich adsorption models. Langmuir. 2012, 28, 1790–803. [Google Scholar] [CrossRef]
  35. Dur, J.C.; Elsass, F.; Chaplain, V.; Tessier, D. The relationship between particle-size distribution by laser granulometry and image analysis by transmission electron microscopy in a soil clay fraction. Eur J Soil Sci. 2004, 55, 265–70. [Google Scholar] [CrossRef]
  36. Percival, J.B.; Bosman, S.A.; Potter, E.G.; Peter, J.M.; Laudadio, A.B.; Abraham, A.C.; et al. Customized spectral libraries for effective mineral exploration: Mining national mineral collections. Clays Clay Miner. 2018, 66, 297–314. [Google Scholar] [CrossRef]
  37. Fernando Mac-as-Quiroga, I.; Inés Giraldo-Gómez, G.; Roc-o Sanabria-González, N. Characterization of Colombian Clay and Its Potential Use as Adsorbent. hindawi.com [Internet]. 2018 [cited 2020 May 23]; Available online: https://doi.org/10.1155/2018/5969178. [CrossRef]
  38. Frost, R.L.; Ding, Z. Controlled rate thermal analysis and differential scanning calorimetry of sepiolites and palygorskites [Internet]. Elsevier. 2003 [cited 2020 May 23]. Available online: https://www.sciencedirect.com/science/article/pii/S0040603102002289.
  39. Vyazovkin, S.; Dranca, I. A DSC study of α- and β-relaxations in a PS-clay system. Journal of Physical Chemistry, B. 2004, 108, 11981–7. [Google Scholar] [CrossRef]
  40. Abdullah, M.; Zamhari, K. , … MHJ of C, 2016 undefined. High temperature characteristics of warm mix asphalt mixtures with nanoclay and chemical warm mix asphalt modified binders. Elsevier [Internet]. [cited 2020 Aug 11]; Available online: https://www.sciencedirect.com/science/article/pii/S0959652616001785.
  41. Brunauer, S.; Emmett, P.H.; Teller, E. Adsorption of Gases in Multimolecular Layers. J Am Chem Soc. 1938, 60, 309–19. [Google Scholar] [CrossRef]
  42. Ahmed, A.; Chaker, Y.; Belarbi, E.H.; Abbas, O.; Chotard, J.N.; Abassi, H.B.; et al. XRD and ATR/FTIR investigations of various montmorillonite clays modified by monocationic and dicationic imidazolium ionic liquids. J Mol Struct. 2018, 1173, 653–64. [Google Scholar] [CrossRef]
  43. Nayak, P.S.; Singh, B.K. Instrumental characterization of clay by XRF, XRD and FTIR. Bulletin of Materials Science 2007, 30, 235–8, Available from: https://link.springer.com/article/10.1007/s12034-007-0042-5. [Google Scholar] [CrossRef]
  44. Ural, N. The significance of scanning electron microscopy (SEM) analysis on the microstructure of improved clay: An overview. Open Geosciences 2021, 13, 197–218, Available from: https://www.degruyter.com/documen. [Google Scholar] [CrossRef]
  45. Sagar Nayak, P.; Singh, B.K. Instrumental characterization of clay by XRF, XRD and FTIR. Vol. 30, Bull. Mater. Sci. 2007. [Google Scholar]
  46. Occelli, M.; Olivier, J.; Perdigon-Melon, J.; Langmuir, A.A. 2002 undefined. Surface area, pore volume distribution, and acidity in mesoporous expanded clay catalysts from hybrid density functional theory (DFT) and adsorption microcalorimetry. ACS Publications [Internet]. [cited 2020 May 23]; Available online: https://pubs.acs.org/doi/abs/10.1021/la020567o.
  47. Sears, G.W. Determination of Specific Surface Area of Colloidal Silica by Titration With Sodium Hydroxide. Anal Chem. 1956, 28, 1981–3. [Google Scholar] [CrossRef]
  48. Dur, J.C.; Elsass, F.; Chaplain, V.; Tessier, D. The relationship between particle-size distribution by laser granulometry and image analysis by transmission electron microscopy in a soil clay fraction. Eur J Soil Sci 2004, 55, 265–70, Available from: https://onlinelibrary.wiley.co. [Google Scholar] [CrossRef]
  49. Percival, J.B.; Bosman, S.A.; Potter, E.G.; Peter, J.M.; Laudadio, A.B.; Abraham, A.C.; et al. Customized spectral libraries for effective mineral exploration: Mining national mineral collections. Clays Clay Miner. 2018, 66, 297–314. [Google Scholar] [CrossRef]
  50. Ptáček, P.; Šoukal, F.; Opravil, T.; Havlica, J.; Technology, J.B.P. 2011 undefined. The kinetic analysis of the thermal decomposition of kaolinite by DTG technique. Elsevier [Internet]. [cited 2020 May 23]; Available online: https://www.sciencedirect.com/science/article/pii/S0032591010006273.
  51. Marchuk, A.; Rengasamy, P.; McNeill, A. Influence of organic matter, clay mineralogy, and pH on the effects of CROSS on soil structure is related to the zeta potential of the dispersed clay. Soil Research 2013, 51, 34, Available from: http://www.publish.csiro.au/?paper=SR13012. [Google Scholar] [CrossRef]
  52. Alujas, A.; Fernández, R.; Quintana, R.; Scrivener, K.L.; Martirena, F. Pozzolanic reactivity of low grade kaolinitic clays: Influence of calcination temperature and impact of calcination products on OPC hydration. Applied Clay Science 2015, 108, 94–101. [Google Scholar] [CrossRef]
  53. Viswabaskaran, V.; Gnanam, F.D.; Balasubramanian, M. Mullitisation behaviour of calcined clay-alumina mixtures. Ceram Int. 2003, 29, 561–71. [Google Scholar] [CrossRef]
  54. Todor, D.; Todor, D. Thermal Analysis Of Minerals Dumitru N Todor [Internet]. 1976 [cited 2020 May 23]. Available online: https://pdfs.semanticscholar.org/fe19/5d62df6714083573eb4ab7e4c3bd172fc3cf.pdf.
  55. Duong, L.v. The morphology and structure of intercalated and pillared clays. 2008. [Google Scholar]
  56. Sapag K, and SMC and SAP, 2001 undefined. Synthesis and characterization of micro-mesoporous solids: pillared clays. Elsevier [Internet]. [cited 2020 May 23]; Available online: https://www.sciencedirect.com/science/article/pii/S0927775701006173.
  57. Faı¨za Bergaya F, Lagaly G, Boston A•, Heidelberg •, London •, New •, et al. Handbook of Clay Science Second Edition Techniques and Applications. Handbook of Clay Science: Techniques and Applications [Internet]. 2013 [cited 2020 May 23];5B. Available online: http://dx.doi.org/10.1016/B978-0-08-098259-5.00005-6. 23 May. [CrossRef]
  58. Corazzari, I.; Nisticò, R.; Turci, F. ; … MFPD, 2015 undefined. Advanced physico-chemical characterization of chitosan by means of TGA coupled on-line with FTIR and GCMS: Thermal degradation and water adsorption capacity. Elsevier [Internet]. [cited 2020 Nov 12]; Available online: https://www.sciencedirect.com/science/article/pii/S014139101400439X.
  59. Brindley, G.W.; Robinson, K. The structure of kaolinite. Mineralogical Magazine and Journal of the Mineralogical Society 1946, 27, 242–53, Available from: https://www.cambridge.org/core/journals/mineralogical-magazine-and-journal-of-the-mineralogical-society/article/abs/structure-of-kaolinite/F8F0F9B622878457EB175E3722C8D51F. [Google Scholar] [CrossRef]
  60. Duong, L. The morphology and structure of intercalated and pillared clays. 2008; Available online: http://eprints.qut.edu.au/17707. 1770. [Google Scholar]
  61. Elimbi, A.; Tchakoute, H.K.; Njopwouo, D. Effects of calcination temperature of kaolinite clays on the properties of geopolymer cements. Constr Build Mater. 2011, 25, 2805–12. [Google Scholar] [CrossRef]
  62. Chotoli, F.F.; Quarcioni, V.A.; Lima, S.S.; Ferreira, J.C.; Ferreira, G.M. Clay activation and color modification in reducing calcination process: Development in lab and industrial scale. RILEM Bookseries. 2015, 10, 479–86. [Google Scholar]
  63. Trümer, A.; Ludwig, H.M.; Schellhorn, M.; Diedel, R. Effect of a calcined Westerwald bentonite as supplementary cementitious material on the long-term performance of concrete. Appl Clay Sci 2019, 168, 36–42. [Google Scholar] [CrossRef]
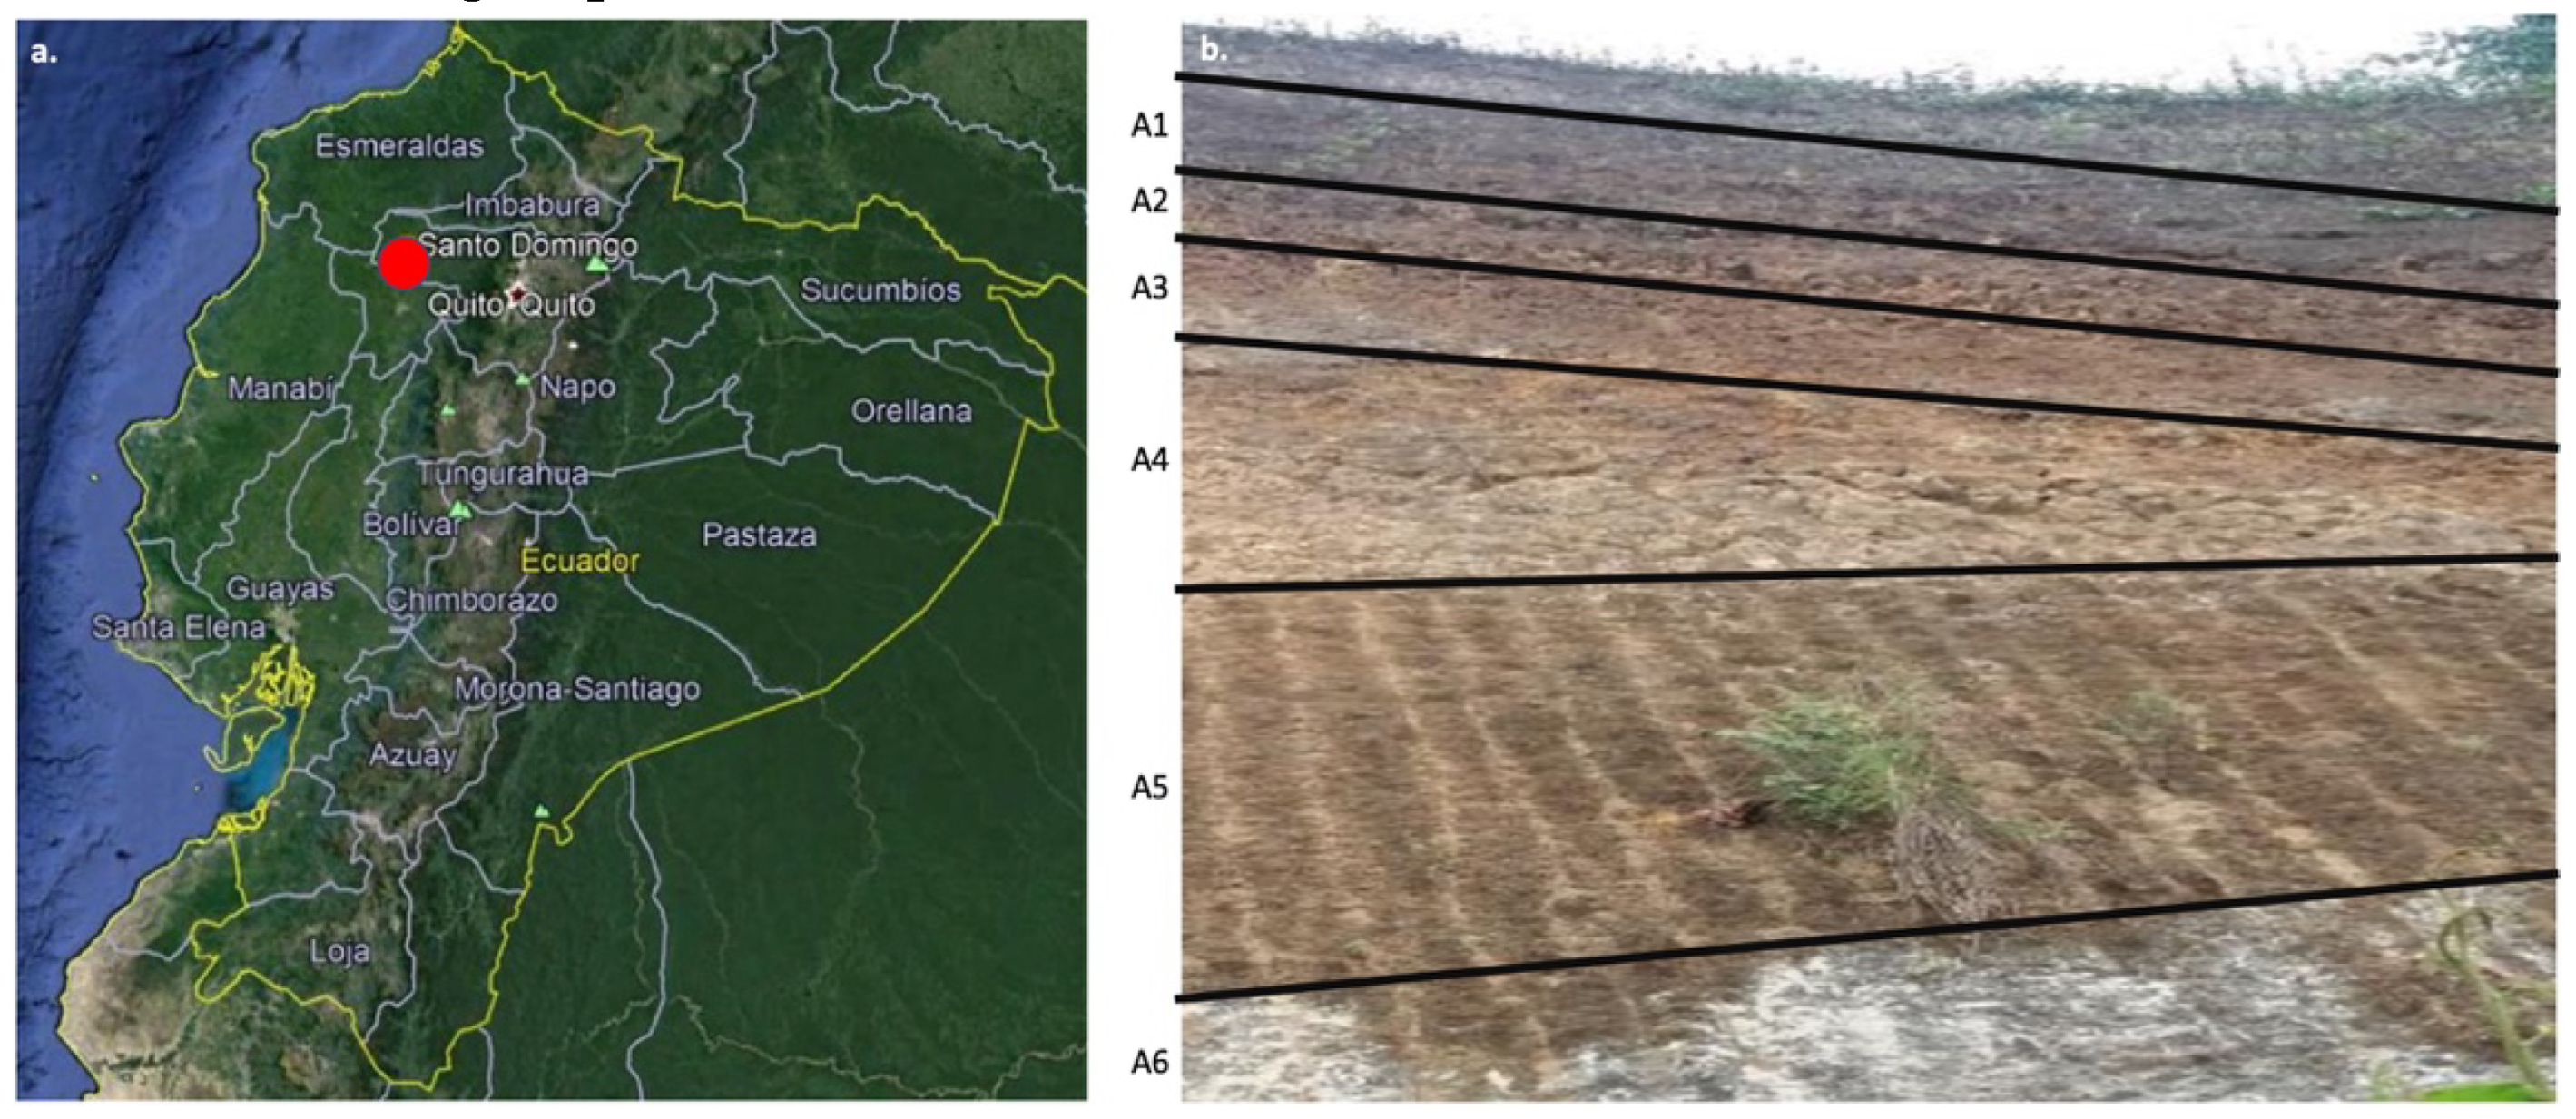
Figure 1. Stratigraphic column of the San Tadeo formation, with clay levels A1-A5 and Halloisite (A6).
Preprints 74598 g001
Figure 2. Spectra of the clay sample in the FTIR, (a) Sample treated with NaOH, (upper); (b) Natural sample, (lower); (c) Diffractogram of a particulate clay sample in the DRX; (d) Image of the particulate clay exposed to the SEM electron microscope.
Preprints 74598 g002
Figure 3. (a) Comparison of the spectrum of allophane and the clay samples treated with AN_NH3, NaOH and pure natural clay, in their order; (b) Comparison with spectrum of Bentonite / Smectite of Montana, Nevada, with pure sediment chip samples treated with NH3 and NaOH.
Preprints 74598 g003
Figure 4. (a) TGA of clay samples A1-A5 and Halloisite (A6); ( b) Thermogram of the particulate clay sample, calcined A1 horizon and evaluated by TGA and DCS.
Preprints 74598 g004
Figure 5. Absorption profiles and weight gain, as a function of time, of samples of levels A1-A6 and A7.
Preprints 74598 g005
Table 1. Data from X-ray Fluorescence analysis results.
Element Sample 1 Sample 2 Sample 3
Si 0,3077 0,3357 0,3246
Al 0,2987 0,3259 0,3151
Fe 0,1186 0,1294 0,1251
Na 0,0316 0,0344 0,0333
Ca 0,0138 0,015 0,0145
Ti 0,0116 0,0127 0,0123
Mg 0,0111 0,0121 0,0117
K 0,0041 0,0045 0,0043
Mn 0,0015 0,0017 0,0016
P 0,0013 0,0014 0,0014
S 0,001 0,0011 0,0011
TOC 0,199 0,126 0,155
Overall 1 1 1
Table 2. TGA results of the clay samples from strata A1 -A5 and Halloisite (A6).
Weight Wt., g
a) b) c) d) e)
A1 0,0722 0,0307 0,0415 42,5%
A2 0,0722 0,0252 0.047 34,9%
A3 0,0722 0,0291 0.0431 40,3%
A4 0,0722 0,0156 0.0566 21,6%
A5 0,0722 0,0171 0.0551 23,7%
A6 0,0722 0,012 0,0602 16,6%
Table 3. (a) Endothermic temperatures of clay samples A1-A6; (b) Data on the thermal variation of mass of the clay samples A1 A5 and halloisite (A6).
(a)
To °C
A1 A2 A3 A4 A5 A6
178 212 192 213 167 258
b) Tm °C
A1 A2 A3 A4 A5 A6
328 339 238 282 347 302
544 578 682 416 701 697
656 800 654 871
723
(b)
a) Initial Wt. @ T °C
Initiation A1 A2 A3
x y x y x y
0.00% 0.00% 0.00%
b) In progress, Wt. @ T°C
A1 A2 A3
13.20% 31.00% 5.40% 15.50% 4.00% 10.00%
29.80% 70.10% 16.90% 48.40% 30.70% 76.30%
36.80% 86.70% 28.10% 80.60%
39.20% 92.20%
c) Overall , Wt. @ T °C
A1 A2 A3
42.50% 100.00% 34.90% 100.00% 40.30% 100.00%
a) Initial, Wt. @ T °C
A4 A5 A6
x y x y x y
0.00% 0.00% 0.00%
b) In progress, Wt. @ T °C
A4 A5 A6
2.20% 10.30% 6.50% 27.50% 1.50% 9.20%
6.00% 27.60% 15.90% 67.20% 10.90% 65.90%
11.60% 53.90% 23.30% 98.20%
c) Overall , Wt. @ T °C
A4 A5 A6
21.60% 100.00% 23.70% 100.00% 16.60% 100.00%
Disclaimer/Publisher’s Note: The statements, opinions and data contained in all publications are solely those of the individual author(s) and contributor(s) and not of MDPI and/or the editor(s). MDPI and/or the editor(s) disclaim responsibility for any injury to people or property resulting from any ideas, methods, instructions or products referred to in the content.
Copyright: This open access article is published under a Creative Commons CC BY 4.0 license, which permit the free download, distribution, and reuse, provided that the author and preprint are cited in any reuse.
Prerpints.org logo

Preprints.org is a free preprint server supported by MDPI in Basel, Switzerland.

Subscribe

© 2024 MDPI (Basel, Switzerland) unless otherwise stated