1. Introduction
External udder conformation has been widely studied in dairy sheep breeds to determine an effect on milk production and the efficiency of machine milking [
1]. Studies have also shown a close relationship between udder conformation and milkability, and that certain conformational traits could be considered for selection to possibly improve milking ability in the future [
2]. For example, among udder conformation, udder depth and length were the most correlated traits to milk production, while deep udders and short teats were related to lower somatic cell counts in Spanish Assaf sheep [
3].
Interestingly, a study in beef cattle showed that beef calves that had difficulty in suckling because of teat conformation and size showed a greater morbidity and mortality [
4]. Furthermore, a study in dairy cattle by Ventorp, M., and Michanek, P. [
5] showed that calves born to cows or heifers with low slung udders cannot be expected to obtain colostrum soon enough by natural suckling resulting in a negative effect on passive immunity and health of the calve [
5].
Different scoring systems have been historically utilized to determine udder conformation in sheep. These scoring systems classify external conformation traits by using simple numerical scales or physical measurements [
1,
6]. Measurements have included udder length, udder width, rear udder depth, udder attachment, cistern depth, teat length, or teat angle.
A study conducted in 2012 was the first that focused on the association between udder conformation and lamb weights in Suffolk ewes by using visual and physical udder measurements [
6]. In that study, udder conformation traits of teat placement, teat lesions, and cross-sectional area of teats were measured two weeks after lambing. It was concluded that teat placement and teat lesions were the only traits associated with lamb weights and that teat conformation in ewes may reduce intramammary infection and increase lamb growth rates [
6].
Nevertheless, external udder conformation and its relationship to colostrum quality and growth rates in lambs has not been extensively studied in meat breeds.
A practical method of visual assessments of udder floor, udder depth, teat placement, teat lesions, and the presence of wool could result in an effective selection method to evaluate external udder conformation in relation to lamb growth rates and colostrum quality. The objective of this study was to determine the relationship between external udder conformation, using visual assessments of external udder, and colostrum quality and lamb growth rates in Suffolk ewes.
2. Materials and Methods
2.1. Animals
All animals, treatments, and procedures were approved by the University of Idaho Animal Care and Use Committee (IACUC 2022-05). All work was conducted at the University of Idaho Sheep Center. This study used 50 Suffolk ewes between 1 and 5 years of age. The ewes were randomly selected from a group of multiparous ewes by selecting the first 50 ewes to lamb twins. External variables such as feed, environment, and management practices were kept consistent to limit variability.
2.2. Experimental Design and Methodology
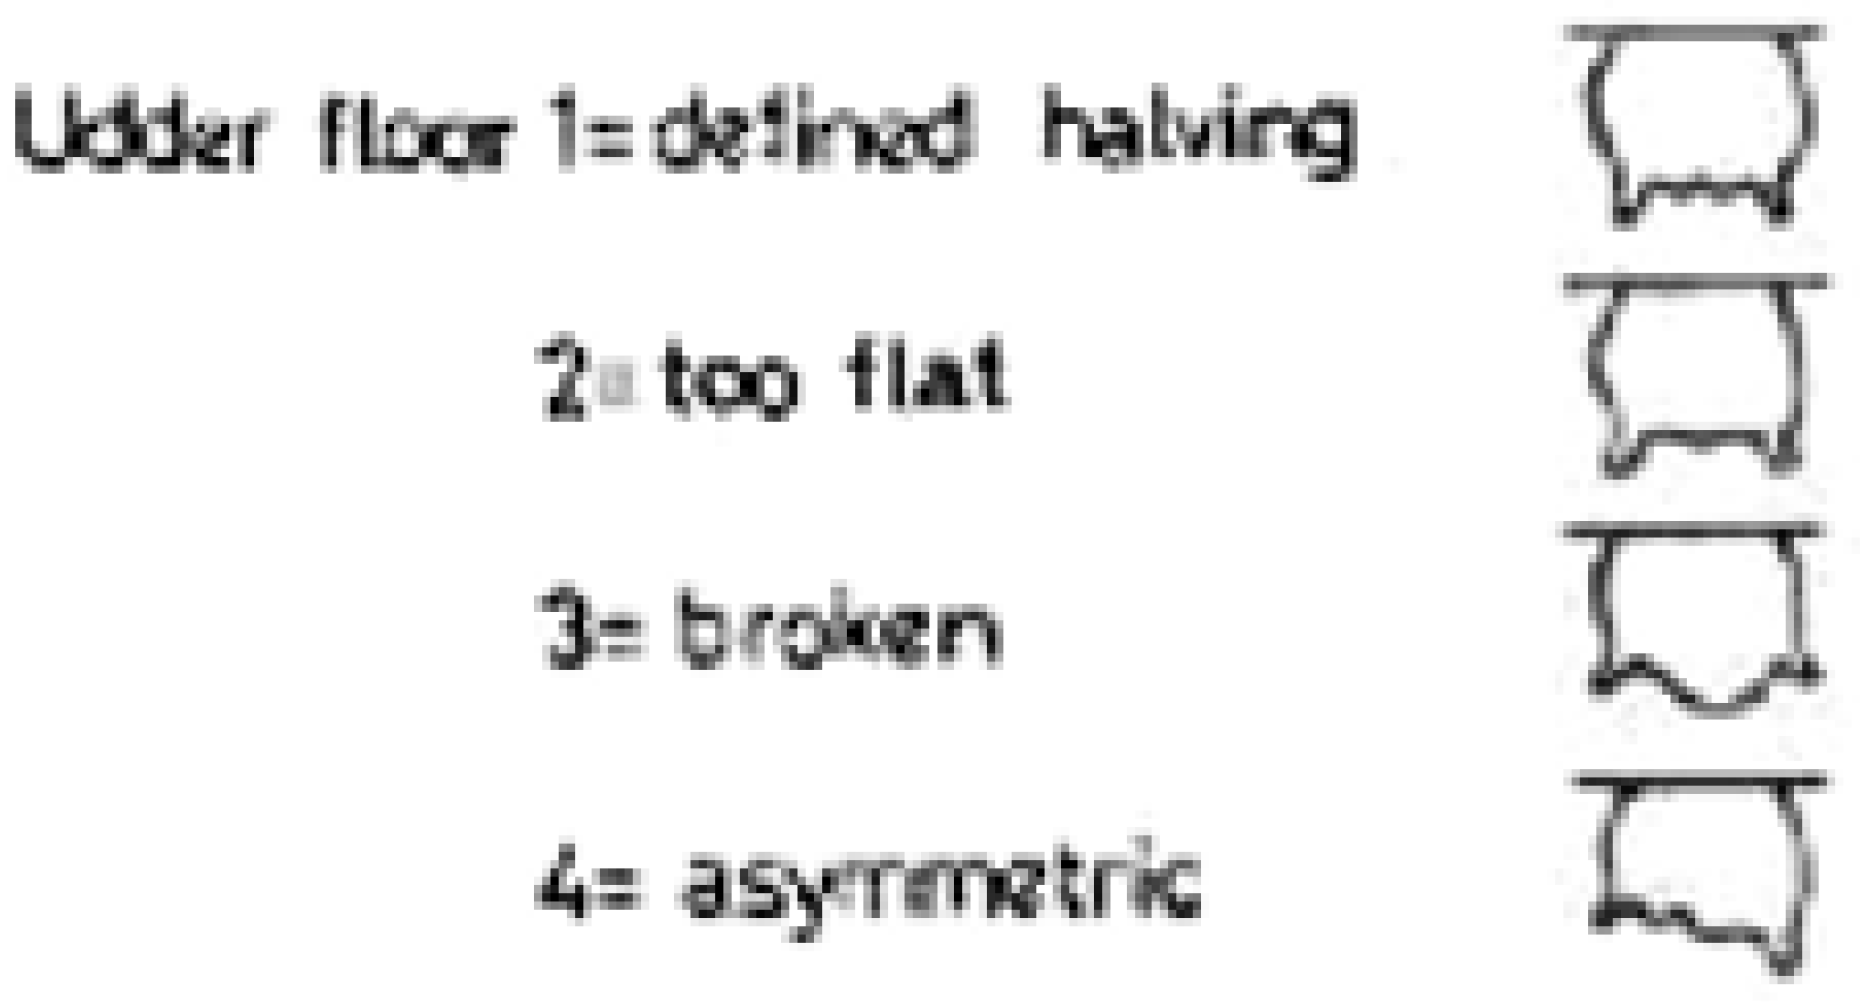
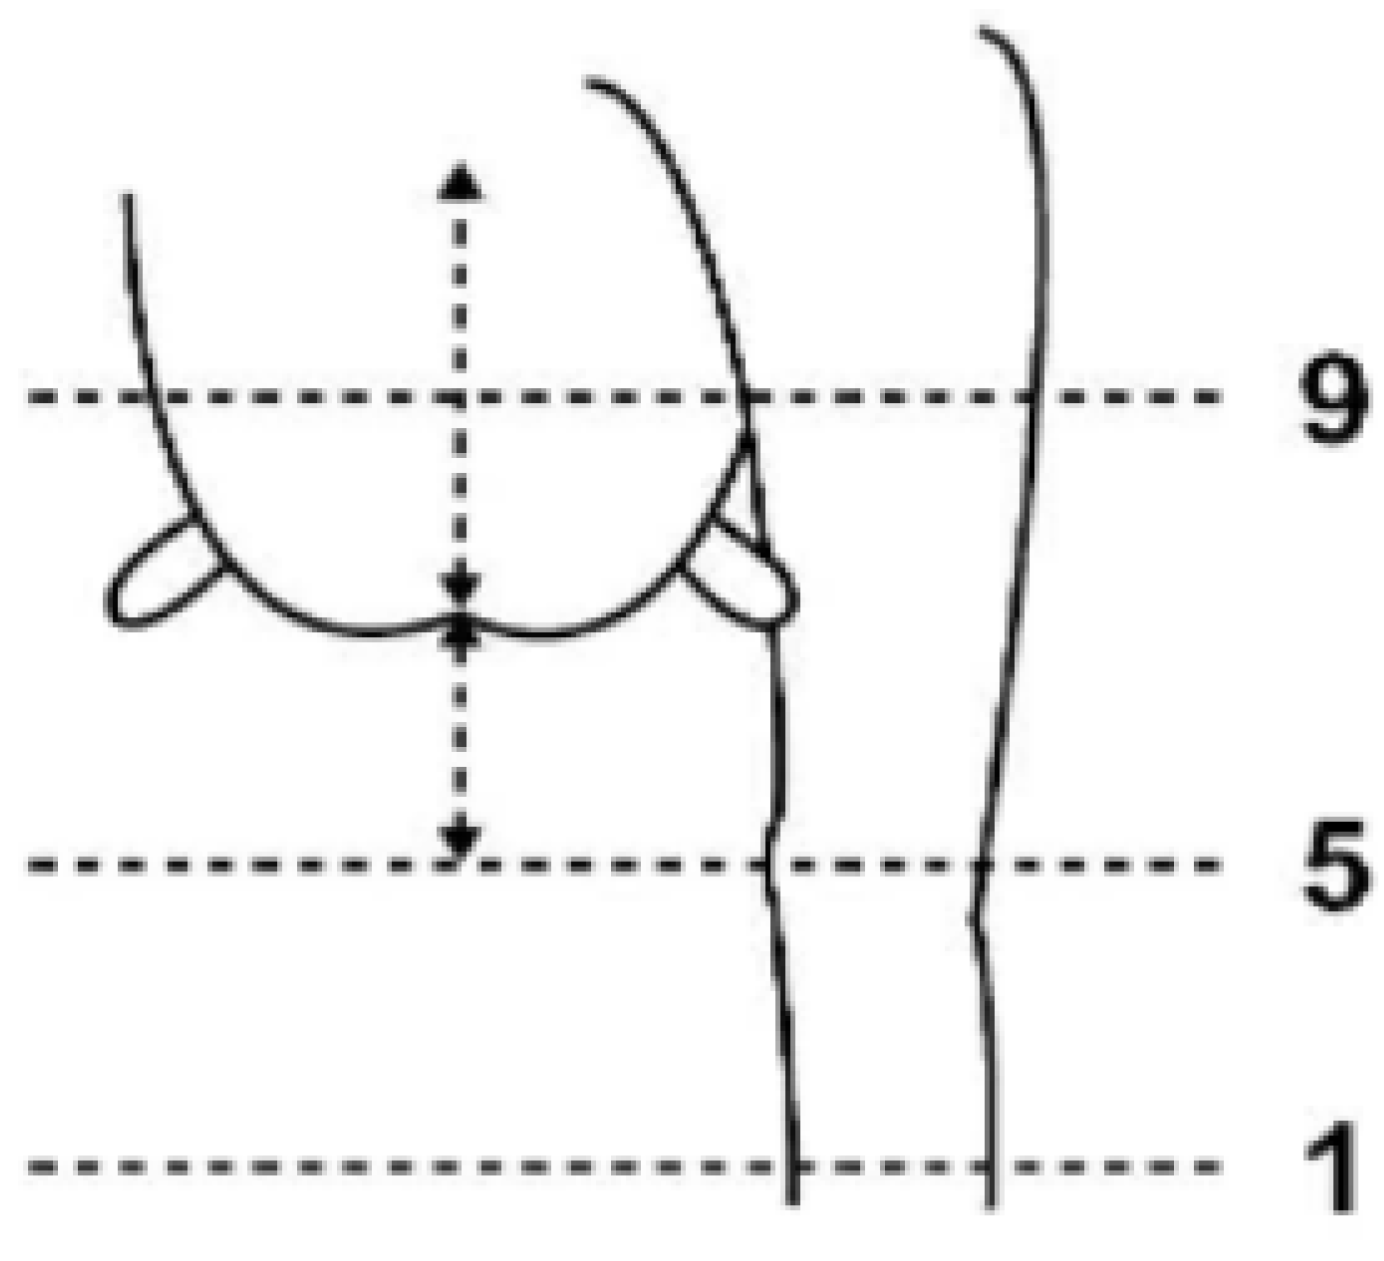
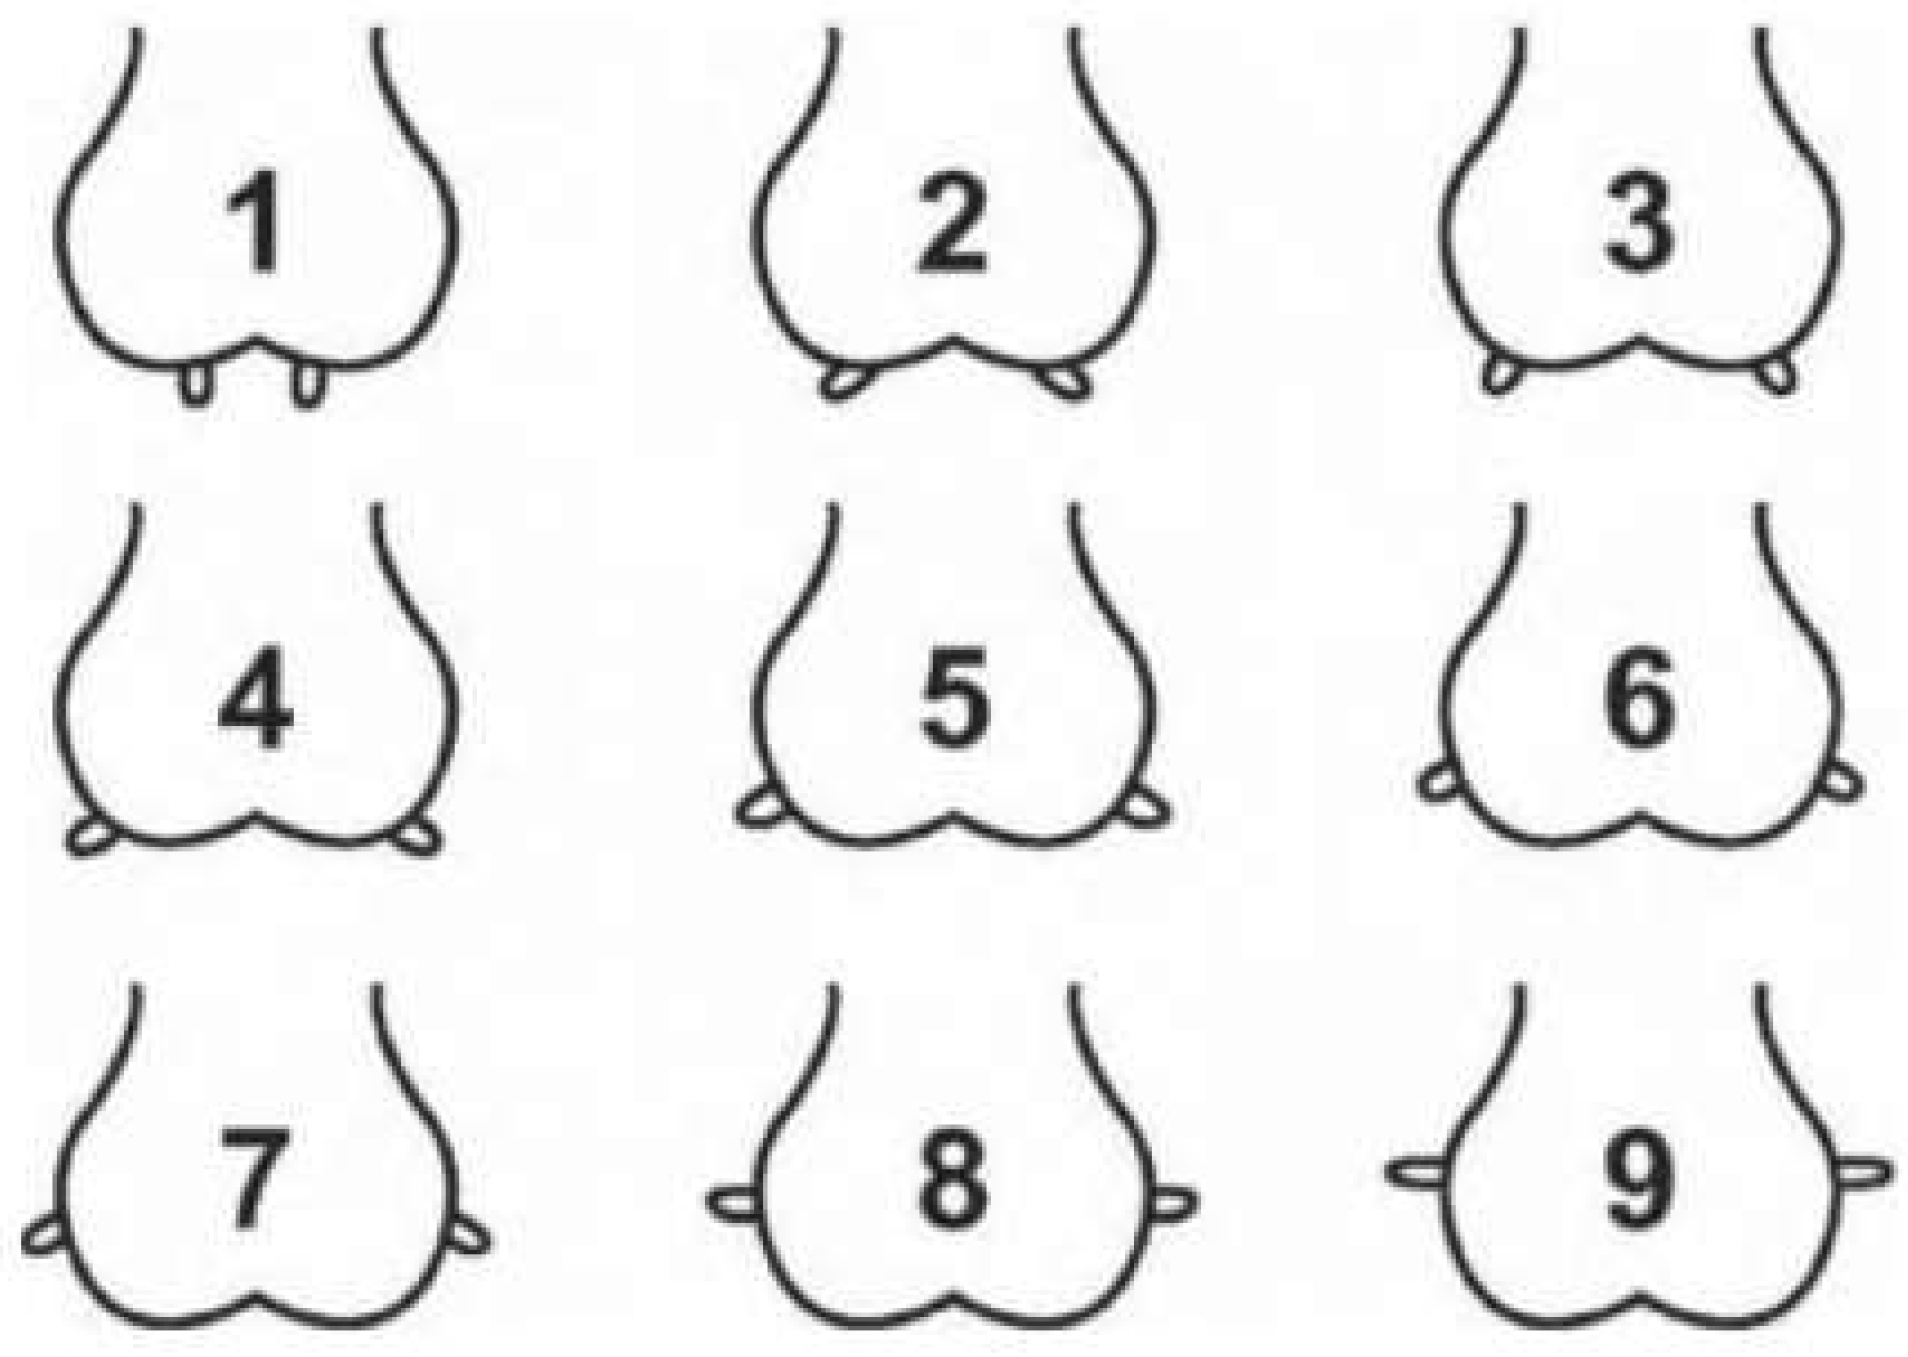
A visual assessment was performed on external characteristics of the udder within 6-8 hours of parturition, and on days 2, 45, and 60 after parturition. The visual scoring system used evaluated udder floor, udder depth, teat placement, teat lesions, and presence of wool on the udder. Udder floor (
Figure 1) was scored on a 1-4 scale: 1= defined halfling, 2= too flat, 3= broken, 4=asymmetric [
2]. Udder depth (
Figure 2) was evaluated on a 1-9 scale: 1=low udder, 9=shallow udder, 5=reference point at hock [
8]. Teat placement (
Figure 3) was scored on a 1-9 scale: 1=most medial to 9=most lateral [
6,
7]. Teat lesions and the presence of wool were scored on either presence or absence [
6]. Each ewe was characterized as having a ‘normal’ or ‘abnormal’ udder based on the following assessments. Normal udder parameters include udder depth scores of 5 or 6, udder floor score of 1 or 2, teat placement scores 4, 5, and 6, and the absence of teat lesions and wool. All ewes not meeting normal udder parameters were considered to be abnormal. Body condition scores of ewes were recorded when udder conformation was assessed using the standard 1-5 scale: 1= emaciated and 5=extremely fat [
9]. Lamb weights were recorded on approximately days 2, 45, and 60 after parturition.
2.3. Colostrum and Body weight
Colostrum samples were collected from both halves of the udder for each ewe within 6-8 hours of parturition. These samples were analyzed for colostrum quality using an optical refractometer to measure total proteins present in each half. The total proteins from each half were averaged to give an overall total protein score for each ewe. The samples were also analyzed using a Brix refractometer to measure Brix values of each half. The Brix values from each half were also averaged to give an overall Brix value for each ewe’s colostrum.
2.4. Statistical Analysis
Data on the effects of initial udder conformation on total proteins, Brix values, day 2, 45 and 60 lamb weights, lamb average body weight daily gain from day 2 to day 45, lamb weight gain from day 45 to day 60, were analyzed using the GLM procedure in SAS with significance declared at
p < 0.05 [
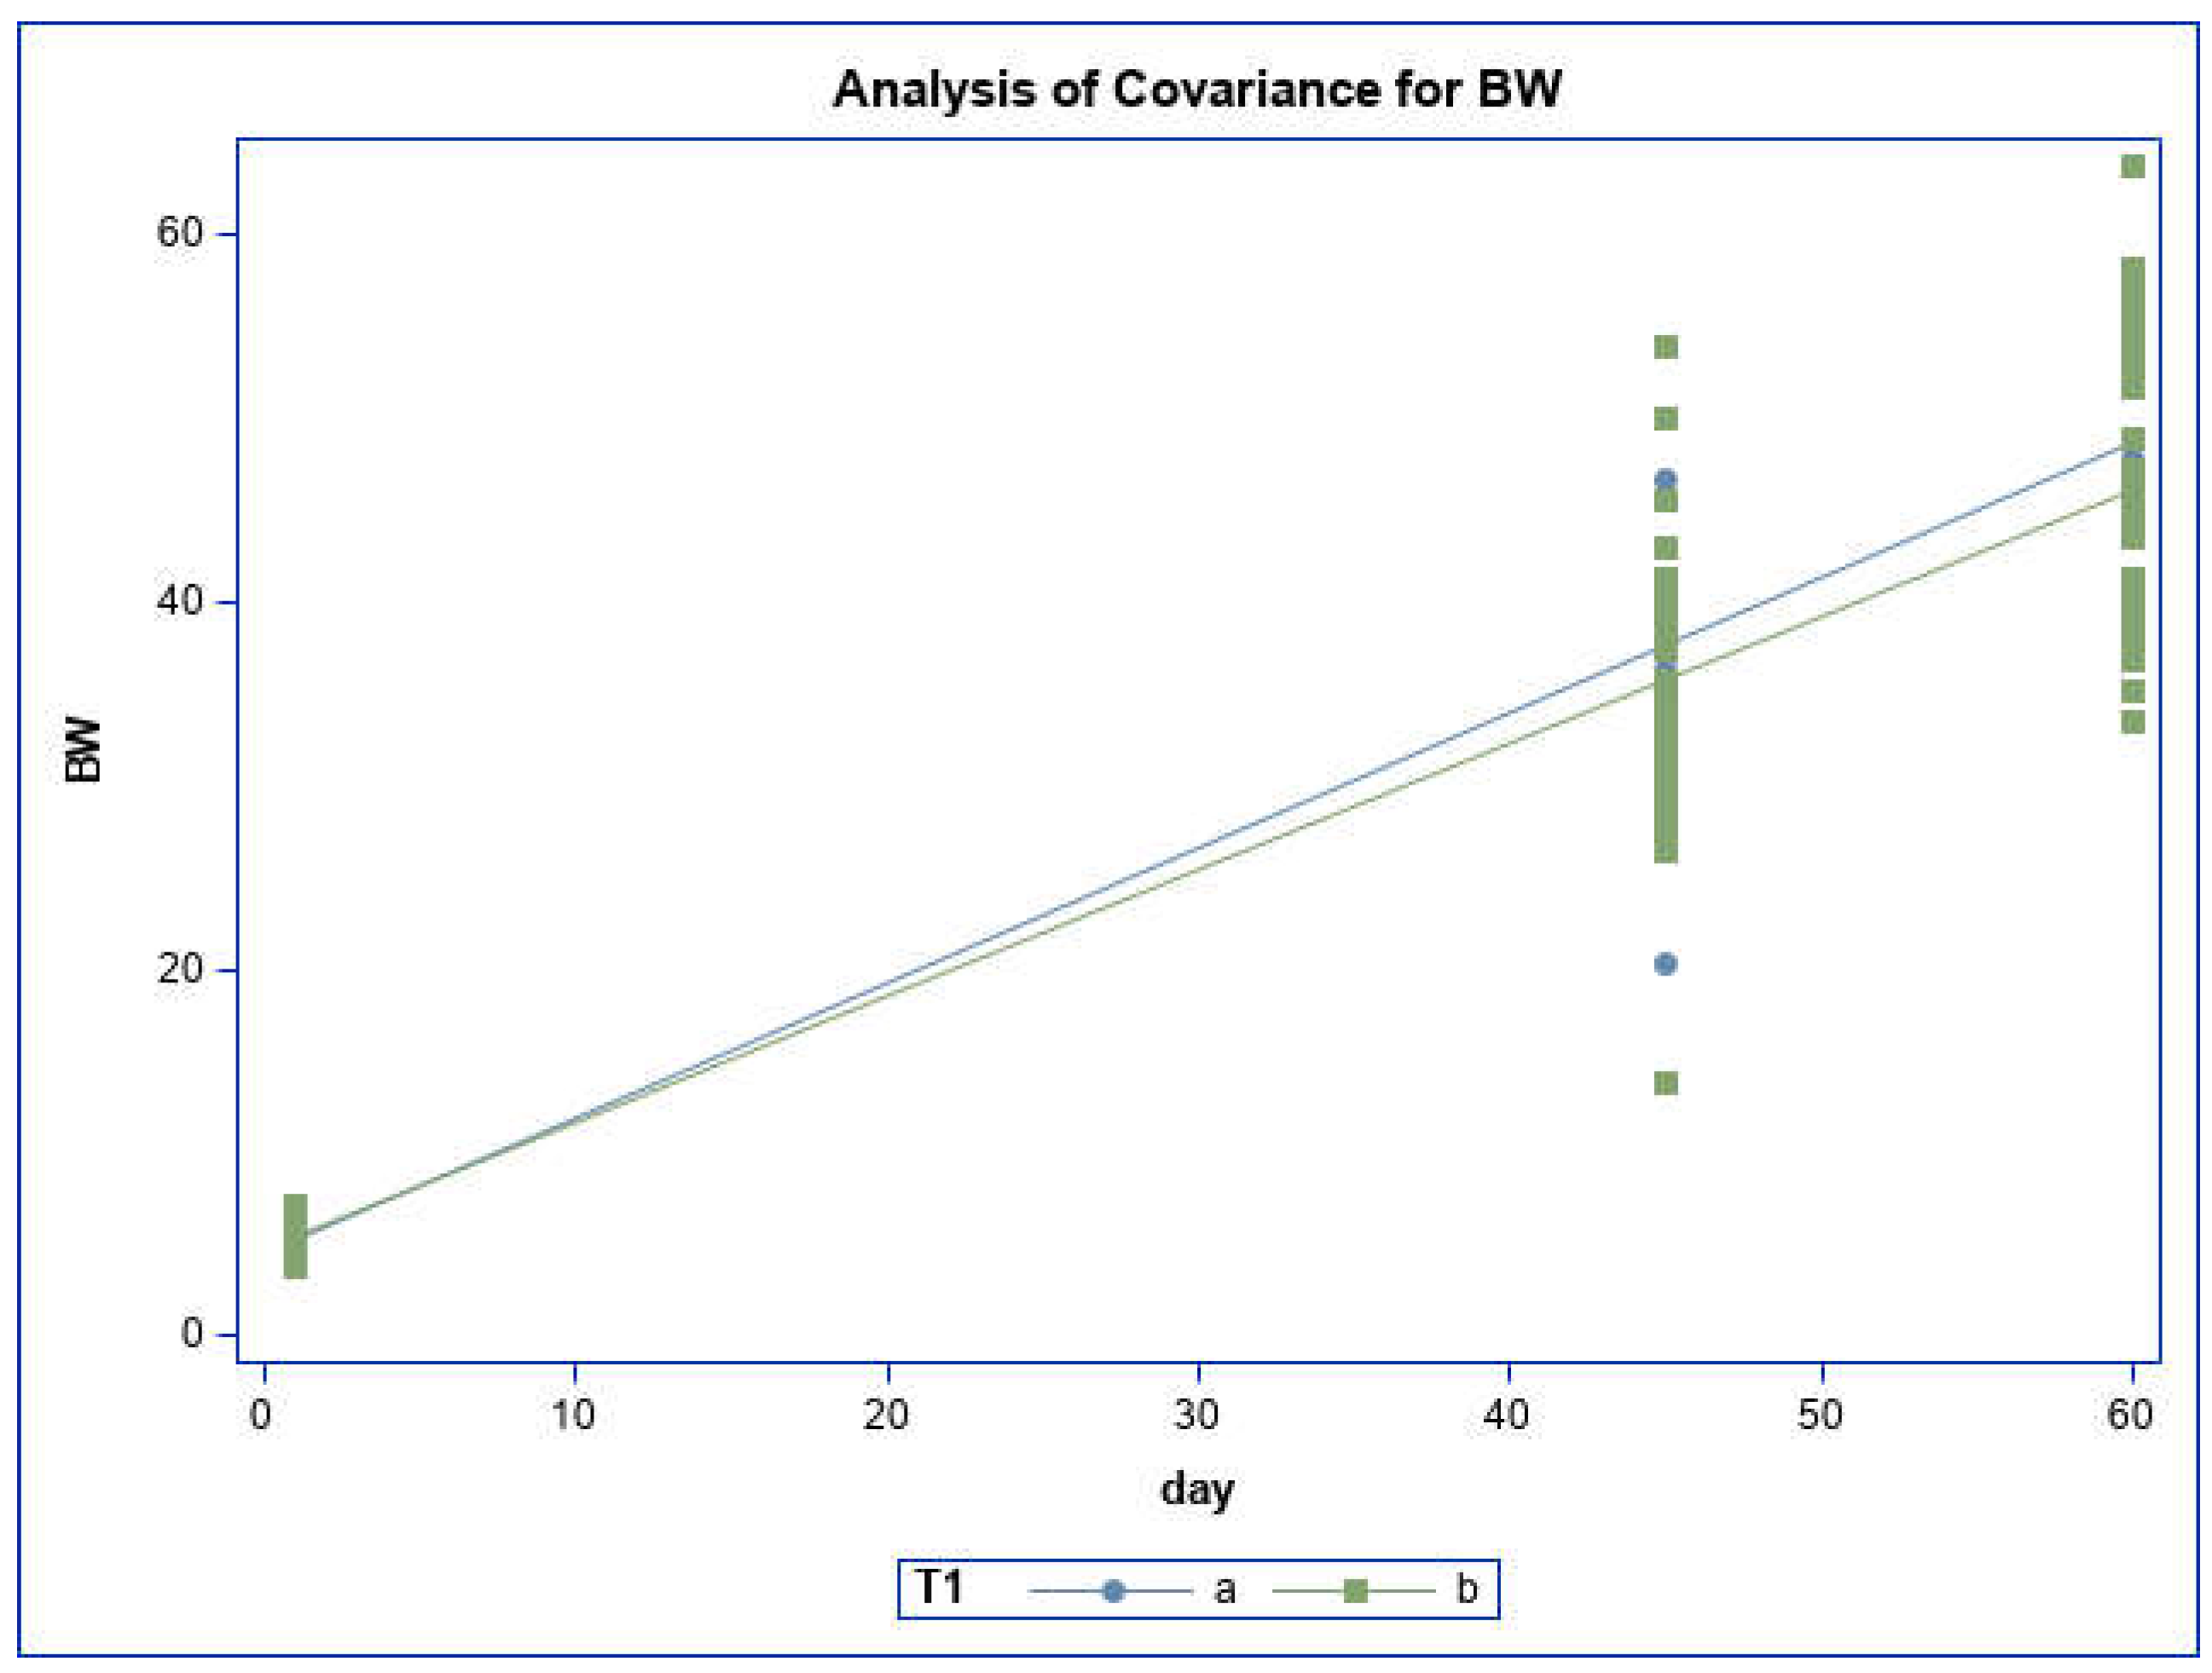
10]. The model included the fix effect of udder type (normal vs abnormal udder conformation) and random effect of ewe. In addition, regression analysis on weight gain over time was conducted to compare the pattern of lambs BW gain overtime between the two udder types (normal vs abnormal).
3. Results and Discussion
Based on initial assessment of udder conformation, 22% of ewes presented ‘normal’ conformation and 78% of ewes presented ‘abnormal’ conformation (
Table 1). This initial classification of ewes was used through the rest of the experiment to compare mean colostrum total proteins, Brix values, and mean lamb weights between ‘normal’ and ‘abnormal’ udder conformations.
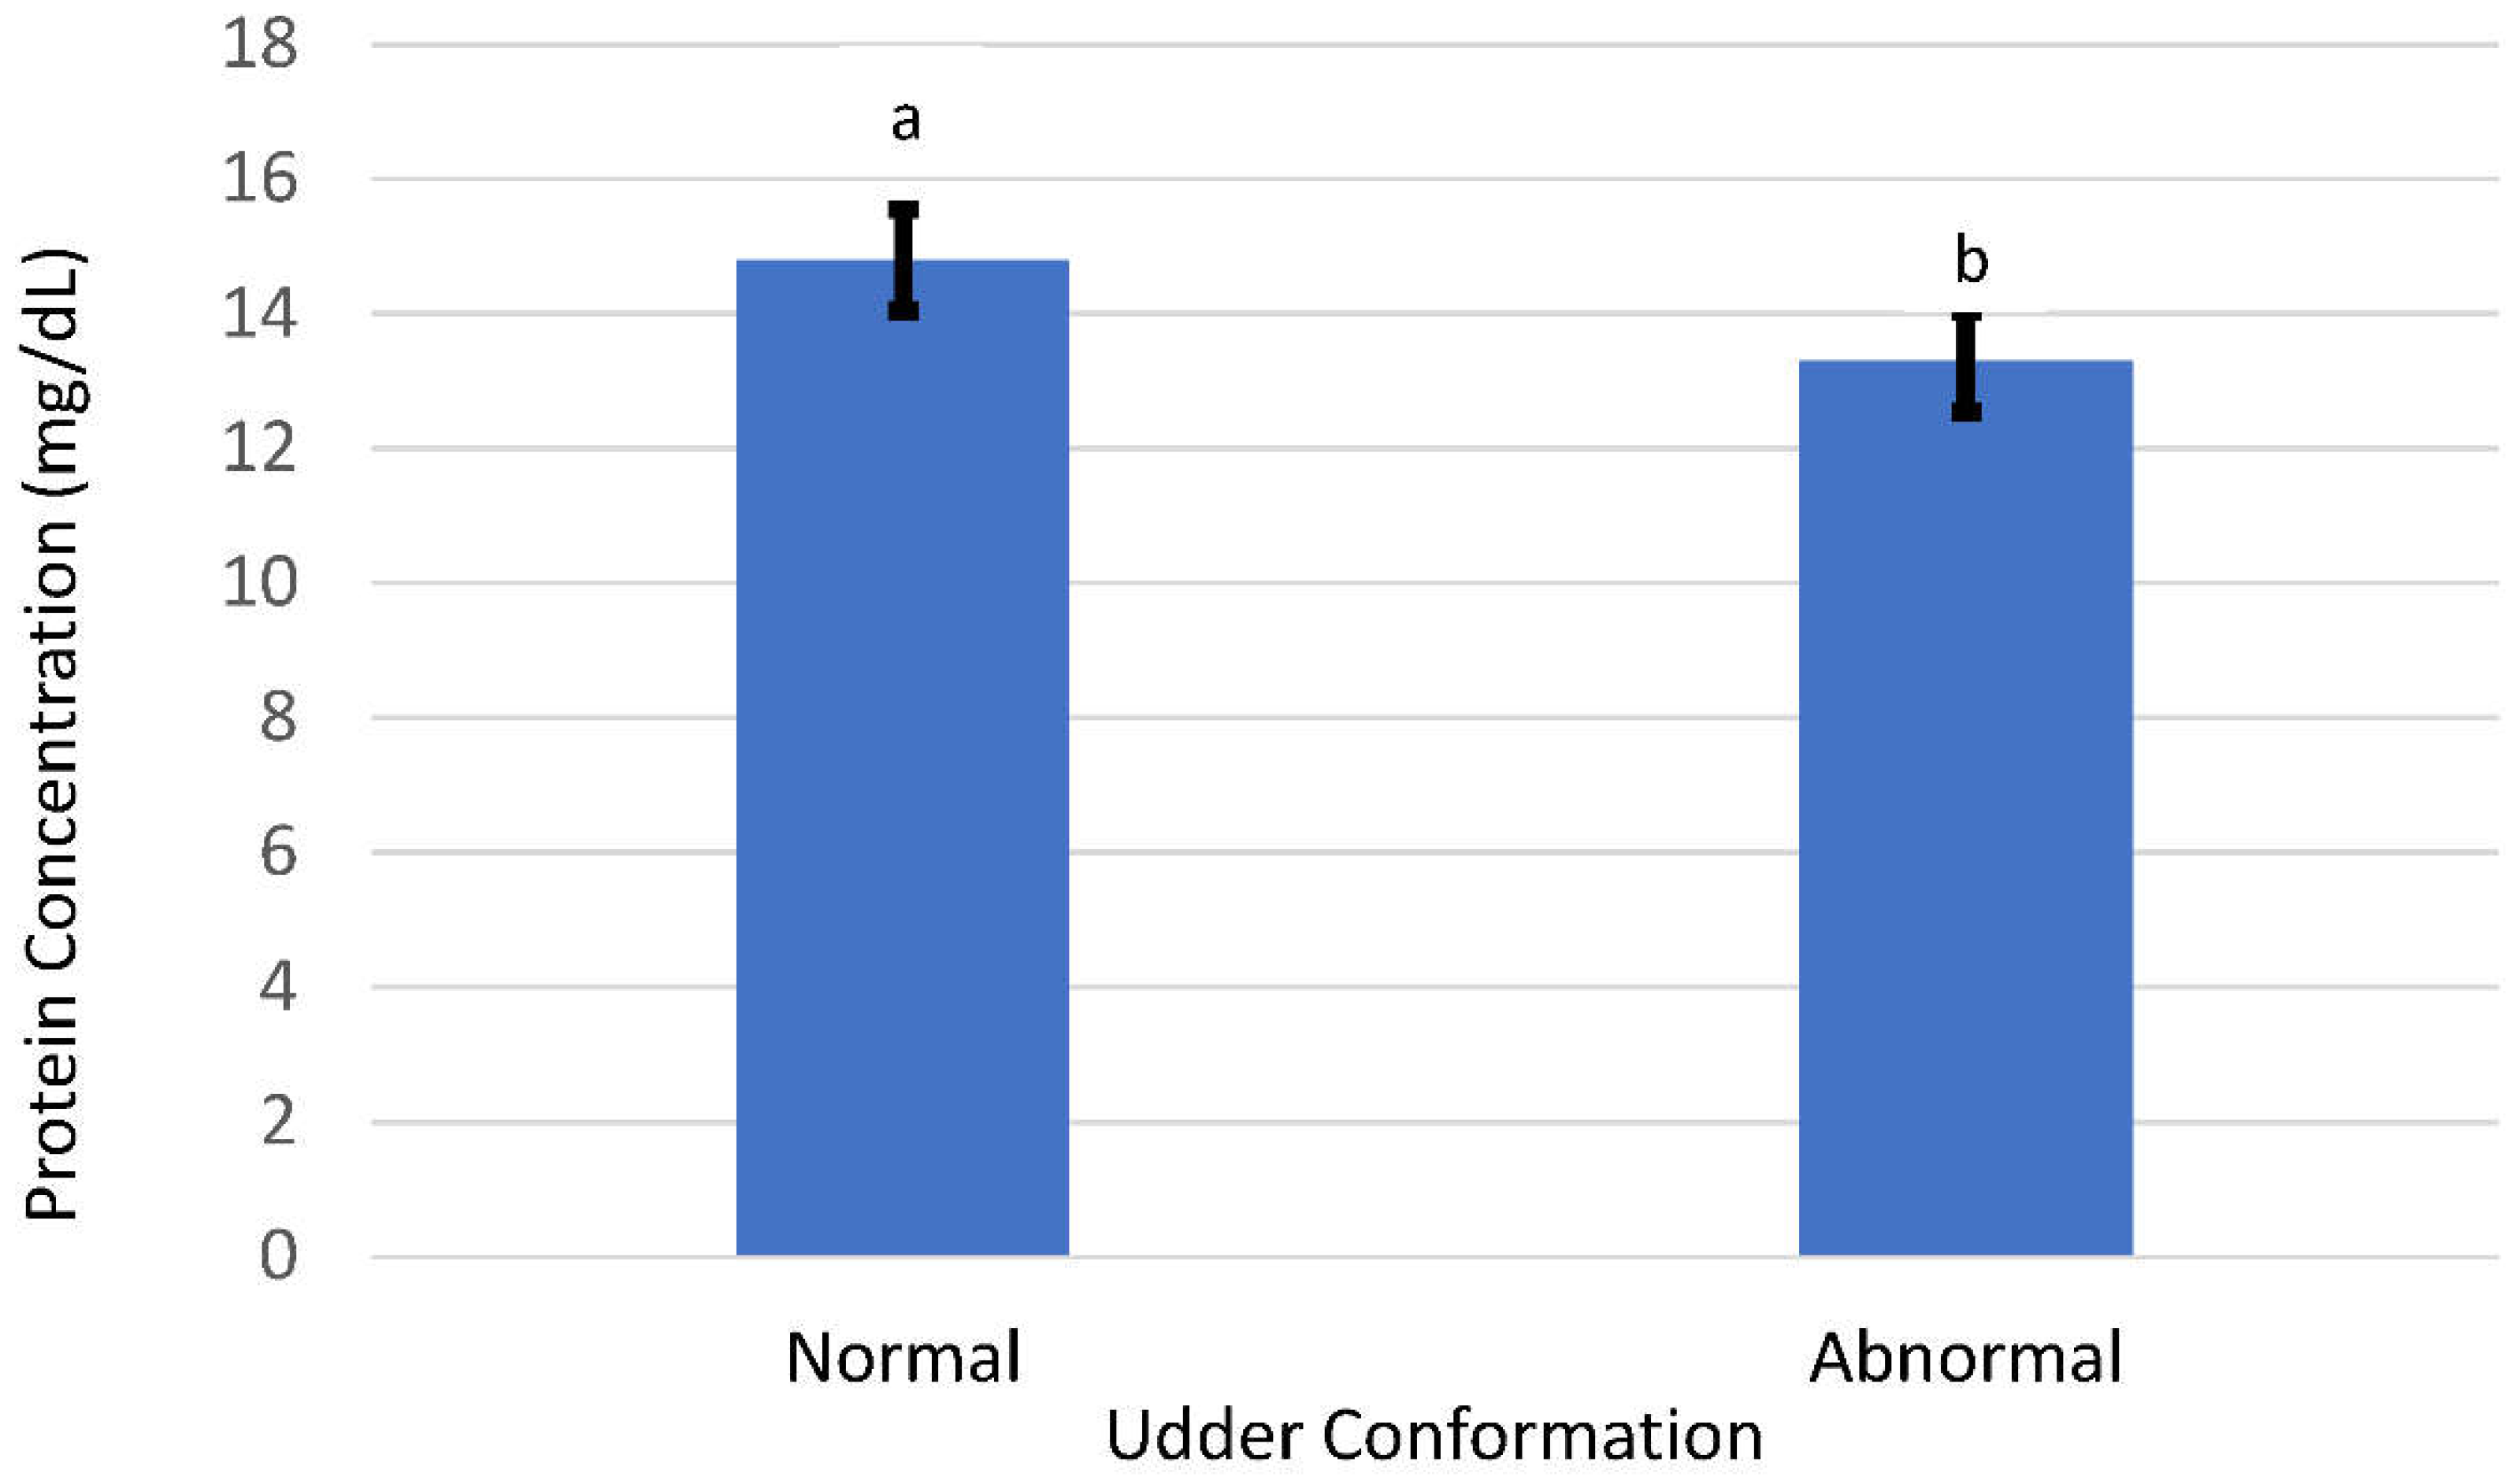
Mean total colostrum protein was greater (
p =0.02) in ewes with ‘normal’ udder conformation (14.82 ± 0.58mg/dl) compared with ewes having ‘abnormal’ conformation (13.31 ± 0.33mg/dl) (
Table 1) (
Figure 4). Brix values were also greater (
p =0.03) in ewes presenting ‘normal’ conformation (21.70 ± 0.88) compared to ewes presenting ‘abnormal’ conformation (19.54±0.52) (
Table 1).
The results demonstrate that ‘normal’ udder conformation may be associated with greater colostrum quality. Brix values have been highly correlated to IgG in ewe colostrum, with both frozen and thawed samples [
11,
12]. The greater colostrum quality exhibited in the ‘normal’ udder conformation may be a result of better intramammary colostrogenesis. It can be speculated that ‘normal’ systems may have advantages in size and structure of secretory lobules or alveoli, allowing for increased production of colostrum components including proteins, resulting in greater quality colostrum. Barbagianni [
13] found that the size of gland cisterns correlated with milk production in dairy sheep, as ewes exhibiting larger gland cisterns resulted in increased milk yields. However, colostrum quality was not reported on in the study, yet the larger gland cisterns may potentially contribute to increased colostrum production. Another study by Caja et al [
14] observed that the size of the gland cistern varies depending on the breed and milking ability, with dairy breeds exhibiting larger gland cisterns compared to non-dairy breeds. However, the gland cistern size would most likely affect the amount of colostrum and milk that is able to be produced rather than the quality of colostrum. The importance of high-quality colostrum should not be overlooked. Lambs lack the energy reserves necessary for survival and rely on adequate colostrum to meet nutritional, metabolic, and immunological needs [
15]. According to Nowak [
15], neonate mortality in sheep production systems is 15-25% worldwide, and most preweaning lamb deaths occur within the first week of life. Therefore, the quality of colostrum should be emphasized along with the quantity of colostrum in sheep production systems to ensure survival and vitality of lambs. This study suggests that by evaluating the external udder conformation in ewes, we can infer the relative quality of colostrum being produced to better ensure survival of the lambs. Practical management practices can potentially be implemented based on the evaluation of external udder conformation. For example, excess colostrum could be collected from ewes with better udder conformations to be frozen for later use or fed to lambs with a dam exhibiting poor udder conformation. This could be an important management strategy to identify ewes producing higher quality colostrum by evaluating udder conformation.
Initial udder conformation classification was used to compare lamb weights from dams with ‘normal’ and ‘abnormal’ udder conformations. There was no difference (
p > 0.3) in mean lamb weights at day 2 (2.44 ± 0.12kg vs 2.48 ± 0.07kg), day 45 (17.28 ± 0.91kg vs 16.02 ± 0.60), and day 60 (22.5 ± 1.31kg vs 21.1 ± 0.68kg) between the normal and abnormal udder conformations (
Table 2). Furthermore, lamb average daily gain from day 2 to day 60 showed no difference (
p >0.05) between ‘normal’ (0.75 ± 0.04 kg) conformation and abnormal (0.70 ± 0.02 kg) conformation (
Table 2). Regression analysis was performed on weight gain over time between ‘normal’ and ‘abnormal’ udder conformations with no difference (
p >0.05) between lamb growth rates in conformation groups (
Figure 5). These results demonstrate no differences in lamb average daily gain between ewes with normal and abnormal udder conformations. These findings are not consistent with a previous study [
6] which demonstrated that offspring of ewes with more desirable teat placement and less teat lesions on week 2 after parturition had increased lamb growth. Additional parameters measured within 6-8 hours of parturition of udder floor, udder depth, and presence of wool were used in the current study, potentially accounting for the differences in lamb growth rates reported. Huntley et al [
6] reported that excellent teat conformation, including teat placement scores of 5 and greater cross-sectional area of the teats reduced intramammary infection. This may be because of the greater volume of residual milk resulting from a larger teat cistern or because the teats have a more secure teat sphincter, reducing bacterial entry [
6]. When only considering the teat placement, a placement score of 5 suggested that this is the optimal position to allow lambs to effectively suckle based on an earlier study [
6]. As there was no difference in lamb growth rates between the ‘normal’ and ‘abnormal’ conformation groups, we can deduce that external udder traits of udder floor, udder depth, and presence of wool may have no significant effect on lamb growth rates.
In this study lambs were fed a creep grain starting at 2 weeks old. The creep feed consists of canola meal, rolled corn, rolled barely, dried distillers’ grains, mineral molasses mix, and bypass fat. Providing a creep feed may have had an impact on the ADG between the two udder conformation groups. If lambs were not receiving enough nutrients from the dam, there was another source available to account for this deficiency. All lambs had continuous access to the creep feed, potentially resulting in no difference in ADG between the conformation groups.
4. Conclusions
This study provided evidence of increased mean total protein values and increased Brix values in colostrum in ewes with ‘normal’ udder conformation compared with ewes with ‘abnormal’ conformation. Udder conformation based on the parameters of udder floor, udder depth, teat placement, teat lesions, and presence of wool do not appear to have a significant effect on lamb body weight or growth rates.
By identifying lambs in need of colostrum supplementation and ewes who produce higher quality colostrum on the basis of udder conformation, producers could better support lamb survival and reduce lamb mortality even prior to lambing. Additionally, production management practices such as collecting and freezing colostrum from ewes with ‘normal’ udder conformation may increase the overall quality of stored colostrum. Although udder conformation appears to influence colostrum quality, further research evaluating the relationship between udder conformation and lamb mortality and morbidity in the first week could have implications on both lamb and ewe management.
This study found no differences in lamb growth rates between udder conformations, although previous studies found a correlation between lamb growth and teat placement in Suffolk sheep. Additional research may be needed to further evaluate the relationship between lamb growth and udder conformation, specifically in meat breeds. Continued research looking at carcass values of lambs in the context of udder conformation may reveal an influence of high-quality colostrum and udder conformations on carcass traits. Genetic influence of udder conformation on colostrum values and growth rates has also yet to be considered.
Data Availability Statement
Not applicable.
Acknowledgment
This research was partially funded by an Undergraduate Research Grant from the Office of Undergraduate Research at the University of Idaho. Special thanks to the University of Idaho Sheep Center for providing additional labor and the ewes and lambs used in this study.
Conflicts of Interest
The authors declared no conflict.
References
- Milerski, M.; Margetín, M.; Čapistrák, A.; Apolen, D.; Špánik, J.; Oravcová, M. Relationships between External and Internal Udder Measurements and the Linear Scores for Udder Morphology Traits in Dairy Sheep. Czech Journal of Animal Science. 2011, 51, 383–390. [Google Scholar] [CrossRef]
- Pourlis, A. Ovine mammary morphology and associations with milk production, milkability and animal selection. Small Rumin. Res. 2020, 184, 106009. [Google Scholar] [CrossRef]
- Ángeles Pérez-Cabal, M.; Legaz, E.; Cervantes, I.; de la Fuente, L.F.; Martínez, R.; Goyache, F.; Gutiérrez, J. P. Association between body and udder morphological traits and dairy performance in Spanish Assaf sheep. Arch. Anim. Breed. 2013, 6, 430–442. [Google Scholar] [CrossRef]
- Frisch, J.E. The use of teat-size measurements or calf weaning weight as an aid to selection against teat defects in cattle. Anim. Sci. 1982, 35, 127–133. [Google Scholar] [CrossRef]
- Ventorp, M.; Michanek, P. The Importance of Udder and Teat Conformation for Teat Seeking by the Newborn Calf. Journal of Dairy Science. 1992, 75, 262–268. [Google Scholar] [CrossRef] [PubMed]
- Huntley, S.J.; Cooper, S.; Bradley, A.J.; Green, L.E. A cohort study of the associations between udder conformation, milk somatic cell count, and lamb weight in suckler ewes. J. Dairy Sci. 2012, 95, 5001–5010. [Google Scholar] [CrossRef] [PubMed]
- Casu, S.; Pernazza, I.; Carta, A. Feasibility of a linear scoring method of udder morphology for the selection scheme of Sardinian sheep. Journal of Dairy Science. 2006, 89, 2200–220. [Google Scholar] [CrossRef] [PubMed]
- Innovation flocks (2022) Innovation Flocks measurements and DNA sampling.
- Fernandes, D. Body Condition Scoring of Sheep. University of Arkansas Extension: Animal Science. Accessed March 23, 2023. 23 March.
- SAS Institute (2015) SAS Version 9.4. SAS Institute Inc. Cary, NC.
- Heinrichs, J.; Jones, J. M. (2016) Colostrum Management Tools: Hydrometers and Refractometers. Penn State Extension: Colostrum Management Tools.
- Kessler E., C.; Bruckmaier R., M.; Gross, J.J. Short Communication: Comparative estimation of colostrum quality by Brix refractometry in bovine, caprine, and ovine colostrum. Journal of Dairy Science. 2020, 104, 2438–2444. [Google Scholar] [CrossRef] [PubMed]
- Barbagianni, M. S.; Mavrogianni, V.S.; Vasileiou, N.G.C.; Fthenakis, G.C.; Petridis, I.G. Ultrasonographic Examination of the Udder in Sheep. Small Ruminant Research. 2017, 152, 86–99. [Google Scholar] [CrossRef]
- Caja, G.; Rovai, M. Udder Morphology and Machine Milking Ability in Dairy Sheep. Virascience 2001. Udder Morphology and Machine Milking Ability in Dairy Sheep. Available online: virascience.com.
- Nowak, R.; Pascal, P. From birth to colostrum: early steps leading to lamb survival. Reproduction Nutrition Development. 2006, 46, 431–446. [Google Scholar] [CrossRef] [PubMed]
|
Disclaimer/Publisher’s Note: The statements, opinions and data contained in all publications are solely those of the individual author(s) and contributor(s) and not of MDPI and/or the editor(s). MDPI and/or the editor(s) disclaim responsibility for any injury to people or property resulting from any ideas, methods, instructions or products referred to in the content. |
© 2023 by the authors. Licensee MDPI, Basel, Switzerland. This article is an open access article distributed under the terms and conditions of the Creative Commons Attribution (CC BY) license (http://creativecommons.org/licenses/by/4.0/).
