1. Introduction
In recent years, with the rapid development of technologies such as 5G and IoT, emerging applications such as autonomous driving, remote surgery, and virtual reality have gradually entered people’s vision [
1]. Various sensors, smart wearable devices, and other mobile devices with portability features have been widely used in the production and life of various industries [
2]. The widespread popularity of mobile end devices has also directly led to explosive growth in the number of devices accessing the network. According to Cisco’s network report predictions in the past two years, by 2023, the number of networked devices will reach 29.3 billion, and the explosive growth of data volume poses various challenges to mobile computing devices and network environments [
3]. Although cloud data centers can solve the problem of limited computing and storage resources of mobile devices, the cloud data centers are far away from the end users and cannot guarantee access latency in latency-sensitive scenarios [
4]. To this end, the European Telecommunications Standards Association introduced Mobile Edge Computing (MEC), and the application of MEC greatly solved the above problems [
5]. This approach enables the computation and storage capacity from the core network to be transferred to the edge network in order to reduce latency. Compared with the remote cloud, MEC greatly reduces data transmission latency and network congestion in the core network by offloading computing tasks from the cloud center to the network edge closer to the user side in latency-sensitive application scenarios [
6,
7].
The deployment problem of edge servers is to select different strategies to place edge servers within a specific geographical range to meet certain constraints [
8]. The locations of edge servers affect both the latency and the resource utilization of edge servers, especially in smart cities with hundreds or thousands of CBSs that enable end devices to access the edge servers. [
9,
10]. In addition, the edge cloud is able to provide computation offloading services to end devices. Task scheduling can offload computation-intensive tasks to the edge cloud or remote cloud, helping mobile devices extend battery life and shorten task execution time, thereby improving user experience [
11].
In this paper, we propose a Server Deployment and Task Scheduling (SDTS) framework in multi-edge collaborative computing to minimize latency and balance task allocation. The contributions of this paper are as follows:
We divide a MAN into dense candidate regions (DCRs) based on the density characteristics of end devices, and servers are deployed independently in each DCR. This ensures that the servers processing a request for an end device does not exceed the DCR range that the end device belongs to, that is, the latency can be controlled within a certain range even in the worst case.
We design a two-step clustering algorithm to deploy servers as close as possible to end devices and present a task scheduling algorithm based on an established edge scheduling layer in DCRs, which can leverage collaboration between edge servers to improve the performance of the entire edge computing system.
The experimental results based on the CBS dataset of Shanghai Telecom indicate that the proposed approach outperforms several representative strategies in terms of latency and workload balancing.
The rest of the paper is organized as follows.
Section 2 introduces the related works.
Section 3 presents the system model and gives the problem definition.
Section 4 presents the algorithm design.
Section 5 evaluates the performance of the proposed strategy. Finally, we give the conclusion of the paper.
2. Related Work
On the deployment problem of edge servers in MEC. Mao et al. [
12] propose that the connection between devices and edge nodes in a MEC environment can be the nearest CBS. Edge servers can now also be considered as the offloading destination of mobile devices, aiming to reduce the latency between mobile devices and the remote cloud. Currently, many studies on edge server deployment abstract the edge server deployment problem as a multi-objective constrained optimization problem. In [
10], the authors take the latency and workload balancing of edge servers as constraints and use mixed integer programming to place edge servers, achieving optimal solutions with low latency and workload balancing under deployment. Li et al. [
13] consider the delay and energy consumption problems of edge servers under deployment and use a particle swarm optimization energy-aware edge server layout algorithm to deploy servers, while also considering that user behavior is regular so that edge servers will also produce periodic idle. Yin et al. [
14] propose a tentacle decision execution framework that can discover appropriate unforeseen edge locations, using inaccurate network distance estimation to prioritize identifying potential edge locations near user sets to achieve the purpose of reducing latency.
There are many studies on the deployment strategy of cloudlets. Jia et al. [
15] consider the server deployment and user allocation strategy of cloudlets in the MAN, and designs a multi-user, multi-cloud computing system model based on queuing network. Based on this, an algorithm for cloudlet assignment and user-to-cloudlet assignment is proposed. yang et al. [
16] establishes a task completion delay calculation model and proposes a bender decomposition algorithm based on the deployment of cloudlets using SDN. In [
17], the authors consider the use of big data to get the geographic location of user access points and then use a clustering algorithm to place cloudlets at locations close to the user gathering area based on the geographic information of the access points. the deployment goal of low access latency is achieved. Xu et al. [
18] abstract the problem of deploying cloudlets into MANETs as an ILP (integer linear programming problem) and then uses a heuristic method to solve the deployment problem. In [
19,
20], the authors consider the workload of APs is also a very critical direction to consider and uses cloud computing as task scheduling to offload tasks to resource-rich nodes to achieve a balanced workload.
The geographical region and the deployment of heterogeneous servers also have an important impact on the edge server placement strategy in MEC. Bouet et al. [
21] is based on the size, capacity, quantity, and operation area of the servers, satisfying different structures of edge servers deployed in different places, and meeting the needs of different scenarios in MEC. Users are mobile, and user mobility affects the workload of access points. In [
22], the authors consider that user mobility causes changes in density, and thus dynamically adjust the deployment location according to the clustering algorithm, using the shortest path algorithm of the graph, deploying the servers on the smart car and moving it to achieve dynamic adjustment. Mixed deployment with other servers can also improve the edge computing capability in some scenarios. Taherizadeh et al. [
23] propose a capillary computing architecture, which builds a distributed system with edge nodes, fog nodes, and cloud together, realizing fast orchestration and processing of microservices, which is nearly four times faster than traditional cloud computing micro service processing.
In this paper, we propose Server Deployment and Task Scheduling (SDTS) framework in multi-edge collaborative computing. The proposed framework divides a MAN into dense candidate regions (DCR) based on the density characteristics of mobile end devices, and then servers are deployed independently in each sub-region. A two-step clustering algorithm is designed to deploy servers as close as possible to mobile devices. This ensures that the servers processing a request for an end device does not exceed the DCR range that the end device belongs to, that is, the latency can be controlled within a certain range even in the worst case. Based on the proposed edge server deployment approach, a task scheduling algorithm is presented to minimize the access latency and optimize the workload balancing among servers by establishing an edge scheduling layer in DCRs.
3. System Model and Problem Definition
3.1. System Model
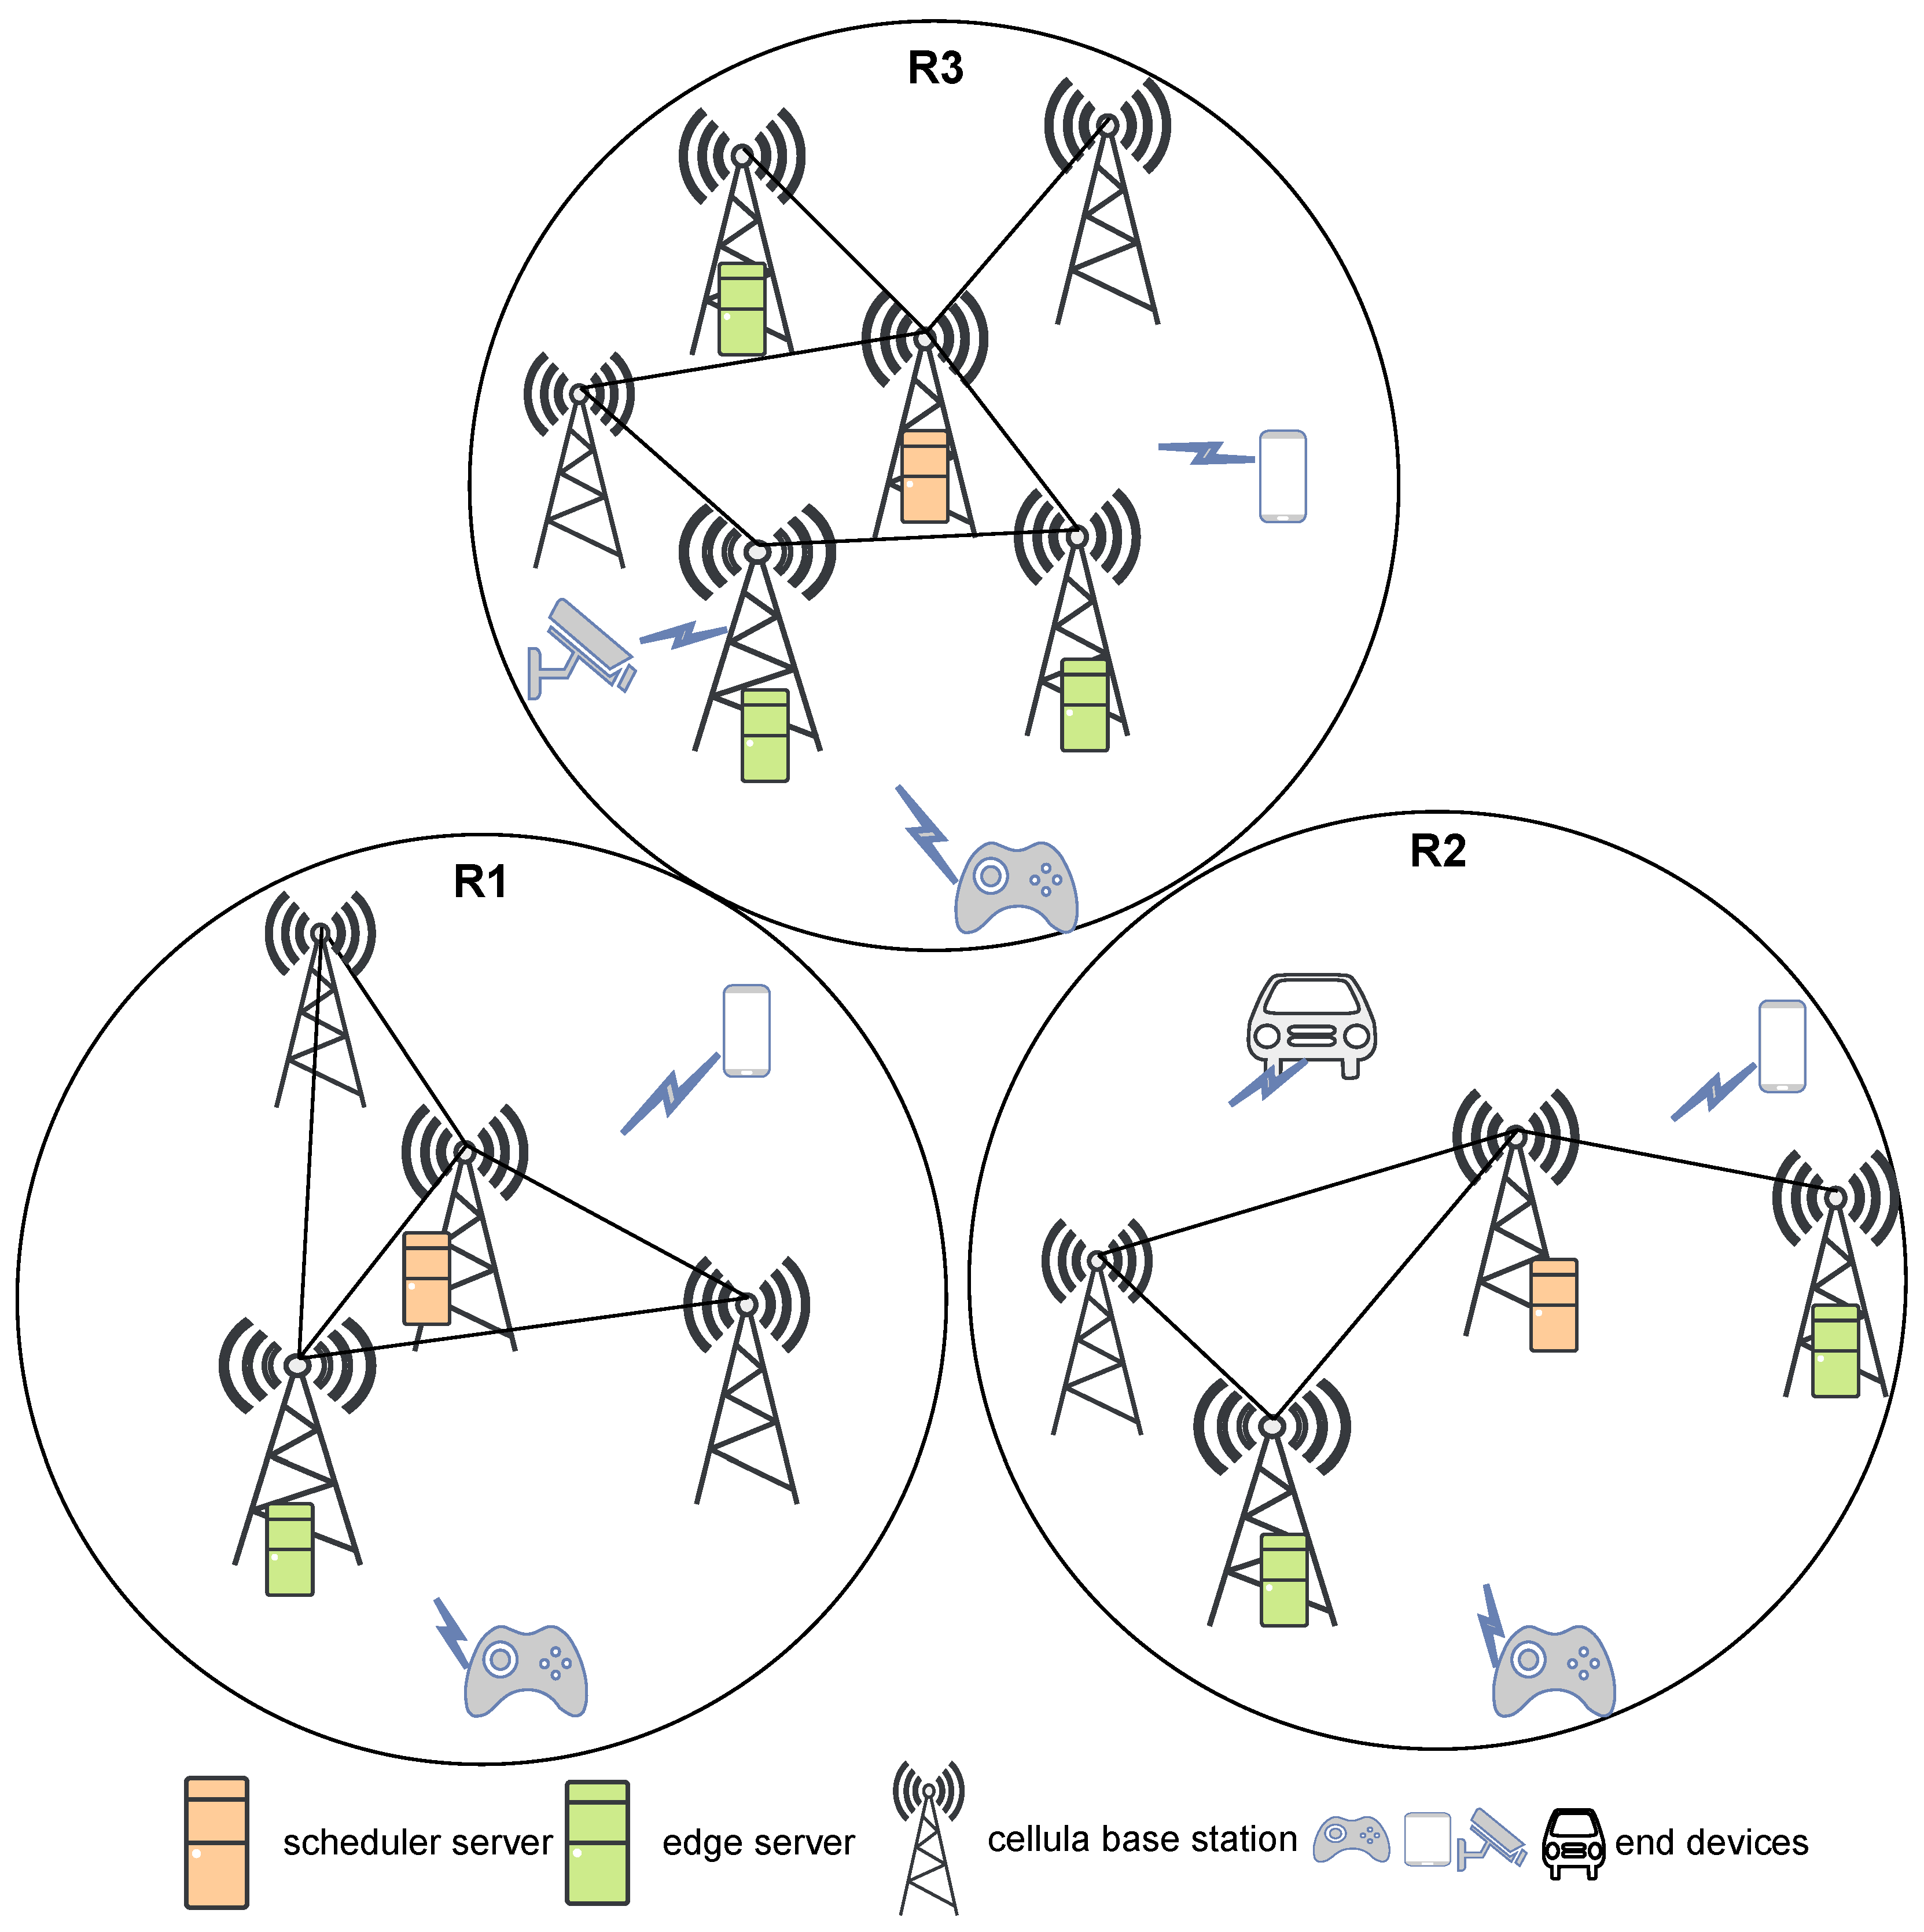
As shown in
Figure 1, the main entities in the system are CBSs, edge servers, scheduler servers, and mobile end devices. Symbols
,
,
, and
denote CBSs, the servers, the generated DCRs and mobile end devices, respectively.
N,
M,
K, and
T are the number of CBSs, servers, DCRs, and mobile end devices, respectively.
DCRs are sub-regions that are divided according to the density of different end devices. Edge server with limited computing and storage resources. It provides users with real-time, agile, and flexible network services. Edge servers in the same DCR can transfer data to each other through the Internet. A Scheduler server is a specific type of edge server that distributes the workload evenly to different servers, improving the utilization of each server and ensuring the service quality. The end devices consist of mobile computing devices, including mobile phones, wearable devices, mobile sensors, smart robots, etc. The tasks uploaded by end devices may be locally calculated by the nearest edge server or cooperatively completed by the edge servers in the same DCR.
3.2. Problem Definition
Assuming each CBS can only be tied to one DCR. That is, the following Equation (
1) is satisfied,
where
and
are the set of base stations in DCR
and DCR
, respectively.
Each server can only be deployed in one CBS, and each CBS at most deploys one server. That is, the following Equation (
2) is satisfied.
where
and
denote the set of all servers in DCR
and DCR
, respectively.
For each end device
, latency is the time difference between the server response and the service request, and it includes propagation and transmission delays. This paper only considers propagation delay or latency, which is proportional to the distance between two nodes. So the latency between the end device and edge server in the same DCR is defined as Equation (
3).
where
and
are the edge server that processes the tasks from the
, and the access latency of end device
, respectively. And the average latency of all DCRs is Equation (
4).
End devices receive services by sending requests to a CBS. In the MEC network, each CBS has a fixed radio coverage. Workload balancing on edge servers increases their efficiency and provides more suitable services to end users. It avoids the overloading of resources while some other resources are underloaded. In this paper, the standard deviation metric is employed to define the workload balancing of the resources in a DCR [
24,
25]. The overall workload balancing of servers is determined in Equation (
5).
where
and
are the workload of edge server
j and the average workload of all edge servers in DCR
, respectively.
is the total number of edge servers in DCR
.
This paper uses the weighted average model as the objective function, as shown in
6.
where
and
are the weights of the objectives,
. Although these weights are adjustable, in all experiments, these weights are assumed equal to 0.5.
4. Algorithm Design
In this section, a detailed description of the edge server deployment and the task scheduling algorithm is presented.
4.1. Server Deployment
The deployment of edge servers in this paper consists of three steps: (1) Generation of DCR; (2) Determine the location of the candidate edge servers; (3) Determine the location of the scheduler server.
4.1.1. Generation of DCRs
Before deploying the servers, DCRs need to be generated based on the density of end devices. In many existing studies, all the positions of CBS in the MAN are used as the input for clustering algorithms. However, as cities continuously grow, the city will be divided into densely populated regions and sparsely populated discrete regions [
26]. Therefore, the center shift may be caused for clustering algorithms if outliers or a small amount of noisy data impact the mean [
27,
28]. When clustering algorithms are used directly over a large area, the deployment of servers in sub-regions with dense end devices will be affected by sparsely populated sub-regions. This leads to servers being deployed in locations that are far from high-density end devices, increasing investment costs and affecting user experience [
29].
To solve the above problem, the concept of DCR is presented, that is, before edge servers are deployed, find the densely populated and end devices concentrated DCRs for priority deployment. First, the regions where the end devices are densely distributed are obtained by the DBSCAN (Density-Based Spatial Clustering of Applications with Noise) [
30,
31,
32] algorithm, and then such sub-regions are defined as Dense Candidate Regions (DCR).
DBSCAN is a density-based clustering algorithm that has two main parameters: and .
is the radius of the neighborhood, which defines the range of points that are close to a given point, that is, the set of all points that are within a distance of or less from the point. The value of influences the number and shape of the clusters.
is the minimum number of points that defines whether a point is a core point, that is, the point has at least points in its neighborhood. The value of influences the density of the clusters and the detection of noise points.
The selection of
and
can be obtained based on the k-distance graph [
33,
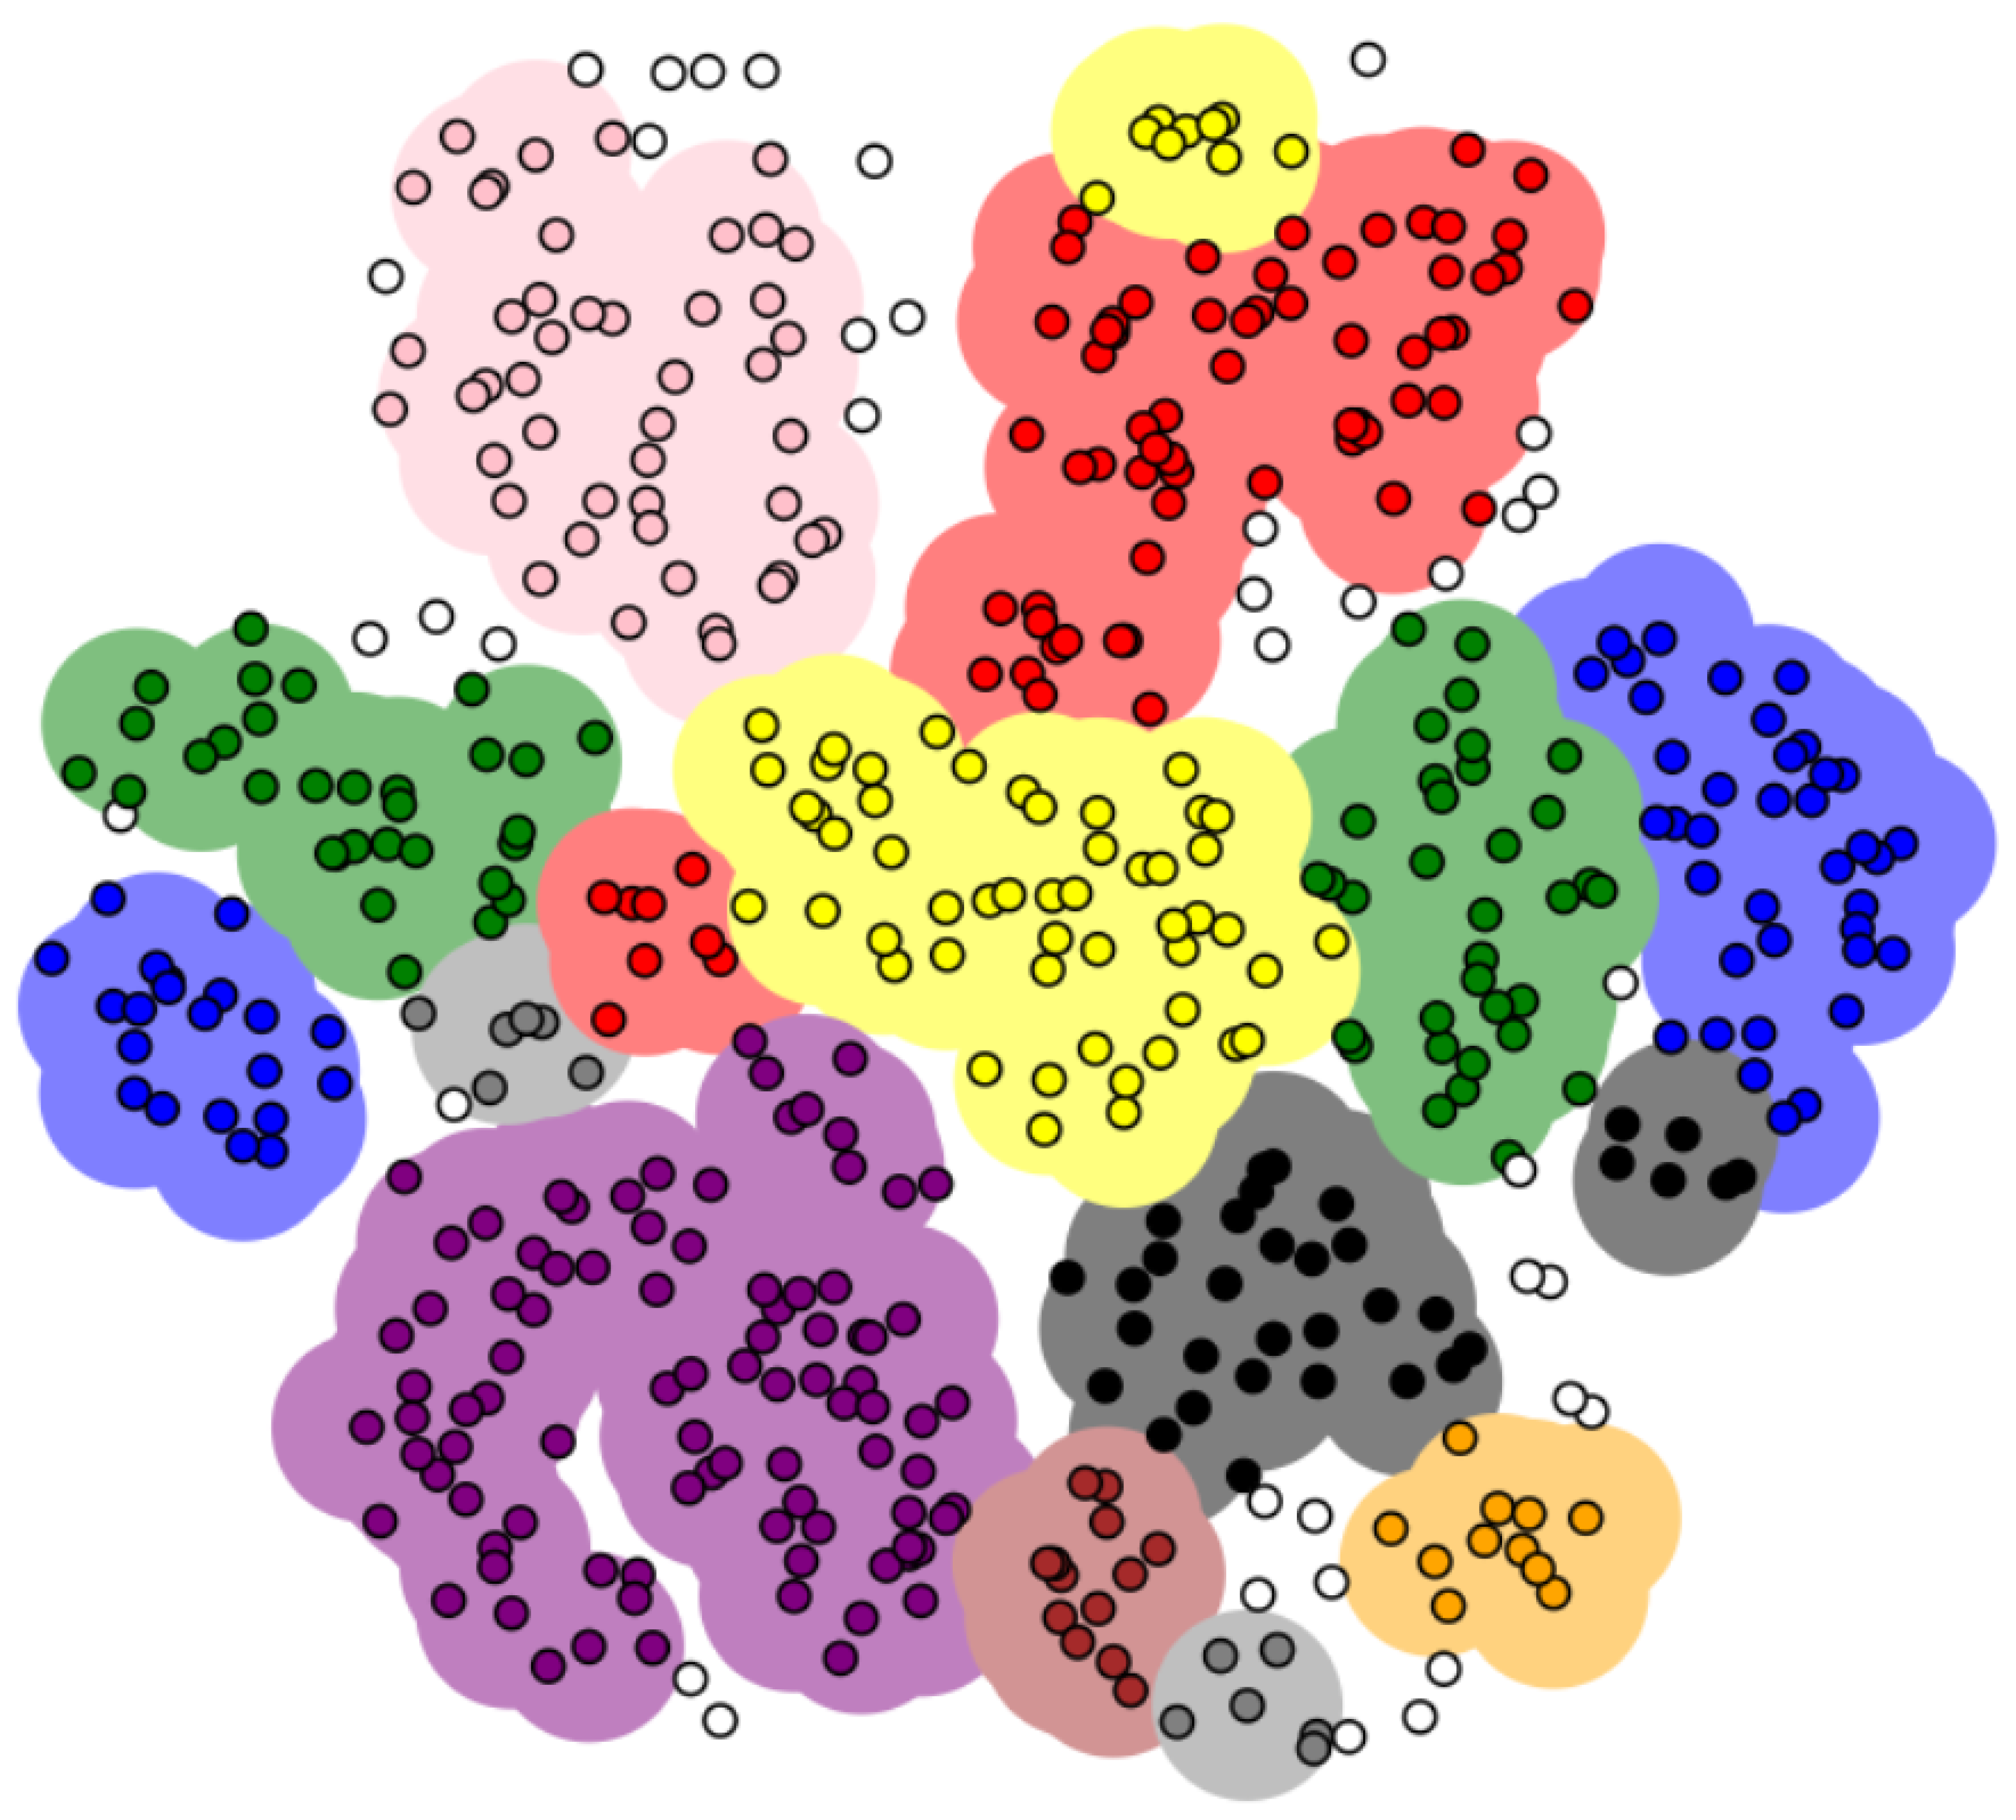
34]. As shown in
Figure 2, the DCRs generated by DBSCAN are marked with different colors. We can find that there are some points that are not in any DCR. In order to enable each base station to be in a DCR, we assign all such noise points to the DCR nearest to them. As shown in Equation (
7), all CBSs are divided by DBSCAN clustering, and a set of DCRs
R and a set of noise points
are obtained.
4.1.2. Deployment of Servers
Based on the DCR generation results described above, the next step is to start the server deployment. To find the candidate CBS locations for the servers in each DCR, which involves solving three key problems: (1) How many servers should be deployed in a DCR? (2) Which CBSs should the edge servers be deployed at? (3) Which CBS should the scheduler server be deployed at?
(1) Determine the number of servers to be deployed in each DCR. To ensure a relatively fair experience for all users, it is necessary to deploy the servers as evenly as possible in different DCRs. Assume that the number of base stations in the MAN is
N, and the number of servers to be deployed is
M, then the average number of servers used by each CBS is
. The number of servers to be deployed in each DCR is determined by the following Equation (
8).
where
and
are the number of servers and the number of CBSs in
, respectively.
(2) Determine the locations of servers in a DCR. To determine the candidate locations of servers in DCRs, we again apply the K-medoids clustering algorithm to each DCR, and such clusters divided by K-medoids are called
candidate CBS clusters. For example, as shown in
Figure 3, five servers need to be deployed in this DCR, so the servers in this DCR are divided into five candidate CBS clusters and their corresponding centroids.
Candidate CBS clusters in
are divided by Equation (
9). The input of the K-medoids algorithm is the locations of all CBSs in the DCR, and the number of clusters
K to be partitioned, where the
.
where
and
are the candidate CBS clusters and corresponding centroids in DCR
, respectively.
In order to minimize the delay of the server in responding to the requests from the end devices, intuitively, a server should be deployed as close as possible to the center of a candidate CBS cluster. Therefore, we naturally use the centroids of each candidate CBS cluster obtained by the K-medoids algorithm as the candidate server deployment locations.
(3) Determine the location of the scheduler server in a DCR. After determining the locations of all the servers in a DCR, we need to select a special location from the candidate CBS locations to deploy the scheduler server. As shown in
Figure 3, intuitively, the scheduler server should be deployed in the candidate CBS cluster marked in blue. Because the scheduler server should be located as close as possible to other servers to ensure timely scheduling of the edge servers in the DCR.
There are many methods to find the most central point from a set of discrete points, such as the minimum distance sum, the minimum variance, the maximum density, and so on. This paper adopts the minimum distance method to determine the location of a server, which is the CBS location that minimizes the variance of the distances to all other CBSs in the same candidate CBS cluster. The specific method is as follows:
Let
, where the center point
is defined as the average of all points:
where
is the number of centroids of
, and
are the coordinates of the
i-th node.
The minimum Euclidean distance
and return the corresponding point where the scheduler server will be deployed:
where
is location of the scheduler server in
.
4.1.3. Two-step Clustering Server Deployment Algorithm
Based on the above description, we can obtain the following two-step clustering server deployment algorithm.
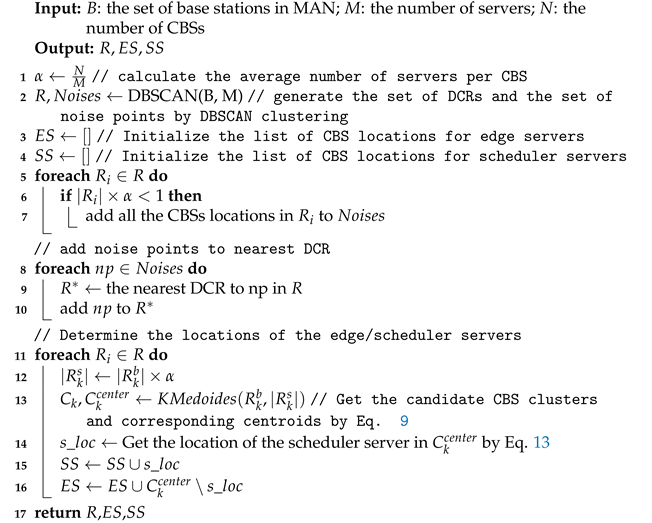
As shown in 1, the DCRs Generation Algorithm is shown in Algorithm 1. The input of the algorithm is the set of CBS B, the number of servers to be allocated M the number of CBSs to be allocated N. The output is the generated DCRs R, locations of edge servers , and locations of scheduler servers .
Line 1 calculates the average number of servers per CBS. Line 2 generates DCRs and noise points by DBSCAN clustering (Equation (
7)). Line 3 and Line 4 initialize the list of edge servers and scheduler servers, respectively. Lines 5-7 release the base stations in the DCRs that have less than one server allocated as noise points, and lines 8-10 add all the noise points to the nearest DCR. Lines 11-16 determine the deployment locations of the edge servers.
4.2. Task Scheduling
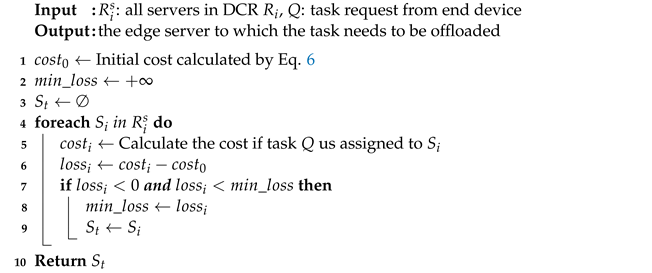
The edge servers report the resource utilization and resources required for the computing task to the scheduler servers by sending heartbeats. The scheduler servers assign tasks based on the global status of the servers after receiving the heartbeat packet from the edge server, aiming to achieve optimal workload balancing. This paper configures a greedy-based task scheduling algorithm for the proposed server deployment algorithm. The idea is to choose the server with the smallest loss to assign tasks in each iteration until a suitable server is found or all servers are checked, as shown in Algorithm 2.
|
Algorithm 1:Two-step Clustering Server Deployment Algorithm |
 |
|
Algorithm 2:Task scheduling algorithm |
 |
5. Performance Evaluation
In our experiment, we used the CBS dataset of Shanghai Telecom, which contains the Internet information of mobile users accessing 3233 CBSs. These data contain the detailed start and end time of each mobile user accessing the CBSs. Shanghai is a typical densely populated city, so it can fully meet the requirements of a mobile edge computing network.
5.1. Comparison of Approaches
We implement the proposed framework to verify the performance and compared it with other representative deployment approaches in terms of access latency and workload balancing, as follows:
MIP. This approach is an algorithm for solving mixed integer programming problems, which are optimization problems that require minimizing or maximizing a linear objective function subject to linear constraints.
K-means. This approach is commonly used to automatically cluster a data set into K groups [
27]. We use K-means clustering algorithms to find K clusters of CBSs, then place K edge servers into their centers to minimize the within-cluster sum of squares.
Top-K. This approach places the K edge servers at the Top-K base stations, where a base station is a Top-K base station if the number of mobile user requests that it receives is among the Top-K values. The rationale behind this approach is to place edge servers at the K busiest base stations that have more mobile user requests than others.
Random. This approach randomly selects K CBSs to deploy edge servers.
5.2. Comparison of Results
5.2.1. Changing the Number of Servers
Assuming that each CBS randomly receives task requests from mobile end devices. First, we fix the number of base stations as 3000 and change the number of servers, and observe the impact of different server deployment numbers on latency and load balancing.
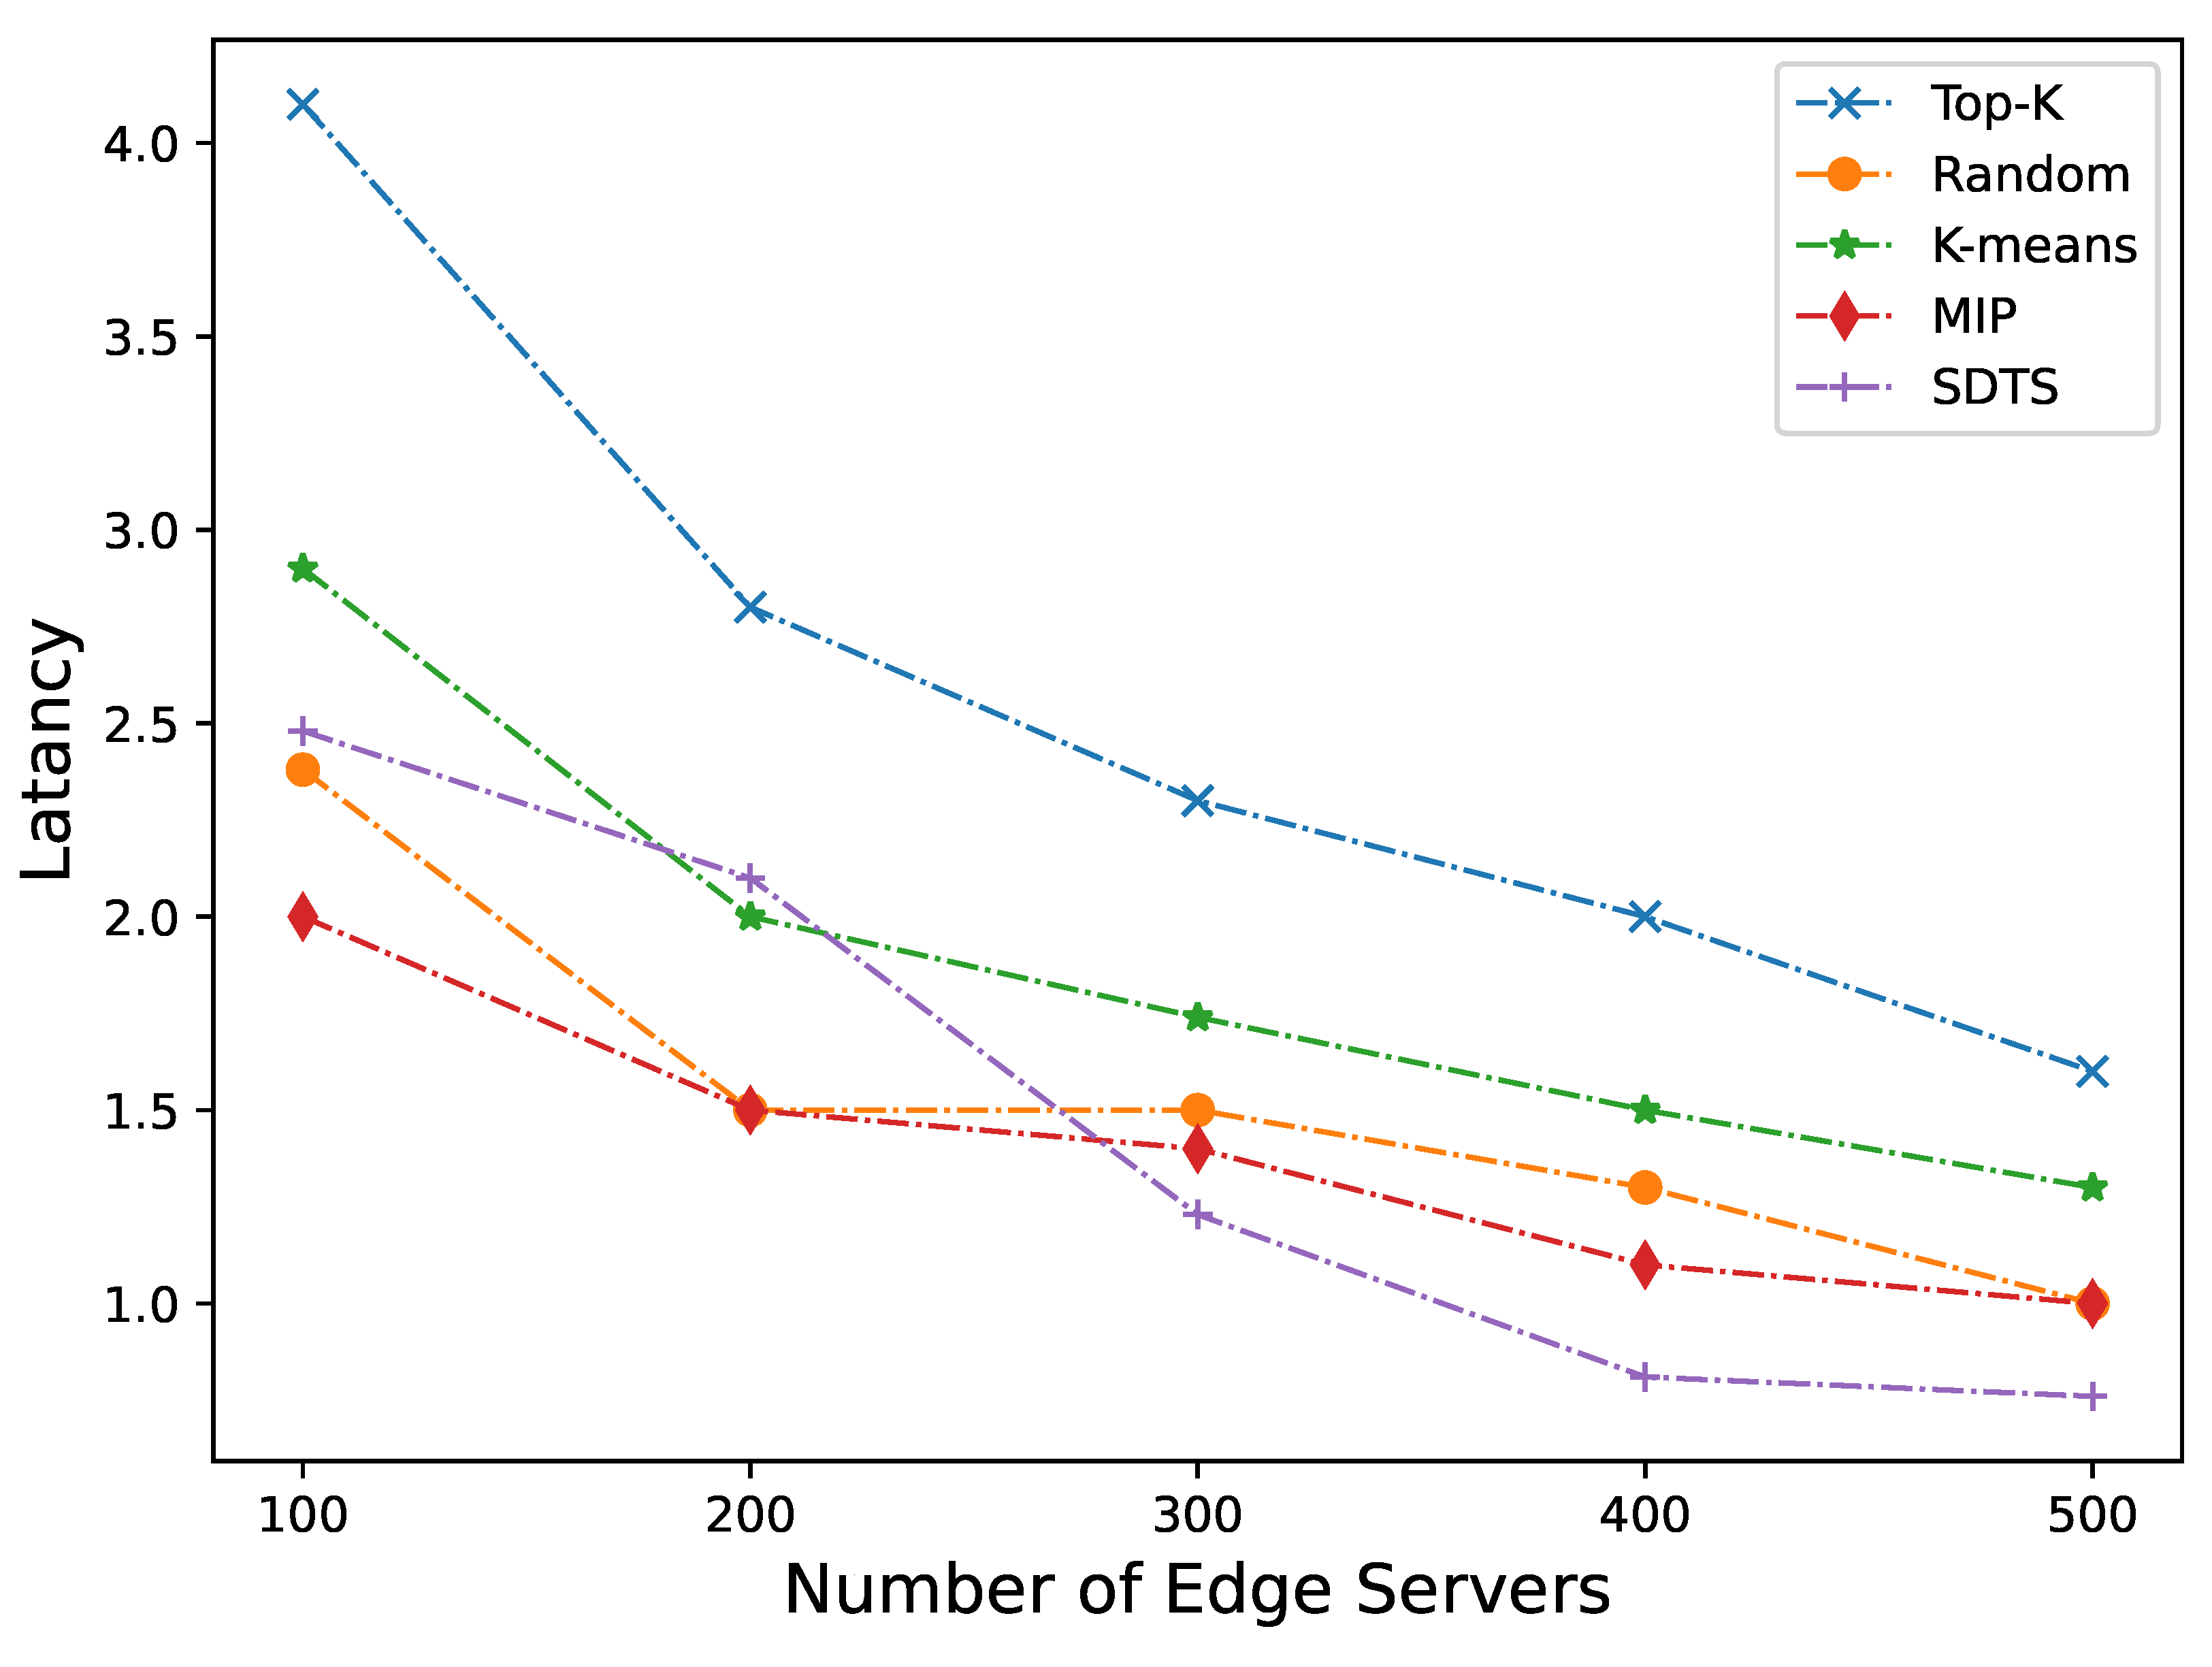
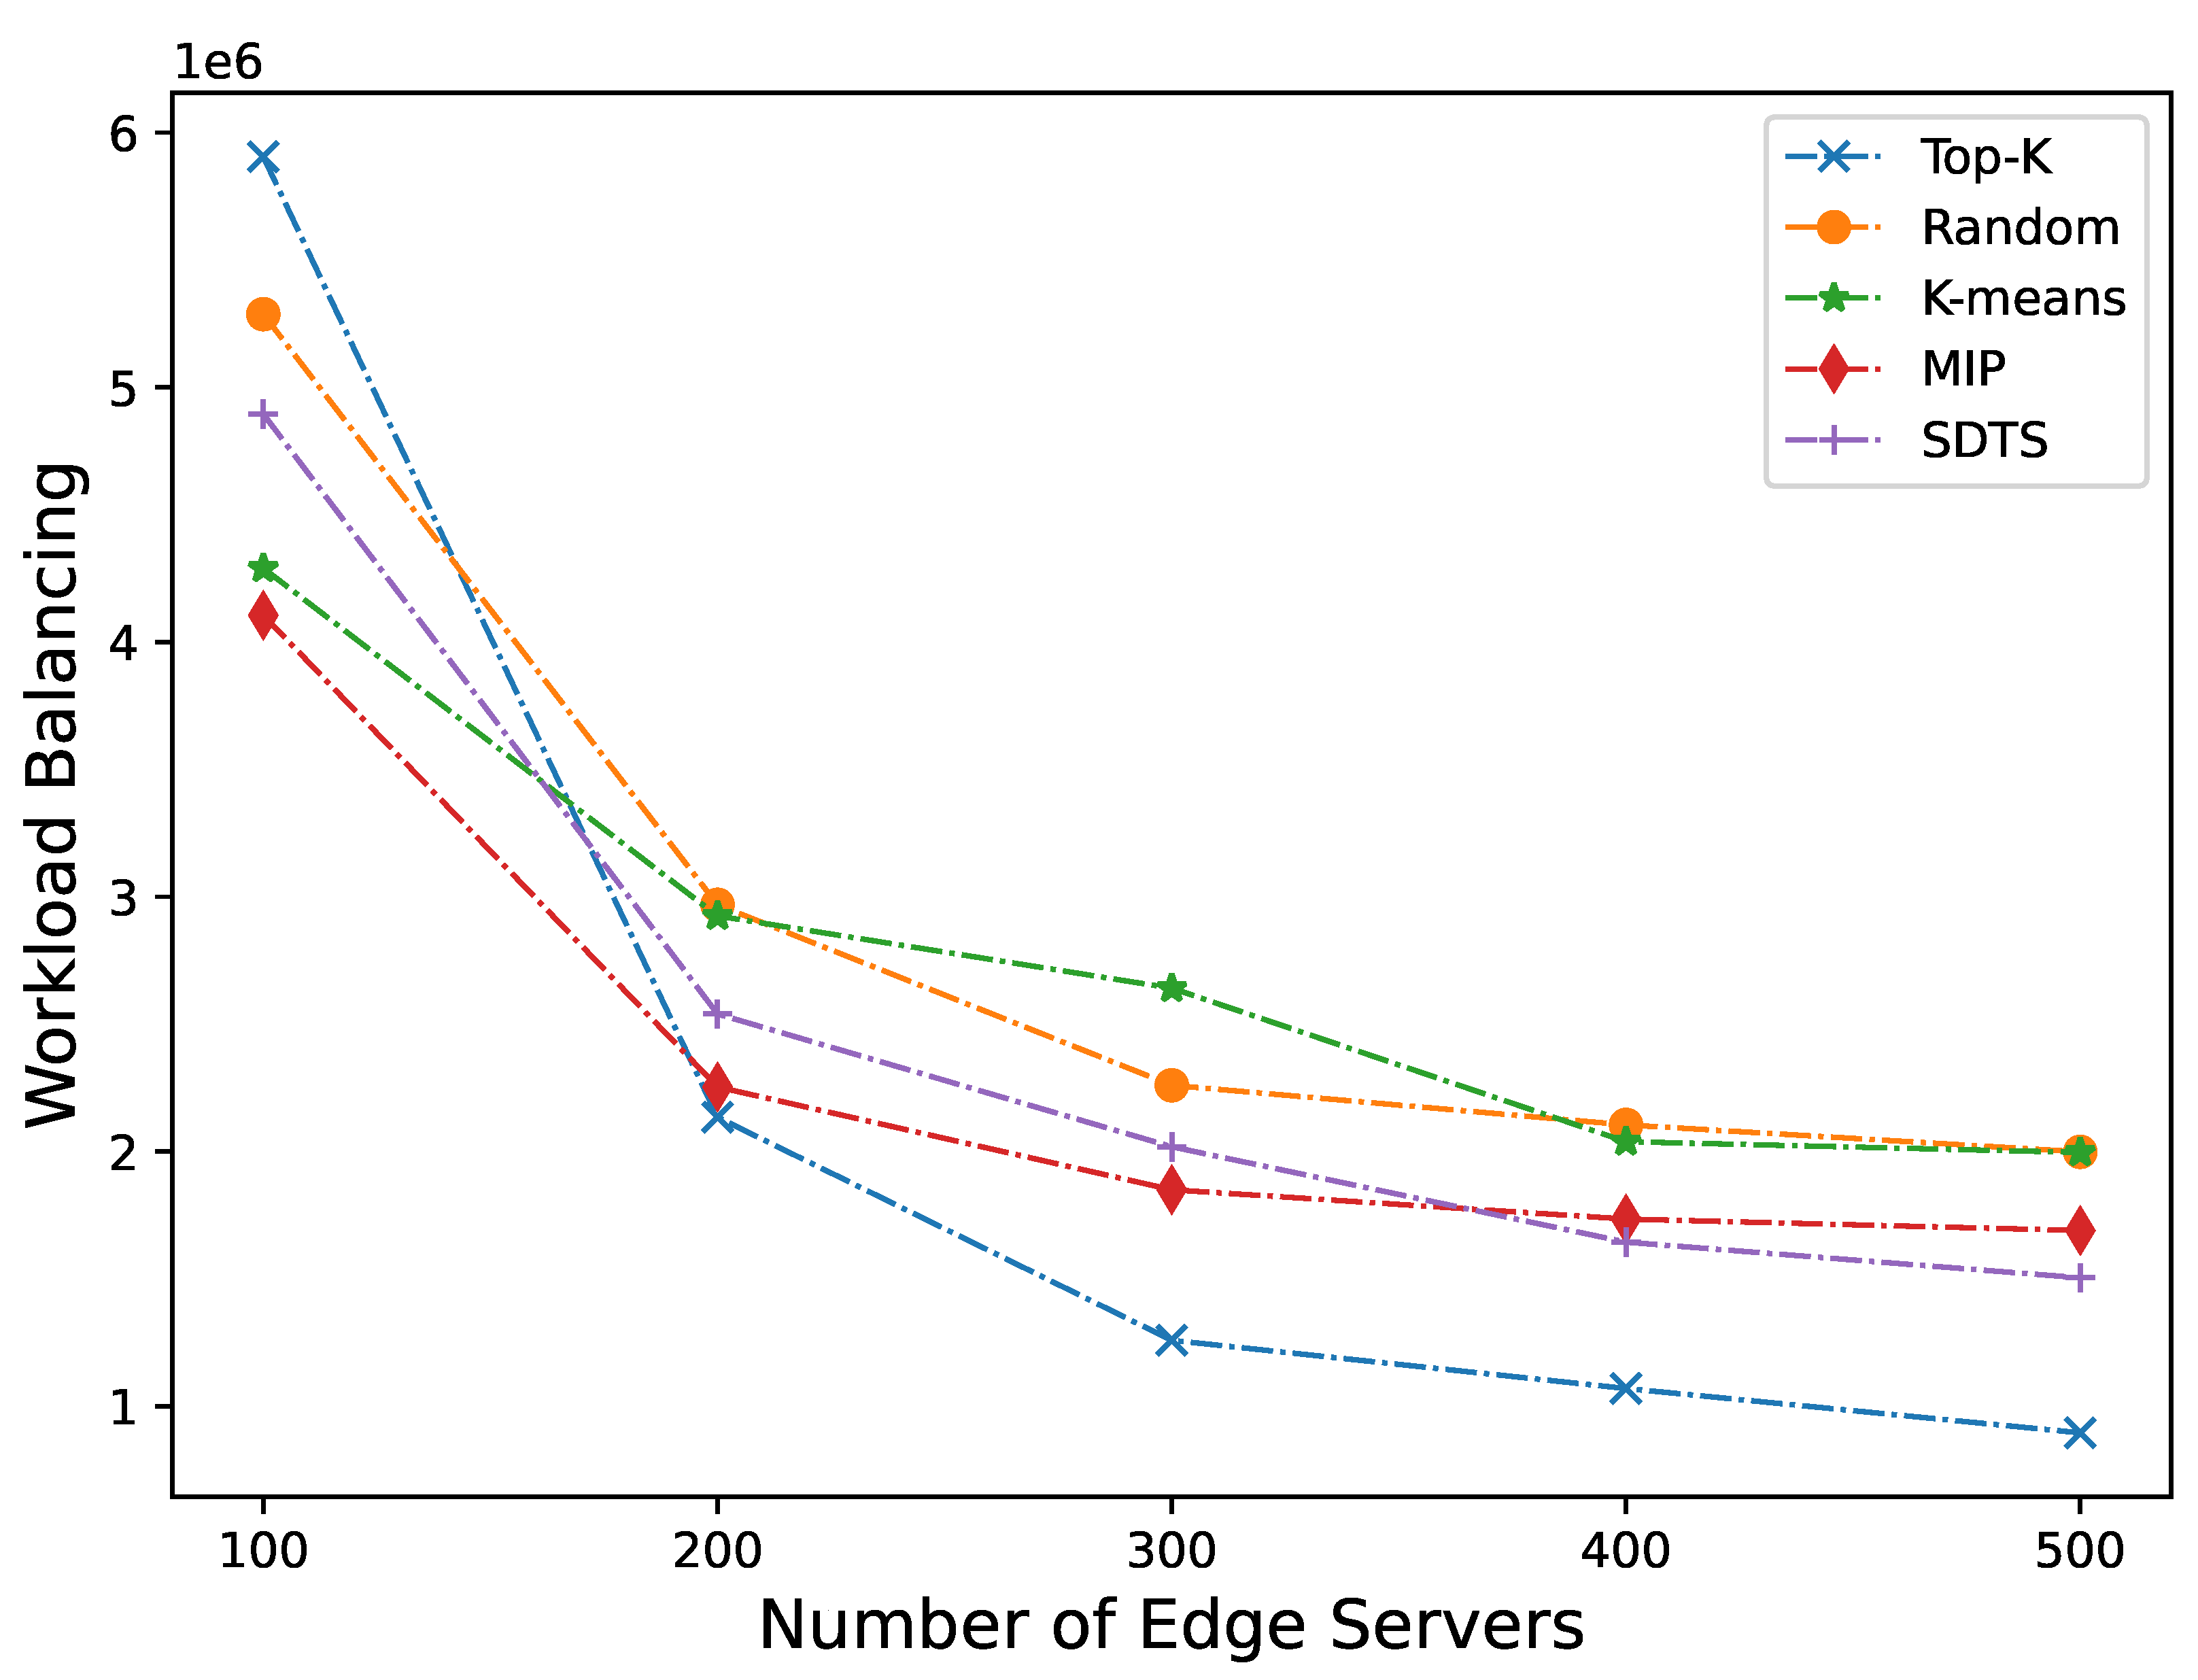
Figure 4 and
Figure 5 show the performance of latency and workload balancing of edge servers in different strategies as the number of servers increases. Overall, our approach is more effective than other approaches in terms of both latency and workload balancing.
From the perspective of access latency of edge servers (as shown in
Figure 4), when the number of servers is between 100 and 200, the shortage of edge servers, the increase of workload, and the limited scheduling capacity of a few scheduler servers will occur due to the small number of servers. The average latency will be 20.72% higher than the MIP. The performance of SDTS improves as the number of servers increases. When thenumber of servers is between 200 and 300, the difference in average latency with MIP becomes smaller and lower than K-means by 13.48%. The advantage of SDTS becomes evident when the number of servers value exceeds 300. The latency decreases faster as the number of servers increases. The average latency of edge servers between 250 and 500 is 28.64% lower than that of the MIP.
From the perspective of workload balancing (as shown in
Figure 5), when the number of servers is between 100-200, due to the insufficient scheduling capabilities of the scheduler servers, the workload balancing capability is 17.71% worse than that of MIP. However, as the number of servers increases, the load balancing level of SDTS significantly improves. When the number of servers is between 250 and 500, the load balancing capability of SDTS is 6.28% higher than that of MIP, but still significantly lower than that of Top-K. Although Top-k has the best workload balancing capability, if we shift our attention to
Figure 4, we can find that this is at the cost of significantly higher latency than other approaches, which contradicts the goal of mobile edge computing.
From the experimental results, it can be seen that DSTS achieves better results in terms of latency. This is because DCRs are generated before deploying servers, the servers that process requests from end devices will not exceed the DCR that the end device belongs to, that is, the latency can be controlled within a certain range even in the worst case. DSTS employs edge scheduler servers to schedule tasks, and the workload balancing result is not ideal when there are fewer edge servers. However, when the number of edge servers increases to around 350, the workload balancing ability is basically not much different from MIP, and then gradually better than MIP. Therefore, the proposed SDTS outperforms other comparative methods in terms of latency and workload balancing. The ideal number of effective CBS in Shanghai is around 3000, when the number of edge server deployments is about 400, SDTS can achieve the optimal latency and workload balancing.
5.2.2. Changing the Number of CBSs
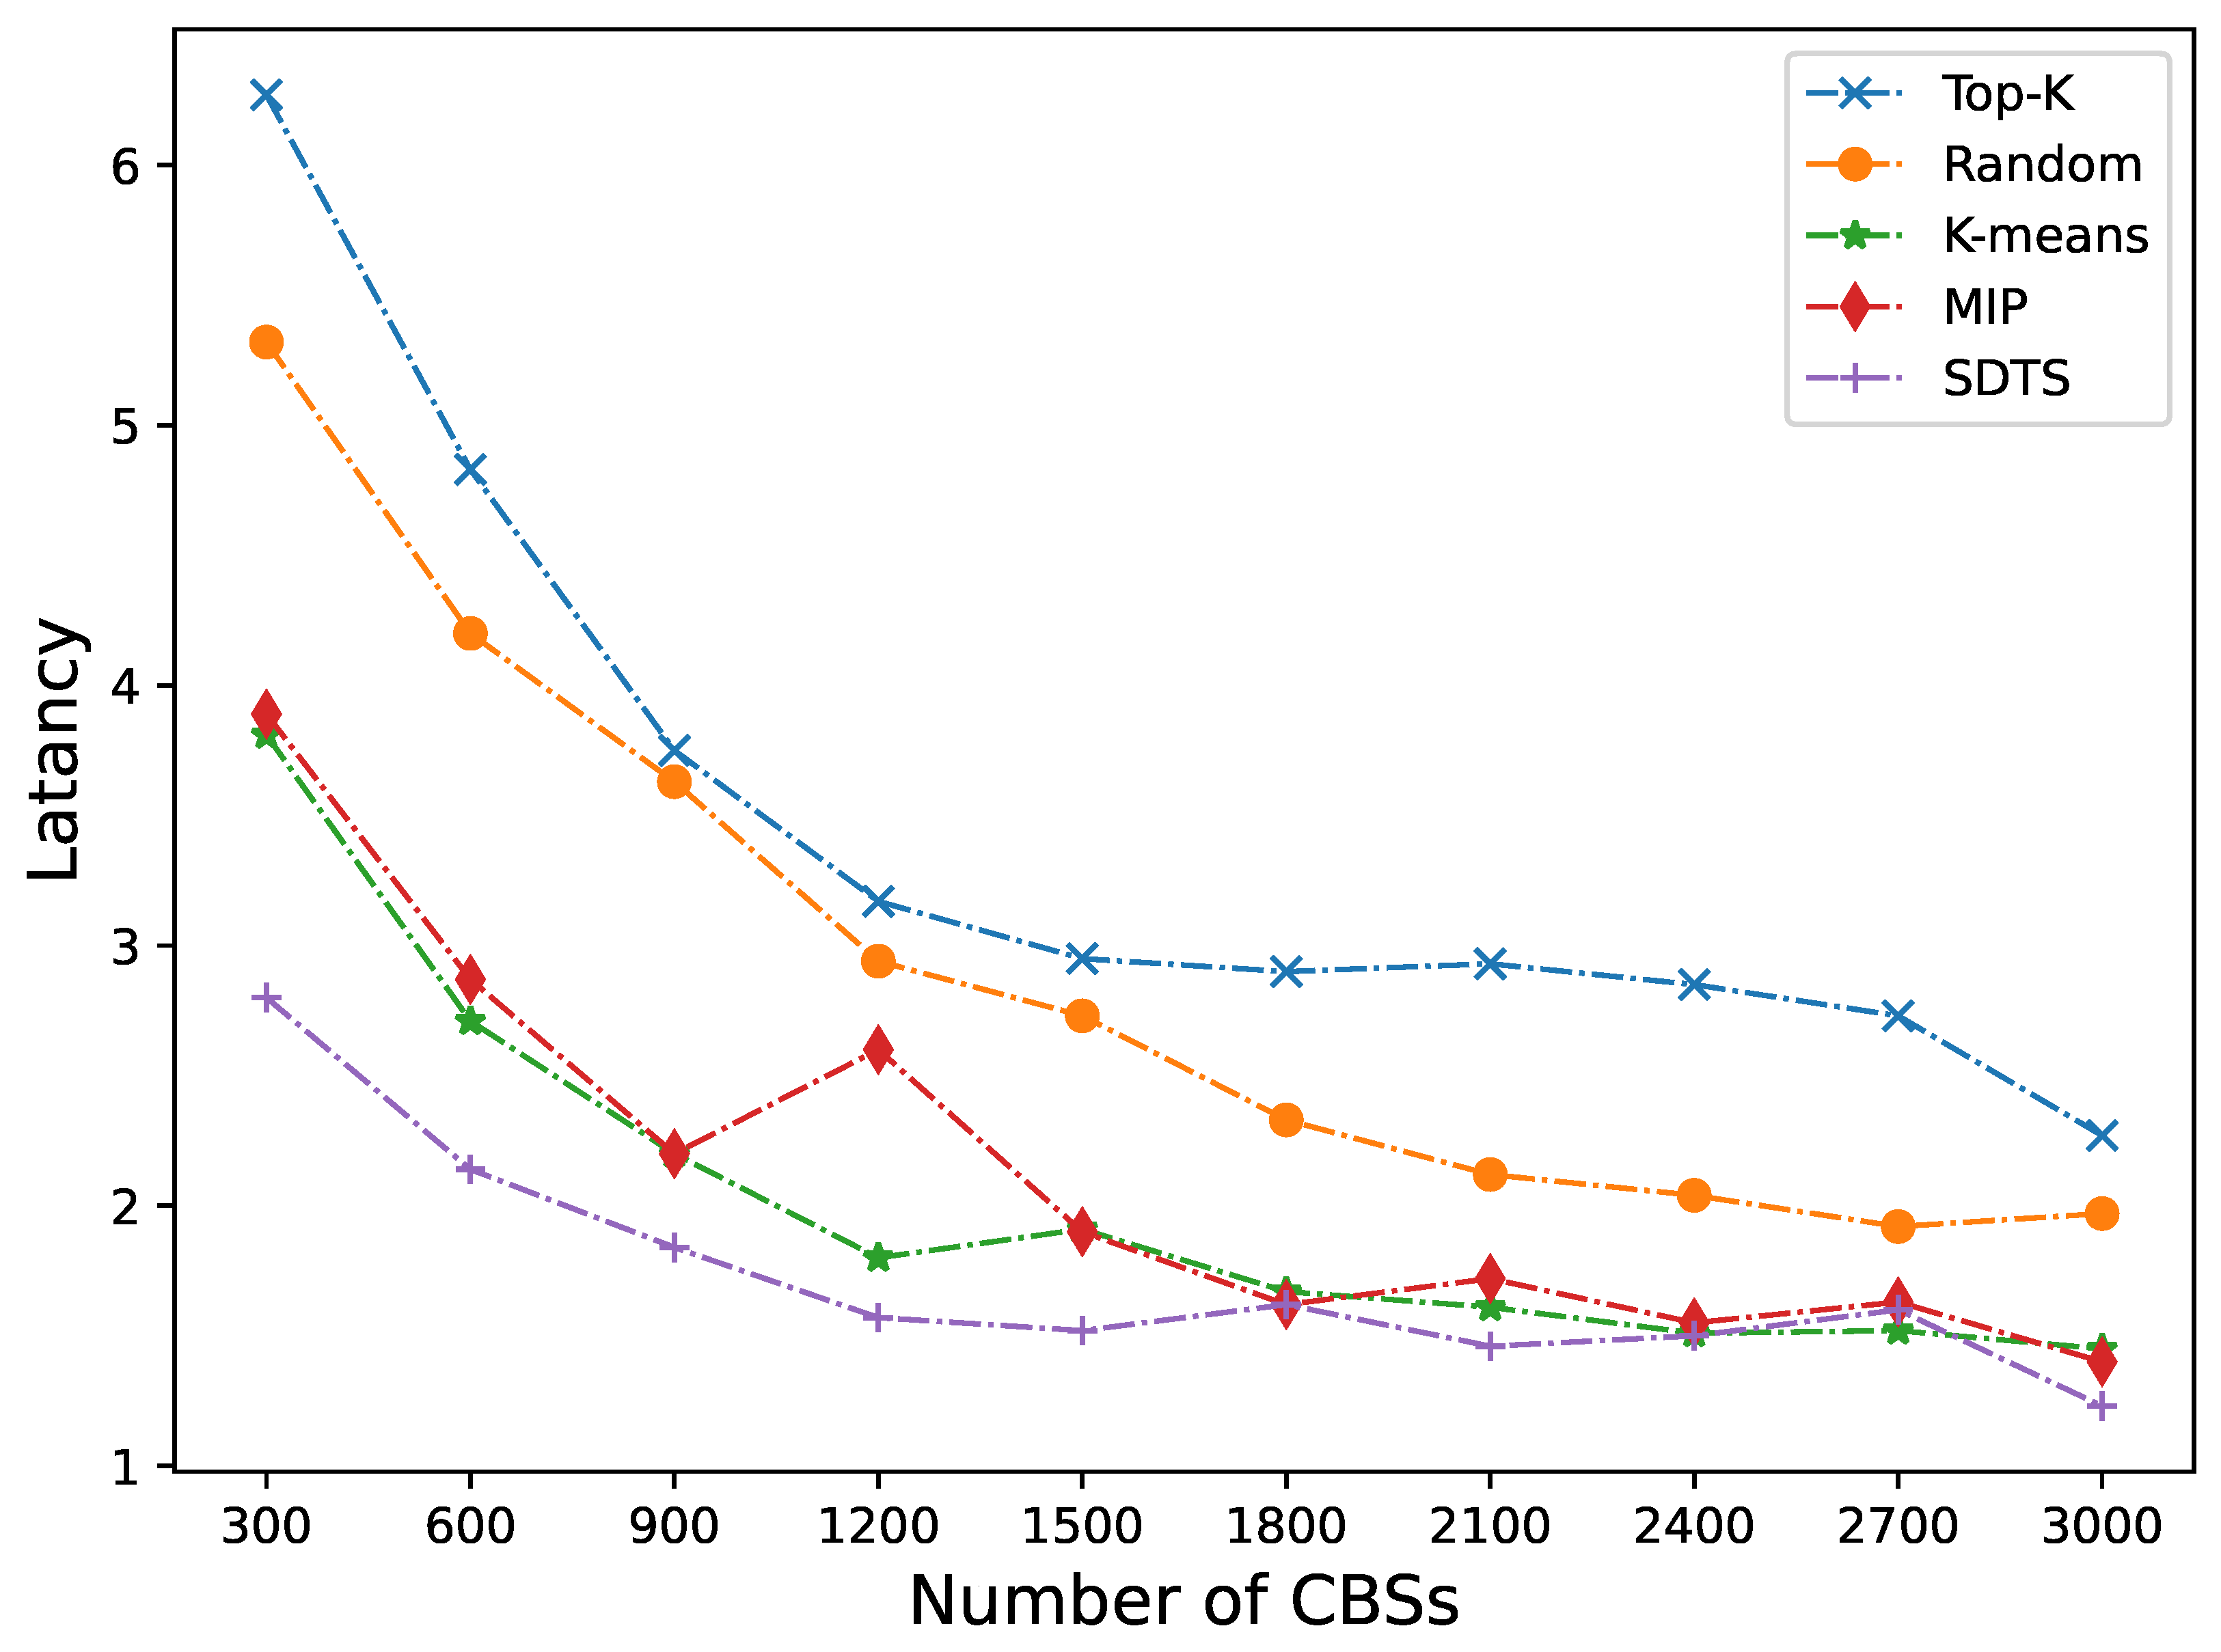
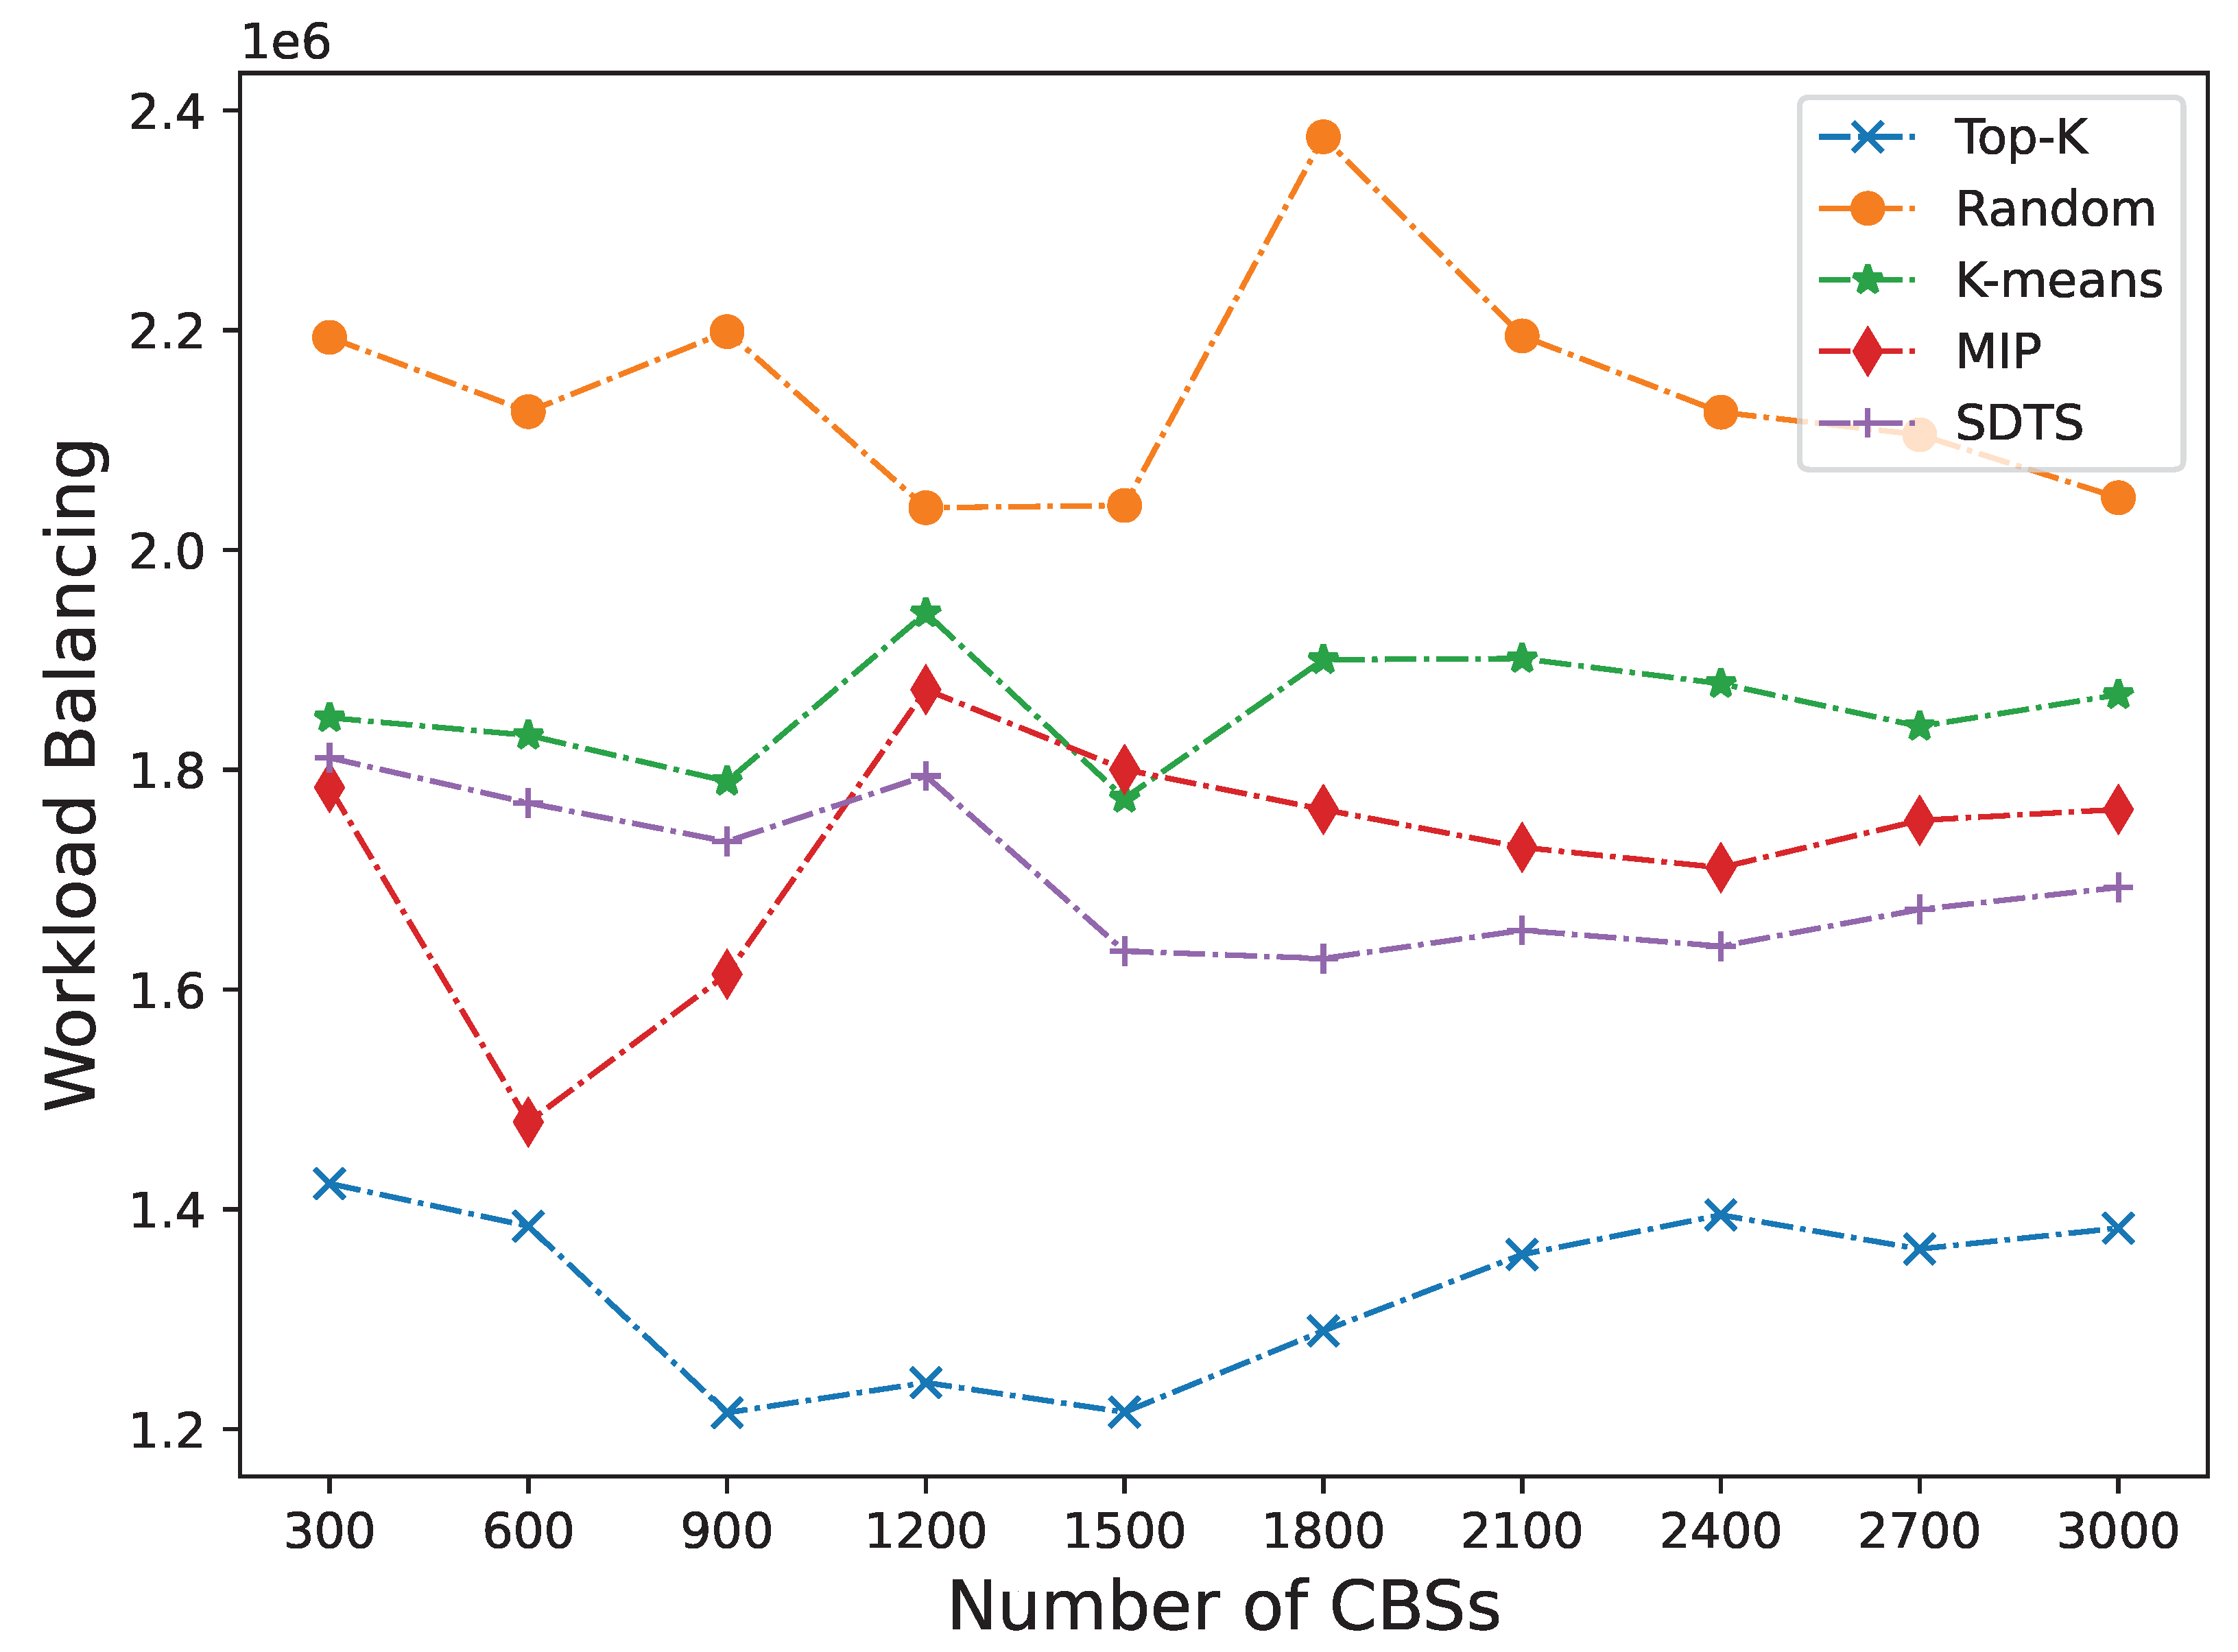
The deployment of servers requires a lot of costs, so it cannot be done blindly or excessively. Next, we fix the number of servers as 400 and change the number of CBSs. It can be seen from
Figure 6 and
Figure 7 that our method is still more effective than other methods in terms of latency and workload balancing.
As shown in
Figure 6, when the number of CBSs is between 300 and 1200, the average latency of SDTS is 27.83% lower than that of K-means. As the number of CBS increases, the trend of reducing latency gradually slows down. When the number of CBSs is between 1500 and 3000, the average latency is 3.26% lower than that of the MIP. The fluctuation of latency can also be seen that as the number of CBS increases, frequent scheduling of user tasks will affect latency. As shown in
Figure 7, the workload balancing results are relatively smooth, but after the number of CBS exceeds the limit, the curve of SDTS will have a clear upward trend. This is because as the number of CBS increases, the computing resources of edge servers are insufficient, and the control servers need more time to schedule. The cost of task migration will increase. Therefore, the number of edge CBS cannot be infinite.
6. Conclusions
This paper proposes a server deployment and task scheduling framework in multi-edge collaborative computing that achieves low latency and excellent workload balancing. By dividing a MAN into DCRs based on the density characteristics of mobile end devices, and servers are deployed independently in each sub-region. A two-step clustering algorithm and a task scheduling algorithm are designed to deploy servers as close as possible to the mobile devices. This ensures that the servers processing a request for an end device does not exceed the DCR range that the end device belongs to, that is, the latency can be controlled within a certain range even in the worst case. Based on the edge servers deployment approach, an edge scheduling layer is established in each DCR to manage the resources and schedule tasks of the edge servers to optimize latency and load balancing as much as possible. The experimental evaluation concludes that SDTS outperforms other comparative strategies in terms of latency and workload balancing.
References
- Index, C.V.N. Global mobile data traffic forecast update, 2017–2022. Cisco white paper 2019. [Google Scholar]
- Nazari Jahantigh, M.; Masoud Rahmani, A.; Jafari Navimirour, N.; Rezaee, A. Integration of internet of things and cloud computing: a systematic survey. IET Communications 2020, 14, 165–176. [Google Scholar] [CrossRef]
- Cisco, U. Cisco annual internet report (2018–2023) white paper. Cisco: San Jose, CA, USA 2020, 10, 1–35. [Google Scholar]
- Zaman, S.K.u.; Jehangiri, A.I.; Maqsood, T.; Ahmad, Z.; Umar, A.I.; Shuja, J.; Alanazi, E.; Alasmary, W. Mobility-aware computational offloading in mobile edge networks: a survey. Cluster Computing 2021, 1–22. [Google Scholar] [CrossRef]
- Liyanage, M.; Porambage, P.; Ding, A.Y.; Kalla, A. Driving forces for multi-access edge computing (MEC) IoT integration in 5G. ICT Express 2021, 7, 127–137. [Google Scholar] [CrossRef]
- Mahmood, O.A.; Abdellah, A.R.; Muthanna, A.; Koucheryavy, A. Distributed Edge Computing for Resource Allocation in Smart Cities Based on the IoT. Information 2022, 13, 328. [Google Scholar] [CrossRef]
- Liu, Q.; Gong, J.; Liu, Q. Blockchain-Assisted Reputation Management Scheme for Internet of Vehicles. Sensors 2023, 23, 4624. [Google Scholar] [CrossRef] [PubMed]
- Ometov, A.; Molua, O.L.; Komarov, M.; Nurmi, J. A survey of security in cloud, edge, and fog computing. Sensors 2022, 22, 927. [Google Scholar] [CrossRef]
- Ren, Y.; Zeng, F.; Li, W.; Meng, L. A low-cost edge server placement strategy in wireless metropolitan area networks. In Proceedings of the 2018 27Th International conference on computer communication and networks (ICCCN). IEEE, 2018, pp. 1–6.
- Wang, S.; Zhao, Y.; Xu, J.; Yuan, J.; Hsu, C.H. Edge server placement in mobile edge computing. Journal of Parallel and Distributed Computing 2019, 127, 160–168. [Google Scholar] [CrossRef]
- Ali, A.; Iqbal, M.M.; Jamil, H.; Qayyum, F.; Jabbar, S.; Cheikhrouhou, O.; Baz, M.; Jamil, F. An efficient dynamic-decision based task scheduler for task offloading optimization and energy management in mobile cloud computing. Sensors 2021, 21, 4527. [Google Scholar] [CrossRef]
- Mao, Y.; You, C.; Zhang, J.; Huang, K.; Letaief, K.B. A survey on mobile edge computing: The communication perspective. IEEE communications surveys & tutorials 2017, 19, 2322–2358. [Google Scholar]
- Li, Y.; Wang, S. An energy-aware edge server placement algorithm in mobile edge computing. In Proceedings of the 2018 IEEE International Conference on Edge Computing (EDGE). IEEE, 2018, pp. 66–73.
- Yin, H.; Zhang, X.; Liu, H.H.; Luo, Y.; Tian, C.; Zhao, S.; Li, F. Edge provisioning with flexible server placement. IEEE Transactions on Parallel and Distributed Systems 2016, 28, 1031–1045. [Google Scholar] [CrossRef]
- Jia, M.; Cao, J.; Liang, W. Optimal cloudlet placement and user to cloudlet allocation in wireless metropolitan area networks. IEEE Transactions on Cloud Computing 2015, 5, 725–737. [Google Scholar] [CrossRef]
- Yang, S.; Li, F.; Shen, M.; Chen, X.; Fu, X.; Wang, Y. Cloudlet placement and task allocation in mobile edge computing. IEEE Internet of Things Journal 2019, 6, 5853–5863. [Google Scholar] [CrossRef]
- Xiang, H.; Xu, X.; Zheng, H.; Li, S.; Wu, T.; Dou, W.; Yu, S. An adaptive cloudlet placement method for mobile applications over GPS big data. In Proceedings of the 2016 IEEE Global Communications Conference (GLOBECOM). IEEE, 2016, pp. 1–6.
- Xu, Z.; Liang, W.; Xu, W.; Jia, M.; Guo, S. Efficient algorithms for capacitated cloudlet placements. IEEE Transactions on Parallel and Distributed Systems 2015, 27, 2866–2880. [Google Scholar] [CrossRef]
- Chung, A.; Park, J.W.; Ganger, G.R. Stratus: Cost-aware container scheduling in the public cloud. In Proceedings of the ACM symposium on cloud computing, 2018, pp. 121–134.
- Shi, W.; Cao, J.; Zhang, Q.; Li, Y.; Xu, L. Edge computing: Vision and challenges. IEEE internet of things journal 2016, 3, 637–646. [Google Scholar] [CrossRef]
- Bouet, M.; Conan, V. Mobile edge computing resources optimization: A geo-clustering approach. IEEE Transactions on Network and Service Management 2018, 15, 787–796. [Google Scholar] [CrossRef]
- Shen, C.; Xue, S.; Fu, S. ECPM: an energy-efficient cloudlet placement method in mobile cloud environment. EURASIP Journal on Wireless Communications and Networking 2019, 2019, 1–10. [Google Scholar] [CrossRef]
- Taherizadeh, S.; Stankovski, V.; Grobelnik, M. A capillary computing architecture for dynamic internet of things: Orchestration of microservices from edge devices to fog and cloud providers. Sensors 2018, 18, 2938. [Google Scholar] [CrossRef]
- Asghari, A.; Sohrabi, M.K. Combined use of coral reefs optimization and reinforcement learning for improving resource utilization and load balancing in cloud environments. Computing 2021, 103, 1545–1567. [Google Scholar] [CrossRef]
- Asghari, A.; Azgomi, H.; et al. Multi-Objective edge server placement using the whale optimization algorithm and Game theory. Soft Computing 2023, 1–15. [Google Scholar]
- Wisely, D.; Wang, N.; Tafazolli, R. Capacity and costs for 5G networks in dense urban areas. IET Communications 2018, 12, 2502–2510. [Google Scholar] [CrossRef]
- Wagstaff, K.; Cardie, C.; Rogers, S.; Schrödl, S.; et al. Constrained k-means clustering with background knowledge. Icml 2001, 1, 577–584. [Google Scholar]
- MacQueen, J. Classification and analysis of multivariate observations. In Proceedings of the 5th Berkeley Symp. Math. Statist. Probability. University of California Los Angeles LA USA, 1967, pp. 281–297.
- Wang, Y.; Cao, Z.; Zhang, X.; Zhou, H.; Li, W. Clustering-based algorithm for services deployment in mobile edge computing environment. In Proceedings of the 2019 IEEE 25th International Conference on Parallel and Distributed Systems (ICPADS). IEEE, 2019, pp. 963–966.
- Hahsler, M.; Piekenbrock, M.; Doran, D. dbscan: Fast density-based clustering with R. Journal of Statistical Software 2019, 91, 1–30. [Google Scholar] [CrossRef]
- Schubert, E.; Sander, J.; Ester, M.; Kriegel, H.P.; Xu, X. DBSCAN revisited, revisited: why and how you should (still) use DBSCAN. ACM Transactions on Database Systems (TODS) 2017, 42, 1–21. [Google Scholar] [CrossRef]
- Ester, M.; Kriegel, H.P.; Sander, J.; Xiaowei, X. A density-based algorithm for discovering clusters in large spatial databases with noise 1996.
- Sander, J.; Ester, M.; Kriegel, H.P.; Xu, X. Density-based clustering in spatial databases: The algorithm gdbscan and its applications. Data mining and knowledge discovery 1998, 2, 169–194. [Google Scholar] [CrossRef]
- Wang, C.; Ji, M.; Wang, J.; Wen, W.; Li, T.; Sun, Y. An improved DBSCAN method for LiDAR data segmentation with automatic Eps estimation. Sensors 2019, 19, 172. [Google Scholar] [CrossRef]
|
Disclaimer/Publisher’s Note: The statements, opinions and data contained in all publications are solely those of the individual author(s) and contributor(s) and not of MDPI and/or the editor(s). MDPI and/or the editor(s) disclaim responsibility for any injury to people or property resulting from any ideas, methods, instructions or products referred to in the content. |
© 2023 by the authors. Licensee MDPI, Basel, Switzerland. This article is an open access article distributed under the terms and conditions of the Creative Commons Attribution (CC BY) license (http://creativecommons.org/licenses/by/4.0/).


