2. Introduction
India has experienced exponential urban growth in the last few decades. The urban population of India has grown from 285 million in 2001 to 377 million in 2011 (Census (GoI), 2014), which is likely to touch 533 million by 2025 (Census of India, 2006). The pattern of urbanization in India is characterized by continuous concentration of population and activities in large cities. Urbanization exerts environmental stress (air, water and land pollution, deforestation, construction activities) which also increases the risk of frequency of natural disasters like floods, landslides, water scarcity and likewise.
Cities have complex and inter-connected systems where services rely increasingly upon uninterrupted infrastructure networks. Disruption of these services would have repercussions on the functioning of the city and the well-being of its residents. Due to concentration of people and property, a hazard can turn into disasters that affect millions of people and property with aggregate worth billions.
The present circumstance where Indian economy is on the path of rapid growth, cities cannot function on their usual ways. It is for this reason that we require a climate resilient urban planning using an assessment of the climate vulnerabilities and risks. Climate change is an inevitable and pressing environmental concern for developed as well as developing economies and will likely to add additional stress on urban infrastructure and lifeline services. Climate induced stress on urban services will impact residents in many direct (urban floods, hot and cold periods, water shortage, and increased morbidity and mortality from hazard events, stress from sea level rise and increased cyclonic storms) and indirect ways (rise in ozone gas resulting in exacerbation of Asthma, increase in the vector growth responsible for conditions like dengue, malaria, chikungunya, etc. owing to the increased temperatures). The IPCC special report on “Managing the risks of Extreme Events and Disasters to Advance climate Change Adaptation” (UN IPCC, 2012), establishes a strong link between extreme weather events and climate change. It explains the causal relation between both and the correlated events including urban floods, cyclonic storms, heat waves and droughts. The unprecedented extreme weather events are result of the distortion in the natural climate. The phenomenon might affect the spatial extent, frequency, duration and trend of the extreme climate weather events. Morbidity from climate change could rise in cities, especially among populations that are vulnerable.
The UN's Sustainable Development Goal (SDG 11) (UN, 2019) on city resilience is now accepted as a critical urban agenda. For achieving SDG 11, cities are striving towards affordable basic services, livable housing conditions, sustainable transport systems and urban development, efficient waste management, accessible greens, participatory governance and local level strategies with a focus on risk reduction. Inefficient urban systems act as a hindrance to combat climate change, making urban areas less resilient. Hence the growing interest in bringing resilience is backed by addressing the short and long terms challenges of climate change.
31% of the population in India live in urban areas and the pace of urbanization is projected to increase. According to the world cities report of 2018 the population of cities like Delhi, Mumbai and Bengaluru will increase by 27%, 22% and 30% respectively in 2030.The existing demand and supply gap of infrastructure services is further widened by unplanned development and growing population. The inadequacies progress into creating a negative feedback loop.
According to the National Disaster Management Authority (NDMA) 58.6% of the Indian landmass is vulnerable to floods and river erosions, 5700 kilometers of country’s coastline is vulnerable to tsunamis and cyclones, and more than half (68 %) of its cultivable area is drought prone. In terms of the magnitude of disasters faced by India, it has been found that within a period of thirty years (1980-2010) the country has experienced a total of 431 disaster events, killing 43,039 lives and affecting 1521 million people. The total economic damage caused by these disasters were approximately US$ 48 billion. On an average the natural disasters affect 49 million people per year in India and bring estimated economic damages of US$ 1.55 billion to the country’s economy.
Past decadal incidents like Maharashtra floods of 2005 resulting in the death toll of 1000 plus, 2013 flash floods in Uttrakhand and Himachal Pradesh affecting around 5700 people, Kerala floods of 2018 causing the causalities of 433 and heat waves of 2013 affecting states like - Andhra Pradesh, Telangana, Odisha (Orissa), Rajasthan and Assam, depicts the vulnerability of Indian states and the need for disaster risk management in the urban India. Furthermore, recent events of disasters experienced by Indian cities like the cyclone Nisarga, cyclone Nirvar, Locusts attack, Kerala, Assam and Bihar floods, have exposed the vulnerability of Indian cities to multiple hazards. Cities incur heavy economic losses due to these hazards. As per the Central Water Commission data, US$ 0.63 billion is the total economic loss from the weather event flood in the last 65 years, from 1952 to 2018. The loss is inclusive of crops, housing and miscellaneous damages. Climate change is correlated to the intensity and frequency of the extreme weather events. The lives and live hoods of million people is affected by these events. Climate change erodes the developmental policies and affects the economic performance of the country.
The extreme weather events in the country in past decades have impacted numerous regions. They have adversely affected the lives and livelihood of the people. Many climate events in the recent past lead to the loss of lives and properly due to the absence of preparedness.
In the recent decades the increased number of extreme weather events (EWEs), which are., heatwaves, cold waves, tropical cyclones, floods, lightning, heavy rainfalls, and likewise highly impacted various regions of the Indian subcontinent leading to losses of lives and property and adversely affecting the livelihood of the vulnerable community. In a study by Kamaljit Ray (Kamaljit et al, 2021)., the trend analysis of last 50 years (1970-2019), depicts mortalities caused by extreme weather events. It is observed that the floods (46.1%) cause the highest share of deaths followed by cyclones (28.6%) and Heat wave (12.3%)
4. Materials and Methods
4.1. Developing Methodological Framework
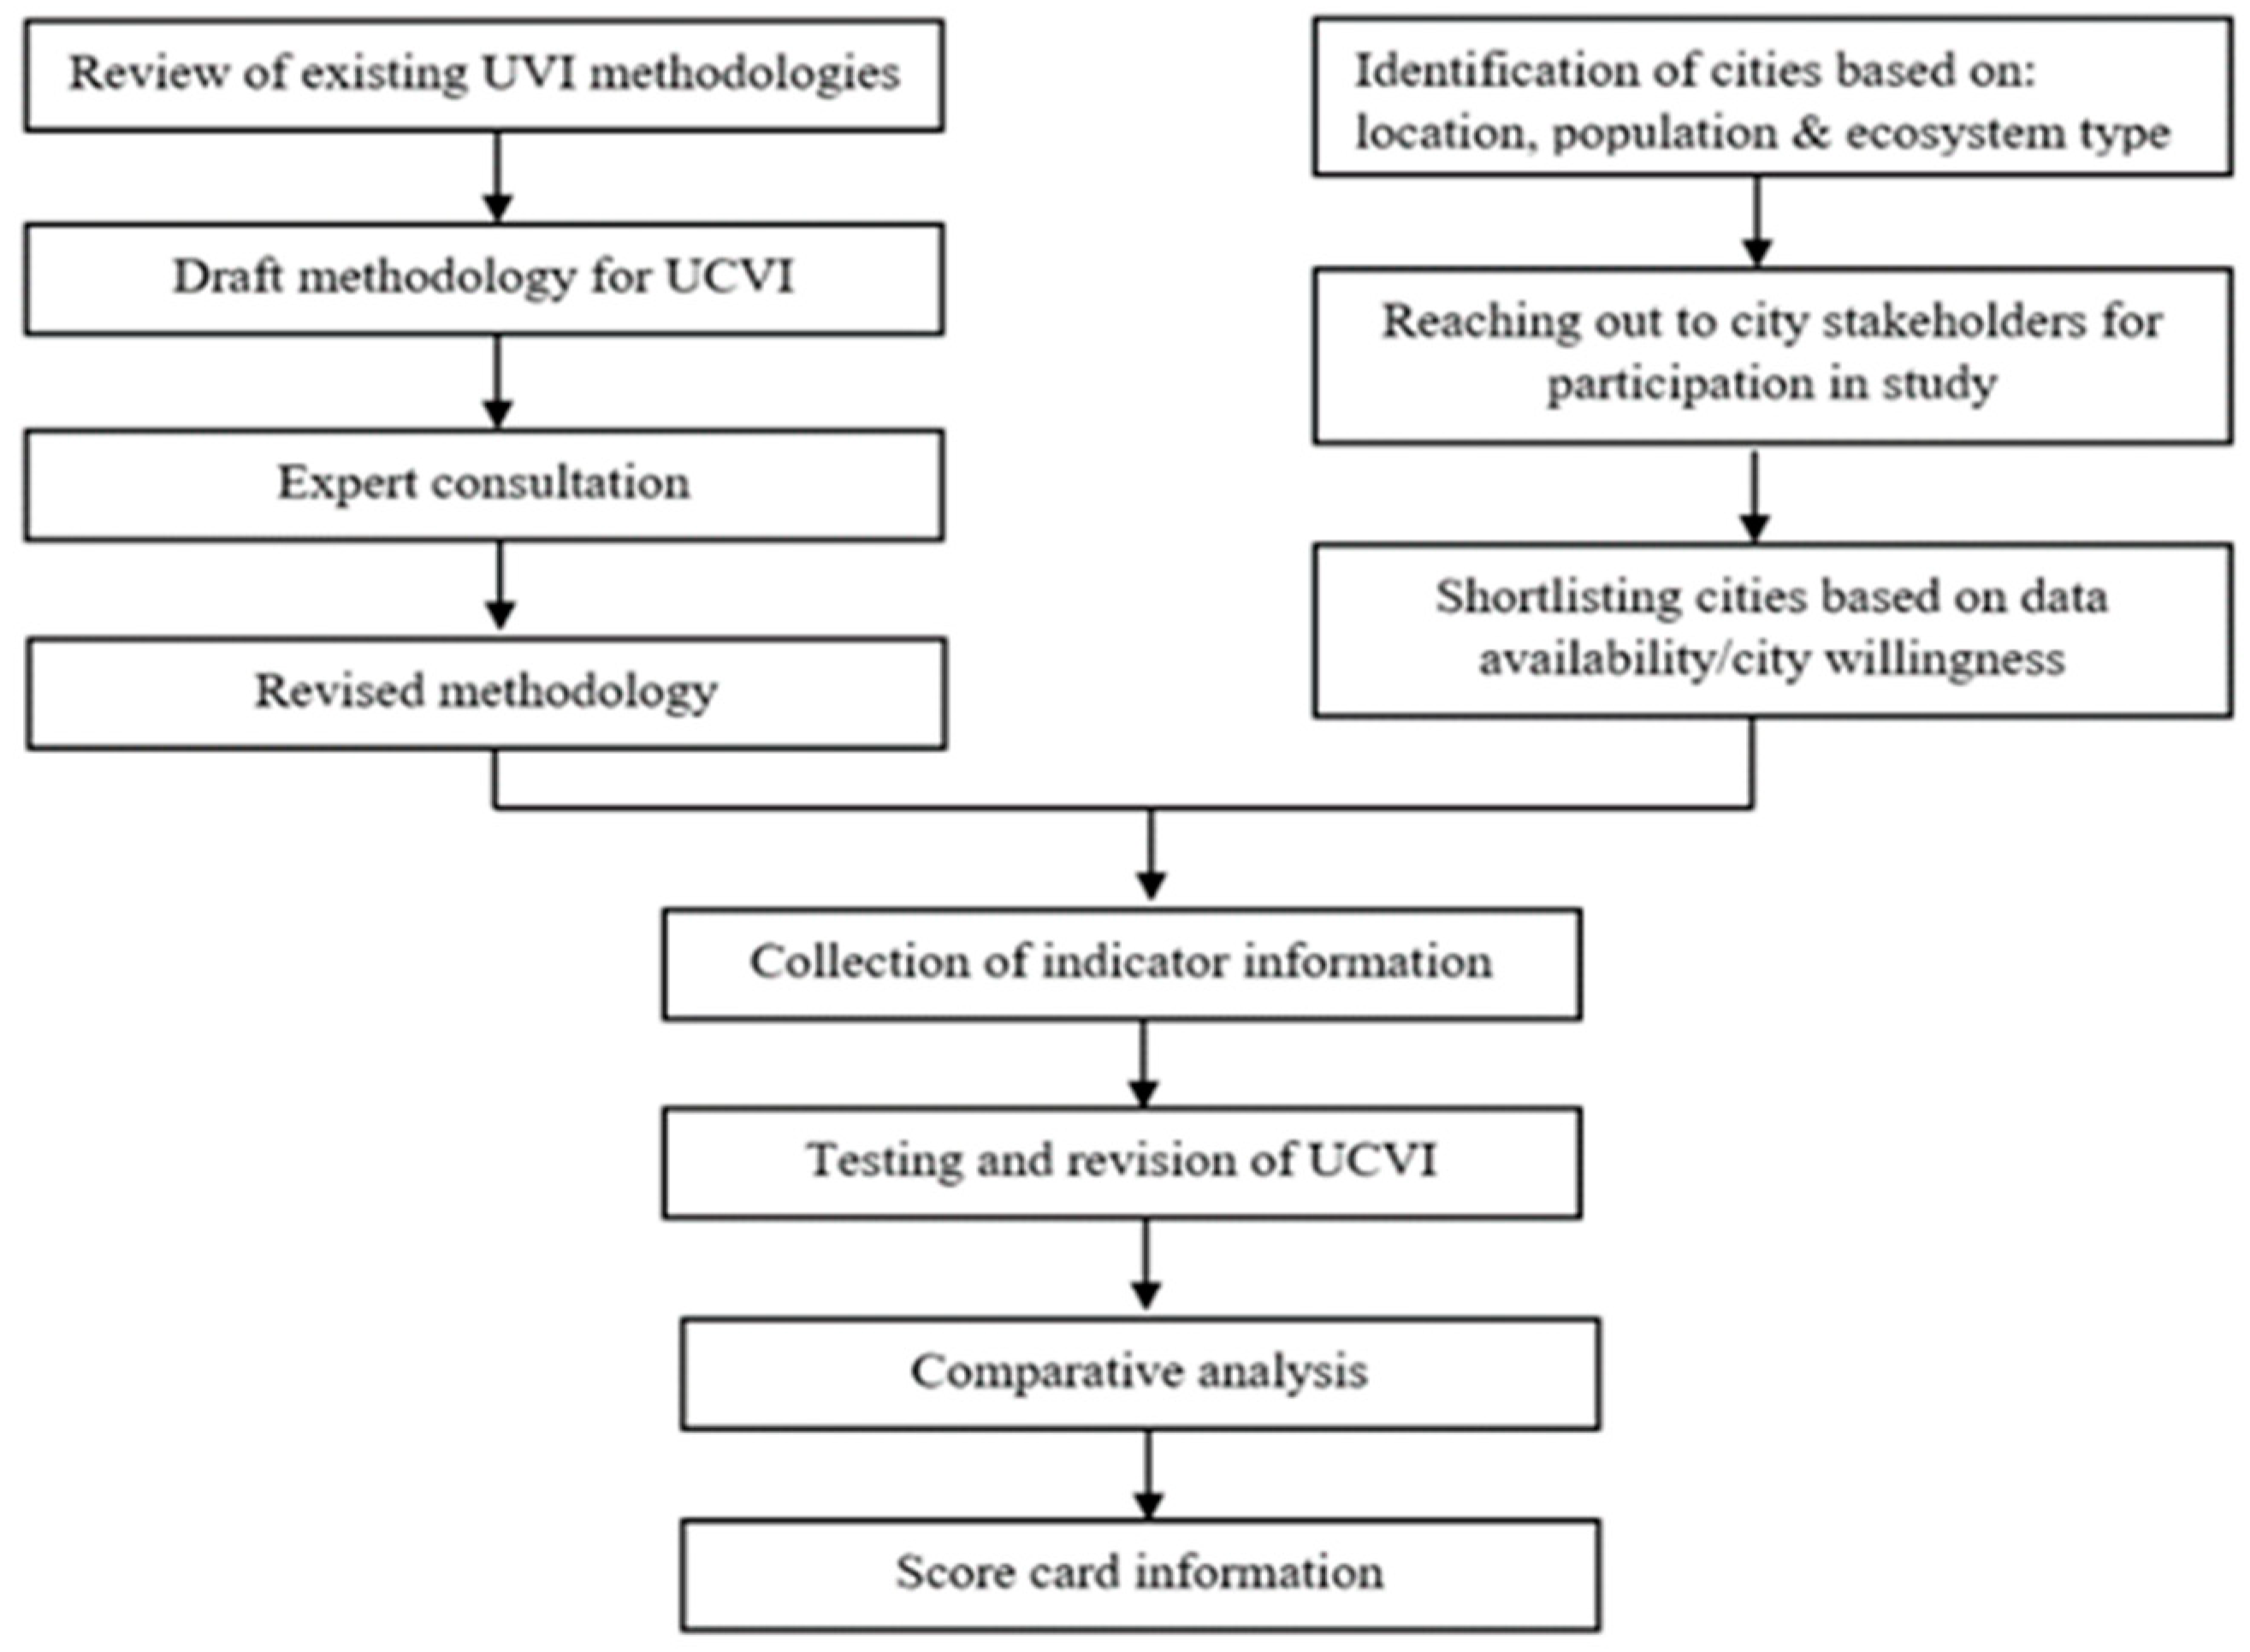
The HIGS (Hazard Exposure, Infrastructure, Governance, Socio-Economic variables) (Parikh J. e., 2014) framework developed by IRADe served as the basis for developing the methodological framework for the current study. The framework consists of gathering relevant data in each category in order to identify key vulnerabilities and their linkages with natural causes, sustainable practices and the capacities of the concerned authorities.
New thematic indicators and sub-indicators were developed, after extensive literature review, to create a holistic risk assessment of climate change at the city level. The extent of Climate Change Vulnerability of the cities is measured based on the following thematic indicators viz.: Physical Vulnerability, Hazard vulnerability, Demographic Vulnerability, Financial Provisioning, Social Vulnerability, Infrastructure Vulnerability and Administration-Governance
A comprehensive index is developed to capture each of these seven thematic indicators. Further, the future vulnerability and preparedness of a city is a weighted aggregation of sub-indices (sub-Indices follow the above mentioned indicator/sub-indicator). These sub-indices are identified and then are quantified, normalized and aggregated to obtain composite vulnerability indices for different thematic indicators for the sectors.
Figure 1.
Methodology for preparing Urban Climate Vulnerability Assessment Index.
Figure 1.
Methodology for preparing Urban Climate Vulnerability Assessment Index.
4.2. Vulnerability Assessment Framework:
The extent of climate change vulnerability for the cities is measured based on respective thematic indicators: Physical, Hazard, Demographic, and Financial provisioning, Social, Infrastructure and Administration-Governance. Each of these thematic indicators will be supported by sub-indicators, with an objective to derive the vulnerability of each city. All the sub-indicators are ranked in three categories: low, medium or high, assessing its level of vulnerability. There is weightage assigned to each ranking (Low, Medium and high), wherein Low represents an indicator least affected by climate change, and a High is most affected by it. The weightage for each of these rankings is determined in accordance with the national and international benchmarks.
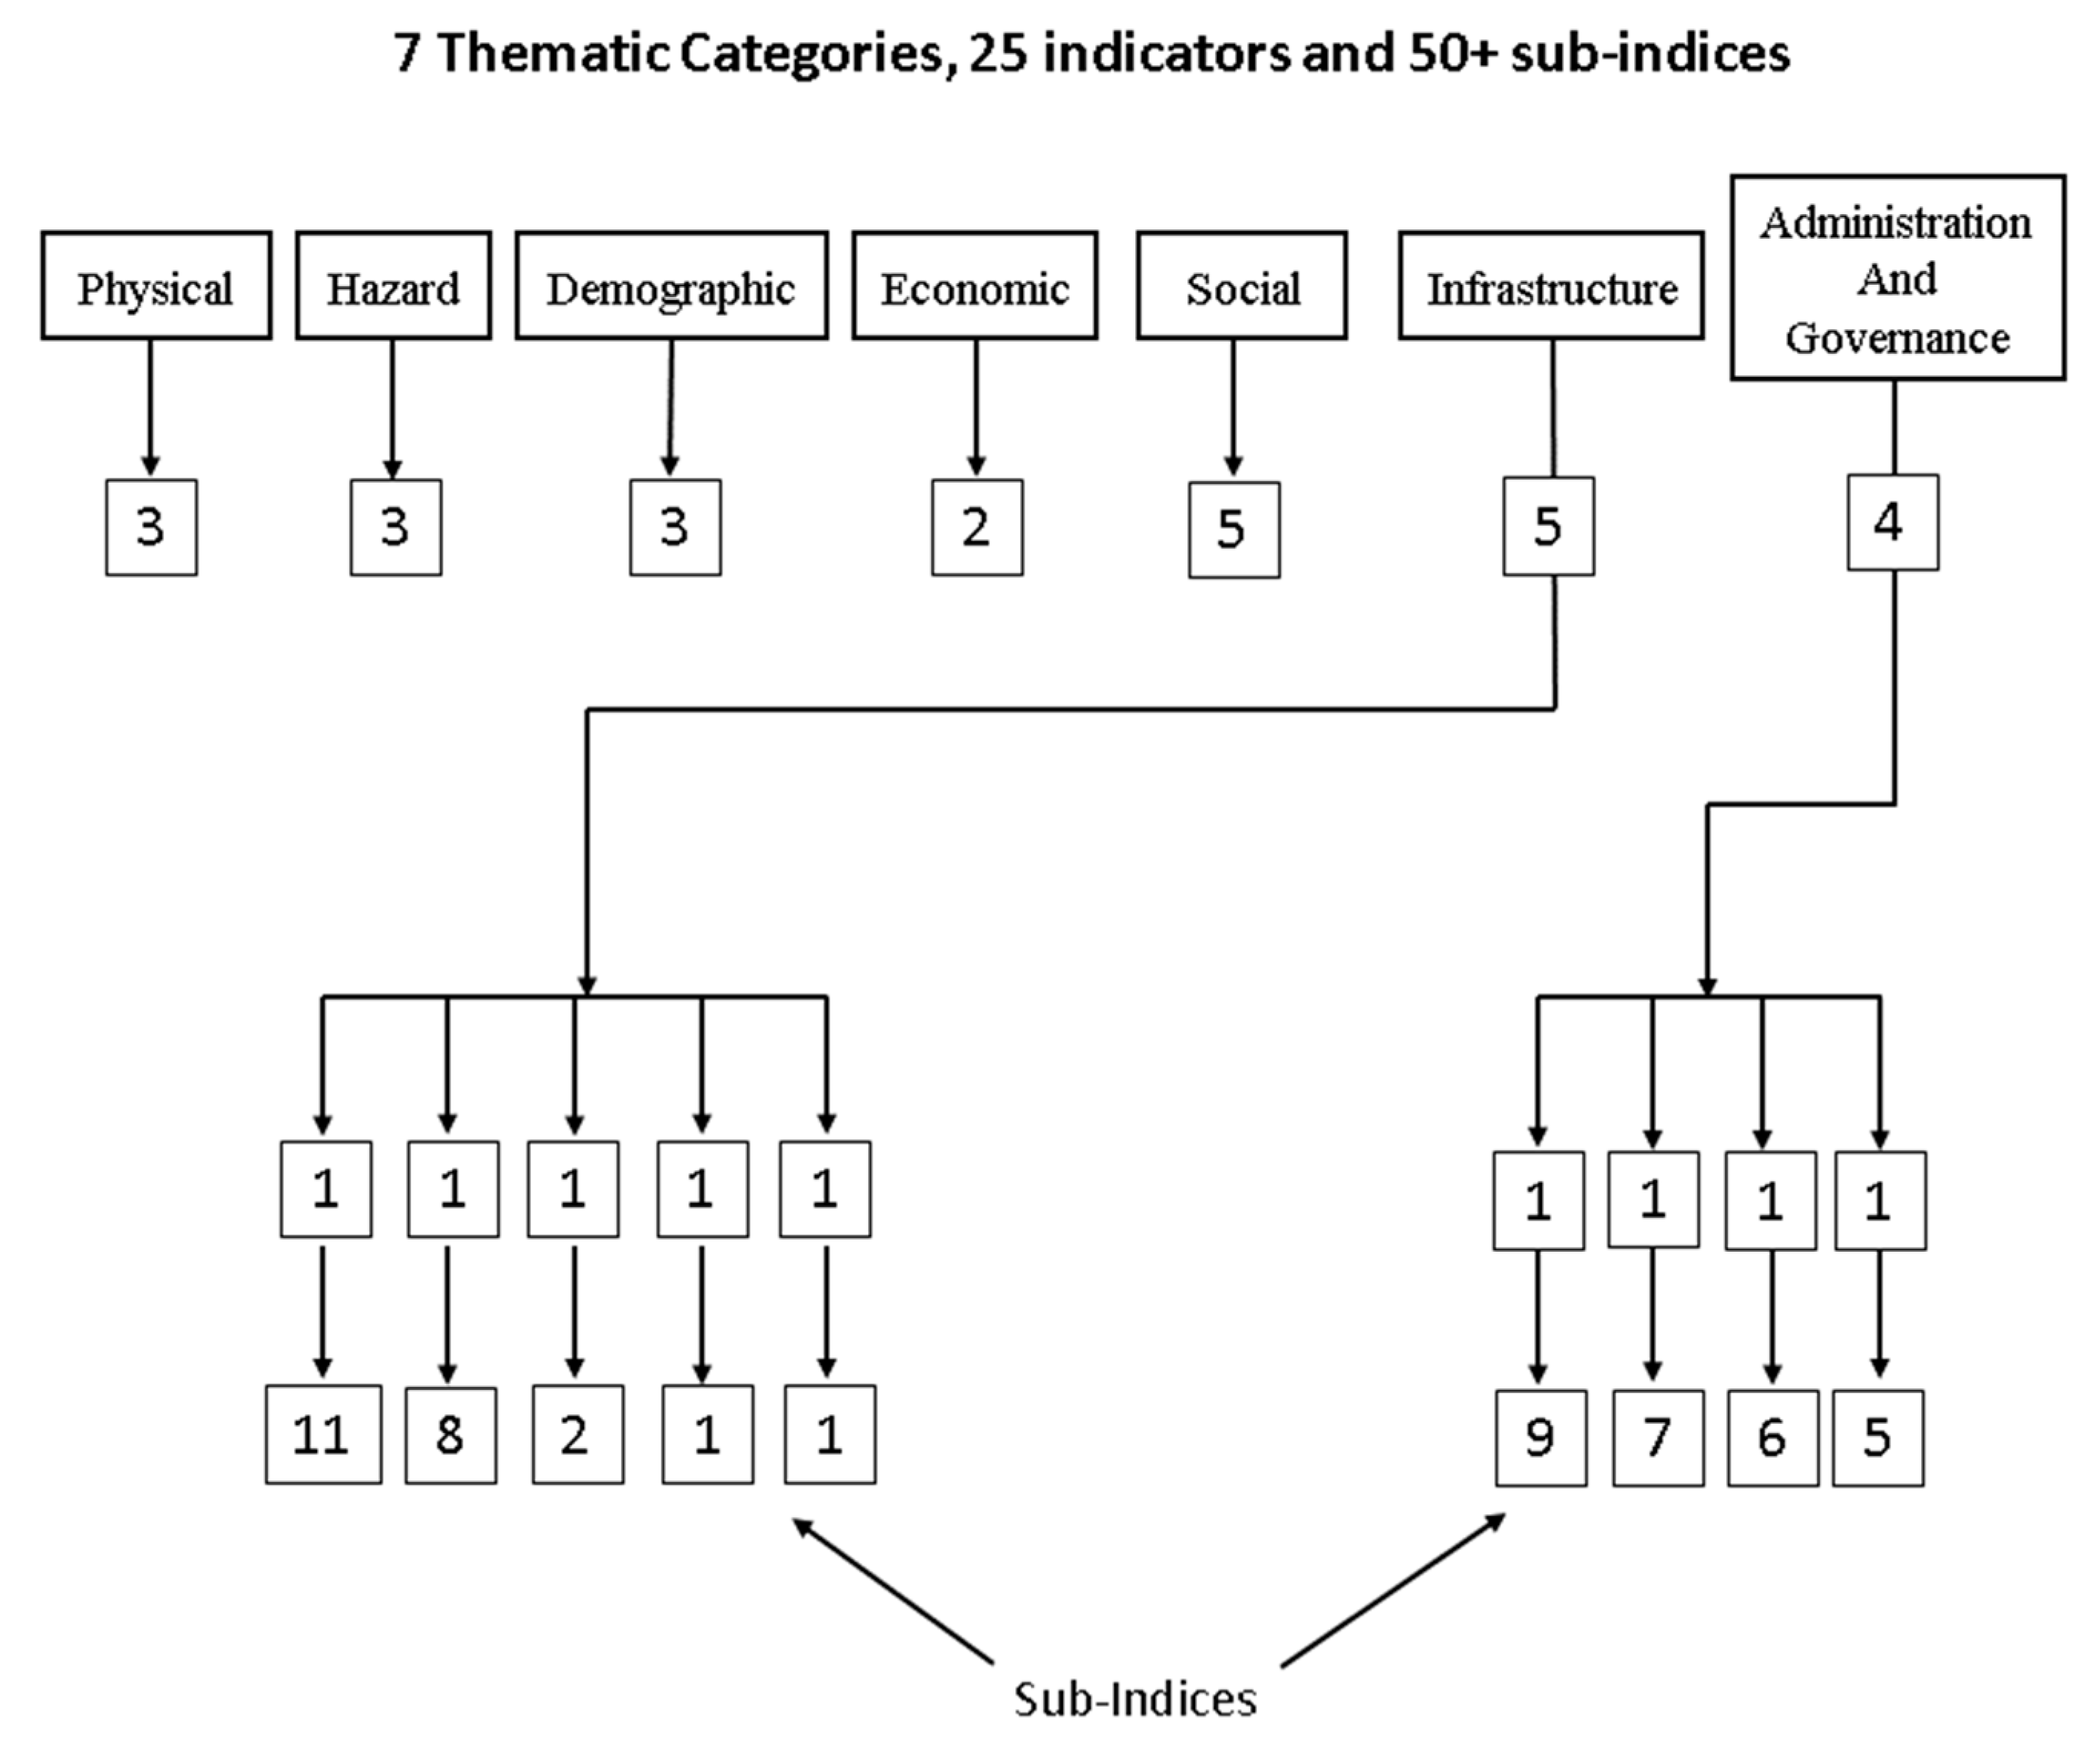
Figure 2.
Urban Climate Vulnerability Assessment Framework.
Figure 2.
Urban Climate Vulnerability Assessment Framework.
4.3. City Selection:
The cities are shortlisted on the basis of their geographical location, population, ecosystem types (coastal region, hilly region, flat terrain) and recent encounter with hazards/ hazard trends and the severity caused/ impact of the same. Seven cities identified for this project are; Delhi, Mumbai, Bengaluru, Chennai, Srinagar, Shillong and Ahmedabad.
Table 1.
City Typologies.
Table 1.
City Typologies.
| S.No. |
City |
City Classification |
Geographical Type |
Climate |
| 1 |
Delhi |
Mega city |
Inland |
Hot Semi Desert Climate |
| 2 |
Mumbai |
Mega city |
Coastal |
Monsoon ( Southwest Monsoon) Climate affected by Cyclones |
| 3 |
Chennai |
Metro city |
Coastal |
Monsoon (Northeast Monsoon) Climate affected by Cyclones |
| 4 |
Bengaluru |
Metro city |
Southern Plateau |
Moderate Climate |
| 5 |
Shillong |
Hill Station |
Northeast India |
Cold and Wet Climate |
| 6 |
Srinagar |
Valley Station |
North India |
Cold climate affected by Mid-latitude Weather Systems |
| 7 |
Ahmedabad |
Metro city |
Western Inland |
Hot Dry Climate |
-
Geographical Location
Geography is important in determining the hazards a city’s vulnerability. For example, the cities located on coasts, near rivers or water bodies can be more vulnerable to floods while those located on hilly areas can be prone to landslides more. Selection of cities from different geographical locations will help in covering all the possible vulnerability indicators and aspects replicable to determine the climate vulnerability of other cities in the future.
-
Population
All the selected seven cities of the study lie under the category of Class 1 towns as defined by Census 2001 Further the cities lie under the classification of: Class I UAs/Towns, Million Plus UAs/Towns, Metro Cities and Mega Cities
-
Ecosystem Type
The cities selected for the study are located in distinct ecosystems such as; Coastal region, Hilly region, inland etc. The existing ecosystem is vital in understanding the arrangement of urban systems and climatic conditions of a city.
-
Hazards
The existing hazard vulnerability of a city may get aggravated from new hazards. Therefore, a city’s previous encounter with hazards and trends in hazards forms an important part of solution to understanding the current vulnerability and also to predict the future hazardous conditions.
-
Severity and frequency of hazards
The hazard severity is and can be assessed in terms of the economic losses, fatality, causality etc. Severity or intensity is a major component of a hazard, along with the frequency of that disaster. This is because a disaster may strike every year, yet might not be a severe one. In contrast, a disaster might strike once in 100 years and cause unimaginable losses, as was the case with Kerala floods of 2018.
4.4. Composite Assessment Framework:
Physical Vulnerability: Under this indicator we recorded the number of residents directly or indirectly exposed to respective hazard, as population which resides in the vicinity of hazardous zones or vulnerable spots of the city are the ones exposed to a particular hazard. Hazard Vulnerability: Geographical location and historical hazard frequency are vital in determining the hazard vulnerability of a city, the susceptibility and preparedness to a hazard. Demographic vulnerability: Population composition is an integral aspect to understand the possible vulnerability of a city. The pace at which a city grows, along with the population density is essential to understand the attached risk and preparedness required. Financial Provisioning: To cope with the damages of hazards it requires various funds and thus the management of same is essential. Disaster management funds are availed from national level, state level, City level, multilateral agencies etc. and its becomes necessary to assess the optimal utilization of such funds. Social Vulnerability: Limited land supply and affordability in urban areas, often leads to slum and squatter settlements being located in places which are highly sensitive and neglected. Its enquires to record aspects of slum location and its population composition to assess the urban poor vulnerability. Infrastructure Vulnerability: A good infrastructure network is responsible for the uninterrupted working of an urban system. The infrastructure vulnerability is inclusive of city’s basic infrastructure – Water, Drainage, Solid waste management, power and telecommunication. The ranges are defined considering the service level benchmarks defined by. Ministry of Housing and Urban Affairs Administration and Governance: The administration and governance vulnerability aspect covers headers like land use, Planning and strategies, operational preparedness and public participation.
Table 2.
Scoring guidance for 5 thematic categories (Physical Vulnerability, Hazard Vulnerability, Demographic Vulnerability, Financial Provisions, Social Vulnerability) and their indicators.
Table 2.
Scoring guidance for 5 thematic categories (Physical Vulnerability, Hazard Vulnerability, Demographic Vulnerability, Financial Provisions, Social Vulnerability) and their indicators.
| Thematic Category |
Indicators |
Low |
Medium |
High |
| Physical Vulnerability |
Percentage of Population exposed to hazards |
Less than 10% |
10-20% |
Above 20% |
| |
Percentage of Population affected due to hazards |
Less than 10% |
10-20% |
Above 20% |
| |
Death / casualties reported due to extreme events |
Less than 50 |
50 to 100 |
Beyond 200 |
| Hazard Vulnerability |
City location (Coastal, Hilly and valley, arid, Semi-arid, Humid etc.) |
Located on relatively low hazard prone area |
Located on relatively high hazard prone area |
Located on highly hazard prone area |
| Average annual occurrences of major climate/ hazard events |
0 |
1 to 2 |
Above 2 |
| Change in the hazard/ disaster frequency/ occurrences over the past decades (preferably 20-30 yrs., minimum 10yrs) |
No Changes |
Relatively changed |
Drastically changed |
| Demographic Vulnerability |
Population density growth |
0 to 5% |
5 to 10% |
above 10% |
| Decadal Growth rate |
0 to 5% |
5 to 10% |
above 10% |
| Projected Population Growth |
0 to 5% |
5 to 10% |
above 10% |
| Financial Provisions |
Funds available for Disaster Risk Reduction (DRR) management & dedicated Disaster management Budget – state & city level plans |
Available & Utilized |
Available but not utilized |
Not available |
| Optimally utilize the available funds |
Available & Utilized |
Available but not utilized |
Not available |
| Social Vulnerability |
Percentage of slum population located on and near vulnerable or hazard prone locations |
Less than 10% |
10-20% |
More than 20% |
| Percentage of slum pockets upgraded & rehabilitated after disasters |
More than 80% |
50-80% |
less than 50% |
| Projected Slum Population growth |
Less than 5% |
5 to 10% |
above 10% |
| Dependent population ( below 14 yrs – Above 60 yrs, women) |
Less than 5% |
5 to 10% |
above 10% |
| Records and updated data for vulnerable section being affected by disasters |
Yes, recorded & Updated information available |
Yes, only recorded but not updated |
No records available |
Table 3.
Scoring guidance for Infrastructure vulnerability, indicators and sub-indicators.
Table 3.
Scoring guidance for Infrastructure vulnerability, indicators and sub-indicators.
| Thematic Indicator |
Indicators |
Sub – indicators |
Low |
Medium |
High |
| Infrastructure Vulnerability |
Water supply |
Coverage of potable water supply |
More than 80% HH Covered |
50-80% |
less than 50% HH covered |
| Per capita water supply |
Above 135 lpcd |
70-135 lpcd |
0-70 lpcd |
| Quality of Potable water |
Beyond 80% is treated |
80-50% |
Less than 50% is treated |
| Water level in Source of Drinking Water |
More than 80% |
50-80% |
Less than 50% |
| Supply network developed in accordance to UDPFI guidelines |
Yes |
Partially |
No |
| Frequency of water supply |
More than 2 times / day |
2 times /day |
less than 2 times/ day |
| Water Treatment Facilities |
Water treatment Plant available along with scientific treatment and metering –more than 80% treated |
Water treatment Plant available - 50-80% treated |
No Water treatment Plant available- less than 50% |
| Age of the Infrastructure |
Less than 30 years |
30-70 years |
Above 70 years |
| Frequency of cleaning and maintenance of the infrastructure |
Once in a year |
Once in 2-3 Years |
Once in more than 3 years |
| Segregation of Drinking water lines and sewage line |
Both drainage systems are separate, along with covered drains |
Work in progress |
Not separated & have not planned for the same |
| Ground water level in past 5 years |
Has increased |
Has remained the same |
Has changed/ decreased drastically |
| Drainage Pattern Sewage |
Coverage of drainage connections |
More than 80% HH Covered |
50%-80% HH Covered |
Below 50% HH covered |
| Drainage network developed in accordance to UDPFI guidelines |
Yes |
Partially |
No |
| Sewerage and storm water drainage system segregation |
Both drainage systems are separate, along with covered drains |
Work in progress |
Not separated & have not planned for the same |
| Availability of Waste Water Treatment System |
Yes, treatment plants available |
Planning to develop CETPs |
No CETP |
| Central Effluent Treatment Plants (CETPs) treatment capacity |
More than 80 % HHs covered |
80-50% HHs covered |
below 50% HHs covered |
| Incidence of water logging in last year (Time) (This does not depict number of instances) |
Less than equal to 1 |
2 - 3 |
More than 3 |
| Frequency of cleaning and maintenance of drainage blockade busting infrastructure |
Once in a year |
Once in 1-2Years |
Once in more than 2 years |
| Mechanism to handle high discharge levels (heavy rainfall) |
Yes, fully equipped and planned |
Planning in process |
No plans exists |
| |
Solid Waste Management |
Municipal Waste Treatment – Collection, segregation & transportation |
More than 80 % HHs covered |
80-50% HHs covered |
below 50% HHs covered |
| land filling sites and scientific treatment |
land filling sites available and waste scientifically treated |
Land filling sites available but waste not scientifically treated |
No landfilling site, over burden capacity |
| Power |
Harnessing renewable sources of energy |
Yes, have provision and projects for green energy utilizing |
Currently developing projects/ planning stage |
Have not made any planning to such harnessing |
| Telecom & Communication |
Emergency Operating Centres (EOC) |
Yes, EOC are developed and working efficiently |
Yes, EOC but not working efficiently |
No, EOC are available |
Table 4.
Scoring guidance for Administration and governance, indicators and sub-indicators.
Table 4.
Scoring guidance for Administration and governance, indicators and sub-indicators.
| Principle |
Indicators |
Sub – indicators |
Low |
Medium |
High |
| Administration and Governance |
Land Use Mapping |
City Master Plan/ land use maps |
Yes, plan & maps available |
Process of developing |
Not available |
| Major changes in the land-use pattern over the decades |
less than 50% |
50 - 80% |
More than 80% |
| Green Cover – Playgrounds, parks, gardens, open space, water bodies etc) |
12-14% small cities
18-20% - Medium cities
20-25% - Metropolitans |
10-12% small cities
14-12% - Medium cities
18-20% - Metropolitans |
7-9% small cities
5-7% - Medium cities
12-14% - Metropolitans |
| Mapping of the major water bodies (rivers, lakes, ponds etc.) |
Yes, mapped & Updated |
Yes, only mapped, not updated |
Not mapped |
| Mapping of the Hazard prone areas, city level, ward level |
Yes, mapped & Updated |
Yes, only mapped, not updated |
Not mapped |
| Mapping of the basic infrastructure |
Yes, mapped & Updated |
Yes, only mapped, not updated |
Not mapped |
| Mapping of the Critical Infrastructure |
Yes, mapped & Updated |
Yes, only mapped, not updated |
Not mapped |
| Mapping of Ecological Hotspots |
Yes, Mapping done |
In process |
Not mapped |
| Mapping of the slum pockets & population cover |
Yes, Mapping done |
In process |
Not mapped |
| Planning & Strategies |
DRR and climate risk management in City Master Plan, Smart city Plans/ DRR in Urban Planning |
Integrated Approach in Planning strategies & Plans |
Mixed |
DRR not a part of Urban Planning strategies & Plans |
| Climate Change & Extreme events Projections in Urban planning |
Integrated Approach in Planning strategies & Plans |
Mixed |
DRR not a part of Urban Planning strategies & Plans |
| City Disaster Management Plans |
Yes, it exists |
Planning in process |
Don’t exist |
| Natural Resource Management Plan |
Yes plan available and is being implemented |
Process of developing |
Not planned |
| Green Space development Plan |
Yes plan available and is being implemented |
Process of developing |
Not planned |
| Separate Plans for particular disaster, Climate risk management plans, like Heat wave management plans, Dengue or Malaria Action plans, Flood and Earthquake disaster management plans – Hazard Specific Plan |
Yes plan available and is being implemented |
Process of developing |
No separate plans available |
| Multi- Hazard Planning at city level |
Yes plan available and is being implemented |
Process of developing |
No separate plans available |
| Operational Preparedness |
Dedicated persons to handle and update disaster related database? |
Dedicated persons available and data updated |
Dedicated person available but data bot updated |
No person available & data not updated |
| Dedicated municipal Cadre (trained & specialized personnel), |
Dedicated Cadre appointed |
Appointment in process |
No initiative taken yet |
| Dedicated team for disaster management/ disaster response system/ Emergency Administrative Authority |
Dedicated persons available and data updated |
Dedicated person available but data bot updated |
No person available & data not updated |
| Early warning and forecasting system |
System exists and executes functional efficiently |
System exists but don’t function efficiently |
Don’t exist |
| Real- Time Hazard Monitoring Systems |
System exists and executes functional efficiently |
System exists but don’t function efficiently |
Don’t exist |
| Awareness Campaigns , training & capacity building sessions mock –drills, evacuation plans for DRR |
Programmes exist and more than 10 such exercises initiated |
Programmes exist but only 1-5 such exercises initiated |
No such Programmes initiated |
| Public Participation |
Community participation/ participatory planning- integral part of planning and strategy building in terms of DRR & climate resilience |
Documented & implemented |
Documented |
Not Documented & Implemented |
| Inclusion of traditional and local approaches/ indigenous knowledge, methodology to manage/ adapt to climate change and disaster occurrences in planning |
Documented & implemented |
Documented |
Not Documented & Implemented |
| Approach Top Down Or Bottom Up Approach |
Nil |
Documented |
Not Documented & Implemented |
| Updated previous disaster data base |
Not Updated |
Partially Without loss figures (economic And human) |
Full with loss figures (economic and human) |
| Municipal credit rating |
Done |
Planned |
Not planned |
4.5. Assessing Vulnerability (Scoring):
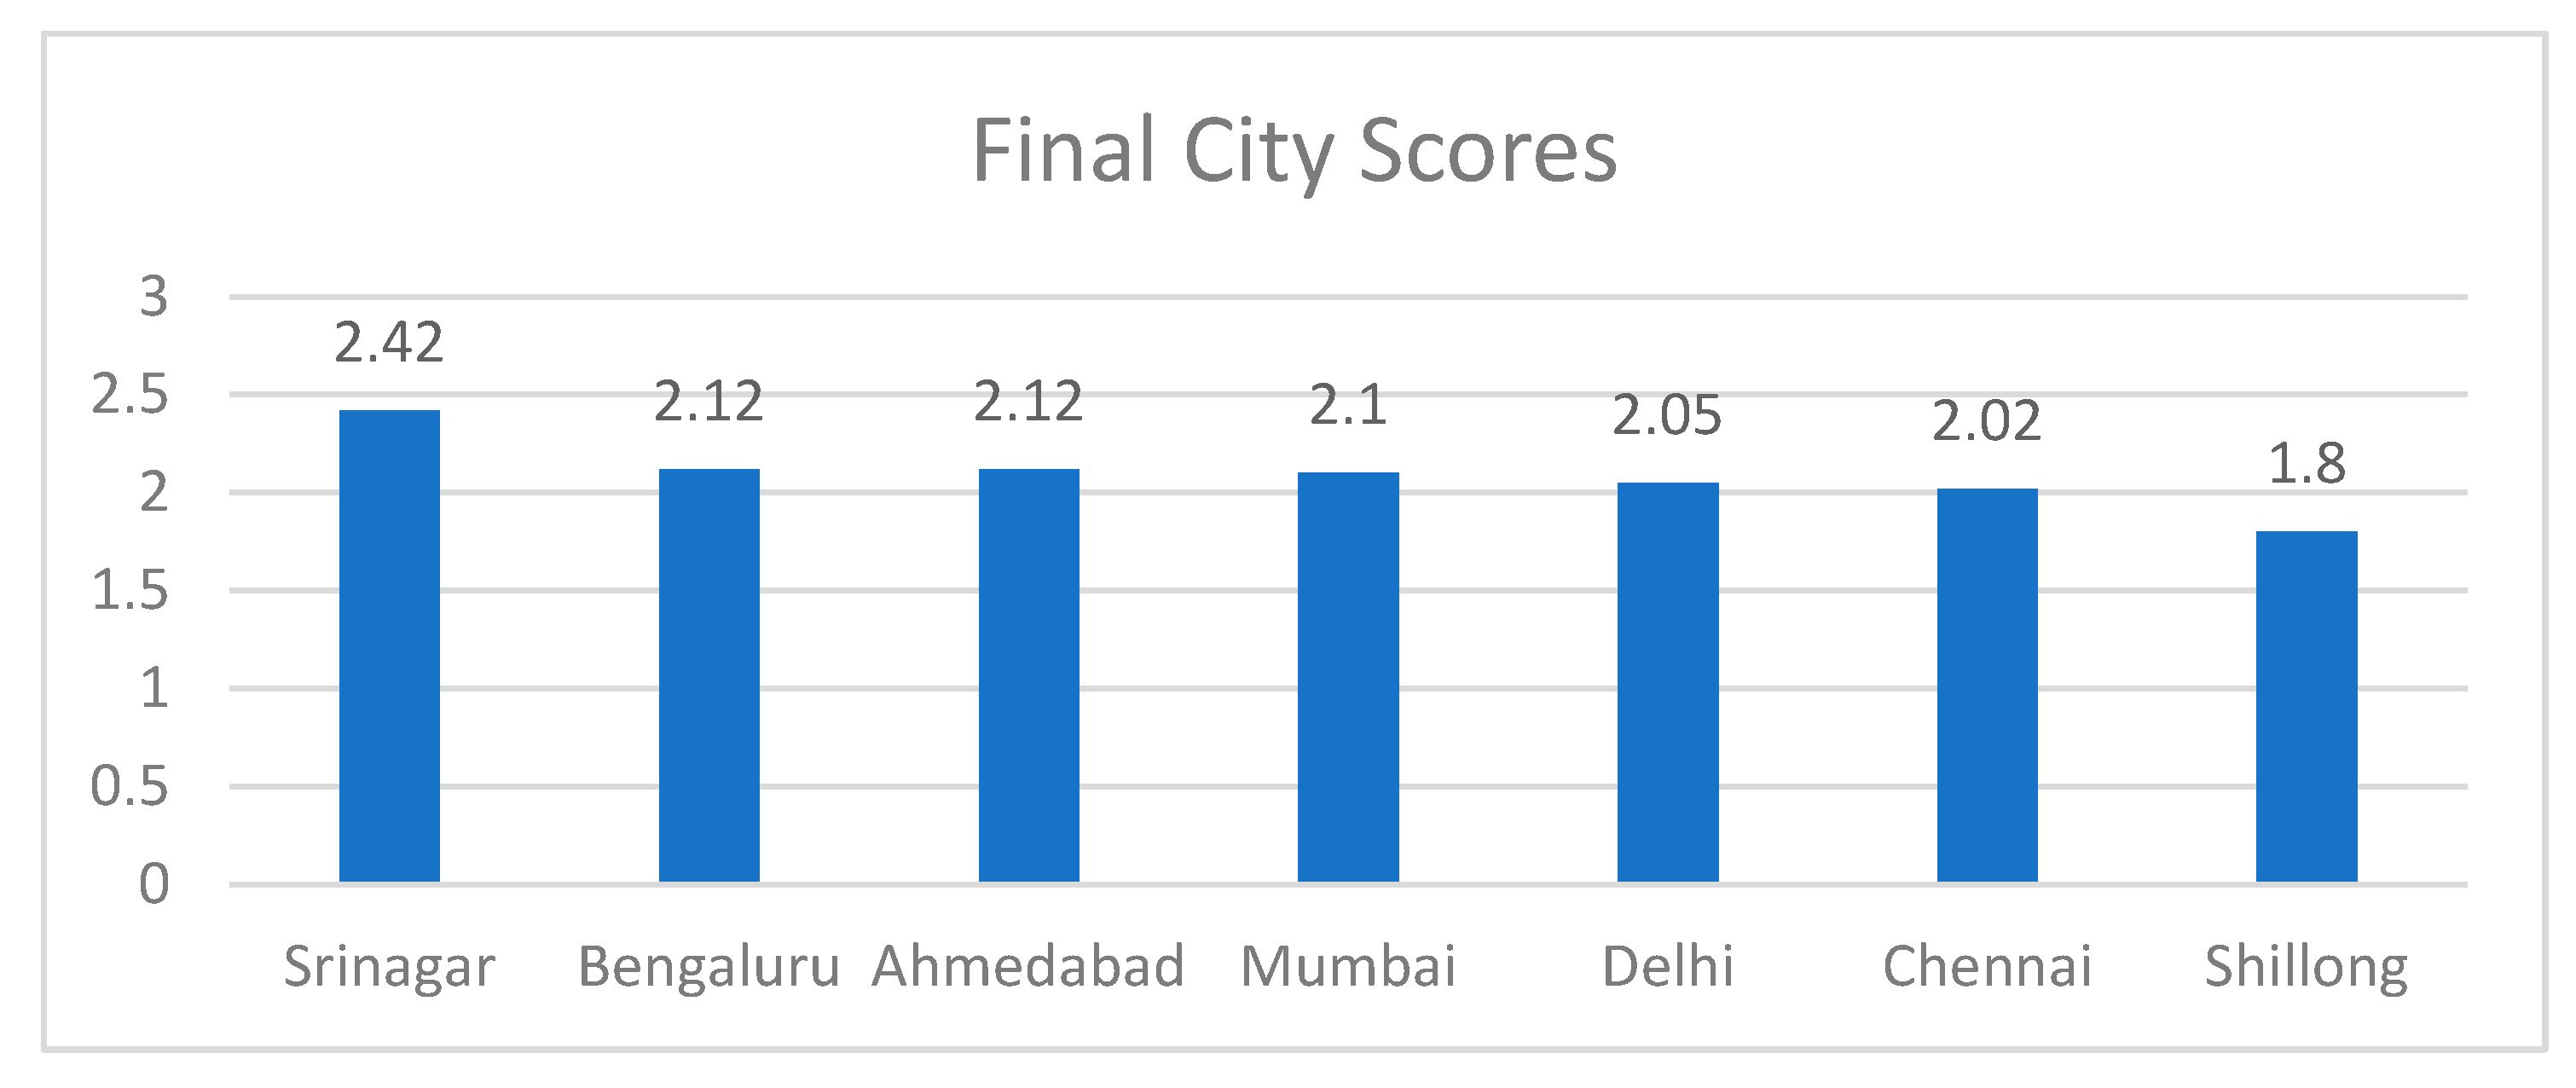
Climate vulnerability across the seven selected cities was analyzed using the comprehensive index. The UCVA has in total – seven thematic categories, twenty-five indicators and fifty sub-indices. The sub-indices are confined to Infrastructure and Administration themes. The scoring of the cities’ indicators and sub-indicators is done on the basis of providing simple scores ranging between 1 to 3, where 1 indicates least vulnerable and is ranked low, and 3 indicates most vulnerable and ranked as high. The lowest level, Indicator or Sub-Indices, representing its respective thematic category is ranked within 1 to 3, depending upon the degree of vulnerability it holds- high, medium and low. It is then aggregated and normalized to obtain a composite vulnerability score of that degree. Also, the indicators or sub-indices which contain information are only taken in consideration while normalizing and otherwise not.
Two methods are used to aggregate and normalize the score: 1. Lowest degree is Indicator, where the scores are aggregated and normalized twice to obtain the final thematic score. 2. Lowest Degree is Sub-indices, where the scores are aggregated and normalized thrice to obtain the final thematic score, as in the case of Infrastructure and Administration. The normalization is done on the basis of the score factor. The Score Factor differs with each thematic indicator and also with each degree it is calculated at. For this study the method of normalization is taken as equal normalization. No further rankings are allocated to the score factor at the time of normalization, indicator/sub-indices with no information are dropped while calculating
The aggregation and normalization in this case is done twice. The scoring of high, medium or low is done at the indicator level as it is the lowest degree in the absence of sub-indices. Once the ranking is done it is then normalized depending upon the score factor.
Indicator Score Factor (Isf) equals to 1 divided by the number of queries in that degree it is used to normalize the ranking. The individual Indicator Score (ISc) for the Indicators are calculated by multiplying the indicator weightage (iw) with the Indicator Score Factor (sf). The scores once normalized are then aggregated and Cumulative Indicator Score (CISc) for all three indicators.
Indicator Score Factor (Isf) = 1 / number of queries for each thematic category
Indicator Score (ISc) = iw * Isf
Cumulative Indicator Score (CISc) = {[ ISc1] + [ISc 2] + [ISc 3]}
Thematic category Factor (Tcf) is then calculated, where Tcf equals 1 divided by the number of thematic categories present. Final Score (FSc) for the particular indicator at respective city level is then calculated by multiplying Cumulative Indicator Score (CISc) with the thematic category Factor (Tcf).
Thematic category Factor (Tcf) = 1 / total thematic indicator
Final Score (FSc) = CIsc * Tcf
- 2.
Scoring Method 2: Scoring of thematic category and indicator with sub-indices
The aggregation and normalization in this case is done thrice. The scoring of high, medium or low is done at the sub-indices level as it is the lowest degree. Once the ranking is done for all the sub-indices for various indicators, it is then normalized depending upon its score factor.
The Sub-Indices Score Factor (SIsf) in this case differs amongst different indicators, but is same for the sub-indices under same indicator. Then, the individual Sub-Indices Score (SISc) for the Indicators are calculated by multiplying the indicator weightage (siw) with the Sub-Indices Score Factor (SIsf). The scores once normalized are then aggregated and Cumulative Sub-Indices Score (CSISc) for all sub-Indices
Sub-Indices Factor (SIsf)= 1 / number of queries for each sub-indices
Sub-Indices Score (SISc) = Indicator weightage x Sub-Indices Factor (siw * SIsf)
Cumulative Sub-Indices Score (CSISc) = {[SISc1] + [SISc2], [SISc3], [n]}
The score factor used for the indicator (Isf) is 1 divided by the total number of indicators. The Cumulative Indicator Score (CISc) for all five indicators is then calculated by multiplying indicator score factor (Isf) with Cumulative Sub-Indices Score (CSISc) of each sub-indices.
Indicator score factor (Isf) = 1 / number of queries for each thematic indicator
Cumulative Indicator Score (CISc) = {[Isf * CSISc1] + [Isf * CSISc2] +…. + [Isf * CSIScn]}
Thematic category Factor (Tcf) is then calculated, where Tcf equals 1 divided by the number of thematic categories present. Final Score (FSc) for the particular indicator at respective city level is then calculated by multiplying Cumulative Indicator Score (CISc) with the thematic category Factor (Tcf).
Thematic category Factor (Tcf)= 1 / total thematic categories
Final Score (FSc) = CIsc * Tcf
Example 1: Calculation of Cumulative Sub-Indices Score for the Solid Waste Management indicator
Table 5.
Scoring method for the Solid Waste Management indicator.
Table 5.
Scoring method for the Solid Waste Management indicator.
| Indicator |
Sub-Indicator |
Low |
Medium |
High |
Influence Factor |
Sub Indice Factor |
Sub Indice Weight |
Score |
Total |
| Solid Waste Management |
Municipal Waste Treatment, Collection, segregation & transportation |
More than 80 % HHs covered |
80-50% HHs covered |
below 50% HHs covered |
High |
1/2 |
3 |
1.5 |
2.5 |
| Land filling sites and Scientific treatment |
Available and waste scientifically treated |
Available but waste not scientifically treated |
No landfilling site, over burden capacity |
Medium |
1/2 |
2 |
1 |
Sub-Indices Factor = 1 / number of queries for each thematic sub-indices
SIsf1 = ½
SIsf2= ½
Sub-Indices Weight
Siw1= 3
Siw2= 2
Sub-Indices Score
Sisc1= SIsf1 *Siw1 = 1.5
Sisc2 = SIsf2 * Siw2 = 1
Cumulative Sub-Indices Score (CSISc)
= Sisc1 + Sisc2
= 1.5+1
= 2.5
Example 2: Calculation of thematic category score for Infrastructure Vulnerability
Table 6.
Scoring method for the entire Thematic Category Infrastructure Vulnerability.
Table 6.
Scoring method for the entire Thematic Category Infrastructure Vulnerability.
| Infrastructure Vulnerability |
|---|
| Indicator |
Indicator Score Factor |
Cumulative Indicator Score |
Score |
Total |
Thematic Indicator Factor |
Total |
| Water Supply |
1/5 |
1.91 |
0.38 |
1.61 |
1/7 |
0.23 |
| Drainage Pattern |
1/5 |
1.63 |
0.33 |
| Solid Waste Management |
1/5 |
2.5 |
0.5 |
| Power |
1/5 |
1 |
0.2 |
| Telecom and Communication |
1/5 |
1 |
0.2 |
Cummulative Indicator Score CISc(IF)
CISc(IF) = {[Isf * CSISc1] + [Isf * CSISc2] + [Isf * CSISc3] + [Isf * CSISc4] + [Isf * CSISc5]}
= {[(1/5) * 2.5] + [(1/5) * 1] + [(1/5) * 1] + [(1/5) * 1.91]+ [(1/5) * 1.63]}
= 1.61
Thematic category Factor Tcf (IF) = 1 / 7
Final Score FSc(IF) = CIsc(IF) * Tcf(IF)
= 1.61 * (1/7)
= 0.23
Comparative Analysis
As earlier discussed in the Methodology chapter, the Urban Climate Vulnerability in Indian cities is assessed based on their Physical, Demographic, Financial Provisioning, and Social, Infrastructure and Administration-Governance structure. Sub-indicators and indices are used to support the same. They are ranked in the categories of High, Medium and Low to assess/ measure the level of vulnerability of the city at each level.
4.6. Physical Vulnerability
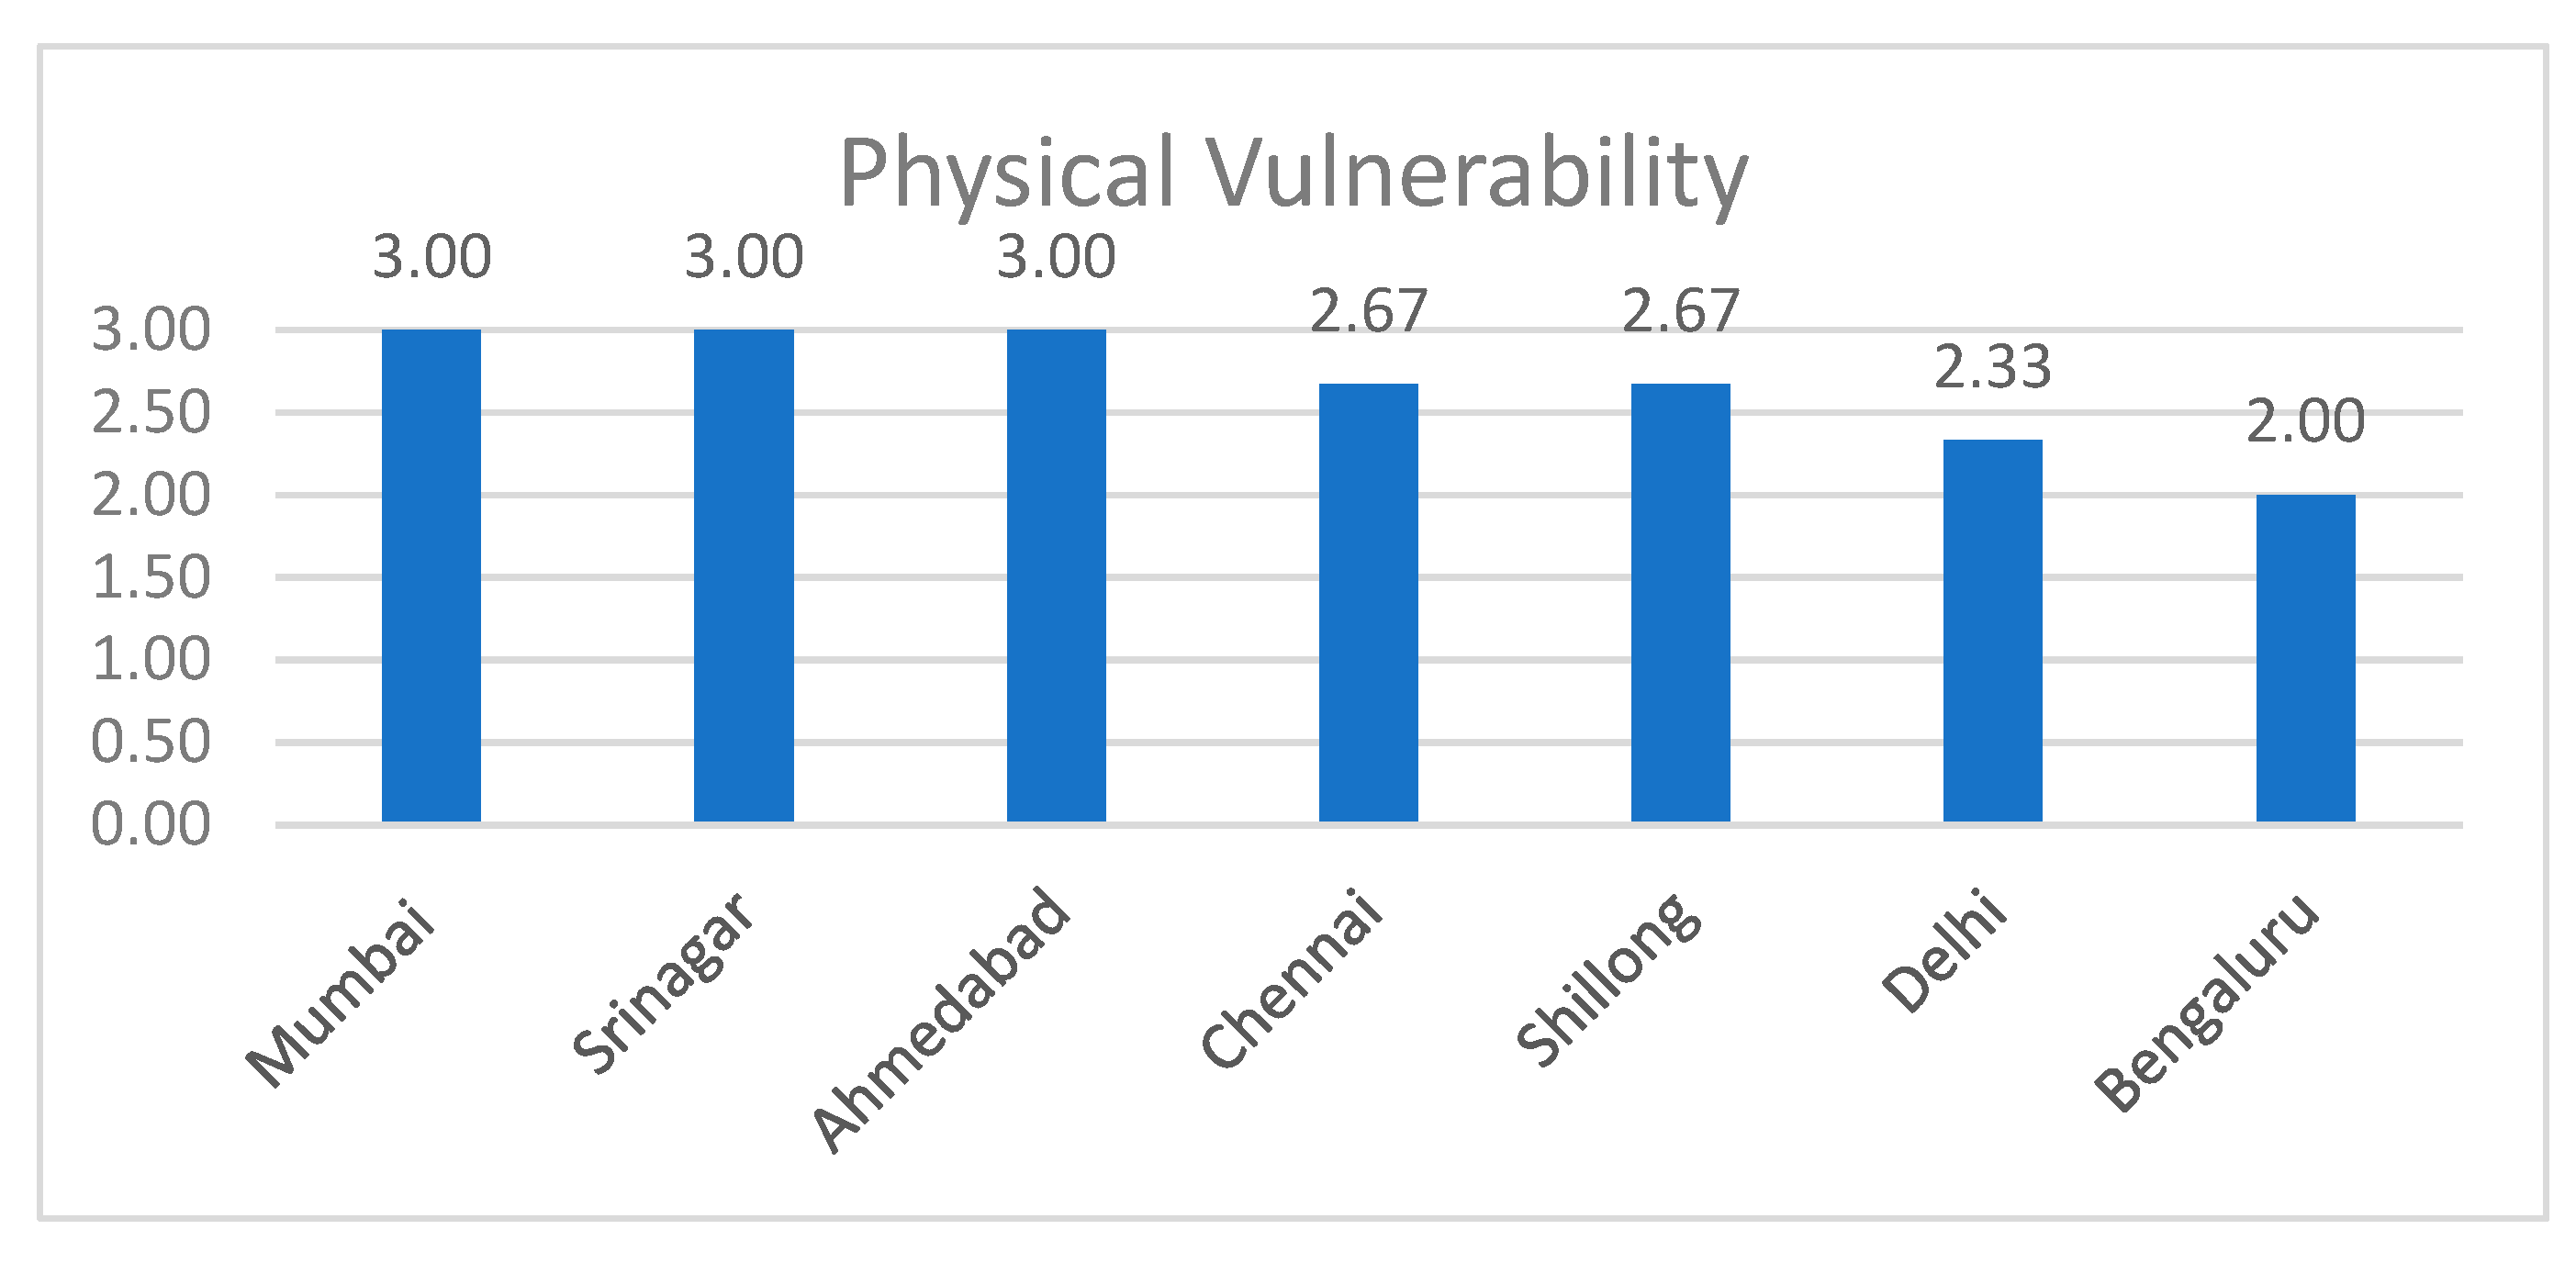
Figure 3.
Physical Vulnerability Scores.
Figure 3.
Physical Vulnerability Scores.
Physical vulnerability covers the sub-indicators wherein the population directly or indirectly affected by the hazards has been considered. The impact of any hazard or disaster can be directly measured by the total number of people affected by the same.
The physical vulnerability score of each city obtained by ranking the respective sub-indicator depicts that Mumbai, Srinagar and Ahmedabad are the most vulnerable, followed by Chennai. This is due to the deaths and casualties reported due to extreme events like the disastrous floods of 2005 in Mumbai, 2014 in Chennai and Srinagar and the 2010 heat wave of Ahmedabad. The population exposed to the city-specific hazards in most cities lies in the range above 20% of the total population. It must also be noted that the percentage of the population affected due to hazards in a majority of the cities is above 20%.
4.7. Hazard Vulnerability
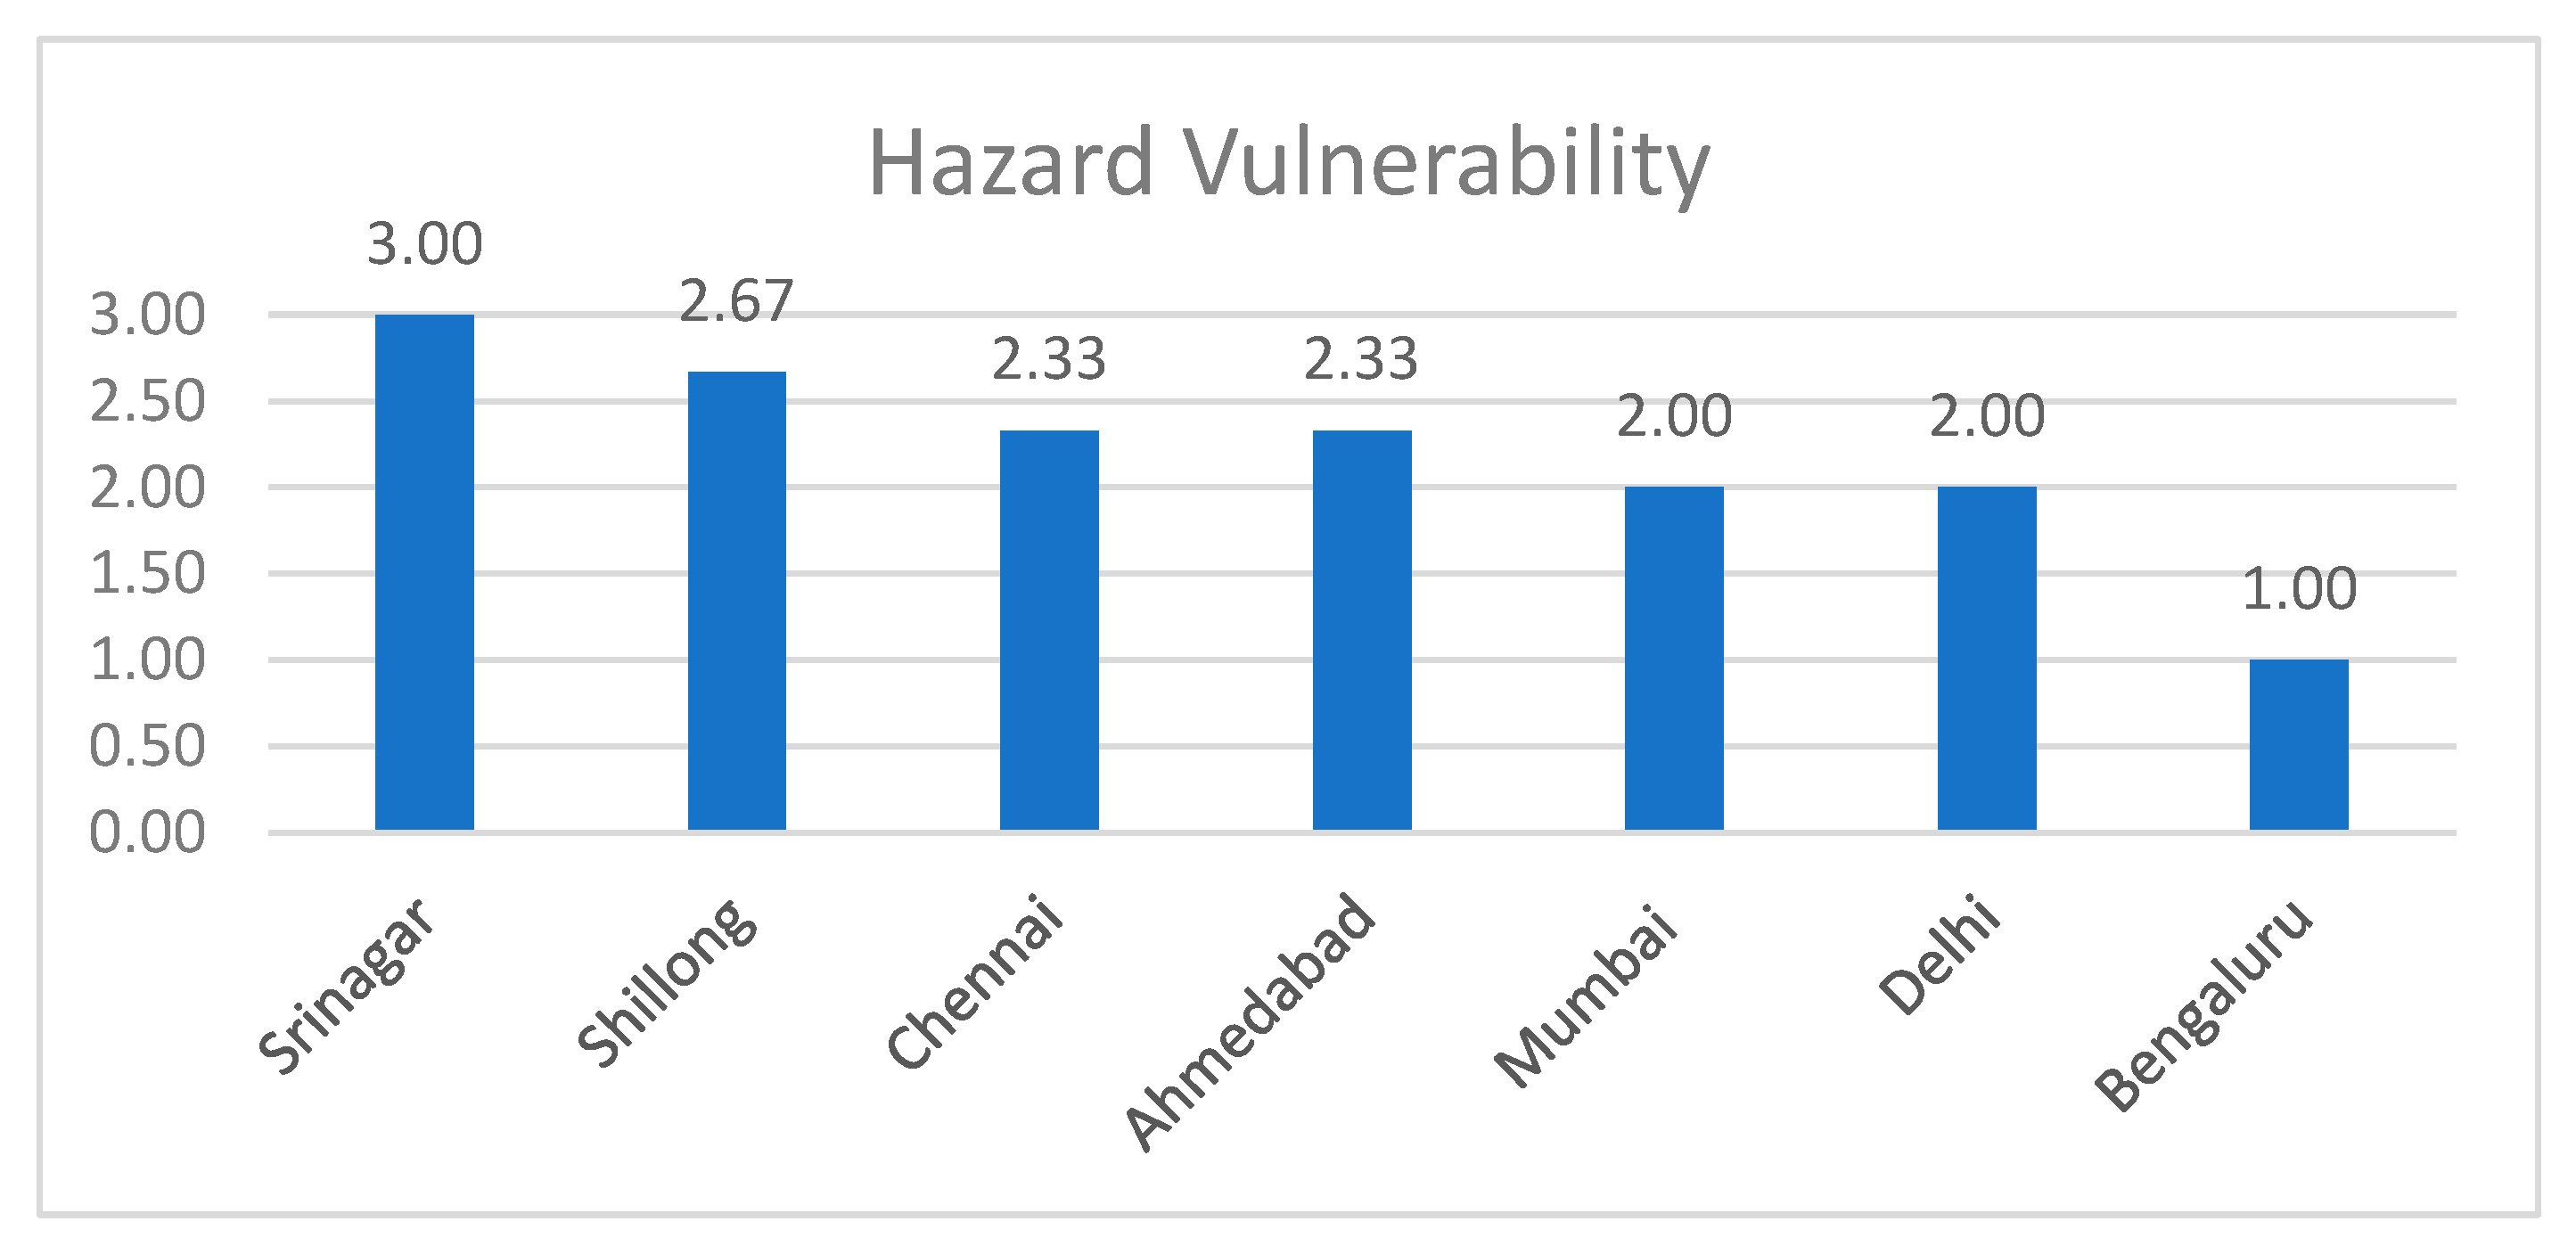
Figure 4.
Hazard Vulnerability Scores.
Figure 4.
Hazard Vulnerability Scores.
Hazard vulnerability is attributed to the cities' geographical and geomorphology, hazard characteristics, and annual/decadal trends.
The hazard vulnerability score of each city obtained by ranking the respective sub-indicator depicts that Srinagar is the most vulnerable, followed by Shillong and Chennai.
The selected cities are located in highly hazard-prone areas except for Bengaluru. The average annual occurrences of the major climate hazards in the cities range from medium to high intensity. The cities like Mumbai, Chennai, Delhi, Bengaluru and Ahmedabad experience one to two events annually; Shillong and Srinagar sometimes experience more than two events annually. The trends for these hazards observed over the past decades reveal that such incidences have remained consistent in most cases. Only in Srinagar there was an increase in climate-induced hazards.
4.8. Demographic Vulnerability
Figure 5.
Demographic Vulnerability Scores.
Figure 5.
Demographic Vulnerability Scores.
Population growth and distribution, especially increased population density and urbanization, increases vulnerability to disasters.
1
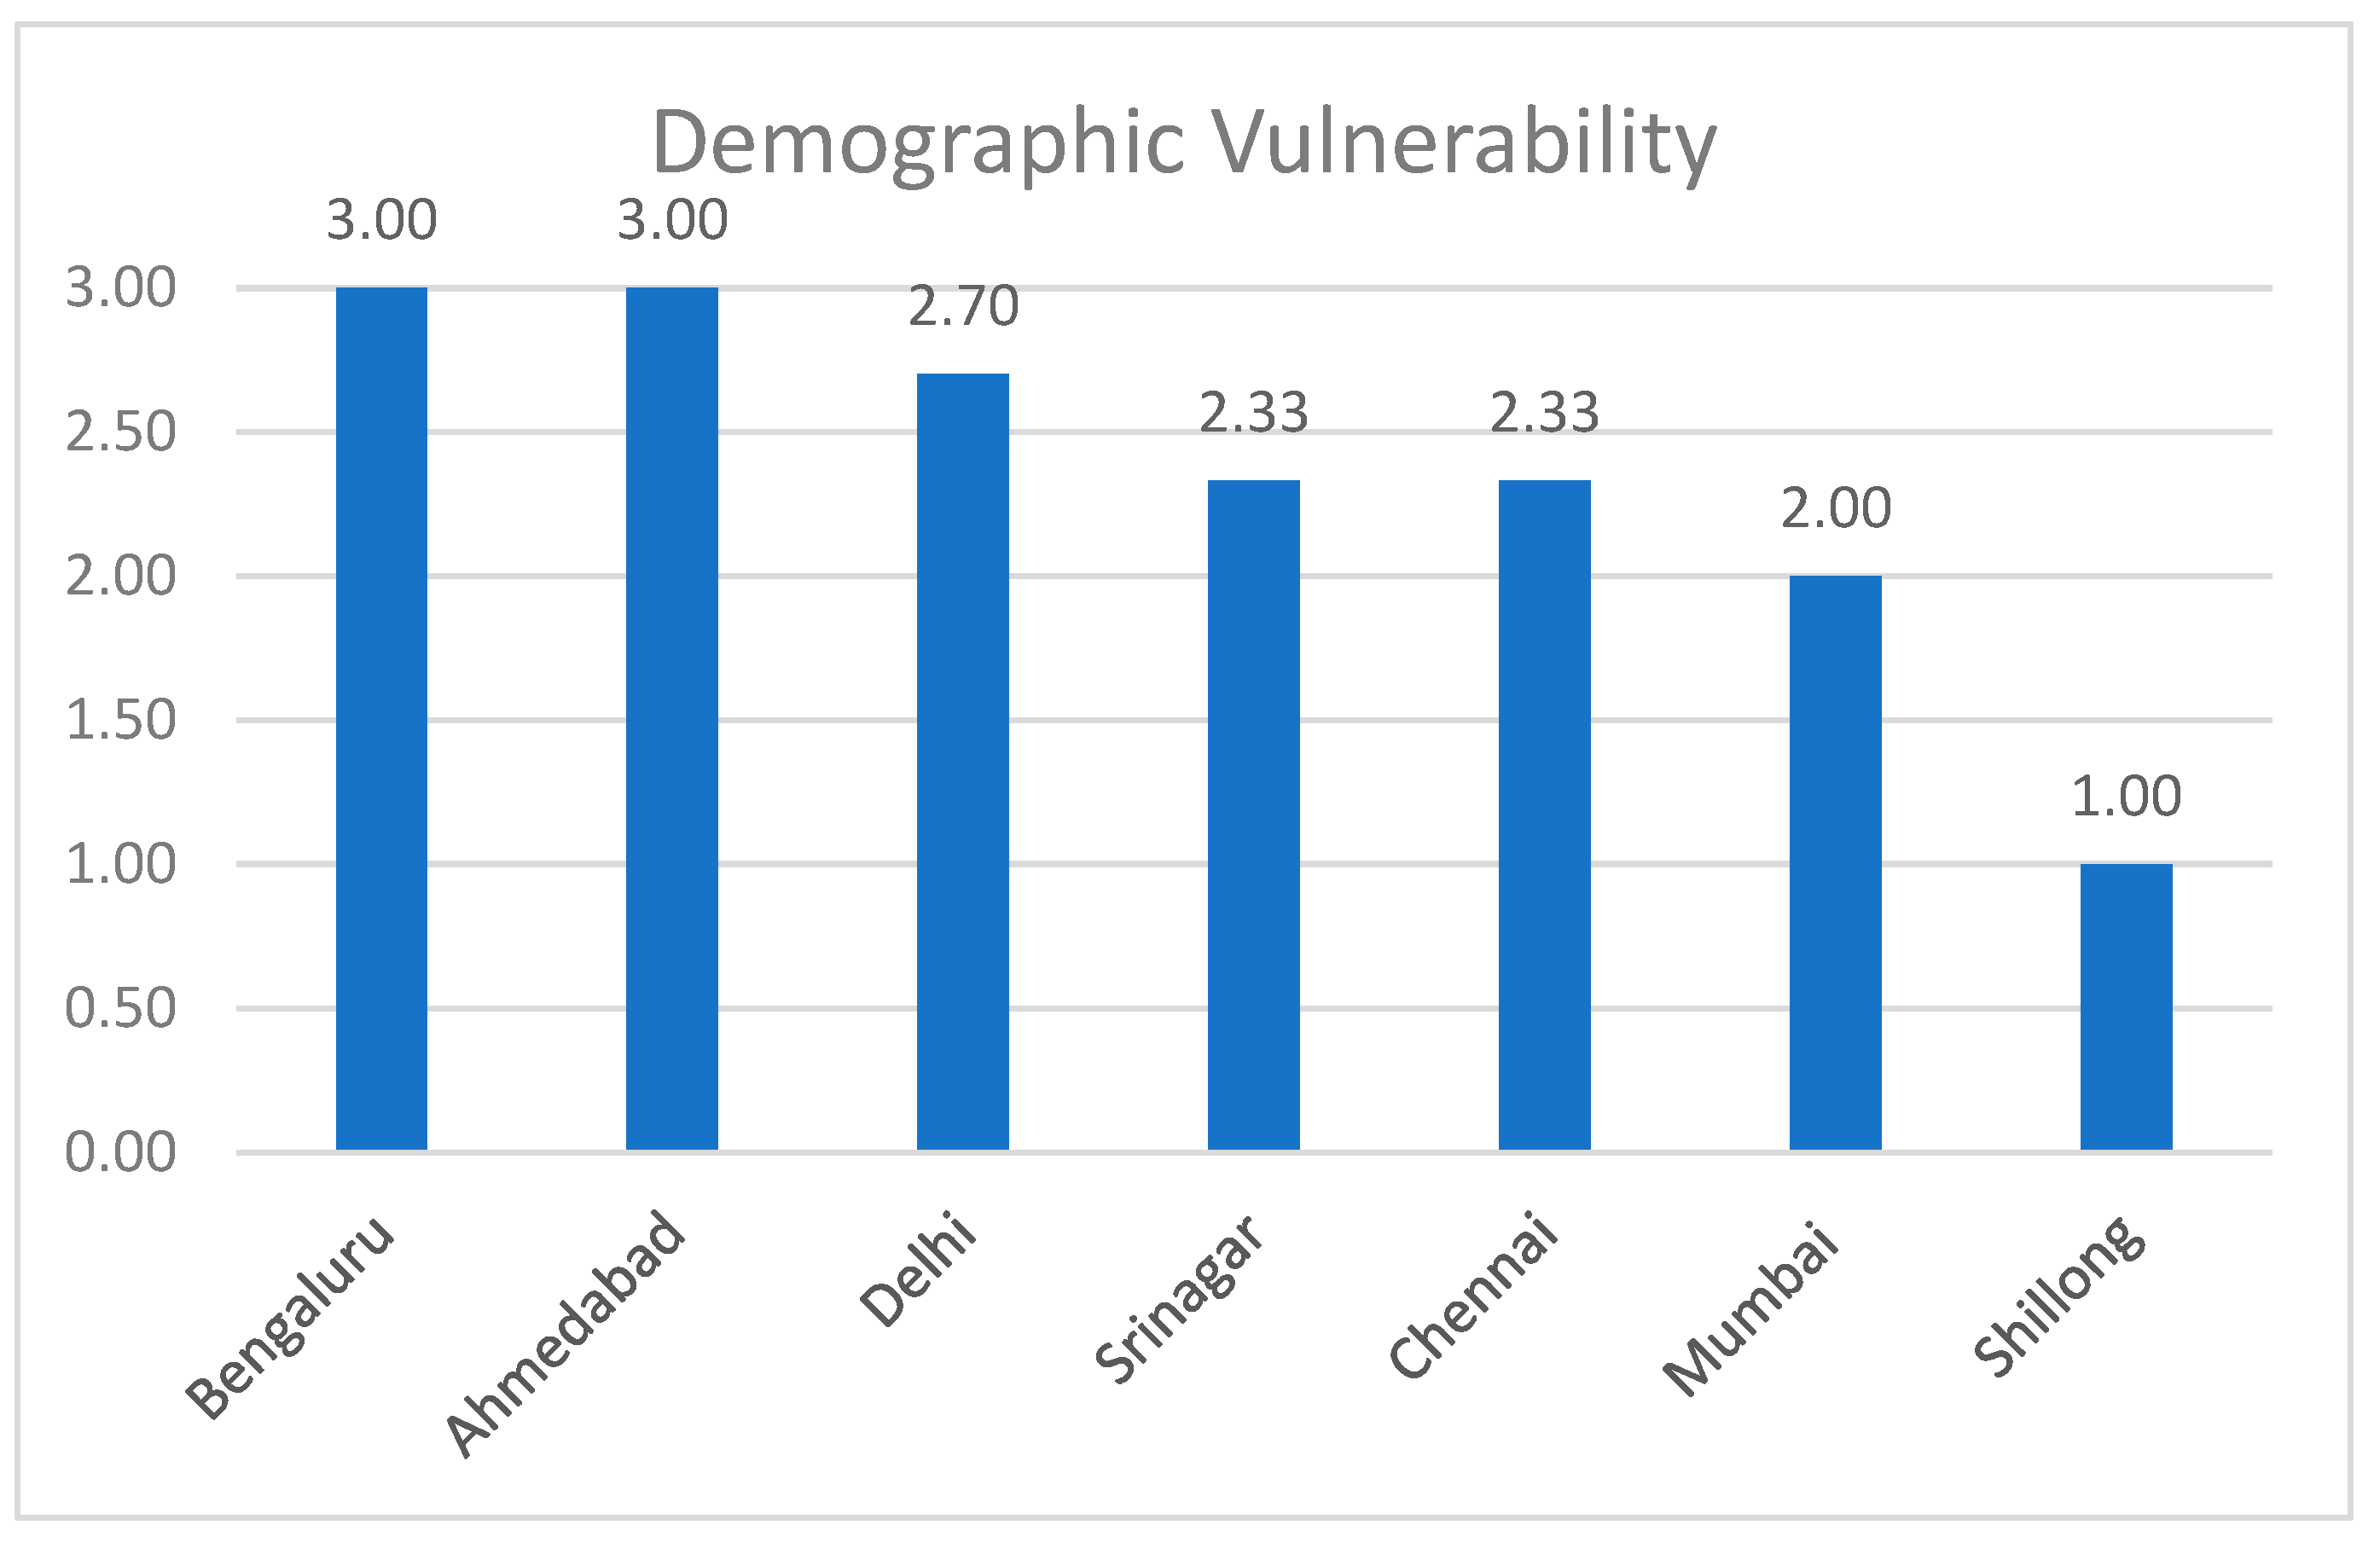
The demographic vulnerability score of each city obtained by ranking the respective sub-indicator depicts that Bengaluru is the most vulnerable, followed by Ahmedabad and Delhi.
Decadal population density growth (2001-2011), ranging from 5% to 10%, has been reported in most cities. While looking at the decadal growth rate, the cities that have recorded higher growth rate (above 10%) are Bengaluru, Ahmedabad, Srinagar and Delhi. The reasons accounting for this include an increase in the migrant/floating population, Bengaluru an IT hub of the nation, Delhi the national capital, and Srinagar the fastest growing city in the valley. Moreover, the index depicts that the projected population growth in the majority of the cities is lying in the high range that is above 10%. The increase in the population indicates that the number of people exposed to climate-related hazards will increase as the city grows in the future.
4.9. Financial Provisioning
Figure 6.
Financial Provisioning Scores.
Figure 6.
Financial Provisioning Scores.
The vulnerability of a city is often defined as the lack of capital, and the capital is viewed as the stocks that can produce a flow of economically desired outputs. It is not only the availability of the funds that is important but its availability for use/utilization, its accessibility-equity-quality-diversity that needs to be taken into account.
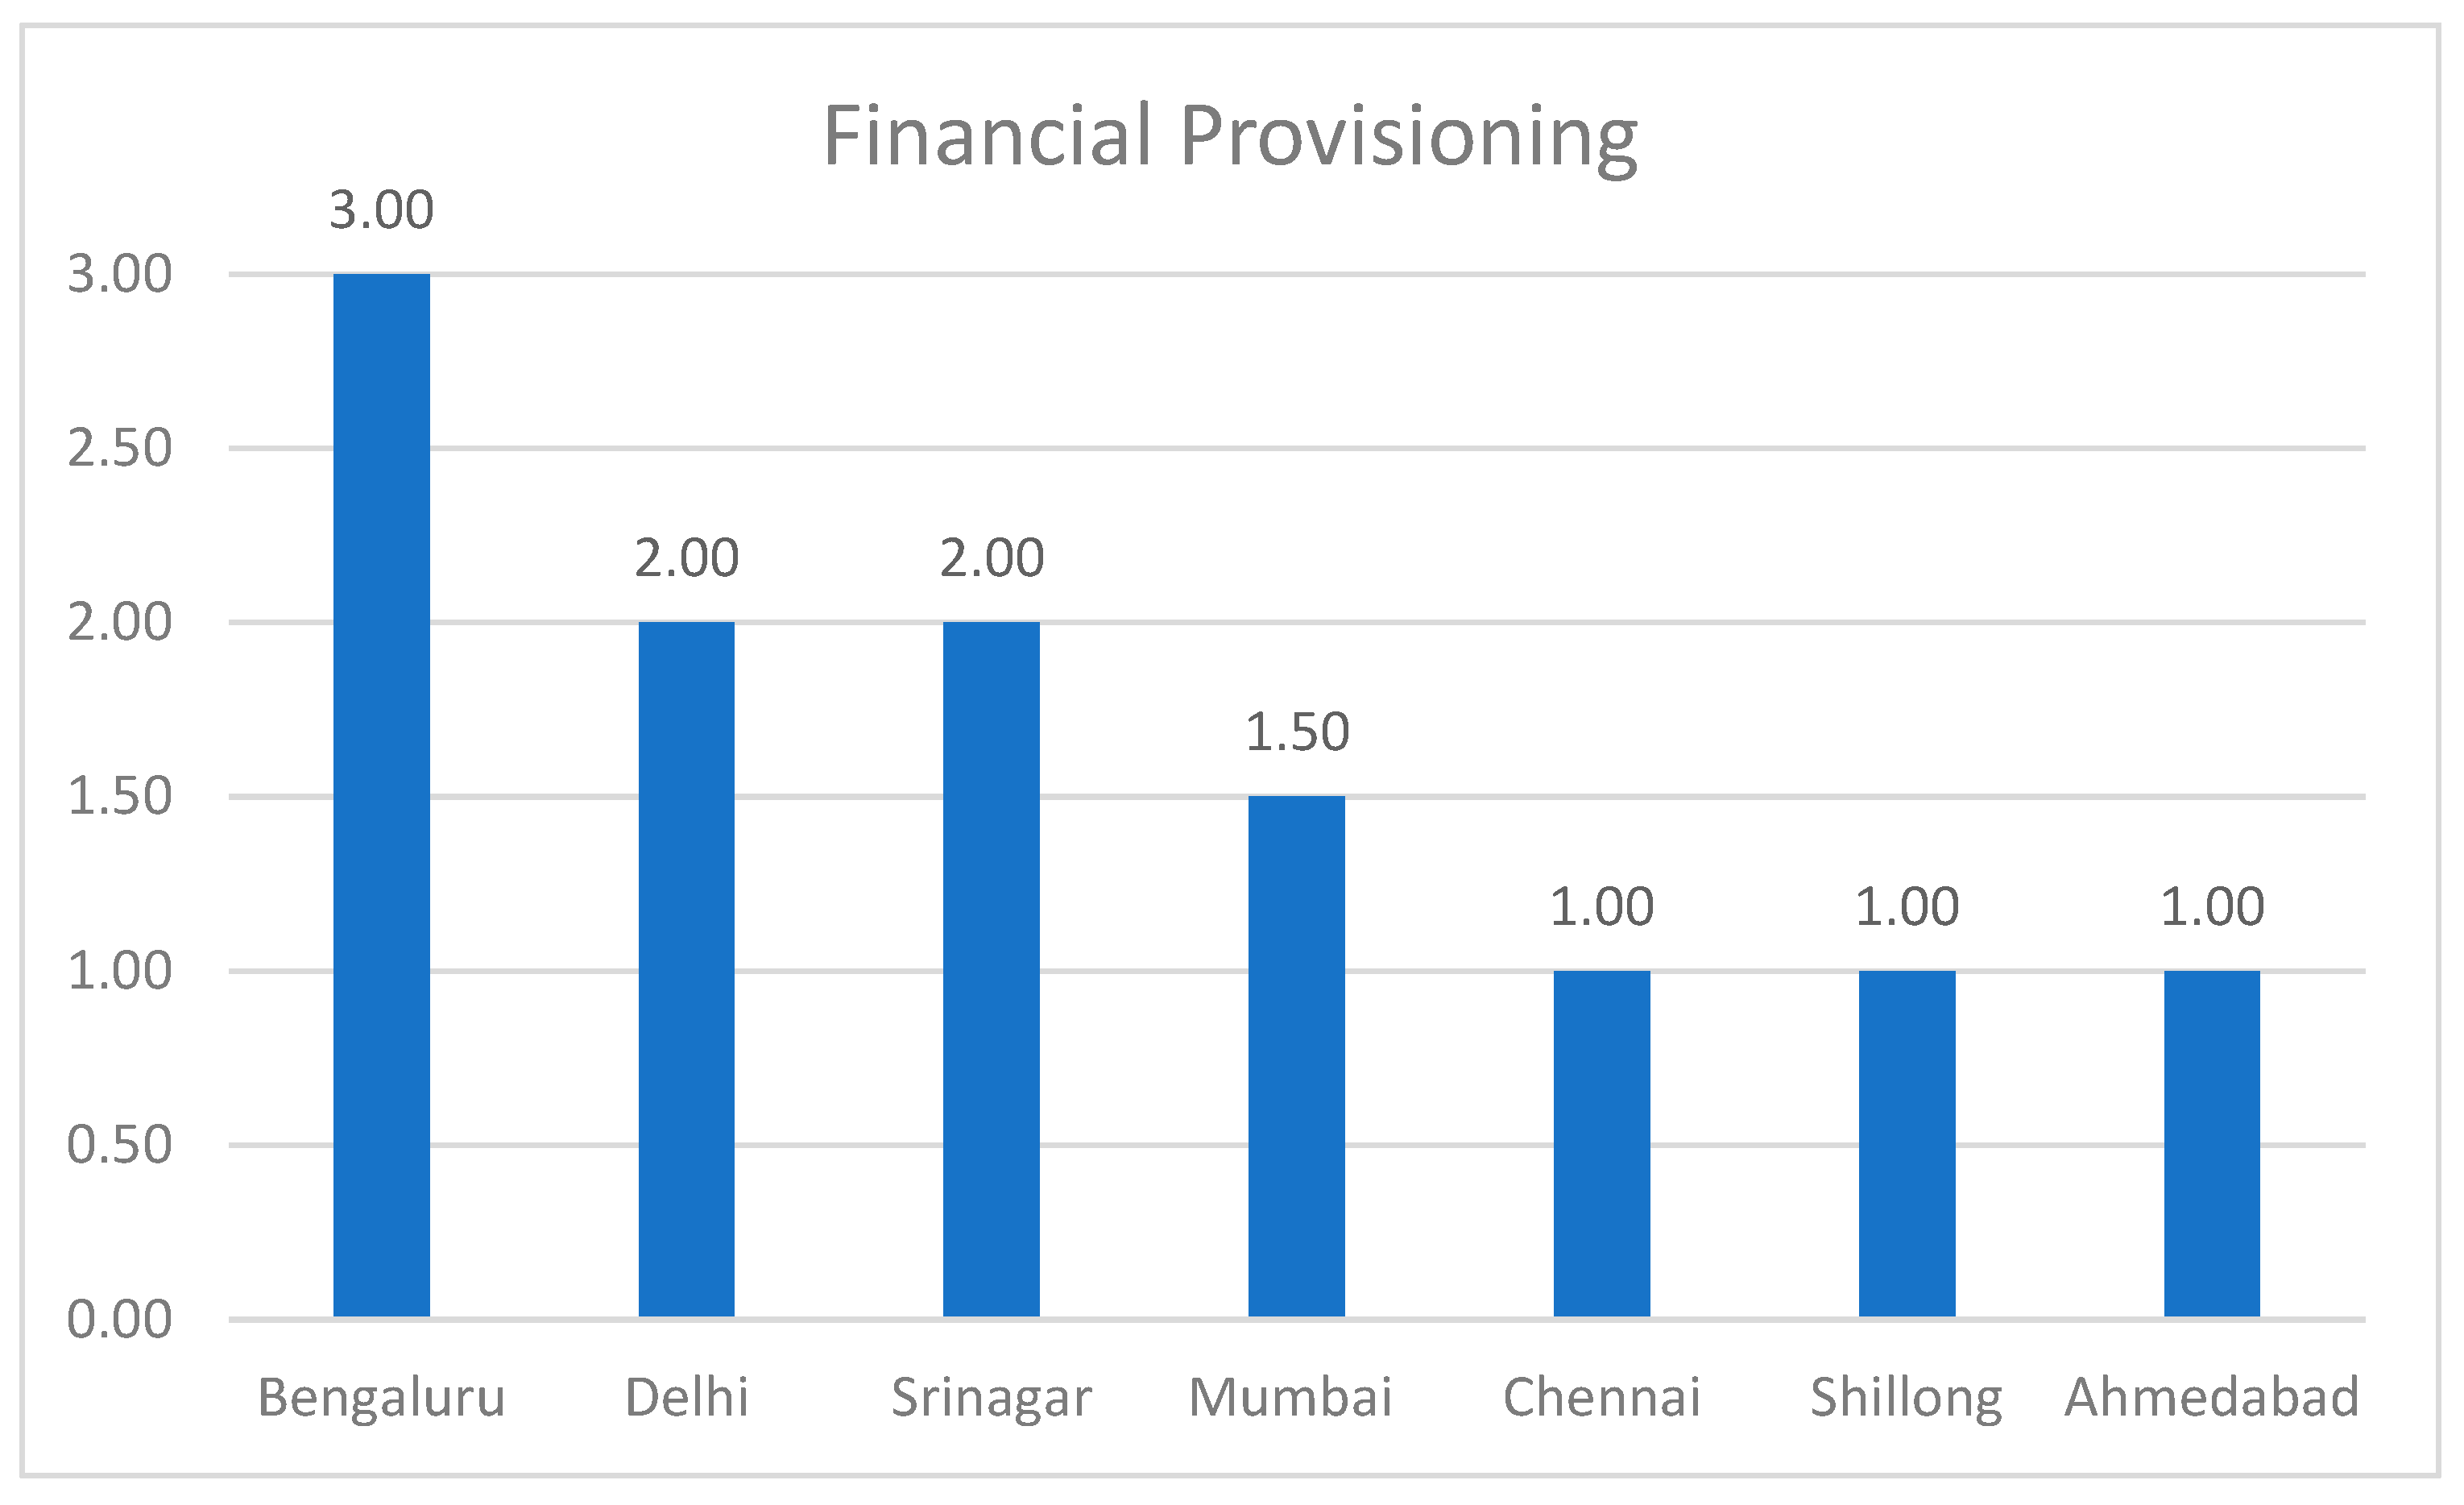
The economic vulnerability score of each city obtained by ranking the respective sub-indicator depicts that Bengaluru is the most vulnerable, followed by Delhi.
We find that Bengaluru does not have a proper budget allocated for the DRR management at city level plans. Cities like Delhi and Srinagar have DRR budgets, but they are not utilized, resulting in the high vulnerability of such cities.
Information regarding the optimal utilization of the available funds represents a huge shortcoming in this sector as the available funds are not utilized. Chennai is the only city that uses DRR funds.
4.10. Social Vulnerability
Figure 7.
Social Vulnerability Scores.
Figure 7.
Social Vulnerability Scores.
The social vulnerability of the city is assessed through the slum and existing vulnerable population of the cities. This section manifests the vulnerable, dependent population and deprivation that transcends income poverty.
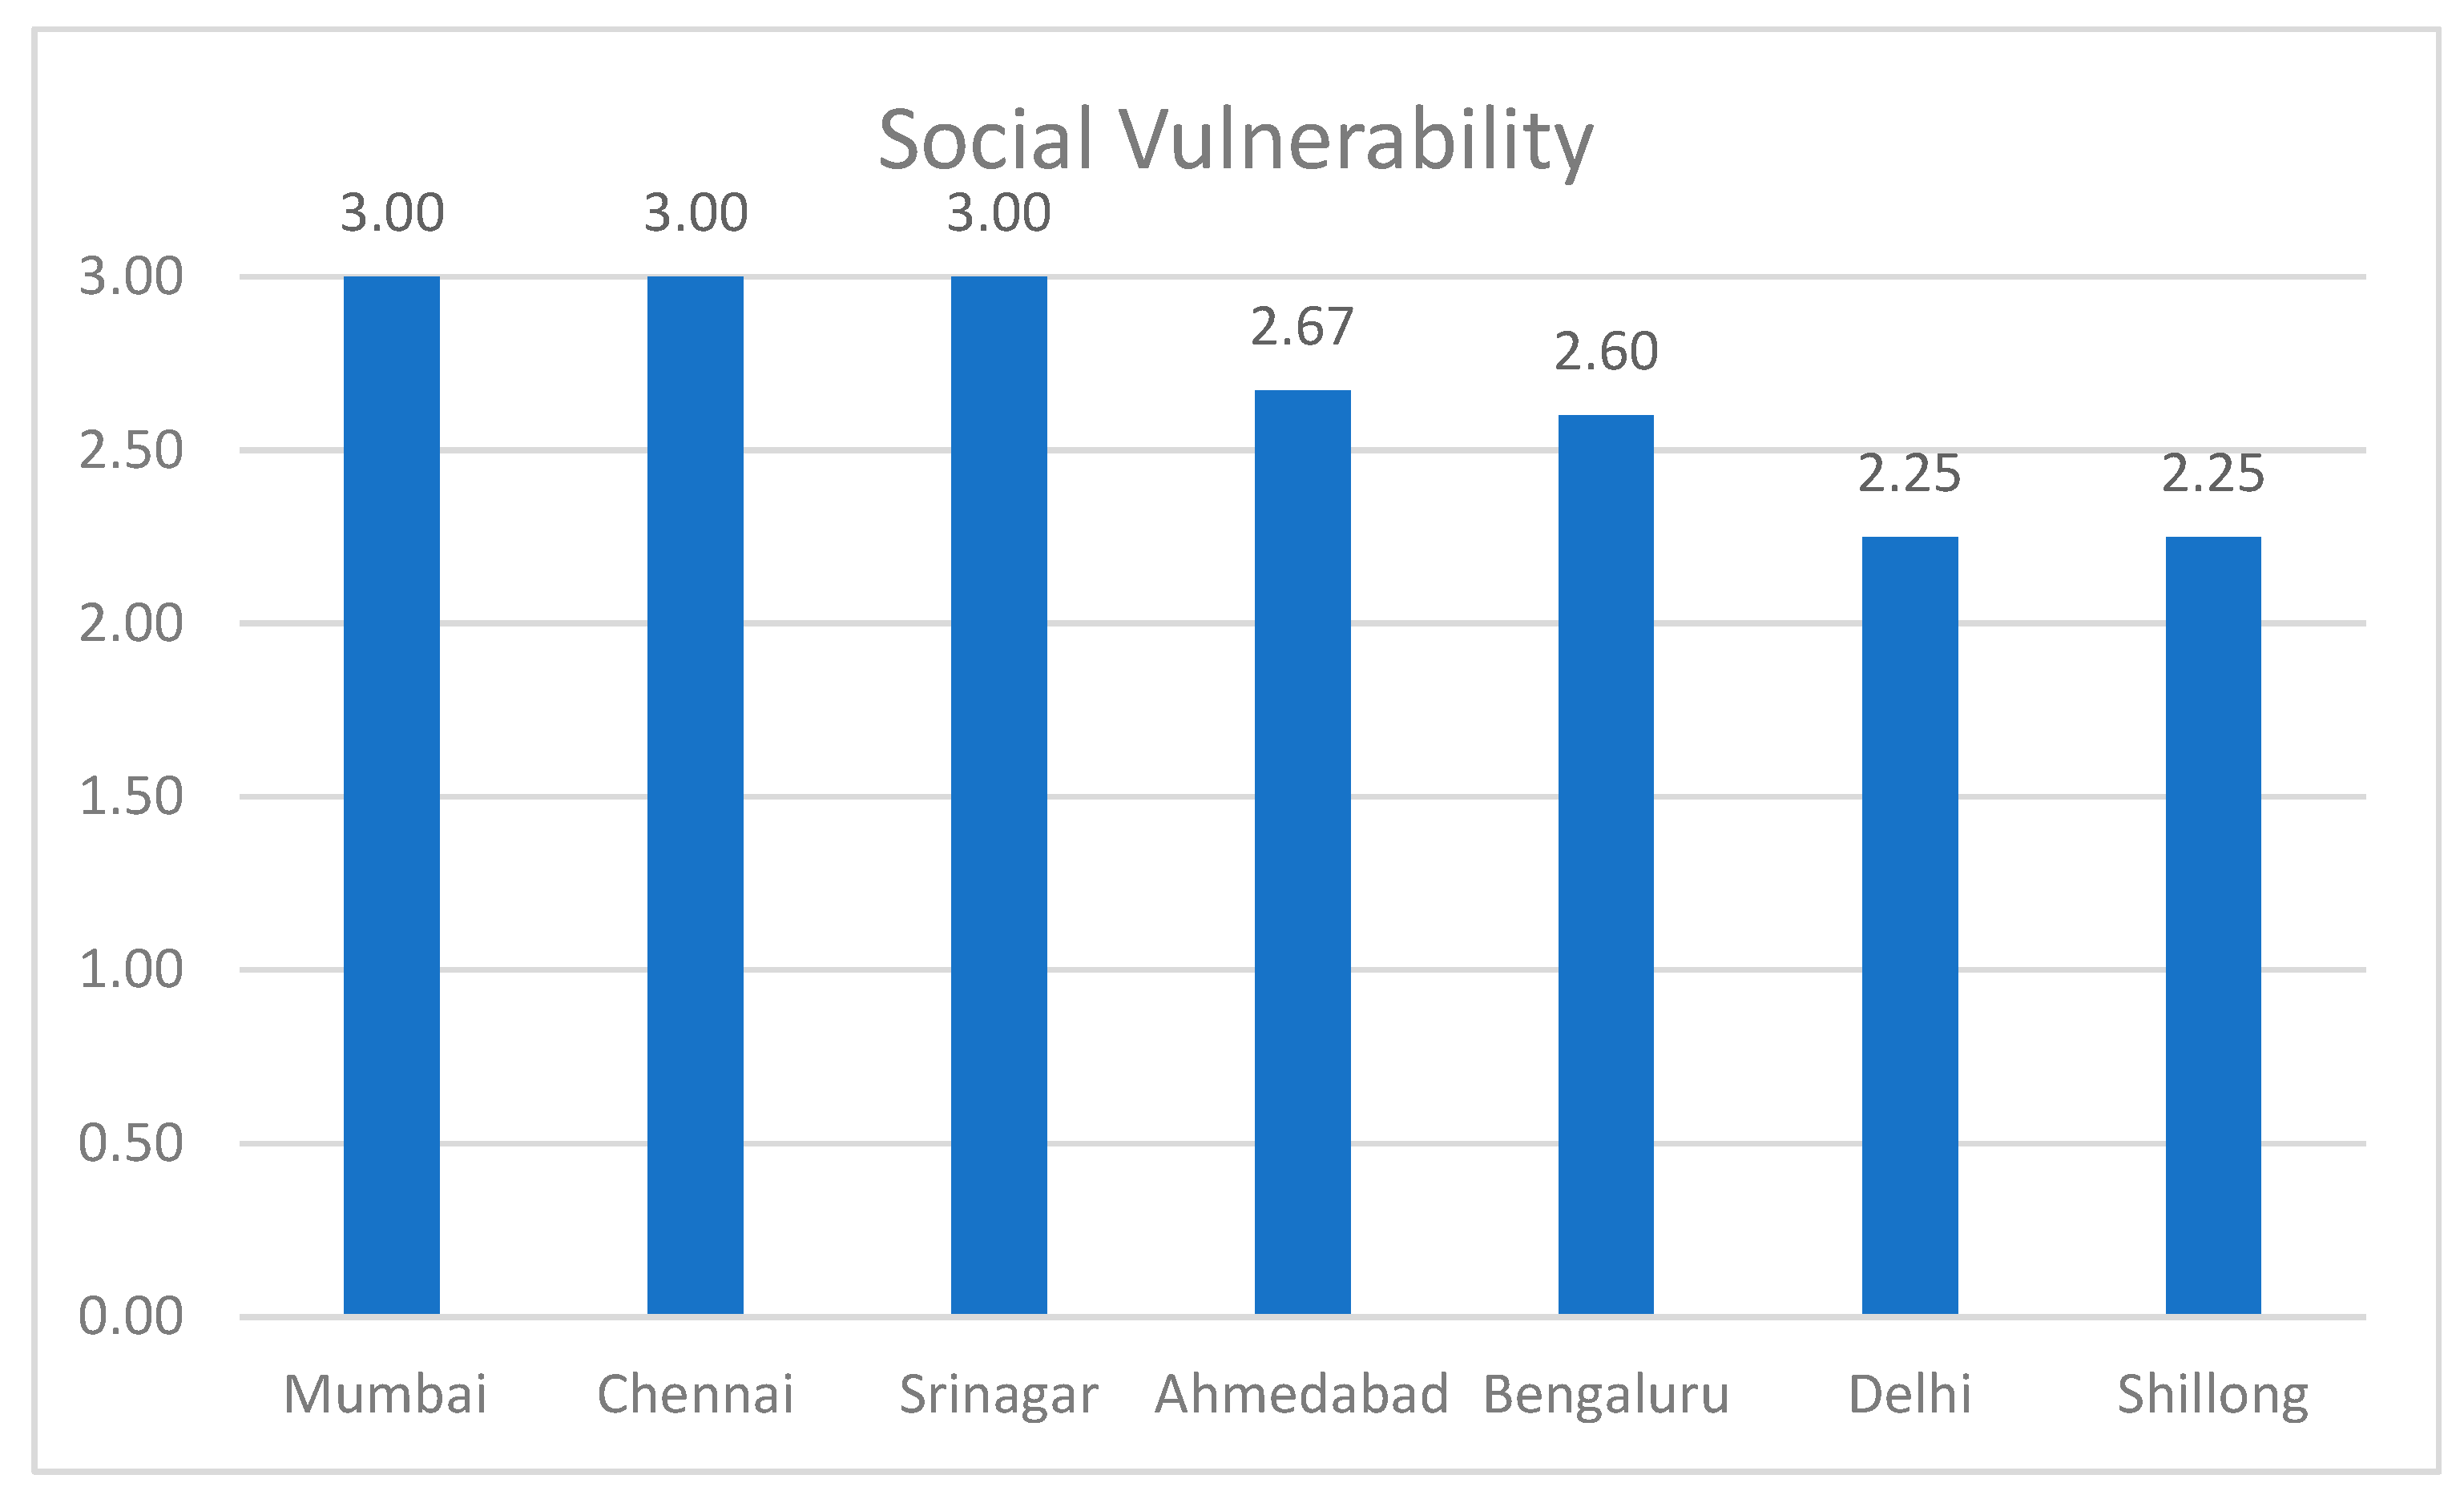
The social vulnerability score of each city obtained by ranking the respective sub-indicator depicts that Mumbai, Chennai and Srinagar are the most vulnerable, followed by Ahmedabad.
Most cities record high (more than 20%) slum population occupying hazard-prone areas like low lying flood plains or hilly terrains. In cities like Srinagar and Mumbai, a huge slum population resides on the river banks, making them highly vulnerable to urban floods.
The index depicts that the percentage of slum pockets upgraded and rehabilitated post-disaster was less than 50% in cities like Chennai and Shillong. In the case of Ahmedabad, the population resettled due to the lack of economic opportunities in the relocated sectors. Whereas the data concerning the issue of rehabilitation for Mumbai, Delhi and Srinagar is unavailable.
The vulnerability will rise with the rise in population. Data on the projected slum population portrays that Mumbai, Chennai and Ahmedabad are expected to experience a 10% increase in the existing slum population. This will further worsen the vulnerability of the underprivileged.
Along with this, the dependent/vulnerable sections are highly vulnerable in all the seven cities, and proper records of these sections are not being documented for reference at the time of hazard.
The updated data for the number of children, old (above 60), and women in all the cities are either not available or updated as per the latest records. This is a major limitation in the Indian administrative systems.
4.11. Infrastructure Vulnerability
Figure 8.
Infrastructure Vulnerability Scores.
Figure 8.
Infrastructure Vulnerability Scores.
The infrastructure and services that have been studied in detail against the MoHUA benchmarks, SLBs, are water supply, sewerage, solid waste management and storm water drainage facilities within the selected cities.
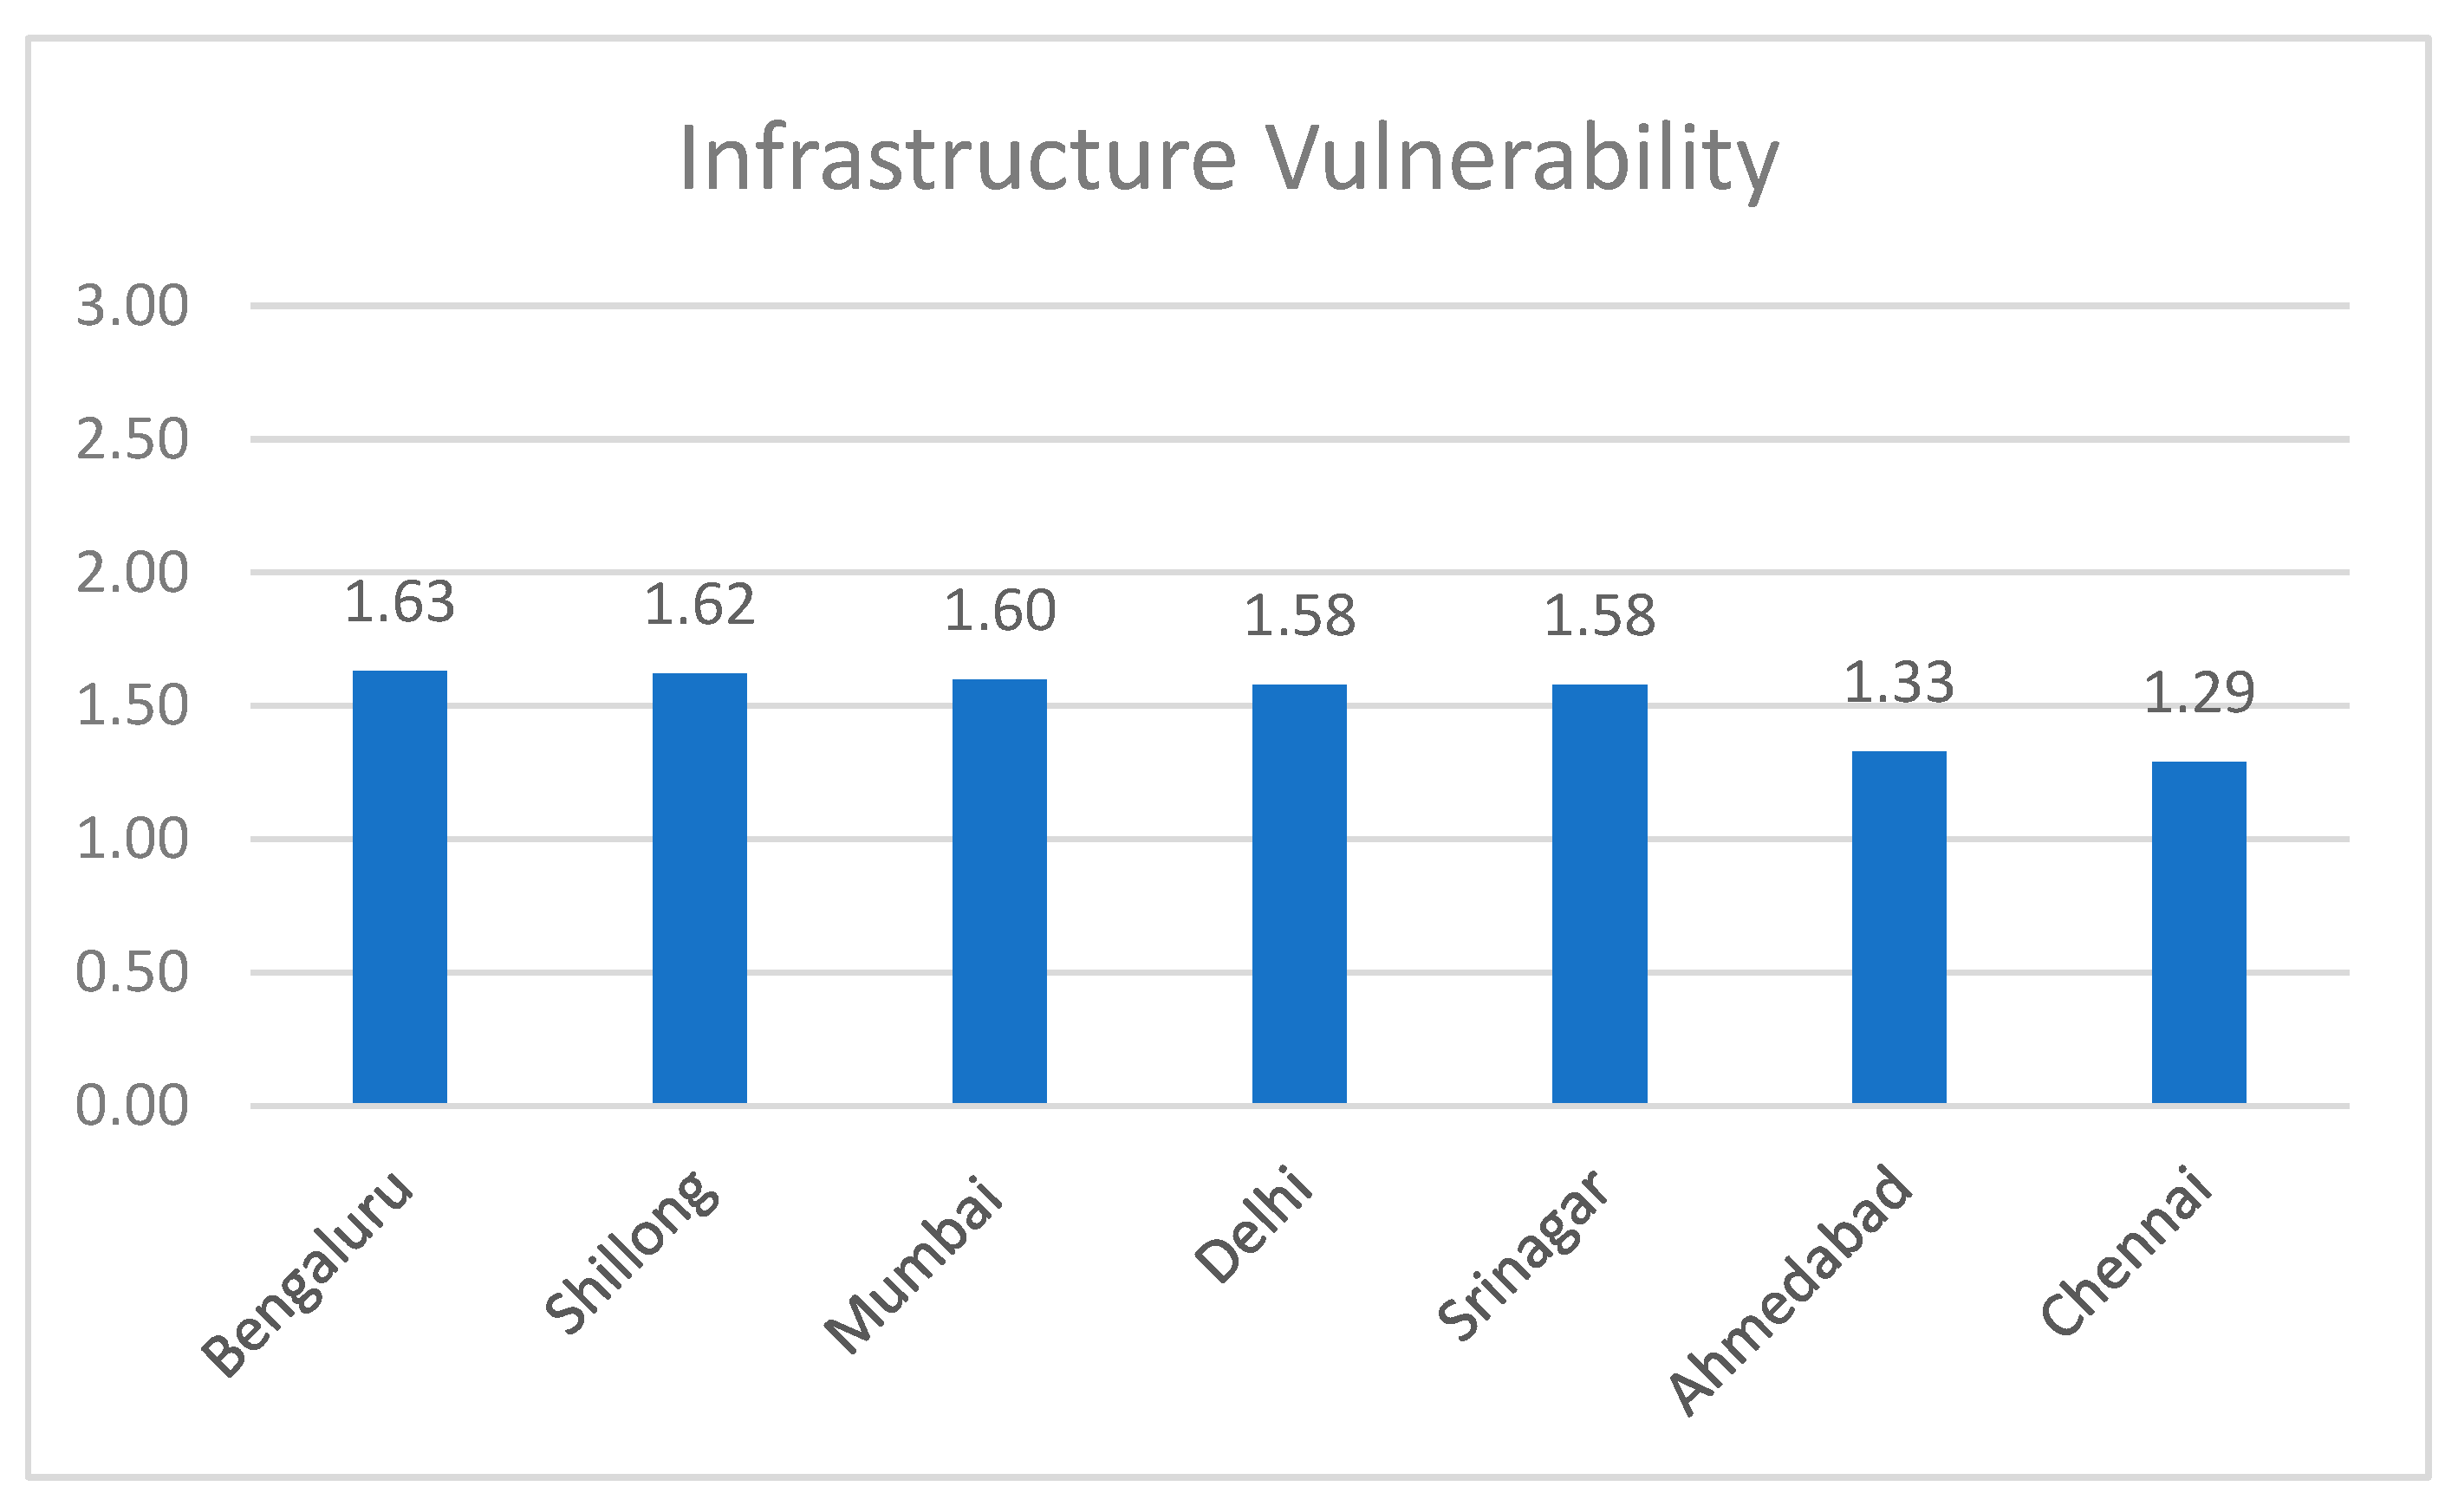
The infrastructure vulnerability score of each city, obtained by ranking the respective sub-indicator, depicts that Bengaluru is the most vulnerable, followed by Shillong and Mumbai.
Looking into the per capita water supply and availability of the potable drinking water and its quality, we find that the selected cities are at a lower to medium level of risk, as almost 50% of the households have access to nearly 75-135 lpcd of water for daily use and consumption. Also, the cities have tried to develop the supply network as per the SLBs set forth by the Central Govt. However, the water treatment facilities and the age of the water supply systems reveal that the cities are at a medium level of vulnerability as the structures are nearly 70 years old. Cities like Shillong do not have options for the regular cleaning and maintenance of the systems, as it is not cost-effective and may require the water system to be shut down for days, which is not feasible as there is no alternative source of water supply.
Delhi, Mumbai, and Chennai experience constant water shortage as the demand and supply gap in these cities is vast. They are at medium to high risk as the frequency of the water supply is sometimes less than two times a day, knowing that no Indian city has the provision of a 24*7 water supply.
There is a dire need for the cities to segregate the drinking water lines and replenish the groundwater level. These areas are mostly affected during disaster occurrences. Cities Mumbai, Chennai, Delhi and Bengaluru are at higher risk of vulnerabilities due to inadequate water supply facilities.
- 2.
Drainage facilities
The cities of Delhi and Mumbai generate some 17% of all the sewage in the country (Planning Commission, 2012-2017).
The cities have medium risk when it comes to the coverage of the drainage networks (50-80%). They are at low risk with the availability of water treatment plants. However, cities like Shillong and Srinagar have no facilities for segregation of the stormwater and sewage segregation and covered drains making the cities highly vulnerable. Urban flooding has been the major consequences of improper drainage facilities and their proper maintenance. Hence, most cities are at the risk of waterlogging, with more than 2-3 such incidences being recorded last year.
Mumbai, Delhi, Bengaluru and Ahmedabad are at higher risk of vulnerability due to inadequate drainage and sewage facilities.
- 3.
Municipal Waste
Solid waste management is defined as discarded solid fractions generated from domestic units, trade centers, commercial establishments, industries and agriculture, institutes, public services and mining activities (NIUA, 2015).
Except for Chennai, other cities have a high to medium risk towards hazards as below 50% of the cities’ waste is being treated. All the cities have a provision for landfill sites, but they lack a scientific treatment facility for safely disposing of solid waste without harming the environment.
All seven cities are highly vulnerable due to inadequate solid waste management facilities.
4.12. Administration and Governance:
Figure 9.
Administration and Governance Score.
Figure 9.
Administration and Governance Score.
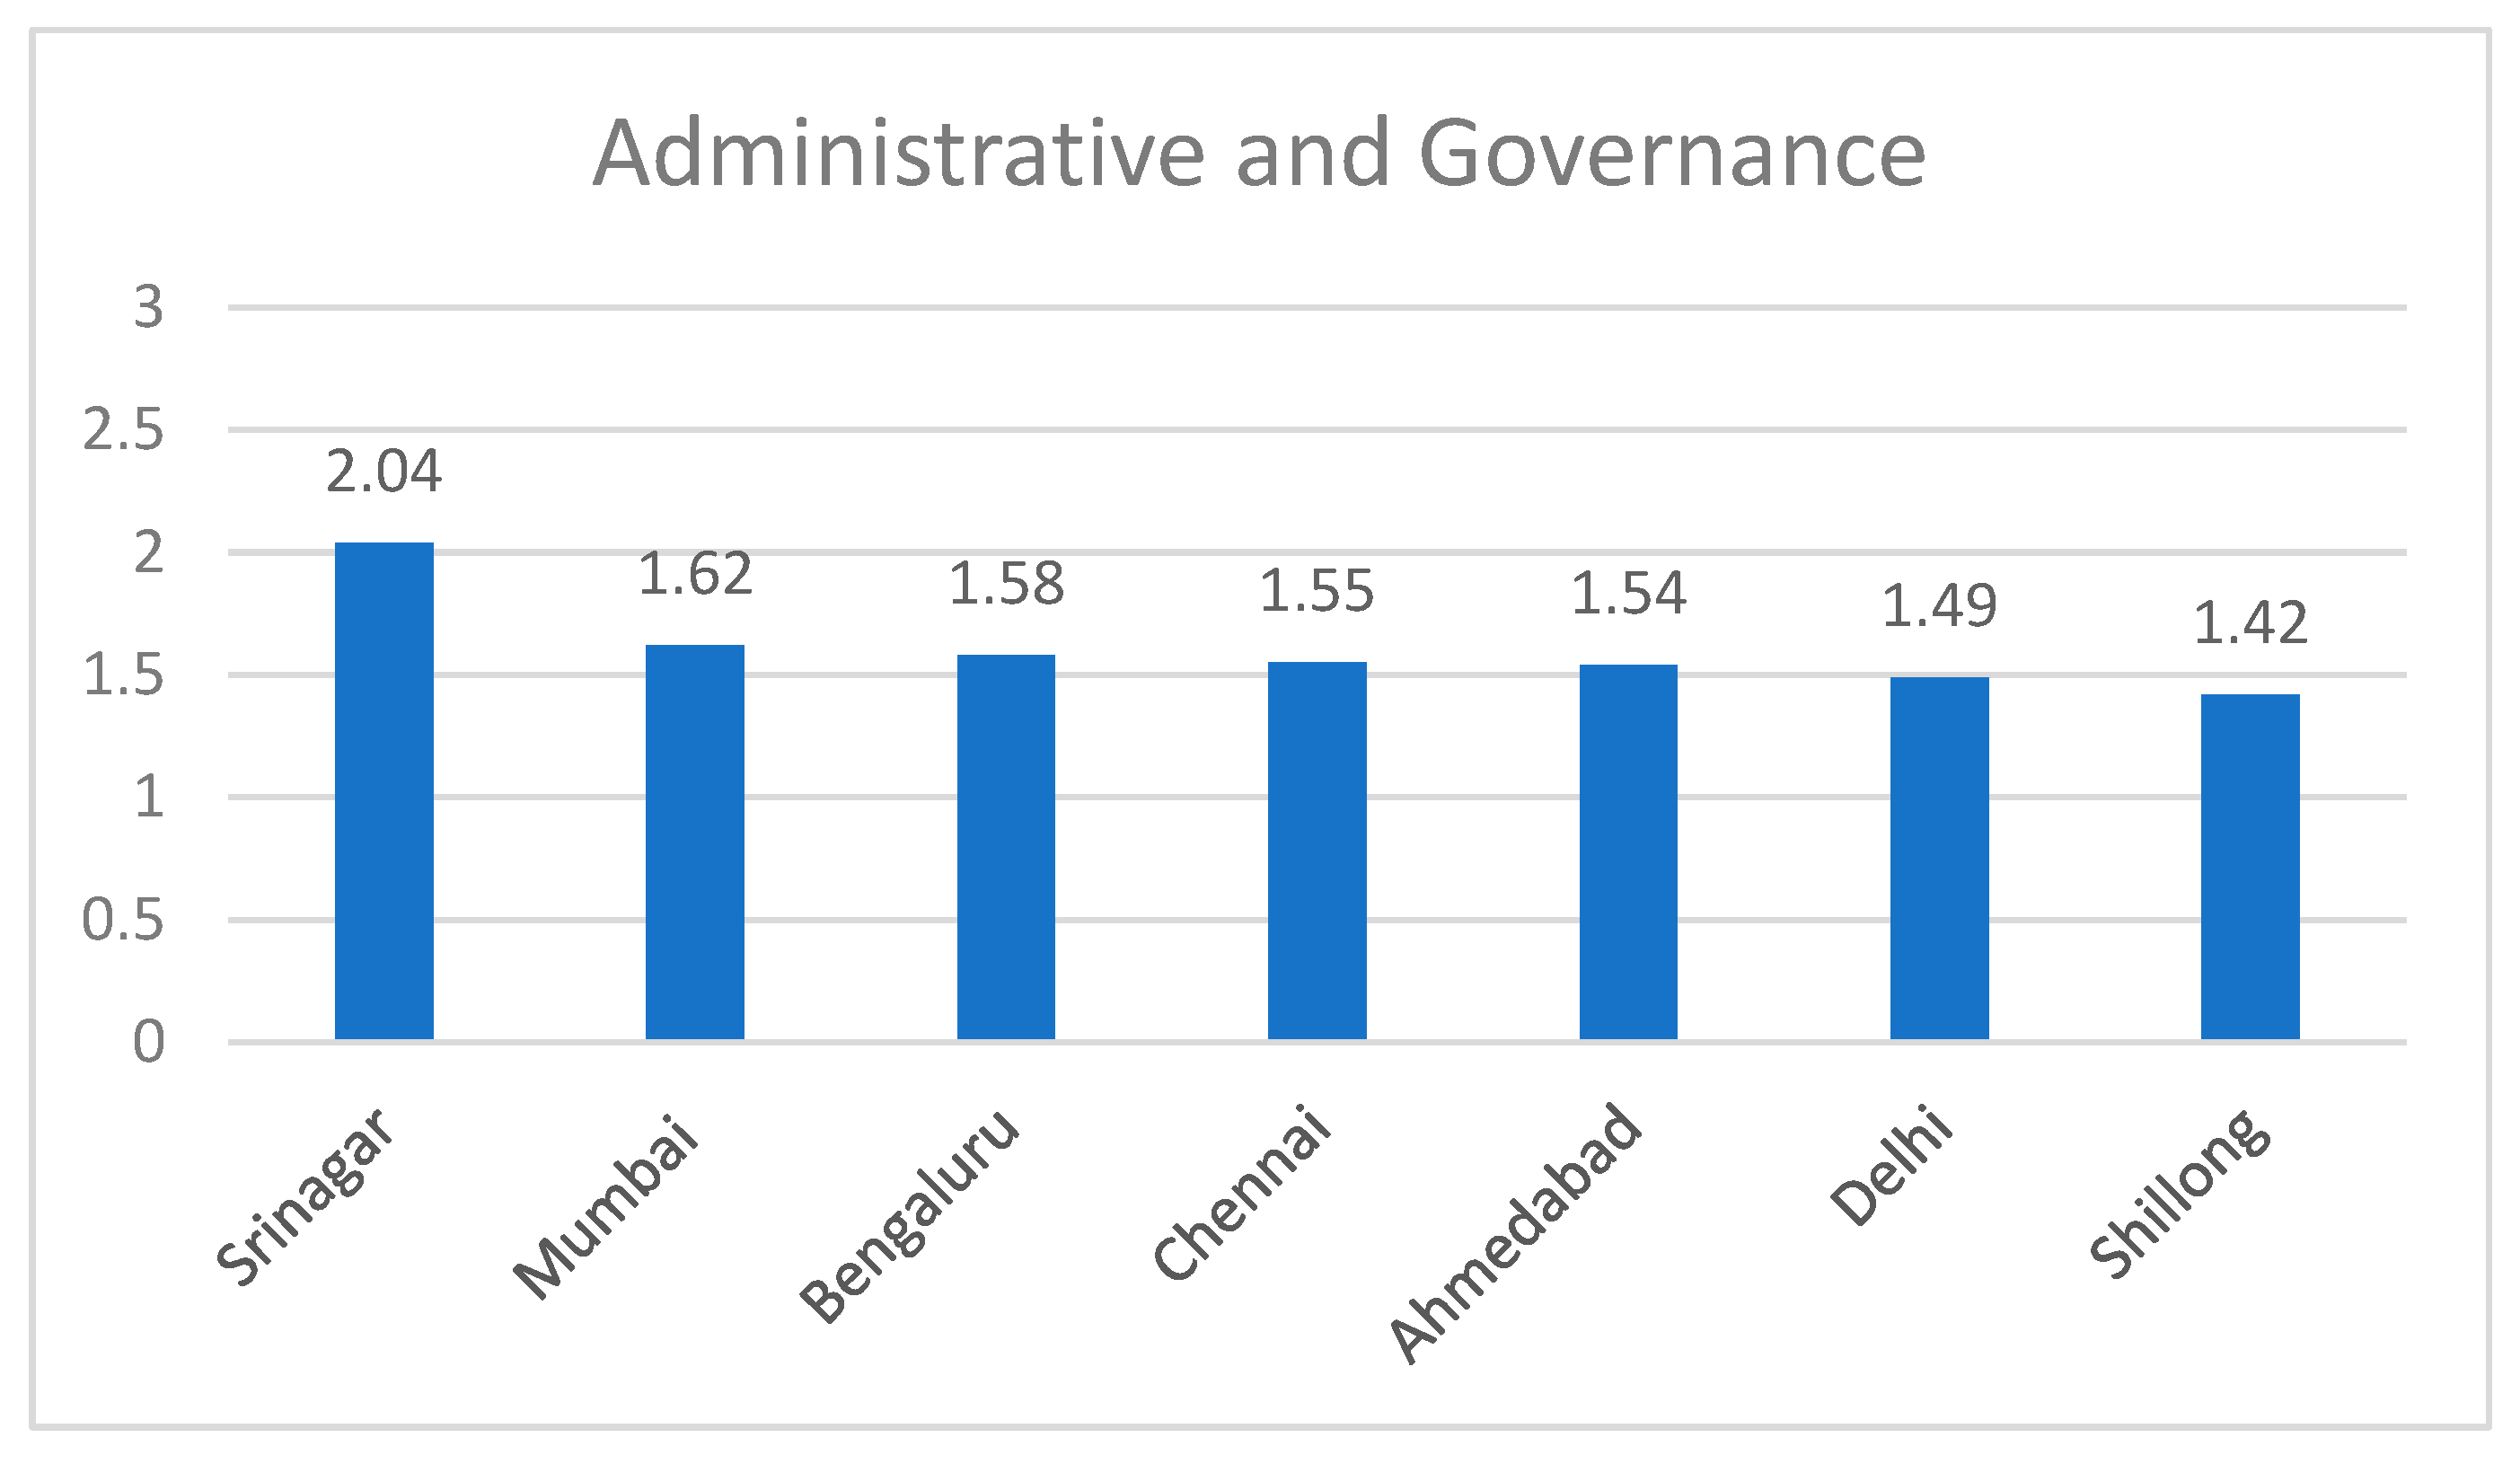
The Administration and Governance score of each city ranked by the respective sub-indicator depicts Srinagar as the most vulnerable, followed by Mumbai and Bengaluru.
Most cities are at low risk to the needs of commons as the changes in the land use patterns observed were less than 50% in most of the cities.
The availability of green cover in cities, like playgrounds, parks and likewise was found to be adequate, ranging from 12%-14% in the small cities, 18%-20% in medium cities and 20%-25% in metropolitan cities. However, Mumbai and Srinagar are the two highly vulnerable cities as they do not meet the criteria set as per the benchmark of urban greening guidelines of 2014.
Mapping of critical resources like water bodies and ecological hotspots are mapped in most of the cities. Chennai and Shillong experience high risks as no records for the same were obtained publically.
Mapping basic and critical infrastructure with slum locations plays a significant role in combating and recovering the hazard vulnerabilities. Except for Shillong and Srinagar, it is observed that most of the cities have acknowledged the need and mapped the essential components like infrastructure services and slums. Mapping of hazard-prone areas is vital to mitigate and prepare for hazards. The index represents that Shillong, Srinagar, and Bengaluru have limited approach to combating hazards as they have no records regarding the hazard-prone areas.
- 2.
Planning and Strategies:
Planning and strategies are core to prepare, plan and practise for the hazards affecting any city. The cities which are highly vulnerable to climatic hazards are Srinagar and Bengaluru. This is so because they do not have a city-level disaster management plan to manage hazards. They also lack the formation of a hazard-specific plan or multi-level hazard planning map.
It is also observed that the cities like Shillong and Bengaluru have no disaster risk management plans, green space development plan or natural resource management plan which is essential for preparedness purposes. A separate plan for climate change and extreme events projection is missing for most of the cities. Only Bengaluru has an integrated approach in planning strategies and plans for the same.
- 3.
Operational Preparedness:
The operational preparedness team is a backbone for carrying out disaster risk reduction measures. Expect for Chennai and Srinagar, other cities either have or are in the process of developing a dedicated team to handle and update disaster related databases, a dedicated municipal cadre and a dedicated team for disaster management response.
Preventive measures like early warning systems and awareness campaigns, training sessions and mock drills are an integral part of their preparedness measures, except for Shillong. The real-time monitoring systems are lacking for all the Indian cities, including the seven selected cities.
- 4.
Public Participation:
The scoring reflects the lack of public participation in Indian cities. It is often observed in all the cities that public participation initiatives like community participation in building DRR, the inclusion of traditional and local approaches to adapt to climate change and a bottom-up approach is either not documented and implemented or is just documented with no implementation.
Table 7.
Comparative City Analysis.
Table 7.
Comparative City Analysis.
| S.No |
City Classification |
Cities |
Physical |
Hazard |
Demographic |
Financial |
Social |
Infrastructure |
Administrative and Governance |
Population 2011 (Millions)
(Census 2011) |
Categorization on the basis of population
(Census 2011) |
| 1 |
Inland |
Delhi |
M |
M |
H |
M |
M |
M |
L |
16.31 |
Mega City |
| 2 |
Ahmedabad |
H |
M |
H |
L |
H |
L |
M |
5.50 |
Metro City |
| 3 |
Coastal |
Mumbai |
H |
M |
M |
L |
H |
M |
L |
18.41 |
Mega City |
| 4 |
Chennai |
H |
M |
M |
L |
H |
M |
M |
8.50 |
Metro City |
| 5 |
Hill Cities
|
Srinagar |
H |
H |
M |
M |
H |
M |
M |
1.27 |
Million Plus |
| 6 |
Shillong |
H |
H |
L |
L |
M |
M |
L |
0.14 |
Class 1 |
| 7 |
Southern Plateau |
Bengaluru |
M |
L |
H |
H |
H |
M |
M |
8.70 |
Metro City |
