1. Introduction
As of December 31, 2022, according to statistical data from the Guangzhou Municipal Administration of Government Affairs Data Management [
1], the Guangzhou Metro has 15 operational lines, along with 11 lines currently under construction. It also has 249 operational stations, with a total operating mileage of 621 kilometers. In 2022, the daily passenger flow exceeded 6.46 million passenger trips per day, and the Guangzhou Metro has experienced a daily passenger flow exceeding 6 million for the past five years. Ensuring even passenger flow between carriages and maximizing the capacity of the train has become an inevitable challenge in organizing passenger flow in urban rail transit. This requires effective guidance of passenger flow on subway platforms and reducing disparities in passenger distribution.
Various scholars have conducted research on how to implement effective strategies for guiding subway passengers and evenly distributing them across carriages. Tian Hongjin et al. [
2] proposed a method for guiding passengers to choose carriages by calculating the congestion level of each carriage. Wang Shiyi et al. [
3] utilized ATS data to determine the real-time congestion of carriages during subway train operation, helping passengers get in and out conveniently. Pang Mengyuan et al. [
4] employed image acquisition technology combined with time series forecasting to predict the alighting rate of an entire train, guiding passengers to board and alight trains more efficiently. ÇAPALAR J et al. [
5] obtained the number of passengers in each carriage via pressure sensors, enabling passengers to choose carriages with fewer people. DING H et al. [
6] proposed a passenger carriage selection guidance system using passenger distribution as an indicator, based on a subway riding guidance model established on the URT platform. Additionally, ZHENG Z et al. [
7] proposed a real-time congestion measurement system for passenger flow on platform screen doors, aimed at identifying congestion events and reducing passenger accumulation on platforms.
Previous studies have focused on guiding passenger distribution by measuring the level of crowding in each subway carriage and attempting to mitigate any existing imbalance. However, these methods have several limitations. They fail to consider the impact of the number of passengers disembarking on the uneven distribution of passengers and do not account for the number of passengers remaining in each carriage, which is a significant factor affecting carriage imbalances. To address these limitations, we utilized Anylogic simulation software to evaluate subway passenger distribution imbalances across several stations of operation, specifically on the Guangzhou Metro Zhujiang New Town Station Line 5 platform. We considered several factors that could have an impact on subway passenger distribution, including the number of people waiting outside the platform screen door, distance between passengers in the queue, the number of people already occupying each carriage, and the number of passengers disembarking. Our study provides quantitative evidence supporting the significant impact of the number of passengers disembarking on the distribution of passengers across subway carriages.
2. Methods and Materials
2.1. Subway Platform Passenger Flow Guidance Methods
The effective management of passenger flow on subway platforms is a critical issue for ensuring efficient operation and passenger safety. Two commonly used guidance methods have been identified in the literature [
8,
9]:
(1)Guidance method 1(Manual guidance), which relies on the experience of station staff to assist in arranging passengers to board the train during peak passenger flow. This method is currently the most prevalent approach adopted by subway stations worldwide.
(2)Guidance method 2(Automatic guidance), which uses various means to collect information on the current congestion level in each car of the incoming train and guides passengers to choose relatively spacious cars through the Passenger Information System (PIS) on the platform. This approach is implemented on several subway lines in different cities, including Shenzhen Metro in China, and in countries such as South Korea and Singapore. Among them, the Singapore subway (SMRT) has achieved better results by combining car congestion information with voice guidance to improve passenger guidance at the platform level.
This article proposes a novel platform guidance method, referred to hereafter as "guidance method 3". This new approach is developed based on the analysis of the existing guidance methods used in subway stations, particularly the successful model implemented by SMRT.
Guidance method 3 is designed to consider the current congestion level of each train car and the number of passengers waiting in each car on the platform. Moreover, this approach integrates the prediction of the passenger flow getting off at each car, which is generated using short-term passenger flow prediction models [
10]. By comprehensively considering these three aspects, guidance method 3 aims to guide passengers efficiently and accurately to choose a reasonable and fast waiting queue on the platform.
1.3. Evaluation indicators
Subway passenger flow balance refers to the degree to which the number of passengers is evenly distributed among subway cars. Previous studies [
11,
12] have used the variance of balance as a quantitative measurement index. However, the variance of balance tends to grow rapidly as the passenger flow increases, which can interfere with the comparison of imbalance when small passenger flows are plotted on the same chart. To address this issue, this article proposes using the standard deviation of balance (
B) as the measurement index, as it provides a similar calculation method to the variance of balance, but with more accurate measurement and without interference with imbalance comparisons. Specifically,
B calculates the deviation between the number of passengers in each car and the average number of passengers at the same time, allowing for a more precise assessment of the uniformity of passenger distribution between subway cars. The formula for calculating
B is as follows:
where
represents the number of passengers in carriage i,
μ is the average number of passengers in all carriages,
N is the total number of stations passed, n is the number of carriages, and in China, the commonly used value for n is 6.
2.2. Introduction to AnyLogic Software
AnyLogic is a Java-based simulation modeling software for various fields, such as industrial manufacturing, logistics, transportation, healthcare, finance, and the environment. The software allows for the establishment of discrete event, system dynamics, and agent models, with high flexibility and scalability.
Compared to other simulation software, AnyLogic adopts a mixed modeling method that combines different types of models to provide more accurate system behavior representation. Additionally, AnyLogic offers advanced visualization and dynamic data analysis features to help users better understand and interpret simulation results. The software is also based on UML and Java language modeling methods, enabling users to develop, program, and improve model animation displays and visualization of evaluation indicators quickly.
In this article, AnyLogic simulation software is used to model and simulate subway platform passenger flow organization. Specifically, the pedestrian library module in AnyLogic and some track library and process library modules are utilized. The social force model algorithm underlies the pedestrian library module.
2.3. Basic principle of the social force model e
The social force model is a continuous micro-simulation model that provides real pedestrian trajectories based on the framework of a multi-particle self-driving system. This model assumes that individuals have the ability to think and react to the surrounding environment. It uses the concept of social force to describe subjective desires, mutual relationships between people, and mutual influences between people and the environment, and relies on three forces as follows:
(1) Intrinsic force: The impact of subjective consciousness on individual behavior can be transformed into the "social force" exerted by the individual upon themselves, embodying the motivation of pedestrians to move towards their destination with an eager pace. The kinematic equation is as follows:
where
represents the spatial position vector of pedestrian α, and
is the desired speed of pedestrian α.
(2) Force between people: It refers to the "force" exerted in an attempt to maintain a certain distance from other pedestrians, simulating the behavior of individuals in a crowd to avoid collisions. The equations for pedestrian acceleration, deceleration, and directional changes are as follows:
where
represents the social force, and
is the disturbance term reflecting the deviation of random behavior.
(3) Force between people and walls: The influence of the wall on humans is similar to the interaction between individuals, simulating the perception and response of individuals to the surrounding environment in order to find a passable path. The equation for social force is as follows:
where
is the acceleration force, is the force between
the person and the wall,
is the force between pedestrian a and other pedestrians β, and
is the attraction effect.
2.4. Assumptions of the Model
To simplify the passenger behavior and reduce unnecessary complications within the simulation model, certain assumptions are made. These include:
(1) Passengers in the social force model are assumed to be affected by other passengers, walls, and waiting queues. To simplify their behavior, the model assumes that the passengers occupy a two-dimensional circular space, with a diameter range of 0.2 to 0.3 meters, reflecting the typical physiological sizes of Chinese crowds.
(2) During the waiting process, passengers will queue up in order to board the train without cutting in line, switching between queues, leaving the station during the waiting period, or giving up this train.
(3) Pedestrians are assumed to choose the nearest car as the priority waiting queue under other circumstances.
(4) Based on literature [
4], it is established that more than 80% of people hope the walking distance to be within 50 meters, about 70% are willing to walk a certain distance to go to a spacious car, and almost 90% want information about passenger flows within the car to guide passengers towards a more convenient and comfortable travel. Therefore, this study applies an 80% threshold to determine whether the passengers are accepting guidance. 4.2 Construction of Simulation Environment The simulation model employs B6 type trains on the platform of Guangzhou Metro Zhujiang New Town Station’s Line 5 [
13]. Zhujiang New Town Station is ranked second in passenger flow among Guangzhou Metro stations in 2019, giving the simulation model a degree of representativeness.
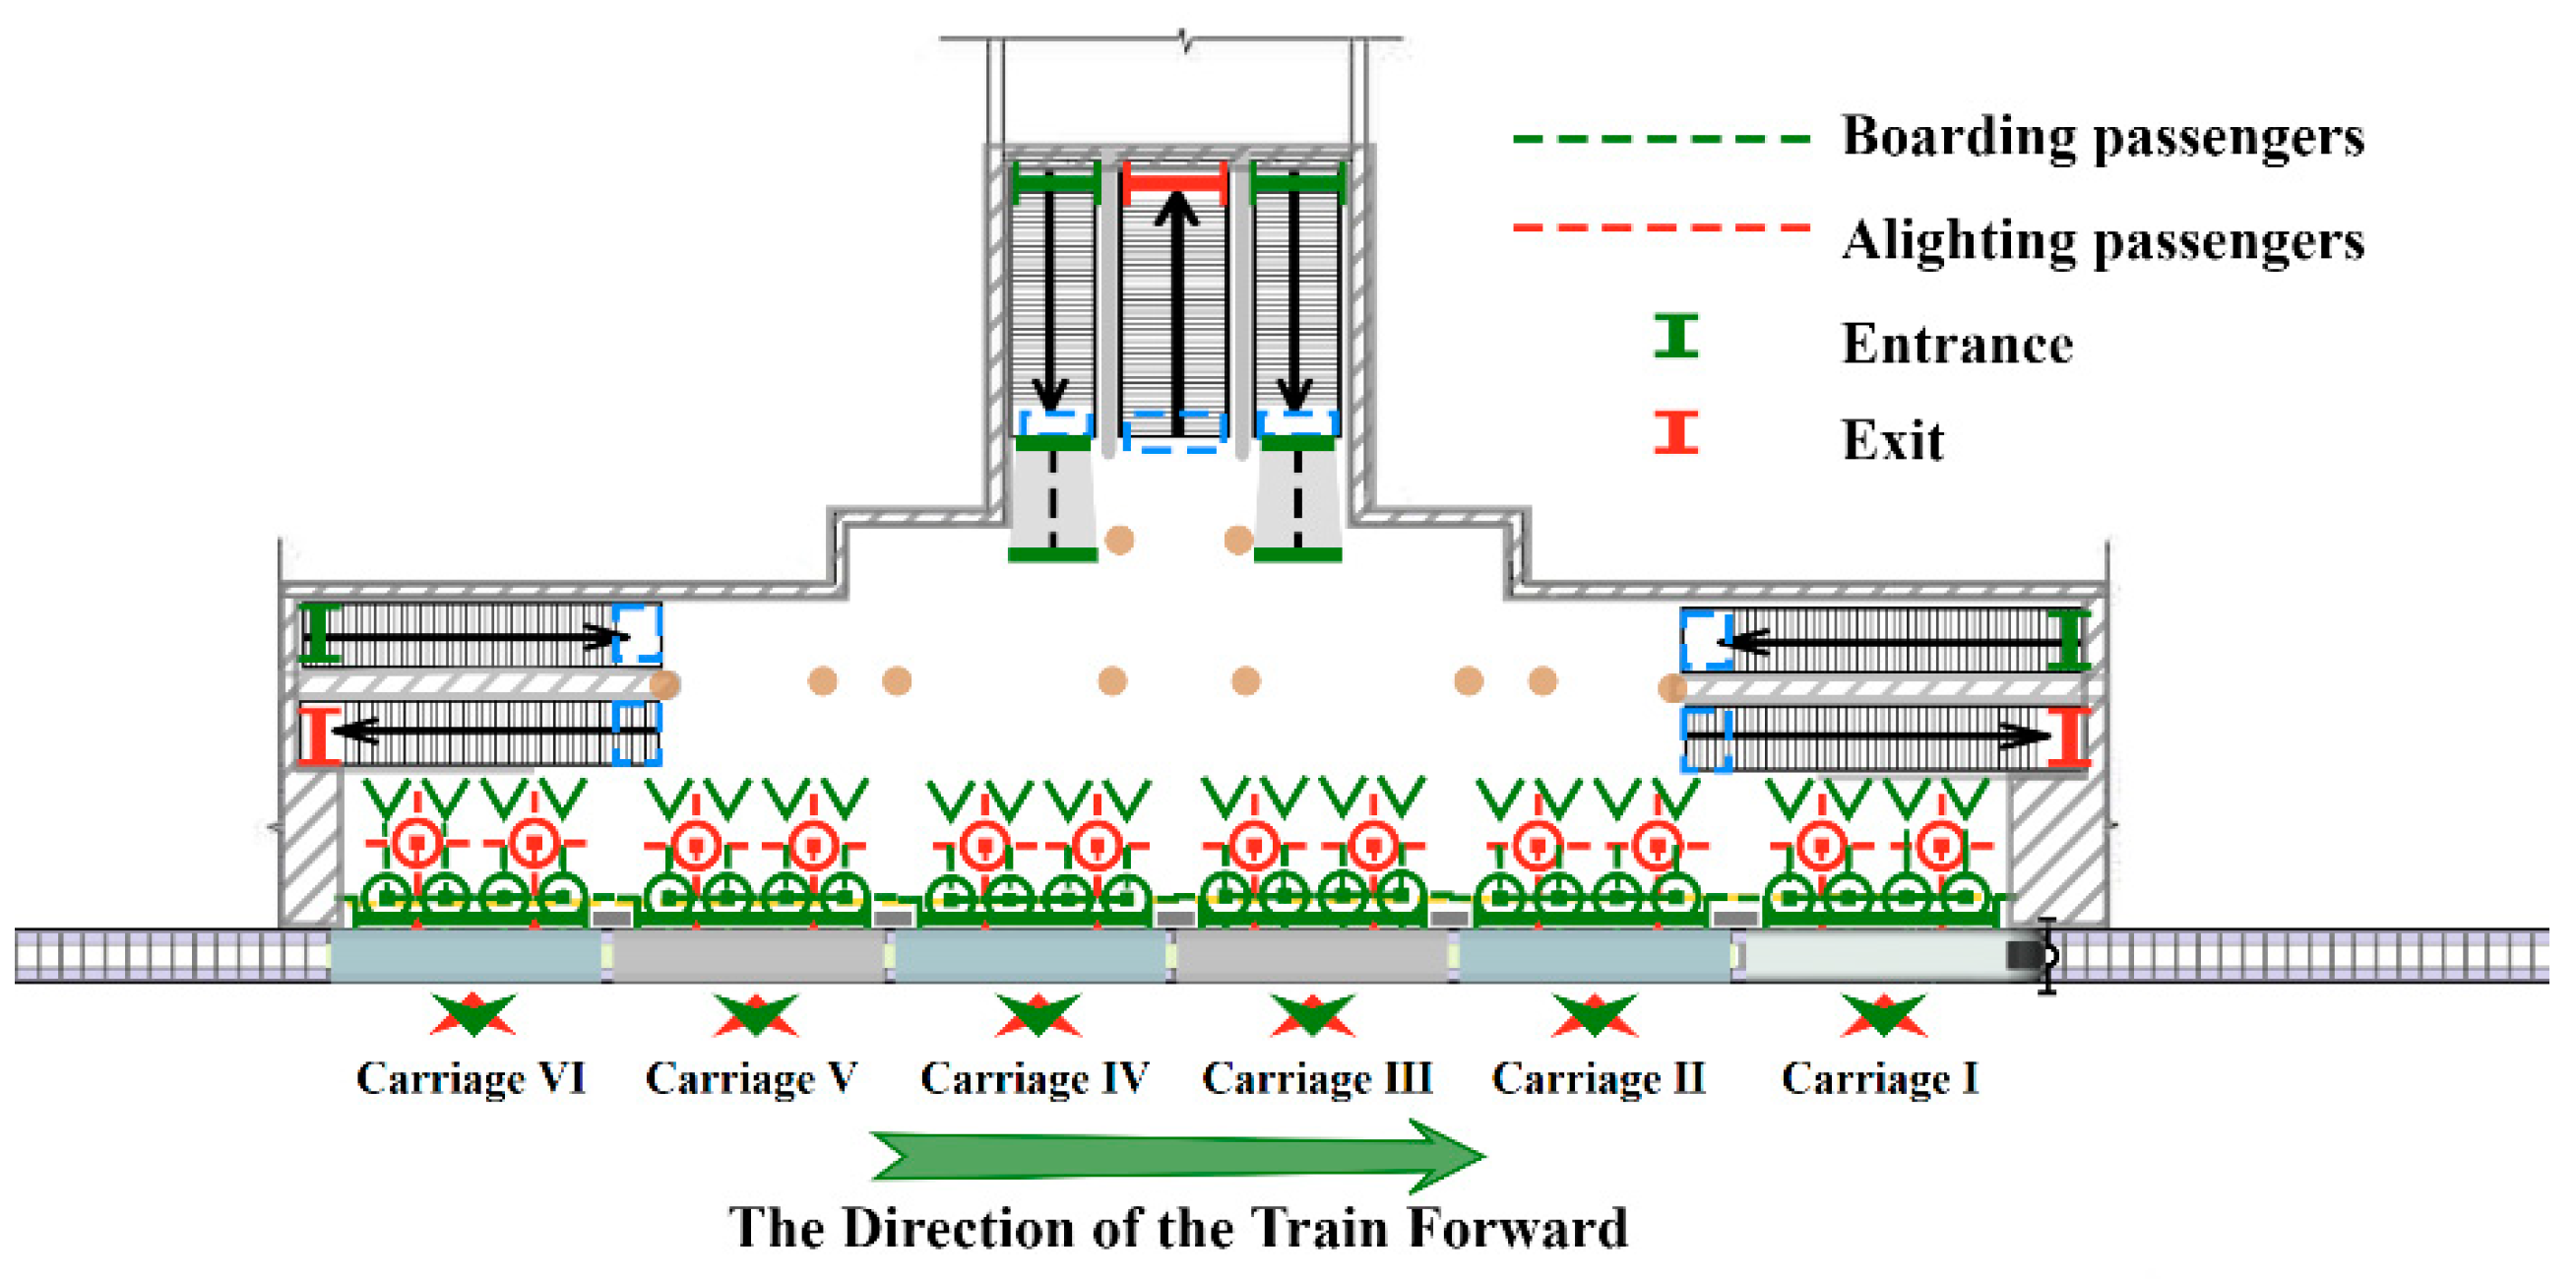
Figure 1 shows the specific layout of the facility.
2.5. Assumptions of the Model
This simulation model is based on the platform of Line 5 at Zhujiang New Town Station in Guangzhou Metro. The main structure of Zhujiang New Town Station on Line 5 has a total length of 145.3 meters, and the standard segment width of the station is 29.0 meters. Line 5 of the metro adopts the B6-type train [
13], with a car length of 19 meters, a car width of 2.8 meters, and each car has 4 doors. In 2019, Zhujiang New Town Station ranked second in terms of total passenger flow among Guangzhou Metro stations, making it quite representative. The specific layout of the station facilities is shown in
Figure 1.
2.6. Streamline Analysis of Simulation
The passenger flow streamline in a subway station is defined by the passenger’s movement path and can be broken down into the passenger boarding process and the passenger disembarkation process. Passenger boarding process describes the flow path of passengers who have arrived at the platform level and select a waiting queue before boarding the train. Whereas, passenger disembarkation process refers to the path passengers follow to leave the train and exit the station upon arriving at their destination. To investigate the impact of the number of passengers exiting each car on the uneven passenger distribution, this paper focuses on analyzing the selection process of a waiting queue during the passenger boarding process.
Figure 2 illustrates the specific logical judgment process.
2.7. Construction of Simulation Model
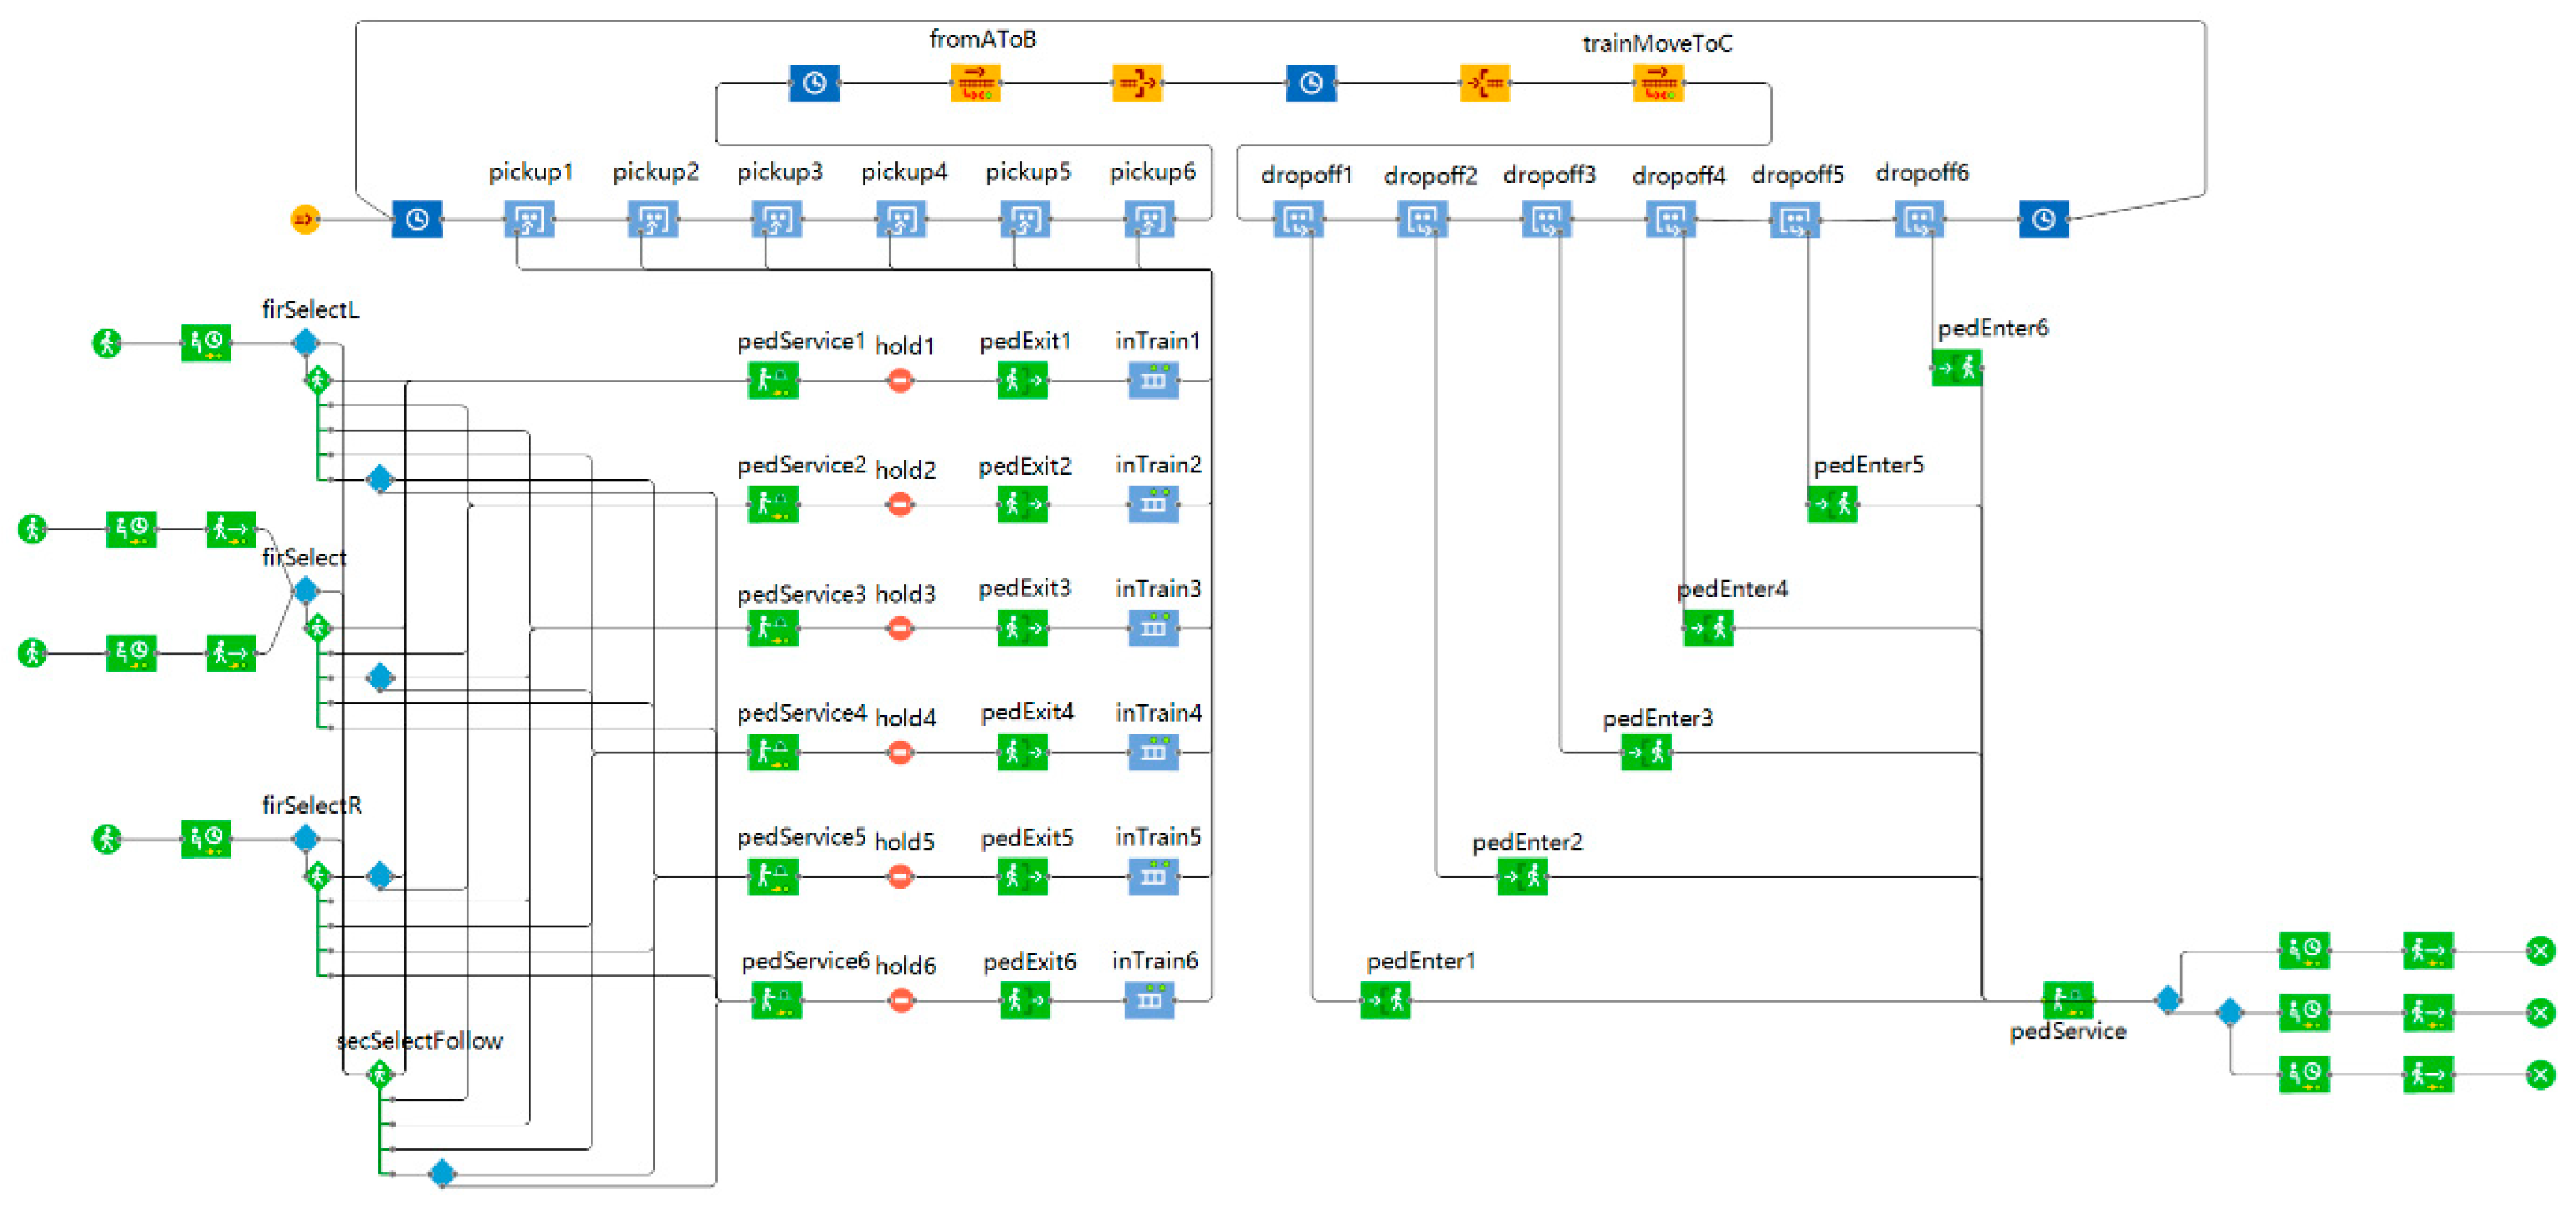
This simulation model extensively utilizes the pedestrian library, track library, and process library in Anylogic based on the fundamental logic of the subway platform operation process.
Figure 3 illustrates a subway system operation flowchart colored yellow. Using the Anylogic track library, the train track is established, including items such as the position of the docking platform and the track’s endpoints marked with space tags. This allows the simulation of multiple platforms, the boarding and alighting of passengers, and the acceleration of the train as it departs from the station. In the passenger boarding process flowchart, marked green, Anylogic’s pedestrian library is employed, and key areas such as the entrance, waiting area, exit, and the passenger boarding route and queue are identified. The two modules are integrated using Anylogic’s process library (colored blue in the figure) that connects each car’s relationship in the track library to the boarding and alighting passengers in the pedestrian library. It offers a judgment logic interface to allow the proper implementation of the preset selection logic.
The operational logic of the model is based on the flowchart of the simulation model. The generation of subway trains is realized by the track library, enabling the movement and looping of trains to simulate their behavior as they pass through multiple stations. The interaction between trains and passengers is facilitated through the process library, which records the number of waiting passengers outside each car, manages the generation and removal of agents, and simulates passenger behaviors such as boarding, moving inside the train, and disembarking at stations. The generation of passenger agents is implemented by the pedestrian library, where agents are generated at specified locations according to predetermined proportions. Once the agents reach a designated area, they briefly pause to simulate the time required to receive guidance information. Subsequently, they follow the system’s instructions, select the appropriate car, and move to the end of the corresponding car’s waiting queue. The specific functions of each module are shown in
Table 1,
Table 2 and
Table 3.
The TrackLibrary module is responsible for generating train agents, simulating the movement of subway trains along the tracks, and facilitating the simulation of train behavior across multiple stations.
The PedestrianLibrary module is responsible for generating pedestrian agents, simulating their movement, behavior, and interaction with the environment, including entering the platform, boarding the train, and exiting at the destination.
The ProcessLibrary module serves as a connector between different components of the simulation, facilitating the flow and coordination of pedestrian agents, train operations, and passenger interactions. It controls the progression of processes, such as platform access, passenger counting, train occupancy, and disembarkation.
2.8. Model Parameter Settings
The single station run time of the train, passenger boarding and alighting time, passenger leaving seat pre-alighting time, subway arrival pre-opening time, departure pre-acceleration time, and the boarding time for a single passenger were set to 1 minute and 20.53 seconds, 42.02 seconds, 45.53 seconds, 1 second, 1 second, and 0.1 seconds respectively, based on frame-by-frame statistics of the entire Point of View (POV) of Guangzhou Metro Line 5 (Jiaokou-Wenchong). According to literature[
14], the proportion of transfer passengers among boarding and alighting passengers on Line 5 in Zhujiang New Town is 73.8% and 47%, respectively.
Table 4 presents a detailed outline of the relevant parameter settings for the AnyLogic Model.
3. Result
Academic literature [
12] reports that the average daily passenger flow for Line 5 in Zhujiang New Town is 240K individuals per day. To simulate the passenger distribution, three guidance methods are utilized, with passenger flows ranging from 120K to 600K people per day. The equilibrium degree’s standard deviation’s reliability under each condition is above 90% (1-
,
is the mean confidence).
Table 5,
Table 6 and
Table 7 show the results:
Table 5 displays the standard deviation of equilibrium degree for passenger flows of 120K to 360K people per day under the guidance method 1 condition. When passenger flow surpasses 360K people per day, platform accumulations occur, which prevent the AnyLogic simulation platform from collecting adequate data points under stable conditions. Thus, there is insufficient relevant data for passenger flows of 480K and 600K people per day.
Table 6 presents the simulation results of standard deviation of the equilibrium degree for passenger flows ranging from 120K to 600K people per day under the guidance method 2 condition. As passenger flow on the platform increases, the platform’s passenger distribution imbalance also increases at a certain level. Although the overall passenger distribution on the platform is more balanced and stable under the same passenger flow conditions, the number of samples available for reliable standard deviation of equilibrium degree is much lower than for guidance method 1.
Table 7 displays the simulation results of standard deviation of the equilibrium degree for various passenger flows under the guidance method 3 condition. Compared to guidance method 2, guidance method 3 is more effective, requiring fewer samples to achieve a reliable standard deviation of equilibrium degree, and leading to a more balanced and stable passenger distribution on the platform.
4. Discussion
4.1. Analysis of Simulation Data
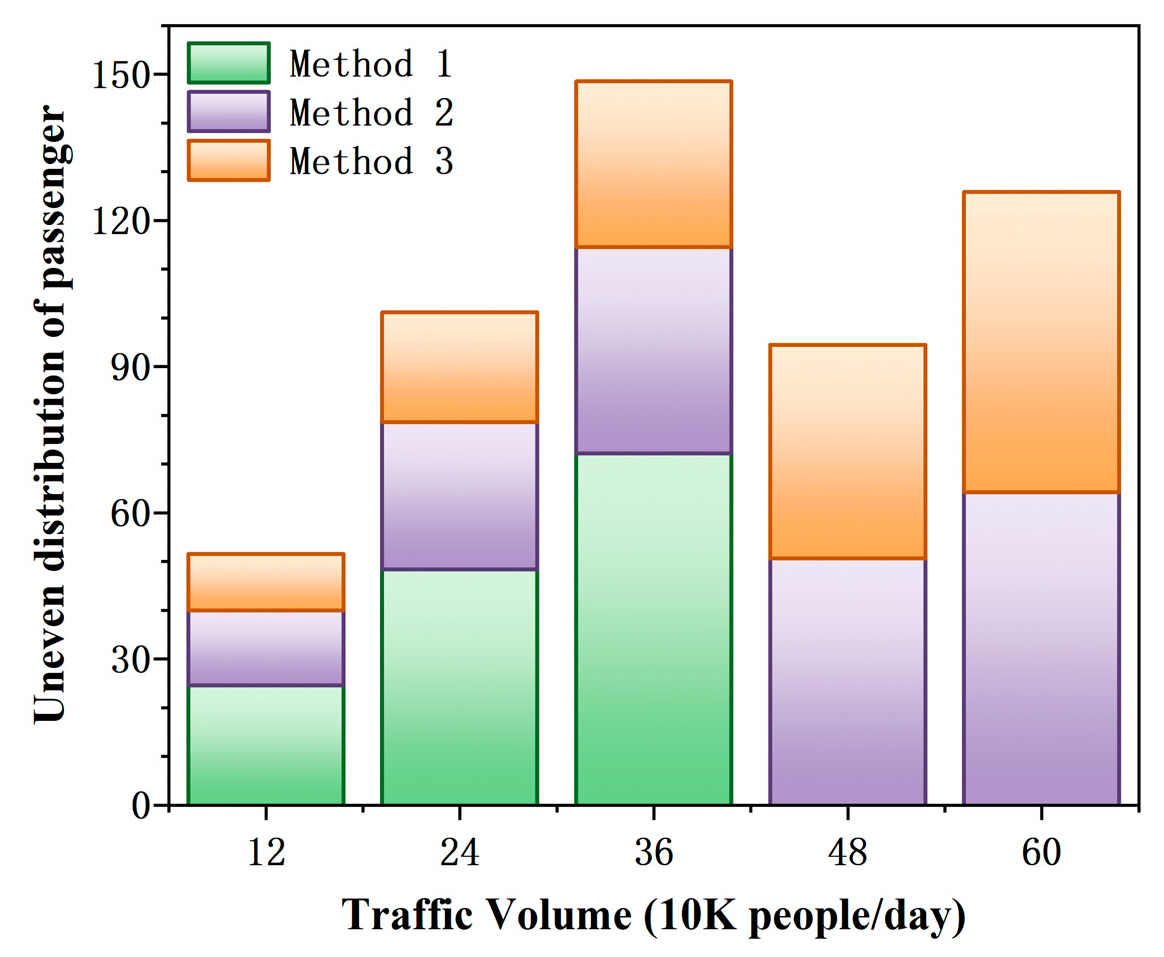
Figure 4 illustrates the standard deviation of the equilibrium degree for the three subway platform passenger flow guidance methods. Guidance methods 2 and 3 offer significant improvement in obtaining reliable data within 600K people per day and in addressing the issue of uneven passenger flow distribution, particularly when compared to guidance method 1, which can only collect data up to 360K people per day.
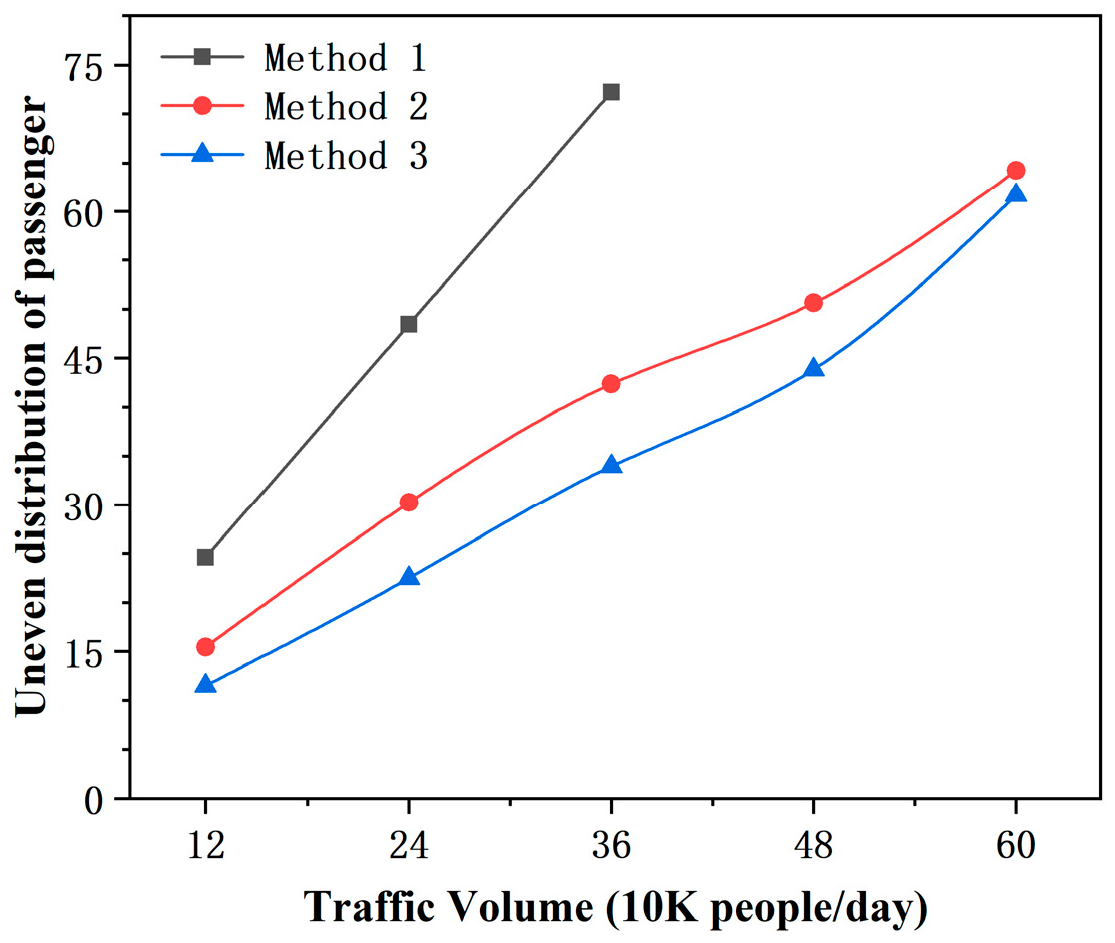
Figure 5 displays a line chart representing the entropy-based imbalance of passenger distribution in each carriage as platform flow increases. Notably, the existence of a proportion of passengers who ignore guidance leads to an increase in entropy-based imbalance with rising passenger flow. Guidance method 3 performs better than guidance method 2 in addressing this issue. However, as passenger flow continues to increase, the effect of improvement weakens due to insufficient transportation capacity on the platform. At this point, additional guidance and flow restriction measures are necessary to produce further improvement. Please refer to
Table 8 for details of specific improvement ranges.
4.2. Analysis of Passenger Flow Distribution Using Simulation Platform
The passenger density map is an intuitive and vivid way to represent the distribution of passengers on the platform. To better understand the platform passenger flow distribution under different guidance methods, we observe the passenger density map after one hour of running the model in virtual time mode. A key density of 9 people per square meter is used.
Figure 6 displays the passenger density map for guidance methods 1, 2, and 3 at Zhujiang New Town Station’s Line 5, with an average daily passenger flow of 240K people. The figure indicates a mild passenger concentration in the waiting queue for the middle carriage under guidance method 1. In comparison, the passenger distribution under guidance methods 2 and 3 is more balanced and shows a state of equilibrium.
Figure 7 presents the passenger density map for guidance methods 1, 2, and 3 at Zhujiang New Town Station’s Line 5, where passenger flow reaches 480K people per day. The map indicates significant passenger accumulation in the waiting queue for the middle carriage under guidance method 1. By contrast, under guidance method 3, the platform displays fewer passenger accumulations and a more equitable passenger distribution in comparison to guidance method 2.
5. Conclusions
This paper provides a comprehensive summary and explanation of the current two passenger flow guidance methods on subway platforms and proposes a novel approach. The new method is based on the original guidance indicators of carriage congestion and the number of passengers waiting for each carriage on the platform, with the added consideration of the expected number of passengers getting off each carriage. This new approach better addresses the issue of uneven distribution of subway passengers. Using AnyLogic simulation software, this paper has examined the passenger distribution issue under different flow conditions and verified the effectiveness of the new approach using three methods. Based on the results, the following conclusions can be made:
(1) Optimal guidance methods can significantly alleviate uneven passenger distribution and improve overall train capacity utilization under average daily passenger flow intensity.
(2) As passenger flow increases towards peak hour levels, however, transportation capacity on the platform becomes insufficient, leading to consistent guidance effects across methods. In such cases, additional guidance and flow restriction measures may be necessary, requiring collaboration with other public transportation methods to ensure efficient passenger transportation.
The research conducted in this article focused solely on the simulation of the platform layout format and performing a statistical analysis on the passenger flow range ranging from 120K/d to 600K/d. Nonetheless, the article solely concentrates on only three factors’ effects: namely, car congestion, queue length, and the expected drop-off count on ride waiting time. Future studies will investigate the influence of passenger allocation across various platform formats and various passenger flow rates. Additionally, those studies will apply innovative passenger flow guidance mechanisms for verifying the implementation in real subway passenger management.
References
- Bureau, G.M.G.S.D.M. Annual Information on Passenger Traffic of Guangzhou Metro. Available online: https://data.gz.gov.cn/ (accessed on.
- Hongjin, T.; Ling, Y. Design and Implementation of a Subway Platform Door Passenger Guidance System. Internet of Things Technology 2022, 12, 75–76. [Google Scholar] [CrossRef]
- Shiyi, W.; Yong, Q.; Yongjian, P.; Zhengjie, L.; Hui, H. Research on an Intelligent Monitoring System for Subway Carriage Congestion. Electronic Design Engineering 2022, 30, 55–59. [Google Scholar] [CrossRef]
- Mengyuan, P.; Yanjun, D.; Chaoji, L.; Xing, L.; Jian, X. Research on Subway Platform Passenger Flow Guidance System Based on Image Acquisition Technology. Urban Rapid Rail Transit 2017, 30, 37–41. [Google Scholar]
- Çapalar, J.; Nemec, A.; Zahradnik, C.; Olaverri-Monreal, C. Optimization of passenger distribution at metro stations through a guidance system. In Proceedings of the Computer Aided Systems Theory–EUROCAST 2017: 16th International Conference, Las Palmas de Gran Canaria, Spain, 2017, Revised Selected Papers, Part II 16, 2018, February 19-24; pp. 397–404.
- Ding, H.; Di, Y.; Zheng, X.; Liu, K.; Zhang, W.; Zheng, L. Passenger arrival distribution model and riding guidance on an urban rail transit platform. Physica A: Statistical Mechanics and its Applications 2021, 571. [Google Scholar] [CrossRef]
- Zheng, Z.; Wang, H.; Liu, W.; Peng, L. Toward real-time congestion measurement of passenger flow on platform screen doors based on surveillance videos analysis. Physica A: Statistical Mechanics and its Applications 2023, 612, 128474. [Google Scholar] [CrossRef]
- Shenzhen Metro pilots the launch of an intelligent display system for carriage congestion. Urban Rapid Rail Transit 2019, 32, 18.
- Sha Yongjie; Ji Yan; Chen Wanting. Singapore Public Transport Planning and Management. Urban Planning International 2021, 36, 142–147. [Google Scholar]
- Fang, C.; Zhou, J.; Dong, S.; Wang, Y.; Chen, S. A Method of Forecast Congestion of Subway Carriages Based on BP Neural Network. Journal of Transport Information and Safety 2018, 36, 47–53. [Google Scholar]
- Yuping, X.; Ruizhi, J. Transportation Efficiency,Transportation Structure and Economic Development. Enterprise Economy 2021, 40, 142–150. [Google Scholar] [CrossRef]
- Liu, G.; Kong, D.; Yao, L.; Sun, L.; Wang, K. Effectiveness and Arrangement of Station Guides Based on Wi-Fi Probing. Journal of Transport Information and Safety 2020, 38, 84–91. [Google Scholar]
- Website, G.M.O. Guangzhou Metro - Train Introduction. Available online: https://www.gzmtr.com/ (accessed on.
- Junhong, M.; Hongguo, S. Analysis of Passenger Flow Organization Before and After Renovation of Zhujiang New Town Station Based on Simulation. Comprehensive Transportation 2021, 43, 119–126. [Google Scholar]
|
Disclaimer/Publisher’s Note: The statements, opinions and data contained in all publications are solely those of the individual author(s) and contributor(s) and not of MDPI and/or the editor(s). MDPI and/or the editor(s) disclaim responsibility for any injury to people or property resulting from any ideas, methods, instructions or products referred to in the content. |
© 2023 by the authors. Licensee MDPI, Basel, Switzerland. This article is an open access article distributed under the terms and conditions of the Creative Commons Attribution (CC BY) license (http://creativecommons.org/licenses/by/4.0/).


