Submitted:
26 May 2023
Posted:
26 May 2023
You are already at the latest version
Abstract
Keywords:
1. Introduction
2. Material and Methods
2.1. Systematic review
2.2. Data collection
2.3. Statistical analysis
2.3.1. Metaregression
2.3.2. Metamodeling
3. Results and Discussion
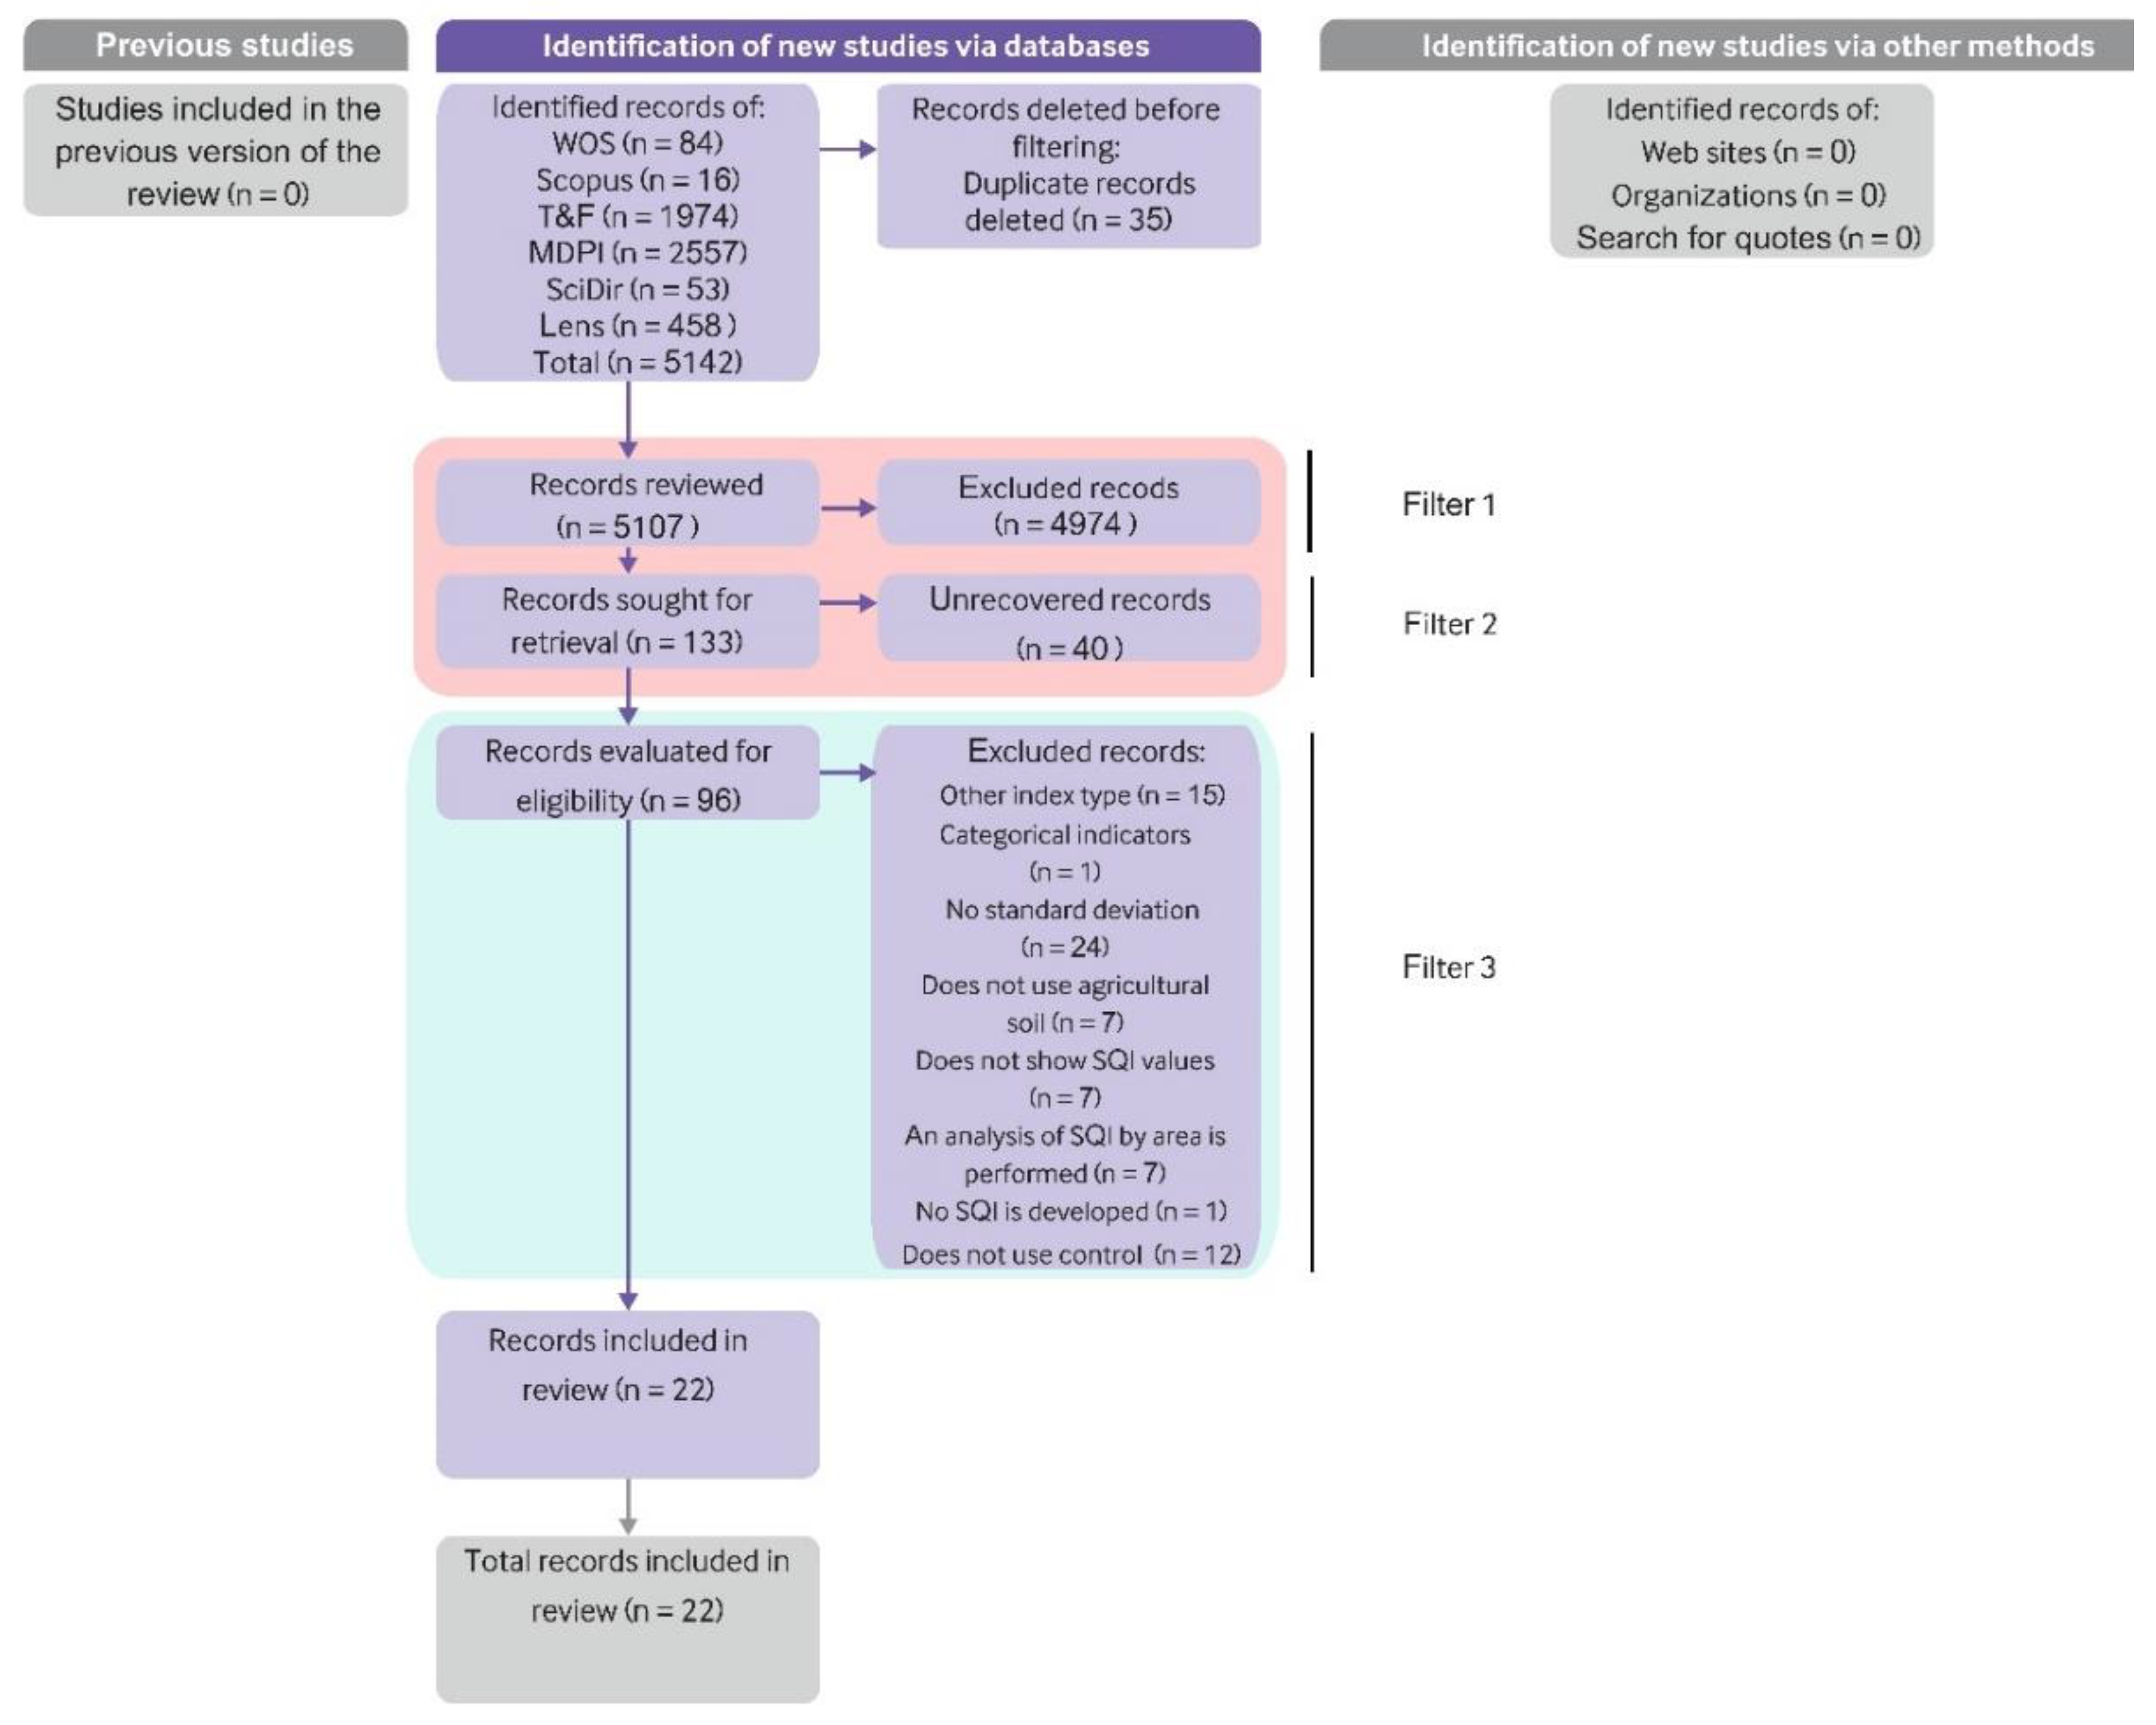
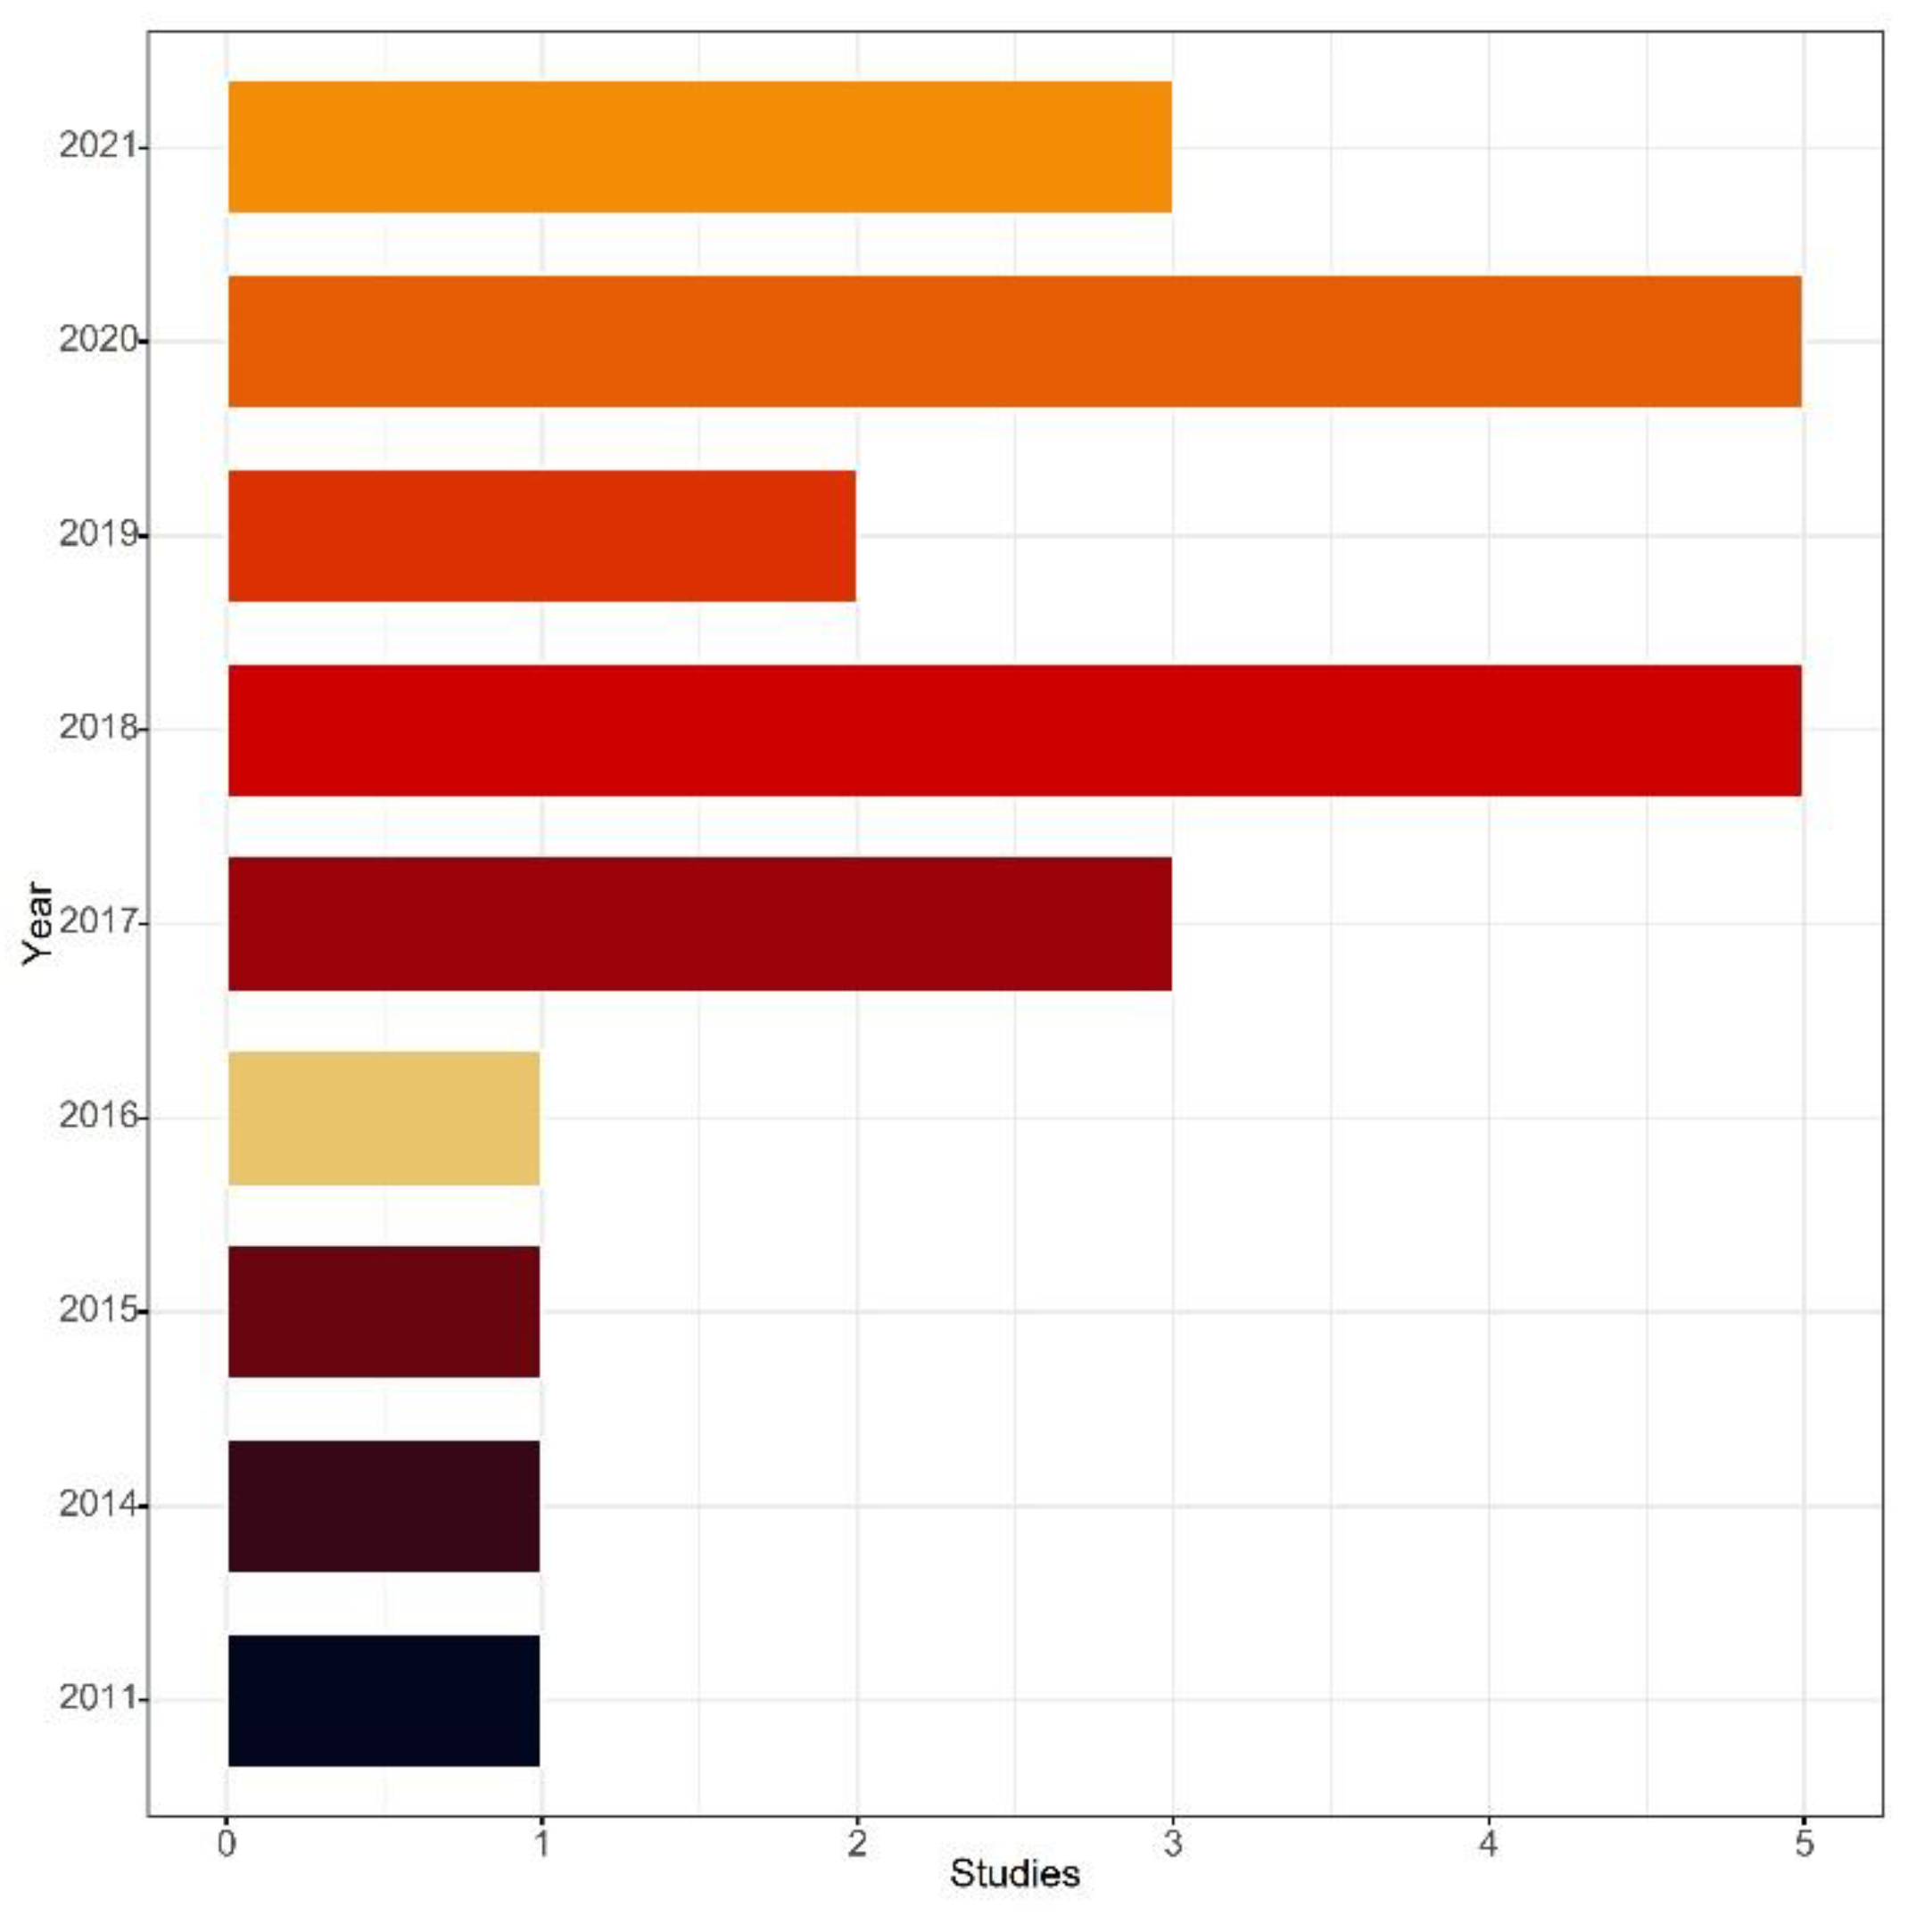
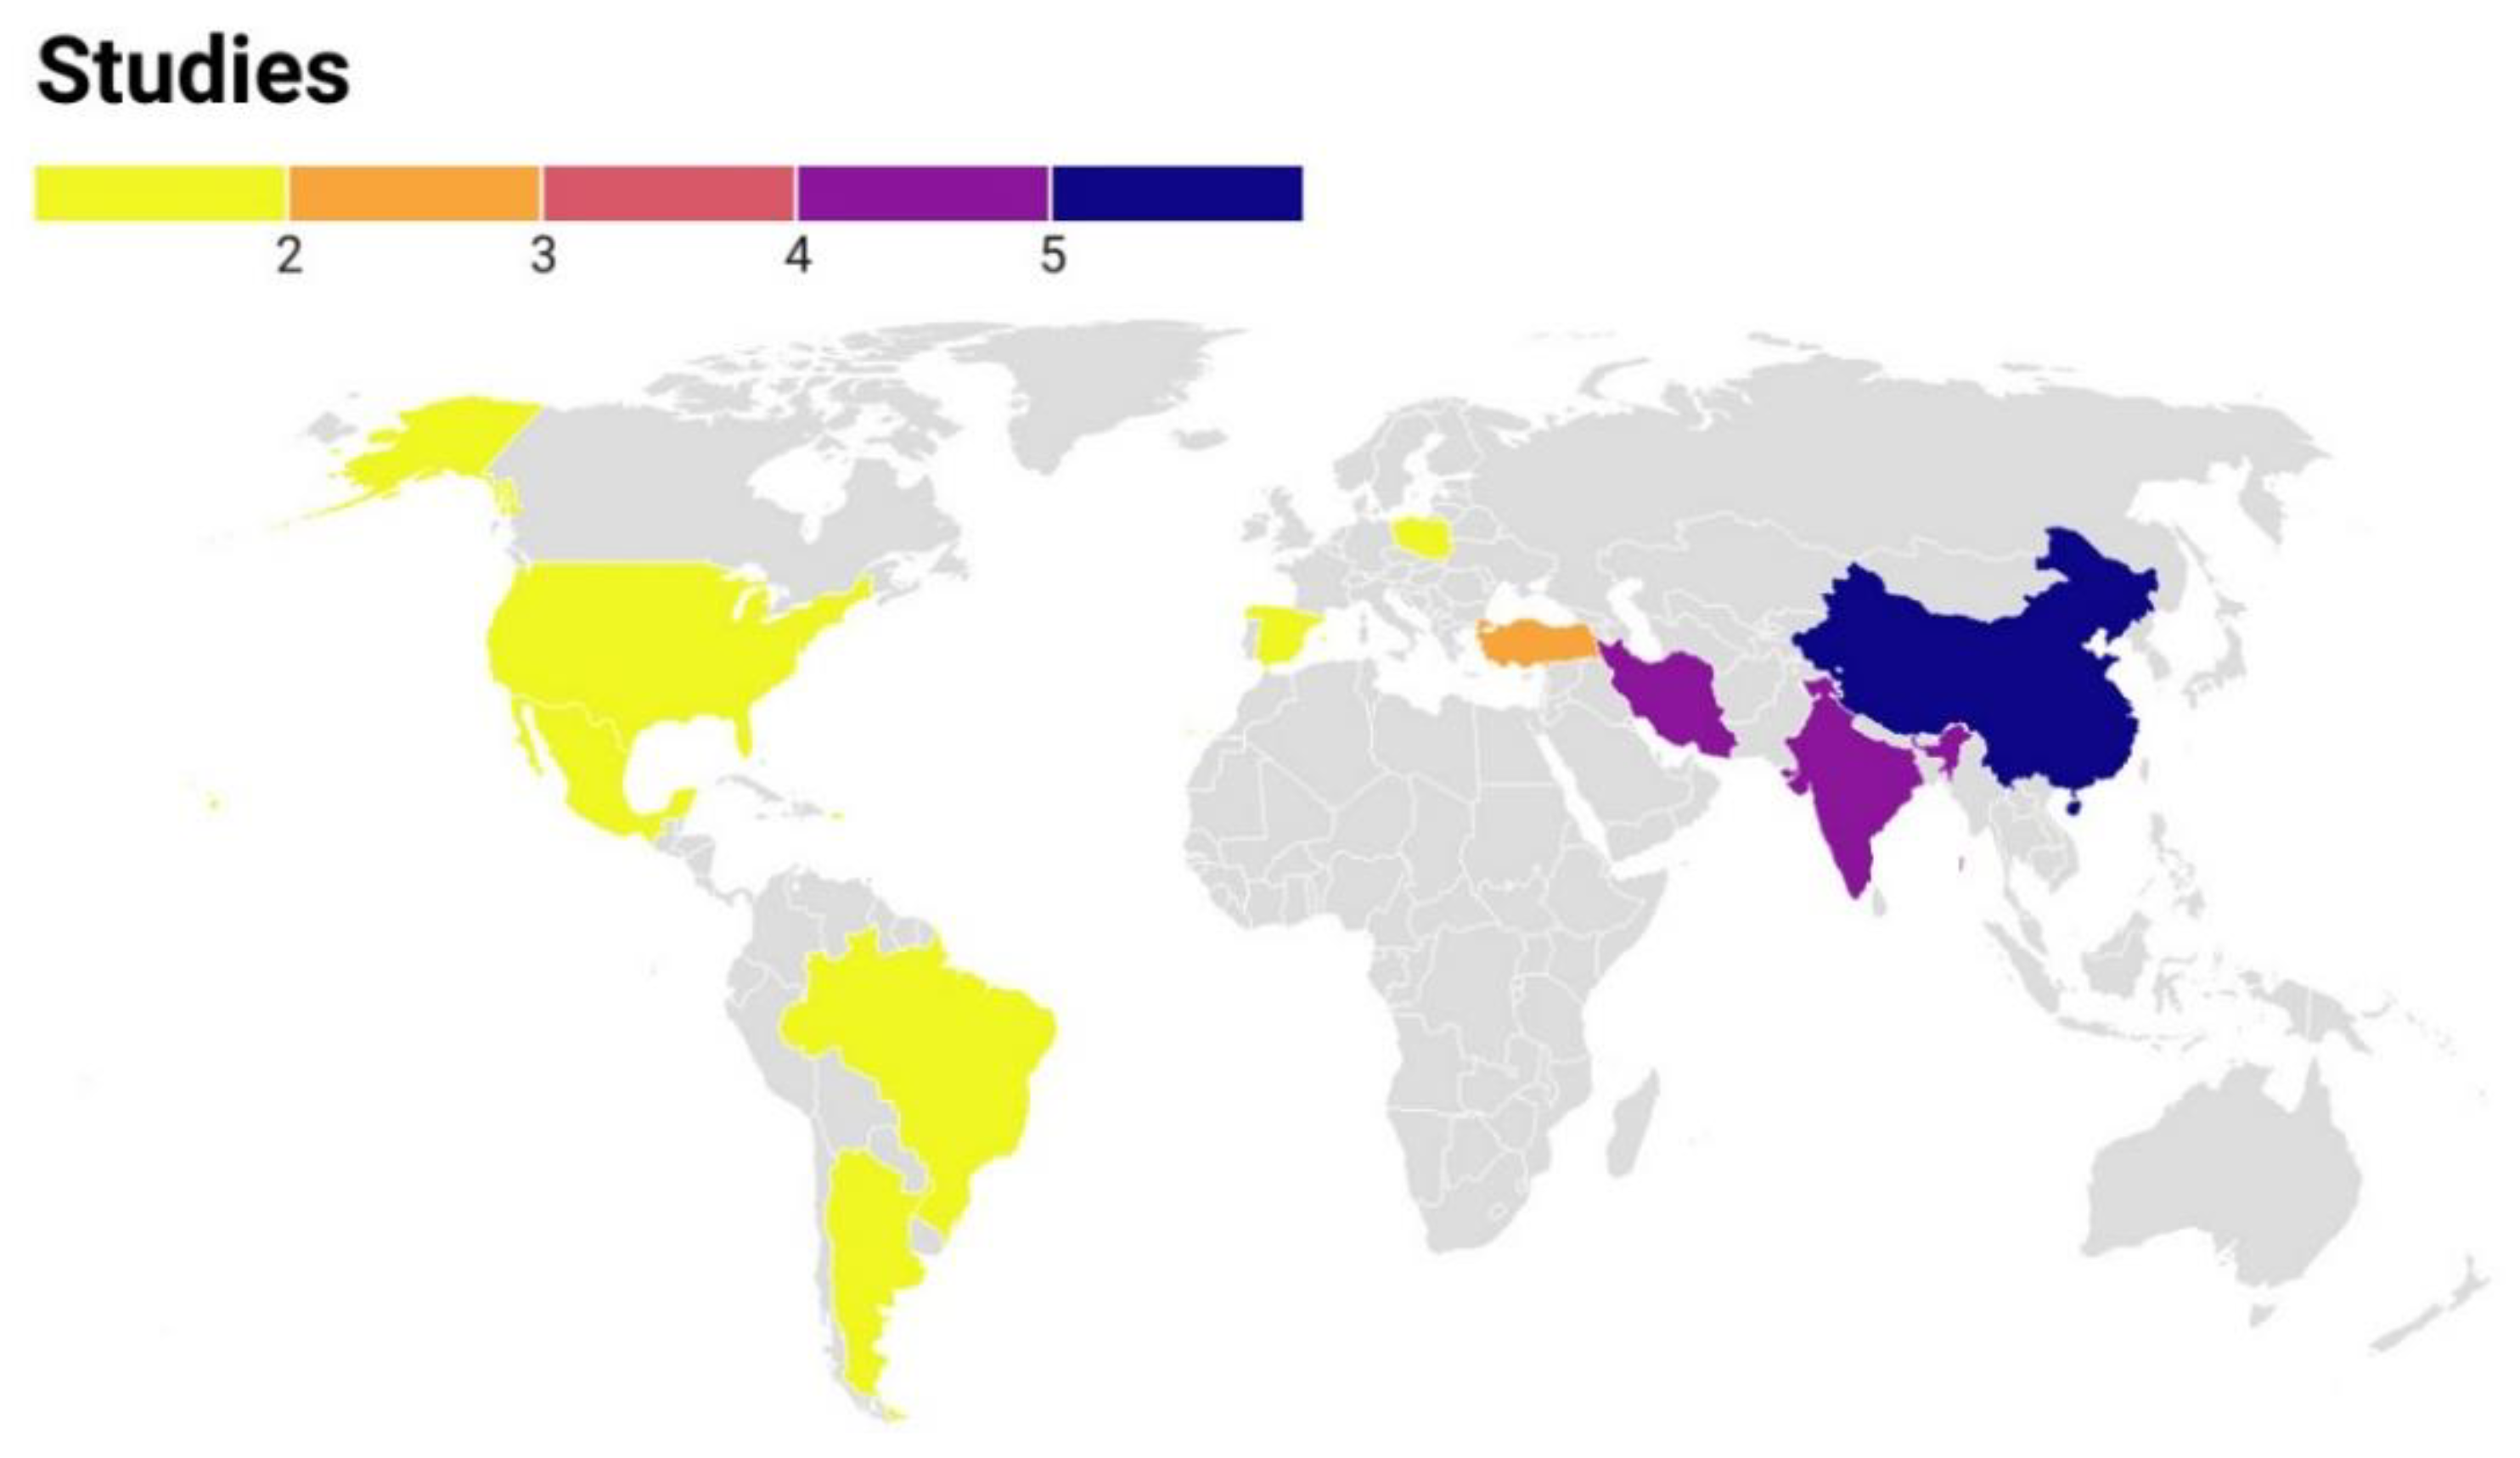
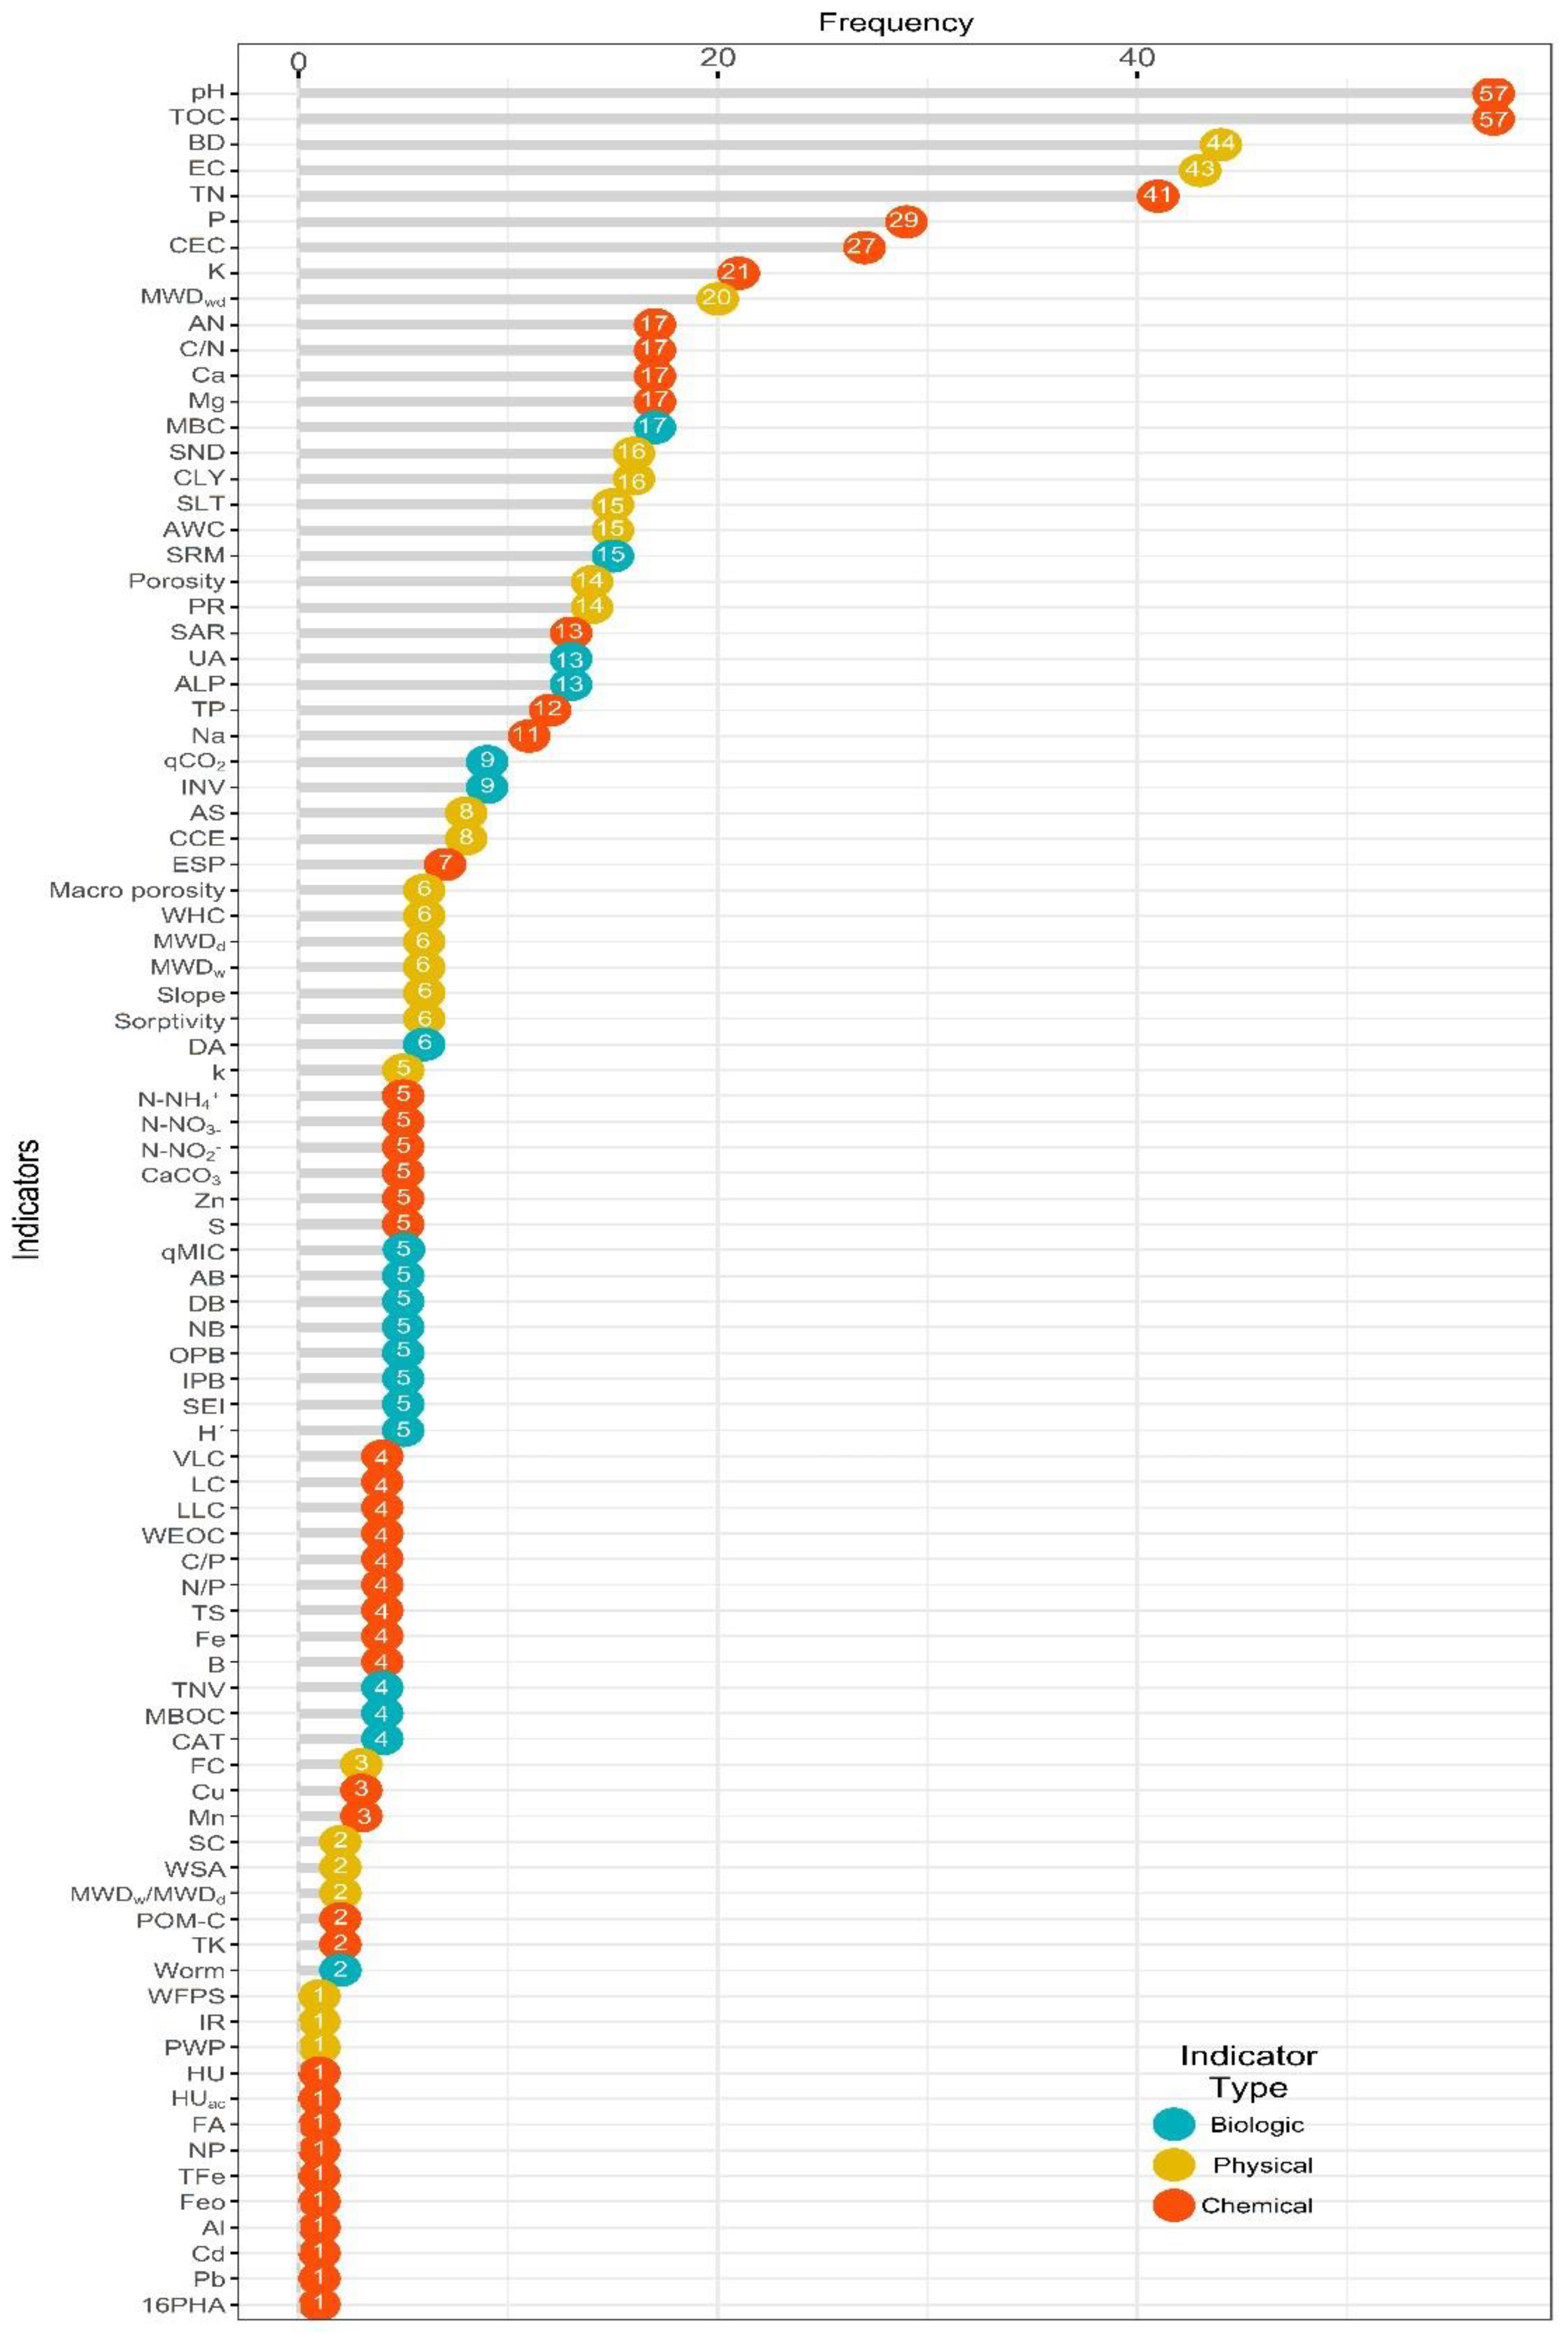
3.1. A systematic review and descriptive analysis
3.2. Meta-analysis
3.2.1. Effect on the quality of intensive agricultural land
3.2.2. Metaregression
3.2.3. Metamodeling
4. Conclusions
Author Contributions
Funding
Institutional Review Board Statement
Informed Consent Statement
Acknowledgments
Conflicts of Interest
References
- Huang, Z.; Sun, L.; Liu, Y.; Liu, Y.-F.; López-Vicente, M.; Wei, X.-H.; Wu, G.-L. Alfalfa Planting Significantly Improved Alpine Soil Water Infiltrability in the Qinghai-Tibetan Plateau. Agric. Ecosyst. Environ. 2019, 285, 106606. [Google Scholar] [CrossRef]
- Karlen, D.L.; Mausbach, M.J.; Doran, J.W.; Cline, R.G.; Harris, R.F.; Schuman, G.E. Soil Quality: A Concept, Definition, and Framework for Evaluation (A Guest Editorial). Soil Sci. Soc. Am. J. 1997, 61, 4–10. [Google Scholar] [CrossRef]
- Ouyang, Y.; Norton, J.M. Short-Term Nitrogen Fertilization Affects Microbial Community Composition and Nitrogen Mineralization Functions in an Agricultural Soil. Appl. Environ. Microbiol. 2019, 86. [Google Scholar] [CrossRef] [PubMed]
- Wang, Y.; Ji, H.; Wang, R.; Guo, S. Responses of Nitrification and Denitrification to Nitrogen and Phosphorus Fertilization: Does the Intrinsic Soil Fertility Matter? Plant Soil 2019, 440, 443–456. [Google Scholar] [CrossRef]
- Vergara Cid, C.; Ferreyroa, G.V.; Pignata, M.L.; Rodriguez, J.H. Biosolid Compost Amendment Increases Soil Fertility and Soybean Growth. J. Plant Nutr. 2021, 44, 1131–1140. [Google Scholar] [CrossRef]
- Estrada-Herrera, I.R.; Hidalgo-Moreno, C.; Guzmán-Plazola, R.; Almaraz Suárez, J.J.; Navarro-Garza, H.; Etchevers-Barra, J.D. Soil Quality Indicators to Evaluate Soil Fertility. Agrociencia 2017, 51, 813–831. [Google Scholar]
- Stone, D.; Ritz, K.; Griffiths, B.G.; Orgiazzi, A.; Creamer, R.E. Selection of Biological Indicators Appropriate for European Soil Monitoring. Appl. Soil Ecol. 2016, 97, 12–22. [Google Scholar] [CrossRef]
- Estrada H, Rayo. ; Hidalgo M, Claudia.; Guzmán P, Remigio.; Almaraz, José.; Navarro G, Hermilio.; Etchevers B, J.D. Indicadores de Calidad de Suelo Para Evaluar Su Fertilidad. Agrociencia 2017, 51, 813–831. [Google Scholar]
- Bedolla-Rivera, H.I.; Negrete-Rodríguez, M. de la L.X.; Gámez-Vázquez, F.P.; Álvarez-Bernal, D.; Conde-Barajas, E. Comparison of Methodolgies of Soil Quality Indices (SQI) for Sodic Soil. Rev. Int. Contam. Ambient. 2022, 38, 317–334. [Google Scholar] [CrossRef]
- Sarmiento, E.; Fandiño, S.; Gómez, L. Índices de Calidad Del Suelo. Una Revisión Sistemática. Rev. Ecosistemas 2018, 27, 130–139. [Google Scholar] [CrossRef]
- Ploughe, L.W.; Akin-Fajiye, M.; Gagnon, A.; Gardner, W.C.; Fraser, L.H. Revegetation of Degraded Ecosystems into Grasslands Using Biosolids as an Organic Amendment: A Meta-analysis. Appl. Veg. Sci. 2021, 24, 1–15. [Google Scholar] [CrossRef]
- Duan, Z.; Tan, X.; Paerl, H.W.; Van de Waal, D.B. Ecological Stoichiometry of Functional Traits in a Colonial Harmful Cyanobacterium. Limnol. Oceanogr. 2021, 66, 2051–2062. [Google Scholar] [CrossRef]
- R Core Team R: Language and Environment for Statistical Computing 2021.
- Luo, G.; Li, L.; Friman, V.-P.; Guo, J.; Guo, S.; Shen, Q.; Ling, N. Organic Amendments Increase Crop Yields by Improving Microbe-Mediated Soil Functioning of Agroecosystems: A Meta-Analysis. Soil Biol. Biochem. 2018, 124, 105–115. [Google Scholar] [CrossRef]
- Viachtbauer, W. Conducting Meta-analyses in R with the metafor package. Journal of Statistical Software. 2010, 36, 1–48. [Google Scholar]
- Kossmeier, M.; Tran, U.; Voracek, M. Metaviz: Forest Plots, Funnel Plots, and Visual Funnel Plot Interference for Meta-Analysis 2020. R package version 0.3.1. Available online: https://CRAN.R-project.org/package=metaviz (accessed on 16 May 2023).
- van Aert, R.C.M. Puniform: Meta-Analysis Methods Correcting for Publication Bias. 2021. Available online: https://CRAN.R-project.org/package=puniform (accessed on 16 May 2023).
- Fisher, Z.; Tipton, E.; Zhipeng, H. Robumeta: Robust Variance Meta-Regression. 2017. Available online: https://CRAN.R-project.org/package=robumeta (accessed on 16 May 2023).
- Xiao, W.; Chen, X.; Jing, X.; Zhu, B. A Meta-Analysis of Soil Extracellular Enzyme Activities in Response to Global Change. Soil Biol. Biochem. 2018, 123, 21–32. [Google Scholar] [CrossRef]
- Zheng, X.; Liu, Q.; Ji, X.; Cao, M.; Zhang, Y.; Jiang, J. How Do Natural Soil NH4+, NO3-, and N2O Interact in Response to Nitrogen Input in Different Climatic Zones? A Global Meta-Analysis. Eur. J. Soil Sci. 2021, 72, 2231–2245. [Google Scholar] [CrossRef]
- Tao, R.; Li, J.; Hu, B.; Shah, J.A.; Chu, G. A 2-year Study of the Impact of Reduced Nitrogen Application Combined with Double Inhibitors on Soil Nitrogen Transformation and Wheat Productivity under Drip Irrigation. J. Sci. Food Agric. 2021, 101, 1772–1781. [Google Scholar] [CrossRef]
- Bedolla-Rivera, H.I.; Xochilt Negrete-Rodríguez, M. de la L.; Medina-Herrera, M. del R.; Gámez-Vázquez, F.P.; Álvarez-Bernal, D.; Samaniego-Hernández, M.; Gámez-Vázquez, A.J.; Conde-Barajas, E. Development of a Soil Quality Index for Soils under Different Agricultural Management Conditions in the Central Lowlands of Mexico: Physicochemical, Biological and Ecophysiological Indicators. Sustainability 2020, 12, 9754. [CrossRef]
- Romaniuk, R.; Giuffré, L.; Costantini, A.; Bartoloni, N.; Nannipieri, P. A Comparison of Indexing Methods to Evaluate Quality of Soils: The Role of Soil Microbiological Properties. Soil Res. 2011, 49, 733. [Google Scholar] [CrossRef]
- Cherubin, M.R.; Tormena, C.A.; Karlen, D.L. Soil Quality Evaluation Using the Soil Management Assessment Framework (SMAF) in Brazilian Oxisols with Contrasting Texture. Rev. Bras. Ciênc. Solo 2017, 41. [Google Scholar] [CrossRef]
- Vasu, D.; Singh, S.K.; Ray, S.K.; Duraisami, V.P.; Tiwary, P.; Chandran, P.; Nimkar, A.M.; Anantwar, S.G. Soil Quality Index (SQI) as a Tool to Evaluate Crop Productivity in Semi-Arid Deccan Plateau, India. Geoderma 2016, 282, 70–79. [Google Scholar] [CrossRef]
- Zornoza, R.; Acosta, J.A.; Bastida, F.; Domínguez, S.G.; Toledo, D.M.; Faz, A. Identification of Sensitive Indicators to Assess the Interrelationship between Soil Quality, Management Practices and Human Health. Soil 2015, 1, 173–185. [Google Scholar] [CrossRef]
- Muñoz-Rojas, M.; Erickson, T.E.; Dixon, K.W.; Merritt, D.J. Soil Quality Indicators to Assess Functionality of Restored Soils in Degraded Semiarid Ecosystems. Restor. Ecol. 2016, 24, S43–S52. [Google Scholar] [CrossRef]
- Kacprzak, M.; Kupich, I.; Jasinska, A.; Fijalkowski, K. Bio-Based Waste’ Substrates for Degraded Soil Improvement—Advantages and Challenges in European Context. Energies 2022, 15, 385. [Google Scholar] [CrossRef]
- McBride, M.B. Long-Term Biosolids Application on Land: Beneficial Recycling of Nutrients or Eutrophication of Agroecosystems? Soil Syst. 2022, 6, 1–15. [Google Scholar] [CrossRef]
- Wendeborn, S. The Chemistry, Biology, and Modulation of Ammonium Nitrification in Soil. Angew. Chem. Int. Ed. 2020, 59, 2182–2202. [Google Scholar] [CrossRef] [PubMed]
- Secretaría de Medio Ambiente y Recursos Naturales [SEMARNAT]. NOM-021-RECNAT-2002; Diario Oficial de la Federación. 2002. Available online: https://www.dof.gob.mx/nota_detalle.php?codigo=717582&fecha=31/12/2002#gsc.tab=0 (accessed on 16 May 2023).
- Ferreyroa, G.V.; Vergara Cid, C.; Verdenelli, R.A.; Dominchin, M.F.; Meriles, J.M.; Pignata, M.L.; Rodriguez, J.H. Availability of Lead in Agricultural Soils Amended with Compost of Biosolid with Wood Shavings and Yard Trimmings. Environ. Sci. Pollut. Res. 2019, 26, 30324–30332. [Google Scholar] [CrossRef]
- Medina-Herrera, M. del R.; Negrete-Rodríguez, M. de la L.X.; Álvarez-Trejo, J.L.; Samaniego-Hernández, M.; González-Cruz, L.; Bernardino-Nicanor, A.; Conde-Barajas, E. Evaluation of Non-Conventional Biological and Molecular Parameters as Potential Indicators of Quality and Functionality of Urban Biosolids Used as Organic Amendments of Agricultural Soils. Appl. Sci. 2020, 10, 517. [CrossRef]
- Brevik, E.C.; Pereg, L.; Steffan, J.J.; Burgess, L.C. Soil Ecosystem Services and Human Health. Curr. Opin. Environ. Sci. Health 2018, 5, 87–92. [Google Scholar] [CrossRef]
- Rangel-Peraza, J.G.; Padilla-Gasca, E.; López-Corrales, R.; Medina, J.R.; Bustos-Terrones, Y.; Amabilis-Sosa, L.E.; Rodríguez-Mata, A.E.; Osuna-Enciso, T. Robust Soil Quality Index for Tropical Soils Influenced by Agricultural Activities. J. Agric. Chem. Environ. 2017, 06, 199–221. [Google Scholar] [CrossRef]
- Bai, Z.; Caspari, T.; Gonzalez, M.R.; Batjes, N.H.; Mäder, P.; Bünemann, E.K.; de Goede, R.; Brussaard, L.; Xu, M.; Ferreira, C.S.S.; et al. Effects of Agricultural Management Practices on Soil Quality: A Review of Long-Term Experiments for Europe and China. Agric. Ecosyst. Environ. 2018, 265, 1–7. [Google Scholar] [CrossRef]
- Valani, G.P.; Vezzani, F.M.; Cavalieri-Polizeli, K.M.V. Soil Quality: Evaluation of On-Farm Assessments in Relation to Analytical Index. Soil Tillage Res. 2020, 198, 104565. [Google Scholar] [CrossRef]
- Moradi, S.; Rasouli-Sadaghiani, M.H.; Sepehr, E.; Khodaverdiloo, H.; Barin, M. Soil Nutrients Status Affected by Simple and Enriched Biochar Application under Salinity Conditions. Environ. Monit. Assess. 2019, 191, 191–257. [Google Scholar] [CrossRef] [PubMed]
- Zungu, N.S.; Egbewale, S.O.; Olaniran, A.O.; Pérez-fernández, M.; Magadlela, A. Soil Nutrition, Microbial Composition and Associated Soil Enzyme Activities in KwaZulu-Natal Grasslands and Savannah Ecosystems Soils. Appl. Soil Ecol. 2020, 155, 103663. [Google Scholar] [CrossRef]
- Legay, N.; Clément, J.C.; Grassein, F.; Lavorel, S.; Lemauviel-Lavenant, S.; Personeni, E.; Poly, F.; Pommier, T.; Robson, T.M.; Mouhamadou, B.; et al. Plant Growth Drives Soil Nitrogen Cycling and N-Related Microbial Activity Through Changing Root Traits. Fungal Ecol. 2020, 44, 100910. [Google Scholar] [CrossRef]
- Leogrande, R.; Vitti, C. Use of Organic Amendments to Reclaim Saline and Sodic Soils: A Review. Arid Land Res. Manag. 2019, 33, 1–21. [Google Scholar] [CrossRef]
- González, N.T.; Méndez, J.P.; García, F.P.; Sandoval, O.A.A.; Santillán, Y.M. Remediation Technologies for Saline Soils: A Case Study of Mexico. World Res. J. Agric. Sci. 2016, 3, 60–68. [Google Scholar]
- Nadeem, F.; Hanif, M.A.; Majeed, M.I.; Mushtaq, Z. Role of Macronutrients and Micronutrients in the Growth and Development of Plants and Prevention of Deleterious Plant Diseases – A Comprehensive Review. 2018, 22.
- Muñoz, B.; Pastor, J.; Rivas, W.; Gonzalez, O.; González, L. Evaluación de La Calidad Del Suelo Bajo Diferentes Sistemas Agrícolas En La Península de Paraguaná Mediante El Uso de Indicadores de Sustentabilidad. koinonia 2017, 2, 123–139. [Google Scholar]
- Zheng, Q.; Hu, Y.; Zhang, S.; Noll, L.; Böckle, T.; Richter, A.; Wanek, W. Growth Explains Microbial Carbon Sse Efficiency Across Soils Differing in Land Use and Geology. Soil Biol. Biochem. 2019, 128, 45–55. [Google Scholar] [CrossRef]
- Castelán Vega, R.D.C. Susceptibilidad Ambiental a La Desertificación En La Microcuenca Del Río Azumiatla, Puebla, México. Ecosistemas Recur. Agropecu. 2019, 6, 91–101. [Google Scholar] [CrossRef]
| Name | Abbreviation | Link | Date of search |
| Web Of Science | WOS | https://www-webofscience-com.access.biblioteca.cinvestav.mx/wos/woscc/basic-search | 19 July 2021 |
| Scopus | Scopus | https://www-scopus-com.access.biblioteca.cinvestav.mx/search/form.uri?display=basic#basic | 19 July 2021 |
| Taylor & Francis | T&F | https://www.tandfonline.com/search/advanced | 19 July 2021 |
| Multidisciplinary Digital Publishing Institute | MDPI | https://www.mdpi.com/about/journals | 19 July 2021 |
| Since Direct | SciDir | https://www-sciencedirect-com.access.biblioteca.cinvestav.mx/ | 19 July 2021 |
| Lens | Lens | https://www.lens.org/ | 28 July 2021 |
| Model | R2 | p |
|---|---|---|
| 81.24 | ||
| 98.81 | ||
| 75.96 | ||
| 73.47 |
Disclaimer/Publisher’s Note: The statements, opinions and data contained in all publications are solely those of the individual author(s) and contributor(s) and not of MDPI and/or the editor(s). MDPI and/or the editor(s) disclaim responsibility for any injury to people or property resulting from any ideas, methods, instructions or products referred to in the content. |
© 2023 by the authors. Licensee MDPI, Basel, Switzerland. This article is an open access article distributed under the terms and conditions of the Creative Commons Attribution (CC BY) license (http://creativecommons.org/licenses/by/4.0/).


