1. Introduction
In recent years, the advent of Autonomous Vehicles (AVs) has gradually changed the concept of travel and the way people travel. Although full automation is not yet a reality, studies have already shown the impact of AVs on profoundly changing urban parking needs and urban travel options. Fagnant et al (2014) and Zhang (2018) have shown that shared AVs will significantly reduce car ownership. At the same time, the self-parking function of Shared Automated Vehicles (SAVs) will not only reduce parking demand, but also reduce the road space occupied by vehicles. The released roadside space can be used for non-motorized modes of transport, delivery areas, parks or other recreational and commercial uses. In response to the variable nature of on-street parking strips, they can be divided into two categories: firstly, conversion to public facilities or green infrastructure, such as pedestrian streets, charging posts, inflatable points, green belts and parks; and secondly, continuation of the traffic function and conversion to other lanes, such as motorways, bus lanes and non-motorized lanes. After assessing the long-term impacts of AVs, Gruel (2016) recommends increasing the attractiveness of public transport in order to achieve the goals of reducing road congestion, increasing road capacity and reducing environmental pollution. Therefore, converting on-street parking lots into bus-only lanes in the era of AVs can guarantee road priority for bus vehicles and reduce vehicle pull-in and pull-out behaviour. This will further reduce conflicts between buses and social vehicles, increase the speed of buses, improve the operational efficiency of buses, enhance the attractiveness of public transport, induce travelers to shift from other modes of travel to public transport, and solve the traffic congestion problem in cities.
In the era of AVs, there is still a gap in the research on the impact efficiency of transforming on-street parking lots into bus-only lanes. Most domestic and foreign researches on the variable types of roadside parking belts focus on qualitative analysis, without the support of data and models, and lack of subsequent quantitative effect evaluation after on-street parking lots are converted into bus-only lanes. However, in the era of AVs, the conversion of on-street parking lots into bus-only lanes will bring changes in the traffic benefits of the entire road network. Therefore, it is necessary to further study the benefits of the conversion of on-street parking lots into bus-only lanes, so as to provide a basis for the conversion of on-street parking lots.
In order to quantitatively analyze the impact on traffic efficiency and emission when on-street parking lots is converted into bus-only lanes, the flow floating car method and video acquisition method are designed to collect data, and the micro-simulation model of the impact of traffic efficiency and emission after the conversion is built based on VISSIM. According to the conversion ratio of different on-street parking lots, the scene design was carried out, and the simulation model of the impact of on-street parking lots conversion was established. The influence effect of on-street parking lots conversion on traffic flow was analyzed from two perspectives of traffic operation efficiency and traffic pollution. Finally, the choice of parking position and the change of parking gate position are discussed in order to optimize and minimize the negative impact of cruising on parking.
Contributions of this study: (1) Quantifying how the conversion of on-street parking lots to bus-only lanes affects traffic efficiency. (2) Measurement of on-street parking lots conversion mitigation emissions. (3) It shows how optimization methods based on bus lane network connectivity affect traffic efficiency and emissions.
2. Literature Review
In recent years, many scholars at home and abroad have used different methods to study the impact of AVs on urban parking demand. Childress (2015) demonstrated that parking locations can be moved from city centers and traveler areas to more remote areas through SAVs and Private Autonomous Vehicles(PAVs) models. Zakharenko (2016) conducted a modeling analysis of the impact of AVs on urban morphology, and the results showed that daytime parking demand will decrease, shifting to remote areas outside the city center and business districts. Fagnant and Kockelman (2015) quantified congestion and other impacts by simulating how travelers and their shared vehicles move around the city throughout the day. The results show that the use of autonomous fleets can save 11 parking spaces per SAVs. Bischoff (2016) analysis replaces private cars within a city with AVs of different sizes. The simulation results show that one AVs can replace the demand for 10 conventional vehicles, which is consistent with the results of Zhang (2017) and Martinez(2017). Zhang and Guhathakurta (2017) showed that if SAVs provided 5% of the mobility service in Atlanta, parking land use could be reduced by about 4.5%, freeing up more than 20 parking spaces per SAVs. Zhang and Guhathakurta (2015) established simulation models to evaluate the potential impact of SAVs systems on urban parking demand under different system operation scenarios. Simulation results show that commuters' need for urban parking can be reduced by up to 90% assuming a fleet penetration rate of 2% SAVs. Jean-Pierre Orfeuil (2018) argued that SAVs can not only reduce the number of motor vehicles by 10 times, but also basically eliminate the need for parking, but also effectively reduce frequent peak congestion, thus effectively solving the city's traffic problems. Yao et al. (2019) proved that only 128,000 SAVs can meet the travel needs of 3 million people. Estepa et al. (2017) proposed the double-decker parking method for AVs, and the results show that double-decker parking can increase the parking capacity of designated areas by more than 50%, which can save a lot of parking space. Nourinejad (2018) studied the layout of AVs parking lots, and the results showed that the demand for parking lots in the AVs era was reduced by up to 87%. Hayes (2011) pointed out that AVs can be parked more closely with each other, saving urban space. Ferreira et al. (2011) designed a side-by-side layout of parking spaces, and studies shown that the space required for parking can be reduced to half that of a conventional parking lot.
For safety reasons, modern road systems contain a lot of driving tolerance, leaving most of the area empty and underutilized, and AVs can solve this problem. Riggs et al. (2016,2017) combine digital tools with community-based participatory planning approaches. The results suggest that travel demand will decrease due to the popularity of AVs, and policies that reduce lanes to support multimodal transport are feasible in the near future.
Research on the conversion of on-street parking lot to public facilities or green infrastructure includes: Zhang (2018) analyzes the impact of autonomous driving technology on traffic and urban space. The results show that the use of SAVs frees up road space, and the freed road resources can be reused to build public facilities. Li et al. (2020) analyzed the expected changes of urban space in the mode of AVs, and proposed that the roadside parking space gradually changed from a single parking space to a roadside public space. Martine et al. (2015) have shown that on-street parking lots can be completely removed. These freed up spaces can be used for non-motorized transportation, pick-up and drop-off points, parks, or other recreational and commercial uses. To some extent, cities have begun to introduce the concept of "park walkways", encouraging the conversion of street parking lots into new uses such as gardens and cafes.(2014,2017) Riggs et al. (2019,2020) construct a street framework that prioritizes urban streets according to the speed of users and the need for curb access, emphasizing walkability.
Research on the continuing traffic function of on-street parking strips in the AVs era includes: Schlossberg et al. (2020) discussed the impact of the AVs era on street use, proposed a human-centered concept to design future roads, and demonstrated how freed up roadside lanes can expand adult sidewalks and non-motorized lanes. Stead D et al. (2019) discuss the potential impact of AVs on urban form, showing that reducing the number of on-street parking provides more opportunities to reallocate urban space for use by public transit or pedestrian crossings.
Previous on-street parking lots studies have focused on qualitative analysis of what on-street parking lots are used for, and there has been no quantitative analysis of the conversion of on-street parking lots into bus-only lanes. This paper collects experimental data to simulate the impact of the conversion of on-street parking lots to bus-only lanes on traffic congestion and emissions.
3. Data Collection
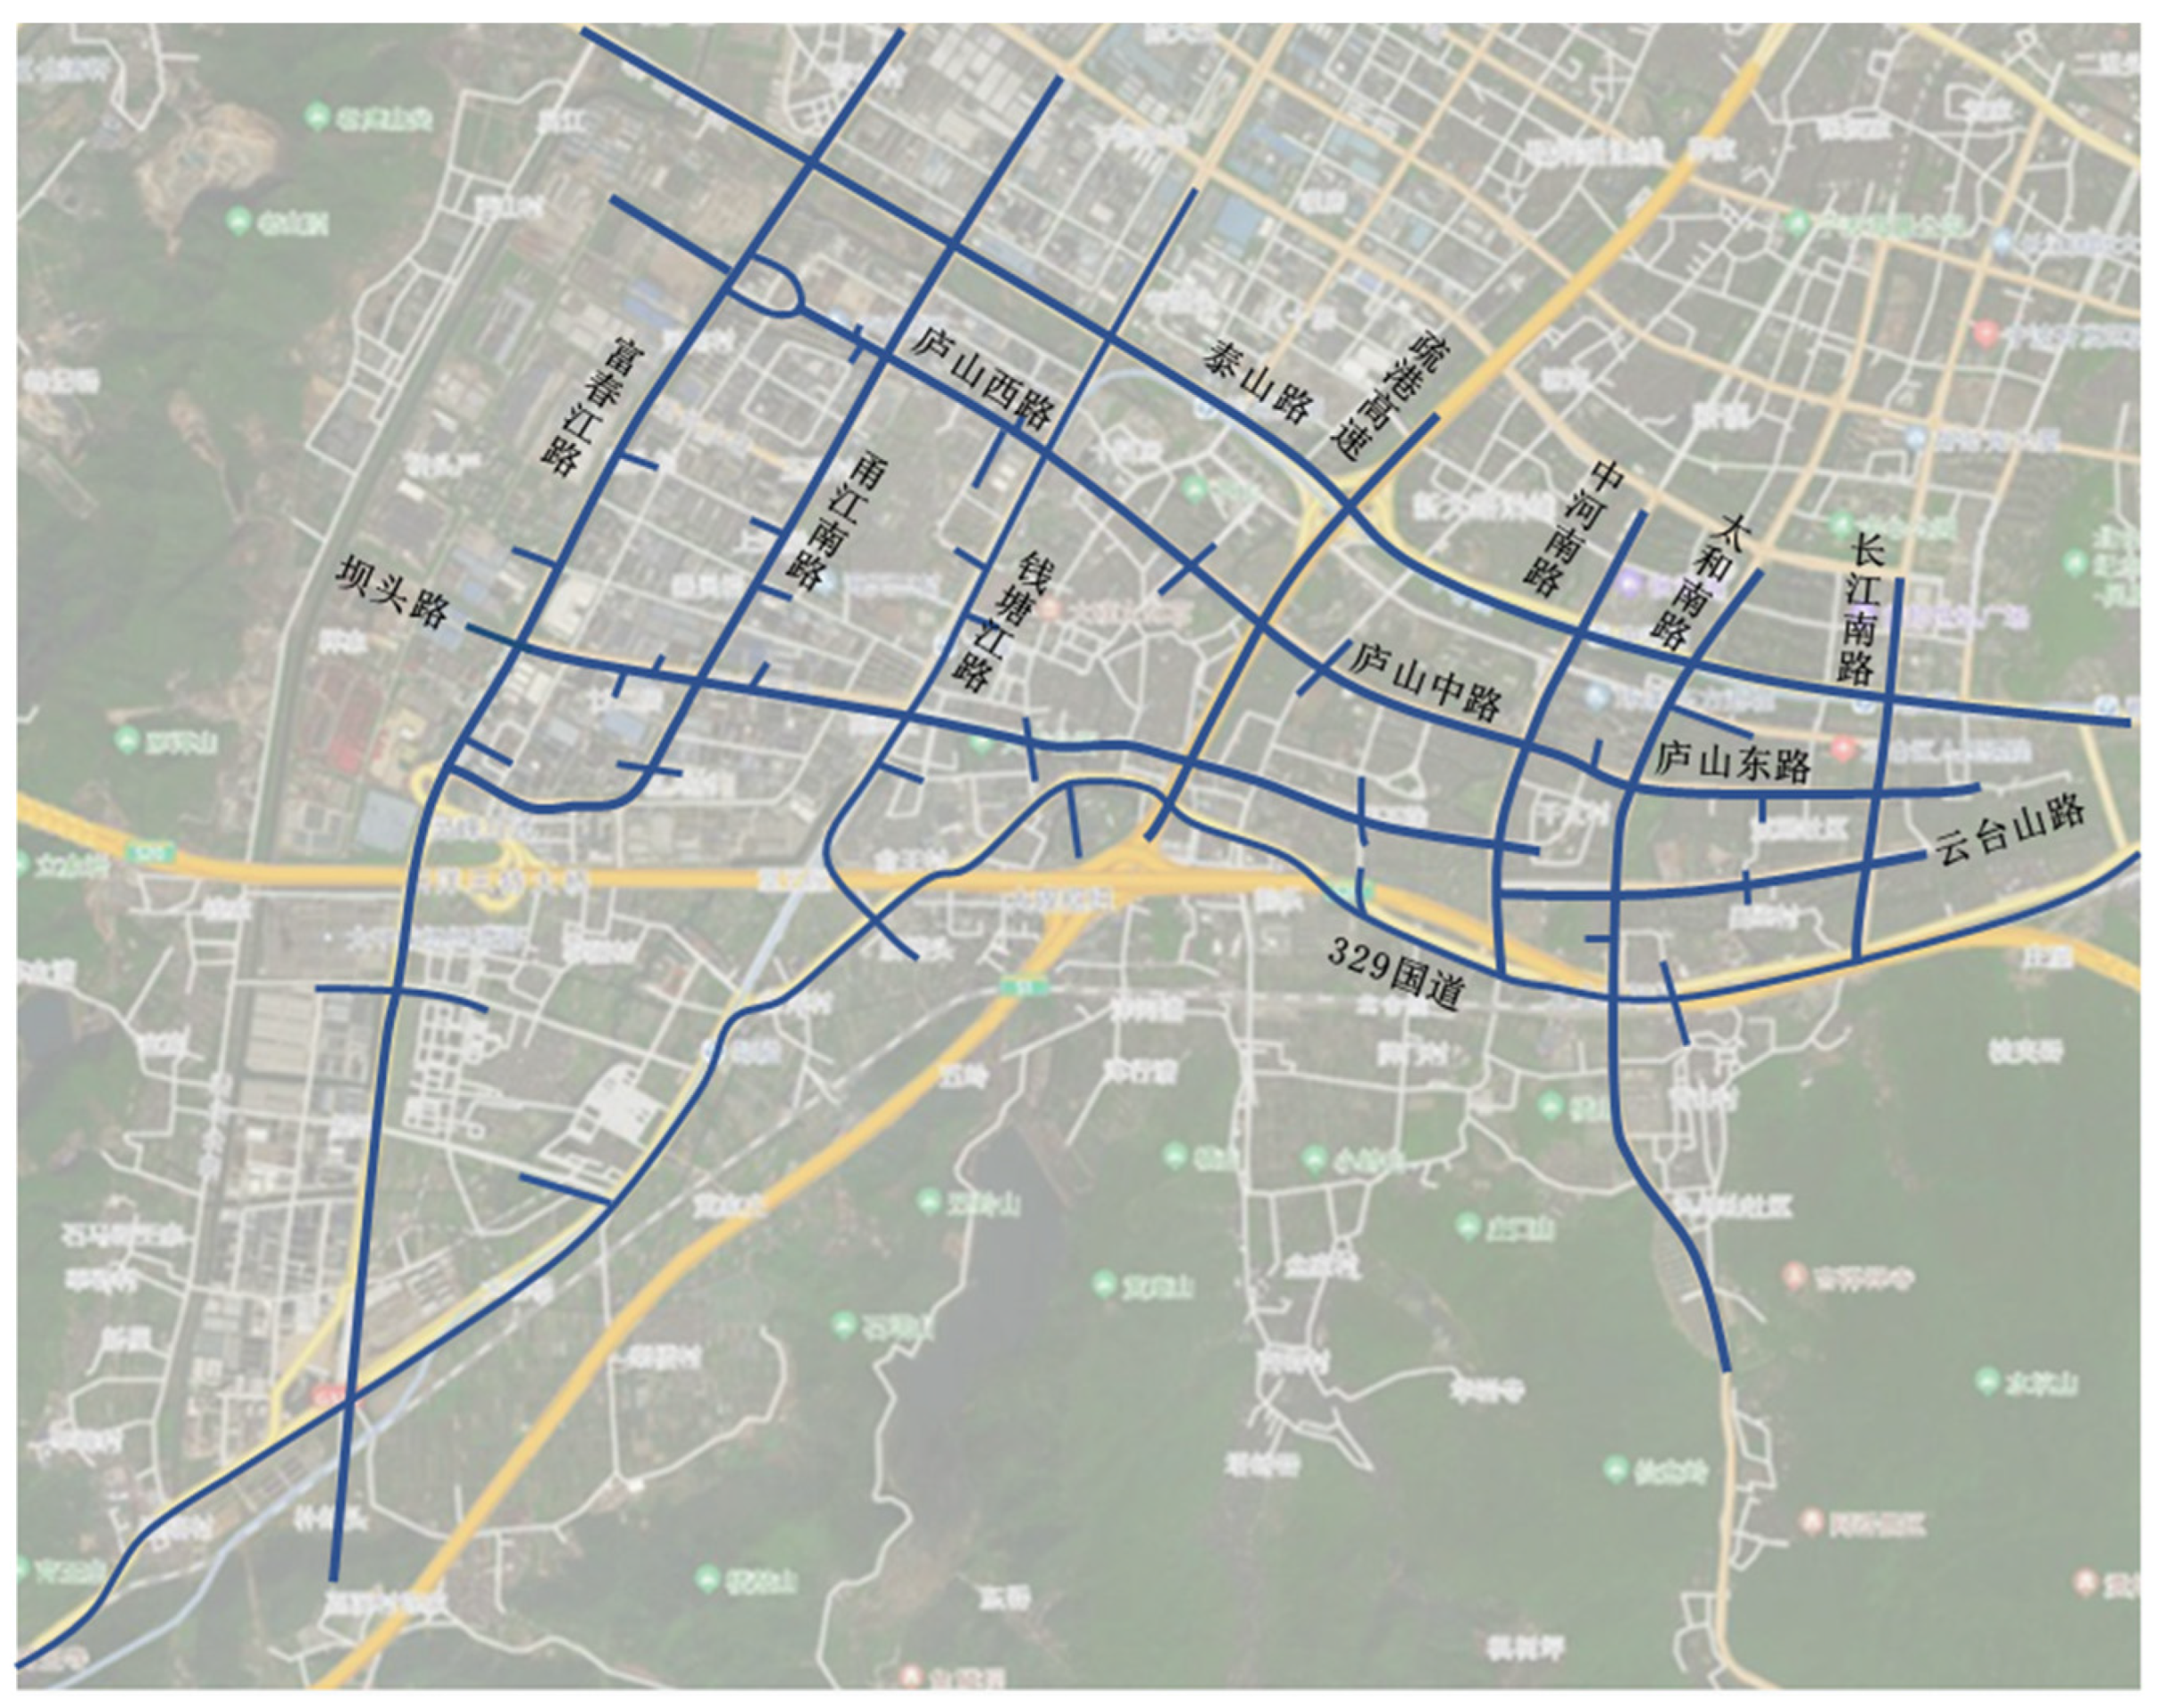
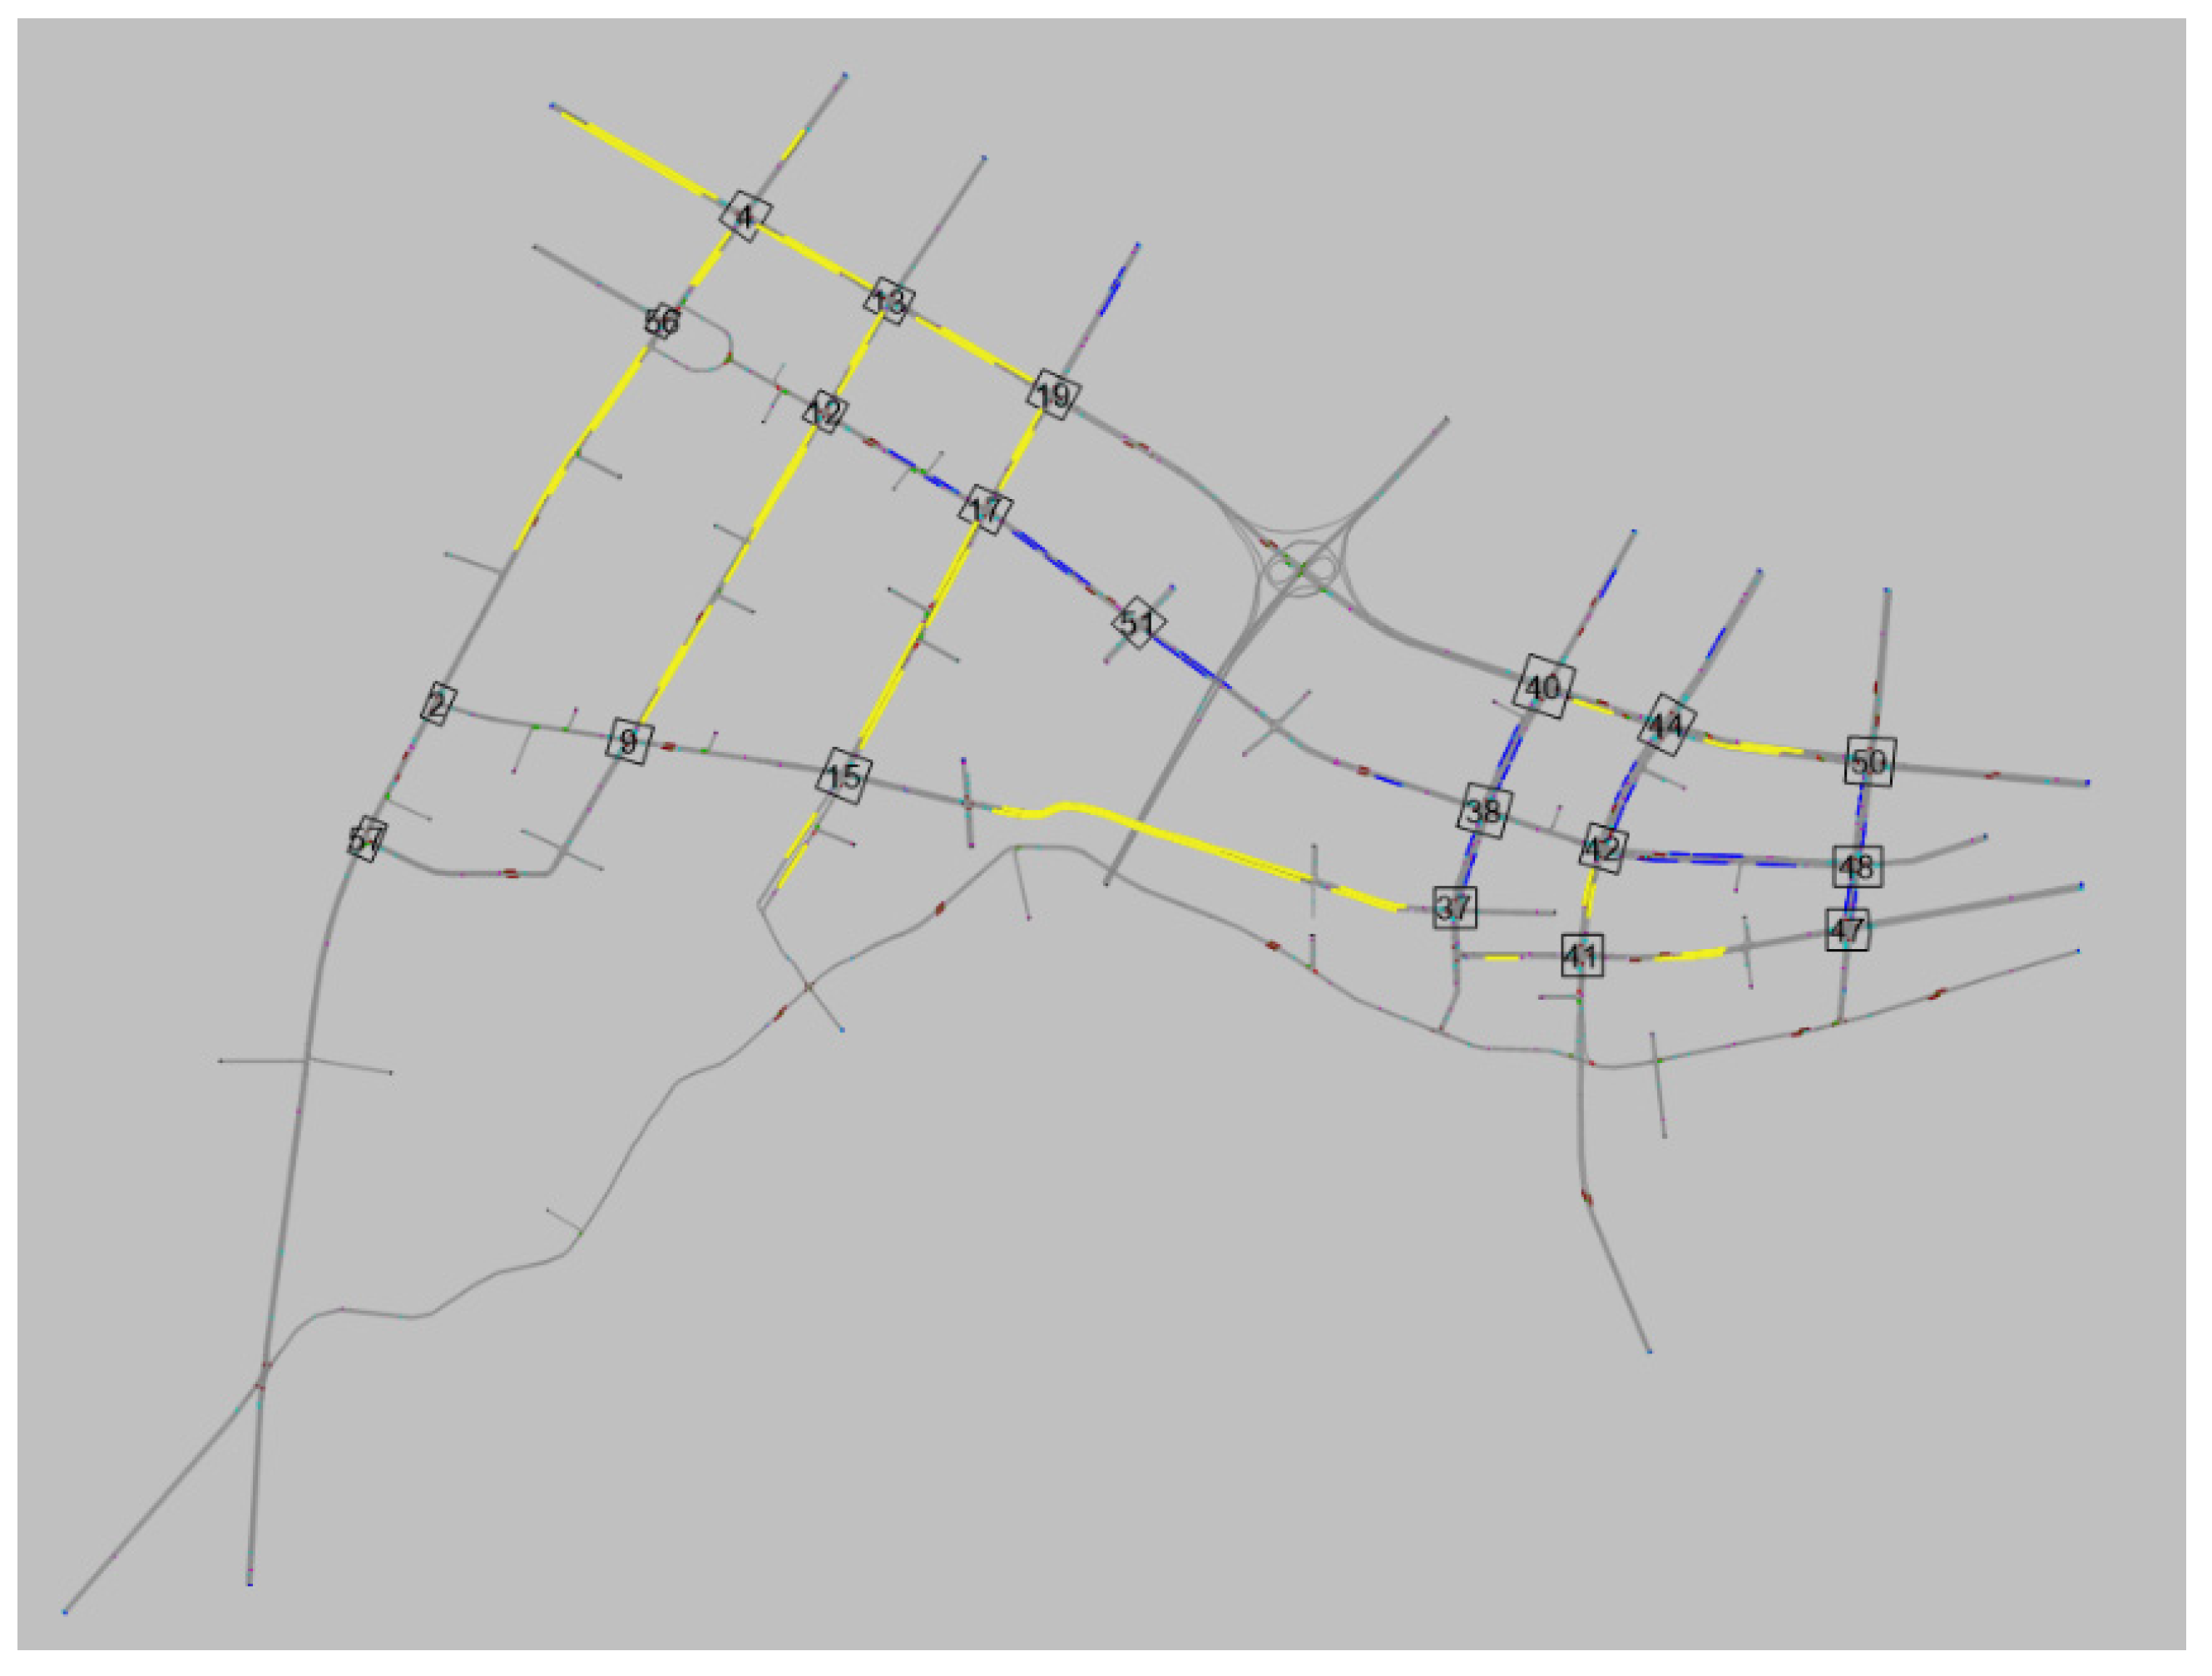
Due to the large amount of bus traffic in the road network of Daqi Street, Beilun District, Ningbo City, and the complex situation of on-street parking, from the characteristics of the road network, Daqi Street is a relatively independent system, without too much access and out, more marginal, more closed, and the impact is easier to quantify, so Daqi Street is selected as the research area. The main roads of the city within the area carry the main traffic volume within the Daqi street. The specific location is shown in
Figure 1. During peak and off-peak hours (16:00-19:00), the floating vehicle survey method was used, the test vehicle was equipped with cameras and detectors to record the moving video and spacing, and the GPS locator was used to record the movement trajectory of the test vehicle and the speed, latitude and longitude and other data, and 541 experiments were recorded in 15 days. Through field surveys, data such as the number, location, and length of parking on the roadside, as well as data on bus-only lines and bus lanes were collected.
4. Micro-modeled on-street parking lots converted into bus-only lanes
4.1. Parameter calibration of traffic flow models
As a classical car following model, Wiedemann74 was chosen for simulating the cruising traffic flow. It could be formulated as:
where
denotes the expected stopping distance;
represents the expected car-following distance and the coefficient;
is the expected car-following distance multiplication coefficient;
defines as the random factor between [0,1], the average value is 0.5, the normal distribution of the standard 0.15.
represents the speed of the car.
Based on the default parameters of the Widemann74 following model in the VISSIM software, combined with GPS data and video data, and drawing on relevant literature, the range of corresponding parameters in the Widemann74 following model was optimized.
The parameterization of AVs is based on assumptions based on current research theory. The main differences between the parameters of AVs and Human-driving Vehicles (HVs, refers to cars and buses) are the model parameters of the Wiedemann follower model (average parking distance, safety distance additional part and multiple of safety distance), minimum front distance and reaction time (2018). The specific parameter settings are shown in
Table 1.
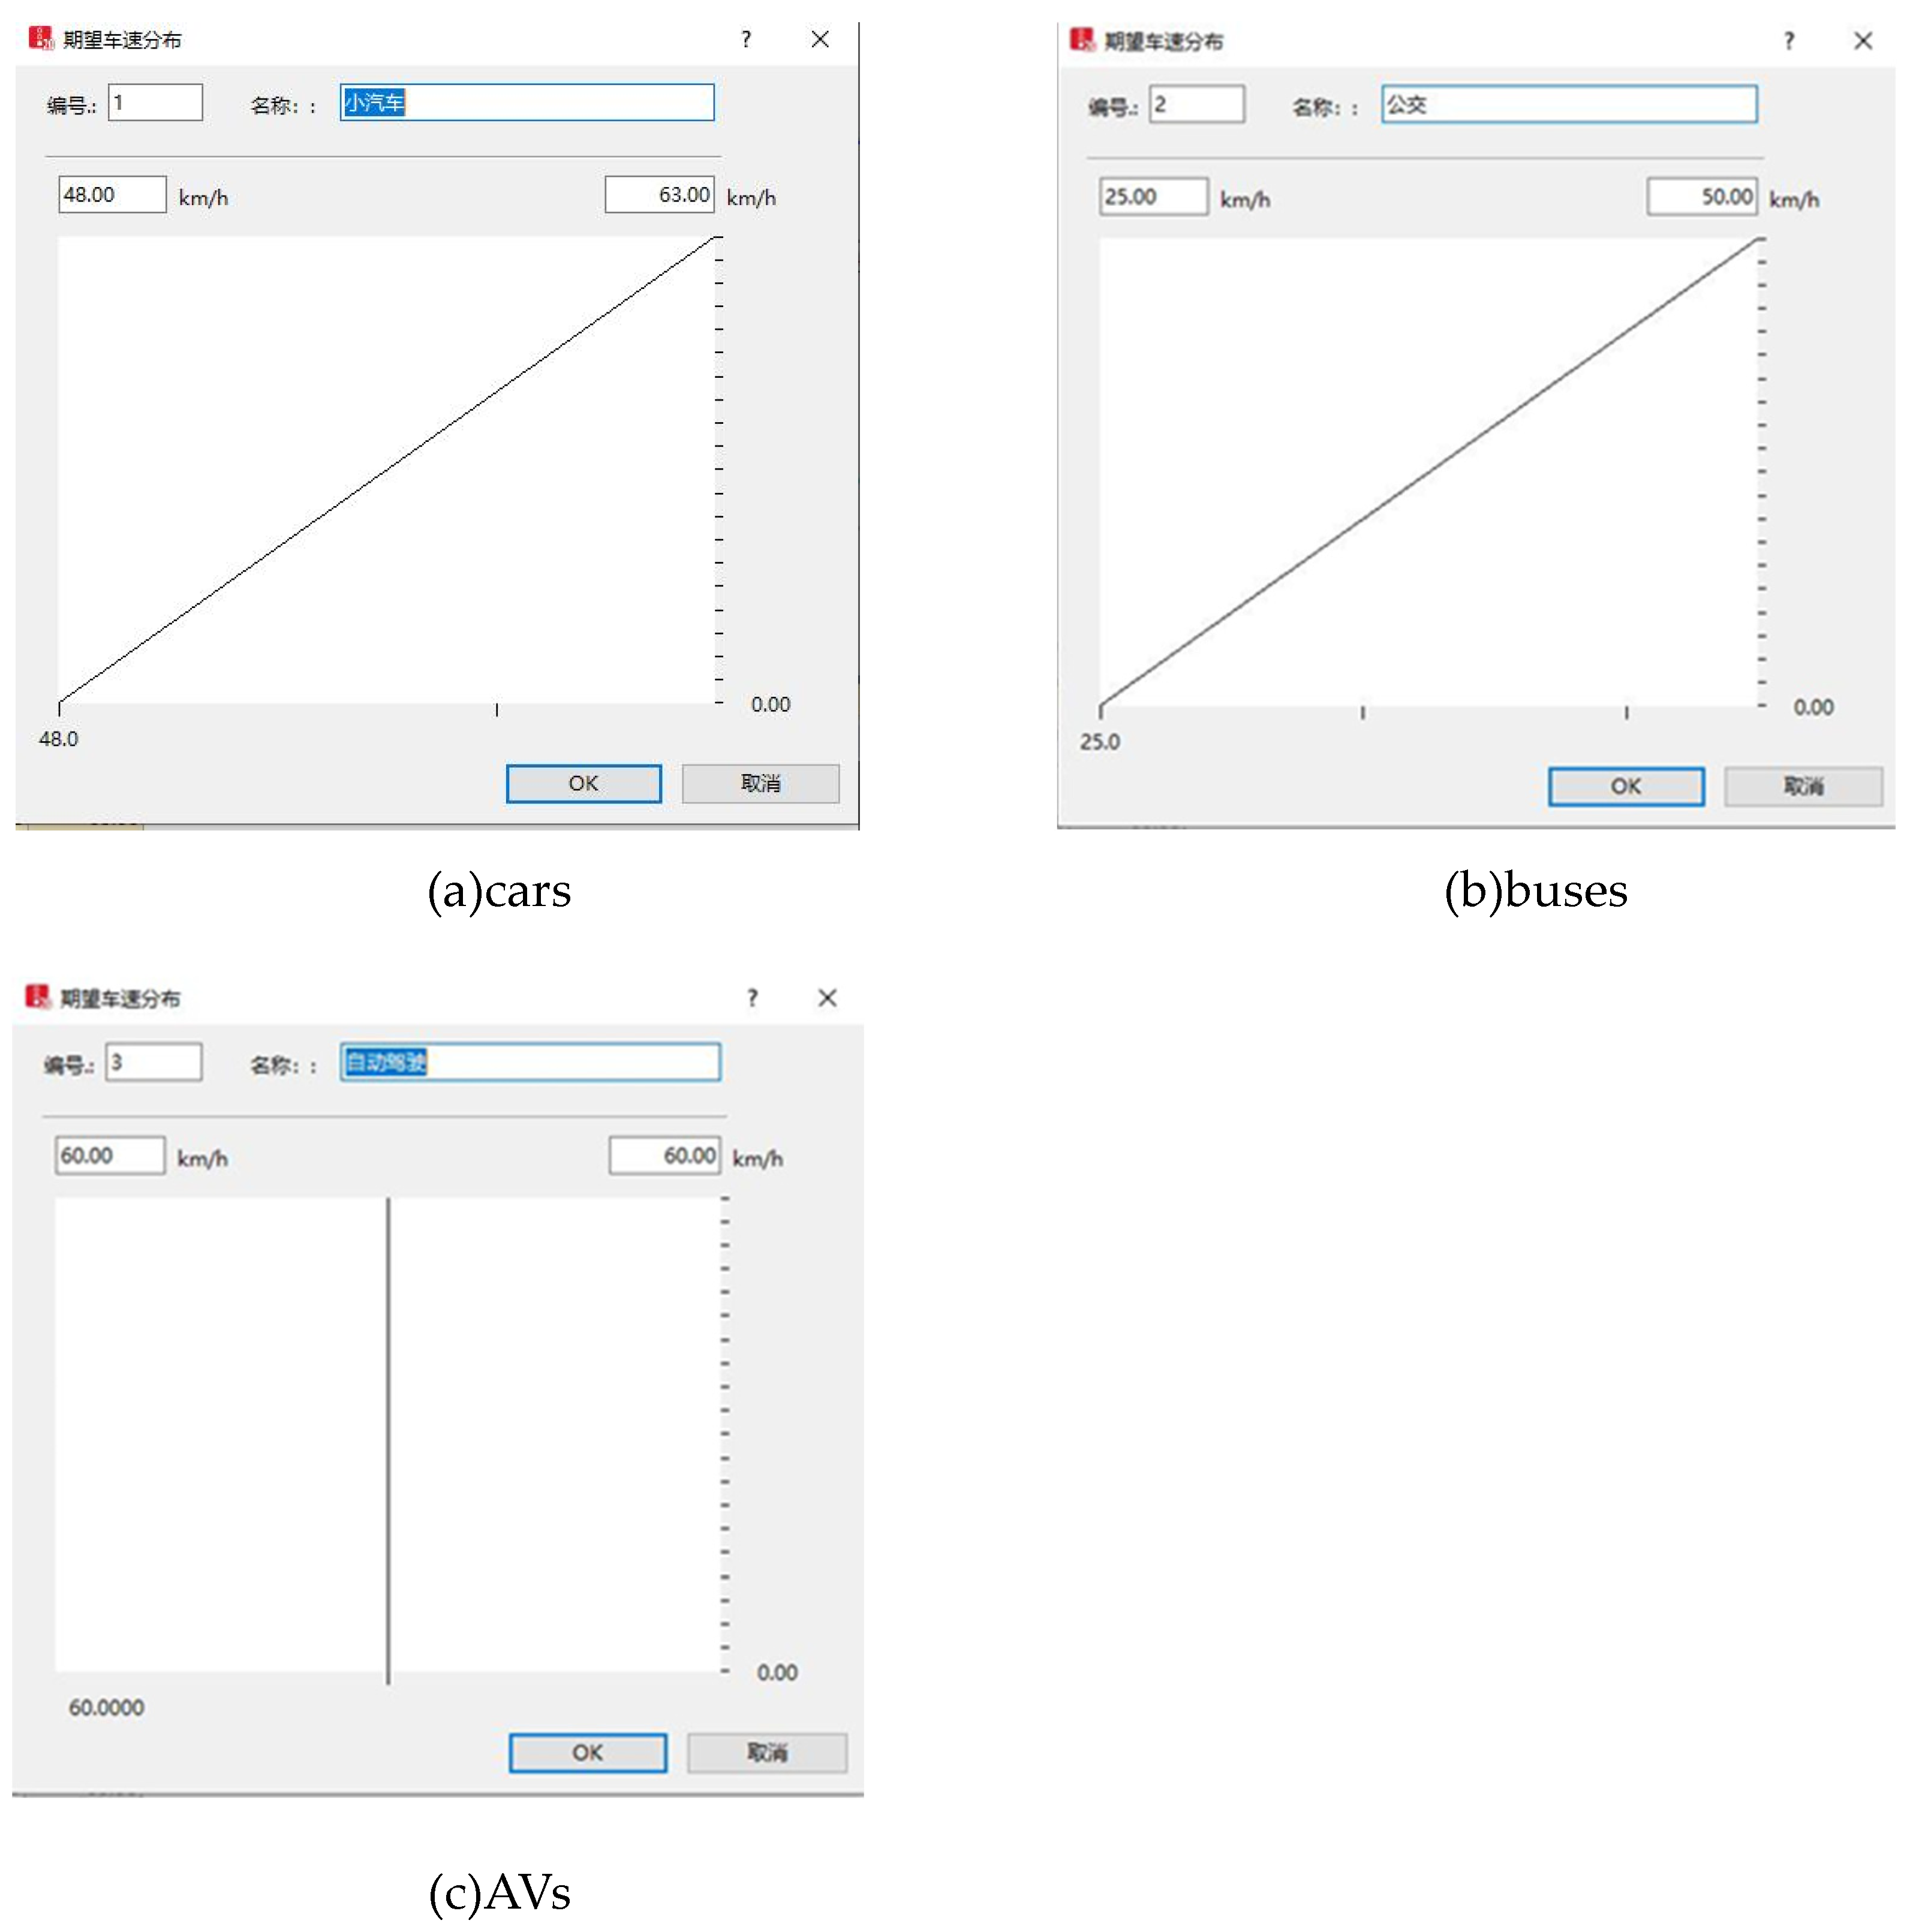
The desired speed of HVs varies up and down within a certain range, while the desired speed of AVs is strictly set. The speed of urban roads is generally 40-60km/h as an example, and the expected speed of the car is shown in
Figure 2(a), that is, 48km/h-63km/h. The speed of the bus is generally 25-50km/h. The expected speed of autonomous vehicles is set at 60 km/h (
Figure 2(c)).
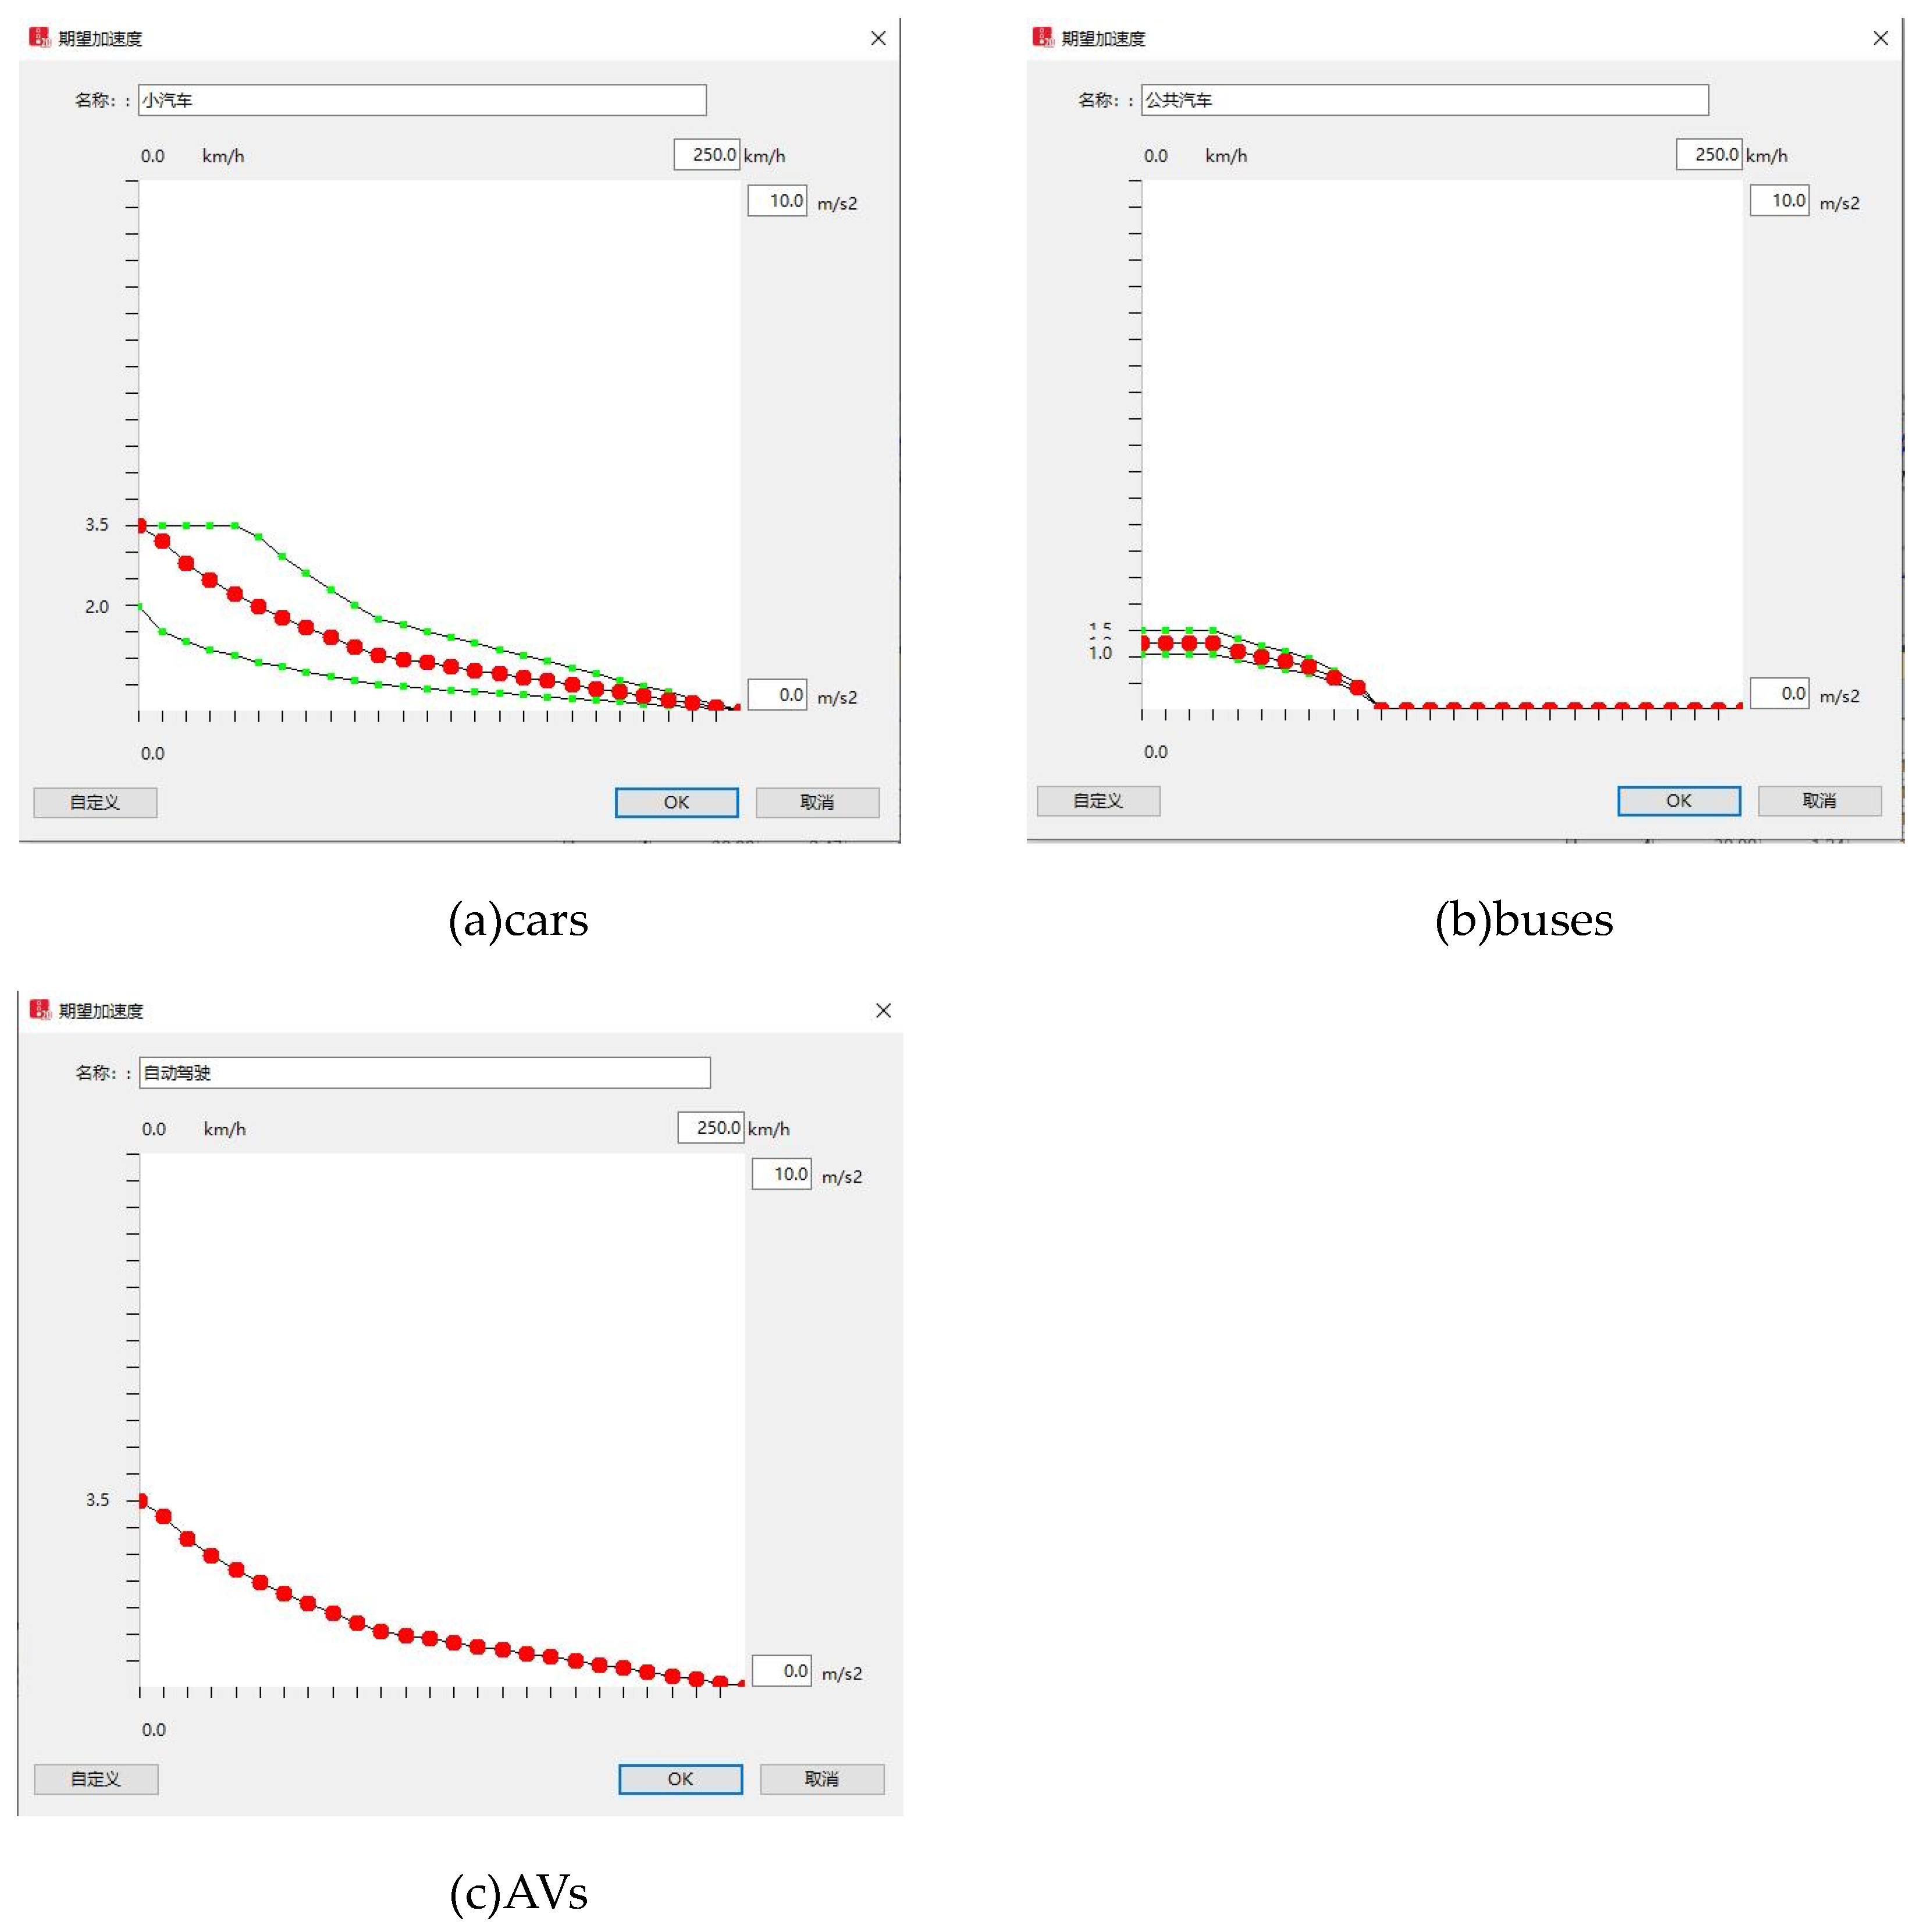
Similar to the desired velocity setting, the maximum acceleration of HVs oscillates within a certain interval above and below the set value, while AVs are a fixed value. Taking the maximum acceleration as an example, as shown in
Figure 3(a),
Figure 3(b) is the maximum acceleration distribution of HVs, while AVs do not oscillate, but strictly follow the red curve, that is,
Figure 3(c).
4.2. Simulation framework based on VISSIM
As shown in
Figure 4, this area covers the complete road network of Daqi Street, including 1625 road sections and connectors. Among them, the road sections/connectors include 8 urban main roads, 1 national highway, 3 secondary roads, 1 interchange and 29 level intersections. Real-world traffic volume, speed, and signal control were selected from actual survey data as control groups for simulation experiments. Then, the on-street parking strip is converted to a bus lane, and four scenarios of on-street parking strips converted to bus lanes are set up, and 25%, 50%, 75%, and 100% of the on-street parking strips are converted respectively (hereinafter referred to as the X% conversion ratio) to test the resulting traffic efficiency and emissions.
5. Empirical Results
Set on-street parking lots data, traffic flow, road network, and signal timing according to the actual road conditions. On the basis of the control group, the experimental group model converts on-street parking lots that meet the conditions for conversion to bus-only lanes into bus-only lanes, and the rest remains unchanged. The on-street parking strips were converted into bus-only lanes step by step, and the impact of bus-only lanes with different conversion ratios and bus lanes without conversion on the traffic flow of the road network was compared, and the impact of the conversion of on-street parking lots on traffic flow was quantitatively analyzed from the three perspectives of intersection, road section and road network.
5.1. Impact of on-street parking lots conversion behavior on traffic efficiency
5.1.1. Influence of different on-street parking lots conversion ratios on traffic flow at the intersections
Under the conditions of 0% (basic scenario), 25%,50%,75%,100% on-street parking lots, six common indicators of intersection level of service (LOS) including average queue length, maximum queue length, average vehicle delay (social vehicle), average vehicle delay (buses), average parking times (social vehicle), and average number of stops (buses) at the intersection are chosen in
Table 2.
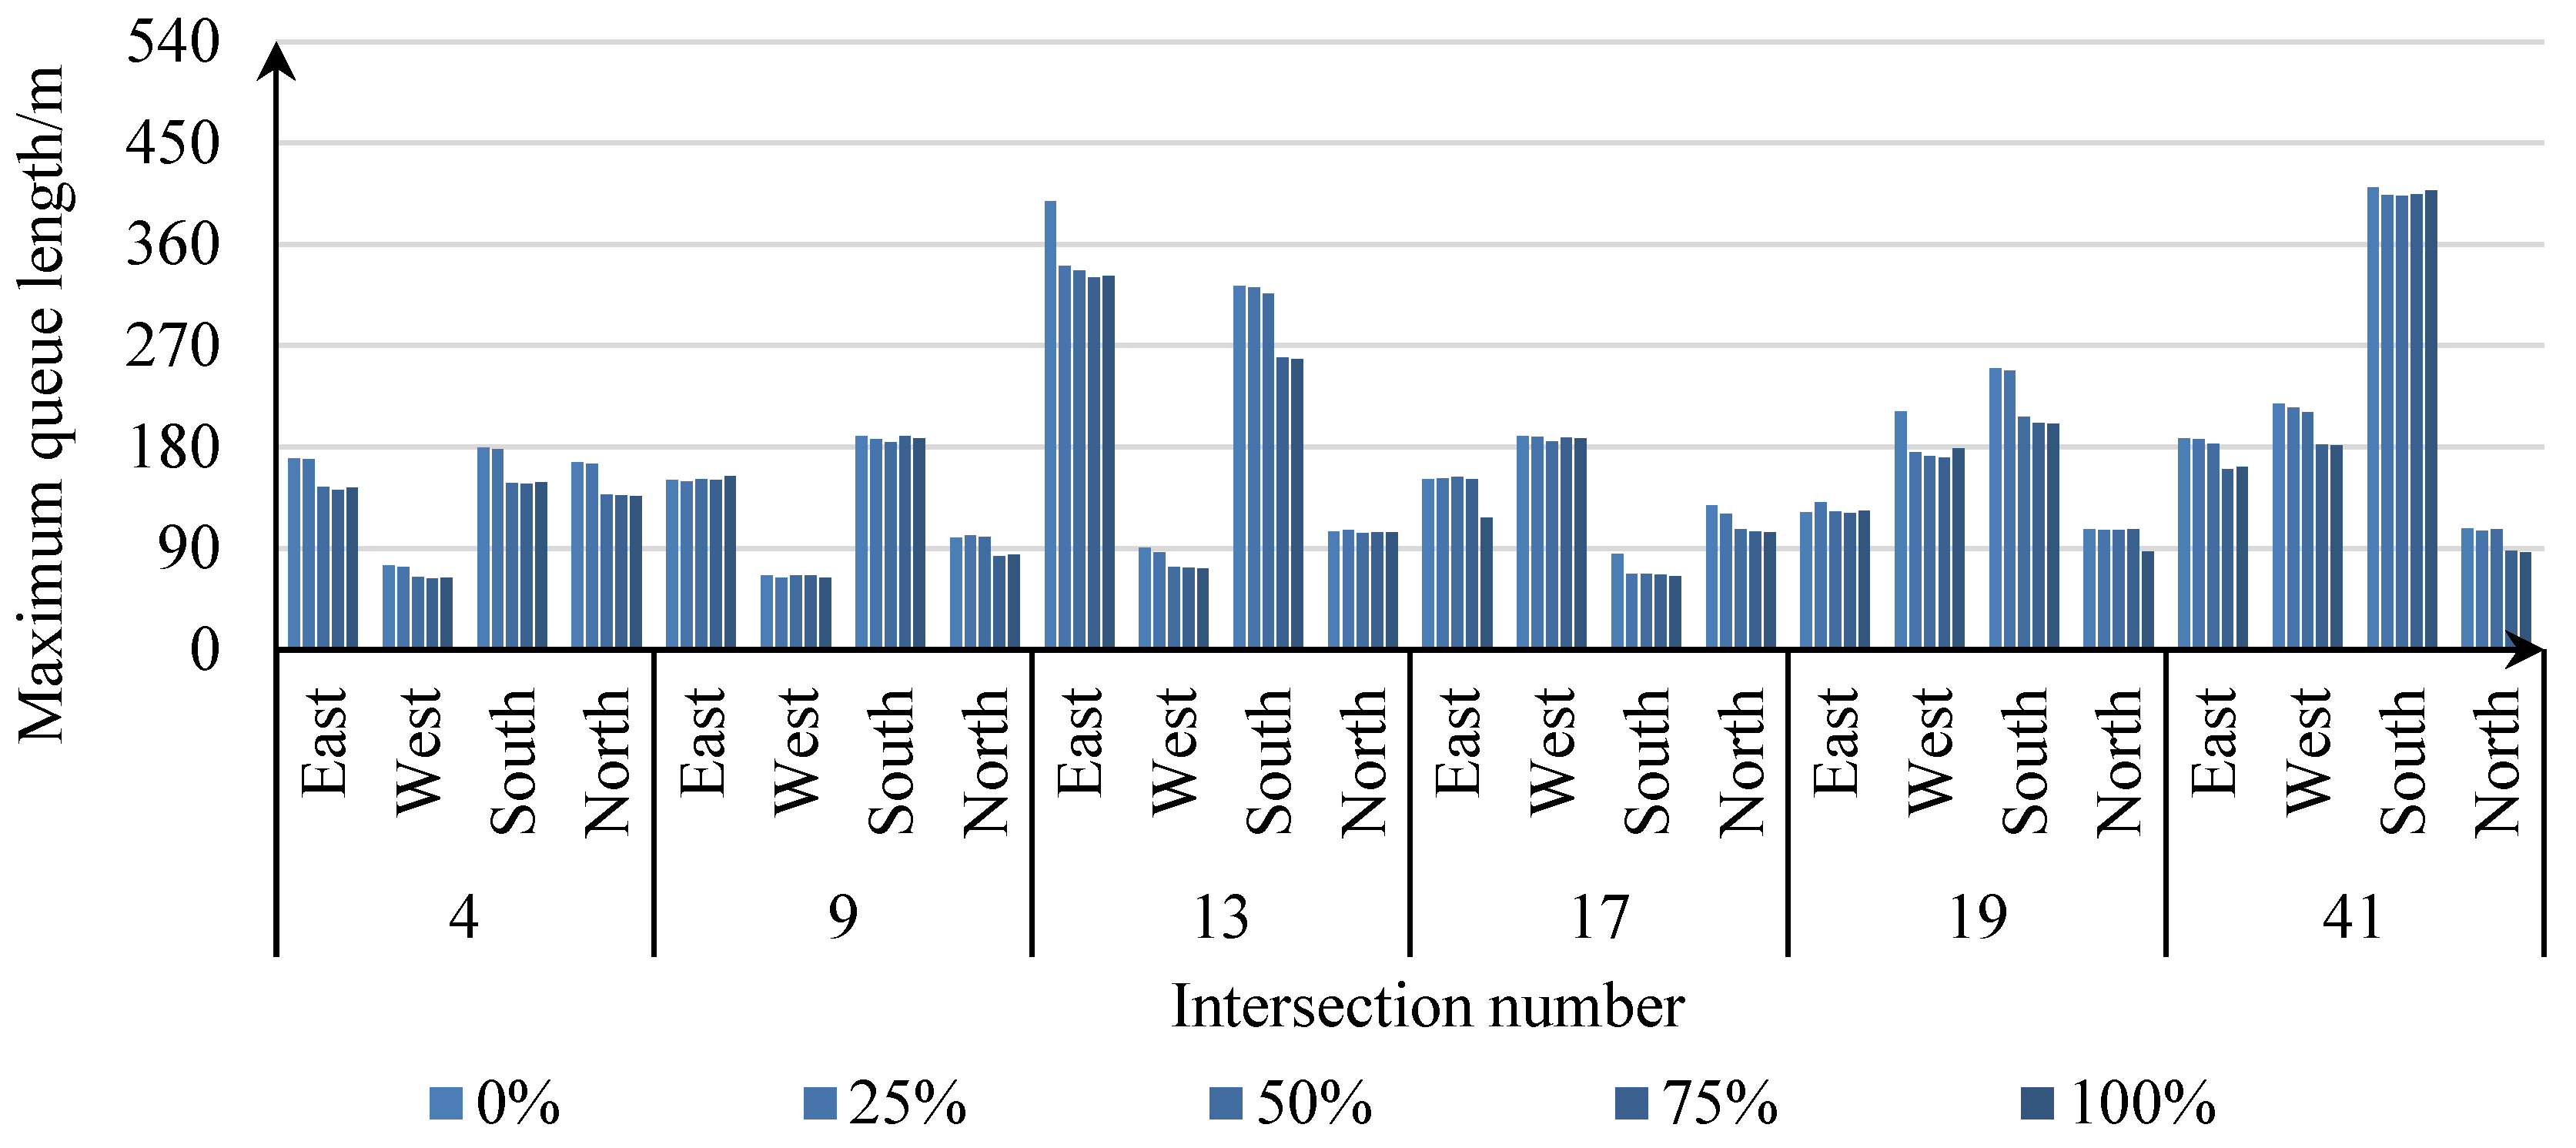
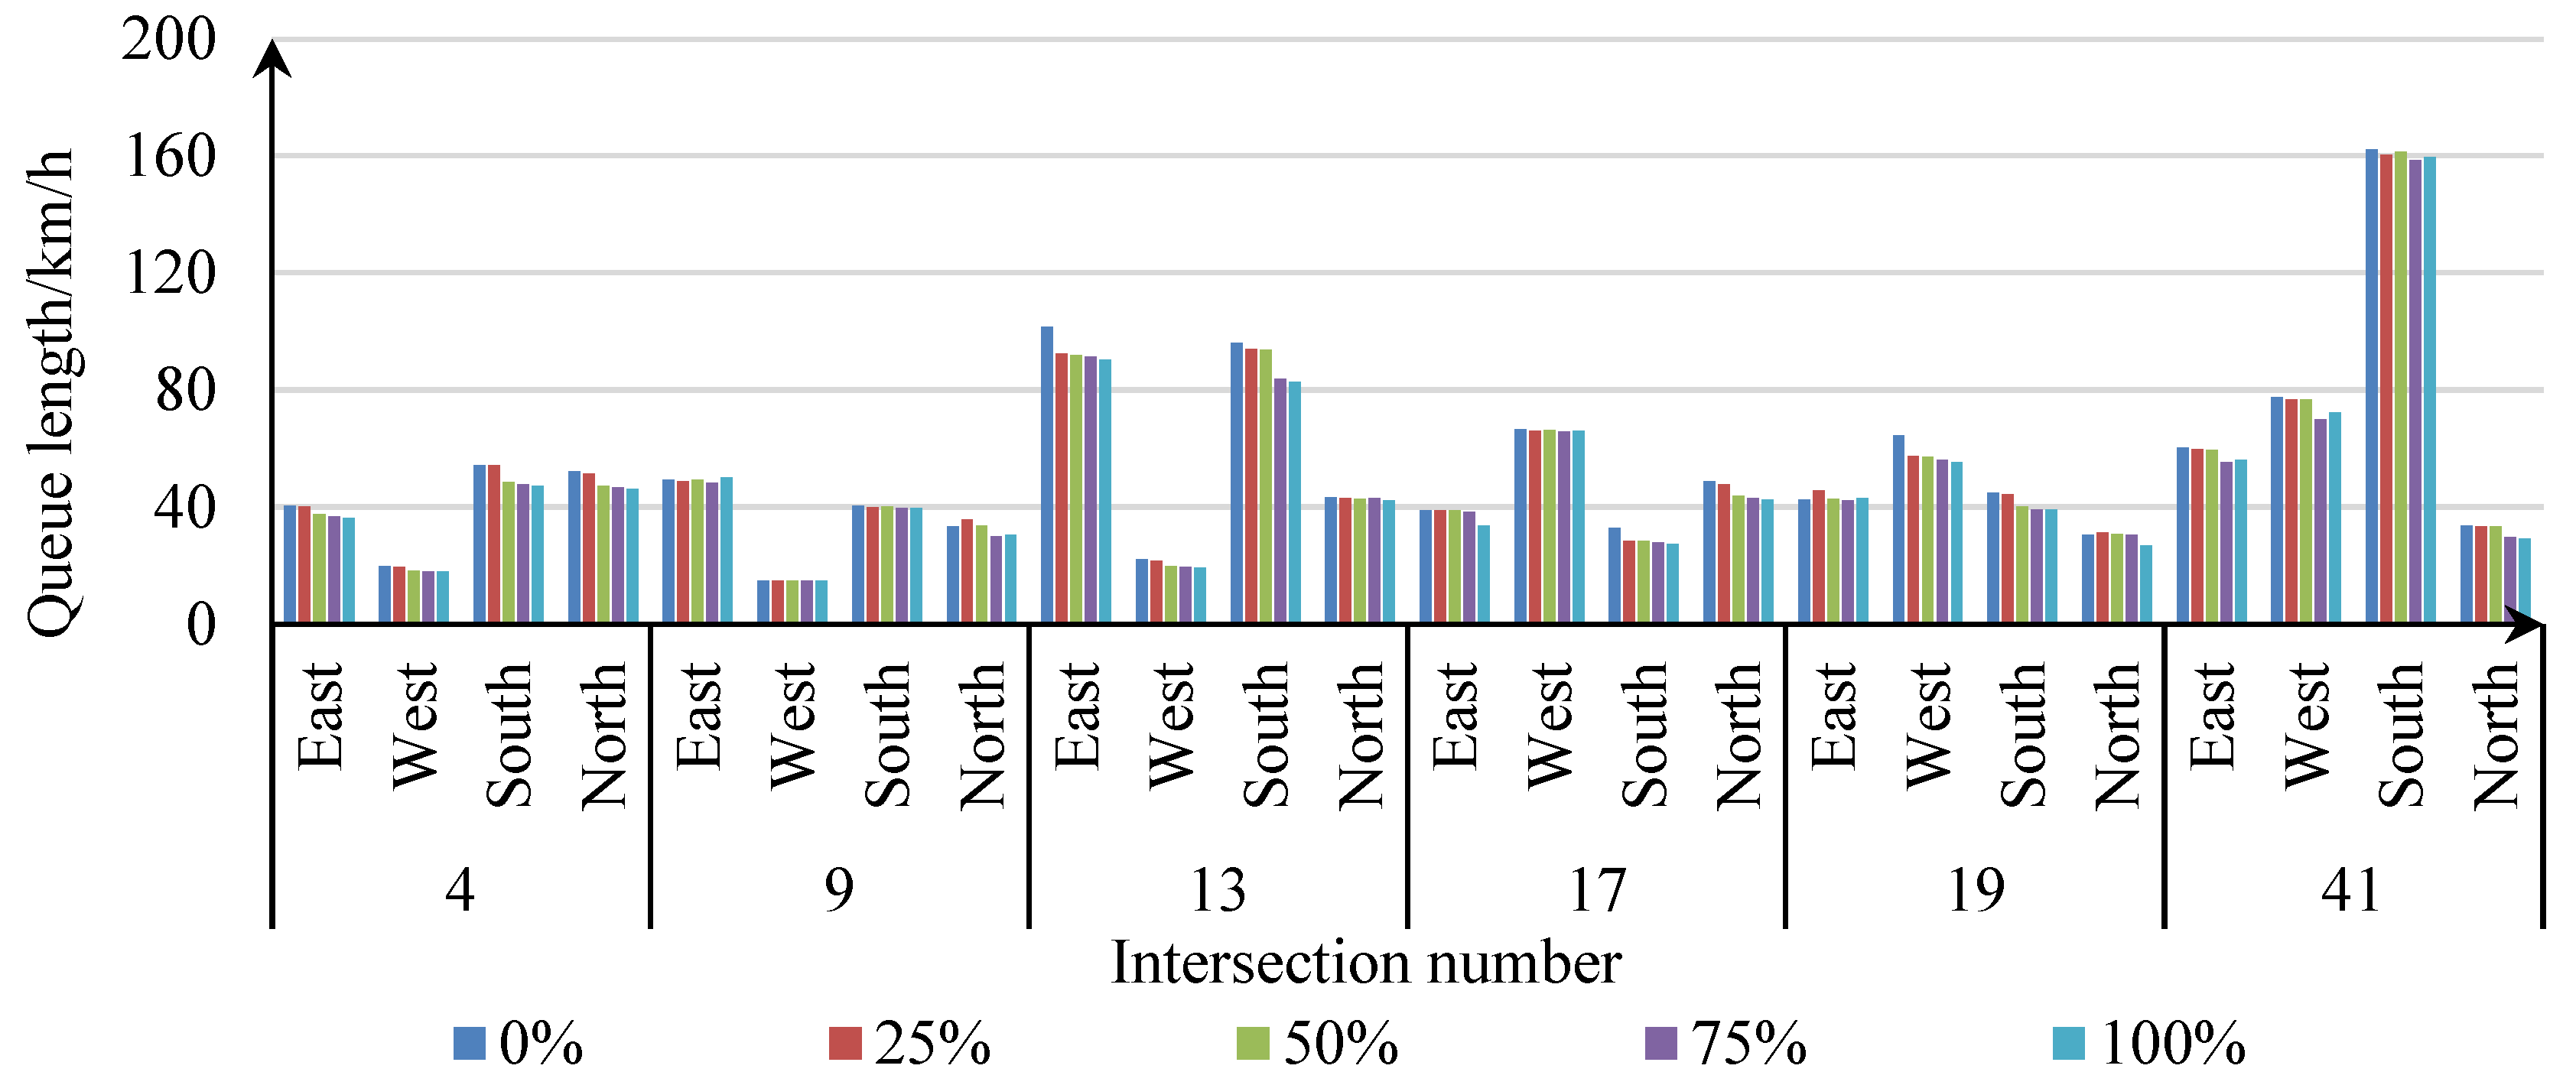
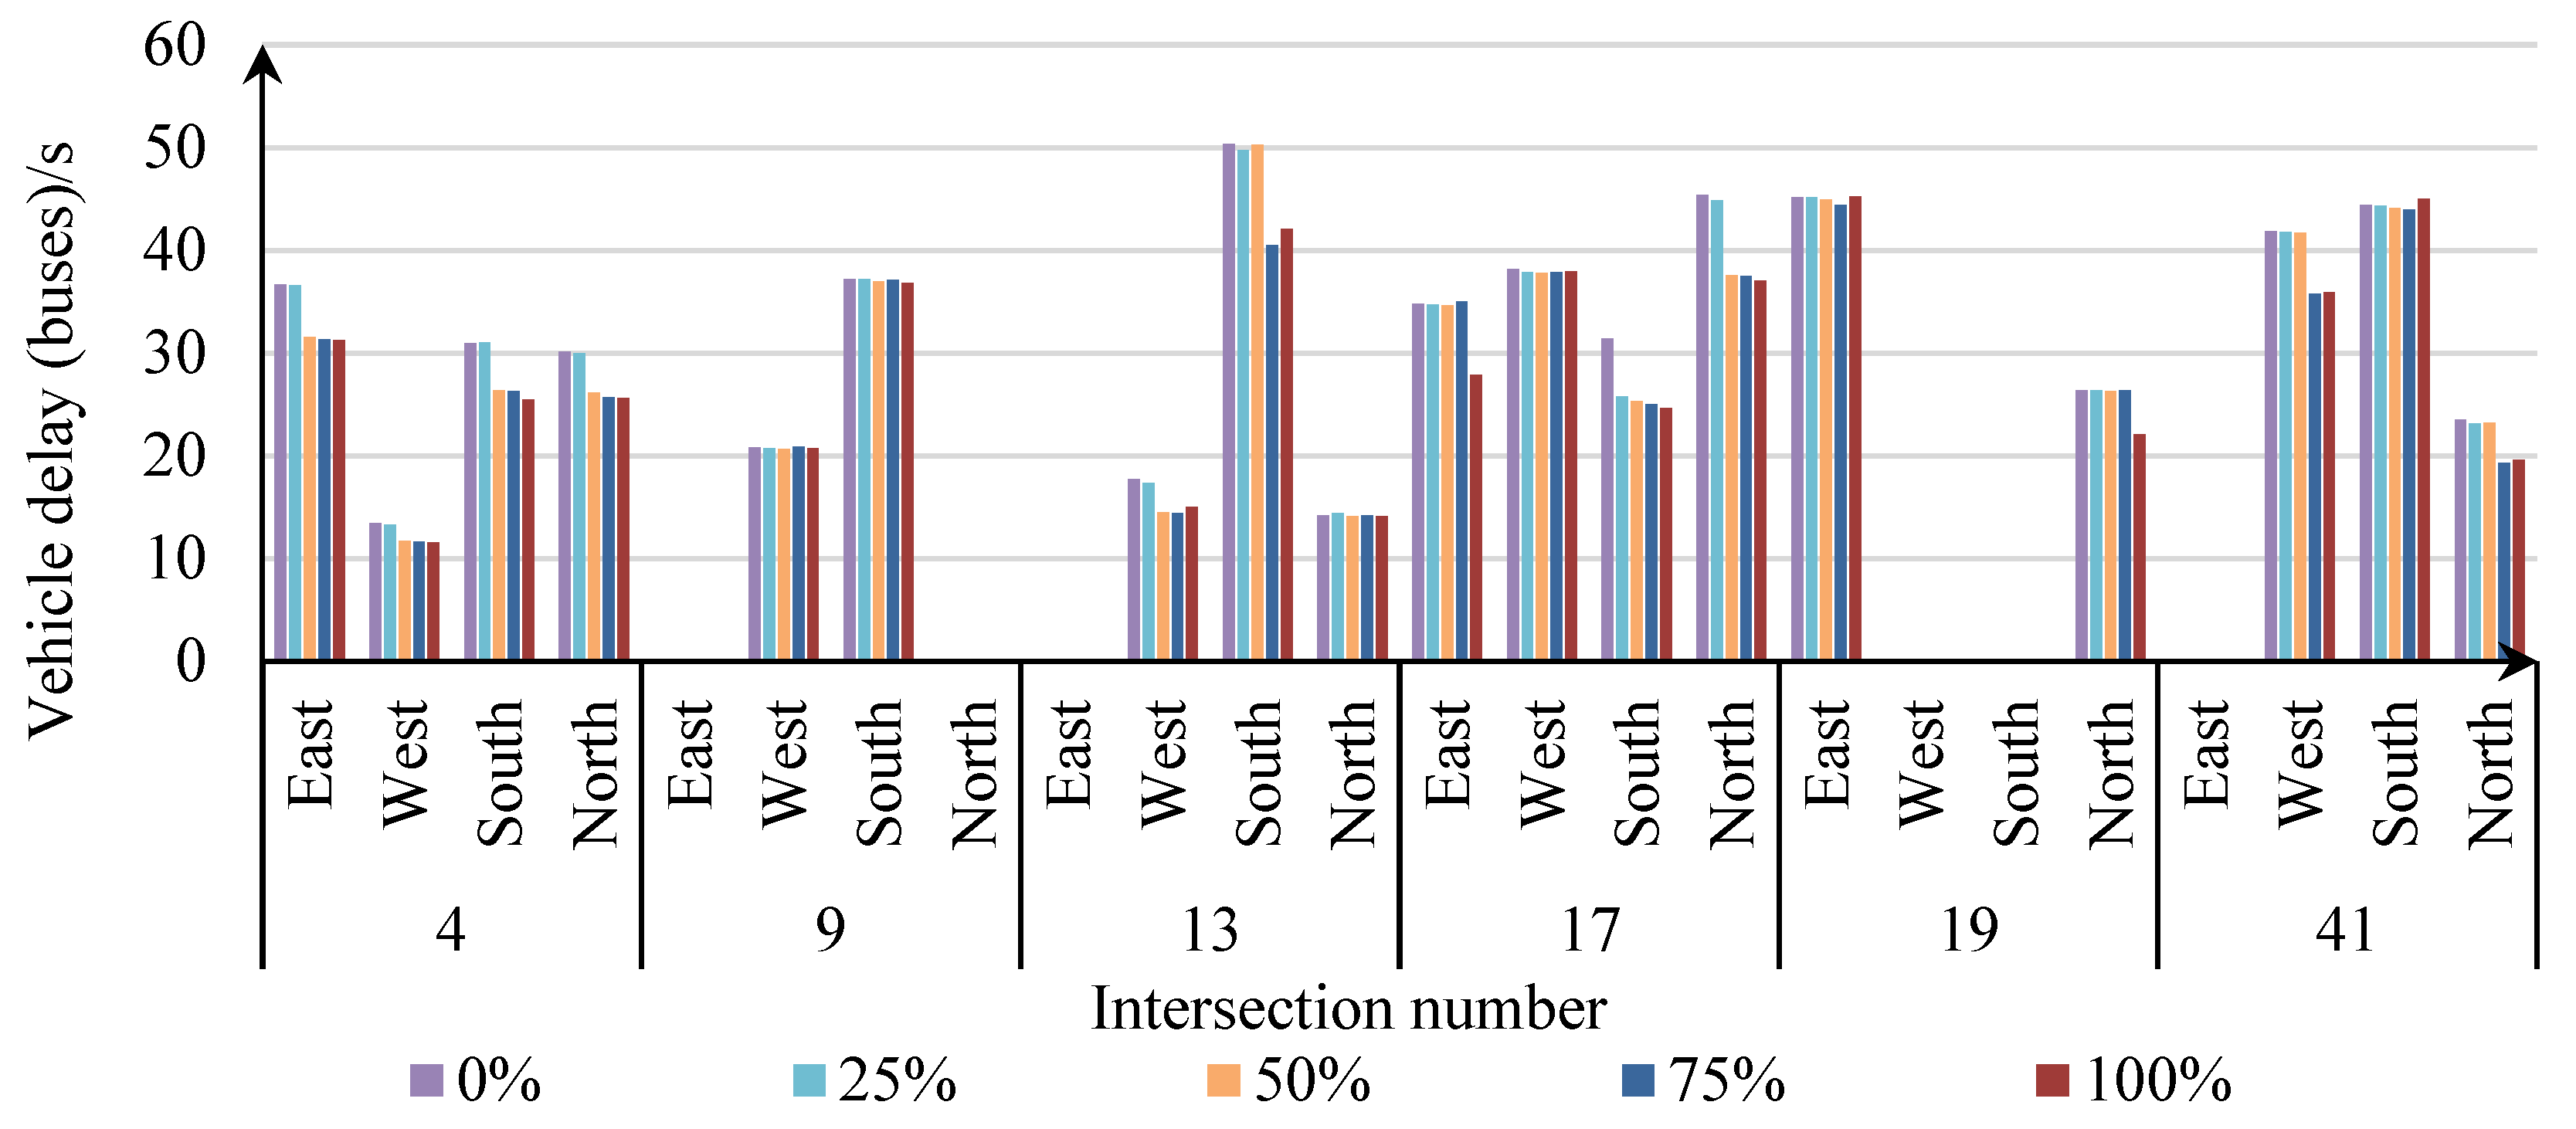
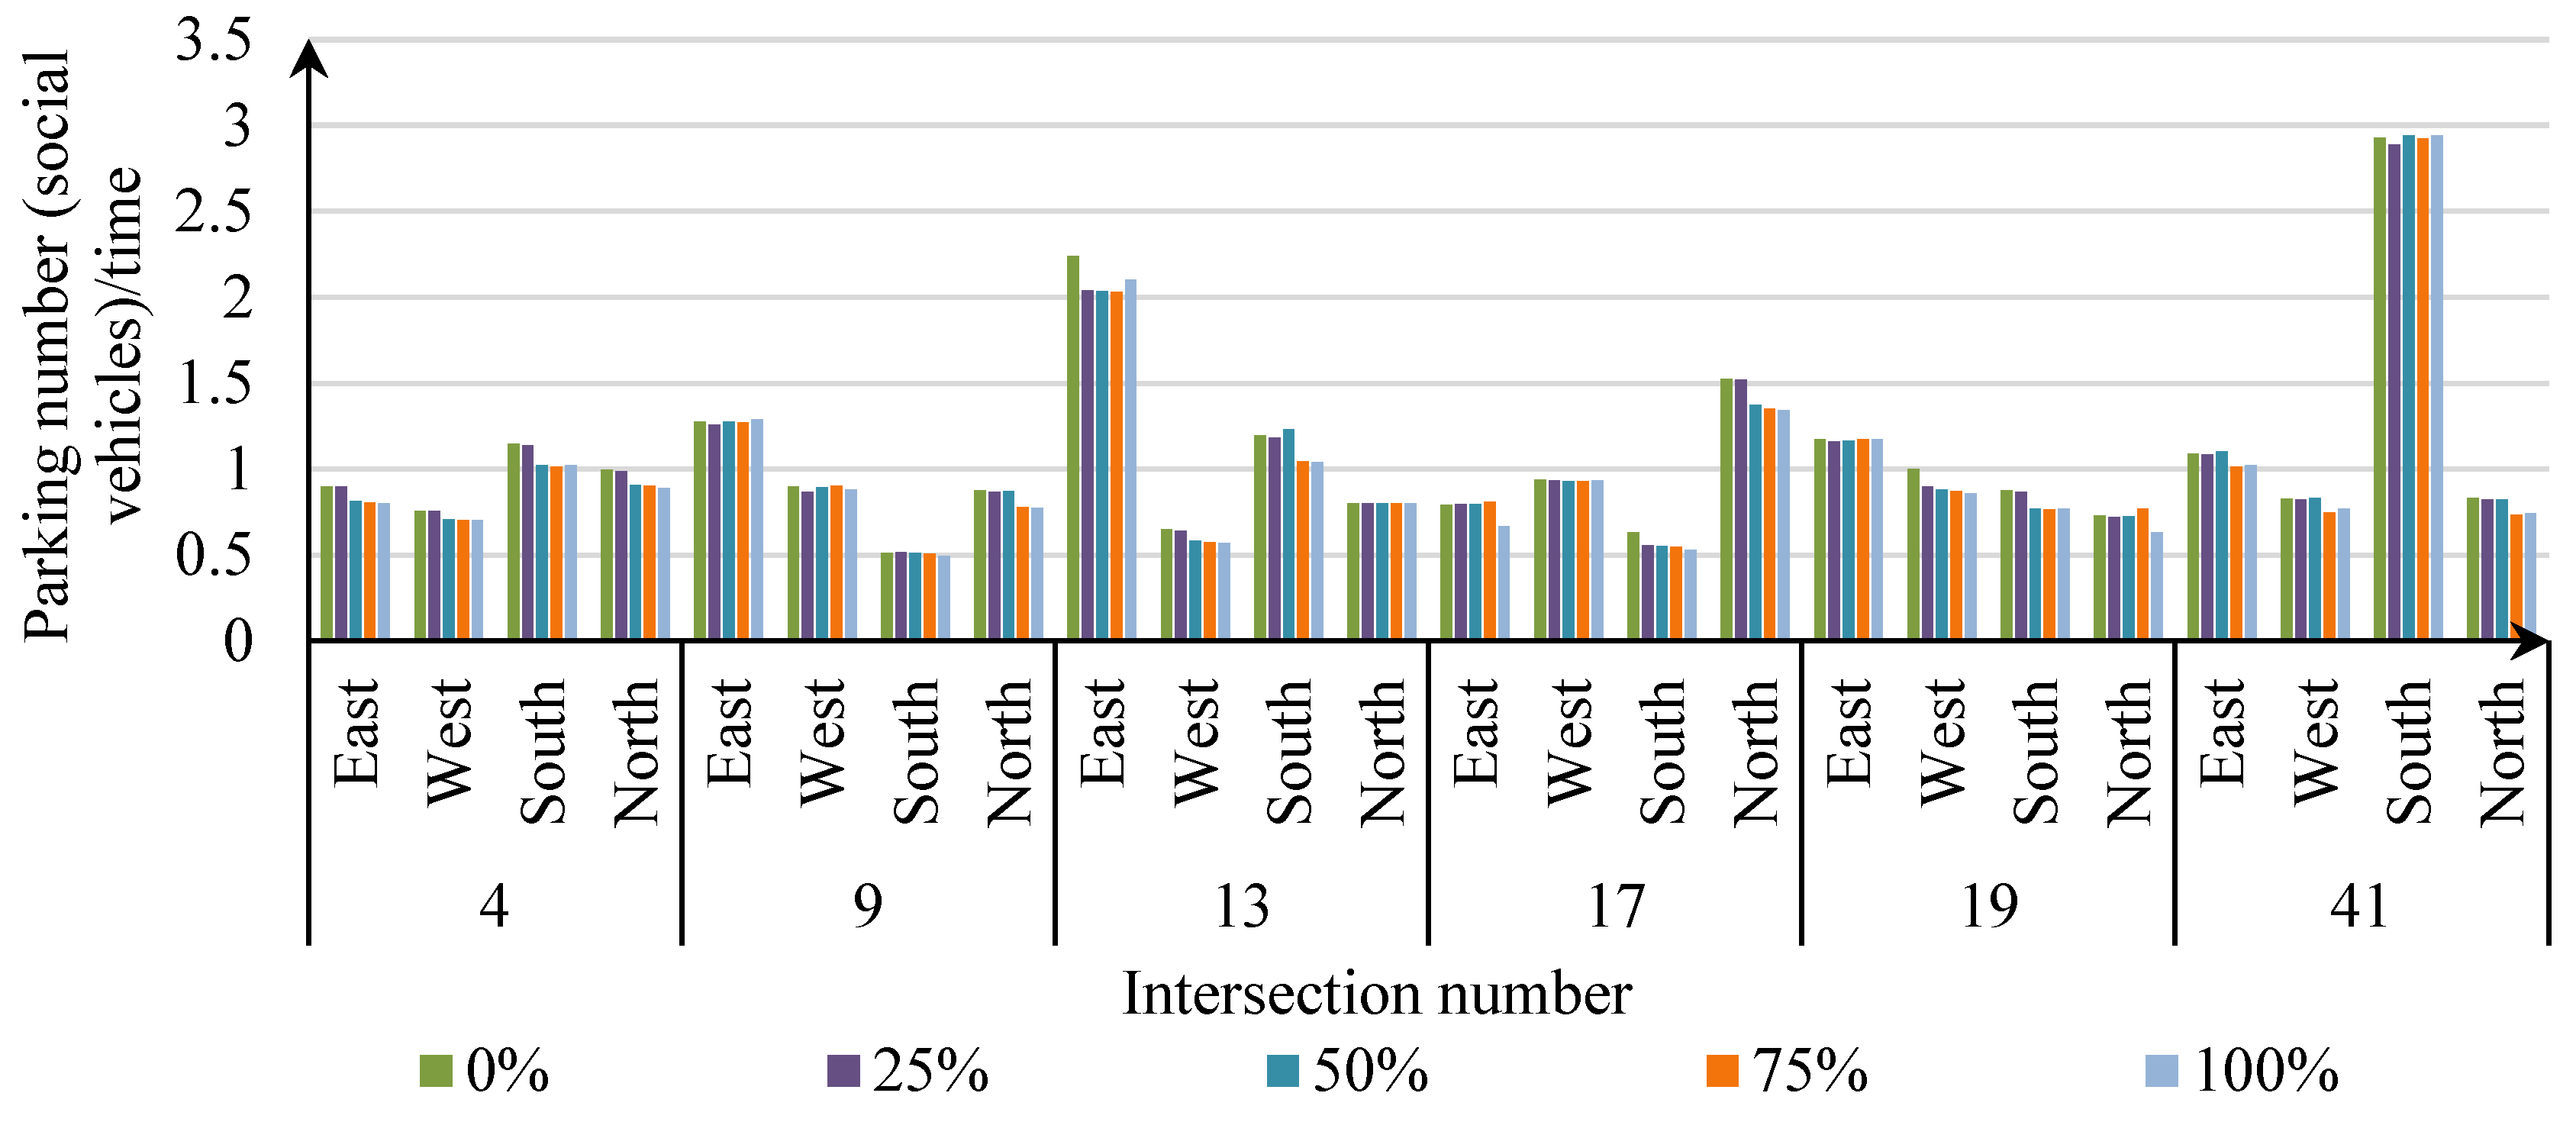
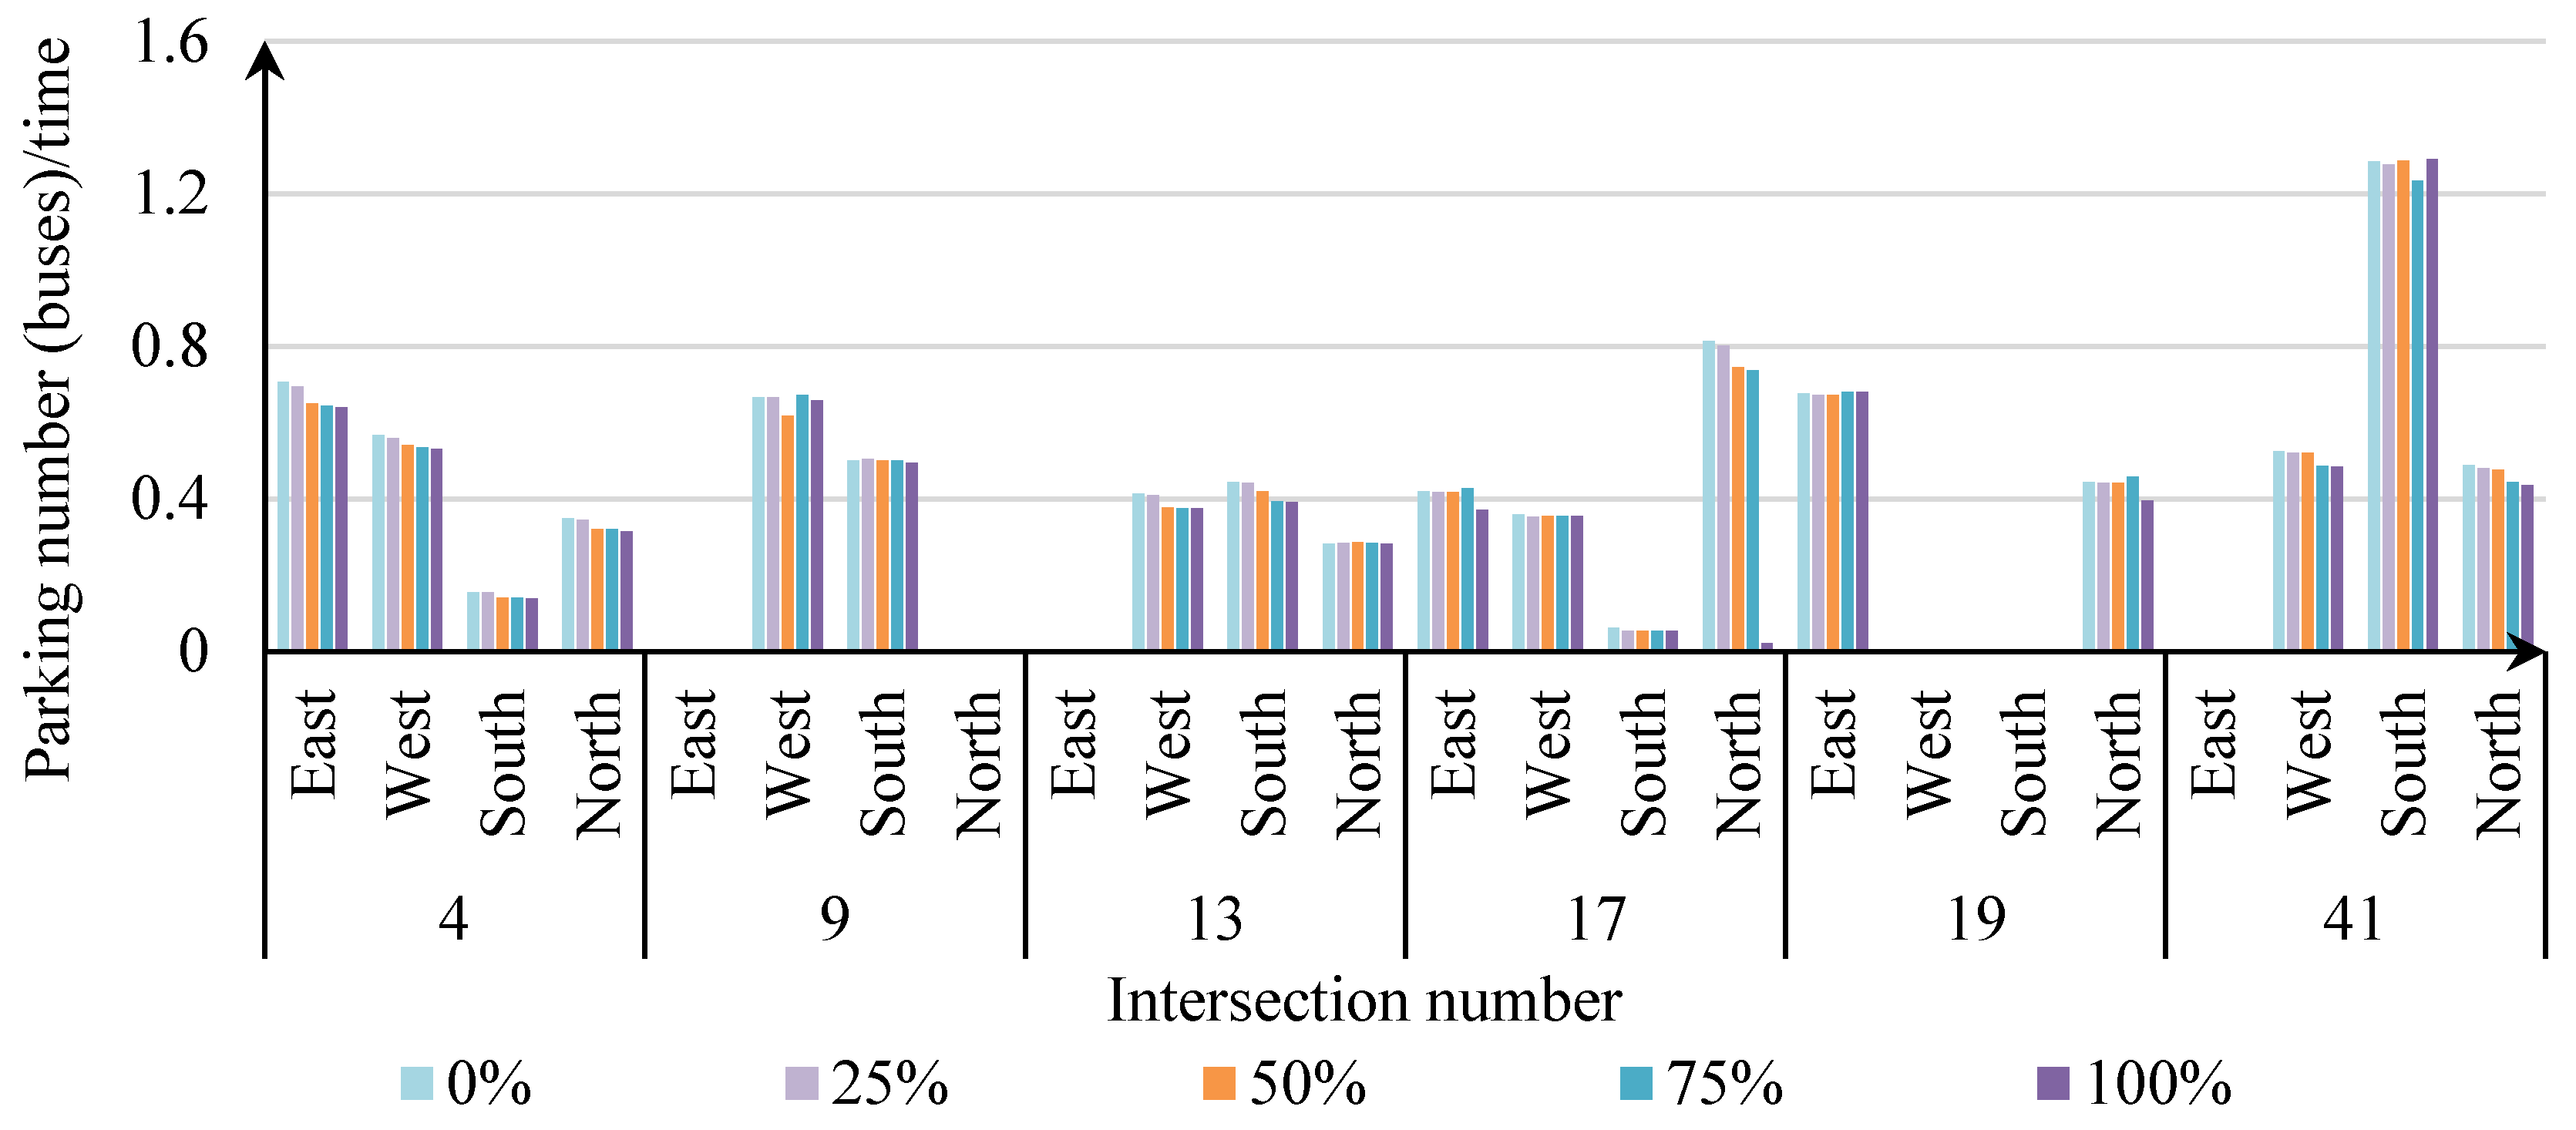
Obviously, the proportion of on-street parking lots conversion is positively correlated with the change trend of intersection queue length, maximum queue length, vehicle delay (social vehicles), vehicle delay (buses), parking number (social vehicles) and parking number (buses). When the conversion ratio of on-street parking lots increased to 75%, the average maximum queuing length of the intersection decreased significantly, from 174.18 m to 153.75m, and the queuing length was shortened by 11.73%. When the conversion ratio of on-street parking lots is increased to 100%, the queue length has been shortened to 152.01m, and the queue length has been shortened by 12.73%. Before entering the intersection, it is not convenient for the car parked on the roadside parking lots to drive out, especially when the queue is long, and this inconvenience exacerbates the traffic jam at the intersection. According to
Figure 5,
Figure 6,
Figure 7,
Figure 8,
Figure 9 and
Figure 10, the most obvious change of indicators is when the conversion ratio of on-street parking lots is 75%, so the 75% conversion ratio of on-street parking lots is used as an example. Under the 75% conversion ratio of on-street parking lots, the queue length, maximum queuing length, average vehicle delay (social vehicles), average vehicle delay (buses), average number of parking times (social vehicles), average parking times (buses) and no on-street parking lots conversion ratio decreased by 7.37%, 11.73%, 10.40%, 9.50%, 6.01%, 6.27% and 4.54%, respectively. According to the signal intersection service level standard, the average LOS of 50% of on-street parking lots conversion ratio is Class C, and 75% of the proportion of on-street parking lots is Class B. Therefore, the behavior of on-street parking lots transitions has a positive effect on intersections. Taking the comparison of queue length, vehicle delay (buses), and parking number (buses) as an example, the six intersections are affected to different degrees. Among them, the more obvious are the south entrance of intersection 4, the north entrance of intersection 9 and the south entrance of Section 13, which indicates that the higher the correlation with the road section where the on-street parking lots is located, the greater the impact of lane change at the intersection. Therefore, it is recommended to convert the on-street parking lots into a bus-only lane to improve the operation efficiency of buses and alleviate traffic congestion.
Taking Section 17 as an example, six indicators were compared by the proportion of on-street parking lots conversion. As shown in
Figure 11, it can be seen that the indicators of the entrance road for sections of roads that have not been converted from street parking lots have remained almost unchanged. The largest change in the indicators of the import channel at the 75% conversion ratio was the largest. Among them, the converted road section is closer to the import road, and the length of the on-street parking lots has the largest decline rate of the indicators of the inlet road, so the intersection with the higher correlation with the on-street parking lot is greatly affected by the on-street parking lot conversion.
5.1.2. Influence of different on-street parking lots conversion ratios on traffic flow on the road sections
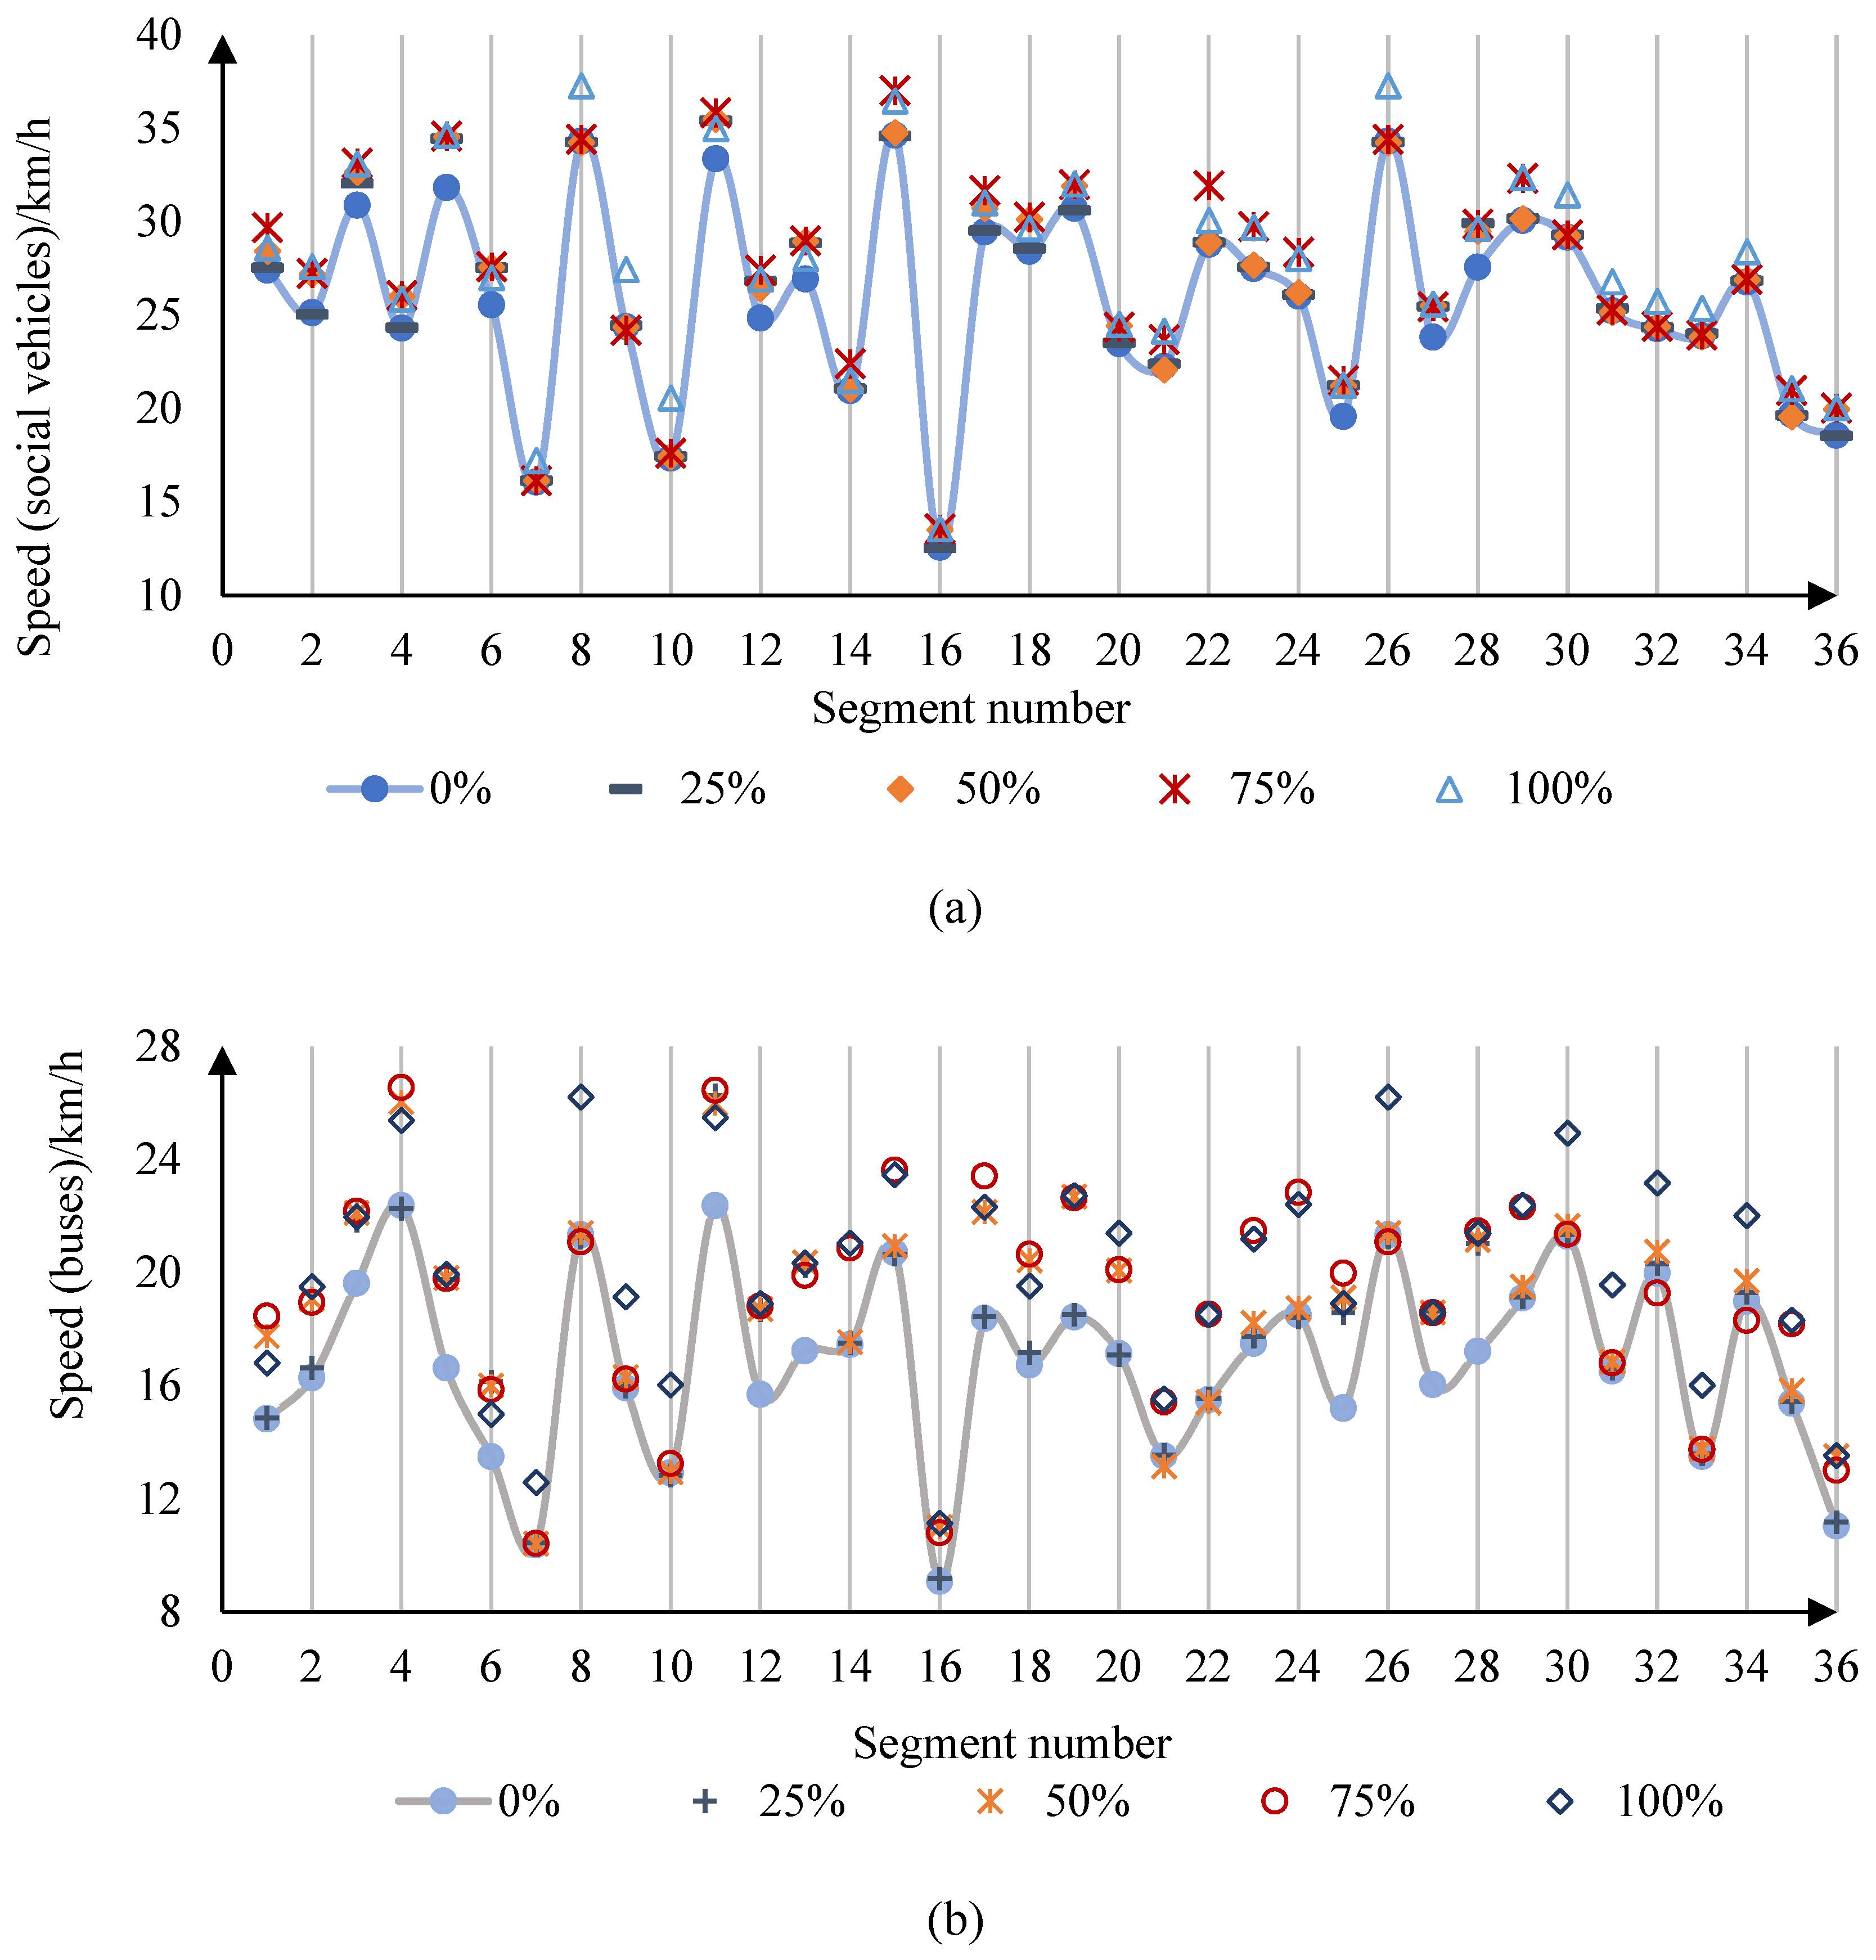
By analyzing the speed data obtained at the detection point, it can be seen that the speed of social vehicles on the road section increases with the increase of the proportion of on-street parking lots conversion. Studies have shown that the behavior of on-street parking lots conversion will lead to an increase in the traffic level of the road section, as shown in
Figure 12. In 9 sections such as Section 3 and Section 5, the speed increased significantly under the 75% conversion ratio, the speed (social vehicles) increased by 8.22%, and the speed (buses) increased by 19.45%, which coincided with the speed of the detection point under other conversion ratios. In the case of 75% conversion ratio in 9 road sections such as Section 4 and Section 16, the speed (social vehicles) increased by 6.82%, and the speed (buses) increased by 20.82%. In the case of 75% and 100% conversion ratios, the speed (social vehicles) increased by 7.78% and 6.12%, and the speed (buses) increased by 18.58% and 18.32%, respectively. Under the 100% conversion ratio of 10 road sections such as Section 7 and Section 8, the speed (social vehicles) increased by 8.79% and the speed (buses) increased by 19.75% respectively.
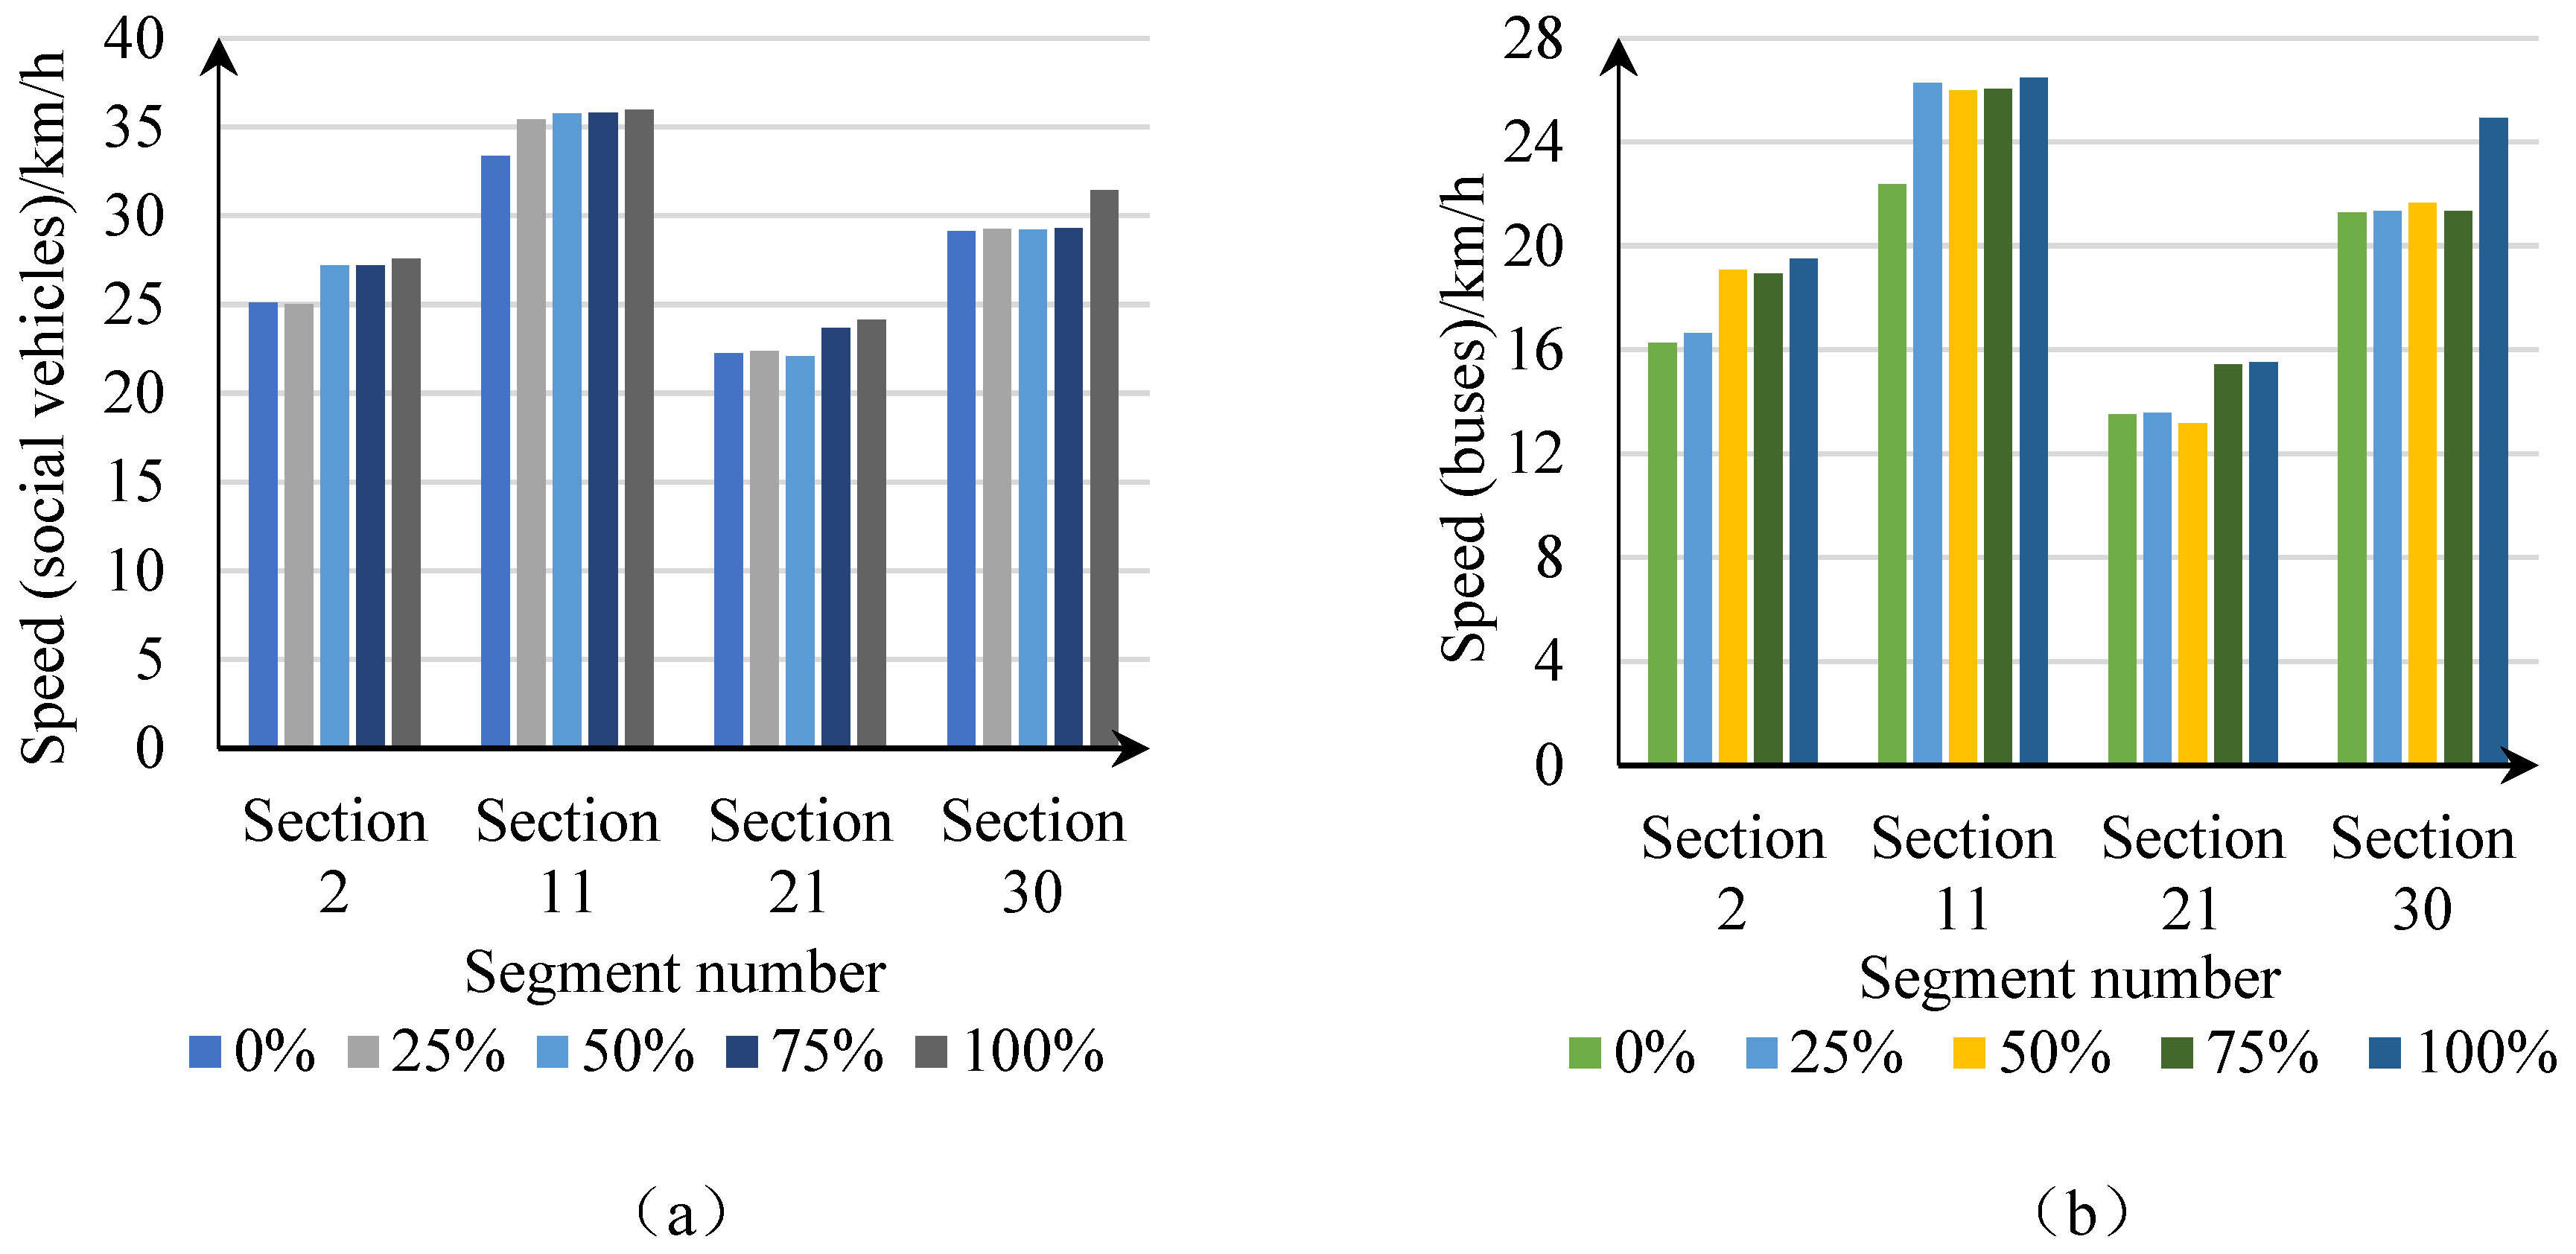
Road sections2, 11, 21 and 30 were selected as reference groups, and grouped according to the conversion ratio of on-street parking lots for vehicle speed comparison, as shown in
Figure 13. The figure shows that the speed of Section 11 increases with the increase of the conversion ratio, of which the speed (social vehicles) increased by 6.15%, 7.26%, 7.37% and 7.64%, and the speed (buses) increased by 17.46%, 16.23%, 16.47% and 18.41% respectively. The speed of the Section 2, Section 21 and Section 30 is almost unchanged at the 25% conversion ratio, as the three sections have not yet converted the on-street parking lots on the sections into bus lanes. When the proportion of on-street parking lots was converted to 50%, the speed (social vehicles) and vehicle speed (buses) of Section 2 increased by 8.24% and 17.19%. With the increase of the conversion ratio, its speed (social vehicles) increased by 8.34% and 9.86%, and its speed (buses) increased by 16.40% and 19.83% respectively. The speed of Section 21 and Section 30 sections is almost unchanged, because the on-street parking lots on the No. 21 section is converted into a bus-only lane when the conversion ratio is 75%. After the conversion, the speed (social vehicles) and vehicle speed (buses) of this section increased by 6.44% and 14.07% respectively. When the conversion ratio is 100%, the speed (social vehicles) and vehicle speed (buses) in this section will increase by 8.50% and 14.77% respectively. After the lane change of Section 30, that is, when the conversion ratio is 100%, the speed (social vehicles) and vehicle speed (buses) of this section increase by 7.81% and 17.21% respectively. It can be seen that the conversion of on-street parking lots has a significant impact on the road section, and the speed of the road section increases with the increase of the conversion ratio. This confirms that converting on-street parking lots into bus-only lanes can significantly increase bus speeds.
5.1.3. Influence of different on-street parking lots conversion ratios on traffic flow of road network
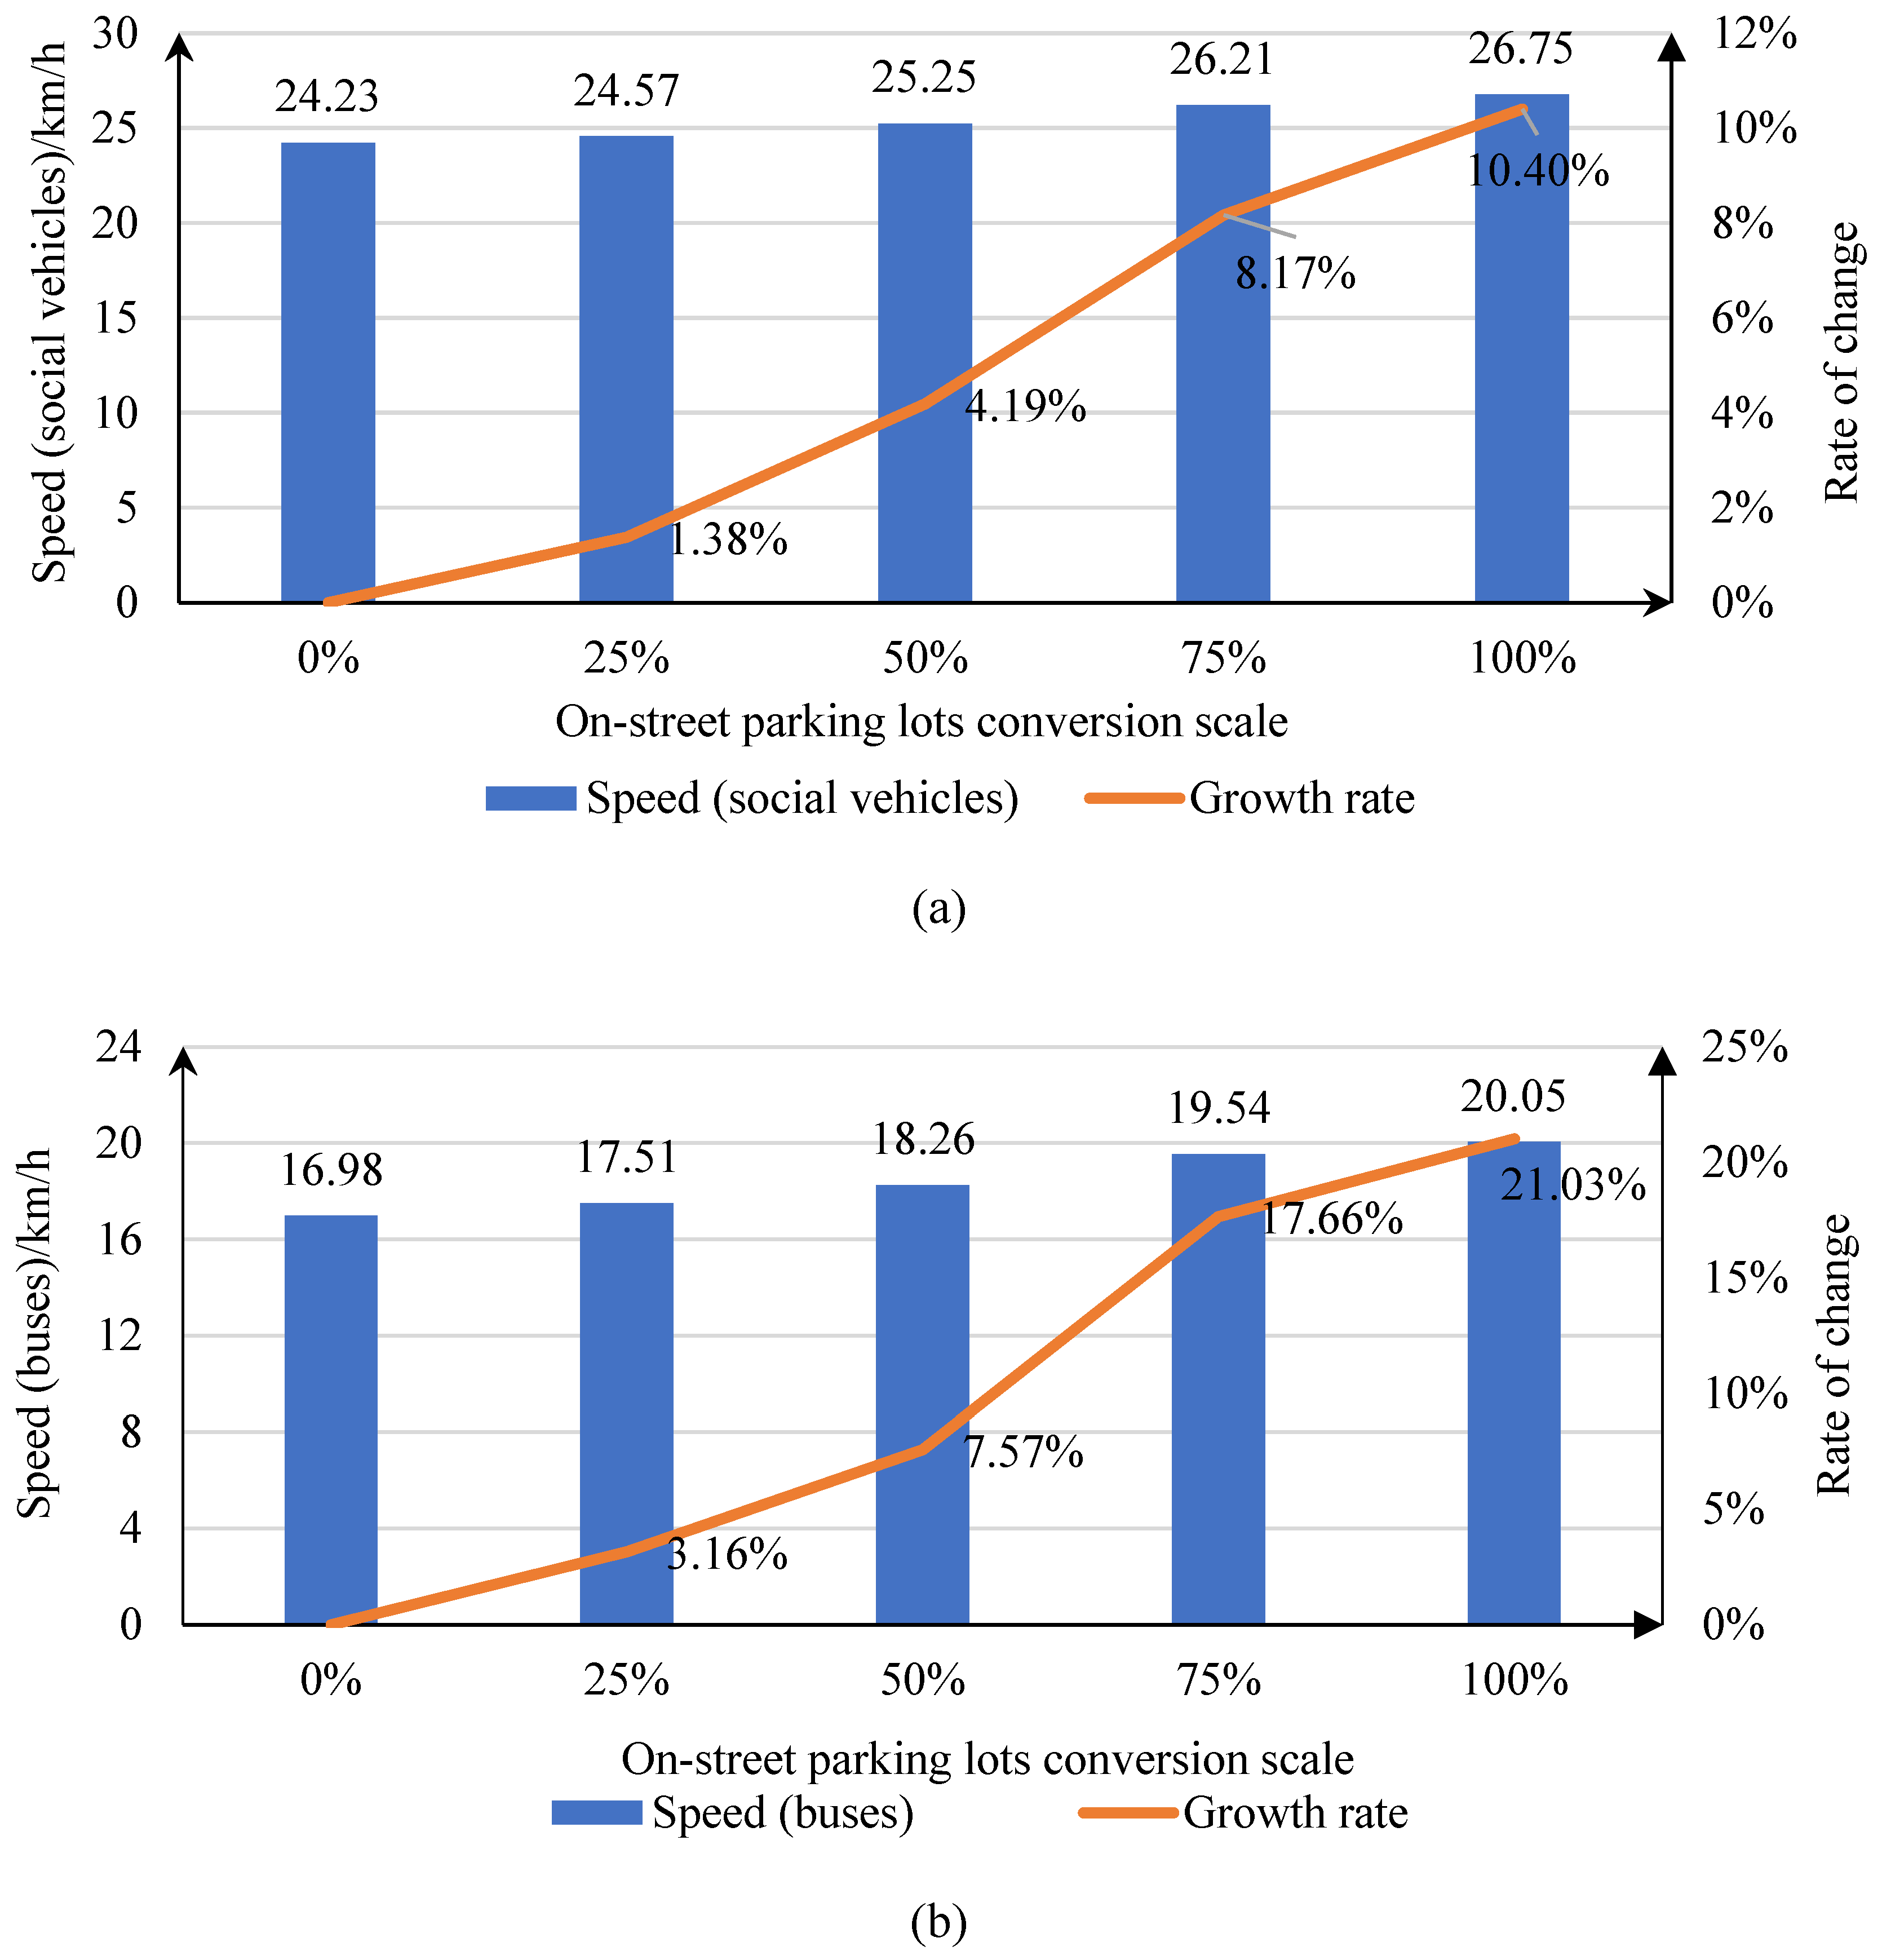
It can be concluded from the influential analysis on the road sections, that the average speed of road network decreases with the increase of the on-street parking lots conversion ratios. As shown in
Figure 14, when the proportion of on-street parking lots conversion is 75%, the vehicle speed (social vehicles) and vehicle speed (buses) increase significantly, which are 8.17% and 17.66% higher than those without on-street parking lots conversion, respectively. When the proportion of on-street parking lots conversion increased to 100%, the speed (social vehicles) and vehicle speed (buses) increased by 10.40% and 21.03% respectively compared with the non-on-street parking lots conversion. Compared with the 75% conversion ratio of on-street parking lots, the speed (social vehicles) and vehicle speed (buses) increased by 2.24% and 3.37%, respectively. By converting the on-street parking lots into a bus lane, the delay caused by parking in and out of the road to social vehicles and buses is avoided, and the impact of on-street parking is reduced. Moreover, the conversion of the roadside parking belt into a bus-only lane is equivalent to adding a lane that does not occupy the right of way of social vehicles, ensuring the priority right of way of buses and reducing the conflict between social vehicles and buses. So as to effectively improve the operation efficiency of public buses and social vehicles on the road network.
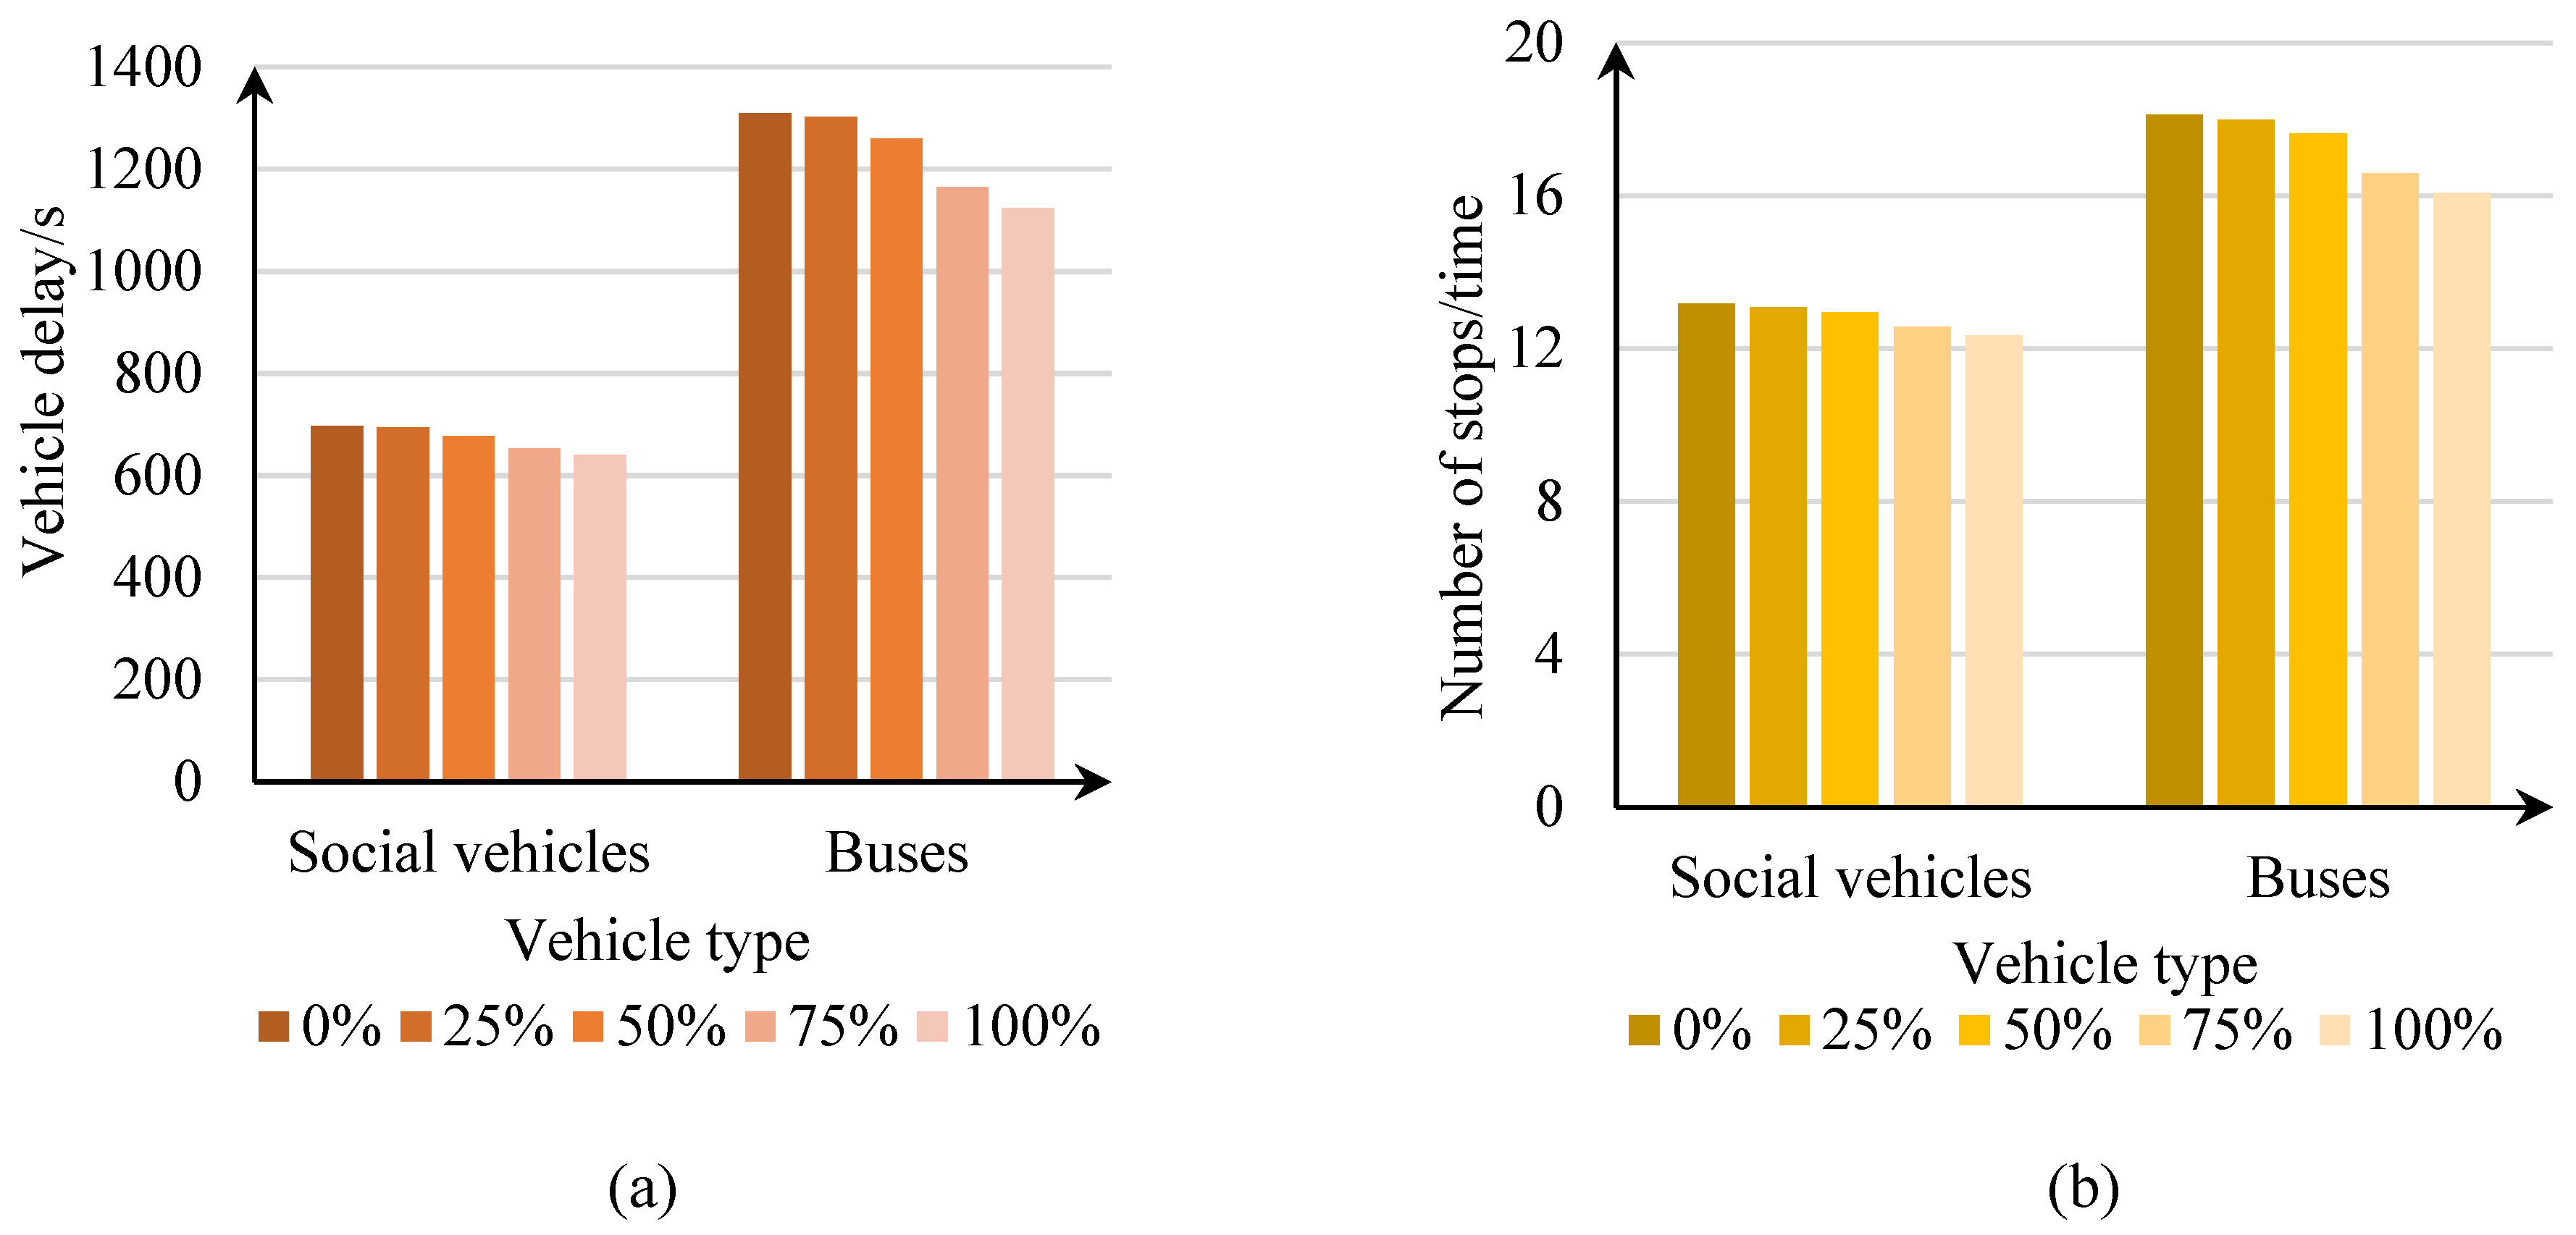
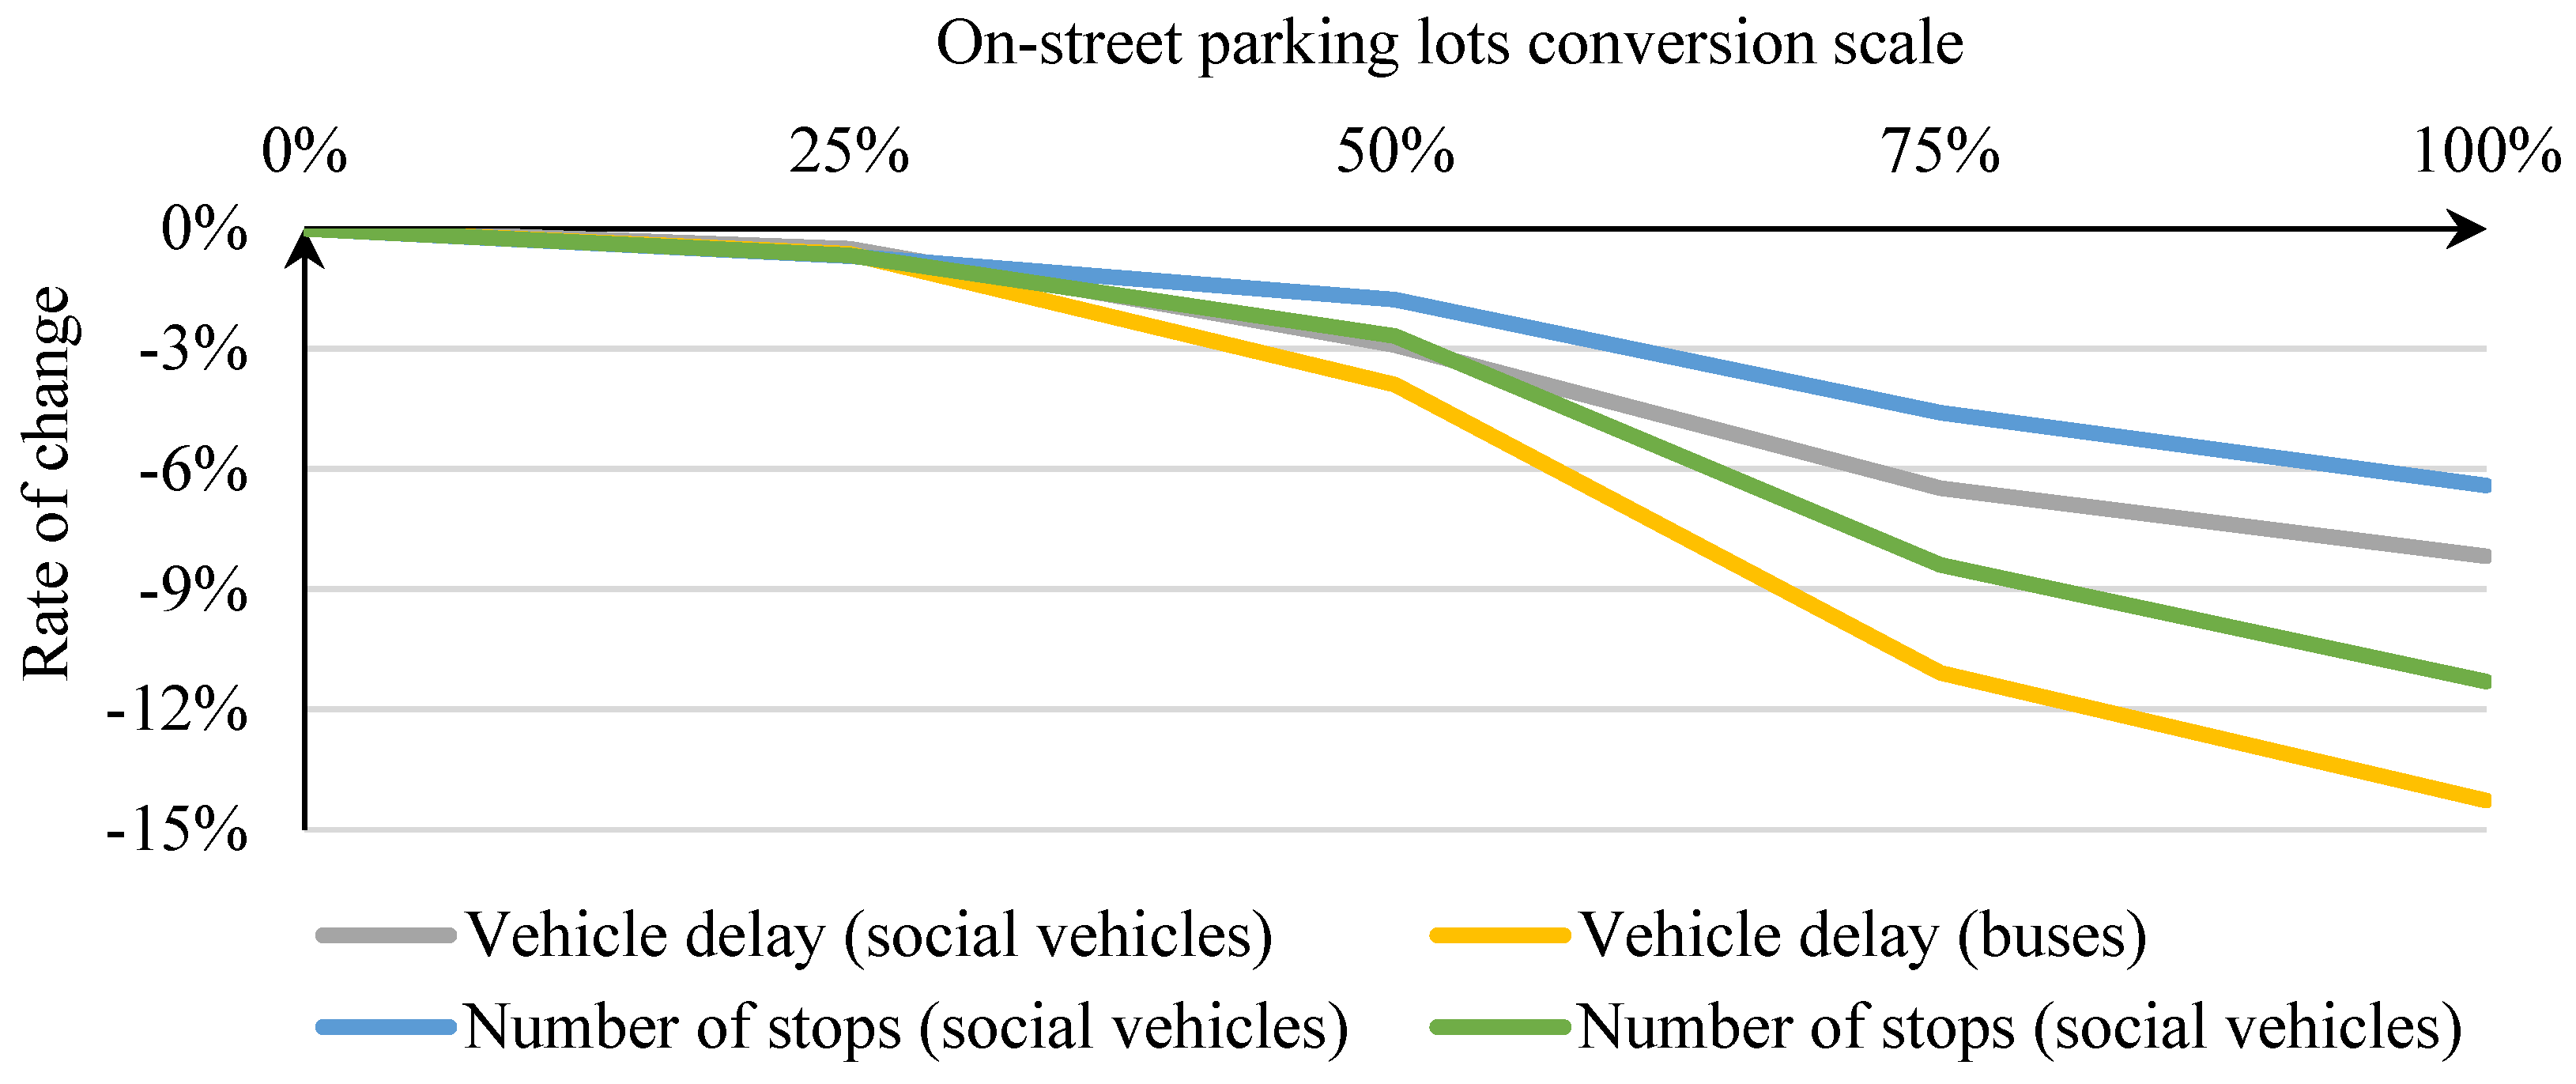
Similar to the impact of the previous analysis, four indicators overall decreased as the proportion of on-street parking lots converted increased. Combined with the analysis of
Table 3,
Figure 15 and
Figure 16, the four indicators of vehicle delay (social vehicles), vehicle delay (buses), number of stops (social vehicles) and number of stops (buses) have been decreasing. When the conversion rate of street parking lots reaches 75%, the impact of the conversion of street parking lots to bus-only lanes begins to weaken. Converting on-street parking lots to bus-only lanes reduces vehicle entry and exit conflicts, reduces vehicle delays, and bus lanes on the road surface form a more continuous network of bus lanes. As a result, the operation efficiency of buses on the road network is effectively improved, and the number of stops and vehicle delays is significantly reduced. It is concluded that the conversion of on-street parking lots has a positive impact on the road network.
5.2. Impact of on-street parking lots conversion behavior on traffic emission
The four indicators of exhaust emissions CO, NOx, VOC and fuel consumption were selected to quantify the environmental impact of the conversion behavior of the on-street parking. VISSIM simulation was used to obtain intersection emission and fuel consumption data. Using the formula between the average speed and the emissions, the total amount of pollution emitted by the road segment and the road network can be obtained. The results are analyzed and compared with the total pollution emissions of road sections and road networks under the condition of different on-street parking lots conversion ratios, and the results are shown in
Table 4. From the table, it can be seen that both pollution emissions and fuel consumption are negatively correlated with the proportion of on-street parking lots conversion, proving that lane changing behavior will reduce traffic pollution.
This paper analyzes the pollution impact of on-street parking lots conversion behavior from three aspects: intersection, road section and overall road network.
5.2.1. Influence of different on-street parking lots conversion ratios on traffic emission at the intersections
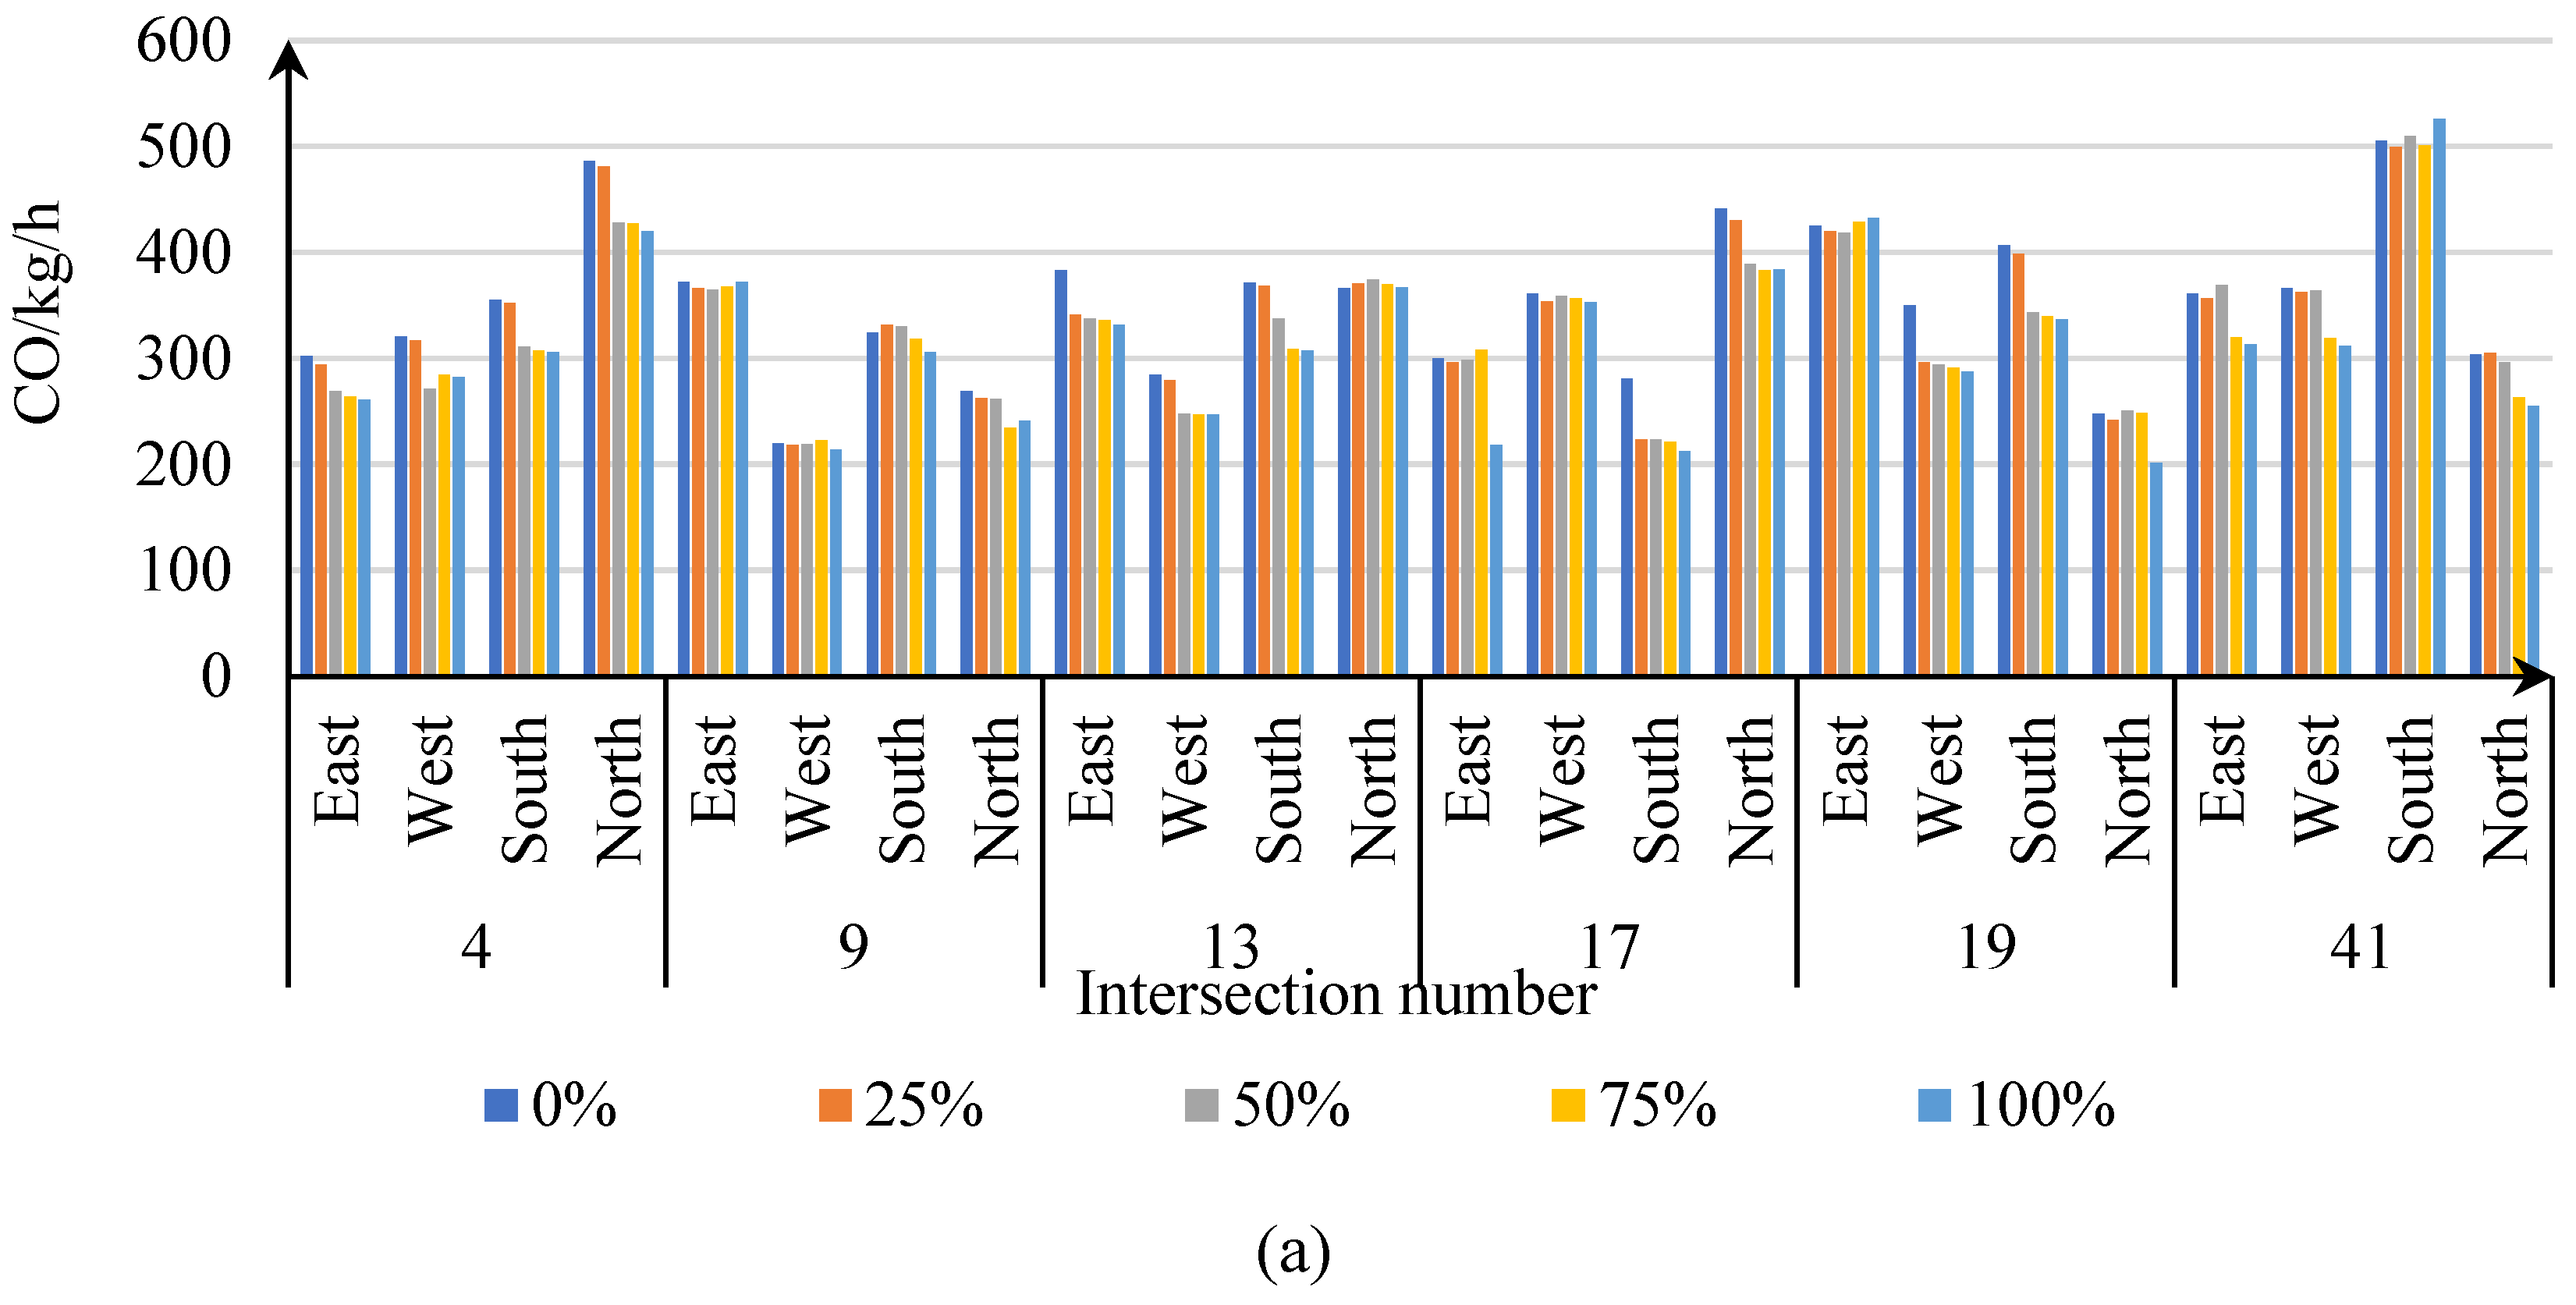
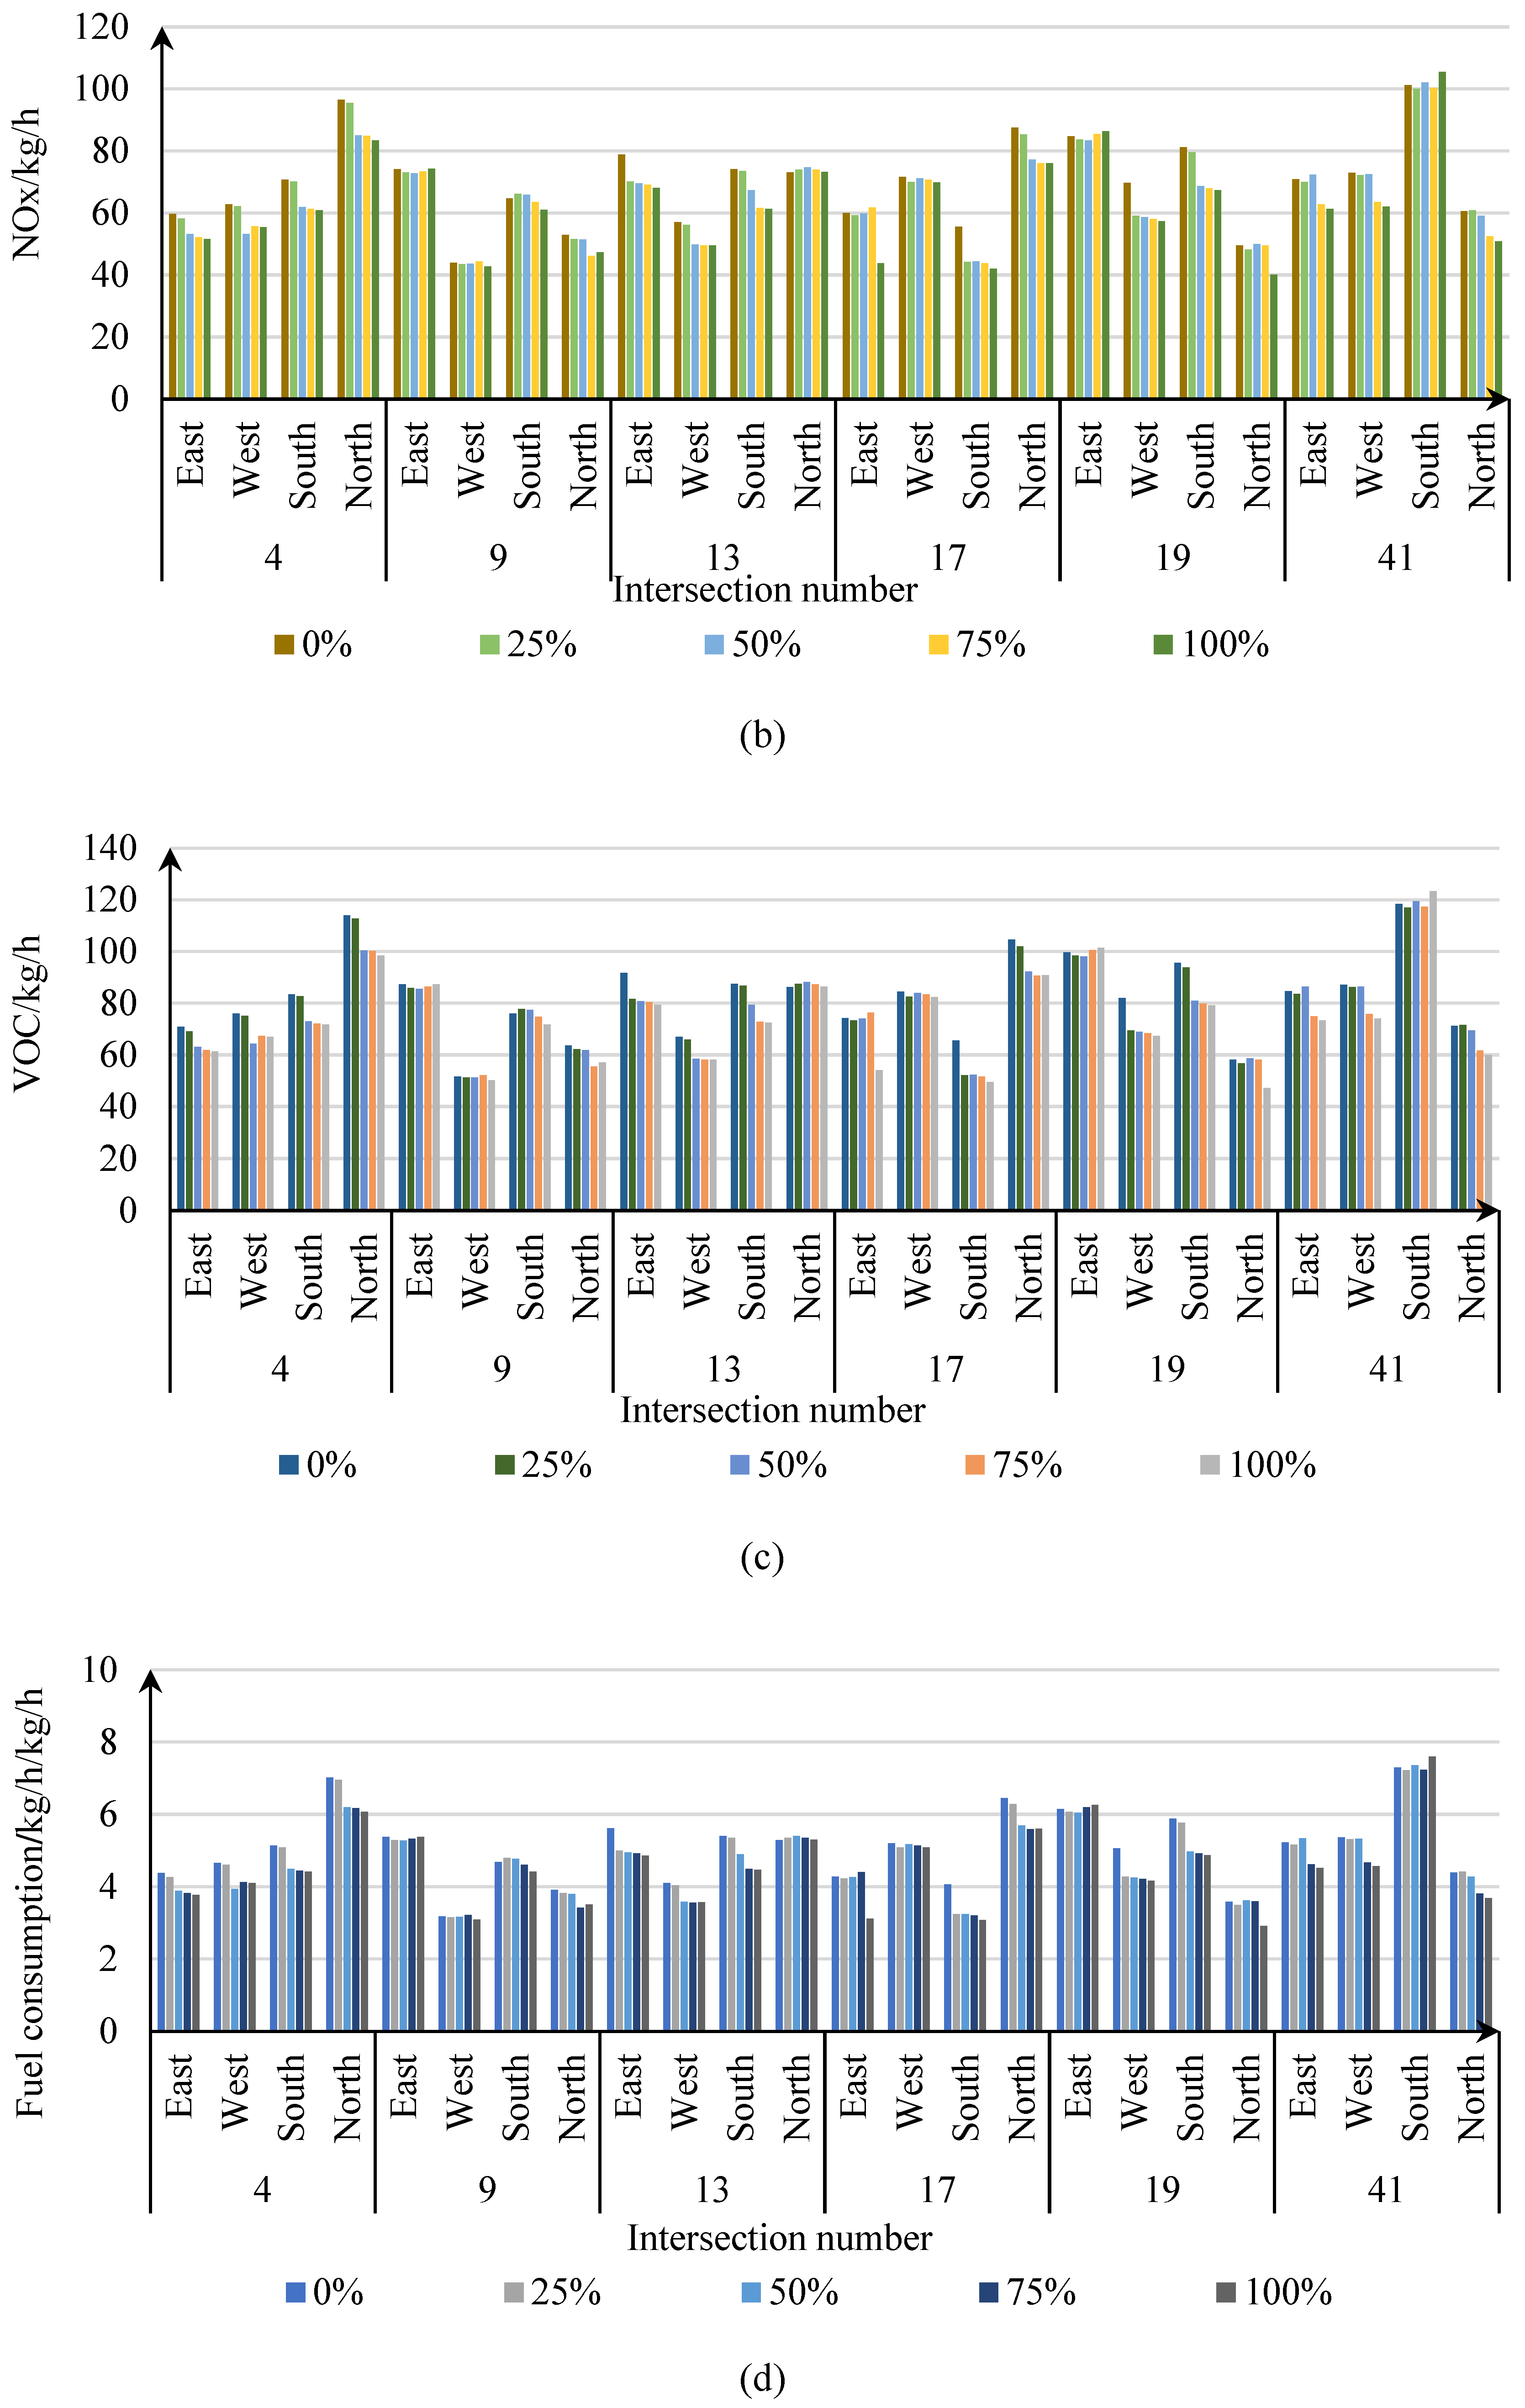
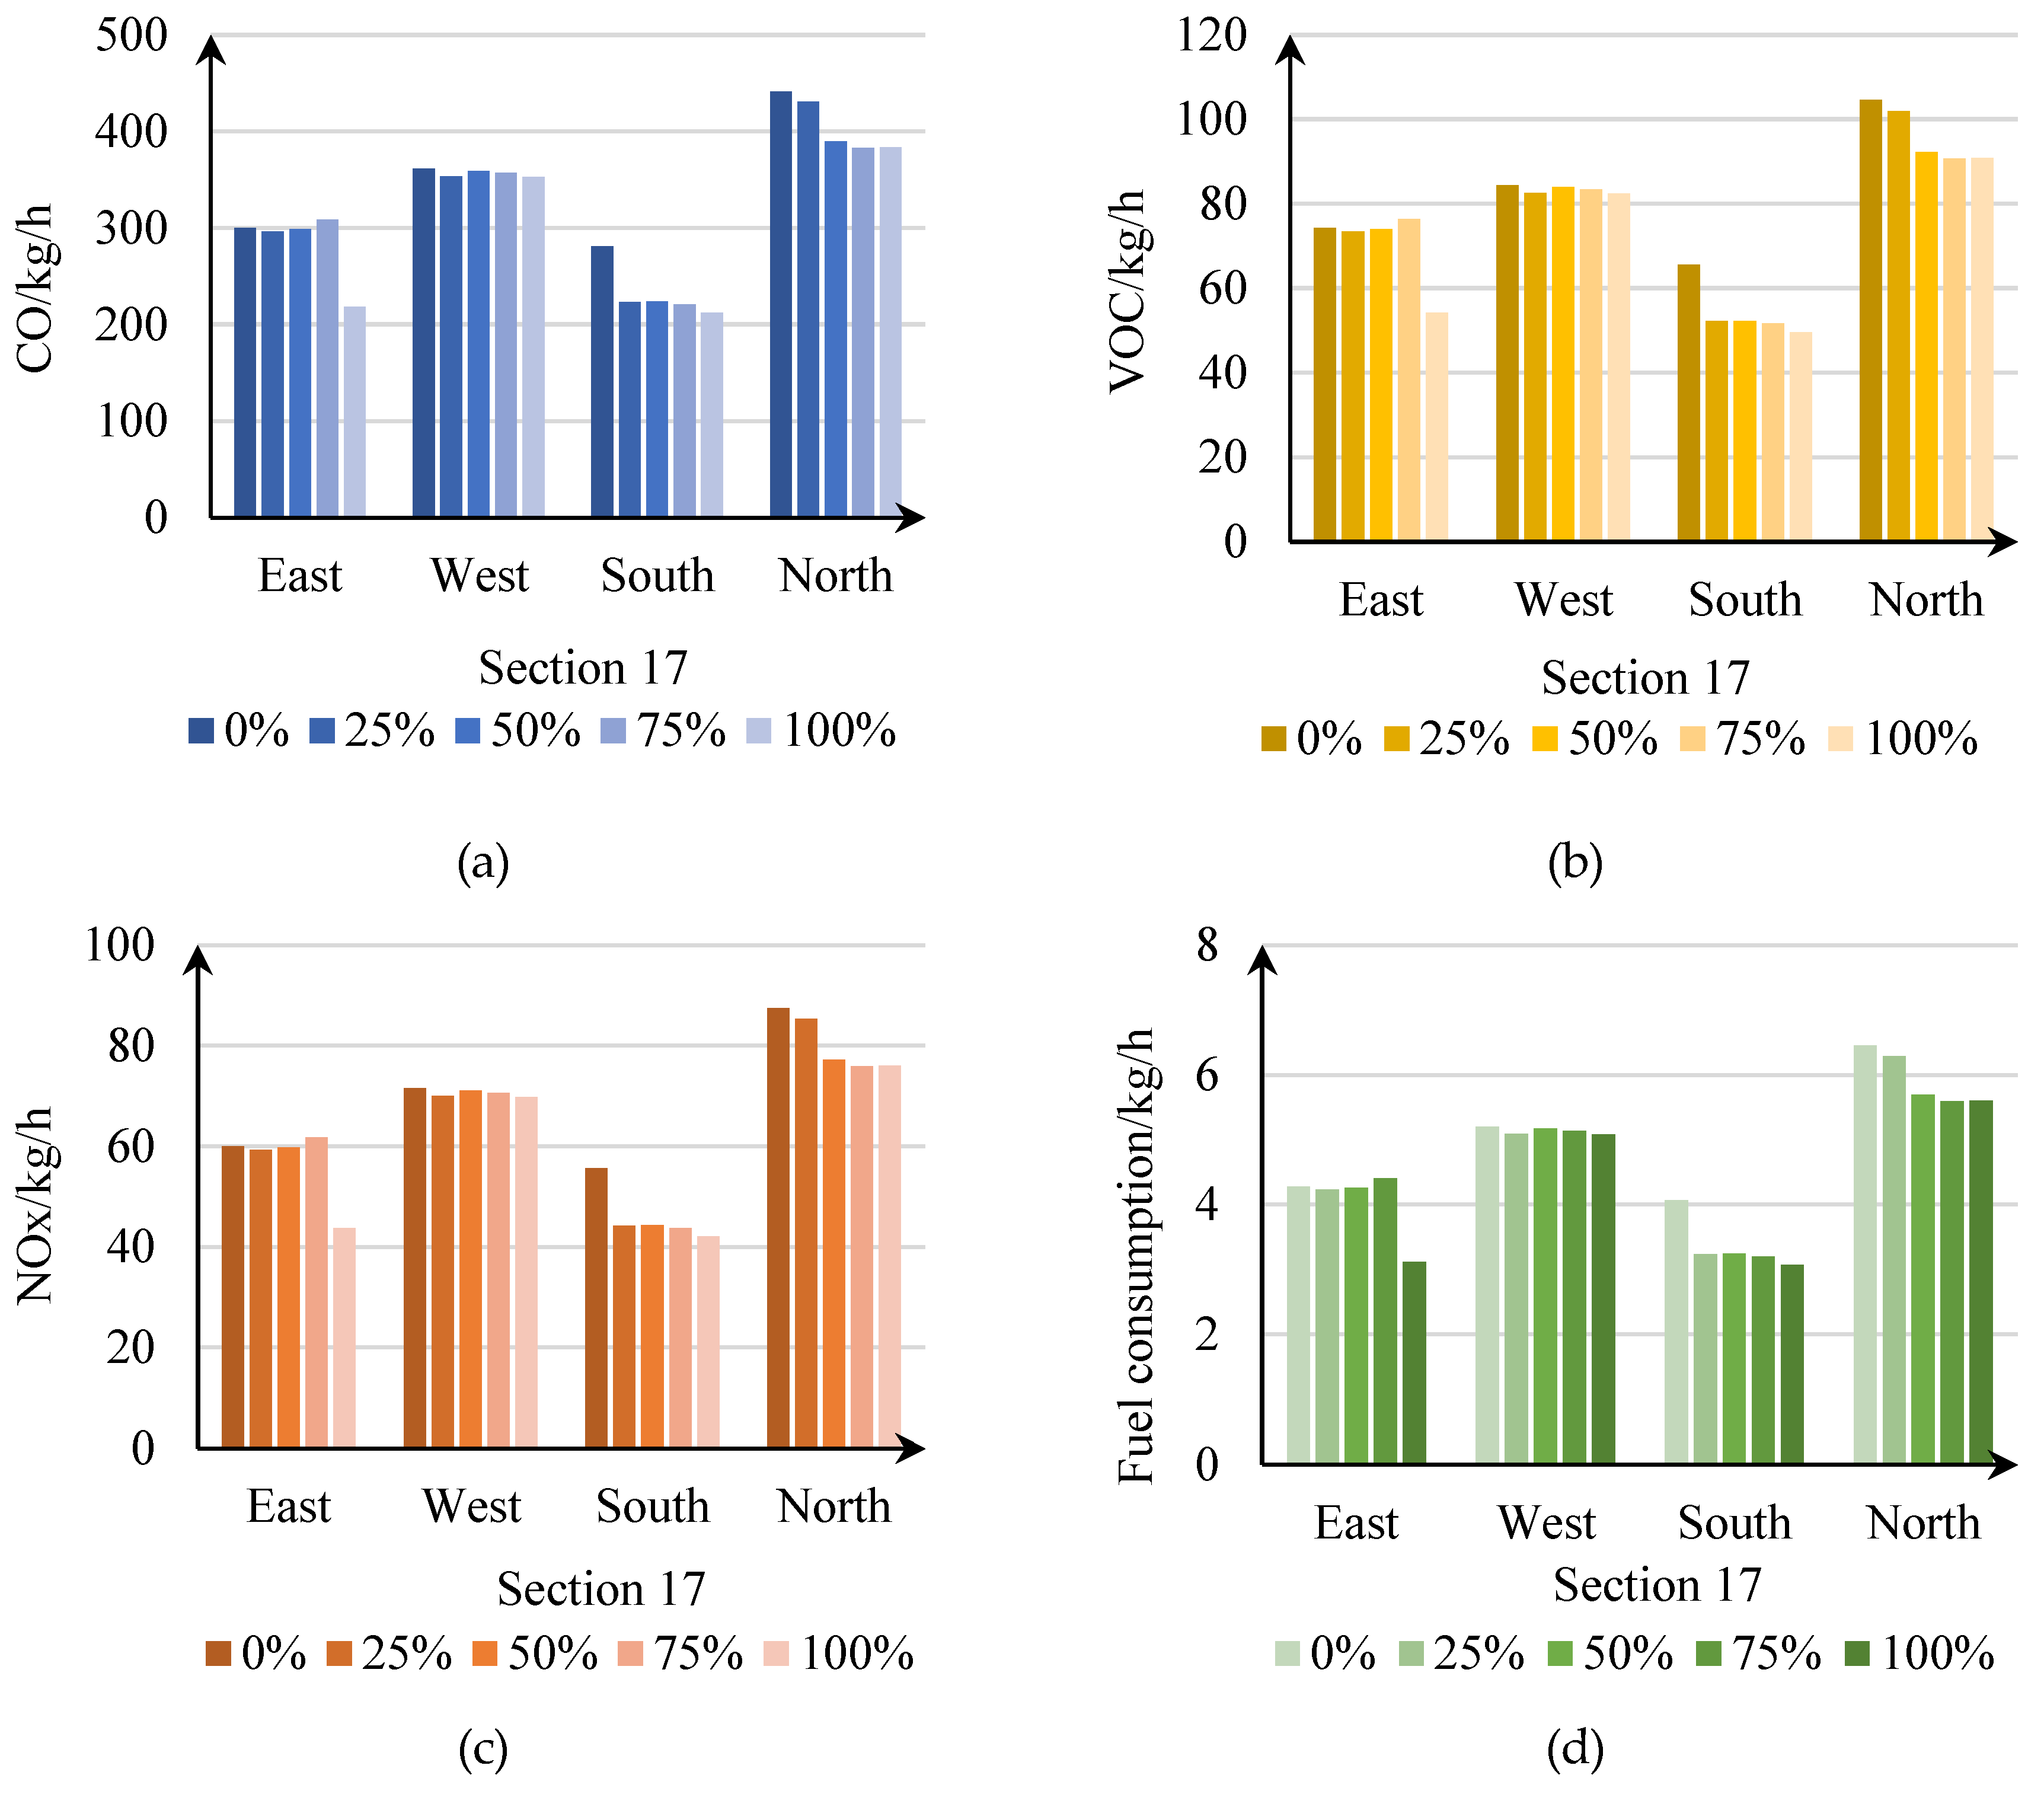
The four indicators of intersection pollution emissions under different on-street parking lots conversion ratios were compared, and the change trends of the four indicators were similar, as shown in
Figure 17. When the vehicle passes through the intersection section, the acceleration and deceleration operation behavior is more than other road sections, and the operating conditions change more frequently, resulting in more exhaust emissions. After the conversion to on-street parking lots, the four types of indicators for intersections that are closer to the intersection (South Entrance at Junction 13, South Entrance at Junction 19, North Exit at Junction 17, etc.) all decrease with the increase in proportion. The reduction rate is significantly higher than at other intersections (East Entrance at Junction 9, North Exit at Junction 13, East Entrance at Junction 19, etc.). Therefore, the conversion of on-street parking lots to bus-only lanes has a more pronounced effect on emissions improvements in the sections closer to the intersection than on other sections.
Taking Section 17 as an example, the four indicators were compared by the proportion of on-street parking strip conversion, as shown in Figure 4.26. As can be seen from the figure, the indicators of the inlet road without the conversion of the on-street parking lots have hardly changed, such as the west entrance. The largest change in the indicators of the import channel at the 100% conversion ratio was the largest. The on-street parking lots converted at the south entrance of intersection 17 is the closest to the intersection, and the length of the on-street parking lots is longer, and the decline rate of its indicators is the largest, and the decline rate of the four indicators (CO, VOC, NOx, fuel consumption) is 24.41%. It proves that intersections with high correlation with on-street parking lots are more affected by lane changes.
5.2.2. Influence of different on-street parking lots conversion ratios on traffic emission on the road sections
From equation 3, the total emissions of the road section are (Shafiei S, 2023):
where:
is the total emission, g/km;
is the average speed, km/h.
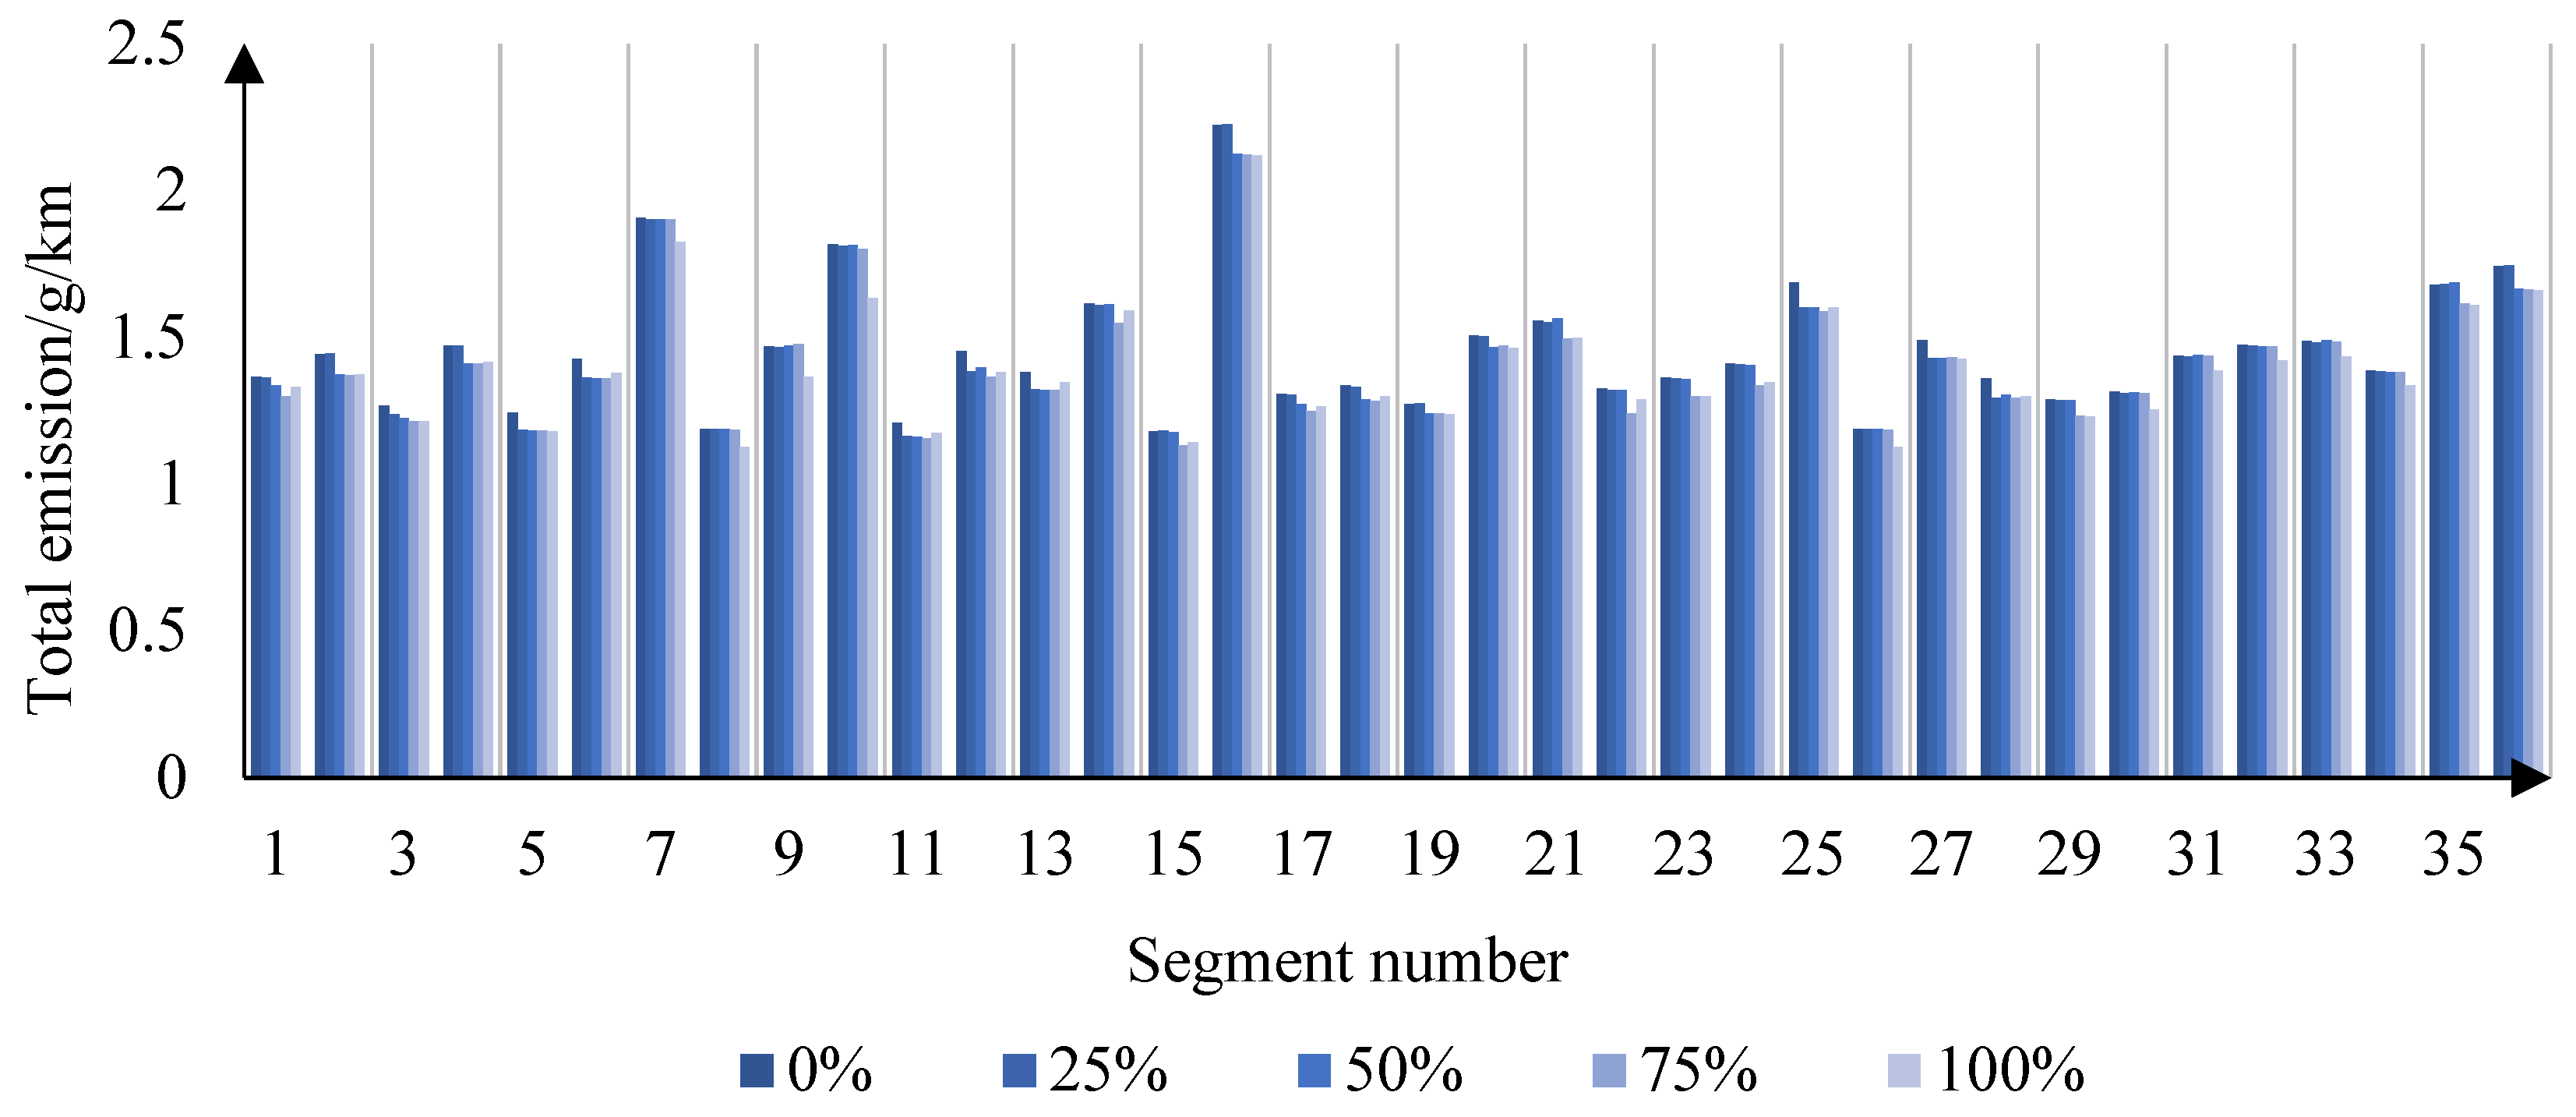
Compared with the total emissions of road sections under different on-street parking belt conversion ratios, the total emissions of road sections shown in
Figure 19 decrease with the increase of the conversion ratio of on-street parking strips. By converting the on-street parking lots into a bus-only lane, the conflict between social vehicles and buses is reduced, and the operating conditions of large exhaust emissions such as sharp acceleration and sharp deceleration are reduced. The results show that the purpose of reducing emission pollution can be achieved after the on-street parking belt is converted into a bus lane, and the effect of improving emissions is best when the conversion ratio of on-street parking lots is 100%.
Among them, the total emission of 9 road sections, as Section and Section 5 decreased significantly under the 75% conversion ratio, and the total emission decreased by 4.82%. In the case of 75% conversion ratio of 9 road sections such as Section 4 and Section 16, the total emission decreased by 4.03%, and although the vehicle speed also decreased under the conversion ratio of 25%, 75% and 100%, the overall change was not much. In the case of 75% conversion ratio for 9 road sections such as Section 4 and Section 16, the total emission decreased by 4.03%. Under the conversion ratio of 25%, 75%, and 100%, although their speed has also decreased, the overall change is not much. The total emissions of 8 road sections, including Section 14 and Section 15, increased by 4.57% when the conversion ratio was 75%. Under the 10 road sections such as Section 7 and Section 8, the total emissions decreased by 5.08% respectively under the 100% conversion ratio.
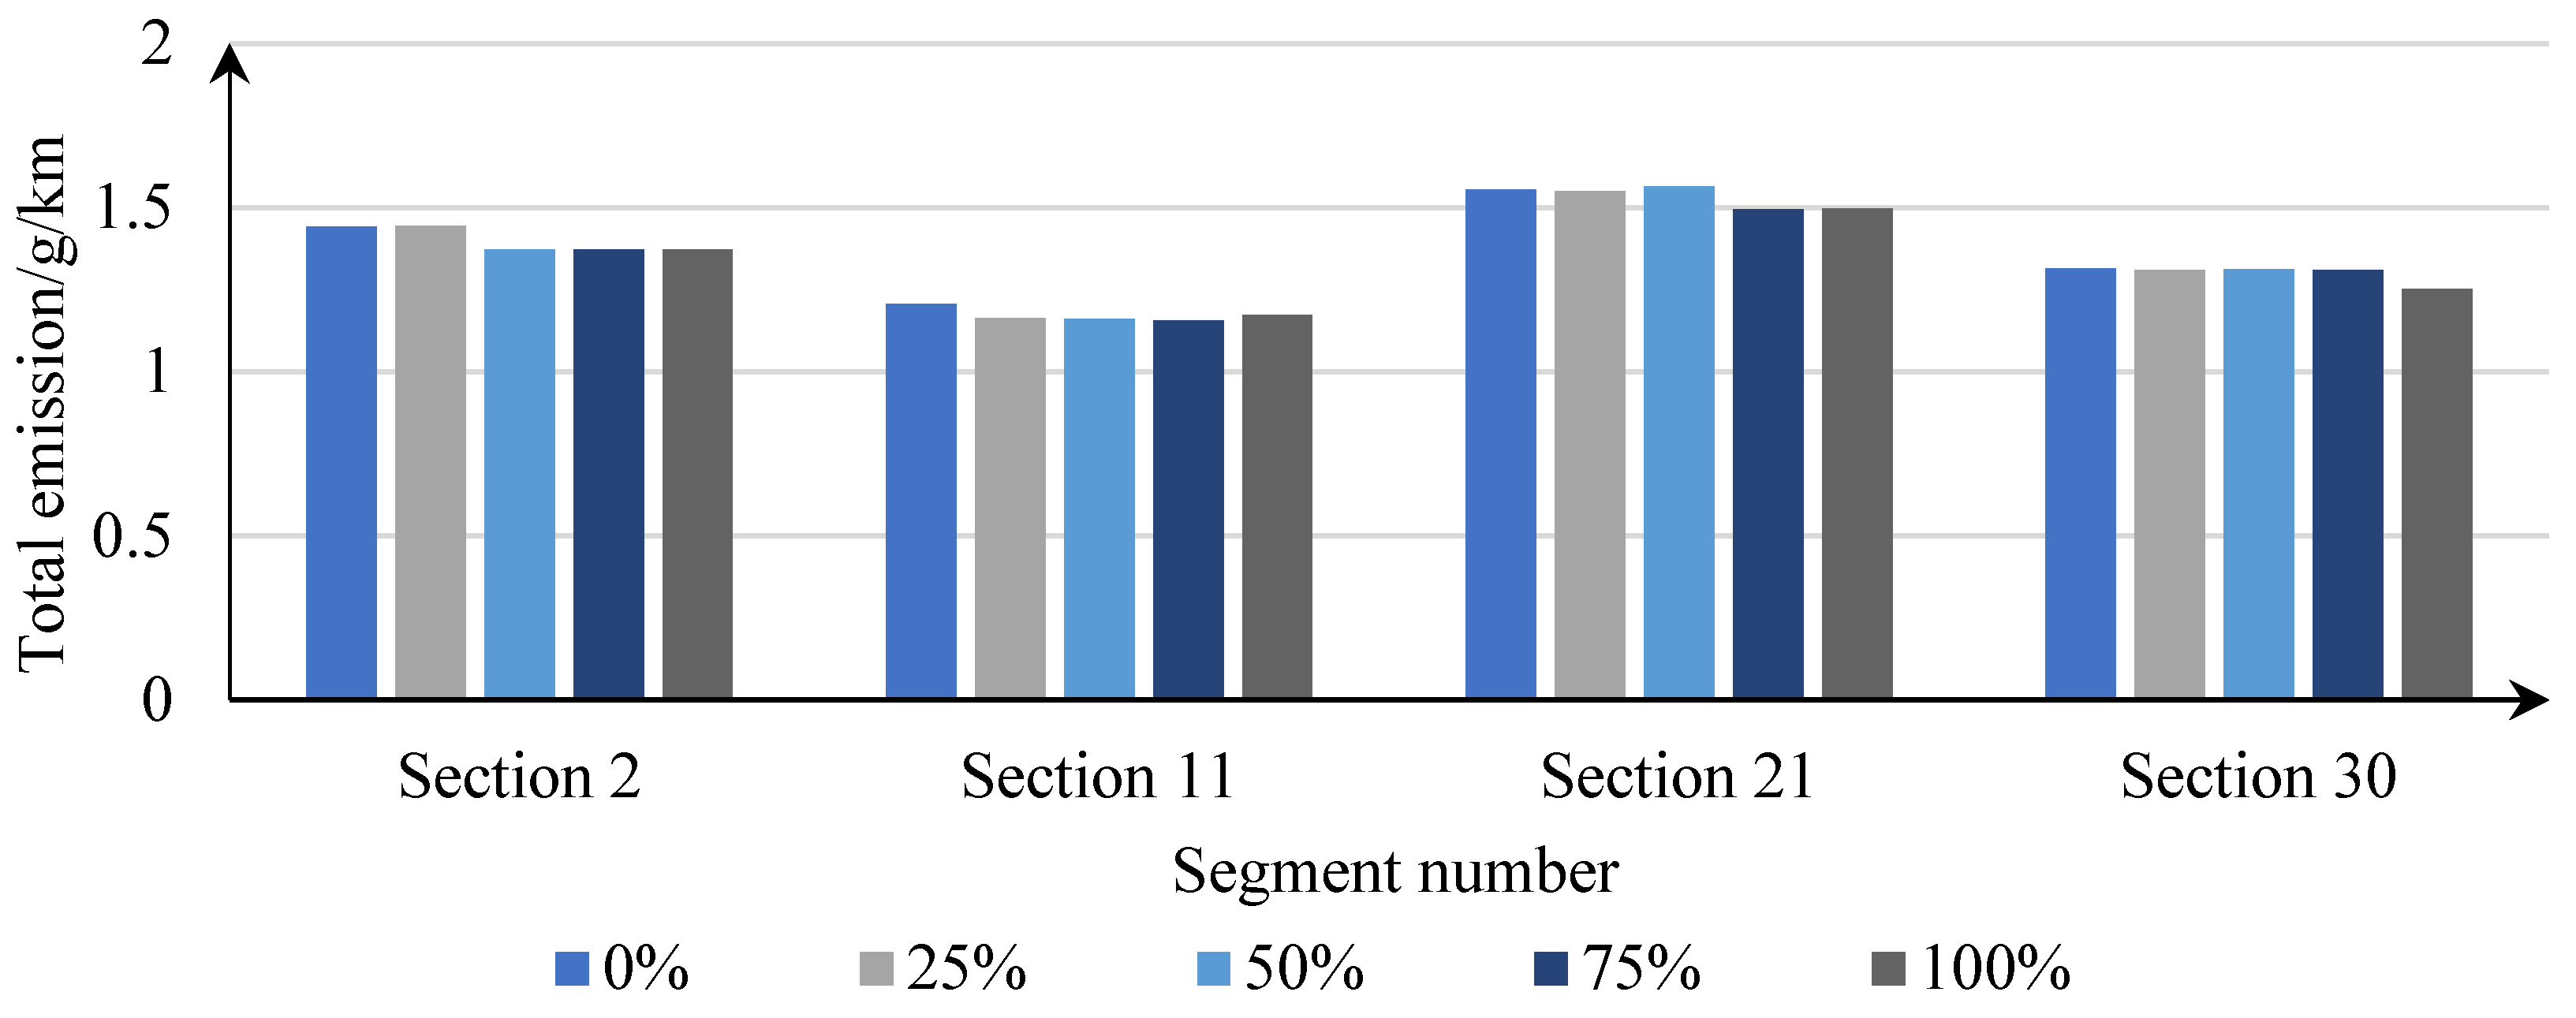
Road Sections 2, 11, 21 and 30 were selected as the reference groups, grouped according to the conversion ratio of roadside parking lots, and the total emission was matched as shown in
Figure 20. The figure shows that the total emission of Section 11 Road decreases with the increase of the proportion of on-street parking lots conversion, and the total emission decreases by 6.15%, 7.26%, 7.37% and 7.64% according to the proportion of on-street parking lots conversion (25%, 50%, 75% and 100%). The total emissions of Section 2 decreased by 8.24% when the proportion of on-street parking lots was converted to 50%, and then decreased by 8.34% and 8.27% respectively with the increase of the conversion ratio. The on-street parking lots on the road section 21 is converted to a bus-only lane when the proportion of the on-street parking strip in the No. 21 section is converted to a bus-only lane, and the total emissions of the road section are reduced by 6.44% after the conversion, and the total emission of the road section is reduced by 6.25% when the conversion ratio is 100%. When the proportion of on-street parking lots in section 30 was converted to 100%, the total emissions decreased by 7.81%. It can be seen that the transformation of on-street parking lots has a significant impact on the road section, and the most significant impact is when the proportion of on-street parking lots converted is 75%.
5.2.3. Influence of different on-street parking lots conversion ratios on traffic emission on the road sections
As shown in
Figure 21, the total emissions of the road network decrease as the proportion of on-street parking lots is converted. When the conversion ratio of on-street parking lots is 25% and 50%, it is reduced by 0.86% and 2.60% respectively compared with the situation without on-street parking lots conversion. The conversion ratio of on-street parking lots was 75%, and at 100%, the total emissions were reduced by 5.03% and 6.38%, respectively, compared with the situation without on-street parking lot conversion. When the proportion of on-street parking strip conversion is 75%, the impact of on-street parking lots conversion behavior begins to weaken, and the total emission decline rate tends to be slow. From the analysis of Figure 4.29, it can be found that the total emission of the entire road network has been significantly improved after the conversion of on-street parking lots, and the effect of reducing vehicle emission pollution has been achieved.
6. Optimization method based on bus-only lane network connectivity
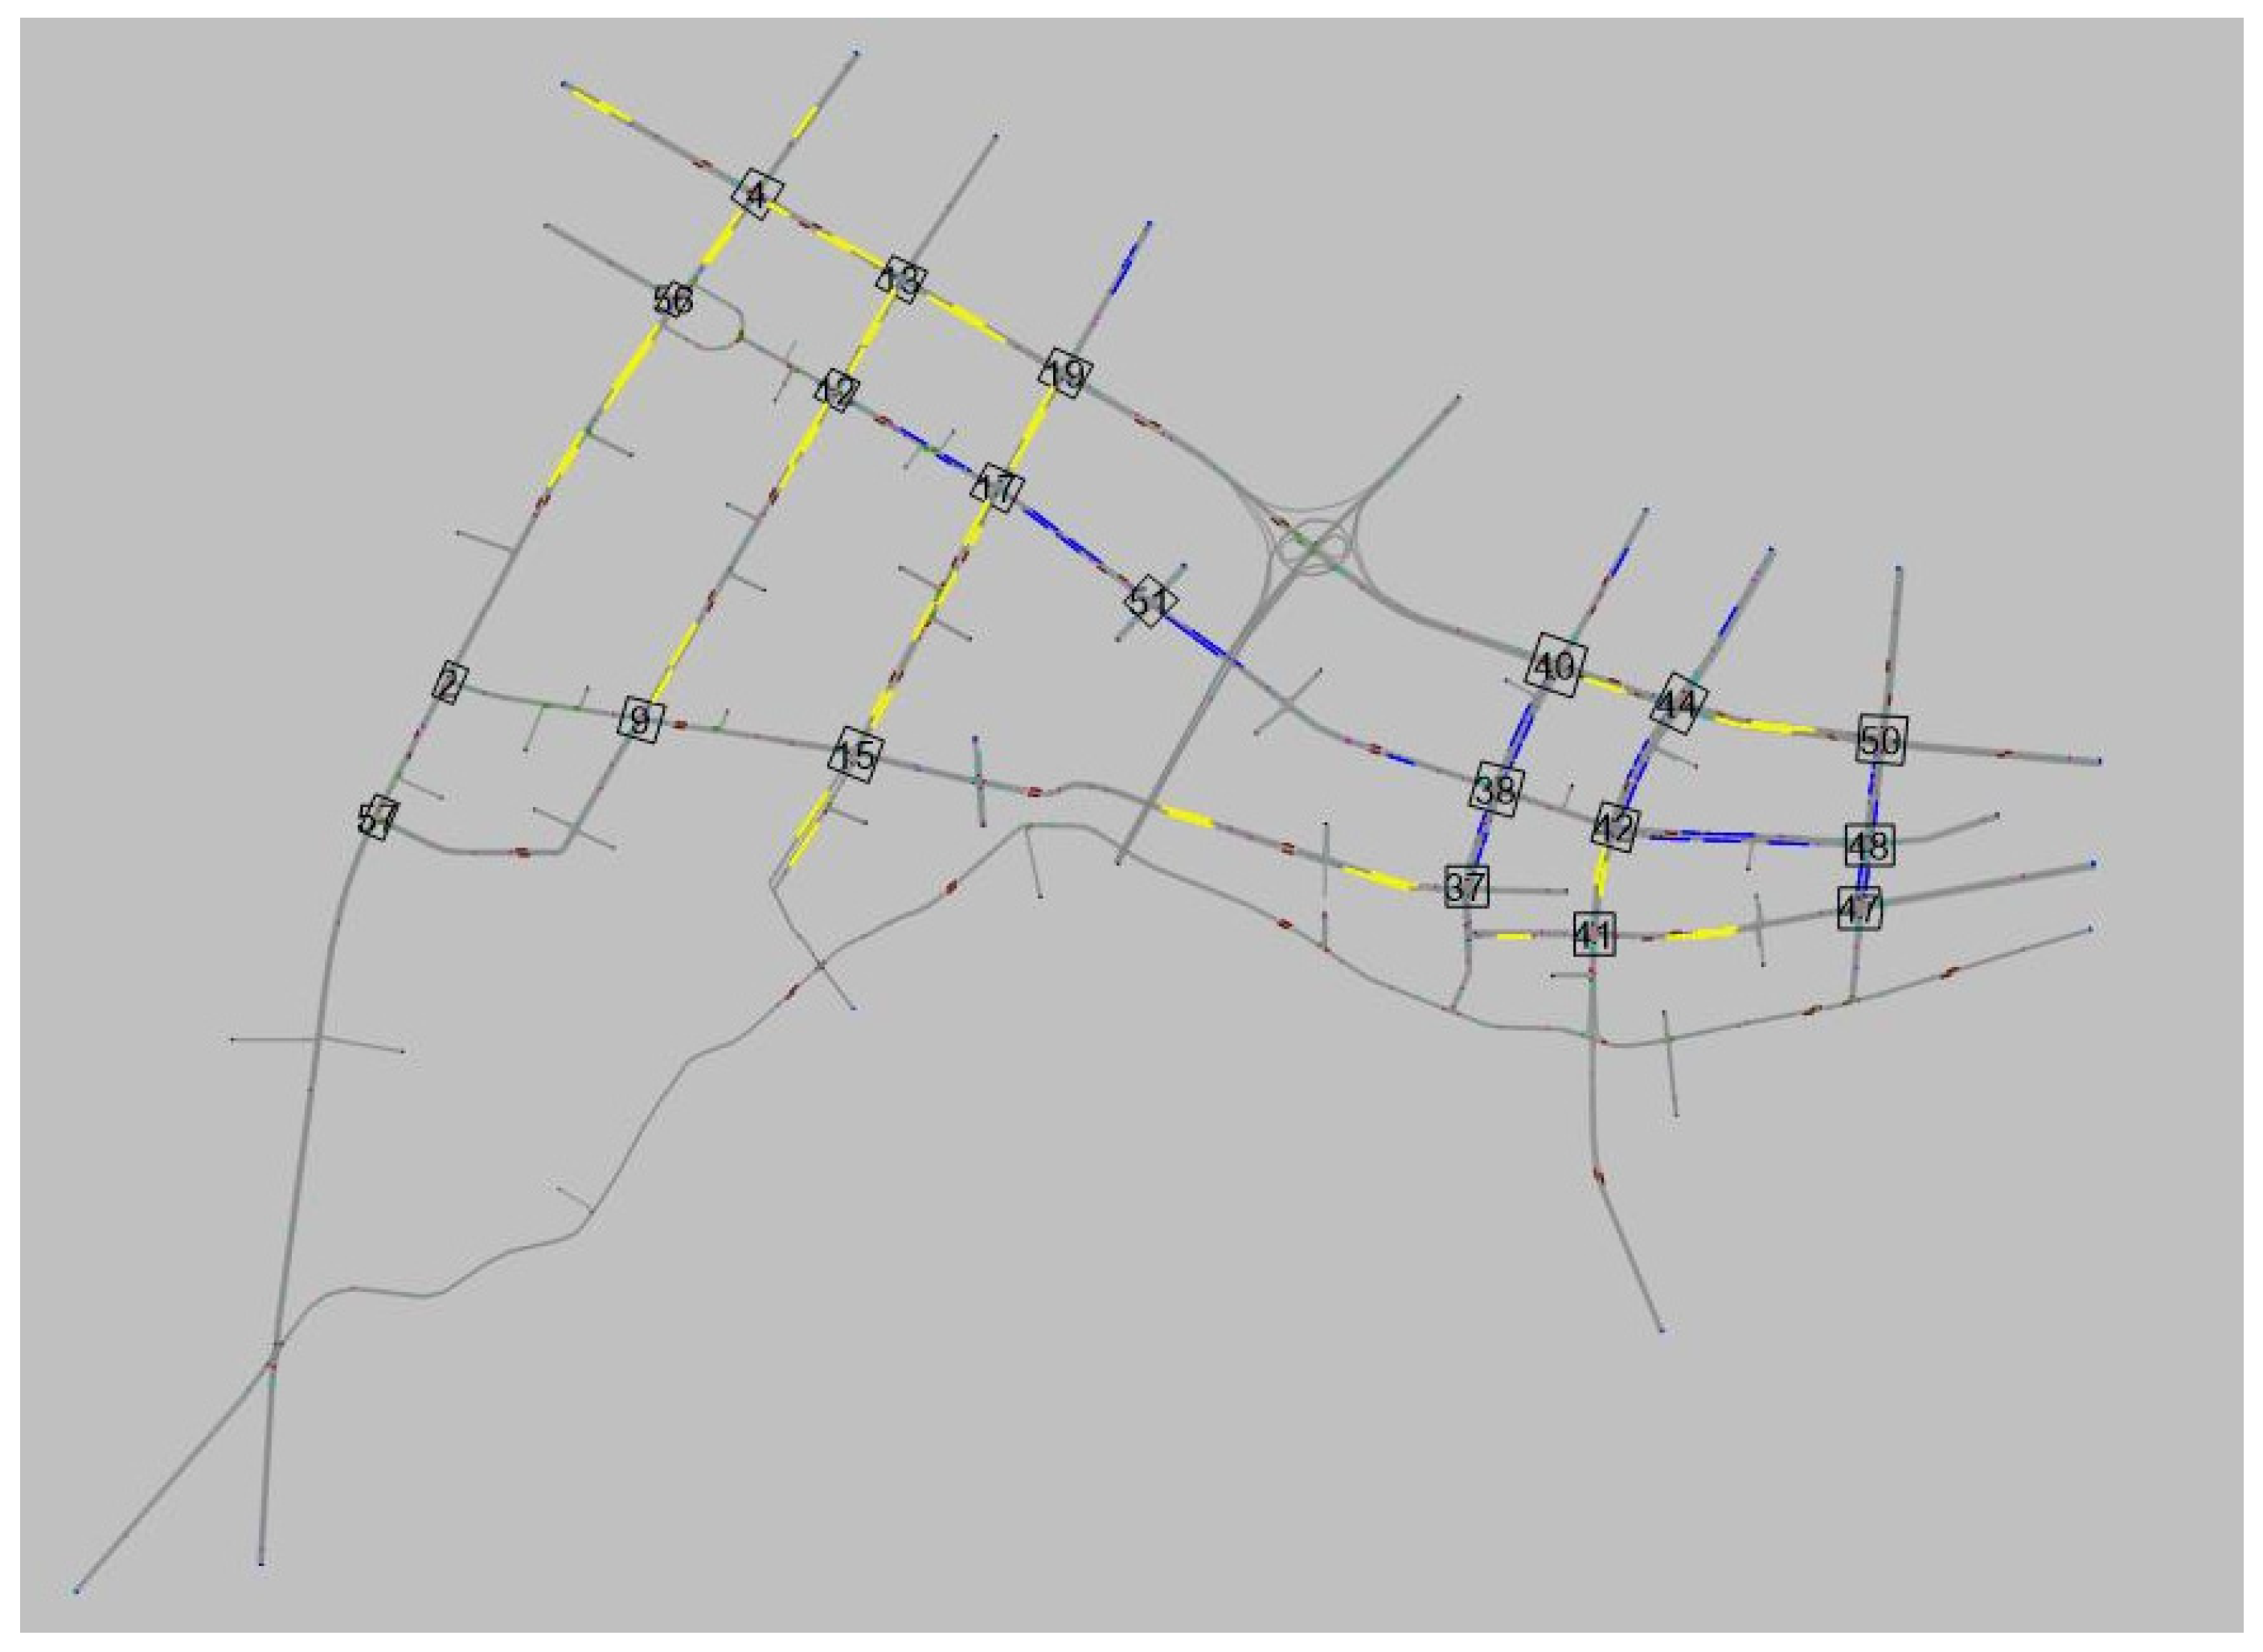
Bus-only lane network connectivity is an indicator used to describe the traffic conditions of bus-only lanes, the shorter the connection distance between bus-only lanes, the faster the average travel speed, the better the network connectivity. Set up bus-only lanes on the road network to open up the connectivity of the bus-only lane network, increase the length of bus-only lanes, and improve the operation efficiency of public transport vehicles. As shown in
Figure 22, there are 44 bus lanes in the road network, and the speed of the bus vehicles in the section where the bus-only lane is located can be obtained according to the collection results of the data collection points.
The main problem of the current on-street parking lots is: because some on-street parking lots are not continuous, the bus lane after conversion to bus-only lane is also intermittent, and the role of the bus-only lane cannot be maximized. Most of the roads that have been converted into bus-only lanes are discrete, and this layout may cause traffic conflicts, causing traffic congestion, so that the effect of bus lanes cannot be fully utilized. It can be seen that the serious conflict points are distributed in Fuchunjiang Road, Yongjiang South Road, Qiantang River Road and other sections, and the lines are complex and staggered, resulting in additional lane changes on the basis of the original buses, thereby aggravating traffic congestion.
As shown in
Figure 23, in order to change the current situation of scattered and fragmented bus lanes, according to the analysis of the main problems of the original bus lanes, an optimization scheme for adding roadside bus lanes is proposed, and the eligible road sections are set as bus lanes.
The results of the optimization scheme are compared with the current results, and the overall comparison results of the traffic impact of the transition behavior of roadside parking strips on the traffic intersection, road section and road network are obtained. The impact of the installation of bus lanes on the intersection is analyzed, including the emission and fuel consumption of the five indicators of the intersection, as shown in
Table 5 and
Table 6.
As can be seen from Tables 5.3 and 5.4, the results of the new bus-only lanes are better than the current results, shortening the queue length, reducing vehicle delays (social vehicles), vehicle delays (buses), parking times (social vehicles), parking times (buses) and total emissions. Taking intersection 4 as an example, the optimization effect of the connectivity optimization scheme for opening up the bus-only lane network is compared and analyzed, and the results are shown in
Figure 23. The optimization effect of the east and west imports of intersection 4 is remarkable. Among them, the queue length of the east entrance was shortened by 6.34%, the maximum queue length was shortened by 8.97%, the average vehicle delay (social vehicles) decreased by 12.37%, the average vehicle delay (bus) decreased by 18.19%, the number of stops (social vehicles) decreased by 11.05%, the number of parking (buses) decreased by 15.49%, and emissions and fuel consumption were reduced by 13.19%. The queue length of the west entrance was shortened by 5.17%, the maximum queue length was shortened by 7.46%, the average vehicle delay (social vehicles) decreased by 11.88%, the average vehicle delay (bus) decreased by 17.97%, the number of stops (social vehicles) decreased by 11.45%, the number of parking (buses) decreased by 13.27%, and emissions and fuel consumption were reduced by 11.08%. After the establishment of the bus lanes of Taishan Road (Dagang 5th Road - Qiantang River Road, Qiantang River Road - Dagang 5th Road), the traffic efficiency of the east and west entrances of the intersection has been significantly improved. Tailpipe emissions and fuel consumption have also been reduced, with a positive impact on the environmental impact.
Figure 24.
Optimization comparison of No. 4 intersection.
Figure 24.
Optimization comparison of No. 4 intersection.
As can be seen from
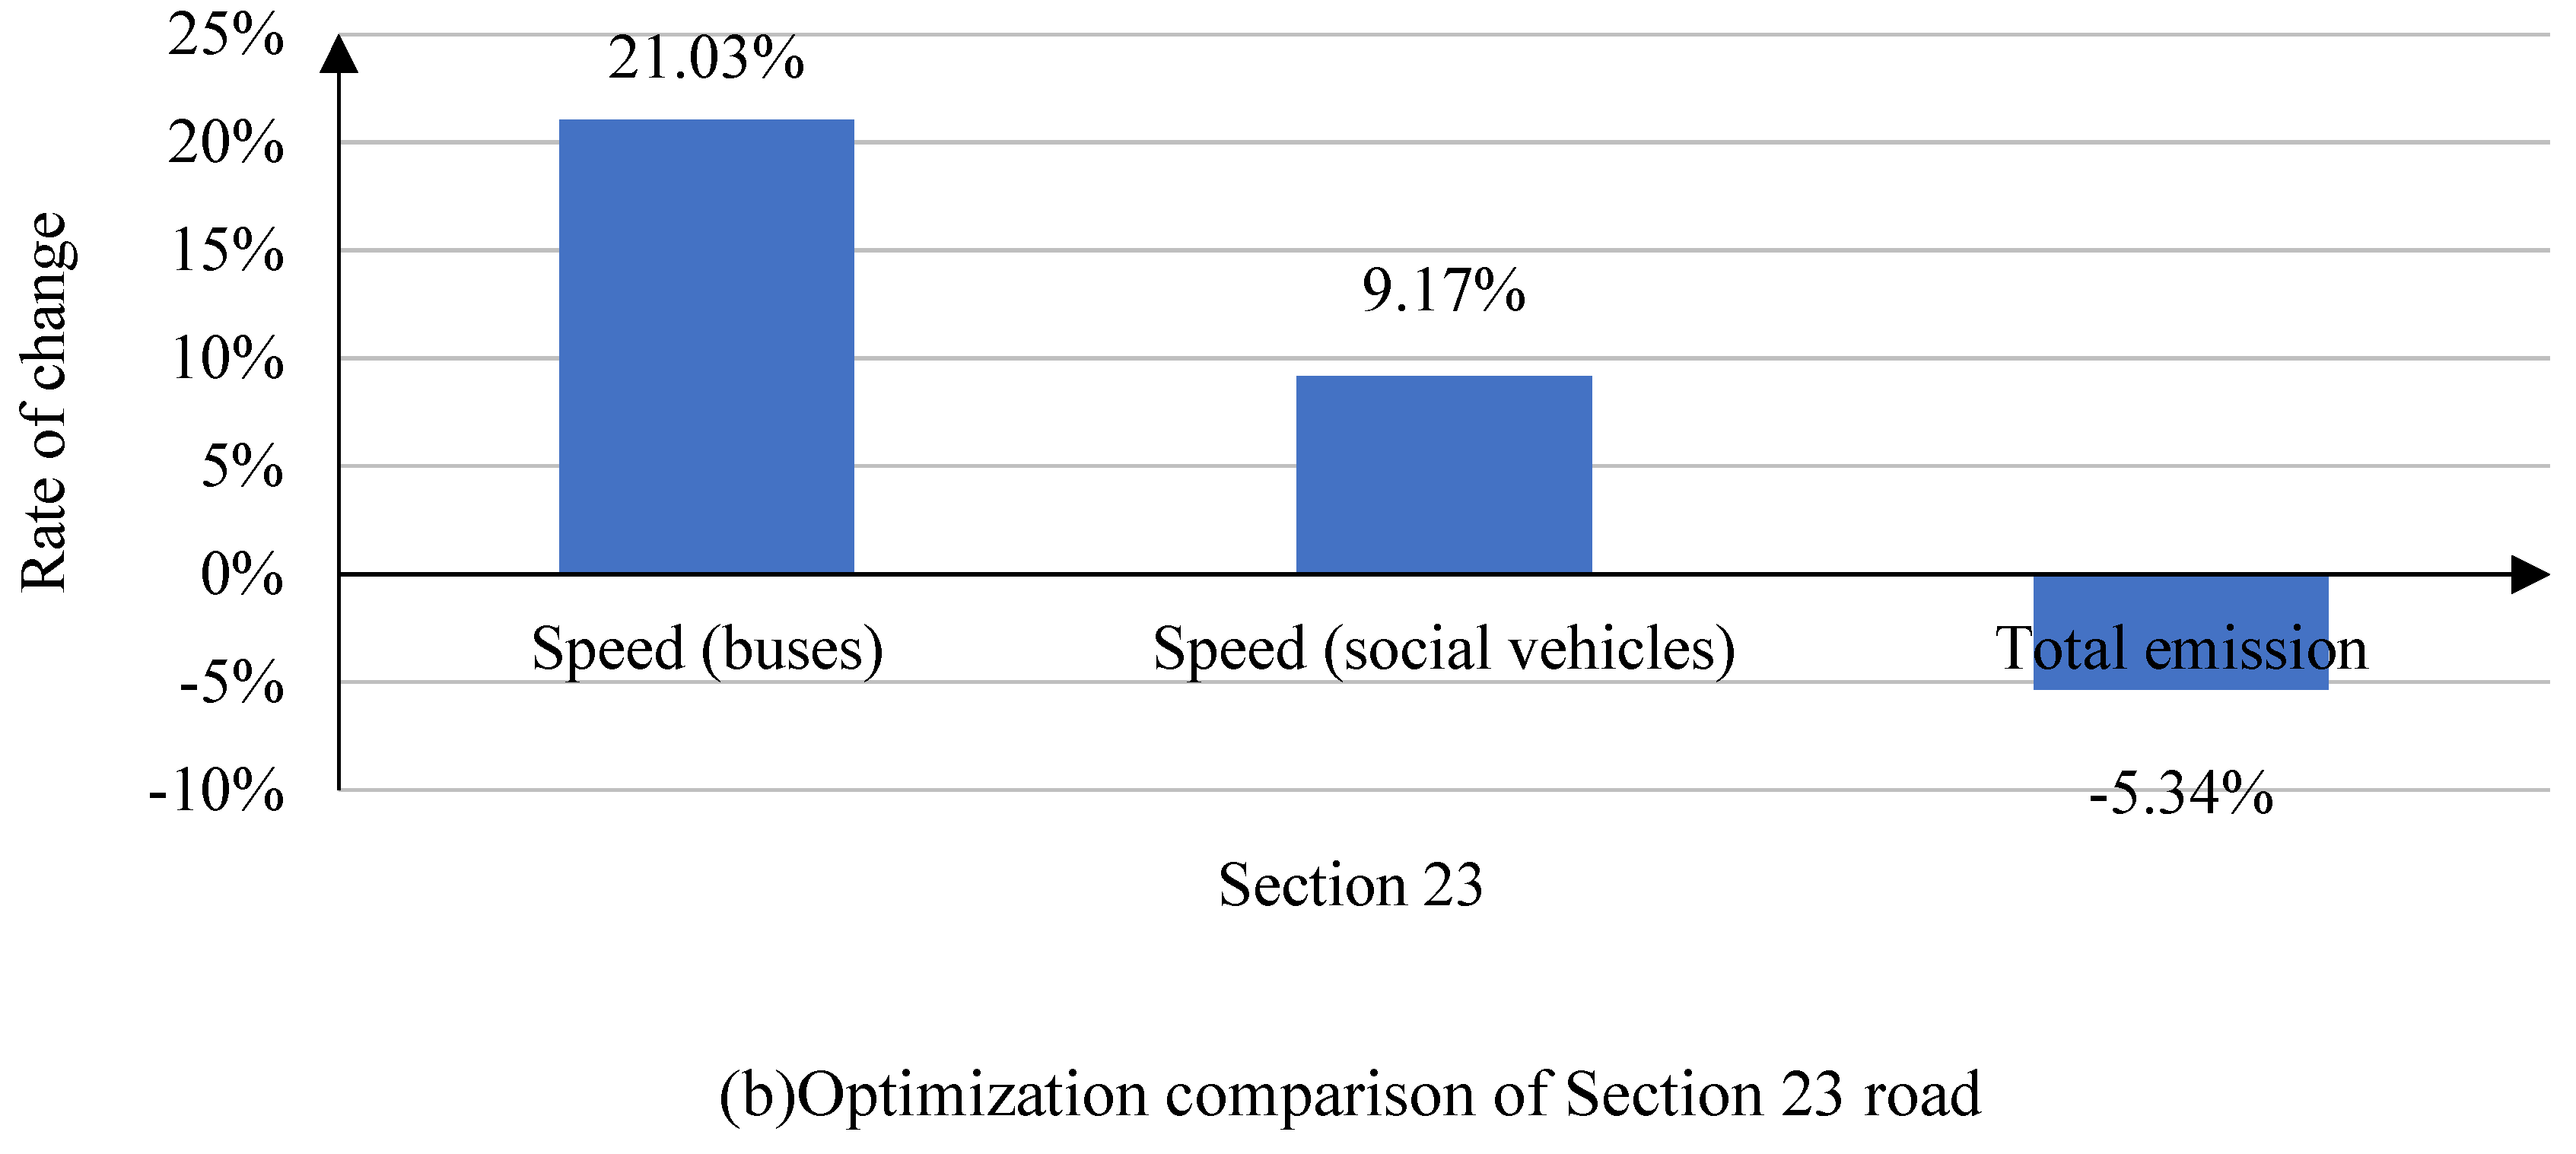
Table 7, the results after setting up bus-only lanes are better than the current results, and the speed (social vehicles) and vehicle speed (buses) have increased, with growth rates of 4.05% and 10.23%, respectively. Total emissions have declined, at a rate of 2.45%. In order to analyze the degree of optimization of bus-only lane setting in more depth, Sections 3 and 23 were selected for analysis, and the comparison results are shown in Figure 24. In the figure, the speed of road No. 1 (social vehicles) increased by 9.44%, the speed (bus) increased by 24.58%, and the total emissions decreased by 6.98%. The speed (social vehicles) of Road 23 increased by 9.17%, the speed (buses) increased by 21.03%, and the total emissions decreased by 5.34%, and the overall road conditions were improved, and the driving speed increased significantly. The speed and exhaust fuel consumption of the road network are compared, as shown in
Table 8.
Figure 24.
Road section optimization comparison.
Figure 24.
Road section optimization comparison.
From the comparison of road network results, it can be obtained that the optimized vehicle delay (social vehicle), vehicle delay (bus), parking number (social vehicle), parking number (bus), vehicle speed (social vehicle), vehicle speed (bus) and total emission are all improved compared with the current situation. It can be concluded that the improved scheme has a positive effect on the efficiency of bus operation.
7. Discussion and Conclusions
In this study, a parking test using GPS and cameras was used to collect data from the vehicle, and traffic flow footage was used to measure the traffic conditions of normal vehicles. A microscopic simulation framework based on VISSIM is proposed to evaluate the operation status of social vehicles and buses after on-street parking lots is converted into a bus-only lane. Model calibration was performed using GPS and video data. The scenarios under different on-street parking lots conversion ratios were analyzed, and the impacts on traffic efficiency and emissions of road sections, intersections and networks were quantitatively analyzed. Finally, optimization methods based on bus lane network connectivity are discussed to maximize the impact of roadside parking lots converted to bus-only lanes. The results show that: (1) After the conversion of on-street parking lots, the traffic operation efficiency of social vehicles and cars is improved to different degrees. Among them, the positive impact of buses is more significant, improving the efficiency of traffic operation, so it is feasible to convert the on-street parking lots into a bus lane. The impact of on-street parking lots conversion behavior on the road network begins to weaken when the proportion of on-street parking lots conversion is 75%. When the proportion of roadside parking lots converted was 100%, the speed of the road network (social vehicles) and vehicle speed (buses) increased by 10.40% and 21.03% respectively, vehicle delays (social vehicles) and vehicle delays (buses) decreased by 8.17% and 14.27%, and the number of stops (social vehicles) and parking times (buses) decreased by 6.40% and 11.31% respectively.(2) Emissions and fuel consumption at intersections decrease with the increase in the proportion of on-street parking lots conversions. The total amount of emissions is negatively correlated with vehicle speed, and the total emissions of road sections and road networks gradually decrease as the proportion of roadside parking lots is converted. Under the 100% conversion ratio, the average total emission change rate of the road section was the largest, reducing by 4.12%, and under the 50% conversion ratio, the average total emission change rate of the road network was the largest, reducing by 2.88%.(3) Setting up bus-only lanes in the road network can improve the connectivity of the bus-only lane network, increase the length of the bus-only lane, improve the operational efficiency of public transport vehicles, and reduce emission pollution and fuel consumption. The impact on road sections and road networks was significant, among which the speed (social vehicles) and vehicle speed (buses) of road sections increased, with growth rates of 4.05% and 10.23%, respectively. Total emissions have declined, at a rate of 2.45%.
Author Contributions
Conceptualization, X.Y. (Xiaofei Ye), X.S. and T.W.; methodology, X.Y. (Xiaofei Ye) and X.S.; software, X.Y. (Xiaofei Ye); validation, X.Y. (Xiaofei Ye) and X.S.; formal analysis, X.Y. (Xiaofei Ye) and X.S.; investigation, X.S.; resources, X.Y. (Xiaofei Ye) and T.W.; data curation, X.Y. (Xiaofei Ye) and X.S.; writing—original draft preparation, X.Y. (Xiaofei Ye); writing—review and Editing, X.S.; visualization, X.Y. (Xiaofei Ye); supervision, X.Y. (Xiaofei Ye), J.C., X.Y. (Xingchen Yan), B.R. and T.W.; project administration, X.Y. (Xiaofei Ye); funding acquisition, X.Y. (Xiaofei Ye). All authors have read and agreed to the published version of the manuscript.
Funding
This research was supported by the projects of the Natural Science Foundation of Zhejiang Province, China (no. LY20E080011), the National Natural Science Foundation of China (nos. 71971059, 71701108, and 71861006), the National Key Research and Development Program of China—Traffic Modeling, Surveillance, and Control with Connected and Automated Vehicles (2017YFE9134700), the Natural Science Foundation of Jiangsu Province, China (no. BK20180775), the Natural Science Foundation of Guangxi Province 2020 (no. GXNSFAA159153), and the Basic public welfare research project of Zhejiang Province 2018 (LGF18E090005).
Data availability
The data used to support the findings of this study are available from the corresponding author upon request.
Acknowledgments
The authors thank their mentors who provided instruction on writing this paper and the participants for their assistance in the survey.
Conflicts of Interest
The authors declare no conflict of interest.
References
- Fagnant D J, Kockelman K M. (2014). The travel and environmental implications of shared autonomous vehicles, using agent-based model scenarios[J]. Transportation Research Part C: Emerging Technologies, 40:1-13. [CrossRef]
- Zhang W, Guhathakurta S, Khalil E B. (2018). The impact of private autonomous vehicles on vehicle ownership and unoccupied VMT generation[J]. Transportation Research Part C: Emerging Technologies, 90:156-165. [CrossRef]
- Gruel W, Stanford J M. (2016). Assessing the long-term effects of autonomous vehicles: a speculative approach[J]. Transportation research procedia, 13:18-29. [CrossRef]
- Childress S, Nichols B, Charlton B, et al. (2015). Using an Activity-Based Model to Explore the Potential Impacts of Automated Vehicles[J]. Transportation Research Record Journal of the Transportation Research Board, 2493: 99-106. [CrossRef]
- Zakharenko R. (2016). Self-driving cars will change cities[J]. Regional science and urban economics, 61:26-37. [CrossRef]
- Fagnant D J, Kockelman K M. (2015). Preparing a nation for autonomous vehicles: opportunities, barriers and policy recommendations[J]. Transportation Research Part A: Policy and Practice, 77: 167-181. [CrossRef]
- Bischoff J, Maciejewski M. (2016). Simulation of city-wide replacement of private cars with autonomous taxis in Berlin[J]. Procedia Computer Science, 83:237-244. [CrossRef]
- Zhang W. (2017). The interaction between land use and transportation in the era of shared autonomous vehicles: A simulation model[D]. Georgia Institute of Technology.
- Martinez L M, Viegas J M. (2017). Assessing the impacts of deploying a shared self-driving urban mobility system:An agent- based model applied to the city of Lisbon, Portugal[J]. International Journal of Transportation Science and Technology, 6(1):13-27. [CrossRef]
- Zhang W, Guhathakurta S. (2017). Parking Spaces in the Age of Shared Autonomous Vehicles: How Much Parking Will We Need and Where? [J]. Transportation Research Record Journal of the Transportation Research Board, 2651:80-91. [CrossRef]
- Zhang W, Guhathakurta S, Fang J, et al. (2015). Exploring the impact of shared autonomous vehicles on urban parking demand: An agent-based simulation approach[J]. Sustainable cities and society, 19: 34-45. [CrossRef]
- Jean-Pierre Orfeuil,Mireille Apel-Muller,Zhu Y Y. (2018). Autonomous driving and future urban development [J]. Shanghai Urban Planning, (02):11-17.
- Yao X, Wang G, Yang C. (2019). Research on the scale of autonomous driving and sharing vehicles in future cities:A case study of Shanghai[J].Journal of Transportation Systems Engineering and Information, 19(06):85-91.
- Estepa R, Estepa A, Wideberg J, et al. (2017). More effective use of urban space by autonomous double parking[J]. Journal of Advanced Transportation, (01): 1-10. [CrossRef]
- Nourinejad M, Bahrami S, Roorda M J. (2018). Designing parking facilities for autonomous vehicles[J]. Transportation Research Part B: Methodological, 109:110-127. [CrossRef]
- Hayes B. (2011). Leave the driving to it[J]. American Scientist, 99(5):362. [CrossRef]
- Ferreira M, Damas L, D'Orey P M, et al. (2014). Self-automated parking lots for autonomous vehicles based on vehicular ad hoc networking[C]. IEEE Intelligent Vehicles Symposium. IEEE. [CrossRef]
- Riggs, W.W., Boswell M R, Ross R. (2016). Streetplan: hacking streetmix for community-based outreach on the future of streets[J]. Focus, 13(1):14.
- Riggs W W. (2017). Modeling Future Street Options in an AV Future Using Restreet[J]. Selected Works University of San Francisco. 36-41.
- Zhang X. (2018). New technology and countermeasures of future urban transportation[J]. Urban Architecture, (30):18-22.
- Li H H, Hu W J, Wang F. (2020). A preliminary study on the change of on-street parking space in the mode of shared travel[J]. Urban Architecture, 17(13):139-143.
- Martinez L, Crist P. (2015). Urban Mobility System Upgrade–How shared self-driving cars could change city traffic[C]. International transport forum, Paris. 14:24.
- Townsend A. (2014). Re-programming mobility: The digital transformation of transportation in the United States[J]. Rudin Center for Transportation Policy and Management: New York, NY, USA, 60(15),21-26.
- Pernestål Brenden A, Kristoffersson I, Mattsson L G. (2017). Future scenarios for self-driving vehicles in Sweden[J]. 43(21), 105-110.
- Riggs W, Ruhl M, Rodier C, et al. (2019). Designing streets for autonomous vehicles[C]. Road Vehicle Automation 6 6. Springer International Publishing, 111-122. [CrossRef]
- Riggs W, Appleyard B, Johnson M. (2020). A design framework for livable streets in the era of autonomous vehicles[J]. Urban, Planning and Transport Research, 8(1):125-137. [CrossRef]
- Schlossberg M, Millard-Ball A, Shay E, et al. (2020). Rethinking the street in an era of driverless cars[J]. 15(4):59-64.
- Stead D, Vaddadi B. (2019). Automated vehicles and how they may affect urban form: A review of recent scenario studies[J]. Cities, 92:125-133. [CrossRef]
- Zhai S Y. (2018) Traffic and environmental benefit assessment of unmanned vehicles based on micro-simulation[D]. Shenzhen University.
- Shafiei S, Gu Z, Grzybowska H, et al. (2023). Impact of self-parking autonomous vehicles on urban traffic congestion[J]. Transportation, 50(1):183-203. [CrossRef]
Figure 1.
Simulation area selection.
Figure 1.
Simulation area selection.
Figure 2.
Schematic diagram of expected speed settings for three types of vehicles.
Figure 2.
Schematic diagram of expected speed settings for three types of vehicles.
Figure 3.
Schematic diagram of expected acceleration settings for three types of vehicles.
Figure 3.
Schematic diagram of expected acceleration settings for three types of vehicles.
Figure 4.
VISSIM road network model diagram.
Figure 4.
VISSIM road network model diagram.
Figure 5.
Comparison of Maximum queue length.
Figure 5.
Comparison of Maximum queue length.
Figure 6.
Comparison of Queue length.
Figure 6.
Comparison of Queue length.
Figure 7.
Comparison of Vehicle delay (social vehicles).
Figure 7.
Comparison of Vehicle delay (social vehicles).
Figure 8.
Comparison of Vehicle delay (buses).
Figure 8.
Comparison of Vehicle delay (buses).
Figure 9.
Comparison of parking number (social vehicles).
Figure 9.
Comparison of parking number (social vehicles).
Figure 10.
Comparison of parking number (buses).
Figure 10.
Comparison of parking number (buses).
Figure 11.
Comparison of six indicators at intersection No. 17.
Figure 11.
Comparison of six indicators at intersection No. 17.
Figure 12.
Speed comparison.
Figure 12.
Speed comparison.
Figure 13.
Speed comparison of 4 road sections.
Figure 13.
Speed comparison of 4 road sections.
Figure 14.
Average road speed comparison.
Figure 14.
Average road speed comparison.
Figure 15.
Comparison of road network overall indicators.
Figure 15.
Comparison of road network overall indicators.
Figure 16.
The rate of change of the overall indicators.
Figure 16.
The rate of change of the overall indicators.
Figure 17.
Comparison of four types of indicators at intersections.
Figure 17.
Comparison of four types of indicators at intersections.
Figure 18.
Comparison of emission indicators at intersection 17.
Figure 18.
Comparison of emission indicators at intersection 17.
Figure 19.
Comparison of total emission standards for road sections.
Figure 19.
Comparison of total emission standards for road sections.
Figure 20.
Comparison of total emission standards for road sections.
Figure 20.
Comparison of total emission standards for road sections.
Figure 21.
Comparison of total emission standards of road network.
Figure 21.
Comparison of total emission standards of road network.
Figure 22.
Existing road network bus-only lanes.
Figure 22.
Existing road network bus-only lanes.
Figure 23.
Optimized road network bus lanes.
Figure 23.
Optimized road network bus lanes.
Table 1.
Driving behavior parameters.
Table 1.
Driving behavior parameters.
| The name of the driving behavior |
Parameters |
Numeric value |
| HVs |
Average parking spacing |
2m |
| Minimum head-to-head distance |
0.5m |
| An additional part of the safety distance |
2m |
| The multiple portion of the safety distance |
3 |
| The duration of mind wandering during the following vehicle |
7s |
| Probability of distraction during following the car |
4.3% |
| Reaction time distribution |
2+0.3s |
| AVs |
Average parking spacing |
1m |
| Minimum head-to-head distance |
0m |
| An additional part of the safety distance |
1.5m |
| The multiple portion of the safety distance |
0 |
| The duration of mind wandering during the following vehicle |
0s |
| Probability of distraction during following the car |
0% |
| Reaction time distribution |
0s |
Table 2.
Various indicators of the conversion ratio of different on-street parking belts.
Table 2.
Various indicators of the conversion ratio of different on-street parking belts.
| On-street parking lots conversion scale |
Queue length /m |
Maximum queue length /m |
Vehicle delay (social vehicles)/s |
Vehicle delay (buses)/s |
Parking number (social vehicles)/time |
Parking number (buses)/time |
| 0% |
52.97 |
174.18 |
69.19 |
24.29 |
1.07 |
0.42 |
| 25% |
51.94 |
168.41 |
67.81 |
23.96 |
1.04 |
0.38 |
| 50% |
50.74 |
160.30 |
65.33 |
22.83 |
1.02 |
0.37 |
| 75% |
49.06 |
153.75 |
62.53 |
21.97 |
1.00 |
0.36 |
| 100% |
48.67 |
152.01 |
61.66 |
21.59 |
0.99 |
0.33 |
Table 3.
The rate of change of the overall indicators.
Table 3.
The rate of change of the overall indicators.
| On-street parking lots conversion scale |
Vehicle delay (social vehicles)/s |
vehicle delay (buses)/s |
Number of stops (social vehicles)/time |
Number of stops (buses)/time |
| 0% |
0.00% |
0.00% |
0.00% |
0.00% |
| 25% |
-0.50% |
-0.63% |
-0.69% |
-0.67% |
| 50% |
-2.90% |
-3.89% |
-1.77% |
-2.68% |
| 75% |
-6.48% |
-11.09% |
-4.59% |
-8.40% |
| 100% |
-8.17% |
-14.27% |
-6.40% |
-11.31% |
Table 4.
Hourly average emissions and fuel consumption comparison table.
Table 4.
Hourly average emissions and fuel consumption comparison table.
| On-street parking lots conversion scale |
CO/kg/h |
NOx/kg/h |
VOC/kg/h |
Fuel consumption/kg/h |
| 0% |
350.12 |
69.71 |
82.56 |
5.07 |
| 25% |
340.29 |
67.74 |
80.24 |
4.93 |
| 50% |
327.79 |
65.26 |
77.30 |
4.75 |
| 75% |
319.52 |
63.62 |
75.35 |
4.63 |
| 100% |
311.88 |
61.60 |
73.51 |
4.52 |
Table 5.
Evaluation of traffic operation efficiency at intersection.
Table 5.
Evaluation of traffic operation efficiency at intersection.
| |
Queue length /m |
Queue length (maximum)/m |
Vehicle delay (social vehicles)/s |
Vehicle delay (buses)/s |
Parking number (social vehicles)/ times |
Parking number (buses)/ times |
| Before optimization |
49.06 |
136.95 |
62.53 |
21.97 |
1.00 |
0.36 |
| After optimization |
48.56 |
134.30 |
61.09 |
21.166 |
0.98 |
0.35 |
Table 6.
Intersection pollution emission evaluation.
Table 6.
Intersection pollution emission evaluation.
| |
CO/kg/h |
NOx /kg/h |
VOC/ kg/h |
Fuel consumption /kg/h |
| Before optimization |
319.52 |
63.62 |
75.35 |
4.63 |
| After optimization |
310.33 |
61.80 |
73.18 |
4.50 |
Table 7.
Road segment results comparison.
Table 7.
Road segment results comparison.
| |
Speed (social vehicles)/km/h |
Speed (buses)/km/h |
Total emissions/g/km |
| Before optimization |
27.28 |
19.23 |
1.37 |
| After optimization |
28.38 |
21.20 |
1.34 |
Table 8.
Comparison of road network results.
Table 8.
Comparison of road network results.
| |
Vehicle delay (social vehicle)/s |
Vehicle delay (buses)/s |
Parking number (social vehicle)/ times |
Parking number (buses)/ times |
Vehicle speed (social vehicle)/km/h |
Vehicle speed (buses)/km/h |
Total emission /g/km |
| Before optimization |
648.05 |
1210.88 |
12.27 |
17.26 |
27.68 |
19.31 |
1.36 |
| After optimization |
589.25 |
1036.45 |
11.49 |
15.19 |
29.04 |
21.13 |
1.32 |
|
Disclaimer/Publisher’s Note: The statements, opinions and data contained in all publications are solely those of the individual author(s) and contributor(s) and not of MDPI and/or the editor(s). MDPI and/or the editor(s) disclaim responsibility for any injury to people or property resulting from any ideas, methods, instructions or products referred to in the content. |
© 2023 by the authors. Licensee MDPI, Basel, Switzerland. This article is an open access article distributed under the terms and conditions of the Creative Commons Attribution (CC BY) license (http://creativecommons.org/licenses/by/4.0/).


