Submitted:
26 May 2023
Posted:
29 May 2023
You are already at the latest version
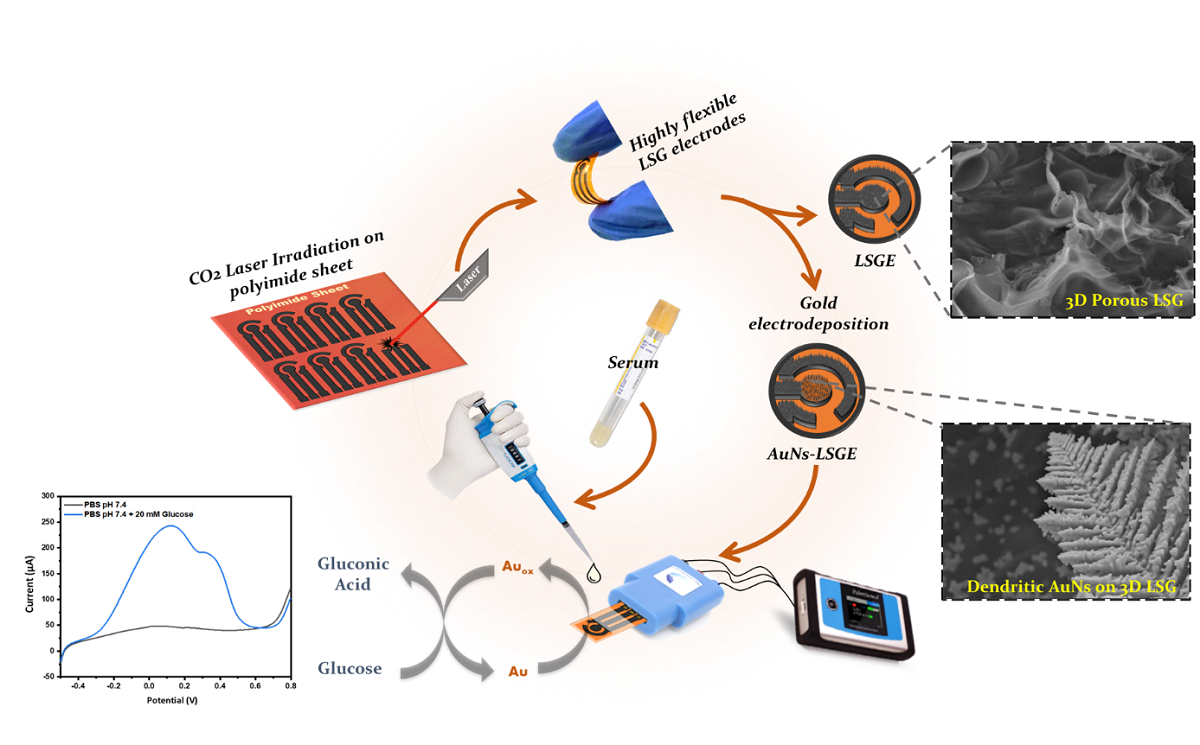
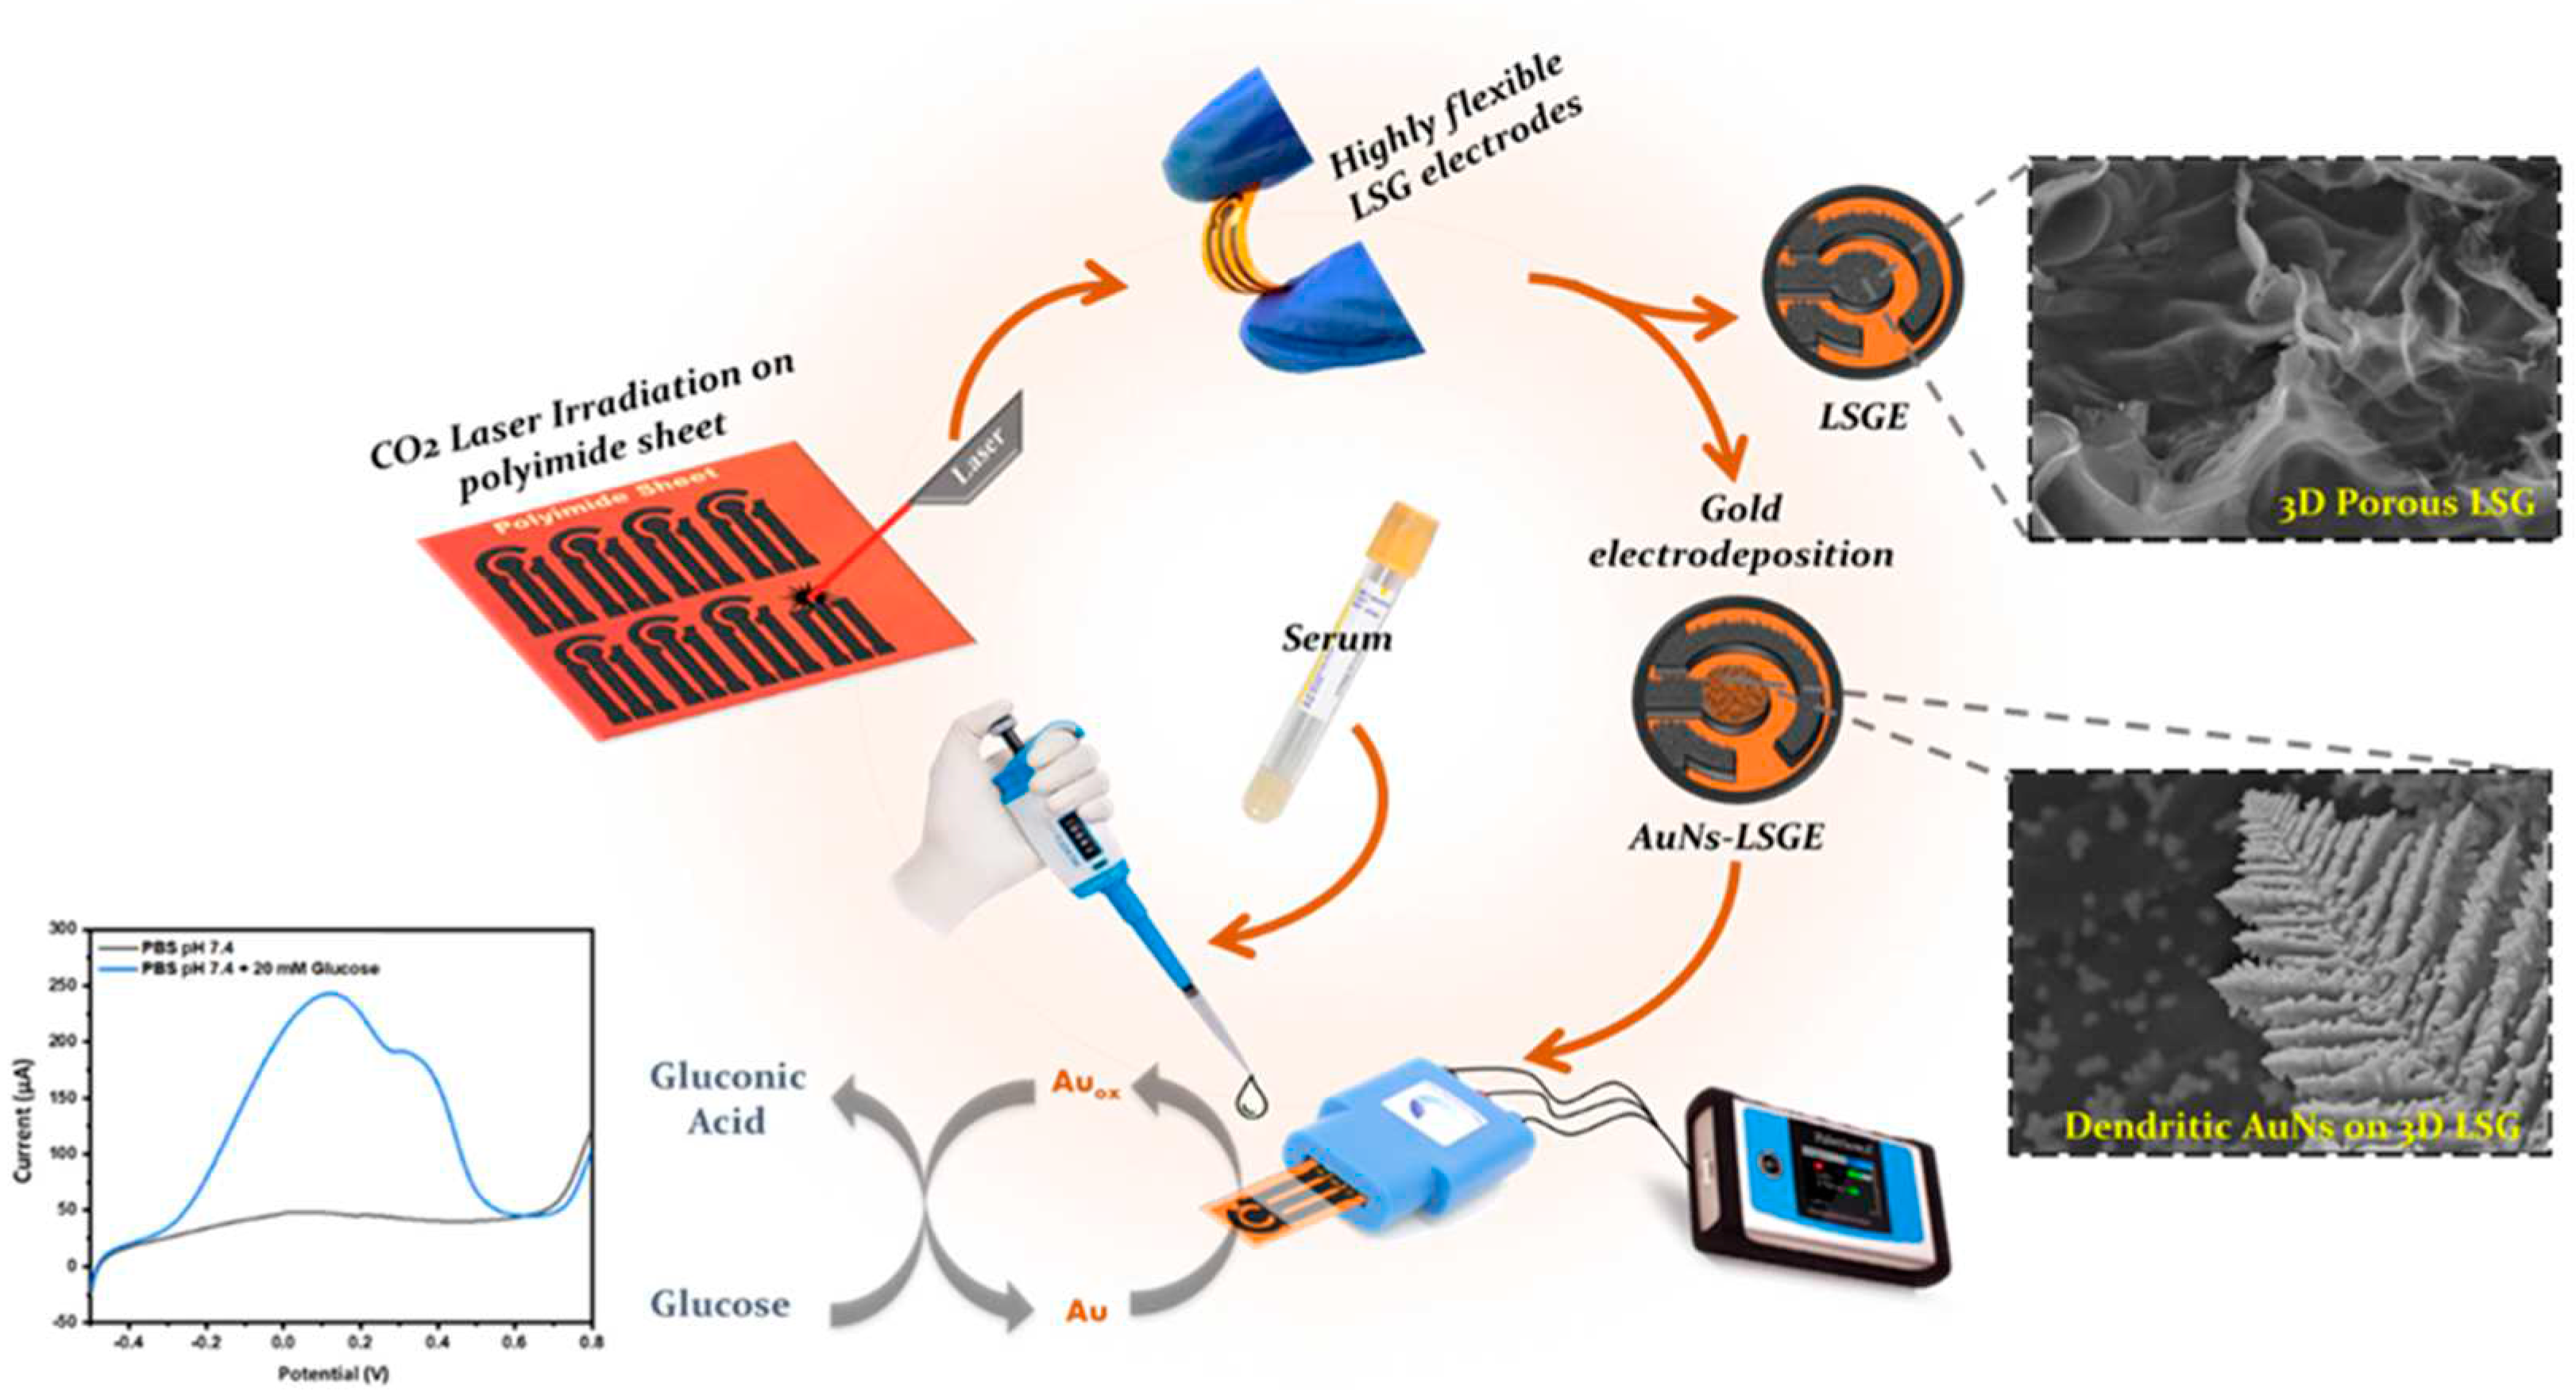
Abstract
Keywords:
1. Introduction
2. Materials and Methods
2.1. Chemicals and Reagents
2.2. Apparatus and Electroanalytical Techniques
2.3. Fabrication of Laser-Scribed Graphene Electrode (LSGE)
2.4. Electrodeposition of Au Nanostructures on LSGE
2.5. Charcterization of Electrocatalytic Activity of AuNs_LSGE
2.6. Real Sample Preparation
3. Results and Discussion
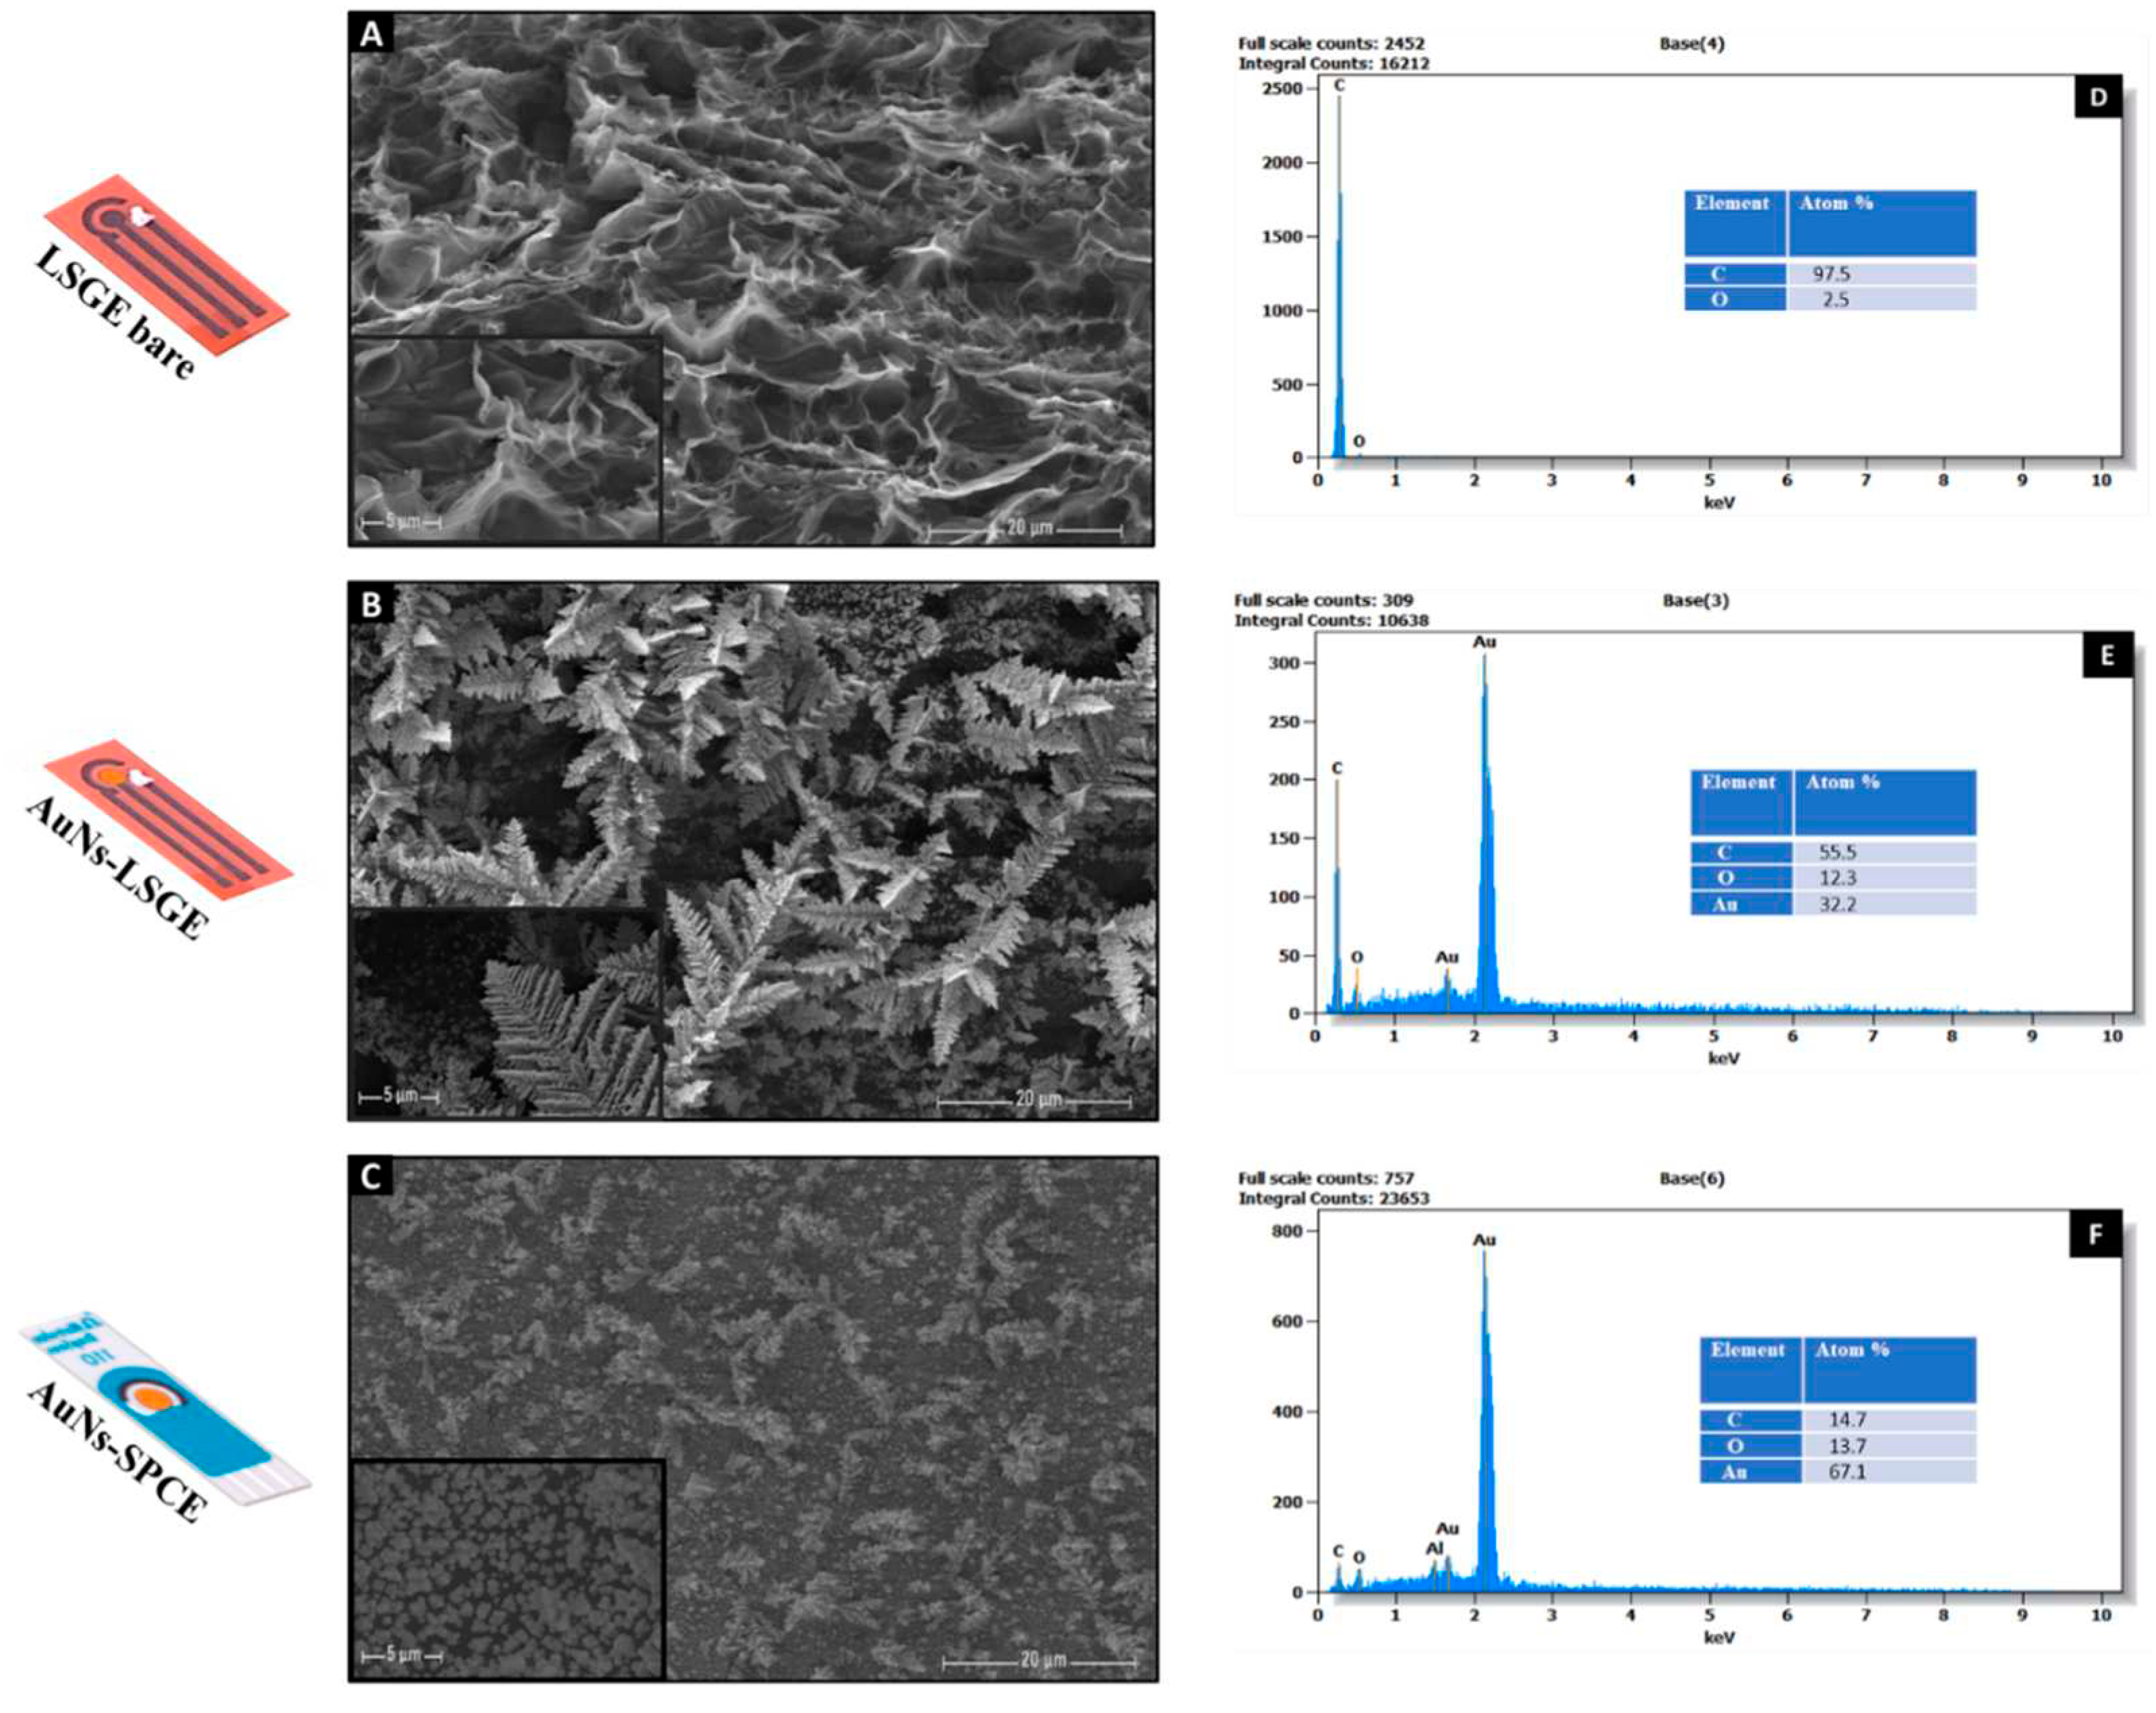
3.1. Morphological and Structural Characterization of the Electrode Surface
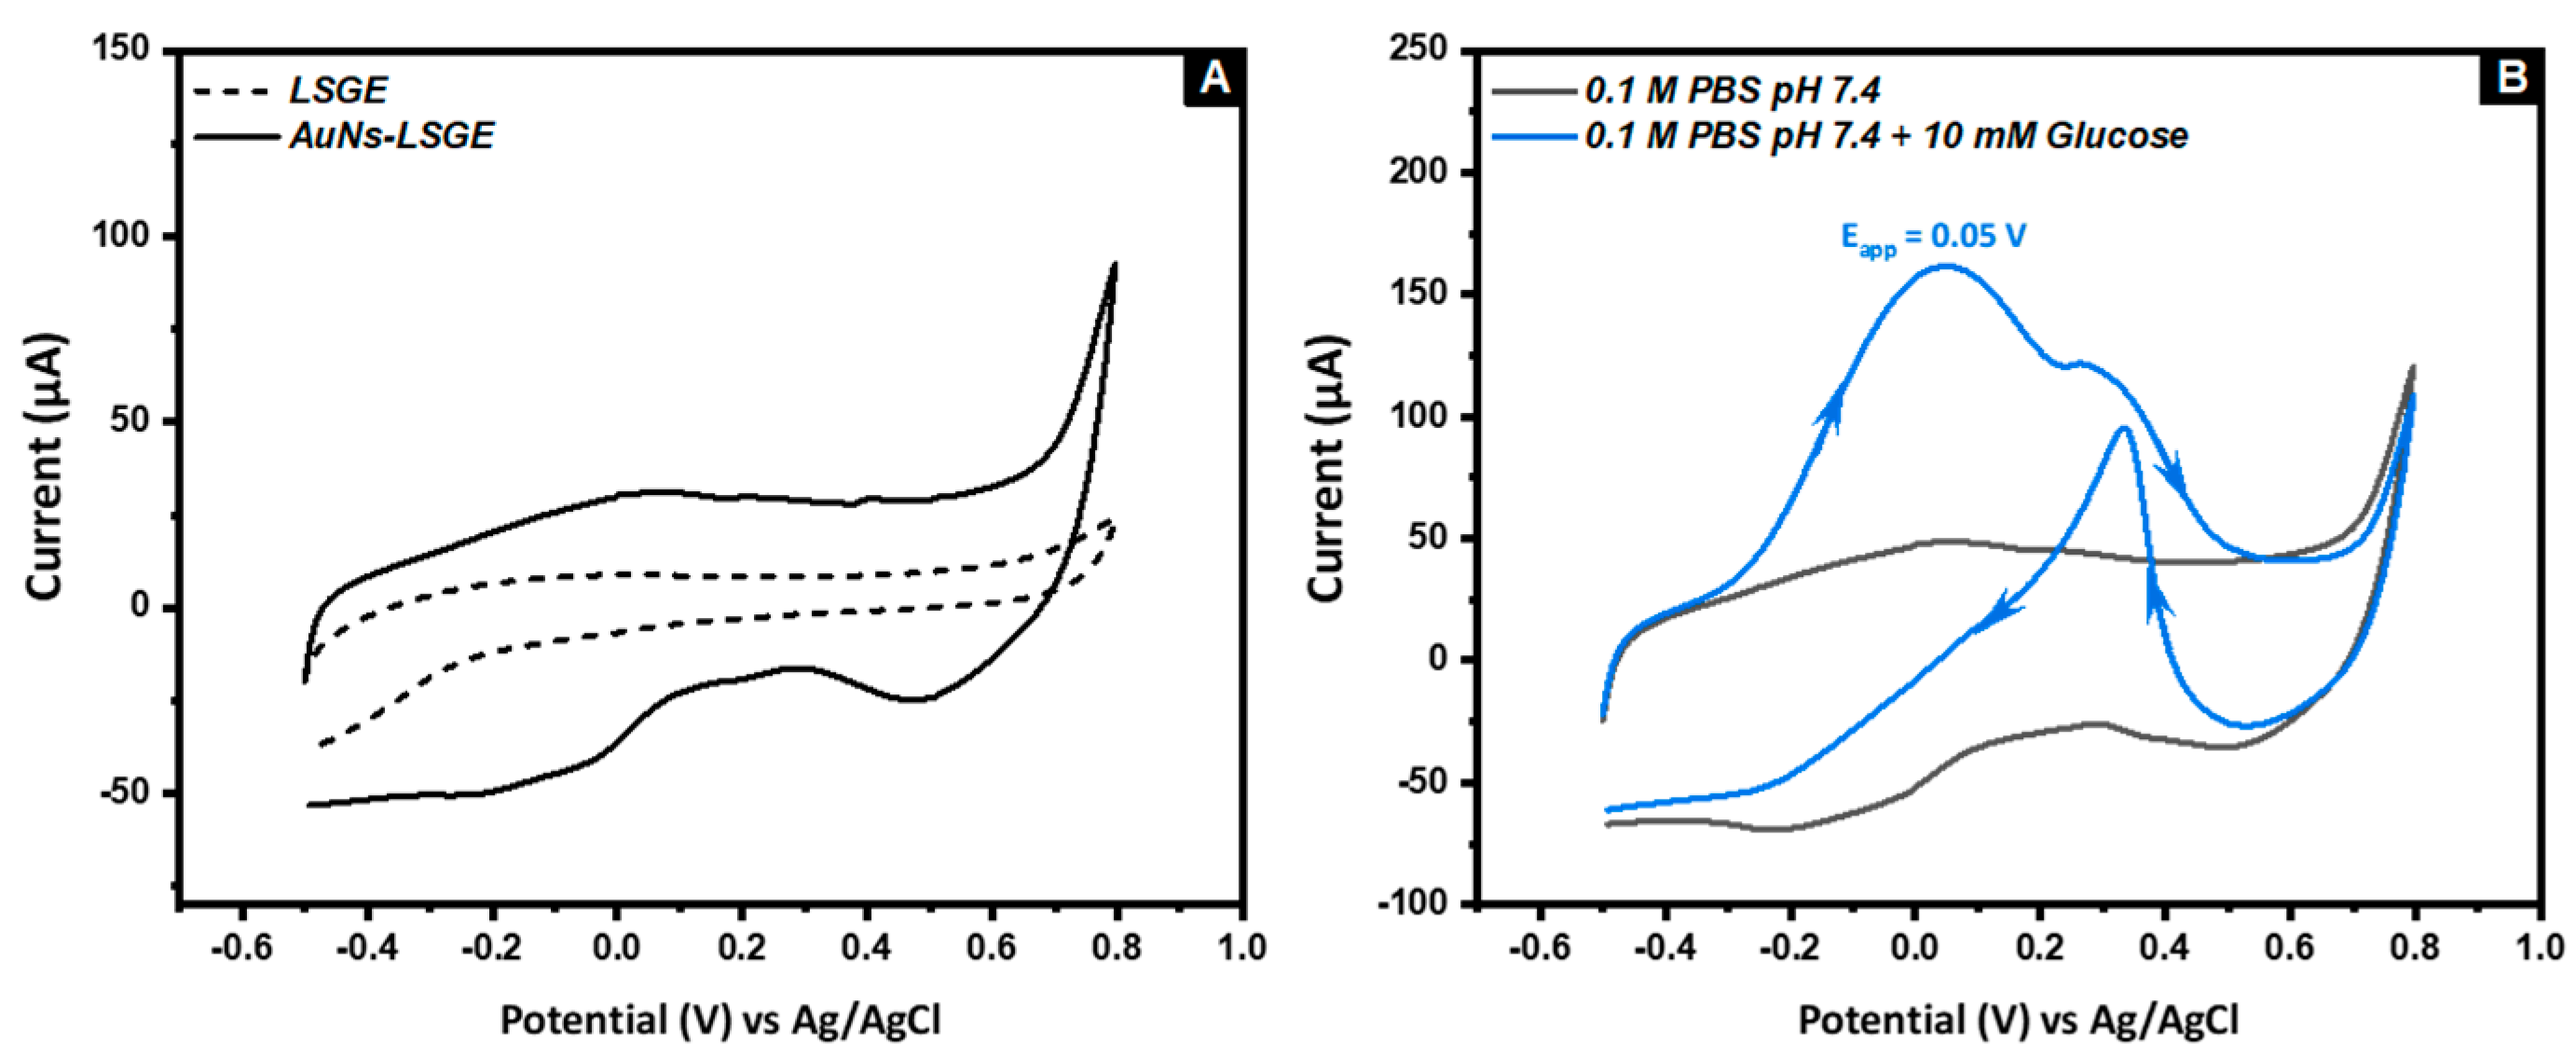
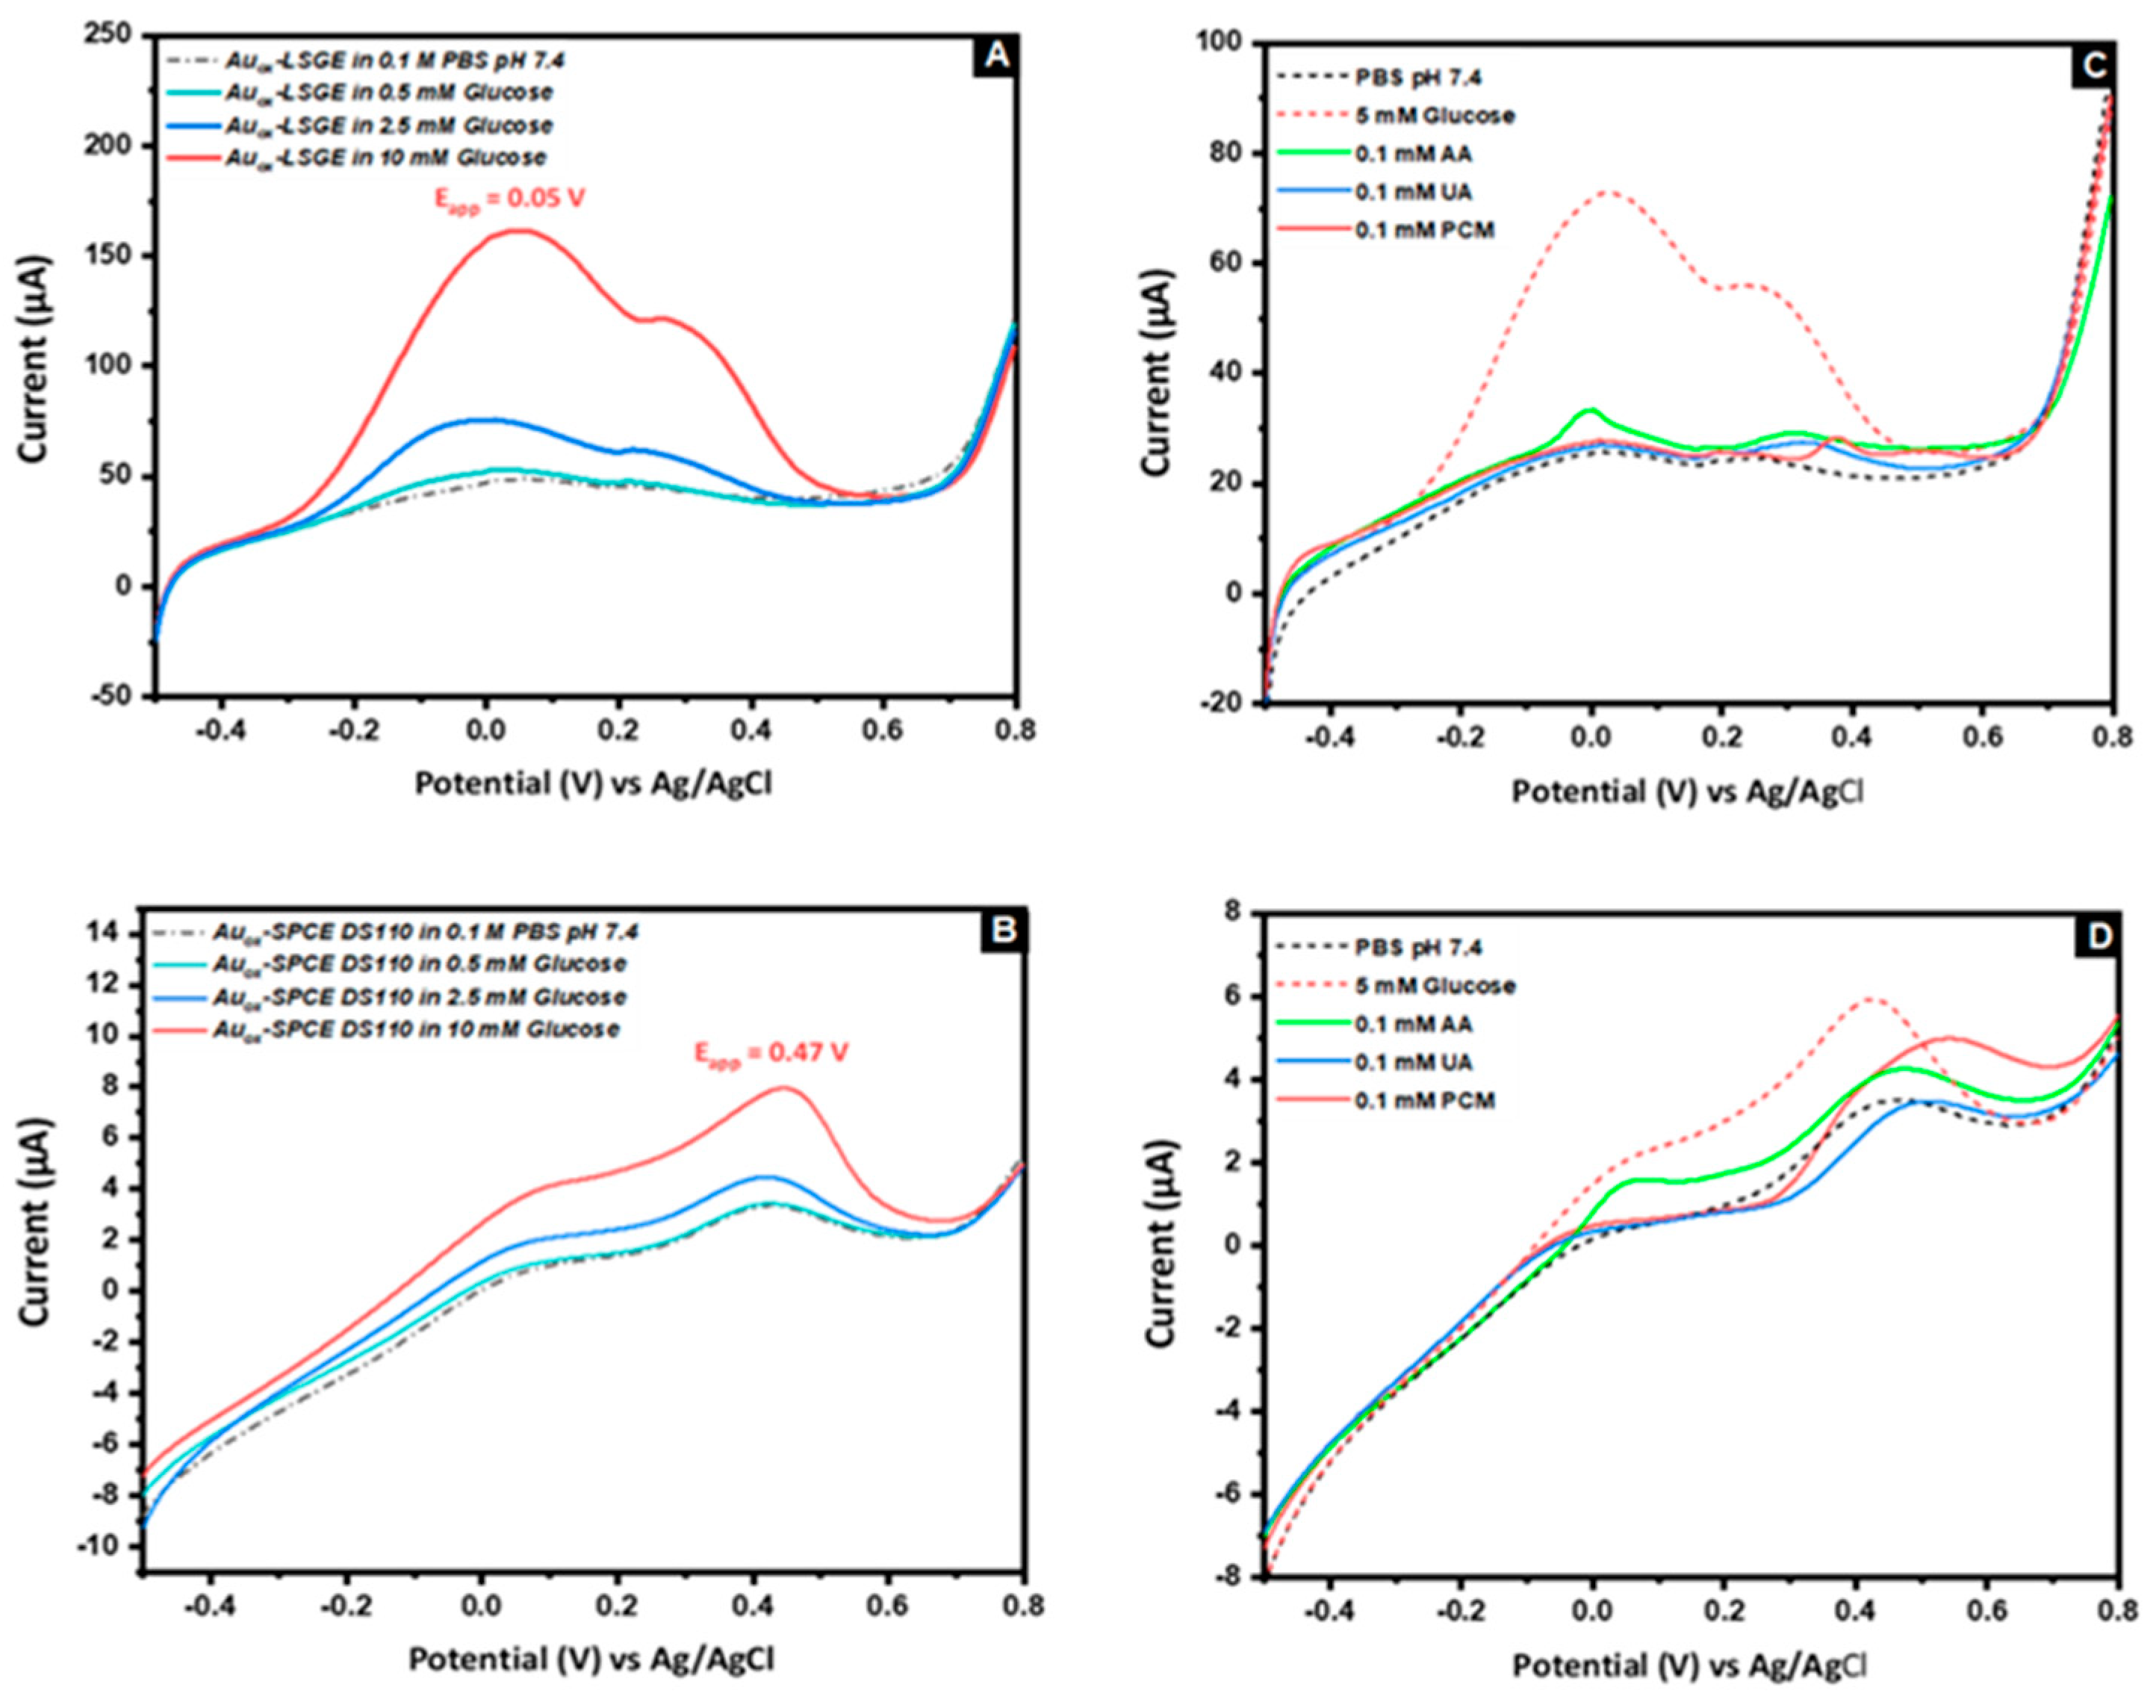
3.2. Electrocatatytic Activity of AuNs-LSGE towards Glucose Oxidation
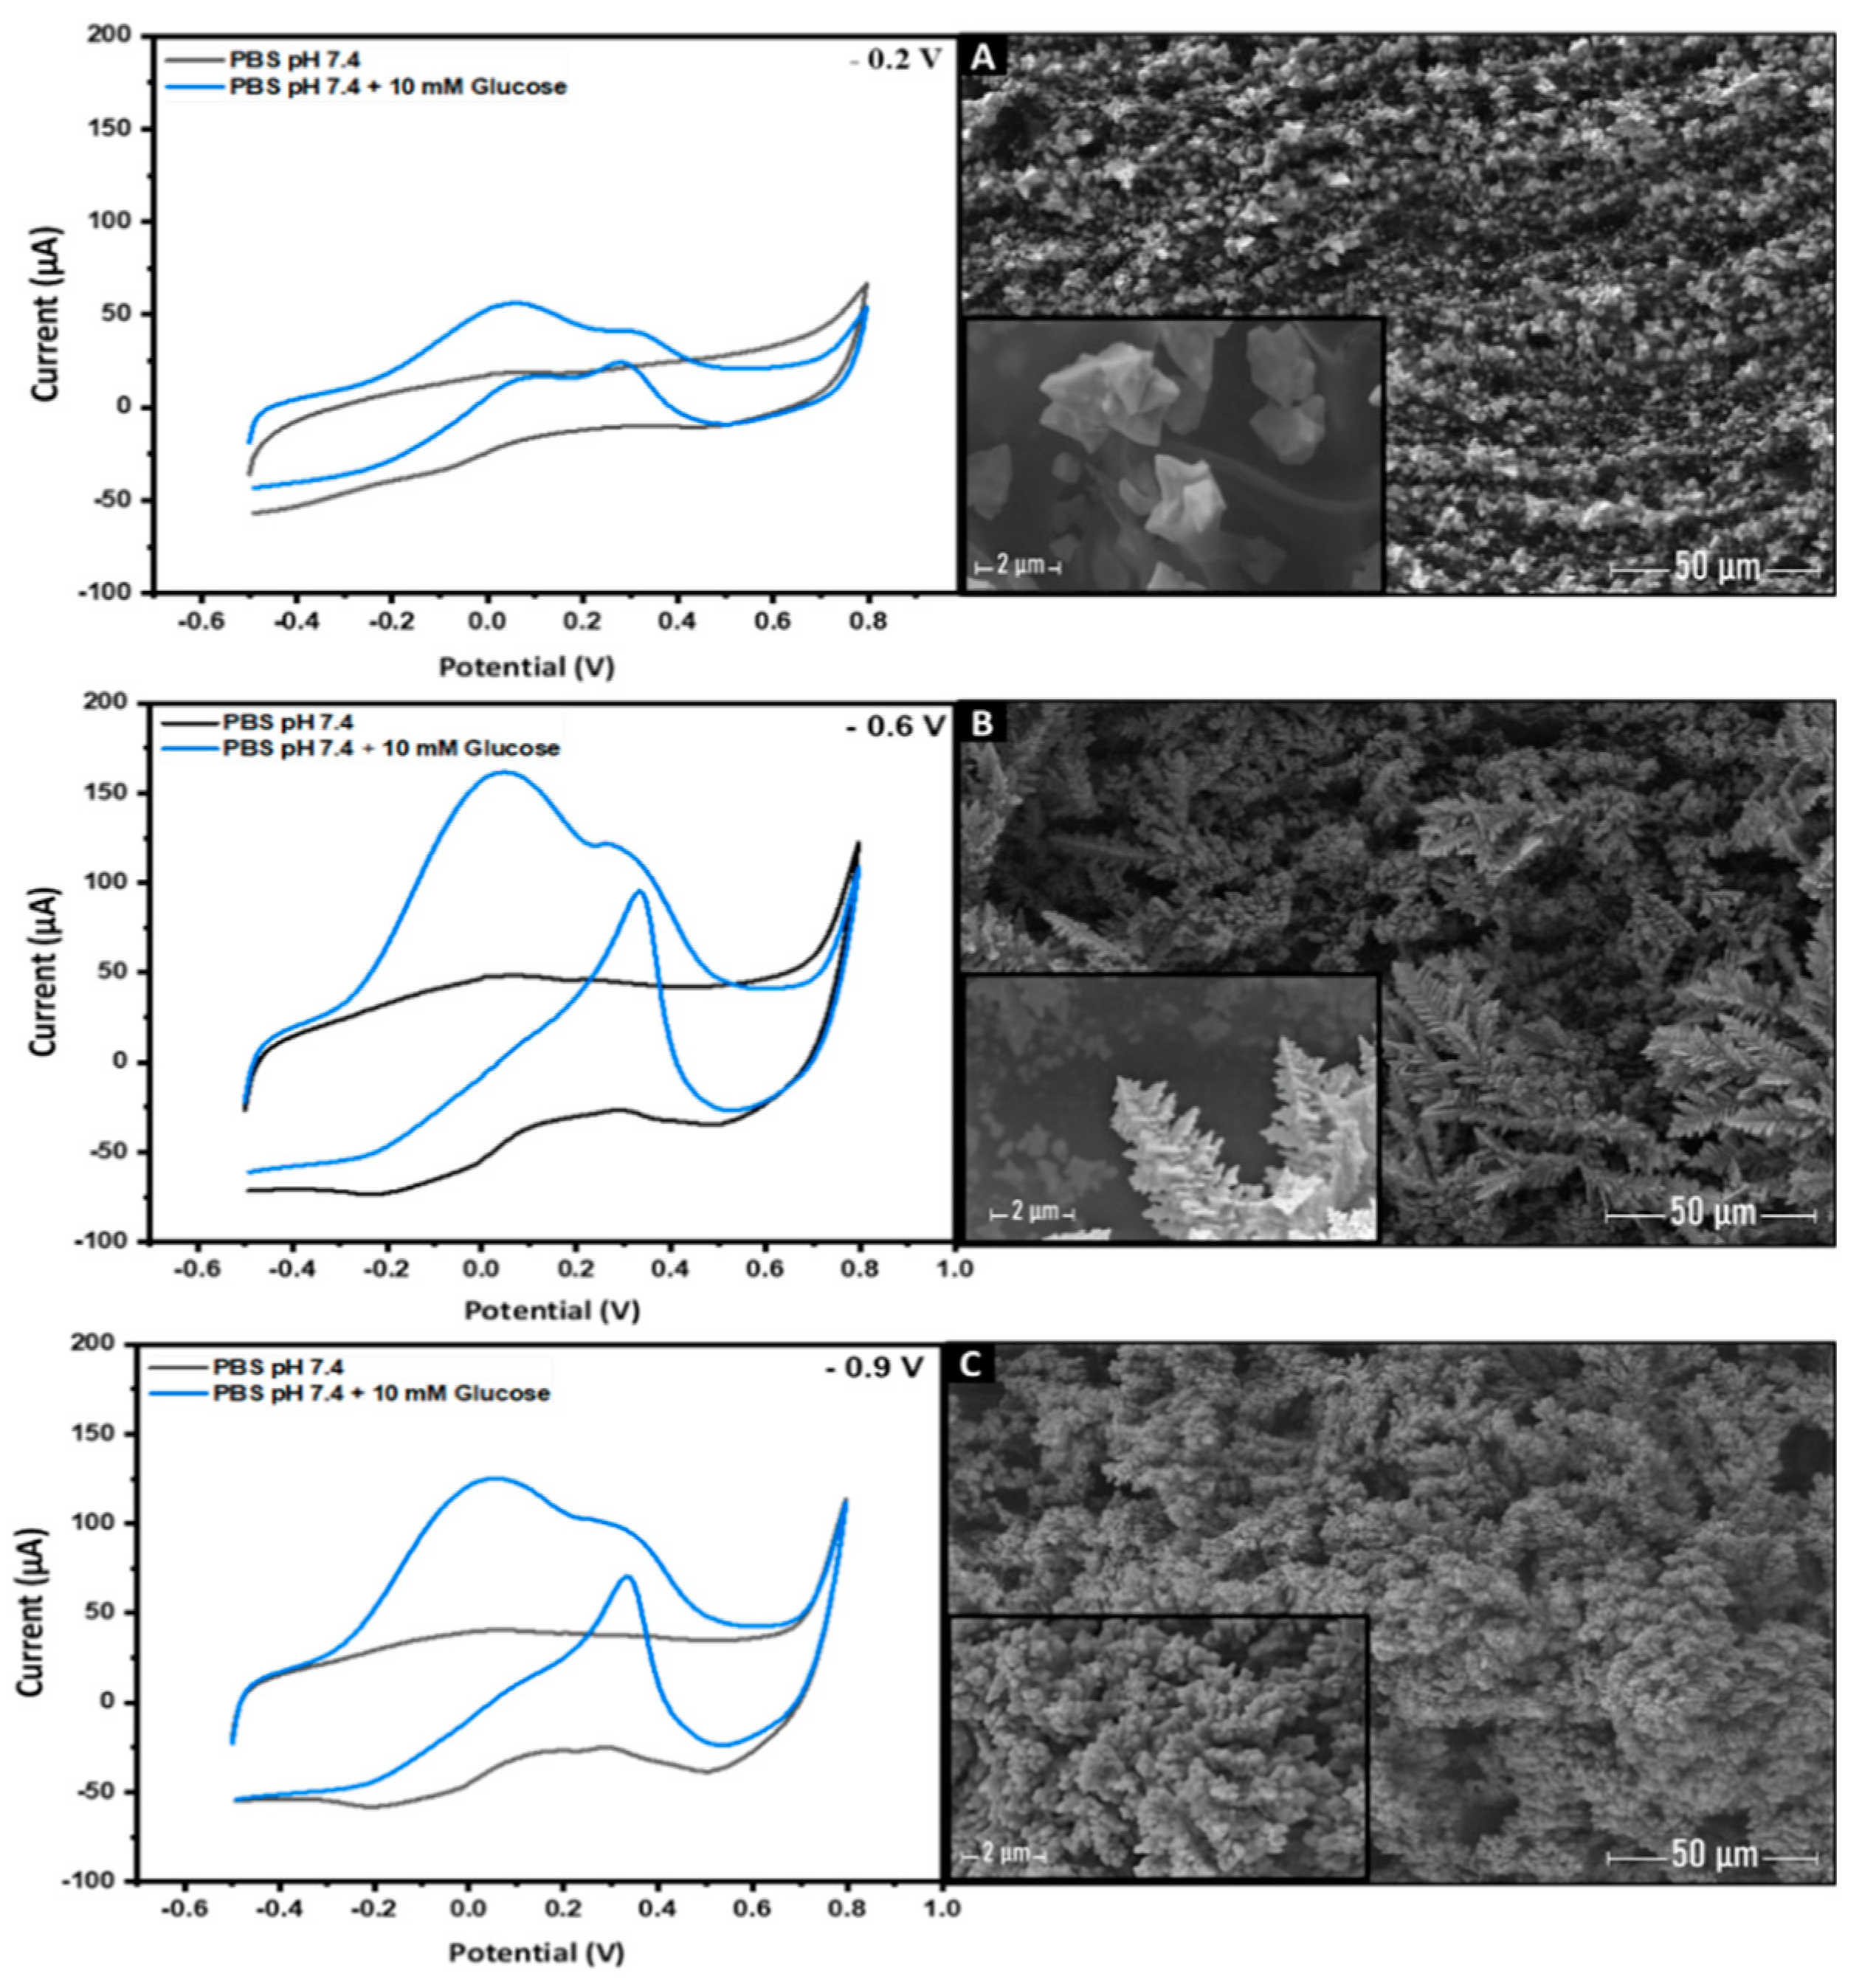
3.3. The Effect of the Applied Voltage and the Precursor Concentration on the Electro-Catalytic Activity of AuNs-LSGE toward Glucose in Neutral pH
3.3.1. The Effect of the Gold Precursor Concentration
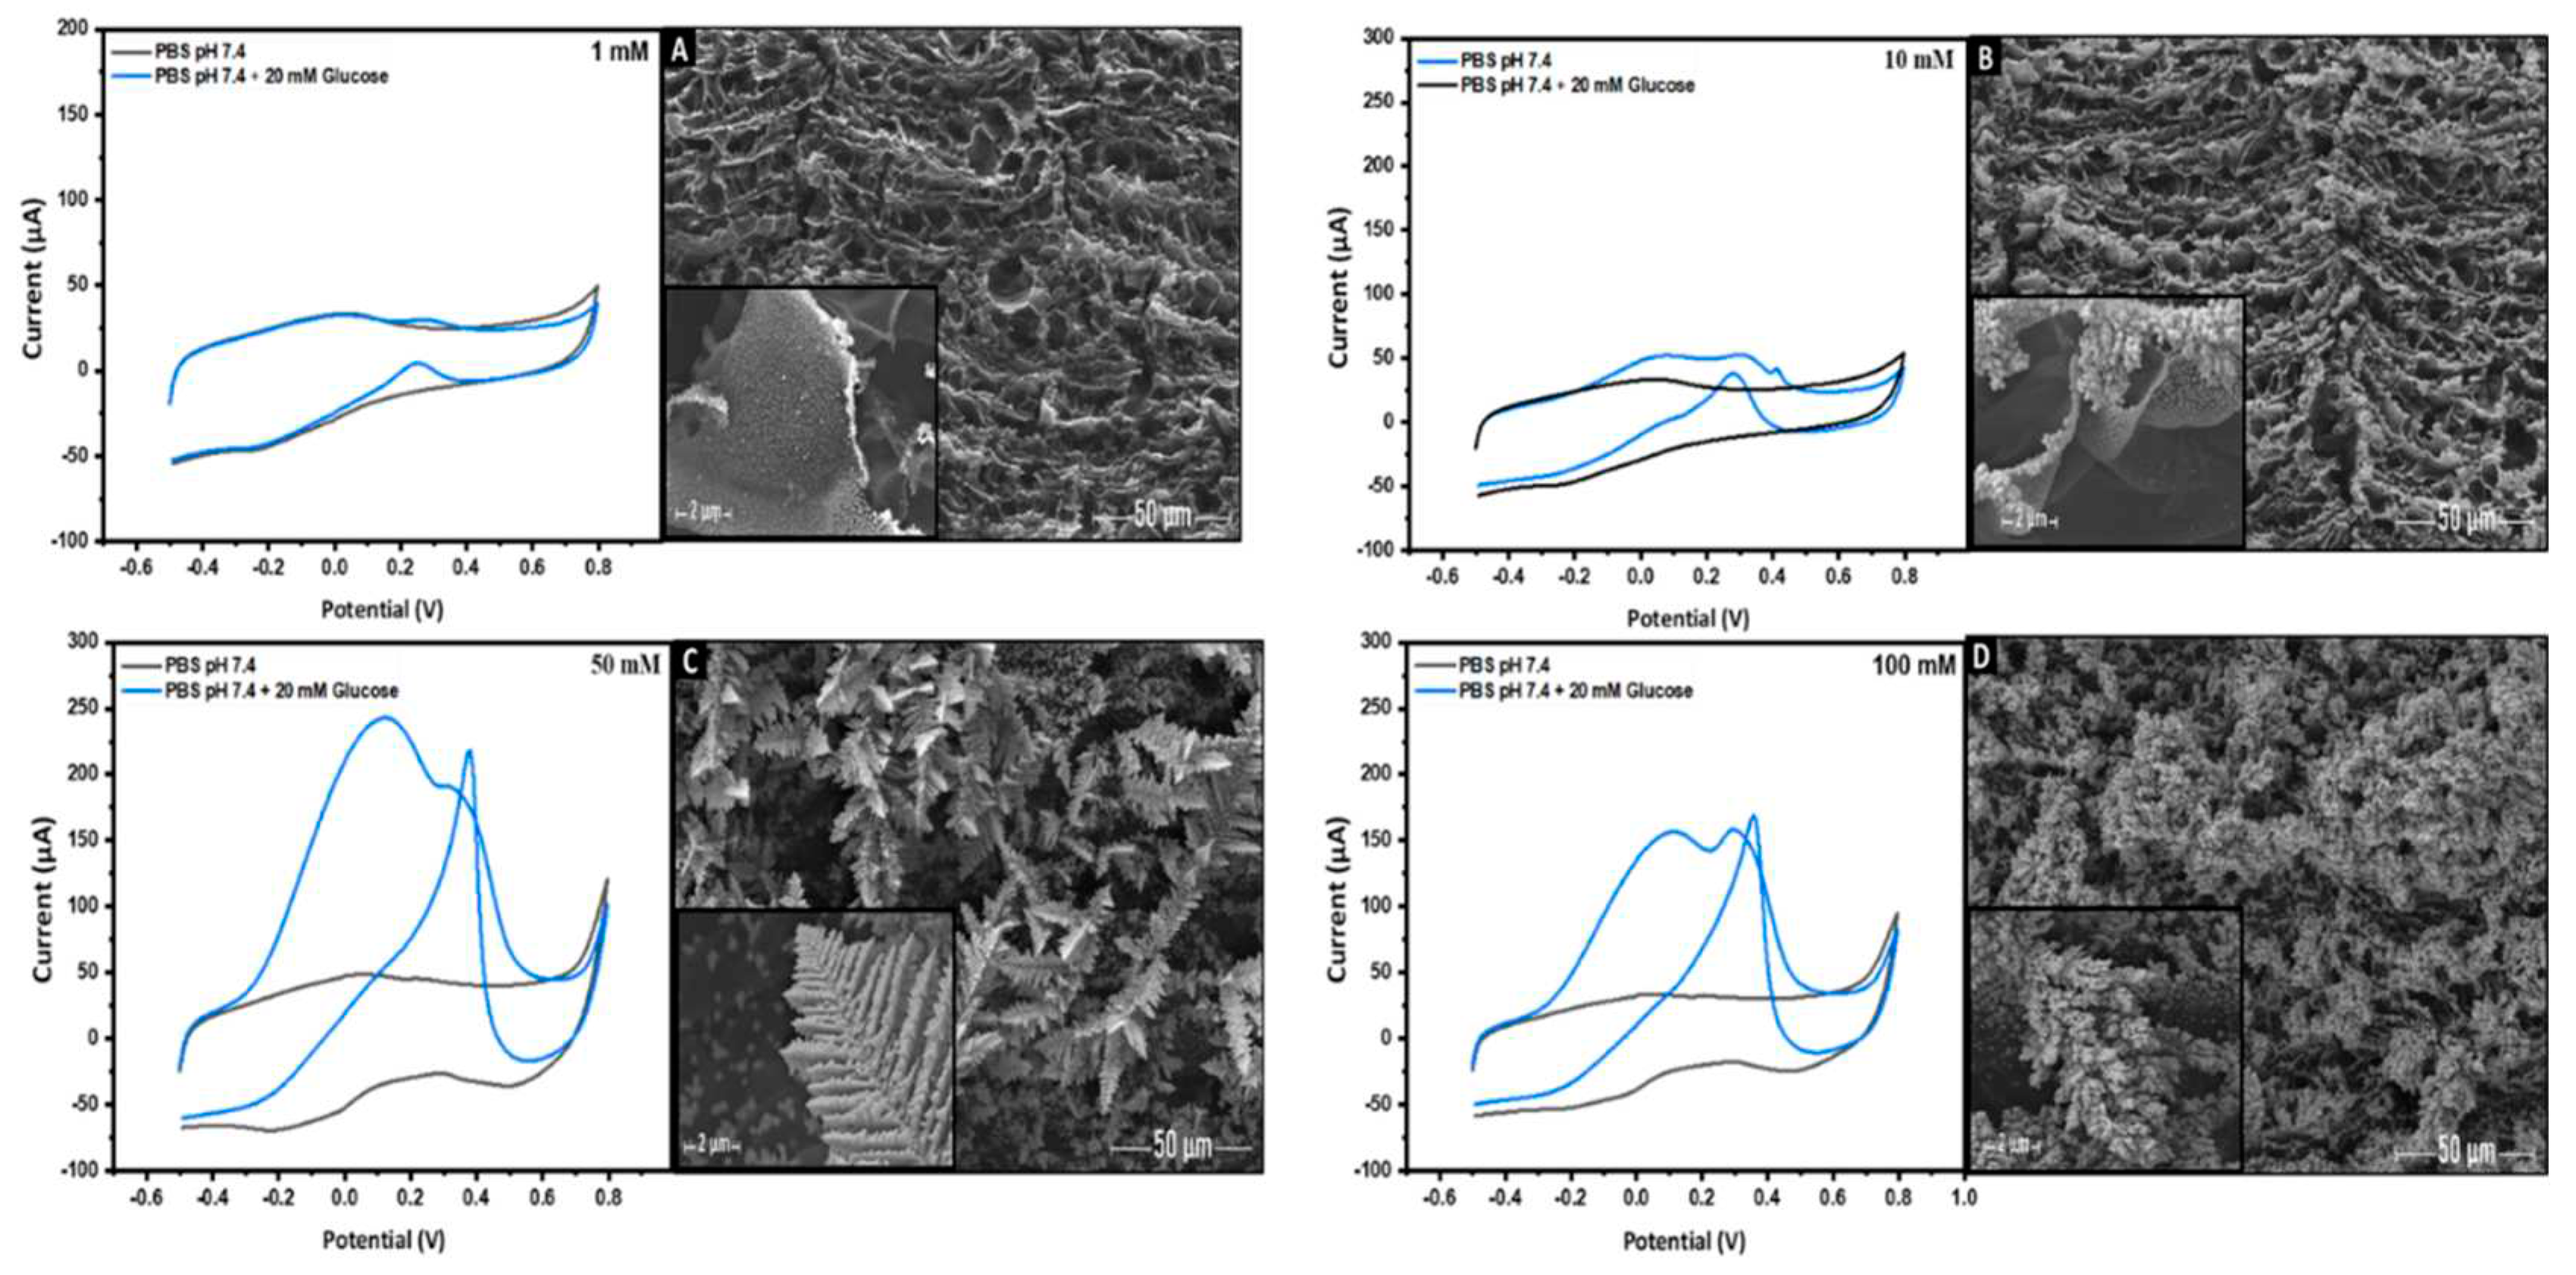
3.3.2. Effect of HAuCl4 Precursor Concentration
3.4. Electroanalytical Performance of AuNs-LSGE Sensor
3.4.1. Voltammetric Detection
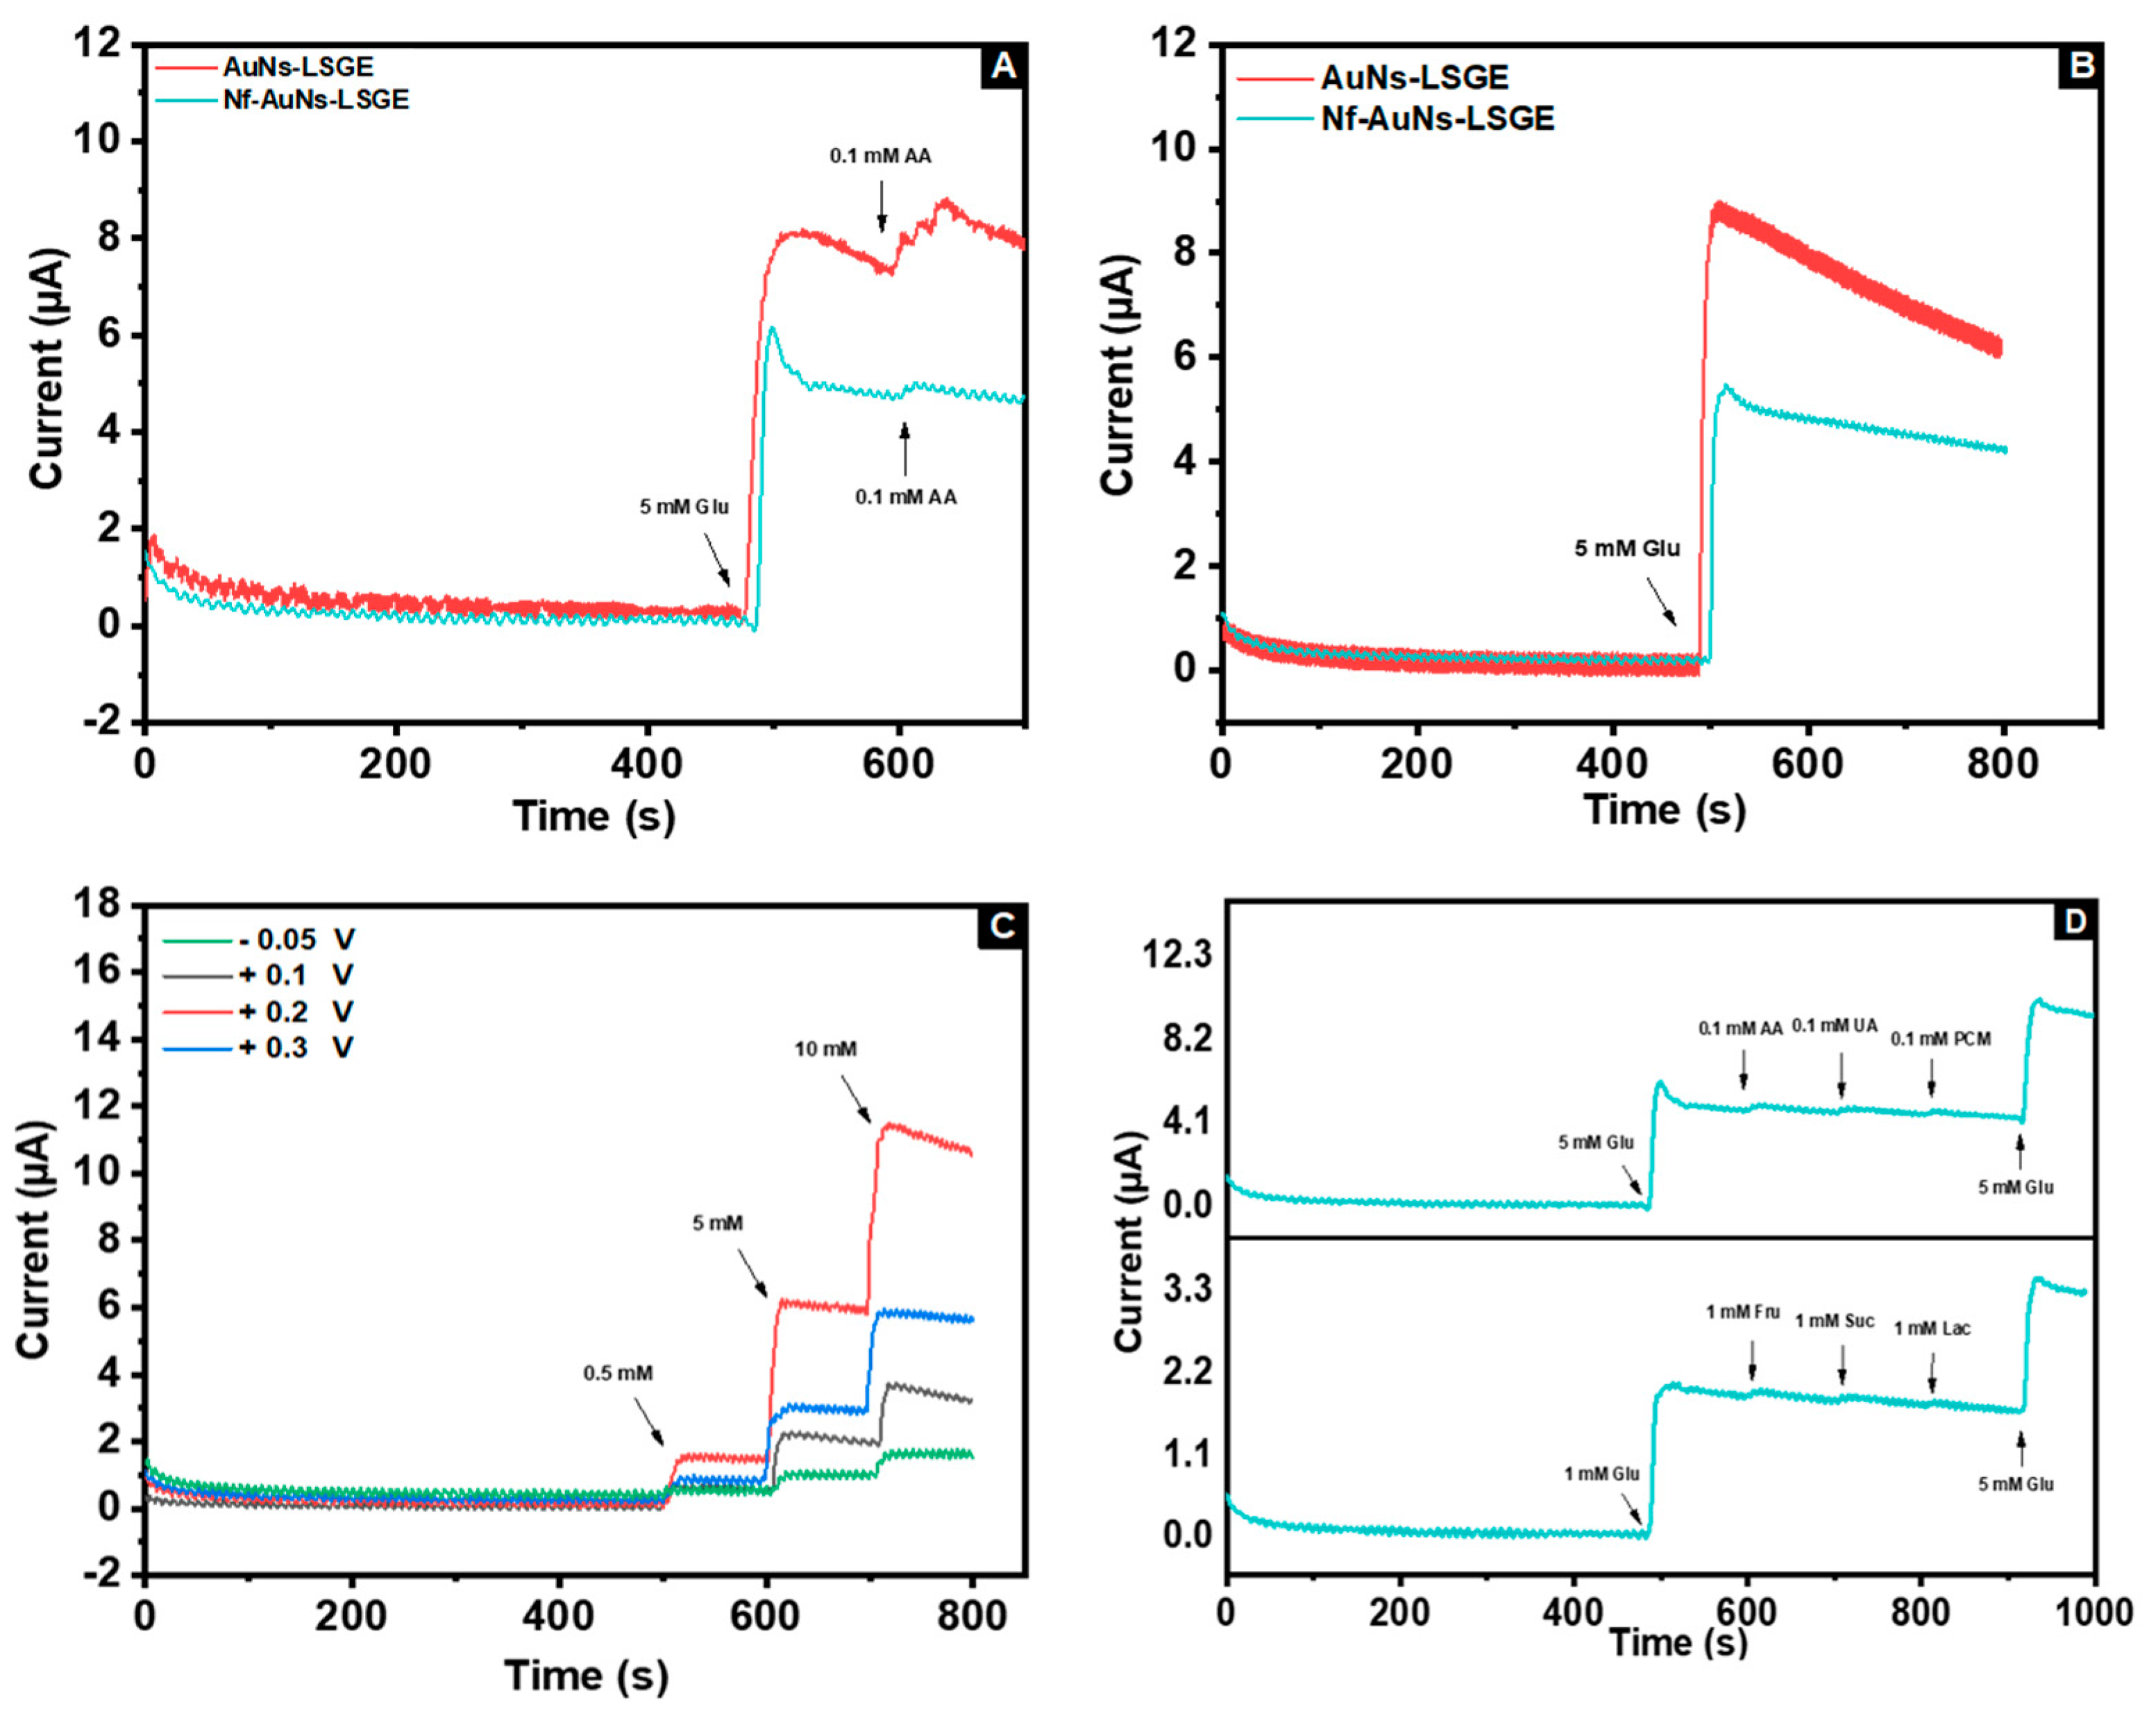
3.4.2. Amperometric Detection
3.4.2.1 Applied Amperometric Potential
3.4.2.2. Interference Study
3.4.2.3 Sensitivity
3.4.2.4. Life Time and Reproducibility Assays
3.4.3. Real Sample Analysis
4. Conclusion
Supplementary Materials
Author Contributions
Funding
Informed Consent Statement
Acknowledgments
Conflicts of Interest
References
- Moore, B.; Zhou, L.; Rolland, F.; Hall, Q.; Cheng, W.H.; Liu, Y.X.; Hwang, I.; Jones, T.; Sheen, J. Role of the Arabidopsis Glucose Sensor HXK1 in Nutrient, Light, and Hormonal Signaling. Science (80-. ). 2003, 300, 332–336. [CrossRef]
- Tian, H.; Yang, Y.; Xie, D.; Cui, Y.L.; Mi, W.T.; Zhang, Y.; Ren, T.L. Wafer-Scale Integration of Graphene-Based Electronic, Optoelectronic and Electroacoustic Devices. Sci. Rep. 2014, 4. [CrossRef]
- Wang, H.C.; Lee, A.R. Recent Developments in Blood Glucose Sensors. J. Food Drug Anal. 2015, 23, 191–200. [CrossRef]
- Heller, A.; Feldman, B. Electrochemical Glucose Sensors and Their Applications in Diabetes Management. Chem. Rev. 2008, 108, 2482–2505. [CrossRef]
- Zhu, L.; She, Z.G.; Cheng, X.; Qin, J.J.; Zhang, X.J.; Cai, J.; Lei, F.; Wang, H.; Xie, J.; Wang, W.; et al. Association of Blood Glucose Control and Outcomes in Patients with COVID-19 and Pre-Existing Type 2 Diabetes. Cell Metab. 2020, 31, 1068-1077.e3. [CrossRef]
- Zimmet, P.Z.; Magliano, D.J.; Herman, W.H.; Shaw, J.E. Diabetes: A 21st Century Challenge. Lancet Diabetes Endocrinol. 2014, 2, 56–64. [CrossRef]
- King, E.J.; Garner, R.J. The Colorimetric Determination of Glucose. J. Clin. Pathol. 1947, 1, 30. [CrossRef]
- Liu, M.; Liu, R.; Chen, W. Graphene Wrapped Cu2O Nanocubes: Non-Enzymatic Electrochemical Sensors for the Detection of Glucose and Hydrogen Peroxide with Enhanced Stability. Biosens. Bioelectron. 2013, 45, 206–212. [CrossRef]
- Attaallah, R.; Elfadil, D.; Amine, A. Screening Study of Enzymatic Inhibition of Medicinal Plants for the Treatment of Diabetes Using a Glucometer Biosensor Approach and Optical Method. J. Herb. Med. 2021, 28, 100441. [CrossRef]
- Wang, J. Electrochemical Glucose Biosensors. Chem. Rev. 2008, 108, 814–825. [CrossRef]
- Kucherenko, I.S.; Soldatkin, O.O.; Dzyadevych, S. V.; Soldatkin, A.P. Electrochemical Biosensors Based on Multienzyme Systems: Main Groups, Advantages and Limitations – A Review. Anal. Chim. Acta 2020, 1111, 114–131. [CrossRef]
- Kim, J.; Campbell, A.S.; Wang, J. Wearable Non-Invasive Epidermal Glucose Sensors: A Review. Talanta 2018, 177, 163–170. [CrossRef]
- Park, S.; Boo, H.; Chung, T.D. Electrochemical Non-Enzymatic Glucose Sensors. Anal. Chim. Acta 2006, 556, 46–57. [CrossRef]
- Toghill, K.E.; Compton, R.G. Electrochemical Non-Enzymatic Glucose Sensors: A Perspective and an Evaluation. Int. J. Electrochem. Sci 2010, 5, 1246–1301.
- Hwang, D.W.; Lee, S.; Seo, M.; Chung, T.D. Recent Advances in Electrochemical Non-Enzymatic Glucose Sensors – A Review. Anal. Chim. Acta 2018, 1033, 1–34. [CrossRef]
- Wang, Q.; Wei, H.; Zhang, Z.; Wang, E.; Dong, S. Nanozyme: An Emerging Alternative to Natural Enzyme for Biosensing and Immunoassay. TrAC Trends Anal. Chem. 2018, 105, 218–224. [CrossRef]
- Wang, J.; Angnes, L. Miniaturized Glucose Sensors Based on Electrochemical Codeposition of Rhodium and Glucose Oxidase onto Carbon-Fiber Electrodes. Anal. Chem. 1992, 64, 456–459. [CrossRef]
- Vashist, S.K.; Zheng, D.; Al-Rubeaan, K.; Luong, J.H.T.; Sheu, F.S. Technology behind Commercial Devices for Blood Glucose Monitoring in Diabetes Management: A Review. Anal. Chim. Acta 2011, 703, 124–136. [CrossRef]
- Ahmed, M.U.; Hossain, M.M.; Safavieh, M.; Wong, Y.L.; Rahman, I.A.; Zourob, M.; Tamiya, E. Toward the Development of Smart and Low Cost Point-of-Care Biosensors Based on Screen Printed Electrodes 2015, 36, 495–505. [CrossRef]
- Strong, V.; Dubin, S.; El-Kady, M.F.; Lech, A.; Wang, Y.; Weiller, B.H.; Kaner, R.B. Patterning and Electronic Tuning of Laser Scribed Graphene for Flexible All-Carbon Devices. ACS Nano 2012, 6, 1395–1403. [CrossRef]
- Tian, H.; Mohammad, M.A.; Mi, W.-T.; Yang, Y.; Ren, T.-L. Laser-Scribing Technology for Wafer-Scale Graphene Devices. Adv. Carbon Nanostructures 2016. [CrossRef]
- Tian, H.; Chen, H.Y.; Ren, T.L.; Li, C.; Xue, Q.T.; Mohammad, M.A.; Wu, C.; Yang, Y.; Wong, H.S.P. Cost-Effective, Transfer-Free, Flexible Resistive Random Access Memory Using Laser-Scribed Reduced Graphene Oxide Patterning Technology. Nano Lett. 2014, 14, 3214–3219. [CrossRef]
- Zhang, J.; Ren, M.; Wang, L.; Li, Y.; Yakobson, B.I.; Tour, J.M. Oxidized Laser-Induced Graphene for Efficient Oxygen Electrocatalysis. Adv. Mater. 2018, 30, 1707319. [CrossRef]
- Wen, F.; Hao, C.; Xiang, J.; Wang, L.; Hou, H.; Su, Z.; Hu, W.; Liu, Z. Enhanced Laser Scribed Flexible Graphene-Based Micro-Supercapacitor Performance with Reduction of Carbon Nanotubes Diameter. Carbon N. Y. 2014, 75, 236–243. [CrossRef]
- Ghanam, A.; Lahcen, A.A.; Beduk, T.; Alshareef, H.N.; Amine, A.; Salama, K.N. Laser Scribed Graphene: A Novel Platform for Highly Sensitive Detection of Electroactive Biomolecules. Biosens. Bioelectron. 2020, 168, 112509. [CrossRef]
- Rauf, S.; Lahcen, A.A.; Aljedaibi, A.; Beduk, T.; Ilton de Oliveira Filho, J.; Salama, K.N. Gold Nanostructured Laser-Scribed Graphene: A New Electrochemical Biosensing Platform for Potential Point-of-Care Testing of Disease Biomarkers. Biosens. Bioelectron. 2021, 180, 113116. [CrossRef]
- Lahcen, A.A.; Rauf, S.; Beduk, T.; Durmus, C.; Aljedaibi, A.; Timur, S.; Alshareef, H.N.; Amine, A.; Wolfbeis, O.S.; Salama, K.N. Electrochemical Sensors and Biosensors Using Laser-Derived Graphene: A Comprehensive Review. Biosens. Bioelectron. 2020, 168, 112565. [CrossRef]
- Ghanam, A.; Haddour, N.; Mohammadi, H.; Amine, A.; Sabac, A.; Buret, F. Nanoporous Cauliflower-like Pd-Loaded Functionalized Carbon Nanotubes as an Enzyme-Free Electrocatalyst for Glucose Sensing at Neutral PH: Mechanism Study. Sensors 2022, 22, 2706. [CrossRef]
- Wang, J.; Gao, H.; Sun, F.; Xu, C. Nanoporous PtAu Alloy as an Electrochemical Sensor for Glucose and Hydrogen Peroxide. Sensors Actuators B Chem. 2014, 191, 612–618. [CrossRef]
- Niu, X.; Li, X.; Pan, J.; He, Y.; Qiu, F.; Yan, Y. Recent Advances in Non-Enzymatic Electrochemical Glucose Sensors Based on Non-Precious Transition Metal Materials: Opportunities and Challenges. RSC Adv. 2016, 6, 84893–84905. [CrossRef]
- Chen, J.; Zhang, W. De; Ye, J.S. Nonenzymatic Electrochemical Glucose Sensor Based on MnO2/MWNTs Nanocomposite. Electrochem. commun. 2008, 10, 1268–1271. [CrossRef]
- Gowthaman, N.S.K.; Raj, M.A.; John, S.A. Nitrogen-Doped Graphene as a Robust Scaffold for the Homogeneous Deposition of Copper Nanostructures: A Nonenzymatic Disposable Glucose Sensor. ACS Sustain. Chem. Eng. 2017, 5, 1648–1658. [CrossRef]
- Wu, J.W.; Wang, C.H.; Wang, Y.C.; Chang, J.K. Ionic-Liquid-Enhanced Glucose Sensing Ability of Non-Enzymatic Au/Graphene Electrodes Fabricated Using Supercritical CO2 Fluid. Biosens. Bioelectron. 2013, 46, 30–36. [CrossRef]
- Lin, S.; Feng, W.; Miao, X.; Zhang, X.; Chen, S.; Chen, Y.; Wang, W.; Zhang, Y. A Flexible and Highly Sensitive Nonenzymatic Glucose Sensor Based on DVD-Laser Scribed Graphene Substrate. Biosens. Bioelectron. 2018, 110, 89–96. [CrossRef]
- Prabhakaran, A.; Nayak, P. Surface Engineering of Laser-Scribed Graphene Sensor Enables Non-Enzymatic Glucose Detection in Human Body Fluids. ACS Appl. Nano Mater. 2020, 3, 391–398. [CrossRef]
- Wang, G.; He, X.; Wang, L.; Gu, A.; Huang, Y.; Fang, B.; Geng, B.; Zhang, X. Non-Enzymatic Electrochemical Sensing of Glucose. Microchim. Acta 2012 1803 2012, 180, 161–186. [CrossRef]
- Feng, D.; Wang, F.; Chen, Z. Electrochemical Glucose Sensor Based on One-Step Construction of Gold Nanoparticle–Chitosan Composite Film. Sensors Actuators B Chem. 2009, 138, 539–544. [CrossRef]
- Tee, S.Y.; Teng, C.P.; Ye, E. Metal Nanostructures for Non-Enzymatic Glucose Sensing. Mater. Sci. Eng. C 2017, 70, 1018–1030. [CrossRef]
- Hassan, M.H.; Vyas, C.; Grieve, B.; Bartolo, P. Recent Advances in Enzymatic and Non-Enzymatic Electrochemical Glucose Sensing. Sensors 2021, Vol. 21, Page 4672 2021, 21, 4672. [CrossRef]
- Berni, A.; Ait lahcen, A.; Amine, A. Electrochemical Sensing of Paracetamol Using 3D Porous Laser Scribed Graphene Platform. Electroanalysis 2022. [CrossRef]
- Berni, A.; Ait Lahcen, A.; Salama, K.N.; Amine, A. 3D-Porous Laser-Scribed Graphene Decorated with Overoxidized Polypyrrole as an Electrochemical Sensing Platform for Dopamine. J. Electroanal. Chem. 2022, 919, 116529. [CrossRef]
- Li, X.; Du, X. Molybdenum Disulfide Nanosheets Supported Au-Pd Bimetallic Nanoparticles for Non-Enzymatic Electrochemical Sensing of Hydrogen Peroxide and Glucose. Sensors Actuators B Chem. 2017, 239, 536–543. [CrossRef]
- Mei, H.; Wu, W.; Yu, B.; Wu, H.; Wang, S.; Xia, Q. Nonenzymatic Electrochemical Sensor Based on Fe@Pt Core–Shell Nanoparticles for Hydrogen Peroxide, Glucose and Formaldehyde. Sensors Actuators B Chem. 2016, 223, 68–75. [CrossRef]
- Mei, H.; Wu, H.; Wu, W.; Wang, S.; Xia, Q. Ultrasensitive Electrochemical Assay of Hydrogen Peroxide and Glucose Based on PtNi Alloy Decorated MWCNTs. RSC Adv. 2015, 5, 102877–102884. [CrossRef]
- Huang, B.; Wang, Y.; Lu, Z.; Du, H.; Ye, J. One Pot Synthesis of Palladium-Cobalt Nanoparticles over Carbon Nanotubes as a Sensitive Non-Enzymatic Sensor for Glucose and Hydrogen Peroxide Detection. Sensors Actuators B Chem. 2017, 252, 1016–1025. [CrossRef]
- Tomanin, P.P.; Cherepanov, P. V.; Besford, Q.A.; Christofferson, A.J.; Amodio, A.; McConville, C.F.; Yarovsky, I.; Caruso, F.; Cavalieri, F. Cobalt Phosphate Nanostructures for Non-Enzymatic Glucose Sensing at Physiological PH. ACS Appl. Mater. Interfaces 2018, 10, 42786–42795. [CrossRef]
- McCormick, W.; McDonagh, P.; Doran, J.; McCrudden, D. Covalent Immobilisation of a Nanoporous Platinum Film onto a Gold Screen-Printed Electrode for Highly Stable and Selective Non-Enzymatic Glucose Sensing. Catal. 2021, Vol. 11, Page 1161 2021, 11, 1161. [CrossRef]
- Dhara, K.; Stanley, J.; Ramachandran, T.; Nair, B.G.; Satheesh, S.B. Pt-CuO Nanoparticles Decorated Reduced Graphene Oxide for the Fabrication of Highly Sensitive Non-Enzymatic Disposable Glucose Sensor. Sensors Actuators B Chem. 2014, 195, 197–205. [CrossRef]
- Lee, S.; Lee, J.; Park, S.; Boo, H.; Kim, H.C.; Chung, T.D. Disposable Non-Enzymatic Blood Glucose Sensing Strip Based on Nanoporous Platinum Particles. Appl. Mater. Today 2018, 10, 24–29. [CrossRef]
- Prabhakaran, A.; Nayak, P. Surface Engineering of Laser-Scribed Graphene Sensor Enables Non-Enzymatic Glucose Detection in Human Body Fluids. ACS Appl. Nano Mater. 2020, 3, 391–398. [CrossRef]
- Zhang, Y.; Li, N.; Xiang, Y.; Wang, D.; Zhang, P.; Wang, Y.; Lu, S.; Xu, R.; Zhao, J. A Flexible Non-Enzymatic Glucose Sensor Based on Copper Nanoparticles Anchored on Laser-Induced Graphene. Carbon N. Y. 2020, 156, 506–513. [CrossRef]
- Zhu, J.; Liu, S.; Hu, Z.; Zhang, X.; Yi, N.; Tang, K.; Dexheimer, M.G.; Lian, X.; Wang, Q.; Yang, J.; et al. Laser-Induced Graphene Non-Enzymatic Glucose Sensors for on-Body Measurements. Biosens. Bioelectron. 2021, 193, 113606. [CrossRef]
| Electrode configuration | Applied potential (V) | Linear range (mM) | LOD (µM) | Medium | Ref |
|---|---|---|---|---|---|
| Pd@Au@MoS2-GCE 1 | - 0.1 | 0.5–20 | 400 | Alkaline | [42] |
| Fe@Pt coreshell-GCE 2 | - 0.15 | 1–16 | 300 | Neutral | [43] |
| PtNi@MWCNTs-GCE 3 | + 0.1 | 0.1-9 | 0.3 | Neutral | [44] |
| Pd@Co@CNTs-GCE 4 | + 0.5 | 0.001-2.4 | 1 | Alkaline | [45] |
| CoPNs-SPCE 5 | + 0.65 | 1–30 | 300 | Neutral | [46] |
| Au@MPTS@Pt-SPCE 6 | + 0.4 | 1-18 | 2 | Neutral | [47] |
| Pt@CuO@rGO-SPCE 7 | + 0.35 | 2-12 | 10 | Alkaline | [48] |
| Pt-SPCE 8 | + 0.65 | 1-30 | - | Neutral | [49] |
| CuONPs-LSGE 9 | + 0.4 | 0.001-5 | 0.1 | Alkaline | [50] |
| CuNPs-LIG 10 | + 0.5 | 0.001-6 | 0.39 | Alkaline | [51] |
| AuNi-LIG 11 | + 0.1 | 0-30 | Alkaline | [52] | |
| Nf-Au-LSGE | + 0.2 | 0.5-20 | 210 | Neutral | This work |
| [Glucose] before spiking (mM) | [Glucose] Added (mM) | [Glucose] Expected (mM) | [Glucose] Found by Commercial Glucometer ± SD (mM) |
[Glucose] Found by developed sensor ± SD (mM) |
Recovery % | |
|---|---|---|---|---|---|---|
| Human serum 1 | 2,7±0.1 | 2.5 mM | 5.2 | 5.2±0.1 | 5.3±0.2 | 101.2 |
| Human serum 2 | 3.3 ± 0.1 | 2.5 mM | 5.8 | 5.7±0.1 | 6.0±0.25 | 103.4 |
Disclaimer/Publisher’s Note: The statements, opinions and data contained in all publications are solely those of the individual author(s) and contributor(s) and not of MDPI and/or the editor(s). MDPI and/or the editor(s) disclaim responsibility for any injury to people or property resulting from any ideas, methods, instructions or products referred to in the content. |
© 2023 by the authors. Licensee MDPI, Basel, Switzerland. This article is an open access article distributed under the terms and conditions of the Creative Commons Attribution (CC BY) license (http://creativecommons.org/licenses/by/4.0/).


