1. Introduction
Facts controllers can control transmission system parameters like series impedance, shunt impedance, current, voltage, phase angle, and oscillation damping at frequencies below the rated frequency, creating these opportunities. These limits cannot be solved mechanically while retaining the requisite system dependability without reducing usable transmission capacity. By adding flexibility, Facts controllers make it possible for a line to carry power closer to its thermal value. Automatic switching must be augmented with rapid-response power electronics. It’s important to note that Facts is a supporting technology, not a direct replacement for mechanical. The Facts technology consists of several high-performance controllers that can be employed independently to control system characteristics [
1]. The specific restrictions of a given transmission line or corridor can be overcome by a well-designed Facts controller.
All Facts Controllers are implementations of the same fundamental technology, allowing their products to eventually benefit from scale technologies. The thyristor or high-power transistor is a key component for numerous high-power electronic Controllers, just as the transistor is necessary for various microelectronic chips The Power Electronics Controllers that are now a part of the Facts framework were developed long before the framework’s release to the technical community. The Static Var Compensator (SVC) is one of the most used methods for regulating voltage because of its shunt connection [
2]. The first series-connected controller uses a capacitor impedance control strategy and is low-power. It showed that series capacitor correction has no limits when an active controller is used. Before SVCs, there were powerful gapless metal oxide arrestors for limiting dynamic overvoltage and two variations of static saturable reactors for limiting overvoltage [
3]. Phase shifters and solid-state tap changers have both been the subject of research. But what makes Facts technology special is that the umbrella concept showed how power electronics technology could be used to greatly improve the value of power systems. This opened the door for a lot of new and advanced ideas to make this a reality. Future power systems around the world will be rethought and re-engineered thanks to Facts technology, which has also given new generations of engineers a boost and excitement [
4].
1.1. Voltage Stability
Problems with voltage control and stability are not new to the electric utility industry, but they are now receiving special consideration from all power system analysts and researchers. Power system networks are becoming more vulnerable to voltage instability due to their growth and economic and environmental constraints. In the past few years, unstable power has caused major network failures in New York, Florida, France, Belgium, Sweden, Japan, and India. Understanding, assessing, and creating ever-newer techniques to deal with the threat of voltage instability/collapse is the responsibility of research If the voltages near the loads in a power system return to their pre-disturbance equilibrium values after being perturbed to a certain level, then the system is said to be voltage stable at that condition of operation. When electrical grids are overloaded or their transmission capacity is diminished as a result of disruptions, voltage instability becomes a serious issue in systems without sufficient reactive power support. The problem of maintaining a consistent voltage affects the entire power system, even though it typically has a greater impact on just one of the power system’s most essential components [
5].
1.2. Voltage Collapse
After voltage instability, a power system will fail if the post-disturbance equilibrium voltages near loads are lower than the permitted limits. The breakdown of electricity might be blackout or incomplete [
6]. Security of voltage refers to a system’s capacity to continue functioning normally in the face of credible emergencies or increases in load. Voltage stability is a dynamic process, yet static analysis methods based on power flow are commonly used since they are fast and approximative.
1.3. Reasons for Voltage Instability
The following factors contribute to voltage instability, which may also cause voltage collapse.
1. Transmission line congestion has increased.
2. Reactive power limitations
3. Sudden failure in generating units
4. Dynamic operation of the on-load tap changer (OLTC)
5. Characteristics of load.
2. Countermeasures for Instability of Voltage
There are numerous consequences associated with voltage instability, including dynamic loads, reactive power production, load tap changer transformers, and transmission system power transfer capability[
7]. The majority of these variables have a considerable impact on the generation, use, and transmission of reactive electricity.
1. Synchronous Condensers
2. Transformer tap changing settings
3. Phase shifters
4. Under voltage load shedding
5. Incorporation of FACTS devices in the network
These are the countermeasures for voltage instability/collapse. In this, some have their disadvantages.
2.1. Transformers Tap Change Setting
Frequently, power applications in power systems call for the need to control the transformer’s voltage. It might be needed in an application.
1. To provide a specific voltage to the Load
2. To compensate for the decreases in voltage caused by the Load
Transformers are necessary components of a power system because of their extra role in the regulation of active and reactive power flows. The voltage is controlled by adjusting the turn ratio. The winding has been designed with taps in it so that this can be performed. Because the volts per turn available in large transformers is extremely considerable, even one turn on the LV side produces a significant percentage change in voltage [
8]. In addition, the LV currents are frequently too big to remove the tapping from the windings. The inner winding, known as LV winding, in core-type transformers makes it more challenging to remove the taps. Therefore, the HV winding is equipped with fixtures for any intended application of tapping. Tap changing refers to the process of providing taps to control voltage. Sometimes, a different voltage is injected in series with the line to raise or lower the voltage in a power system. This combination is sometimes referred to as buck-boost. In addition to that, the magnitude phase of the injected voltage might shift as it comes from different sources in power systems.
2.2. Synchronous Condensers
By compensating for reactive power and adding to the network’s short-circuit power capacity, synchronous condensers are an essential component in maintaining stable network voltage. Synchronous condensers are essentially synchronous generators that do not require an external prime mover to function. Power factor correction is accomplished by controlling the excitation current, which allows for reactive power generation and consumption. One of the most significant advantages of a synchronous condenser is the contribution it makes to the total short circuit capacity of the network node in which it is positioned. This increases the possibility that network-connected devices will be able to “ride through” network breakdown situations. The operation of a synchronous condenser is also ideally suited to take place during times of overload duty that are either shorter or longer in duration. By boosting the network’s inertia, synchronous condensers help keep the power system’s voltage stable during long-term voltage dips[
9]. Consequently, they can be used as VAR compensating devices in situations where voltage instability must be avoided at all costs. The drawbacks of synchronous condensers are that they are expensive to run, need upkeep on rotating machinery, and have a slow reaction speed when something goes poorly.
2.3. Phase Shifter
The transmission line can change the phase of an electromagnetic wave of a specific frequency with the help of a device called a phase shifter. The disadvantages of the two strategies described above are listed below.
1. These consequences are not responding quickly and have several constraints.
2. These are not providing proper results for voltage profile management.
2.4. Under Voltage Load Shedding
Voltage load-shedding strategies may be required in unanticipated or exceptional circumstances. This is comparable to under-frequency load shedding, a procedure used frequently to handle extreme conditions brought on by inadequate generation capacity. The least expensive method of avoiding widespread power collapse is strategic load shedding[
10]. Distinguishing between failures, transient voltage dips, and low voltage circumstances causing voltage collapse should be a goal of load-shedding programs.
2.5. Incorporation of Facts Devices in the Network
FACTS devices are offered for quick reaction and for studying voltage stability in power systems. In addition, FACTS devices utilize sophisticated power electronic devices that provide flexibility and controllability for regulating active and reactive power [
11]. Several studies have been conducted to examine how FACTS controllers affect the system’s ability to improve static performance. System dependability, improved system stability, control over power flow, and decreased losses are all advantages of FACTS. For the FACTS devices to provide the benefits listed above, network installation must be done correctly. The following elements need to be taken into account when determining the best location and working range for various FACTS controllers[
12,
15]. They are active power loss reduction, improved stability, and taking the price of FACTS devices into account.
3. Line Stability Analysis
The Voltage Stability margins in a power system can be increased by using these FACTS devices in addition to compensating reactive power. Evaluation of stability for TCSC and SVC installation. Line stability is utilized to place TCSC, while voltage stability analysis is used to place SVC.
This analysis indicates that the line of test systems is prone to instability. The lines are judged based on the stability index. When this index of a particular sequence approaches the unity value, it is regarded as instability or has a chance of system collapse shortly[
13]. A zero value of the line stability index indicates a stable system
Table 1.
Parameters definitions.
Table 1.
Parameters definitions.
|
Line stability index |
|
The angle between sending and receiving end voltages |
|
Reactive power injection at receiving node j |
|
The voltage at sending node ‘i’ |
|
Reactance value between line i and j |
3.1. Voltage Stability Index
In power systems, the stability indices are used to determine the overall level of stability of each bus as well as the bus that has the lowest level of stability. In an IEEE 14-bus network, utilize the Voltage Stability Index to calculate the stability indices of all load buses [
14]. ThNewton-RaphsonRaphson load flow findings are used to calculate the voltage stability index (V index) for load buses under specific system operating conditions.
where
‘j’: Indicates load buses
‘i’: indicates generator buses
4. Differential Evolution Invasive Weed Optimization (Deiwo) Algorithm
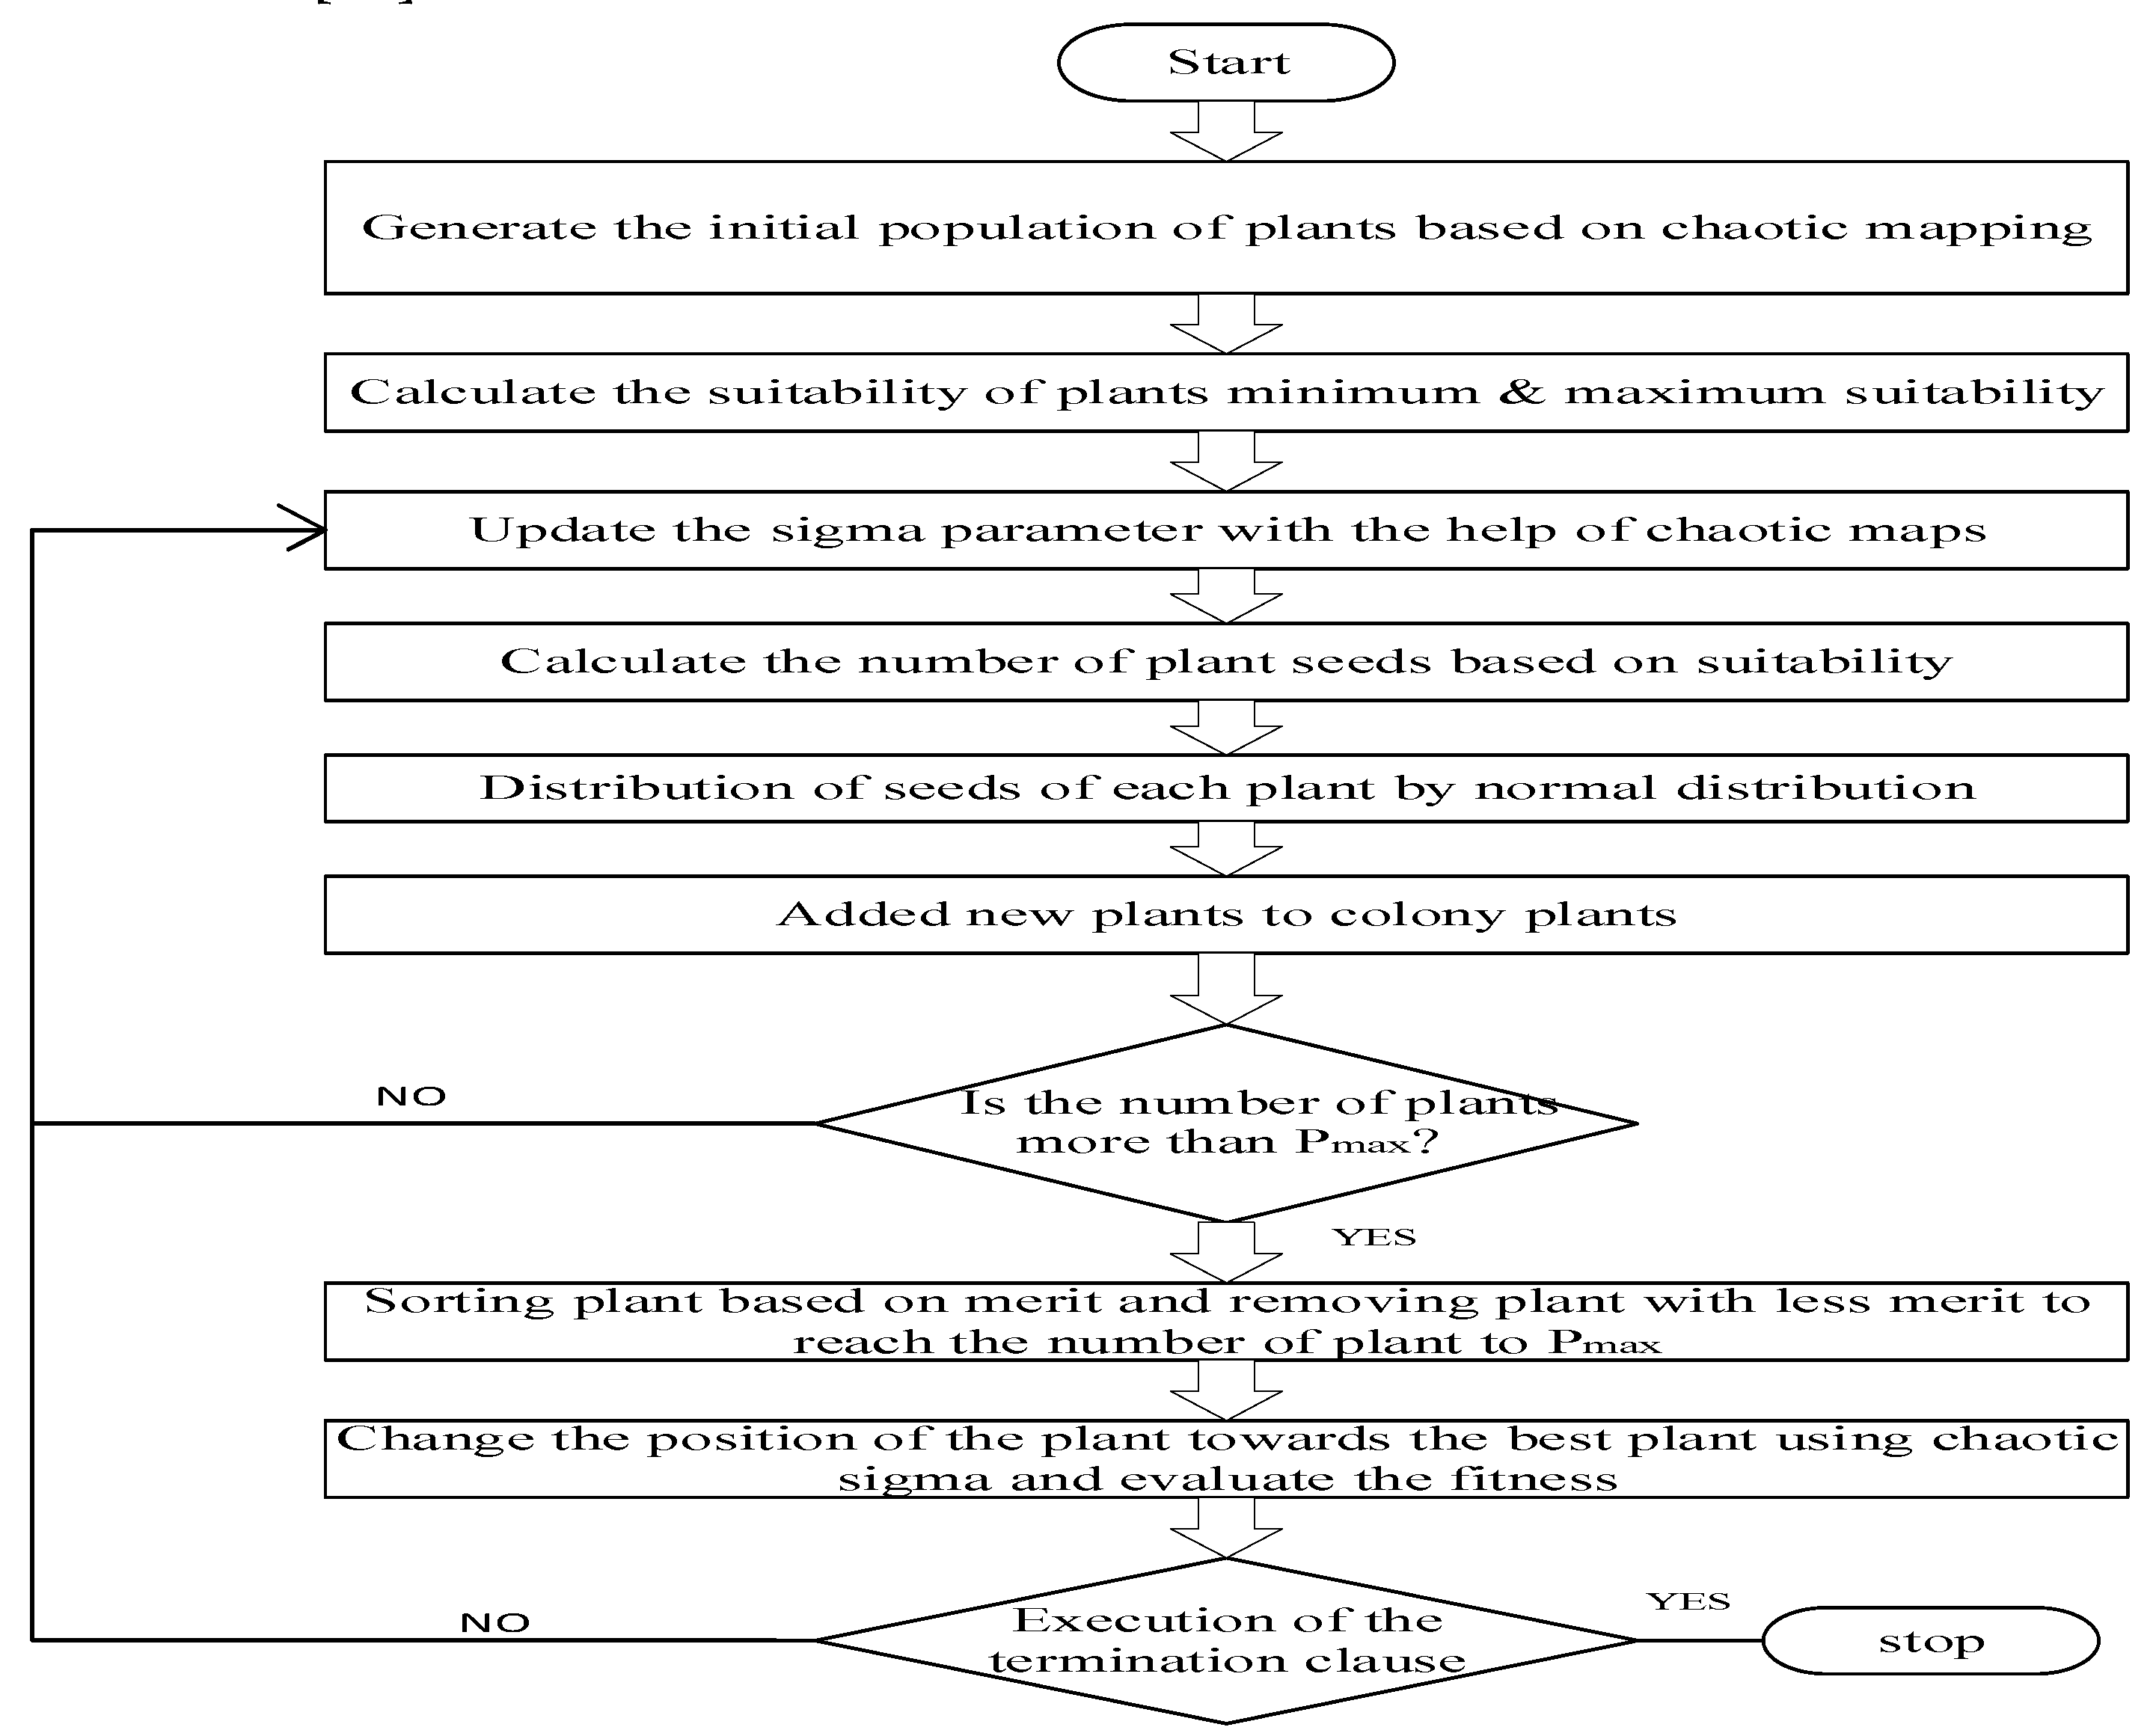
The beginning value and higher accuracy of errors can affect the classic numerical approach for solving nonlinear equations. This study introduces the differential evolution (DE) algorithm, a heuristic global search technique, and applies it to the problem of optimizing the spread of invasive weeds DEIWO[
16]. In the iterative process, the invasive weed optimization algorithm’s global exploration capability offers a useful search area for differential evolution, and at the same time, the differential evolution algorithm’s heuristic searchability provides a solid direction for invasive weed optimization[
17,
18]. The differential evolution invasive weed optimization (DEIWO) algorithm was tested on a variety of common nonlinear equations and a circle packing problem; the results demonstrate that it is accurate and converges quickly, making it a practical and effective tool for addressing nonlinear systems of equations[
19].In terms of convergence speed and ratio, nonconvex nonlinear equations are particularly difficult for nonlinear equations algorithms to solve efficiently. The Newton-Raphson, Quasi-Newton, and homotopy methods have traditionally been used to solve nonlinear equations.
The present work introduces a novel hybrid algorithm based on the population diversity of IWO. To deal with nonlinear systems of equations, consider the differential evolution (DE) algorithm. The combined approach achieves a greater level of optimization accuracy and a faster rate of convergence as a result of the population diversity, which improves the algorithm’s capacity for global searching which increases its capacity for local extractive activities. [
20,
21] Both of these factors contribute to the hybrid algorithm. The suggested approach’s performance has been evaluated for several recognized standard problems in kinematics, chemistry, combustion, and medicine. Mathematical observations show that the suggested method is efficient and flexible to solve large-scale equation solutions[
22].
Figure 1.
Flow chart for DEIWO.
Figure 1.
Flow chart for DEIWO.
Step 1 (Create a population). A set of potential starting points is randomly dispersed across the search space of dimension.
Step 2 (Reproduction). When a weed’s fitness level is high, it will generate a greater number of seeds. The formulation for seeds that grow weeds is
Step 3 (spatial dispersion). Traditional random number distributions use zero-mean, variable-variance random numbers to scatter the generated seeds across the search space’s dimensions. As a result, seeds are guaranteed to be distributed at random to stay close to the parent plant. However, over the course of each generation, the random function’s standard deviation (σ) will be brought down from an initial value(σ) that was established in advance to a final value(σ) that will be used thereafter. A nonlinear alteration has demonstrated good performance in simulations when applied as follows:
Step 4 (Competitive exclusion). Weed colonies will quickly reproduce to their maximum number (max) within a few repetitions. Each weed is now permitted to start producing seeds. When the seeds are placed, they are allowed to grow throughout the entire search area. After all of the sources have been located in the search region, they are ranked with their forebears (like a family of weeds). Next, the lowest-fitness weeds are eliminated to attain the maximum population density permitted for a colony. Together, seeds and weeds are ranked in this way, and only the ones that have a higher fitness level can continue existing and producing offspring. The method for controlling the population is also used on their offspring until the end of a given run. This is called competitive exclusion.
5. Results And Discussions
5.1. IEEE-14 Bus Case Study
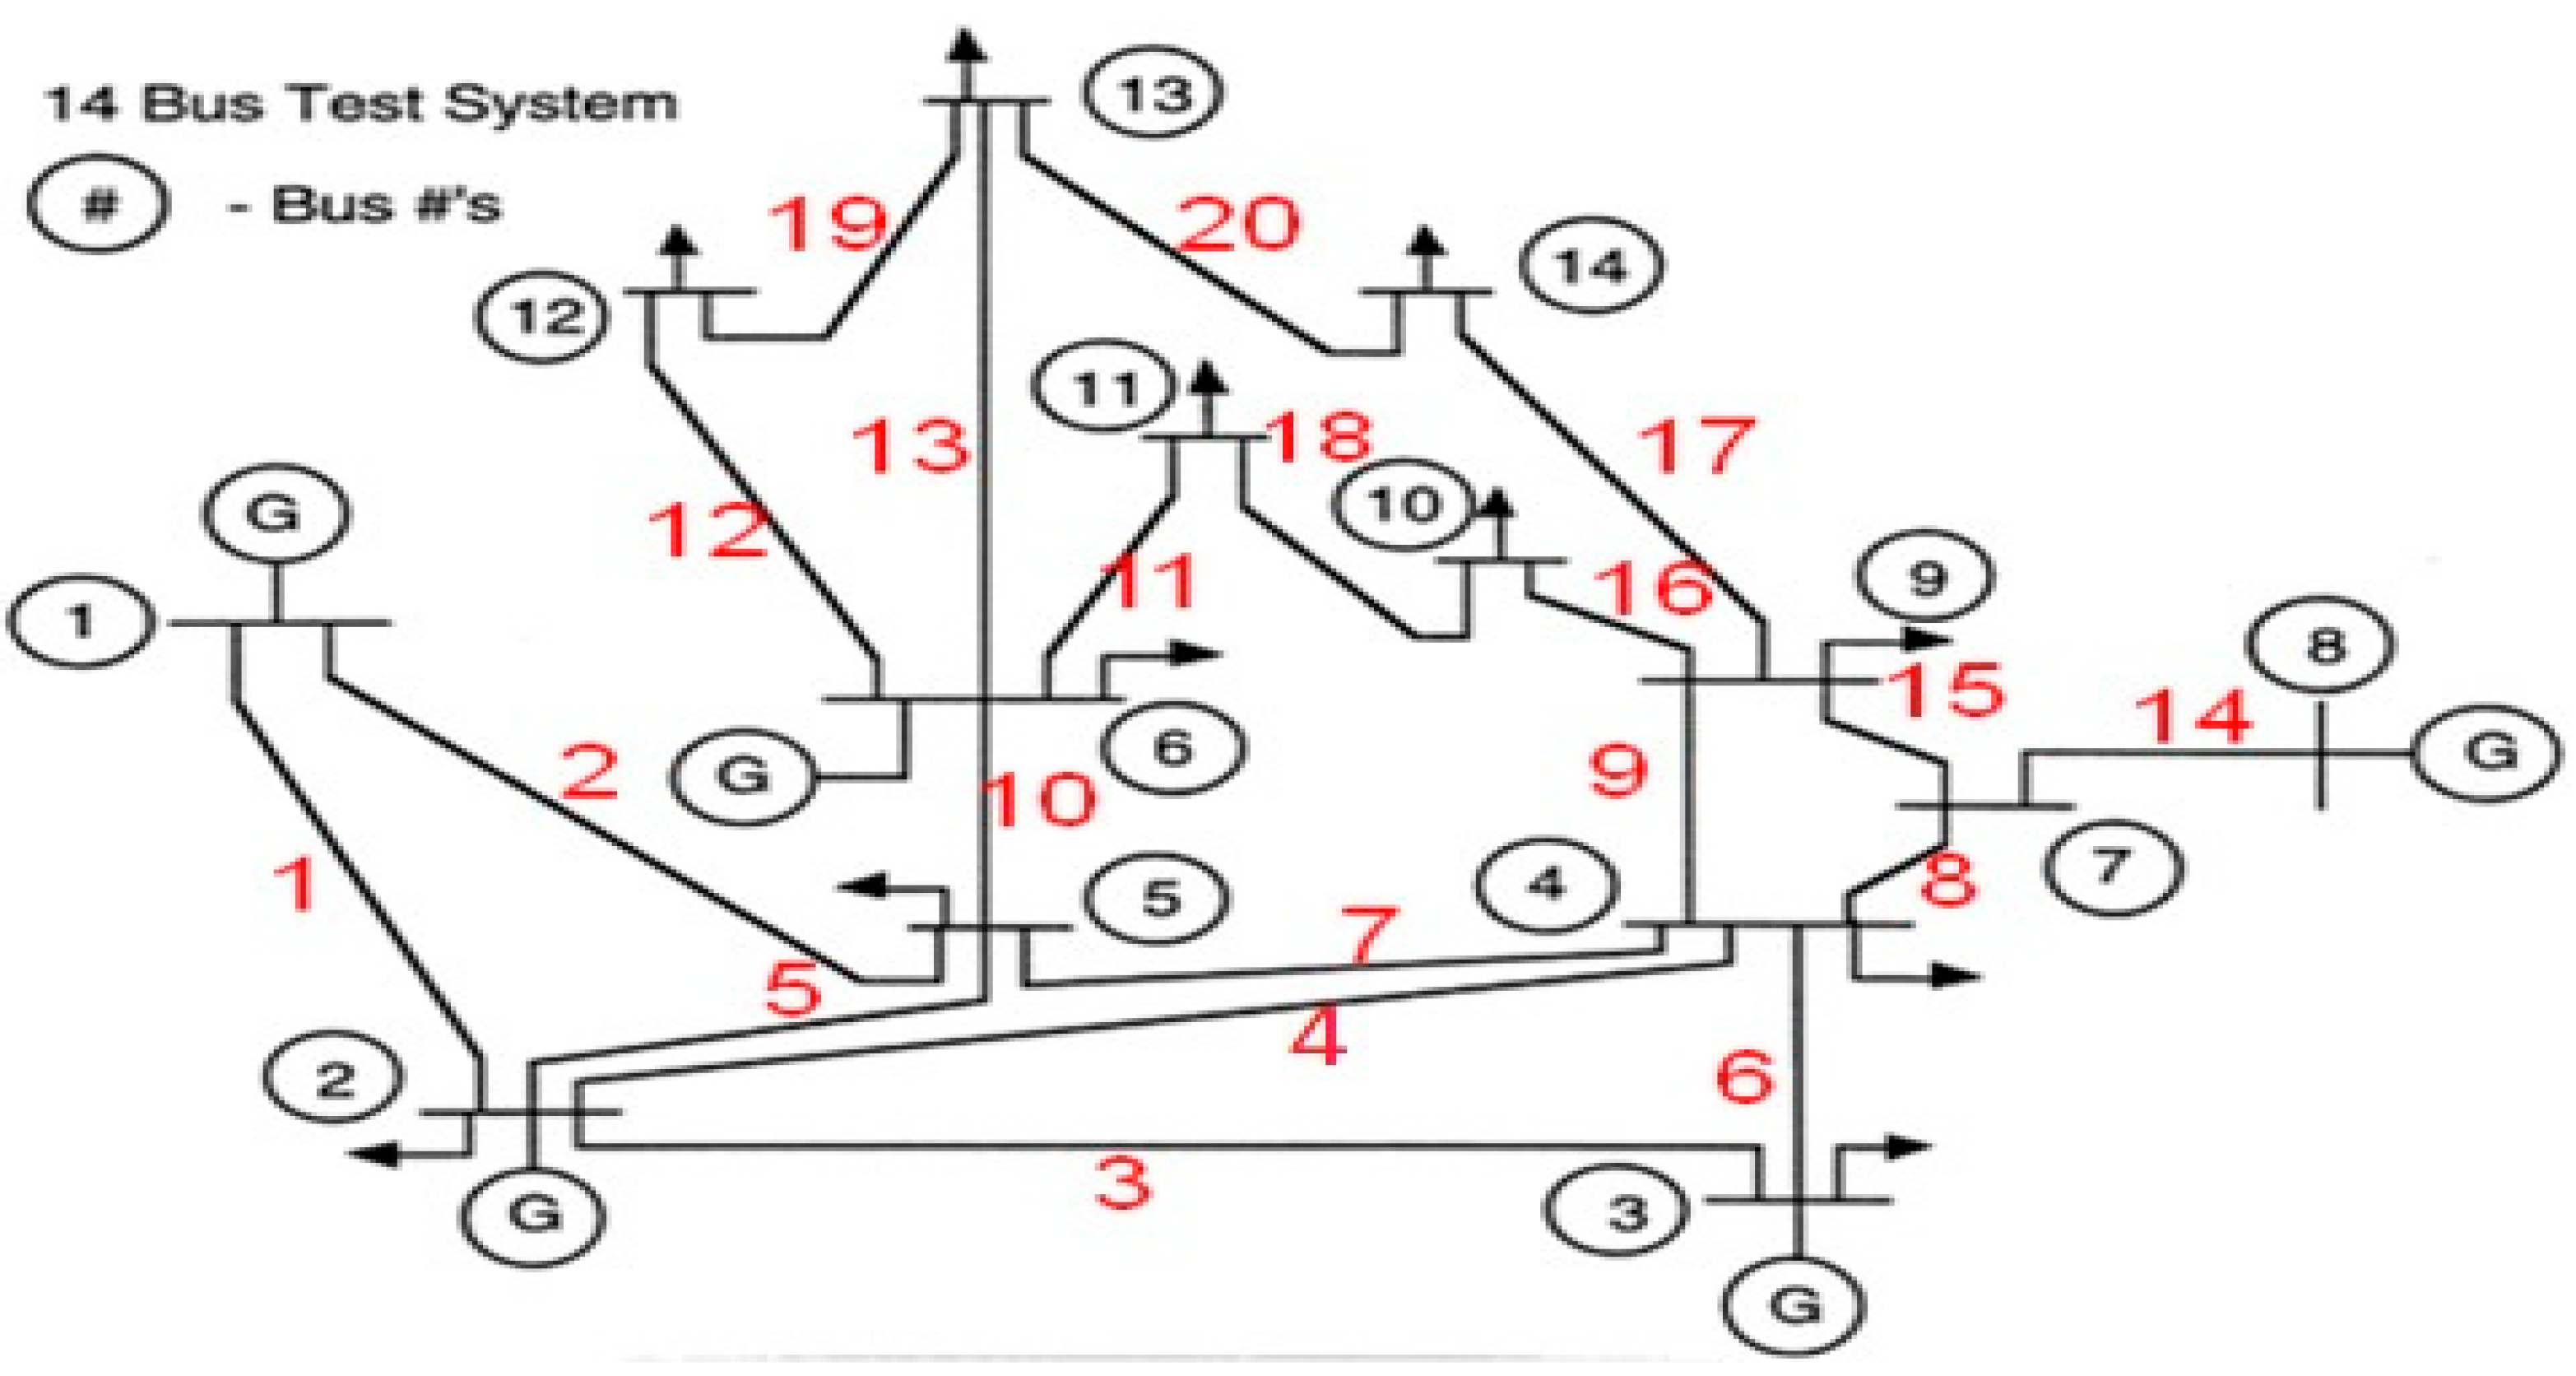
For this case study, the IEEE-14 bus test system is being utilized. It is made up of 9 load buses and 5 generator buses, with this one bus serving as the slack bus in the arrangement. The bus information is given below.
Slack bus: 1st bus
Generator bus: 2nd, 3rd, 6th, 8th buses
Load buses: 4th, 5th, 7th, 9-14th buses
It consists of 20 Transmission lines
Base MVA = 100MVA
Maximum number of iterations = 100.
Figure 2.
Test configuration for the IEEE-14 bus system.
Figure 2.
Test configuration for the IEEE-14 bus system.
5.2. Results of Stability Indices
Here the results of the Line Stability Index (LSI) and Voltage Stability Index (VSI) are given, which are obtained based on load flow results from equations 3 and 4.
Table 1 represents the VSI for different load conditions as shown in
Figure 3.
Table 1.
Voltage stability Index for different load conditions.
Table 1.
Voltage stability Index for different load conditions.
| Load bus |
VSI
Normal Load |
VSI
125% Load |
VSI
140% Load |
VSI
150% Load |
| 4 |
0.726 |
0.724 |
0.724 |
0.722 |
| 5 |
0.726 |
0.725 |
0.723 |
0.723 |
| 7 |
0.700 |
0.697 |
0.695 |
0.695 |
| 9 |
1.000 |
1.000 |
1.000 |
1.000 |
| 10 |
1.000 |
1.000 |
1.000 |
1.000 |
| 11 |
0.502 |
0.499 |
0.497 |
0.495 |
| 12 |
0.470 |
0.467 |
0.465 |
0.464 |
| 13 |
0.445 |
0.441 |
0.439 |
0.437 |
| 14 |
1.000 |
1.000 |
1.000 |
1.000 |
5.2.1. Vsi Results for Different Load Conditions
VSI’s purpose is to find the location of TCSC. Where the VSI is nearer to one, only TCSC is placed there. From the results of VSI shown in
Table 1, VSI is one at the 9th, 10th and 14th load buses, so at that location, only TCSC is placed.
5.2.2. Lsi for Different Load Conditions
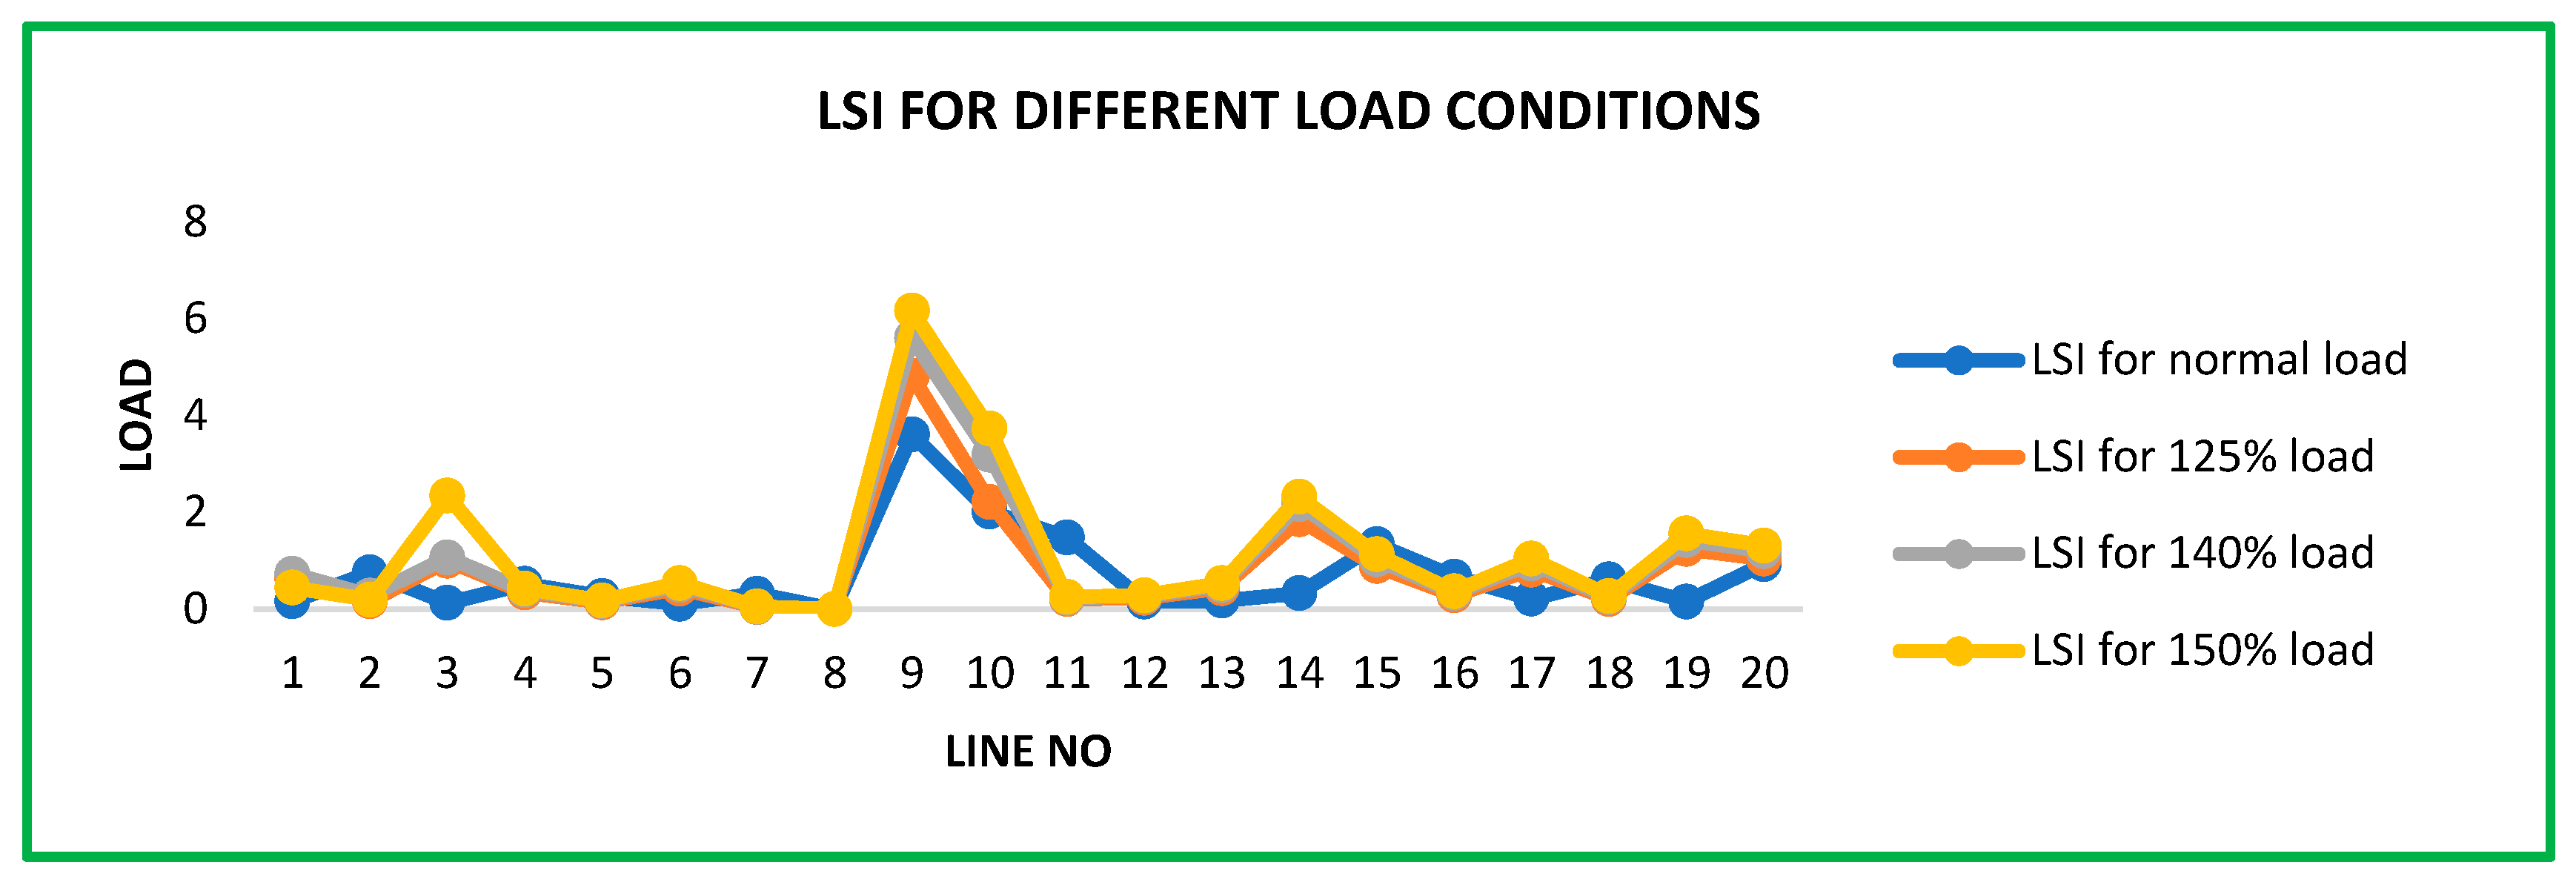
LSI’s purpose is to find the location of SVC. Where the LSI is Maximum, only SVC is placed at that location as shown in
Figure 4.
From
Table 2, at the 9th line, LSI is Maximum. So at the 9th line, SVC is placed. The following result shows the case study to fix the location of TCSC and SVC.
From the case study results shown in
Table 3, we recognized that the 9th line and 9th bus loss reduction is more when compared to the remaining locations.
Table 2.
LSI for average Load.
Table 2.
LSI for average Load.
| Bus no |
LSI for normal Load |
LSI for 125% load |
LSI for 140% load |
LSI for 150% load |
| 1 |
0.1590 |
0.6274 |
0.7306 |
0.4416 |
| 2 |
0.7568 |
0.1590 |
0.2779 |
0.1906 |
| 3 |
0.1280 |
0.9969 |
1.0649 |
2.3437 |
| 4 |
0.5183 |
0.3405 |
0.3862 |
0.4201 |
| 5 |
0.2653 |
0.1397 |
0.1587 |
0.1727 |
| 6 |
0.1086 |
0.4211 |
0.4958 |
0.5359 |
| 7 |
0.3128 |
0.0392 |
0.0456 |
0.0501 |
| 8 |
0.0000 |
0.0000 |
0.000 |
0.0000 |
| 9 |
3.6137 |
4.8228 |
5.6146 |
6.1722 |
| 10 |
2.0189 |
2.2173 |
3.1881 |
3.7308 |
| 11 |
1.4794 |
0.2030 |
0.2296 |
0.2506 |
| 12 |
0.1526 |
0.2286 |
0.2603 |
0.2835 |
| 13 |
0.1736 |
0.4304 |
0.4900 |
0.5342 |
| 14 |
0.3270 |
1.8534 |
2.1655 |
2.3203 |
| 15 |
1.3372 |
0.8876 |
1.0274 |
1.1300 |
| 16 |
0.6680 |
0.2824 |
0.3287 |
0.3631 |
| 17 |
0.2100 |
0.8145 |
0.9447 |
1.0409 |
| 18 |
0.6090 |
0.2086 |
0.2430 |
0.2688 |
| 19 |
0.1545 |
1.2385 |
1.4234 |
1.5622 |
| 20 |
0.9274 |
1.0395 |
1.1956 |
1.3123 |
Table 3.
Case study results after placing FACTS devices.
Table 3.
Case study results after placing FACTS devices.
| Location |
GA |
DEIWO |
| Line |
Bus |
PLOSS (MW) |
Loss reduction (MW) |
PLOSS (MW) |
Loss reduction (MW) |
| 9 |
9 |
29.065 |
1.2392 |
29.0653 |
1.2399 |
| 9 |
10 |
29.650 |
1.0989 |
29.1749 |
1.1303 |
| 9 |
14 |
29.303 |
1.0036 |
29.2947 |
1.0105 |
5.3. GA Results
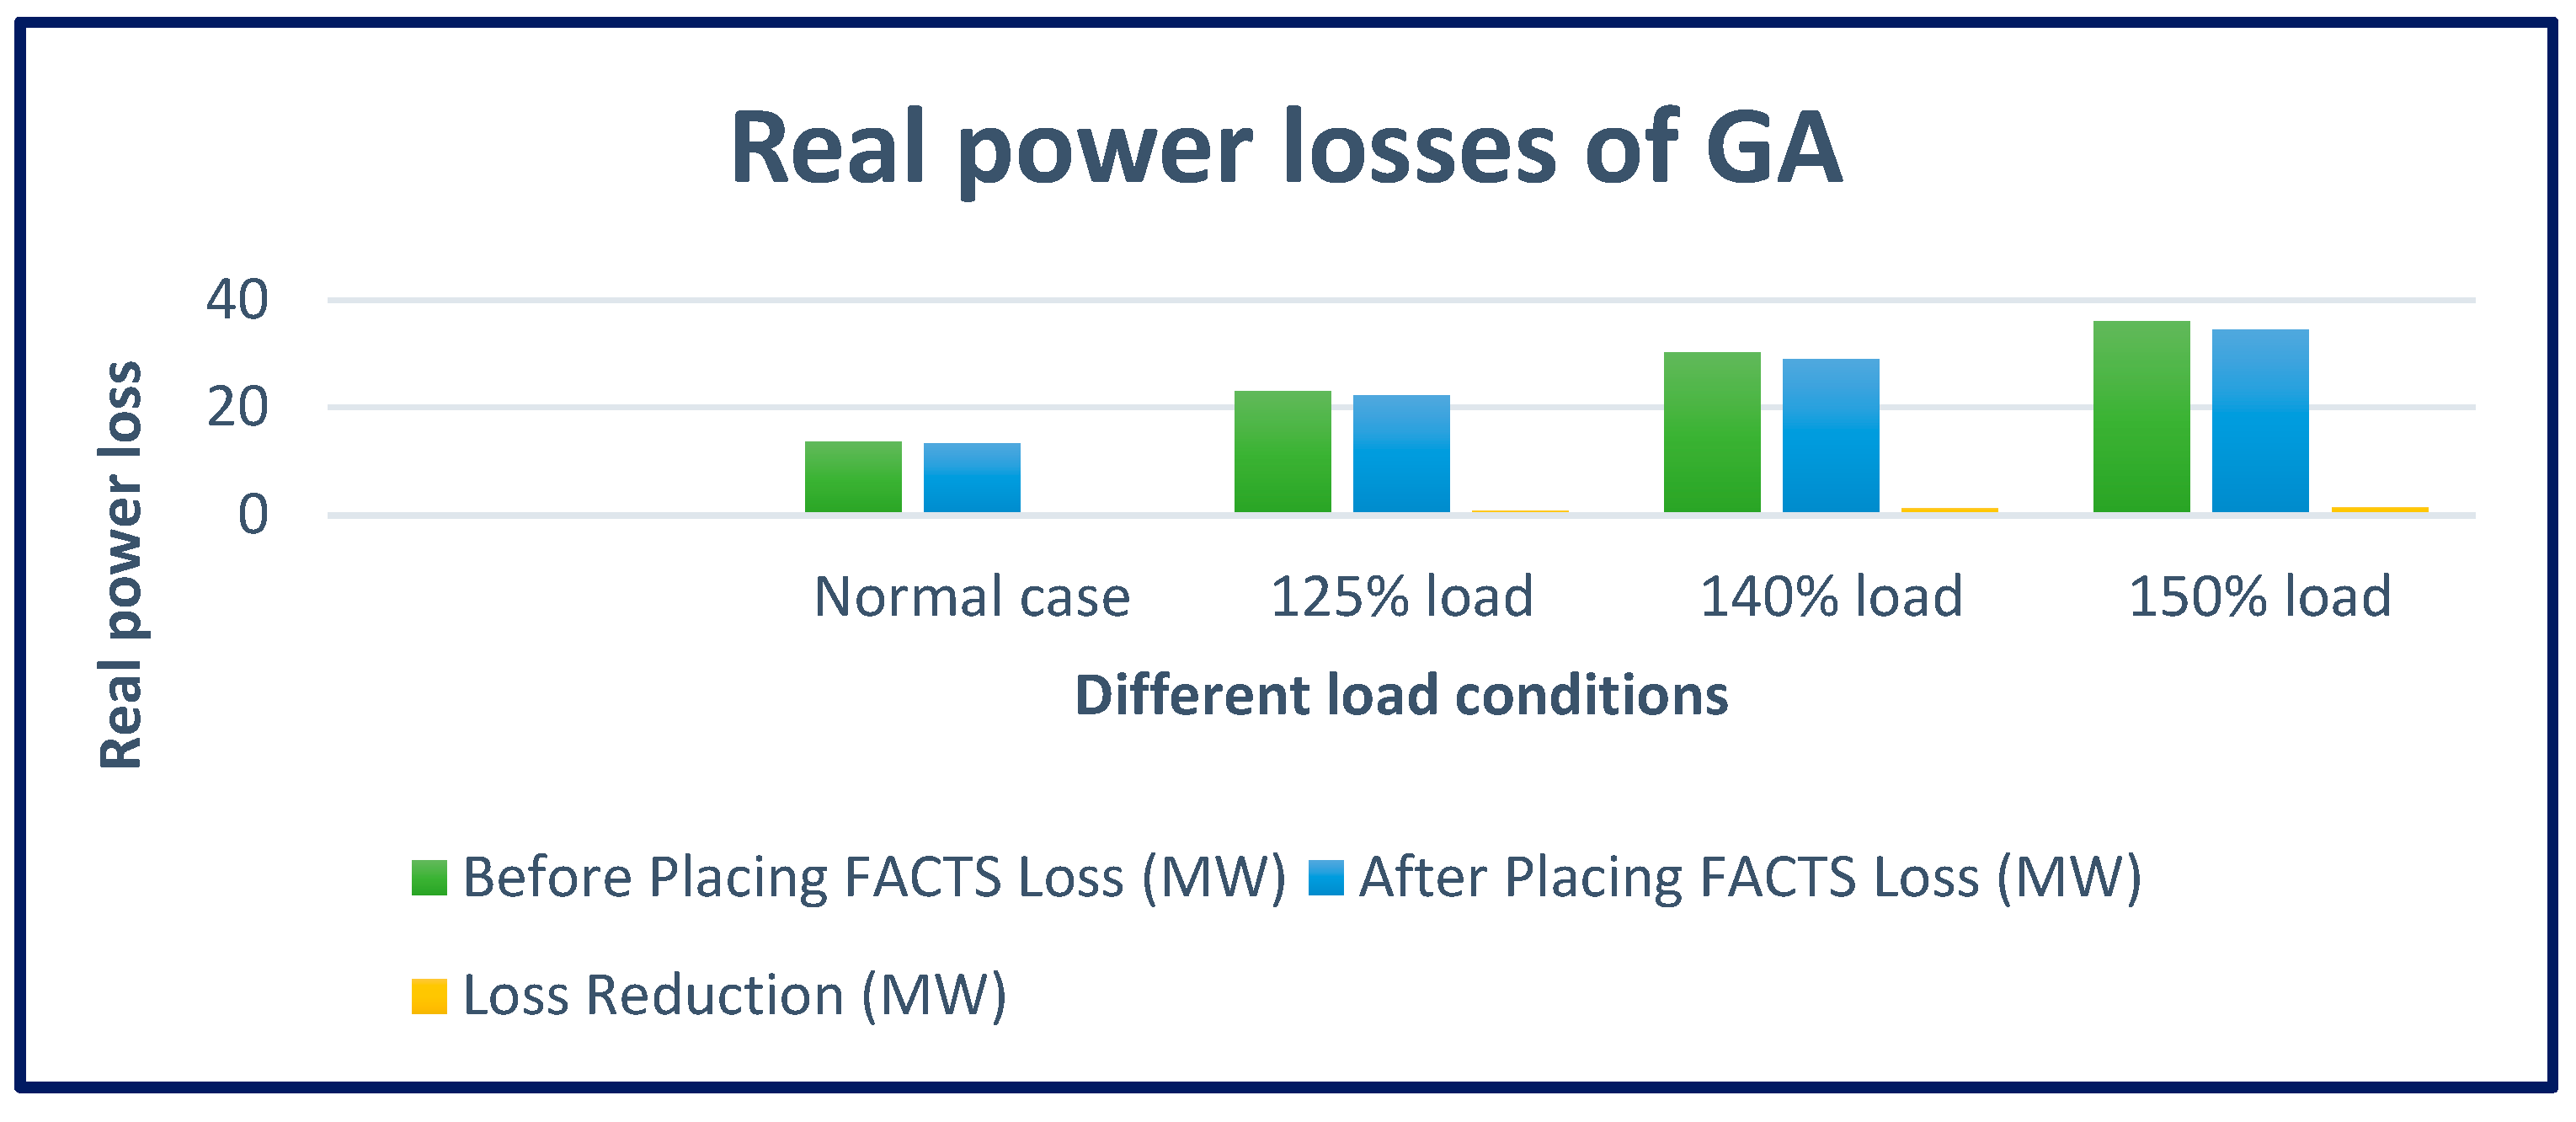
The following are the results of the Genetic Algorithm (GA) for Real power in different load conditions as shown in
Table 4 and graphically represented in
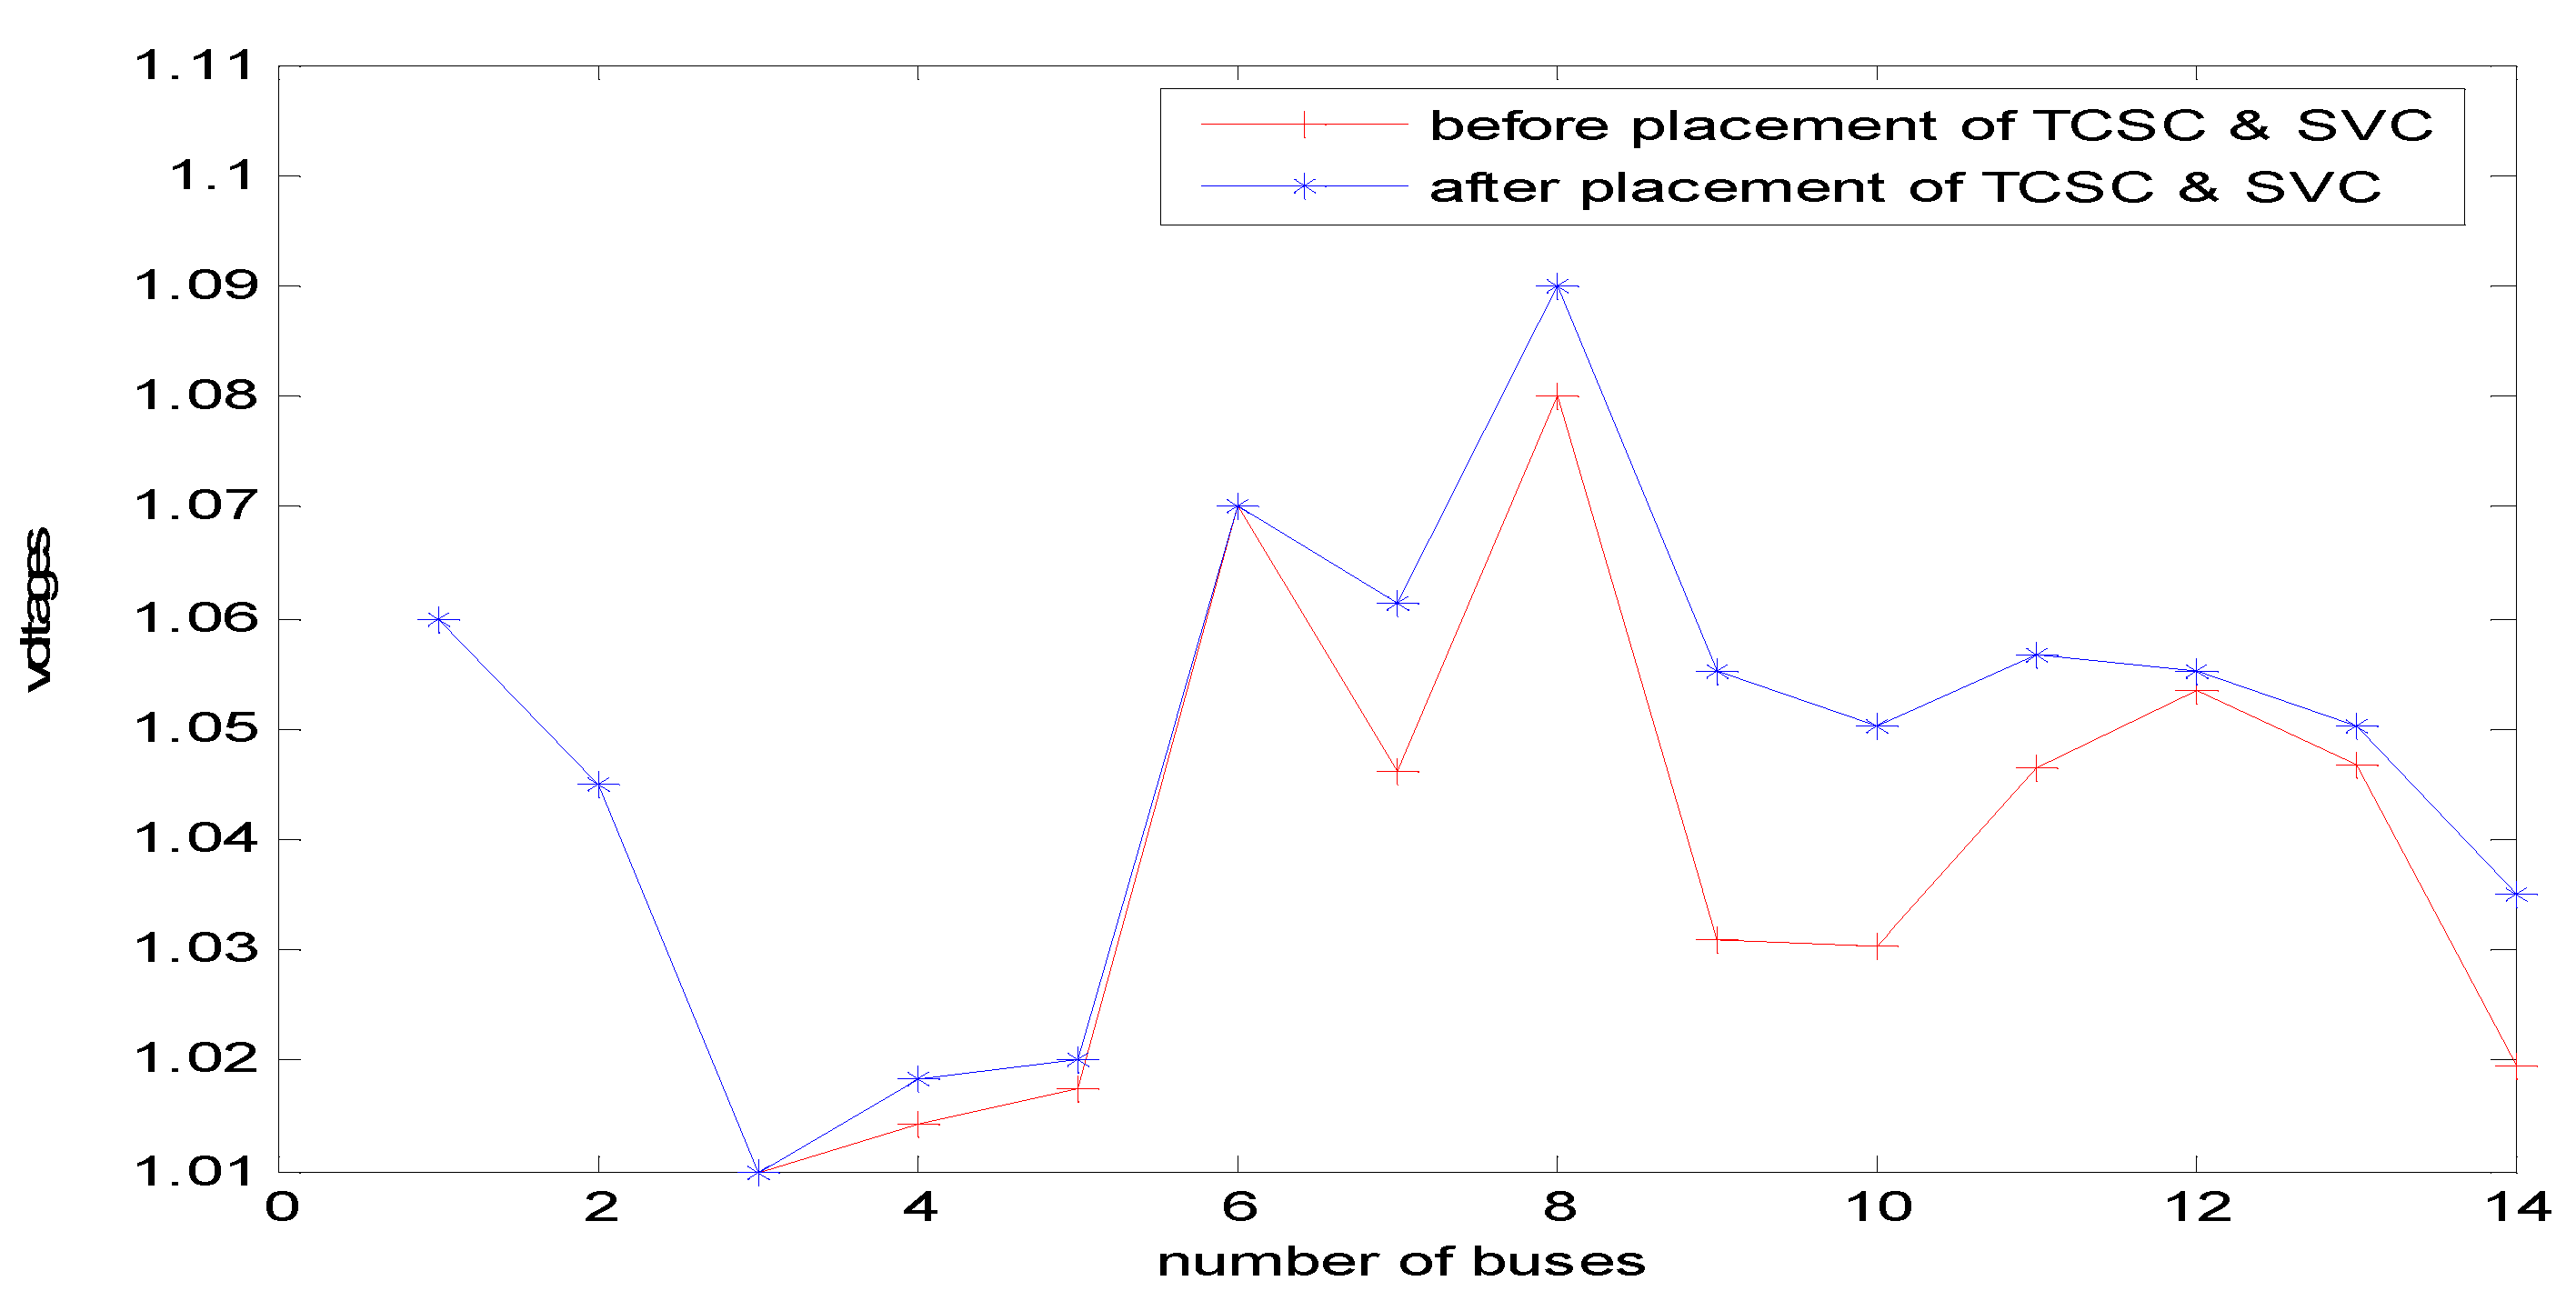
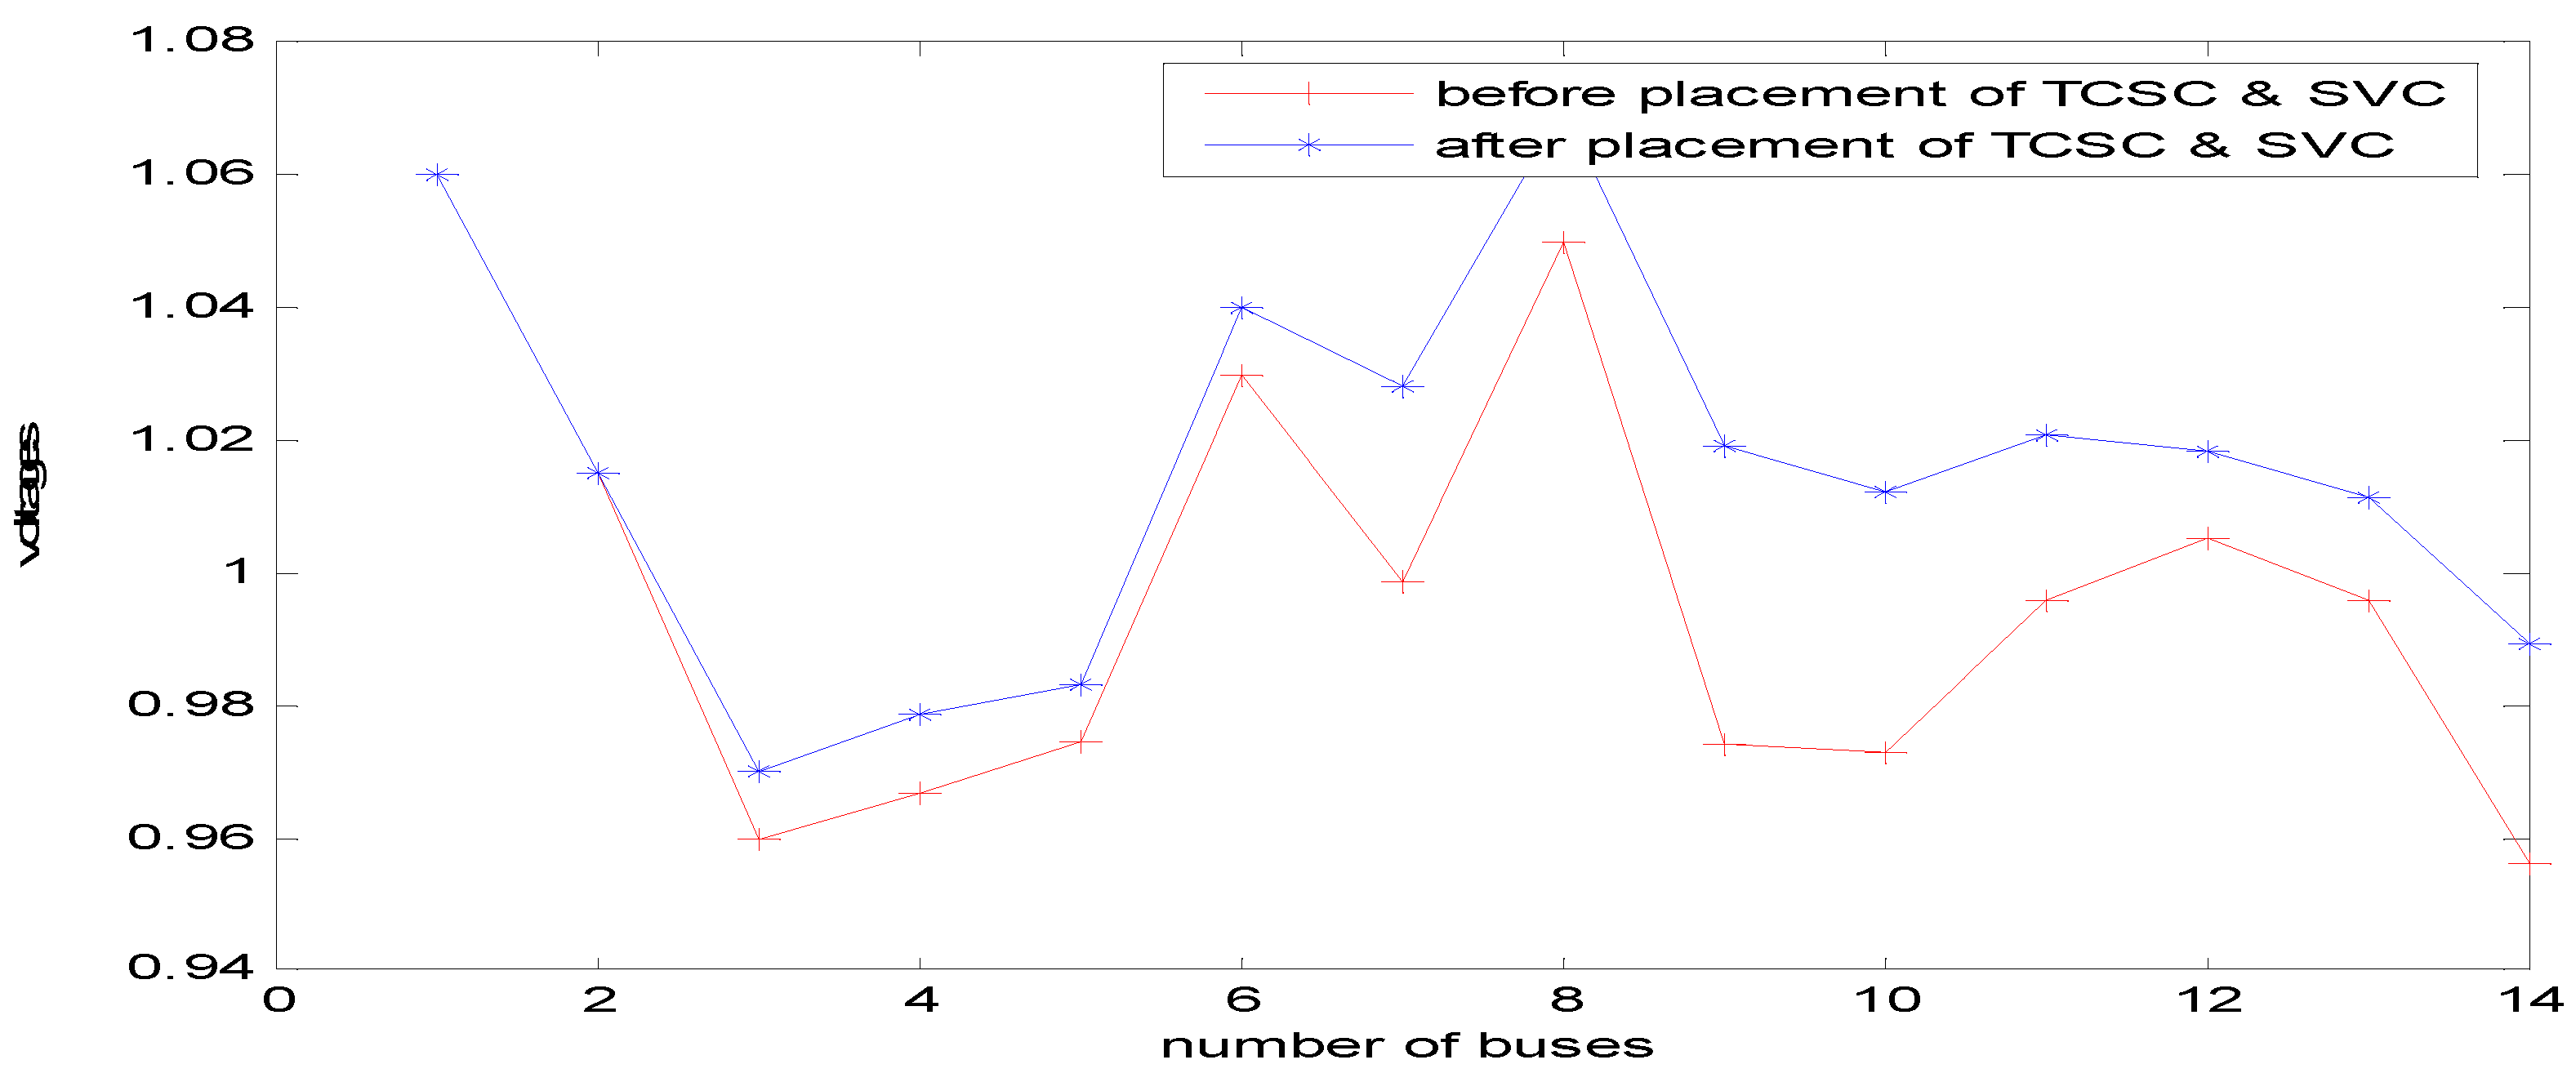
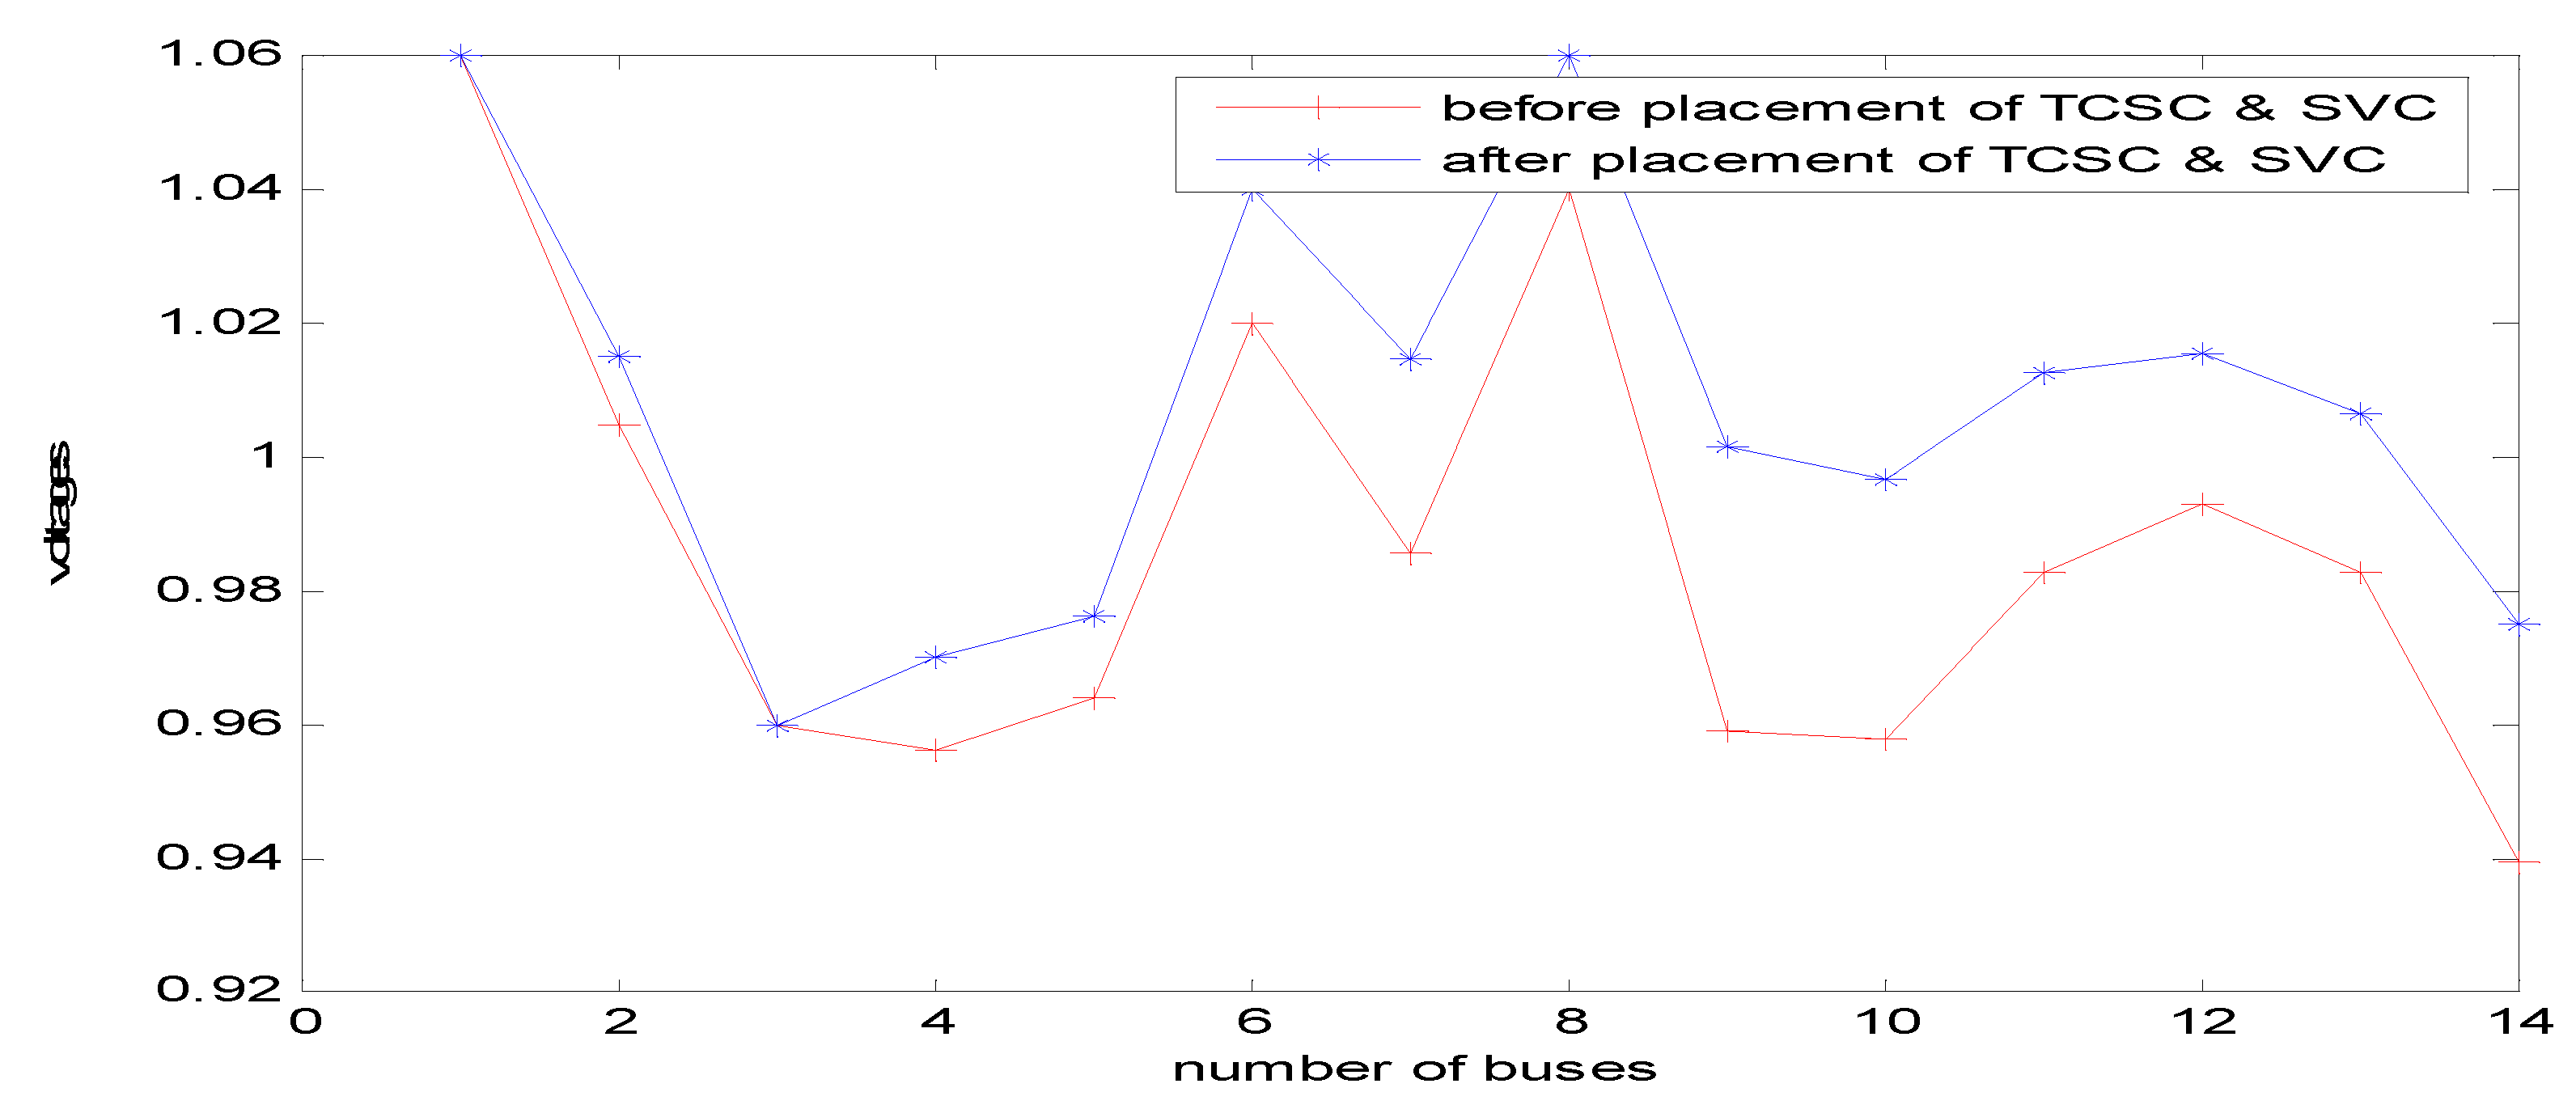
Figure 5. Voltage profiles can be shown in
Table 6 with different load conditions and it is represented in
Figure 7,
Figure 8,
Figure 9 and
Figure 10.
Table 4.
Real power losses of GA.
Table 4.
Real power losses of GA.
| Particulars. |
Before Placing FACTS Loss (MW) |
After Placing FACTS Loss (MW) |
Loss Reduction (MW) |
| Normal case |
13.5766 |
13.3741 |
0.2026 |
| 125% load |
23.088 |
22.2621 |
0.7467 |
| 140% load |
30.3052 |
29.0668 |
1.2384 |
| 150% load |
36.0280 |
34.5264 |
1.5016 |
Table 5.
Reactive power losses of GA.
Table 5.
Reactive power losses of GA.
| Particulars |
Before Placing Loss (Mvar) |
After placing Loss (Mvar) |
Loss Reduction (Mvar) |
| Normal case |
28.553 |
28.328 |
0.225 |
| 125% load |
67.640 |
65.075 |
2.565 |
| 140% load |
97.705 |
95.073 |
2.632 |
| 150% load |
120.800 |
116.580 |
4.220 |
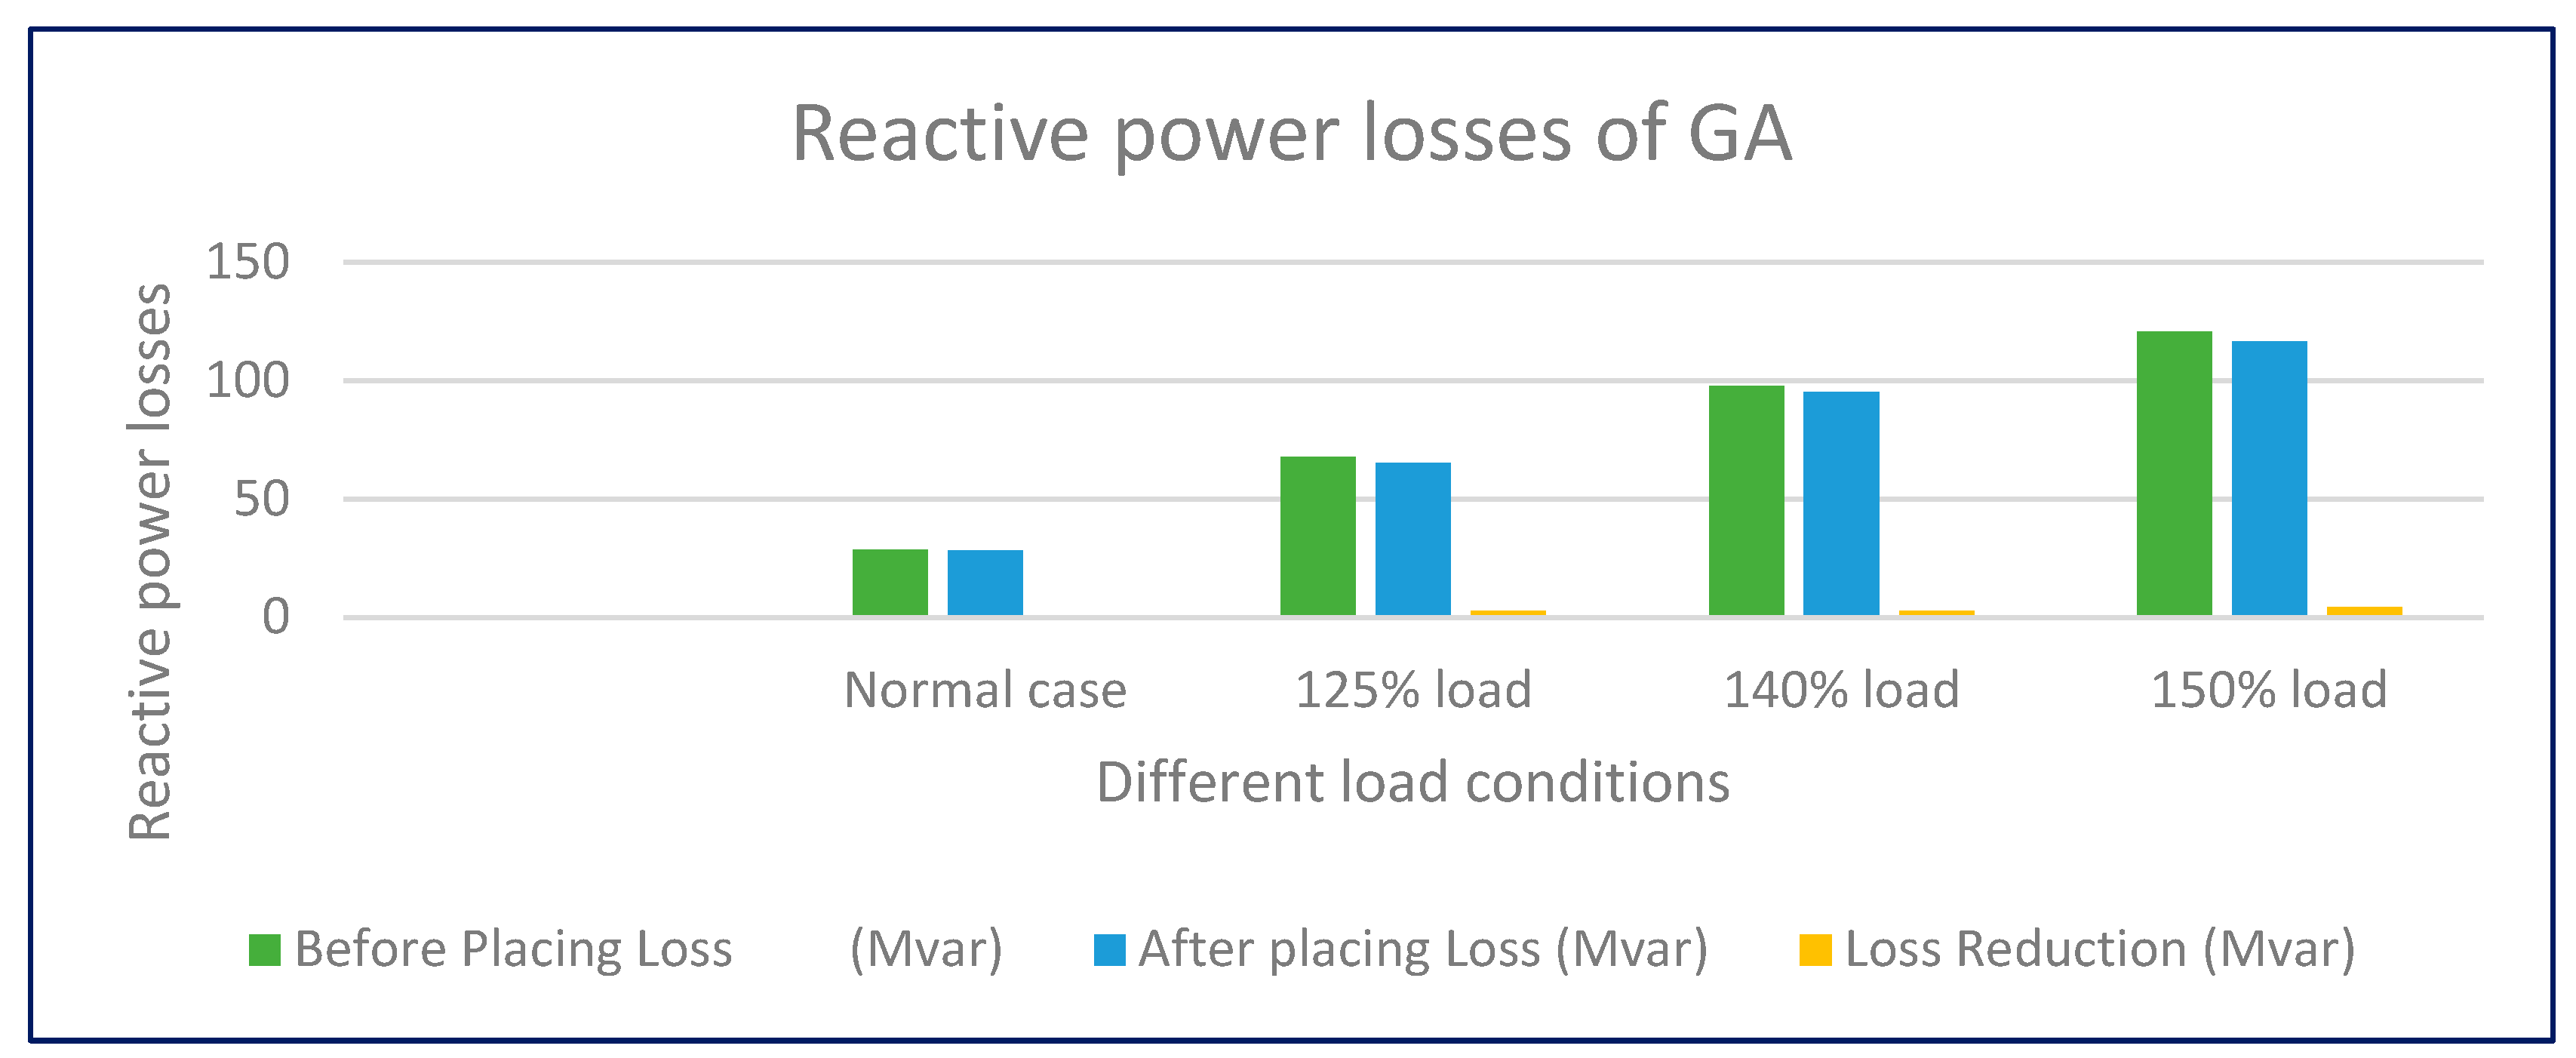
For Reactive power loss the different load conditions as shown in
Table 5, and graphically represented in
Figure 6.
Figure 5.
Real power losses of GA.
Figure 5.
Real power losses of GA.
Figure 6.
Reactive power loss.
Figure 6.
Reactive power loss.
Figure 7.
Voltage profile for normal cases in GA.
Figure 7.
Voltage profile for normal cases in GA.
Figure 8.
Voltage profile for 125% of cases in GA.
Figure 8.
Voltage profile for 125% of cases in GA.
Figure 9.
Voltage profile for 140% load in GA.
Figure 9.
Voltage profile for 140% load in GA.
Figure 10.
Voltage profile for 150% load in GA.
Figure 10.
Voltage profile for 150% load in GA.
5.4. Voltage Profiles of GA5.5. Deiwo Results
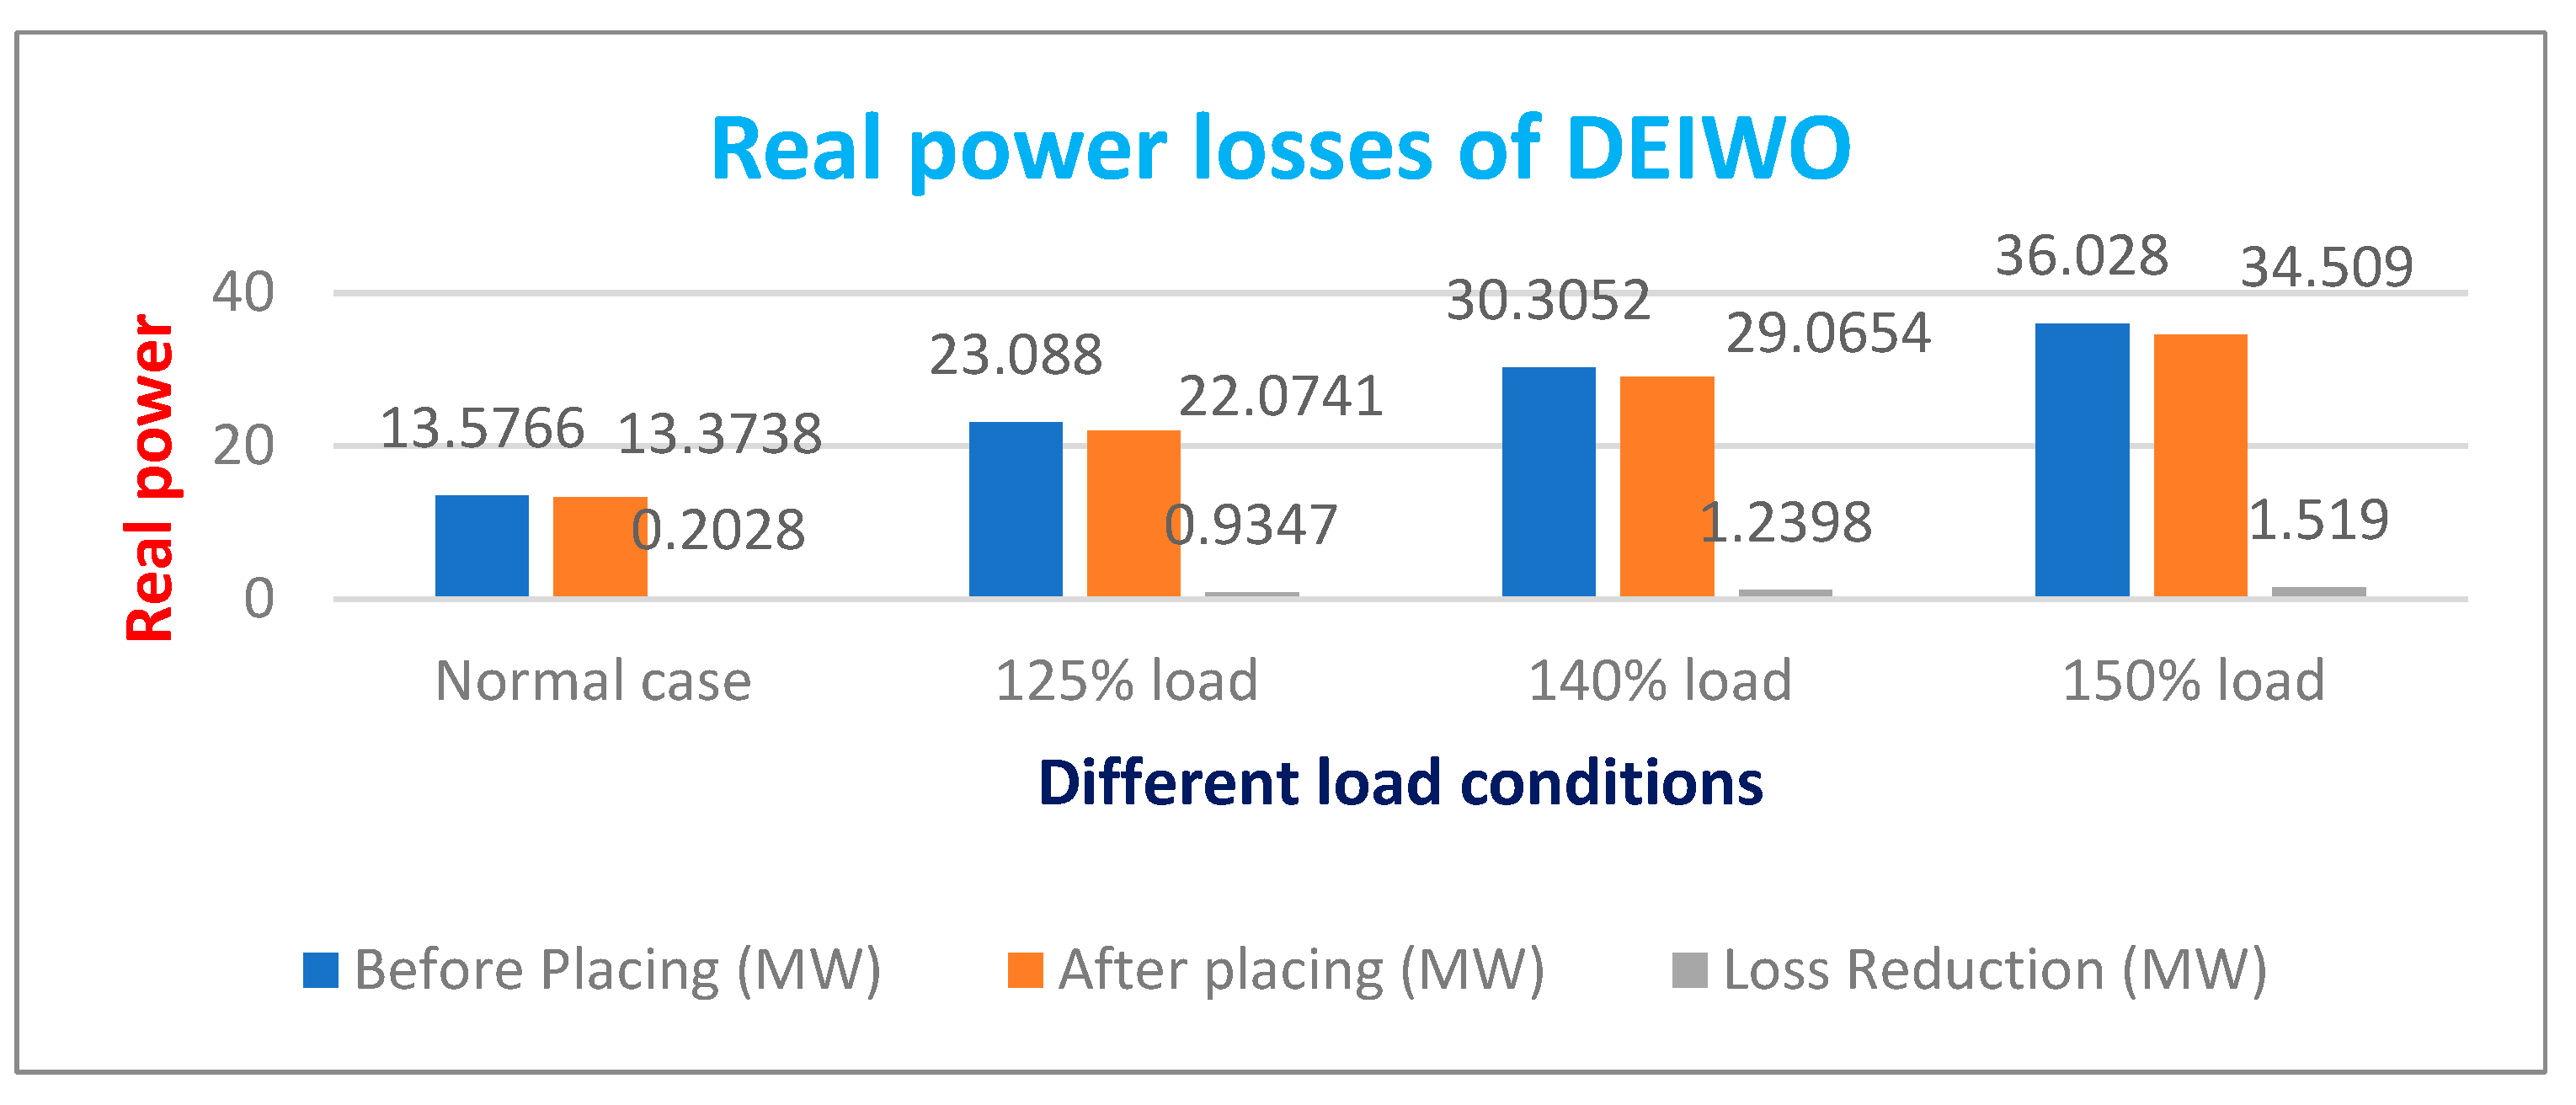
The following are the results obtained by performing Differential evolution Invasive weed Optimization. The real power losses for different load conditions with the help of the DEIWO Algorithm can be shown in
Table 7 and graphically represented in
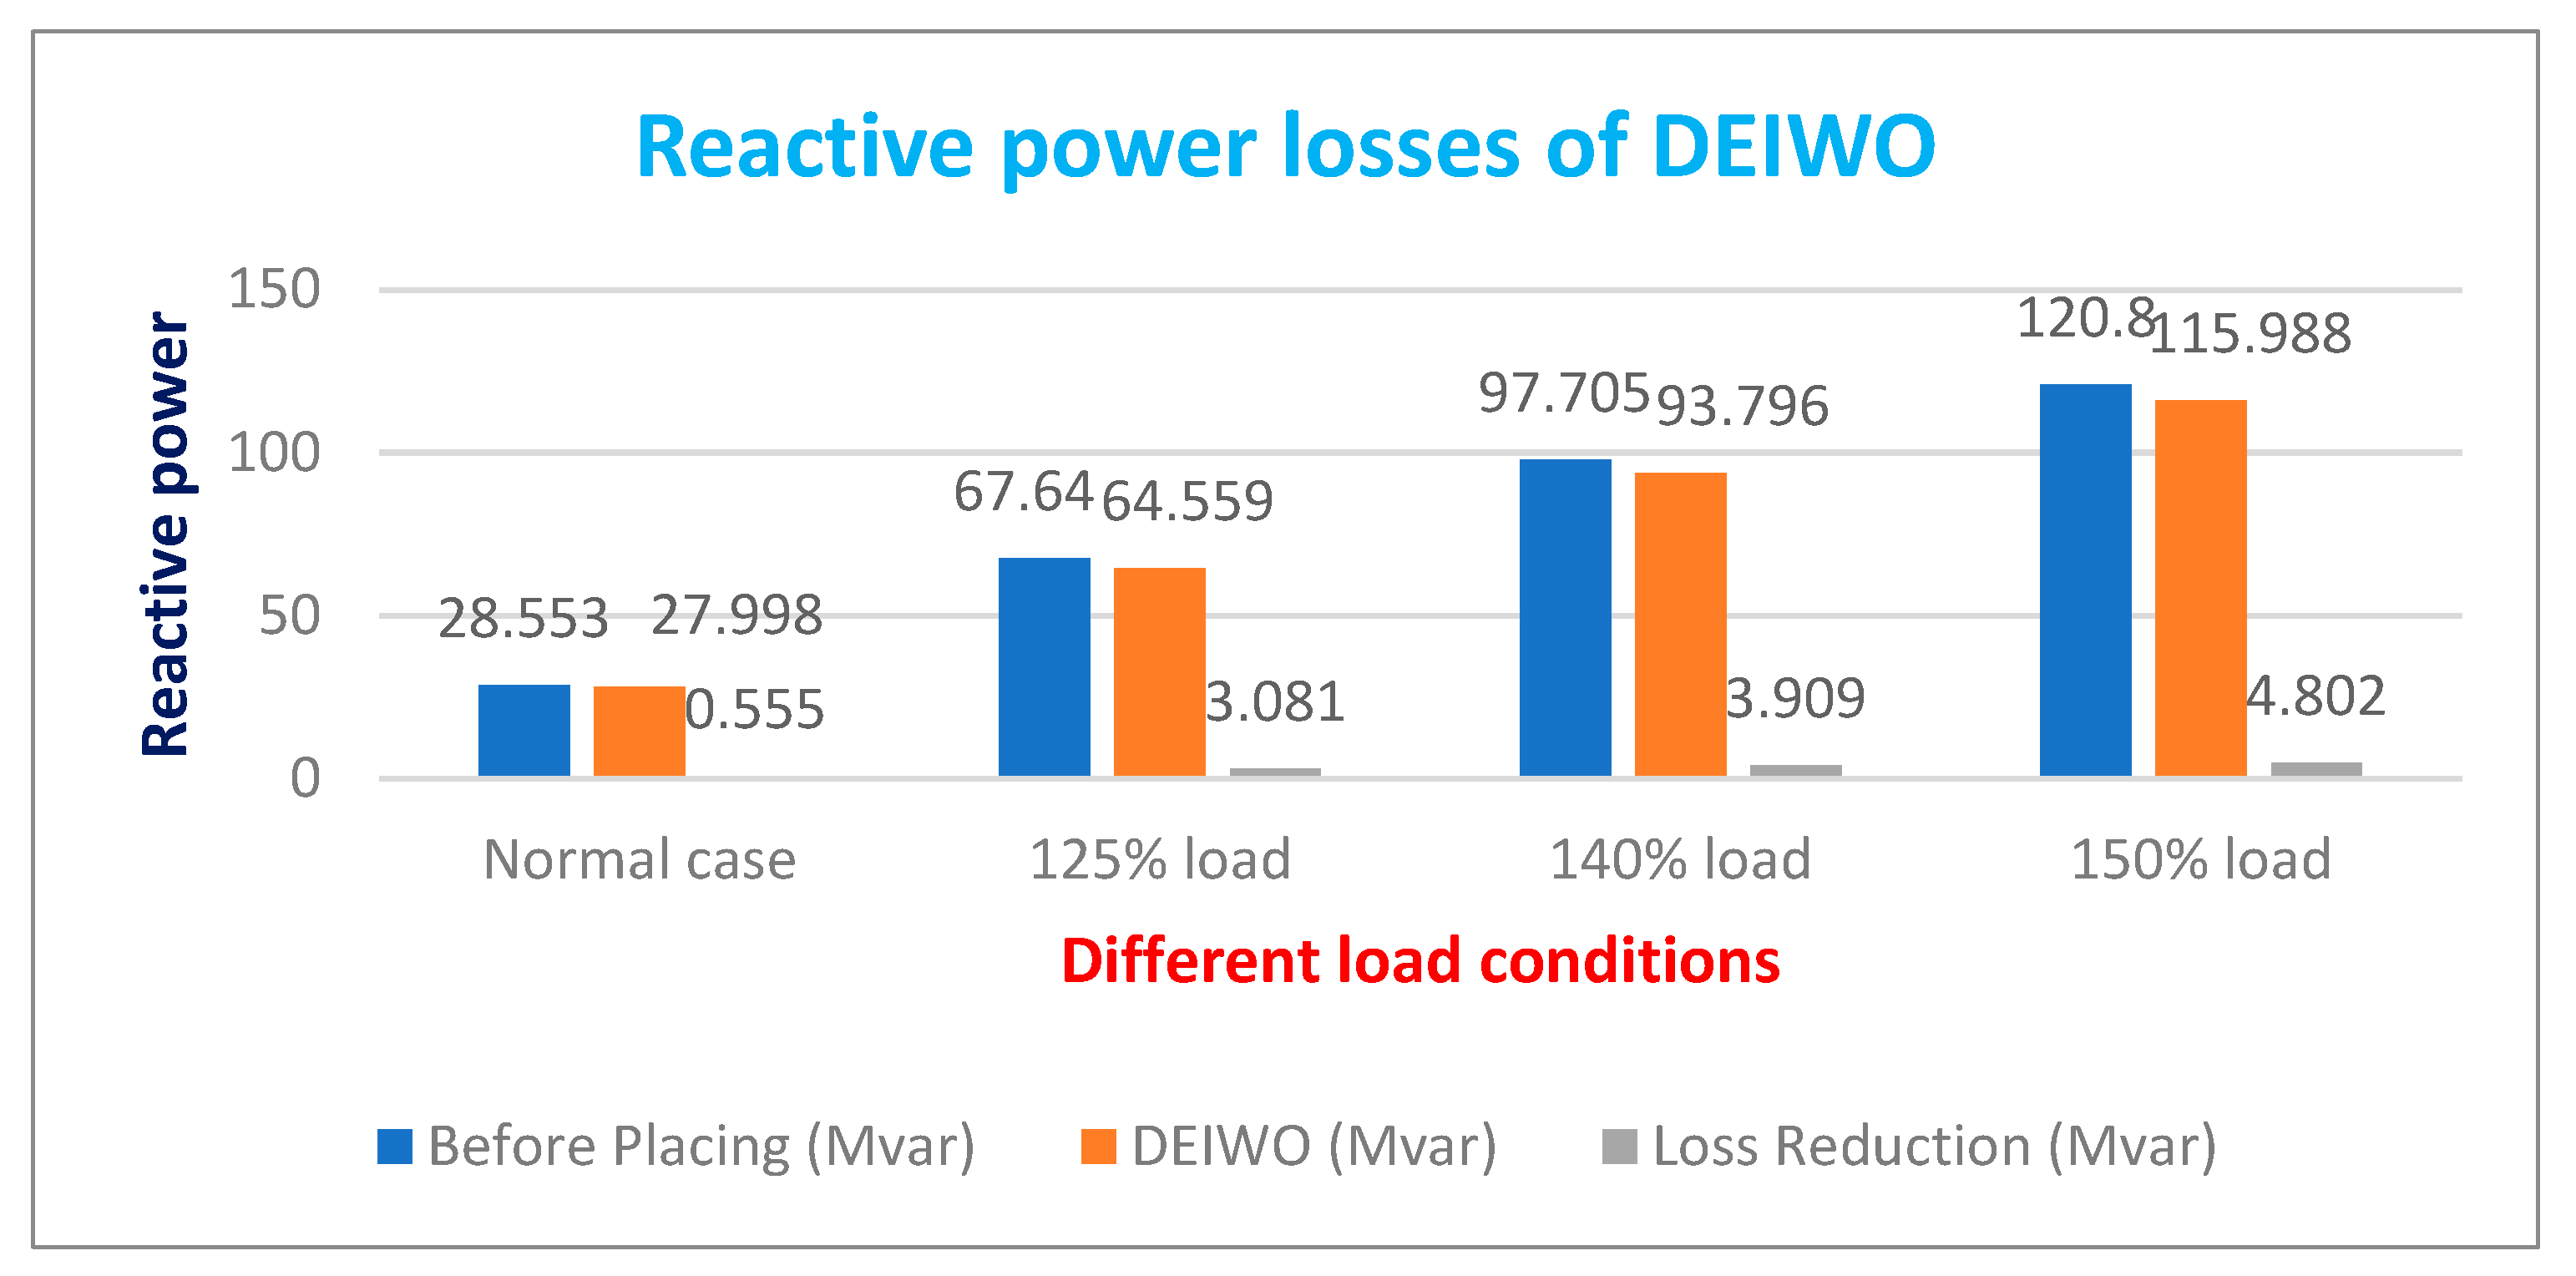
Figure 11. Reactive power losses can be shown in
Table 8 and graphically represented in
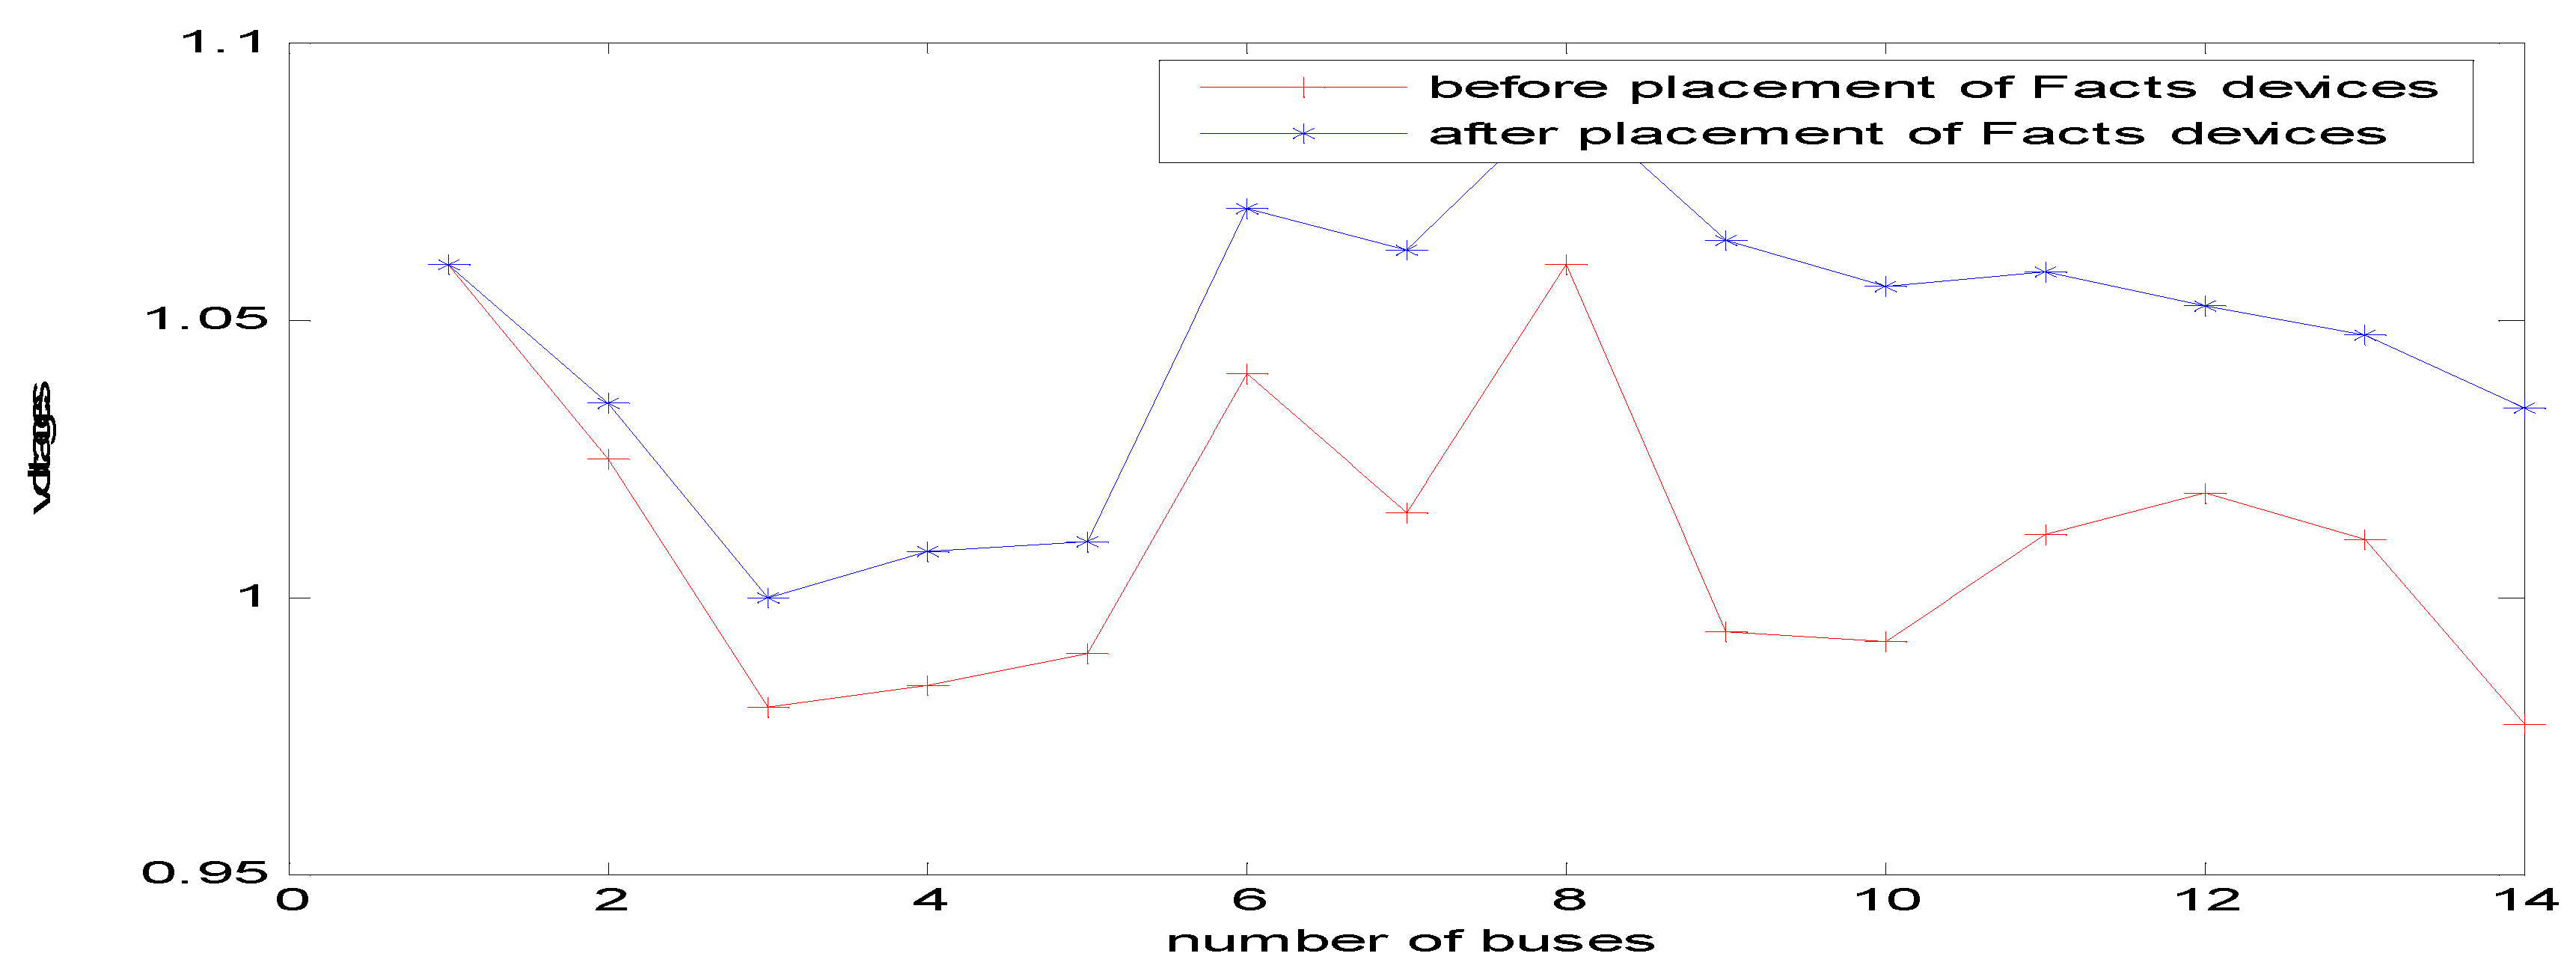
Figure 12. Voltage profiles can be shown with the help of different load conditions in
Table 9 with graphically shown in
Figure 13,
Figure 14,
Figure 15 and
Figure 16.
5.5.1. Voltage profiles for DEIWO
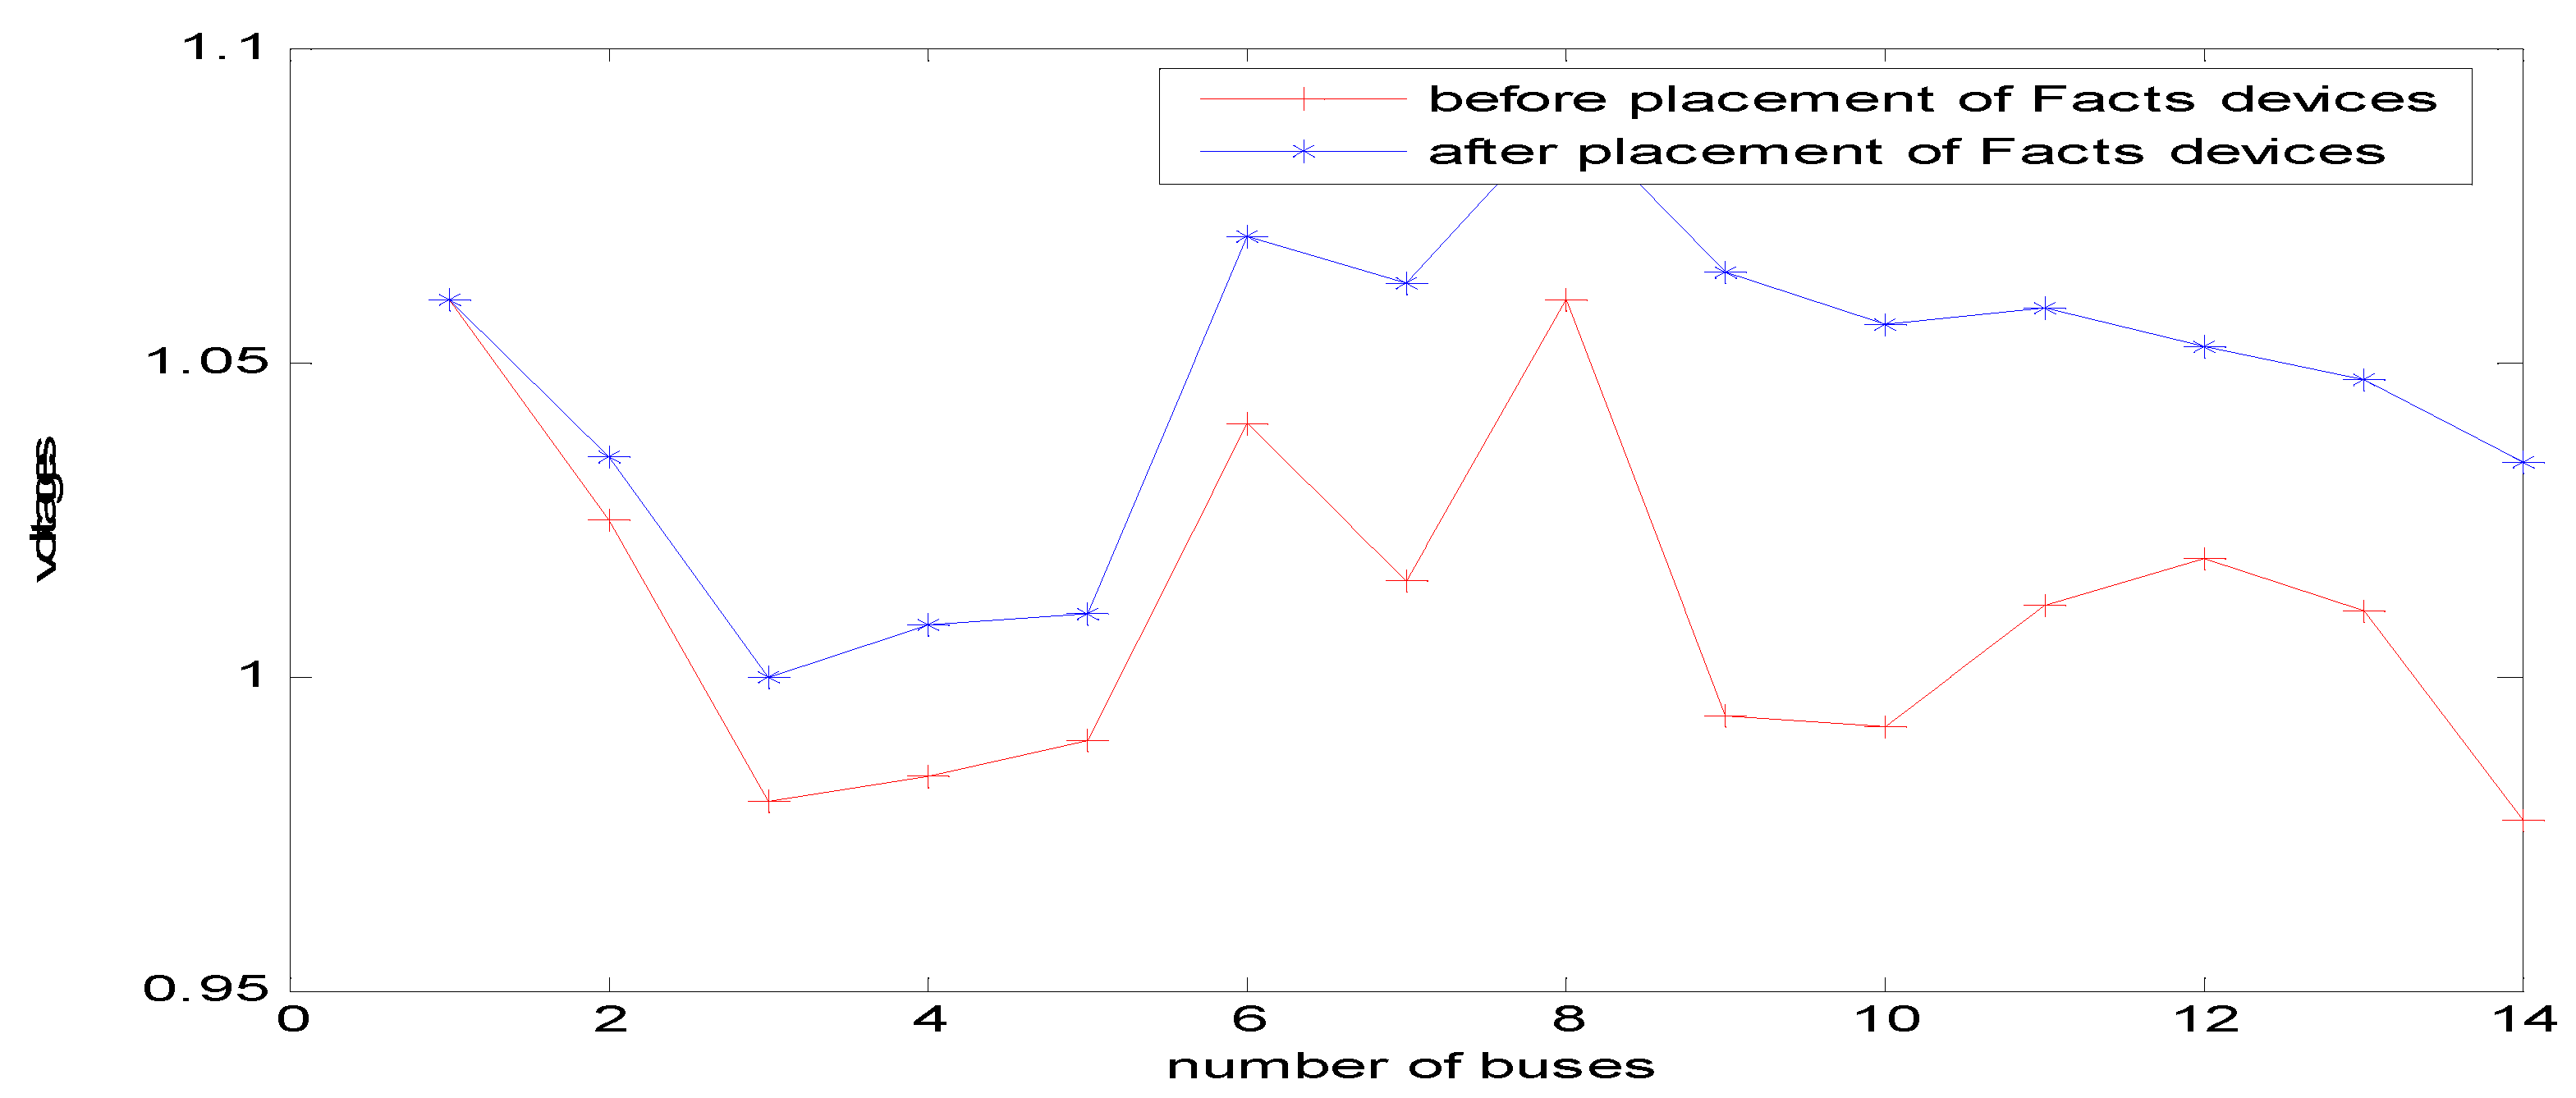
5.6. Comparison of GA and DEIWO
The real power losses, Reactive power losses and voltage profiles comparison for different load conditions with the help of GA& DEIWO.
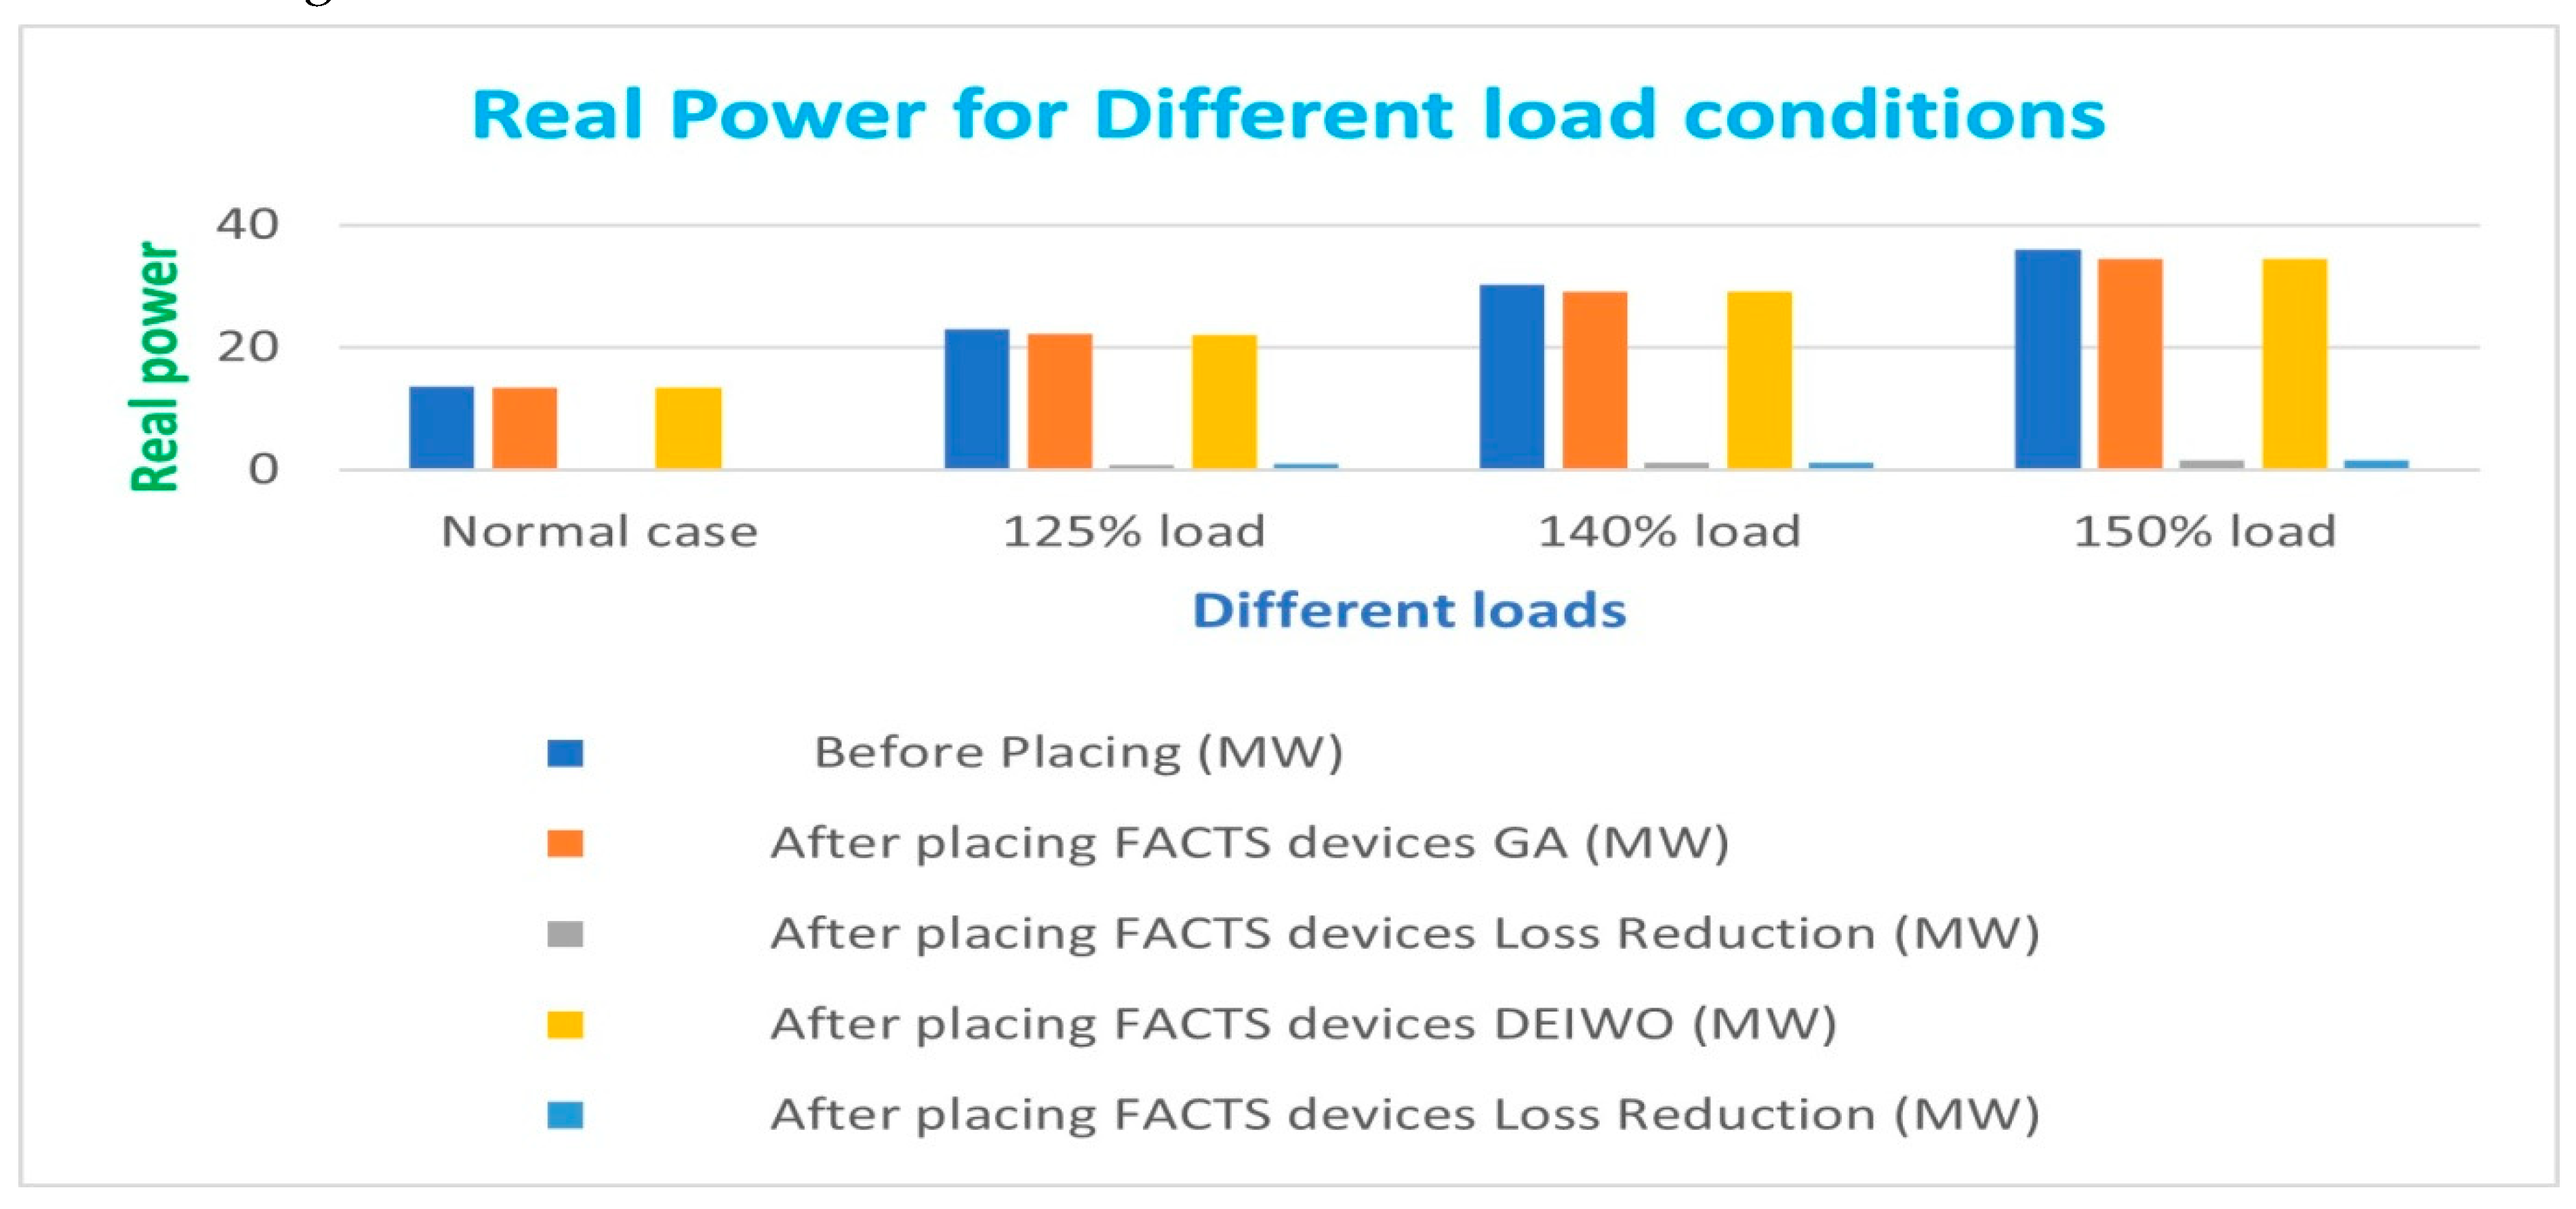
Case 1: Real power losses can be computed as demonstrated in
Table 11 and graphically illustrated in
Figure 17.
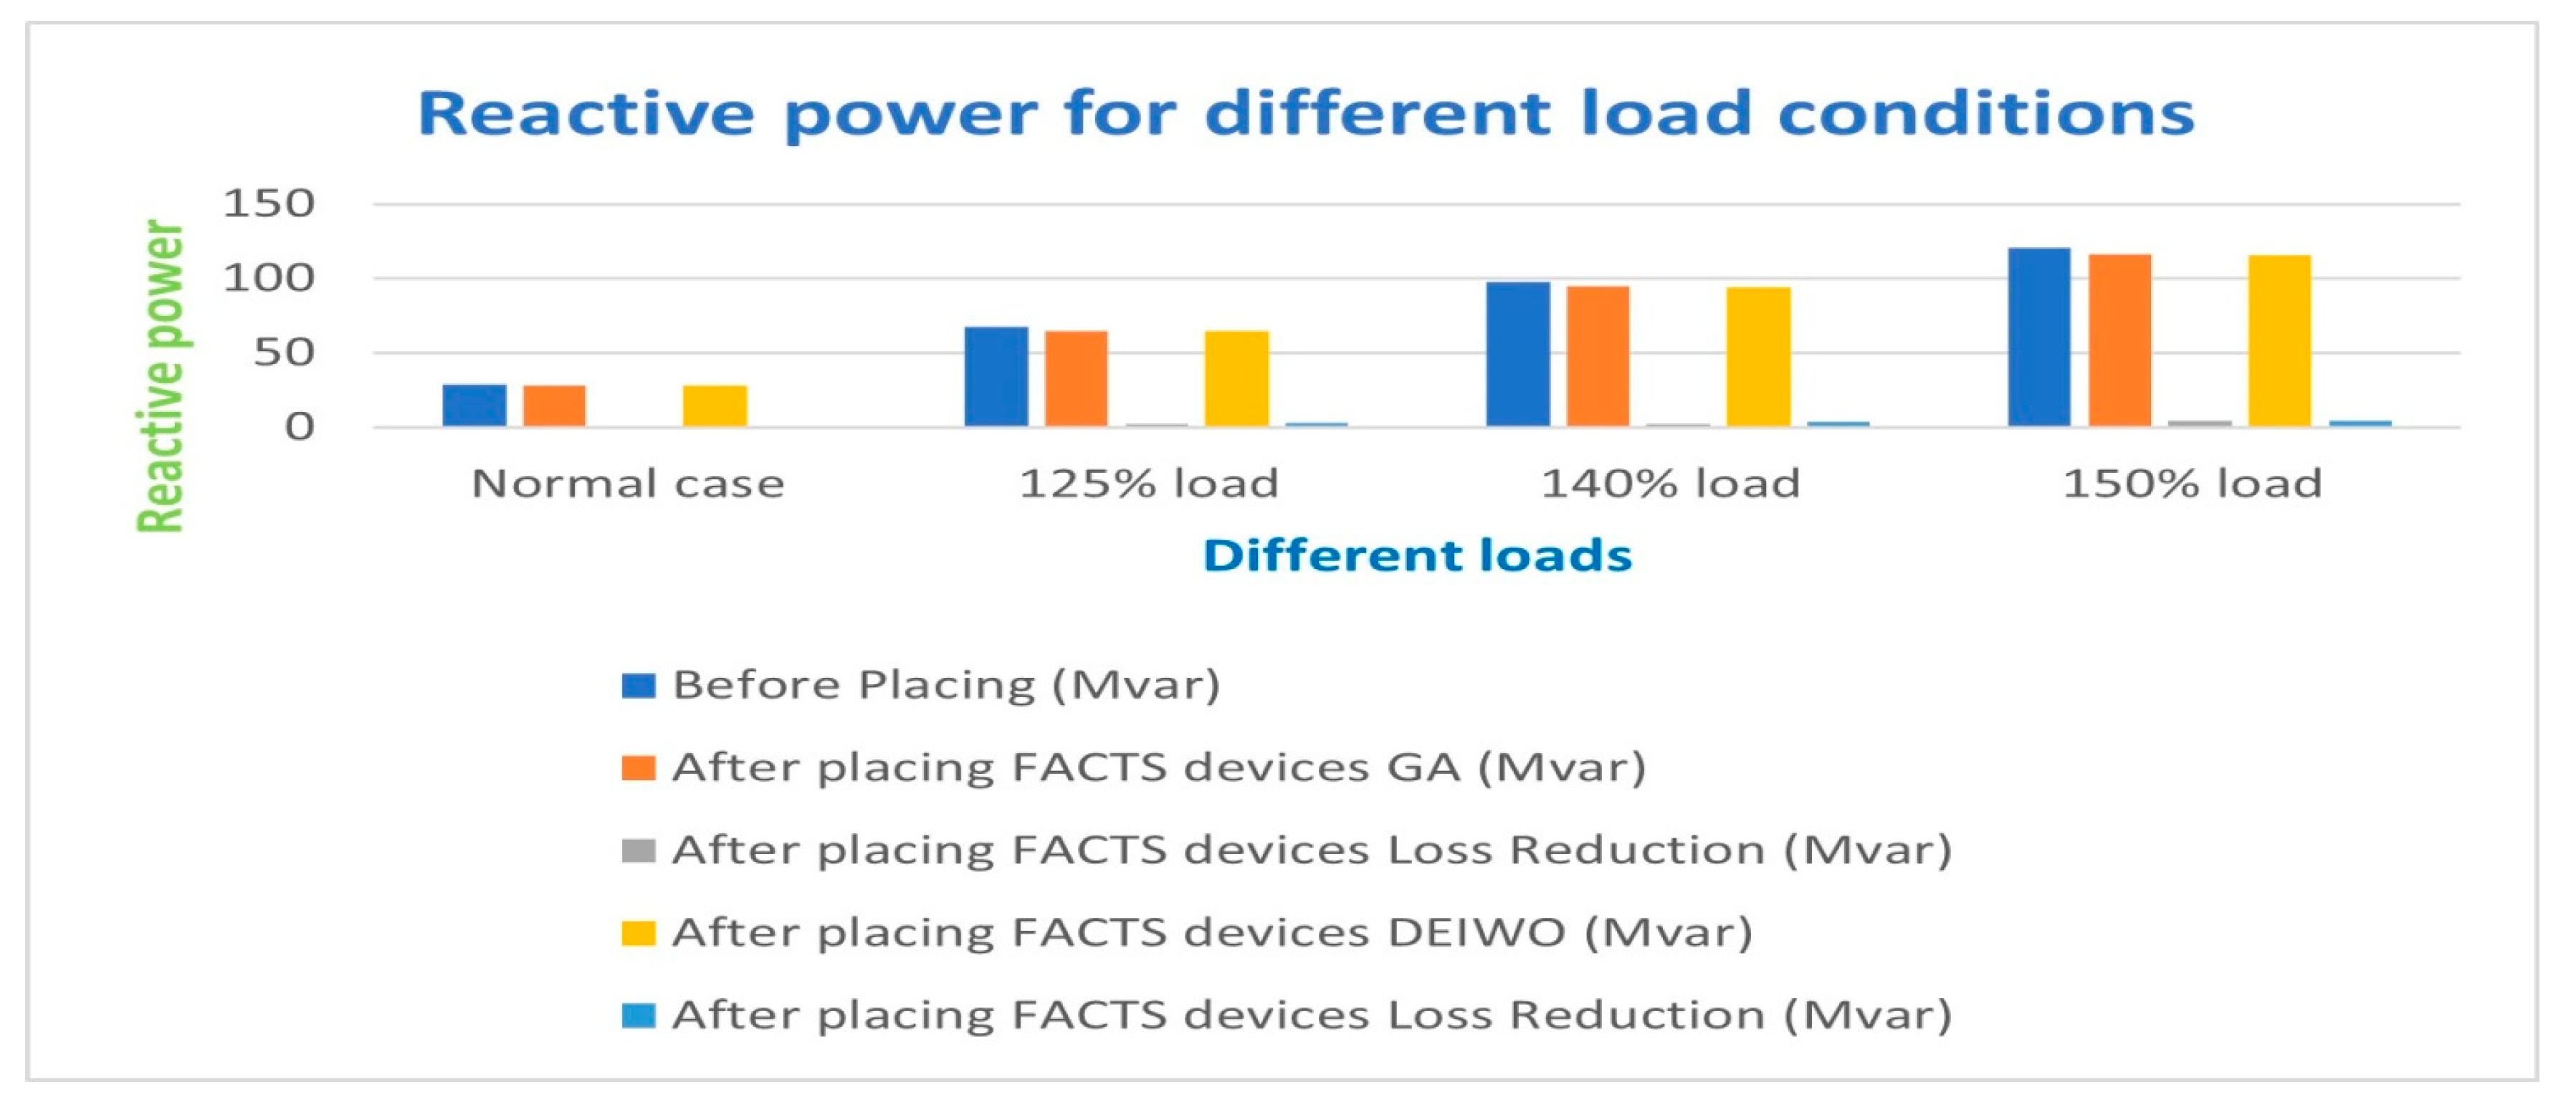
Case 2: Reactive power losses can be calculated according to
Table 12 and represented graphically in
Figure 18.
Table 13.
Voltage profile before and after placing FACTS devices for Different load conditions.
Table 13.
Voltage profile before and after placing FACTS devices for Different load conditions.
| Normal case |
125% load condition |
140 % load condition |
150% load condition |
| Line no |
Before placing FACTS devices |
After placing FACTS devices |
Before placing FACTS devices |
After placing FACTS devices |
Before placing FACTS devices |
After placing FACTS devices |
Before placing FACTS devices |
After placing FACTS devices |
| |
|
GA |
DEIWO |
|
GA |
DEIWO |
|
GA |
DEIWO |
|
GA |
DEIWO |
| |
|
|
|
|
|
|
|
| 1 |
1.0600 |
1.0600 |
1.0600 |
1.0600 |
1.0600 |
1.0600 |
1.0600 |
1.0600 |
1.0600 |
1..600 |
1.0600 |
1.0600 |
| 2 |
1.0450 |
1.0450 |
1.0450 |
1.0250 |
1.0350 |
1.0350 |
1.0150 |
1.0150 |
1.0250 |
1.0050 |
1.0150 |
1.0150 |
| 3 |
1.0100 |
1.0100 |
1.0100 |
0.9800 |
1.0000 |
1.0000 |
0.9600 |
0.9700 |
0.9800 |
0.9600 |
0.9600 |
0.9600 |
| 4 |
1.0141 |
1.0185 |
1.0199 |
0.9840 |
1.0075 |
1.0081 |
0.9670 |
0.9830 |
0.9969 |
0.9562 |
0.9733 |
0.9831 |
| 5 |
1.0173 |
1.0201 |
1.0211 |
0.9897 |
1.0094 |
1.0098 |
0.9746 |
0.9871 |
0.9996 |
0.9638 |
0.9784 |
0.9870 |
| 6 |
1.0700 |
1.0700 |
1.0700 |
1.0400 |
1.0700 |
1.0700 |
1.0300 |
1.0501 |
1.0700 |
1.0200 |
1.0400 |
1.0600 |
| 7 |
1.0461 |
1.0617 |
1.0661 |
1.0150 |
1.0610 |
1.0626 |
0.9986 |
1.0409 |
1.0643 |
0.9858 |
1.0276 |
1.0550 |
| 8 |
1.0800 |
1.0810 |
1.0900 |
1.0600 |
1.0876 |
1.0900 |
1.0500 |
1.0800 |
1.0900 |
1.0400 |
1.0700 |
1.0900 |
| 9 |
1.0309 |
1.0561 |
1.0646 |
0.9935 |
1.0610 |
1.0642 |
0.9742 |
1.0377 |
1.0746 |
0.9593 |
1.0217 |
1.0624 |
| 10 |
1.0303 |
1.0511 |
1.0582 |
0.9919 |
1.0533 |
1.0560 |
0.9729 |
1.0293 |
1.0634 |
0.9578 |
1.0133 |
1.0507 |
| 11 |
1.0463 |
1.0569 |
1.0606 |
1.0110 |
1.0572 |
1.0586 |
0.9958 |
1.0345 |
1.0618 |
0.9828 |
1.0210 |
1.0501 |
| 12 |
1.0533 |
1.0552 |
1.0558 |
1.0186 |
1.0520 |
1.0523 |
1.0054 |
1.0292 |
1.0509 |
0.9933 |
1.0171 |
1.0391 |
| 13 |
1.0467 |
1.0504 |
1.0517 |
1.0103 |
1.0466 |
1.0470 |
0.9957 |
1.0228 |
1.0458 |
0.9827 |
1.0096 |
1.0333 |
| 14 |
1.0195 |
1.0356 |
1.0411 |
0.9769 |
1.0321 |
1.0342 |
0.9562 |
1.0052 |
1.0367 |
0.9395 |
0.9880 |
1.0222 |
Table 14.
TCSC ratings in % of XL.
Table 14.
TCSC ratings in % of XL.
| |
Normal |
125% load |
140% load |
150% load |
| GA |
4.6143 |
6.2615 |
11.2625 |
21.8451 |
| DEIWO |
3.3357 |
5.9665 |
9.1575 |
16.5474 |
Table 15.
SVC ratings in % QL.
Table 15.
SVC ratings in % QL.
| |
Normal |
125% load |
140% load |
150% load |
| GA |
25.2501 |
31.0195 |
43.5568 |
45.6973 |
| DEIWO |
29.3052 |
33.0261 |
43.6937 |
50.0000 |
Table 16.
TCSC ratings.
| |
Normal |
125% load |
140% load |
150% load |
| GA (mF) |
0.7104 |
0.5235 |
0.291 |
0.15 |
| DEIWO (mF) |
0.9765 |
0.5494 |
0.3579 |
0.1981 |
Table 17.
SVC ratings.
| |
Normal |
125% load |
140% load |
150% load |
| GA (Mvar) |
5.8681 |
7.2089 |
10.1226 |
10.6183 |
| DEIWO (Mvar) |
6.8093 |
7.6752 |
10.1544 |
11.6200 |
Table 18.
Time taken for execution.
Table 18.
Time taken for execution.
| |
Normal Load (sec) |
125% load (sec) |
140% load (sec) |
150% load (sec) |
| GA |
1.6980 |
2.3770 |
3.2470 |
3.7468 |
| DEIWO |
5.2800 |
9.2580 |
10.4910 |
11.4370 |
6. Conclusions
Voltage regulation and stability are given significant consideration in a practical power system. The power sector is increasingly worried about the issue of voltage instability in power networks. The power system network may experience a collapse in voltage or a total blackout as a result. For increasing voltage stability, many conventional controllers are used, including synchronous condensers, adjusting transformer tap settings, phase shifters, and under voltage load shedding, among others. Because all of these have drawbacks, FACTS devices are being studied for voltage stability augmentation and lowering transmission line losses in the power system network. The proposed algorithms were evaluated using an IEEE-14 bus test system as a reference power system network.
The SVC and TCSC are two FACTS devices that achieve these goals by reducing transmission line losses and improving voltage stability. Benefits will be maximized by choosing the best location and FACTS device rating. The Genetic Algorithm and DEIWO are the optimization techniques that can be used to obtain the optimal FACTS device ratings. Stability indices are utilized so that the best possible site can be determined. Two such indices are the Voltage Stability Index (VSI) and the Line Stability Index (LSI), both of which are highlighted as follows. SVC’s location is determined using VSI, and TCSC’s position is determined using LSI.
After determining locations FACTS devices are connected to an IEEE-14 bus power system network. Now that both optimization strategies have been applied independently, their results have been shown for conditions with an average load, 125% load, 140% load, and 150% load. By examining the outcomes of all load circumstances, the ensuing observations are made. Comparing the DEIWO approach to the GA method, the DEIWO method has a better voltage profile. Additionally, the reduction of actual and reactive power loss is much better than the conventional method. However, when compared to the GA approach, the DEIWO method has superior TCSC and SVC evaluations. However, the GA approach takes less time to compute than the DEIWO method. Another important observation is that the GA method converges to the local optimum, i.e., the ratings of FACTS devices obtained from GA vary every time the program run, whereas the DEIWO converges to the global optimum.
References
- Jamnani, J.G.; Pandya, M. Coordination of SVC and TCSC for management of power flow by particle swarm optimization. Energy Procedia 2019, 156, 321–326. [Google Scholar] [CrossRef]
- Singh, B.; Agrawal, G. Enhancement of voltage profile by incorporation of SVC in power system networks by using optimal load flow method in MATLAB/Simulink environments. Energy Rep. 2018, 4, 418–434. [Google Scholar] [CrossRef]
- Ranganathan, S.; Velmurugan, V.; Rajan, C.C.A. “Optimal Placement of SVC with Single Objectives using Self-Adaptive Firefly Algorithm,” 2019 Fifth International Conference on Science Technology Engineering and Mathematics (ICONSTEM), Chennai, India, 2019, pp. 311–315. [CrossRef]
- Le Roux, P.F.; Ngwenyama, M.K.; Aphane, T.C. “14-Bus IEEE Electrical Network Compensated for Optimum Voltage Enhancement using FACTS Technologies,” 2022 3rd International Conference for Emerging Technology (INCET), Belgaum, India, 2022, pp. 1–7. [CrossRef]
- Jirjees, M.A.; Al-Nimma, D.A.; Al-Hafidh, M.S.M. “Voltage Stability Enhancement based on Voltage Stability Indices Using FACTS Controllers,” 2018 International Conference on Engineering Technology and their Applications (IICETA), Al-Najaf, Iraq, 2018, pp. 141–145. [CrossRef]
- Roy, C.; Chatterjee, D.; Bhattacharya, T. “Control of a Hybrid Shunt FACTS Compensator for Voltage Collapse Prevention in Interconnected EHV Power Transmission Systems,” in IEEE Journal of Emerging and Selected Topics in Industrial Electronics, vol. 4, no. 2, pp. 538–548, 23. 20 April. [CrossRef]
- Xiao, D.; Dong, Y.; Wu, Y.; Meng, D.; Tang, S. “Method of Judgment and Control Decision of Voltage Instability in Electromechanical Transient of Power System,” 2021 IEEE Sustainable Power and Energy Conference (iSPEC), Nanjing, China, 2021, pp. 3015–3019. [CrossRef]
- Gao, C.; Redfern, M.A. “Advanced Voltage Control Strategy for On-Load Tap-Changer Transformers with Distributed Generations,” 2011 46th International Universities Power Engineering Conference (UPEC), Soest, Germany, 2011, pp. 1–6.
- Mahmud, S.U. “Performance Comparison between Synchronous Condenser and Static VAR Compensator to Improve System Strength in a Wind Dominated Power Grid,” 2020 11th International Conference on Electrical and Computer Engineering (ICECE), Dhaka, Bangladesh, 2020, pp. 411–414. [CrossRef]
- Bekhradian, R.; Sanaye-Pasand, M.; Mahari, A. Adaptive Wide-Area Load Shedding Scheme Based on the Sink and Source Concept to Preserve Power System Stability. IEEE Syst. J. 2023, 17, 503–512. [Google Scholar] [CrossRef]
- Sedighizadeh, M.; Faramarzi, H.; et al. Hybrid approach to FACTS devices allocation using a multi-objective function with NSPSO and NSGA-II algorithms in Fuzzy framework. Int. J. Electr. Power Energy Syst. 2014, 62, 586–598. [Google Scholar] [CrossRef]
- Loji, K.; Sharma, S.; Sharma, G. Mitigation of Solar PV Grid-Penetrated System’s Operational Challenges Considering Penetration Allowance and FACTS Devices Incorporation, 2022 2nd International Conference on Innovative Sustainable Computational Technologies (CISCT), Dehradun, India, 2022, pp. 1–6. [CrossRef]
- Santander-Hernández, L.J.; Fuerte-Esquivel, C.R.; Angeles-Camacho, C. “Incorporation of D-FACTS devices in the Mexican equivalent network,” 2020 IEEE International Autumn Meeting on Power, Electronics and Computing (ROPEC), Ixtapa, Mexico, 2020, pp. 1–6. [CrossRef]
- Wu, X.; et al. “A Transmission Line Selection Method for Parameter Measurement Based on its Impacts on Power Flow Sensitivity and Static Voltage Stability,” 2020 IEEE 4th Conference on Energy Internet and Energy System Integration (EI2), Wuhan, China, 2020, pp. 3339–3344. [CrossRef]
- Chitsazan, M.A.; Fadali, M.S.; Trzynadlowski, A.M. State estimation of IEEE 14 bus with unified interphase power controller (UIPC) using WLS method, in 2017 IEEE Energy Conversion Congress and Exposition, ECCE, IEEE, 2017, pp. 2903–2908.
- Rubio-Marroquín, G.O.; Fuerte-Esquivel, C.R.; Zamora-Cárdenas, E.A. Impact of bad data injection attacks in the estimation of FACTS controllers parameters, in 2018 IEEE Power & Energy Society Innovative Smart Grid Technologies Conference, ISGT, IEEE, 2018, pp. 1–5.
- Li, X.-L.; Wang, J.-S.; Yang, X. “Invasive Weed Optimization Algorithm Based on Differential Evolution Operators to Solve Bin Packing Problem,” 2020 Chinese Control And Decision Conference (CCDC), Hefei, China, 2020, pp. 4141–4145. [CrossRef]
- Luo, Q.; Chen, H. A Novel Differential Evolution Invasive Weed Optimization Algorithm for Solving Nonlinear Equations Systems. J. Appl. Math. 2013, 1–18. [Google Scholar] [CrossRef]
- Misaghi, M.; Yaghoobi, M. Improved Invasive weed optimization Algorithm (IWO) Based on Chaos Theory for Optimal design of PID controller. J. Comput. Des. Eng. 2019, 6. [Google Scholar] [CrossRef]
- Basak, A.; Maity, D.; Das, S. A differential invasive weed optimization algorithm for improved global numerical optimization. Appl. Math. Comput. 2013, 219, 6645–6668. [Google Scholar] [CrossRef]
- Yu, X.; Huang, D.; Gao, Y.; Zhu, J.; Ren, B. Research on Vehicle and Cargo Matching of Electric Materials Based on Weed Optimization Algorithm”, Signal and Information Processing. Netw. Comput. 2023, 996, 380. [Google Scholar]
- Sabry, Hegazy & Eid, Mohamed & Mohamed, Islam & Gad, Radwa. (2020). An Alternative Algorithm to Invasive Weed Optimization Based Global Maximum Power Point Tracking for PV Array Under Partial Shading Conditions. Int. J. Adv. Trends Comput. Sci. Eng. 2020, 9, 7467–7477. [Google Scholar] [CrossRef]
- Cai, W.; Chen, H.; Zhang, J. “An Enhanced Invasive Weed Optimization in Resource-Constrained Project Scheduling Problem,” 2020 11th International Conference on Awareness Science and Technology (iCAST), Qingdao, China, 2020, pp. 1–7. [CrossRef]
Figure 3.
Voltage stability index for different load conditions.
Figure 3.
Voltage stability index for different load conditions.
Figure 4.
LSI For different load conditions.
Figure 4.
LSI For different load conditions.
Figure 11.
Real power loss.
Figure 11.
Real power loss.
Figure 12.
Reactive power loss.
Figure 12.
Reactive power loss.
Figure 13.
Voltage profile for normal Load in DEIWO.
Figure 13.
Voltage profile for normal Load in DEIWO.
Figure 14.
Voltage profile for 125% load in DEIWO.
Figure 14.
Voltage profile for 125% load in DEIWO.
Figure 15.
Voltage profile for 140% load in DEIWO.
Figure 15.
Voltage profile for 140% load in DEIWO.
Figure 16.
Voltage profile for 150% load in DEIWO.
Figure 16.
Voltage profile for 150% load in DEIWO.
Figure 17.
Real power for different load conditions.
Figure 17.
Real power for different load conditions.
Figure 18.
Reactive power for different load conditions.
Figure 18.
Reactive power for different load conditions.
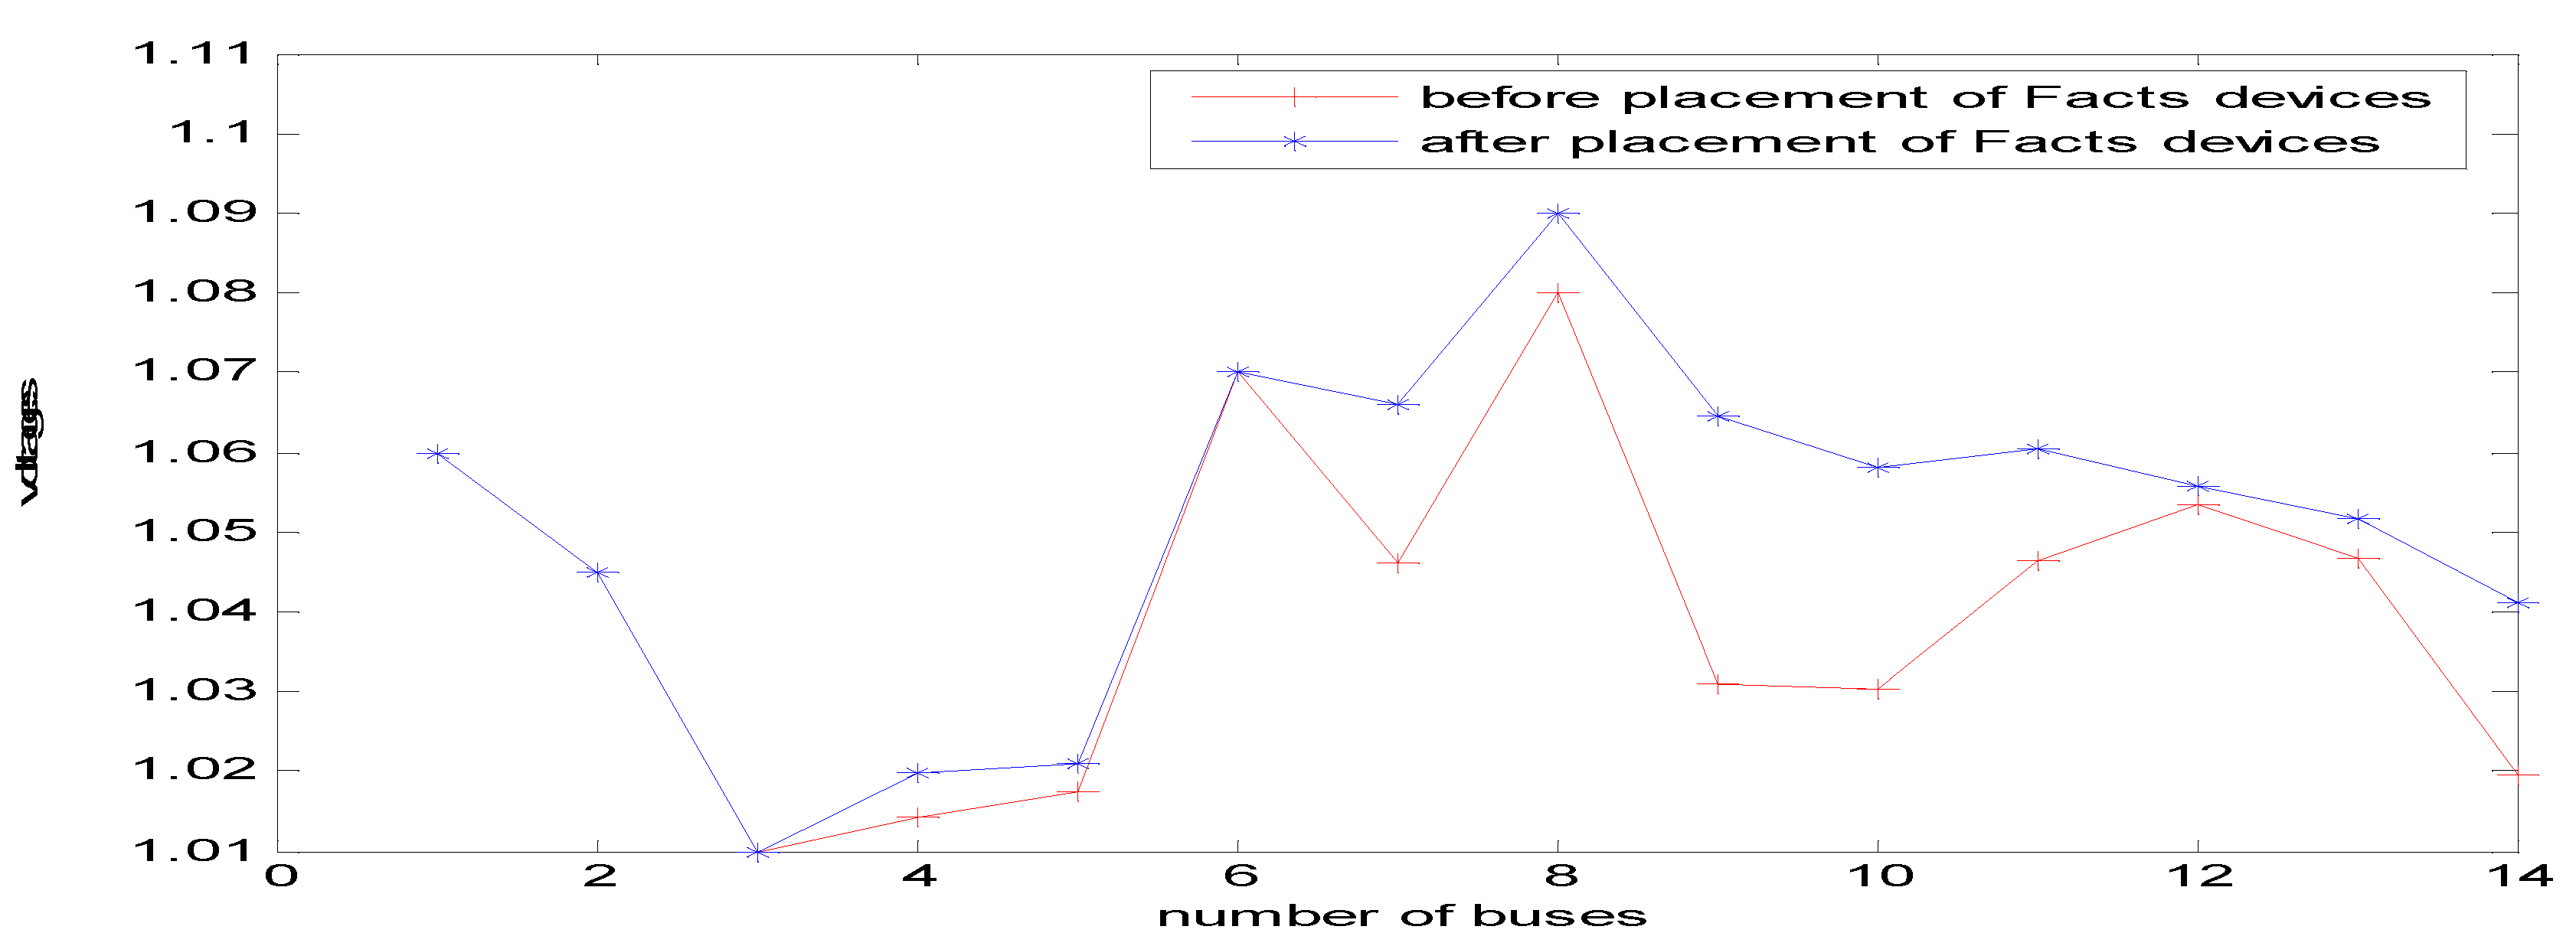
Figure 19.
Voltage profiles before and after placing the facts devices in different load conditions.
Figure 19.
Voltage profiles before and after placing the facts devices in different load conditions.
Figure 20.
Voltage profile comparison of GA and DEIWO for normal load.
Figure 20.
Voltage profile comparison of GA and DEIWO for normal load.
Figure 21.
Voltage profile comparison of GA and DEIWO for 125% load.
Figure 21.
Voltage profile comparison of GA and DEIWO for 125% load.
Figure 22.
Voltage profile comparison of GA and DEIWO for 140% load.
Figure 22.
Voltage profile comparison of GA and DEIWO for 140% load.
Figure 23.
Voltage profile comparison of GA and DEIWO for 150% load.
Figure 23.
Voltage profile comparison of GA and DEIWO for 150% load.
Table 6.
Voltage profile of GA for a Normal load,125%load,140%load and 150% condition.
Table 6.
Voltage profile of GA for a Normal load,125%load,140%load and 150% condition.
| Normal case |
125% load
condition |
140 % load condition |
150% load condition |
| Line no |
Before placing Facts
devices |
After placing Facts
devices |
Before placing Facts
devices |
After placing Facts
devices |
Before placing Facts
devices |
After placing Facts
devices |
Before placing Facts
devices |
After placing Facts
devices |
| 1 |
1.0600 |
1.0600 |
1.0600 |
1.0600 |
1.0600 |
1.0600 |
1.0600 |
1.0600 |
| 2 |
1.0450 |
1.0450 |
1.0250 |
1.0350 |
1.0150 |
1.0150 |
1.0050 |
1.0150 |
| 3 |
1.0100 |
1.0100 |
0.9800 |
1.0000 |
0.9600 |
`0.9700 |
0.9600 |
`0.9600 |
| 4 |
1.0141 |
1.0185 |
0.9840 |
1.0075 |
0.9670 |
0.9830 |
0.9562 |
0.9733 |
| 5 |
1.0173 |
1.0201 |
0.9897 |
1.0094 |
0.9746 |
0.9871 |
0.9638 |
0.9784 |
| 6 |
1.0700 |
1.0700 |
1.0400 |
1.0700 |
1.0300 |
1.0501 |
1.0200 |
1.0400 |
| 7 |
1.0461 |
1.0617 |
1.0150 |
1.0610 |
0.9986 |
1.0409 |
0.9858 |
1.0276 |
| 8 |
1.0800 |
1.0900 |
1.0600 |
1.0900 |
1.0500 |
1.0800 |
1.0400 |
1.0700 |
| 9 |
1.0309 |
1.0561 |
0.9935 |
1.0610 |
0.9742 |
1.0377 |
0.9593 |
1.0217 |
| 10 |
1.0303 |
1.0511 |
0.9919 |
1.0533 |
0.9729 |
1.0293 |
0.9578 |
1.0133 |
| 11 |
1.0463 |
1.0569 |
1.0110 |
1.0572 |
0.9958 |
1.0345 |
0.9828 |
1.0210 |
| 12 |
1.0533 |
1.0552 |
1.0186 |
1.0520 |
1.0054 |
1.0292 |
0.9933 |
1.0171 |
| 13 |
1.0467 |
1.0504 |
1.0103 |
1.0466 |
0.9957 |
1.0228 |
0.9827 |
1.0096 |
| 14 |
1.0195 |
1.0356 |
0.9769 |
1.0321 |
0.9562 |
1.0052 |
0.9395 |
0.9880 |
Table 7.
Real power losses of DEIWO.
Table 7.
Real power losses of DEIWO.
| Particulars |
Before Placing (MW) |
After placing (MW) |
Loss Reduction (MW) |
| Normal case |
13.5766 |
13.3738 |
0.2028 |
| 125% load |
23.088 |
22.0741 |
0.9347 |
| 140% load |
30.3052 |
29.0654 |
1.2398 |
| 150% load |
36.0280 |
34.5090 |
1.5190 |
Table 8.
Reactive power losses of DEIWO.
Table 8.
Reactive power losses of DEIWO.
| Particulars |
Before Placing (Mvar) |
DEIWO (Mvar) |
Loss Reduction (Mvar) |
| Normal case |
28.553 |
27.998 |
0.555 |
| 125% load |
67.640 |
64.559 |
3.081 |
| 140% load |
97.705 |
93.796 |
3.909 |
| 150% load |
120.800 |
115.988 |
4.802 |
Table 9.
Voltage profile of DEIWO for Different load conditions.
Table 9.
Voltage profile of DEIWO for Different load conditions.
| Normal case |
125% load condition |
140 % load condition |
150% load condition |
| Line no |
Before placing Facts
devices |
After placing Facts devices |
Before placing Facts
devices |
After placing Facts
devices |
Before placing Facts
devices |
After placing Facts
devices |
Before placing Facts
devices |
After placing Facts
devices |
| 1 |
1.0600 |
1.0600 |
1.0600 |
1.0600 |
1.0600 |
1.0600 |
1.0600 |
1.0600 |
| 2 |
1.0450 |
1.0450 |
1.0250 |
1.0350 |
1.0150 |
1.0250 |
1.0050 |
1.0150 |
| 3 |
1.0100 |
1.0100 |
0.9800 |
1.0000 |
0.9600 |
0.9800 |
0.9600 |
0.9600 |
| 4 |
1.0141 |
1.0199 |
0.9840 |
1.0081 |
0.9670 |
0.9969 |
0.9562 |
0.9831 |
| 5 |
1.0173 |
1.0211 |
0.9897 |
1.0098 |
0.9746 |
0.9996 |
0.9638 |
0.9870 |
| 6 |
1.0700 |
1.0700 |
1.0400 |
1.0700 |
1.0300 |
1.0700 |
1.0200 |
1.0600 |
| 7 |
1.0461 |
1.0661 |
1.0150 |
1.0626 |
0.9986 |
1.0643 |
0.9858 |
1.0550 |
| 8 |
1.0800 |
1.0900 |
1.0600 |
1.0900 |
1.0500 |
1.0900 |
1.0400 |
1.0900 |
| 9 |
1.0309 |
1.0646 |
0.9935 |
1.0642 |
0.9742 |
1.0746 |
0.9593 |
1.0624 |
| 10 |
1.0303 |
1.0582 |
0.9919 |
1.0560 |
0.9729 |
1.0634 |
0.9578 |
1.0507 |
| 11 |
1.0463 |
1.0606 |
1.0110 |
1.0586 |
0.9958 |
1.0618 |
0.9828 |
1.0501 |
| 12 |
1.0533 |
1.0558 |
1.0186 |
1.0523 |
1.0054 |
1.0509 |
0.9933 |
1.0391 |
| 13 |
1.0467 |
1.0517 |
1.0103 |
1.0470 |
0.9957 |
1.0458 |
0.9827 |
1.0333 |
| 14 |
1.0195 |
1.0411 |
0.9769 |
1.0342 |
0.9562 |
1.0367 |
0.9395 |
1.0222 |
Table 11.
Real power loss comparison for different load conditions.
Table 11.
Real power loss comparison for different load conditions.
| |
After placing FACTS devices |
| Particulars |
Before Placing (MW) |
GA (MW) |
Loss Reduction (MW) |
DEIWO (MW) |
LOSS REDUCTION (MW) |
| Normal case |
13.5766 |
13.3741 |
0.2026 |
13.3738 |
0.2028 |
| 125% load |
23.088 |
22.2621 |
0.7467 |
22.0741 |
0.9347 |
| 140% load |
30.3052 |
29.0668 |
1.2384 |
29.0654 |
1.2398 |
| 150% load |
36.0280 |
34.5264 |
1.5016 |
34.5090 |
1.5190 |
Table 12.
Reactive power loss comparison for different load conditions.
Table 12.
Reactive power loss comparison for different load conditions.
| After placing FACTS devices |
|---|
| Particulars |
Before Placing (Mvar) |
GA (Mvar) |
Loss Reduction (Mvar) |
DEIWO (Mvar) |
Loss Reduction (Mvar) |
| Normal case |
28.553 |
28.328 |
0.225 |
27.998 |
0.555 |
| 125% load |
67.640 |
65.075 |
2.565 |
64.559 |
3.081 |
| 140% load |
97.705 |
95.073 |
2.632 |
93.796 |
3.909 |
| 150% load |
120.800 |
116.580 |
4.220 |
115.988 |
4.802 |
|
Disclaimer/Publisher’s Note: The statements, opinions and data contained in all publications are solely those of the individual author(s) and contributor(s) and not of MDPI and/or the editor(s). MDPI and/or the editor(s) disclaim responsibility for any injury to people or property resulting from any ideas, methods, instructions or products referred to in the content. |
© 2023 by the authors. Licensee MDPI, Basel, Switzerland. This article is an open access article distributed under the terms and conditions of the Creative Commons Attribution (CC BY) license (http://creativecommons.org/licenses/by/4.0/).
