1. Introduction
The evapotranspiration (
ET) is one of the major components of the global water cycle and provides a critical nexus between terrestrial water, carbon and surface energy exchanges. Accurate estimation of
ET is essential for agrometeorological studies, understanding hydrological and ecological processes, and developing effective water management strategies. Nevertheless,
ET is inherently difficult to measure and predict especially at large spatial scales as its spatio-temporal patterns depend on vegetation types, soil properties, and the meteorological conditions at the study site [
1].
Most methods to estimate
ET are based on the water balance equation. This equation, also known as the continuity equation, accounts for water storage changes in a given water system and time interval caused by inputs and outputs of water flow (i.e., rainfall,
ET, and surface and subsurface runoff). Water storage is probably the most difficult component of the water balance equation to quantify due to two main reasons. First, water storage is composed of different contributions like soil moisture, groundwater, and surface water bodies (including snow and ice) that are usually monitored individually. Secondly, the high spatial heterogeneity observed in both the hydraulic properties and the scales of the flow processes involved, makes it difficult to obtain representative values of water storage changes for the whole system [
2]. Thus, the estimate of
ET from the water balance equation is largely conditioned by the accuracy in determining water storage changes.
At point scale, weighable lysimeters provide accurate measurements of water storage changes in the unsaturated zone by recording mass changes of a soil profile. Based on these measurements and an independent record of the flux across the lower boundary of the lysimeter,
ET can be easily calculated from the mass balance equation [
3]. It is important to remark that weighable lysimeters are considered the only device to directly measure the actual
ET [
4,
5]. However, lysimeter data describe the
ET in a single point of the field and do not consider water storage changes in deeper zones of the soil [
6].
Water storage changes can also be estimated at regional and global scales using data from the Gravity Recovery and Climate Experiment (GRACE) and GRACE Follow-On (GRACE-FO) satellite missions [
7]. These missions provide time-variable measurements of the Earth’s gravity field with high accuracy that have been used in many studies of mass variation in different components of the climate system, including terrestrial water storage changes, groundwater depletion, ice sheets and glaciers changes, and
ET [
8,
9,
10,
11]. Unfortunately, the application of GRACE data in local water resources is greatly limited because of the coarse spatial resolution. Swenson
et al. [
12] show that the accuracy of GRACE-derived water storage increases with the study area and they estimate an accuracy of less than 1 cm for study areas larger than 400000 km
2. Based on this result, the spatial resolution of GRACE data is not expected to be better than a few hundred km.
Despite the above-mentioned methods, the determination of water storage changes at the mesoscale (tens to hundreds of meters) remains a challenge for the hydrological community. Measurements of water system components at this spatial resolution are useful for validating remote sensing estimates [
13,
14,
15]. A promising method to estimate water storage at mesoscale is to use data from superconducting gravimeters (SG) [
2,
16]. Similar to GRACE and GRACE-FO satellite missions, these terrestrial instruments measure temporal variations of gravity with unprecedented accuracy and a spatial resolution estimated between 50 and 4000 m [
16]. From these gravity measurements, it is possible to estimate the integrated water storage changes with an accuracy of the order of a few mm. Due to these characteristics, SG have been used as hydrological sensors to calibrate and validate hydrological models [
17], monitor the artificial recharge of an aquifer [
18], and specific yield estimates [
19]. In addition, SG data can be used to estimate
ET in the mesoscale [
2,
20,
21,
22].
The main objective of this work is to show the potential of the SG as a novel tool for the validation of
ET estimates from satellite data. Ground-truth
ET is obtained from the water balance equation using SG data recorded at the Argentine-German Geodetic Observatory (AGGO) located in the Buenos Aires Province, Argentina.
ET is a key hydrological parameter at the study site since it is the main water loss mechanism and it is strongly associated with water availability. Nevertheless, there are few ground stations to estimate
ET in the Buenos Aires Province. In this context, remote sensing methods represent a valuable tool to monitor
ET since they allow mapping the patterns of this hydrological variable at different spatial scales. Particularly, the Moderate Resolution Imaging Spectroradiometer (MODIS) global terrestrial
ET product (MOD16A2) is widely used in different ecosystems due to its high spatio-temporal resolution. The practical utility of the MOD16A2
ET product depends on validation by ground-truth data at similar temporal and spatial scales [
23,
24,
25]. In the Pampas region, Degano
et al. [
26] evaluated the performance of the MOD16A2 version 6
ET product against
ET values based on soil water balance data from seven ground stations. They concluded that the MOD16A2 product underestimates
ET values in humid-subhumid areas. Therefore, in this work, MOD16A2 product is validated using the gravity-based method for an annual period from May 2017 to May 2018 at 8-day and monthly scales.
2. Study Site and Methodology
2.2. Study Site
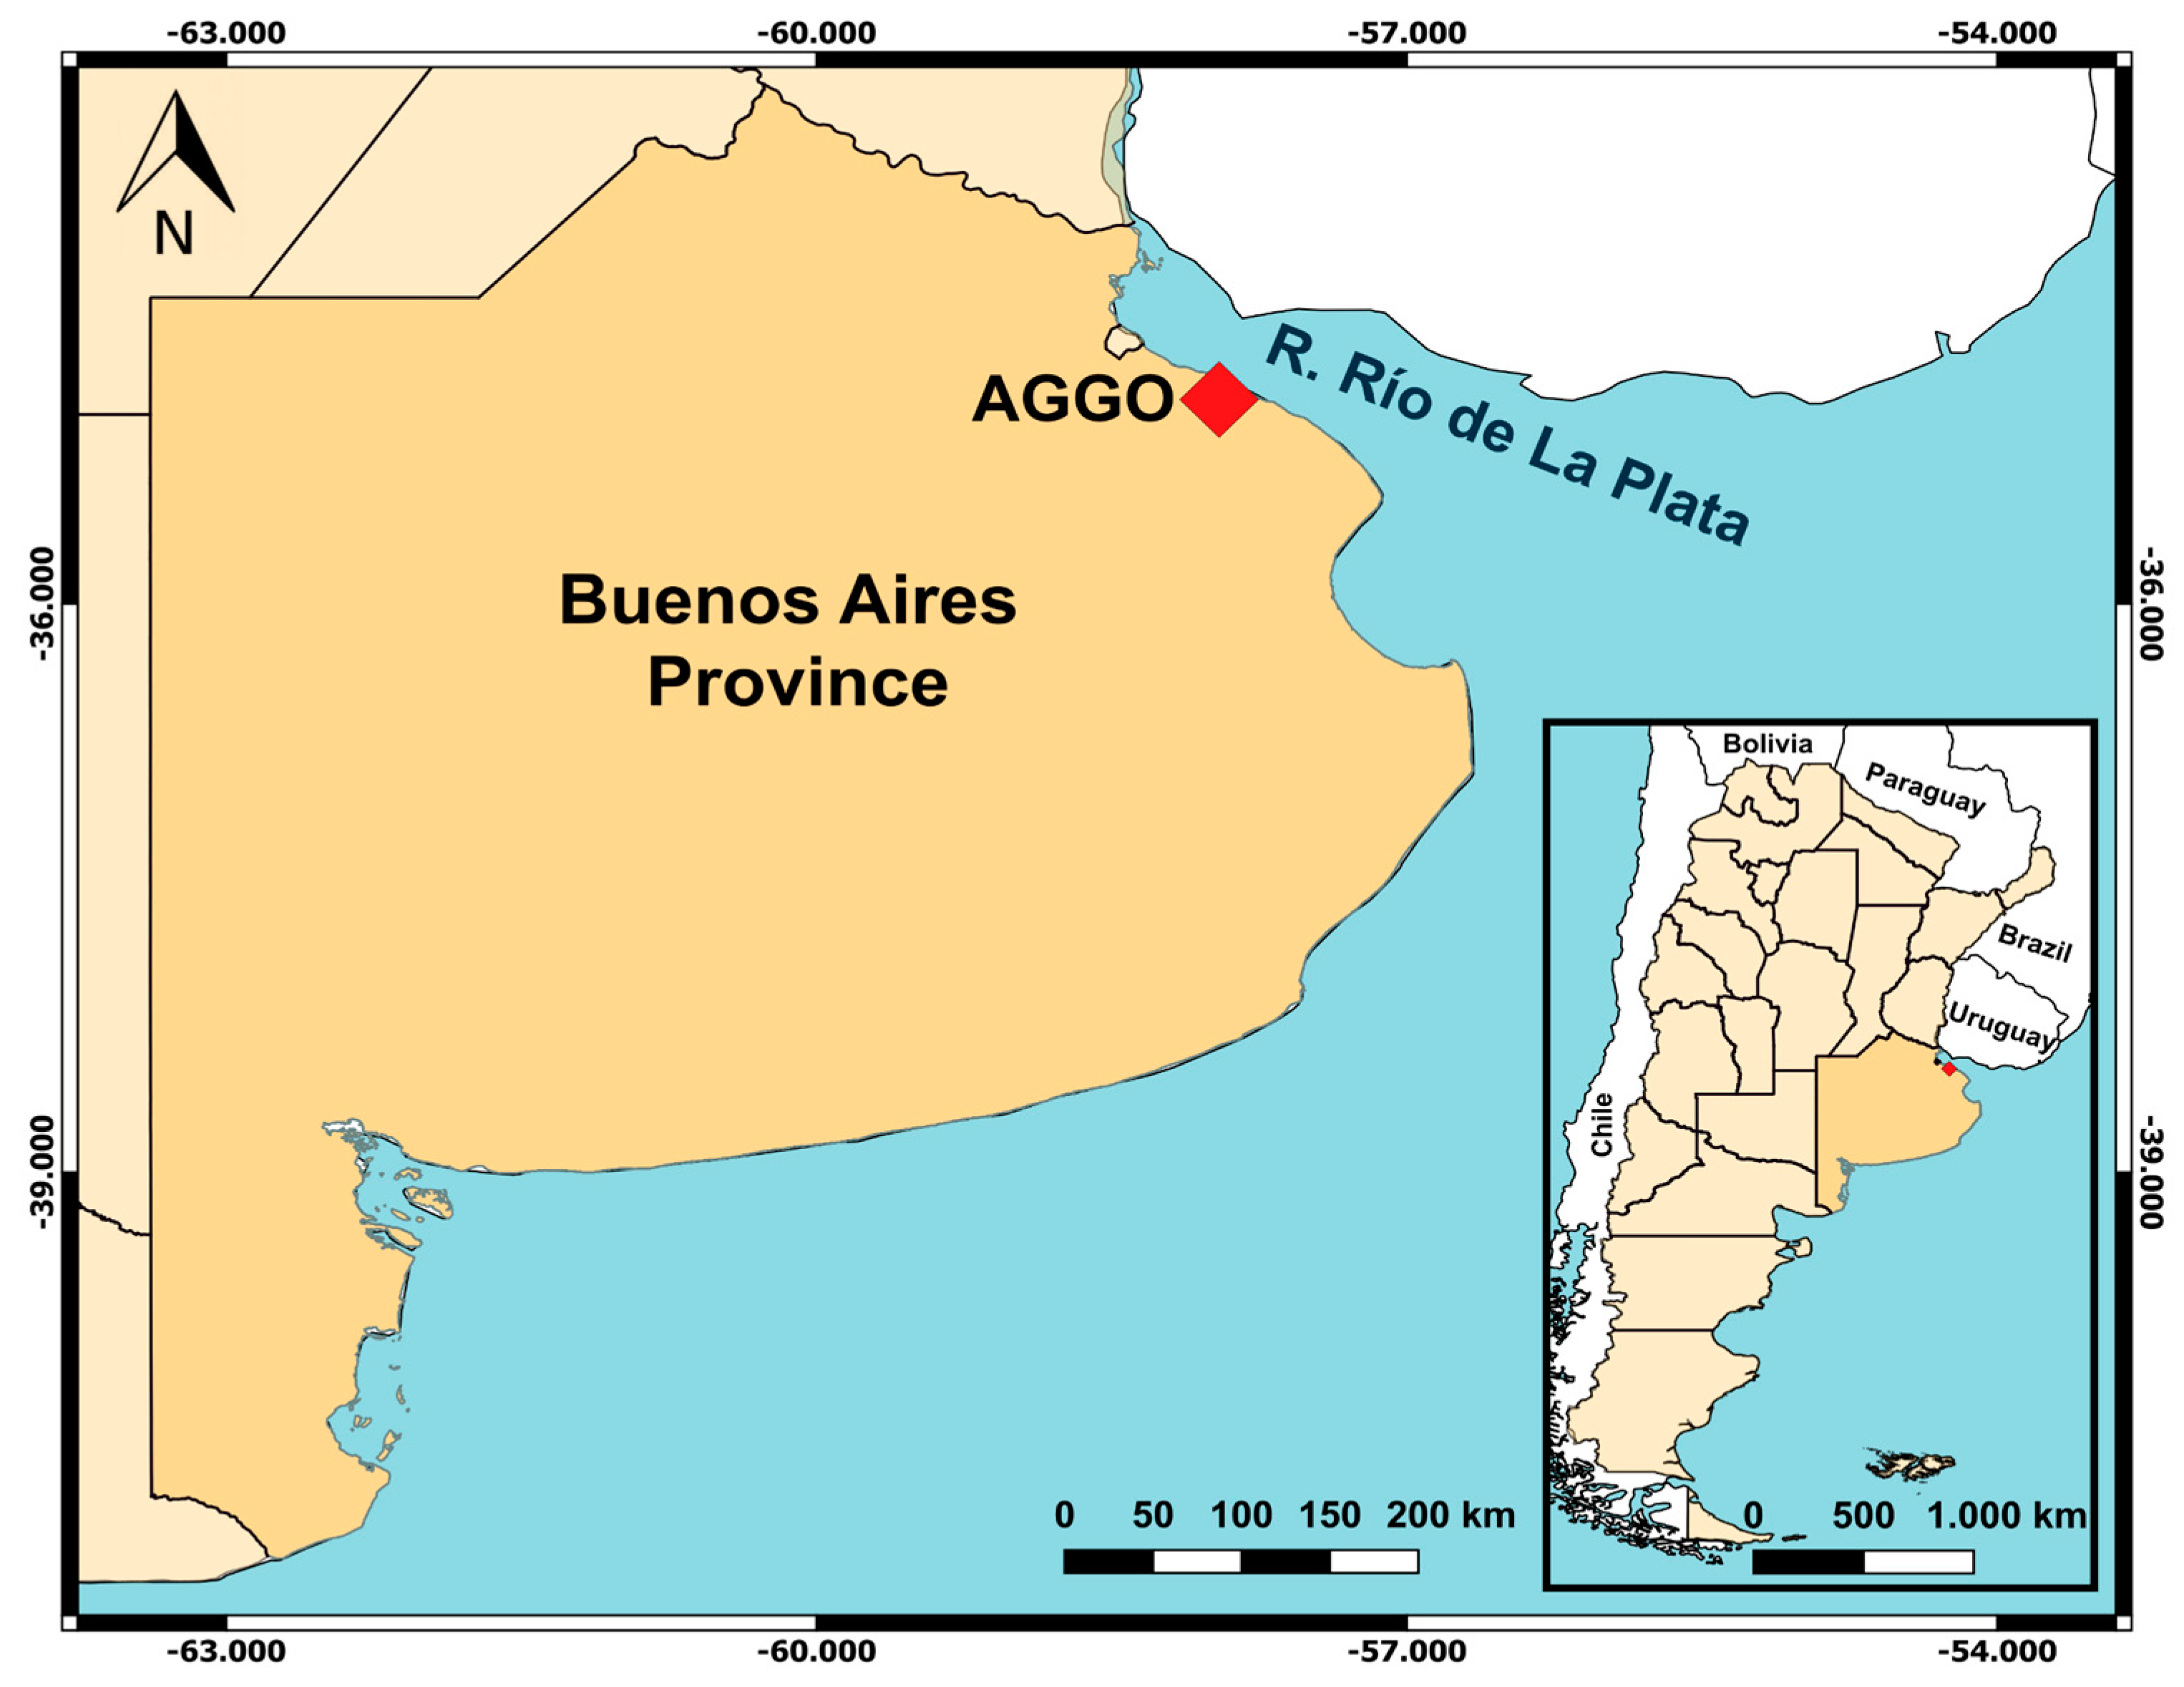
The AGGO is a fundamental geodetic observatory located in Parque Pereyra Iraola, Berazategui, Argentina (
Figure 1). AGGO is equipped with the main geodetic techniques such as VLBI, SRL, GNSS, absolute gravimetry, and a superconducting gravimeter (SG038) which continuously measures the temporal gravity changes since December 2015 [
27]. It is worth noting that the SG038 is currently the only SG operating in Latin America and the Caribbean. In addition to geodetic techniques, hydrometeorological sensors have been installed at AGGO. A weather station with sensors for air temperature, relative humidity, short and long wave radiation, wind speed, and two rain gauges were installed in April 2016. In addition, soil moisture sensors have been installed in several profiles between 5 and 450 cm depth. These instruments are located in the vicinity of the SG038. The hydrometeorological dataset is available in Mikolaj
et al. [
28].
AGGO is located in the Pampas region, one of the largest plains in the world (approximately 520000 km
2) being an important food-producing region due to its fertile land suitable for livestock and agricultural production [
29]. In this region, vertical water flow predominates over horizontal ones with a strong interaction between surface water and groundwater.
The AGGO site is covered by natural grass and surrounded by a small forest of eucalyptus. The mean annual temperature, relative humidity, and precipitation of the study site are 15.8°C, 74.3%, and 1007 mm, respectively. Furthermore, the soil is composed of silty and clayey sediments and the mean groundwater level is approximately 13 m depth.
2.2. Superconducting Gravimeter
SG are the most precise and long-term stable relative instrument to monitor temporal gravity variations. The measurement resolution of SG is in the range of 0.1 – 0.3 nm s
-2 with a temporal resolution of 1 second. The principle of measurement is based on the levitation of a superconducting sphere in a stable magnetic field generated with a pair of niobium coils [
30]. In order to maintain the superconducting state, the gravity sensor is inside a liquid helium Dewar with a refrigeration system which keeps the temperature close to absolute zero (4.2 K). Any change in gravity produces an external force that affects the levitation of the sphere. To compensate for that external force and keep the sphere at a fixed position, an electrical current is injected by an auxiliary feedback coil inducing a change in the magnetic field intensity and consequently, in the voltage. The SG output signal is provided in voltage units, and then, it is converted to gravity values using a calibration factor.
As it is well known from Newton's law, the gravimetric signal attenuates with the square of the distance. Then the SG is more sensitive to nearby mass variations. To define the radius of influence
R of the SG, we will consider the gravimetric effect of an infinite horizontal layer of water at depth z. The gravity response of 1 mm thick layer water is 0.42 nm s
-2 which is usually called
water admittance [
31] and is independent of the depth
z [
32]. As SG accuracy is in the range 0.1 – 0.3 nm s
-2, these devices can detect water layers with thicknesses from 0.2 to 0.7 mm.
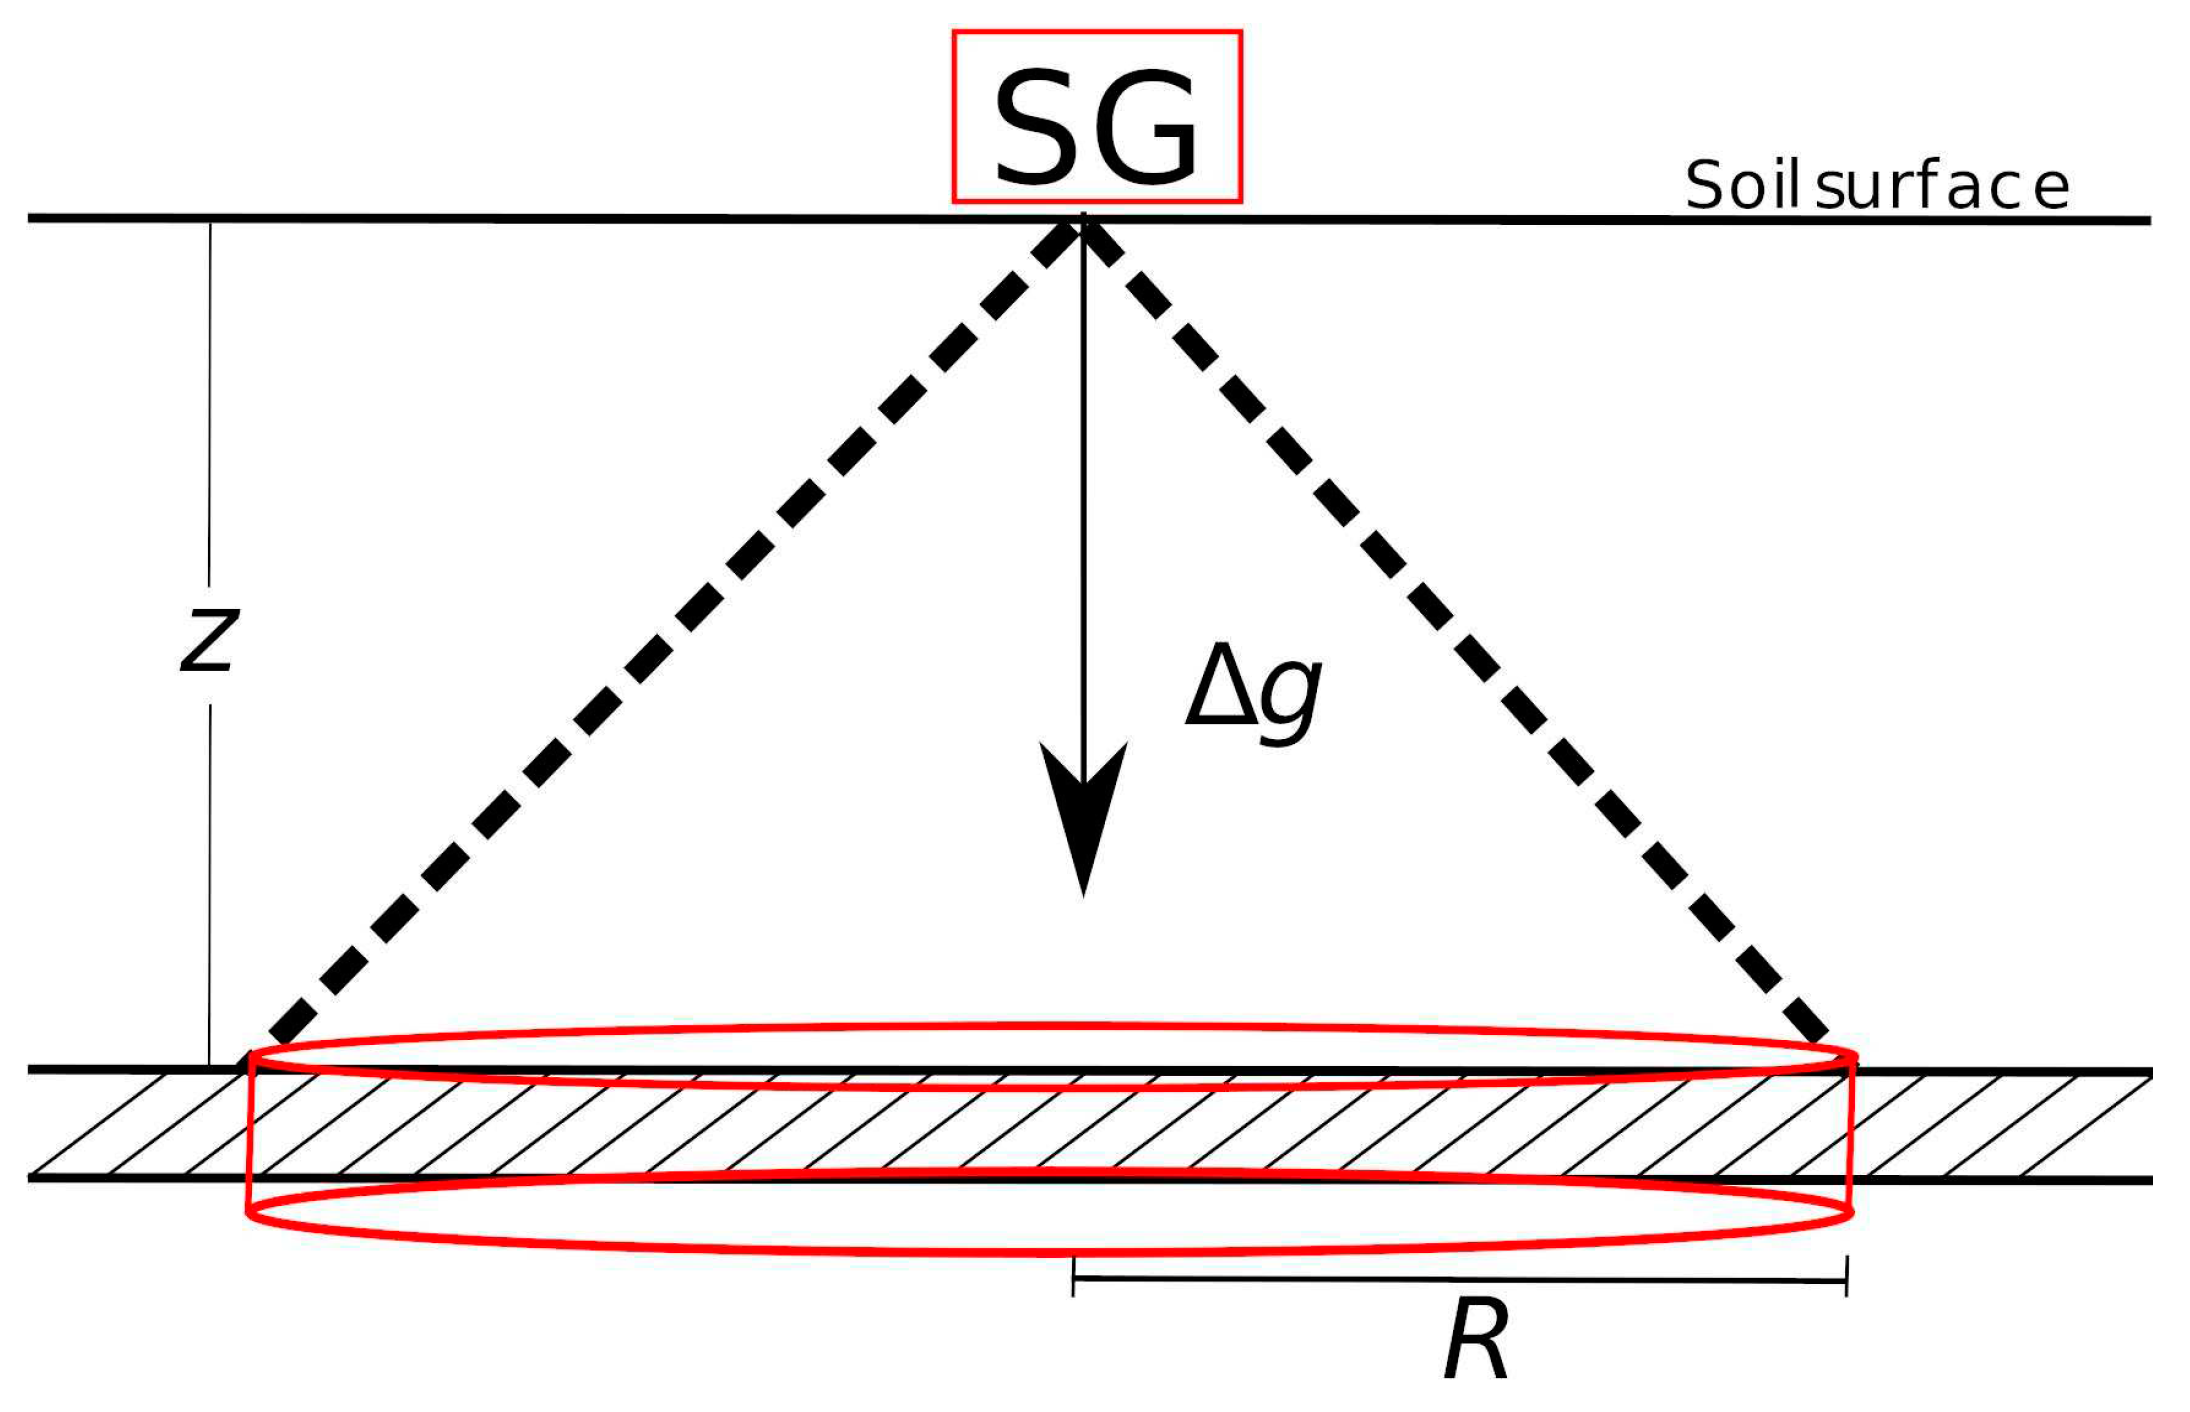
The radius of influence or footprint of SG can be inferred from the comparison between the water admittance value and the gravity effect of a vertical cylinder of 1 mm thickness and radius
R at a depth z below the SG, as shown in
Figure 2.
The gravity effect (Δ
g) of a vertical cylinder of radius
R and 1 mm thickness is estimated from the following equation [
33]:
nm s-2
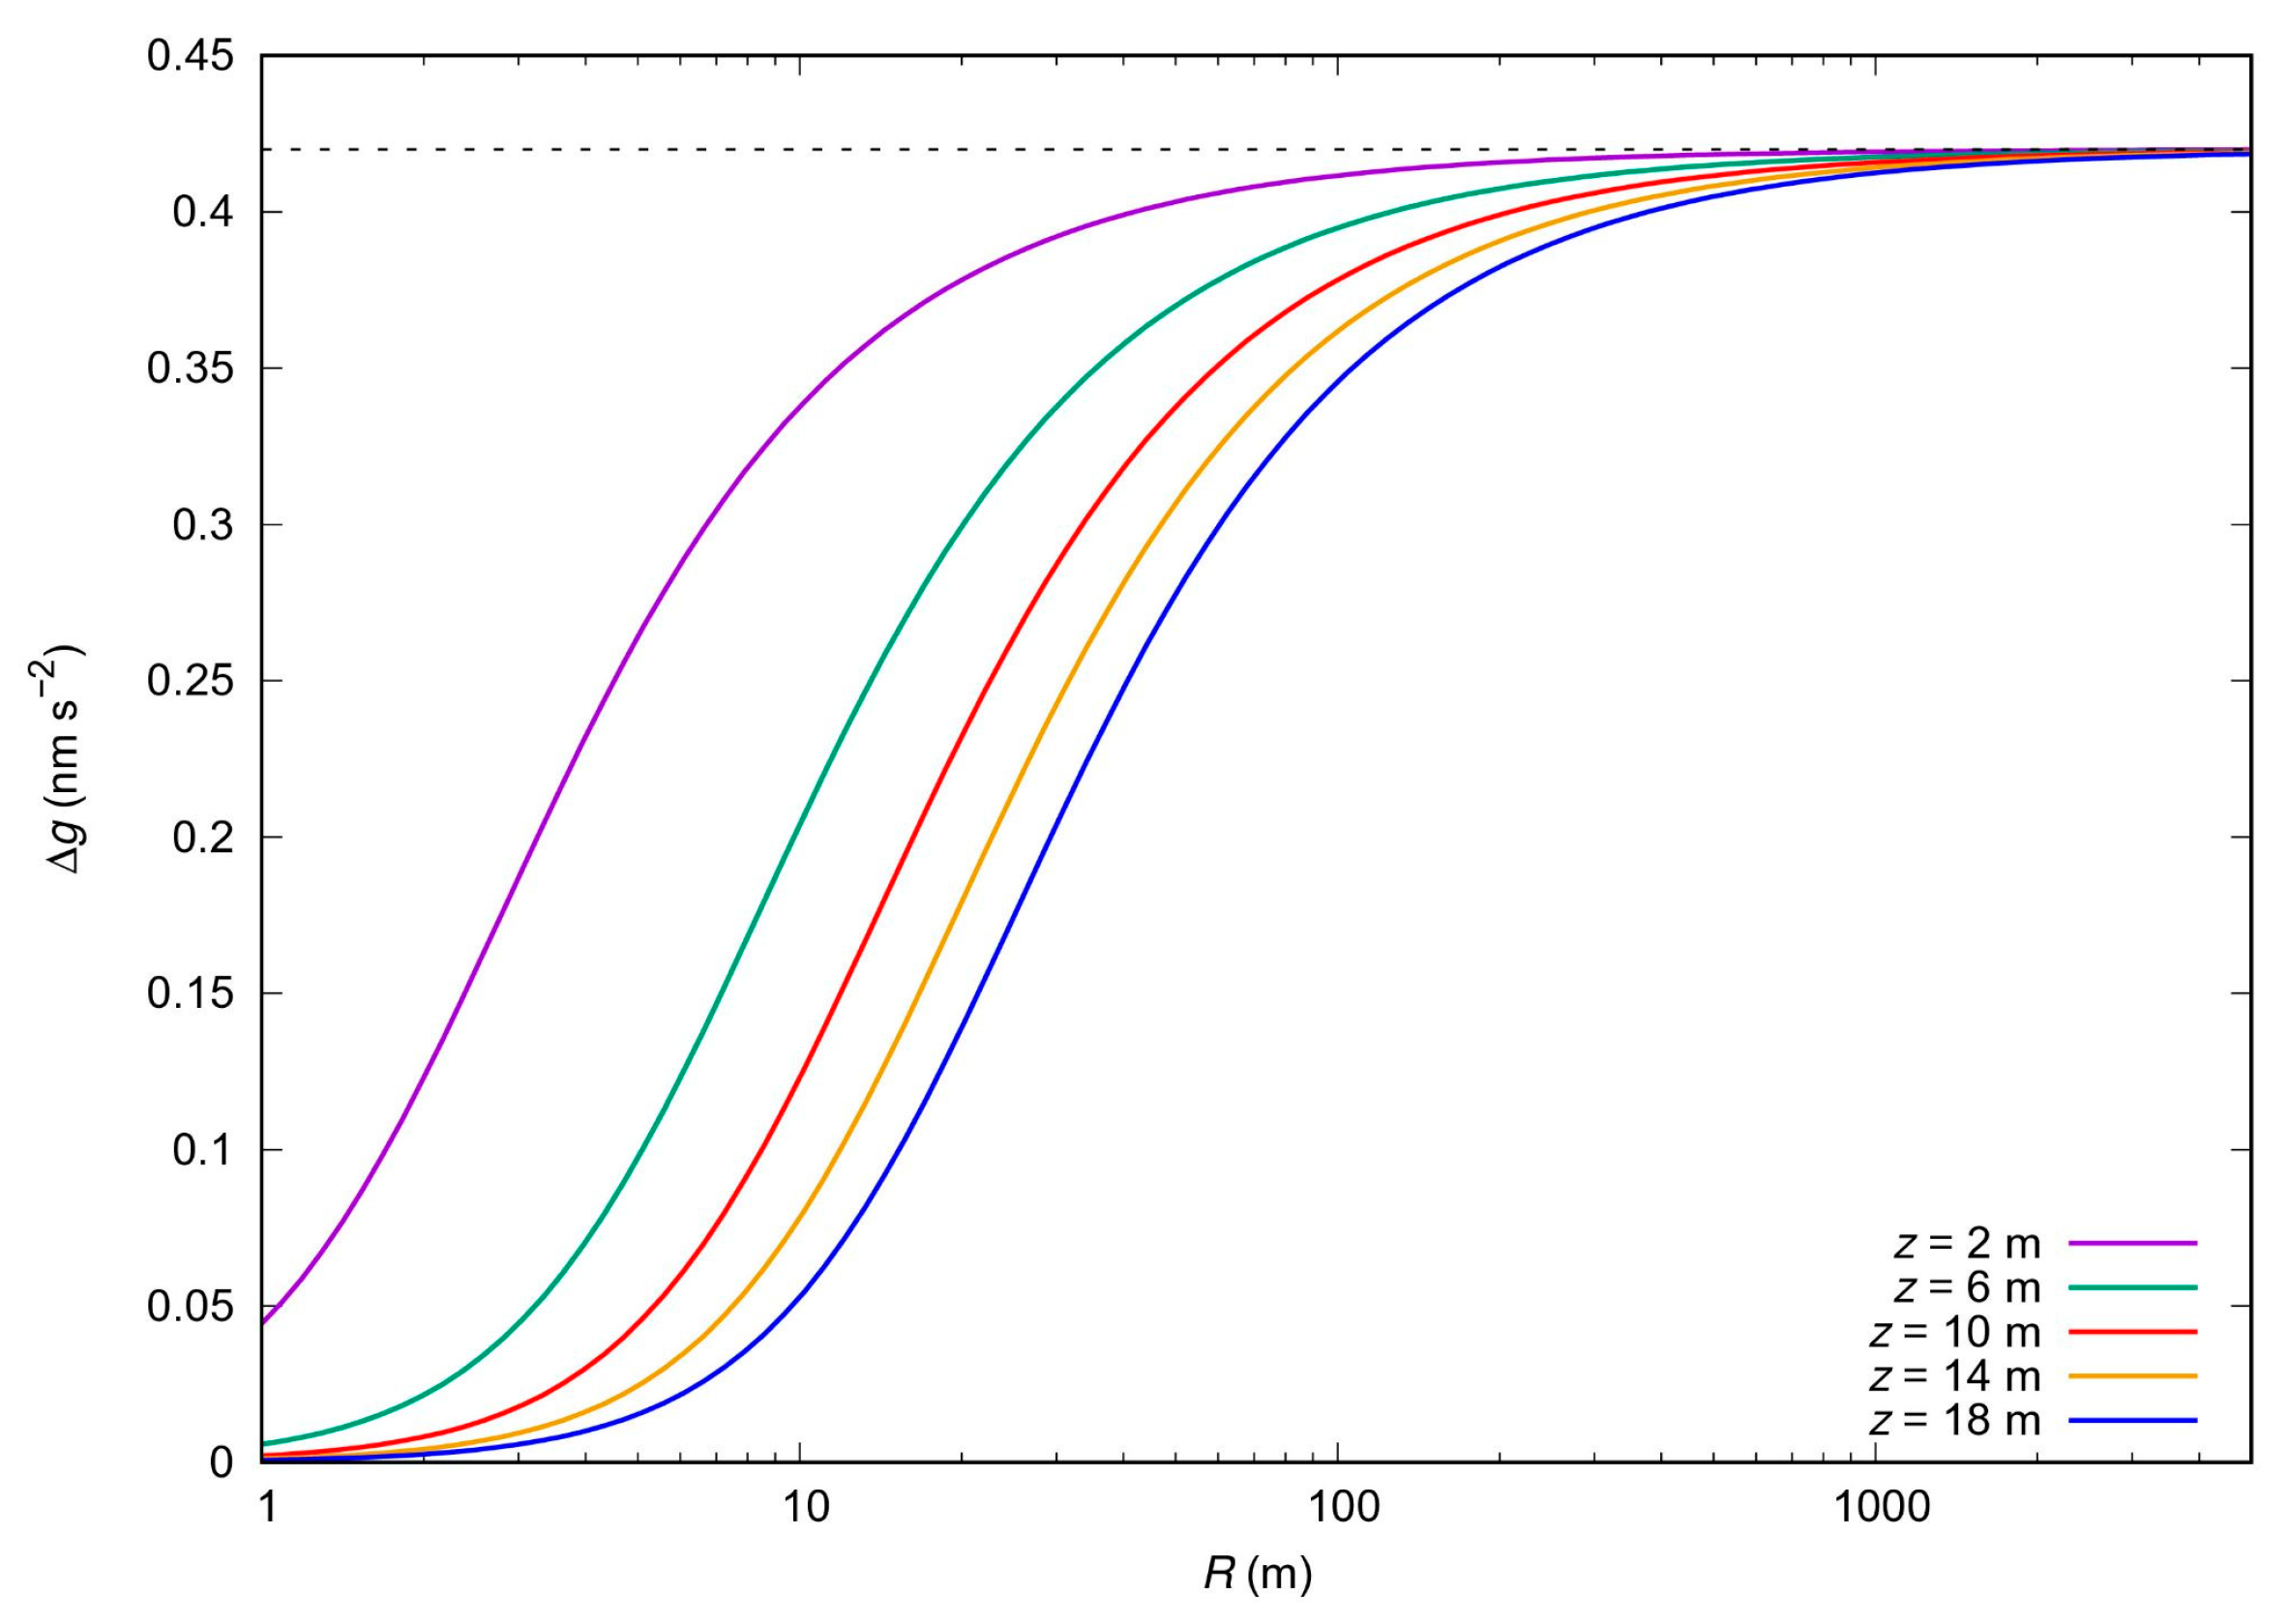
Figure 3 shows the gravity effect (Δ
g) as a function of
R for different depths. Note that when
R tends to infinity in Equation (1), we obtain the value of the water admittance (0.42 nm s
-2). However, 99% of the gravity signal comes from an area of radius 200 to 2000 m, depending on the depth. Moreover, from Equation (1) it can be shown that approximately 99% of the signal is originated within a radius:
Equation (2) defines the radius of influence of the SG, which depends on the depth z. The dependence on depth explains why different radius of influence ranging from 50 to 4000 m are reported in literature (i.e., [
2,
5,
34]). Since the mean groundwater depth in the study site is 13 m, a radius of influence less than 1300 m would be expected.
It is important to mention that Equation (1) is valid for flat terrain. When the topography is not smooth, specific site effects on gravity measurement must be considered to compute R.
2.3. Ground-Truth ET Estimates Using SG Data
ET water balance-based approach is usually used as a benchmark for evaluating other
ET products. This approach is based on the principle of mass conservation and contemplates the difference between incoming and outgoing hydrological fluxes at different temporal and spatial scales. The classical water balance equation can be expressed as:
where
ET,
P and
Rs are cumulative
ET, precipitation, and runoff (in mm) during an arbitrary period of time Δ
t = ti - ti-1, respectively, and
represents the water storage changes. In this study, Δ
t periods of 8-day, which is the temporal resolution of the MOD16A2 product, and 1 month are considered. The estimated
ET values using Equation (6) are representative within an area defined by the SG radius of influence whose value is approximately 1300 m in the study site (see
Section 2.2).
As previously mentioned, the study site is characterized by very low topographic slopes. Then, runoff (
Rs) can be estimated as:
where
α is a model parameter which is assumed to be constant. Several studies performed in Buenos Aires Province report a value of
α = 0.05.
Water storage changes Δ
S are estimated from SG data (Δ
g) using a factor
C to convert gravity variations into equivalent water storage changes as follow:
The value of
C depends on the topography and the size of the building that houses the SG. The building impedes the processes of
ET and natural infiltration, affecting the gravity measurements. This phenomenon is known as the umbrella effect [
35]. When the topography of the study site is flat and the umbrella effect is negligible, the conversion factor
C is 2.38 mm (nm s
-2)
-1 [
31]. At the AGGO study site, Pendiuk [
22] estimated a site-specific
C of 2.57 mm (nm s
-2)
-1 from a regression analysis between gravity residuals and water storage changes computed by soil moisture data.
Combining Equations (3) – (5) an expression for computing
ET is obtained:
Note that Equation (6) only depends on precipitation and gravity residuals so no additional data about physiological properties of canopy is required. In section 3, ET values estimated from Equation (6) are used as ground-truth data to validate the global terrestrial ET products MOD16A2.
2.4. Description of the data Set
In this work, an annual period from May 1, 2017 to April 30, 2018 is considered. Gravity residuals and precipitation time series are available on the GFZ database [
28]. The MODIS global terrestrial
ET (MOD16A2) data is obtained from the
Google Earth Engine platform.
2.4.1. Gravity Residuals and Water Storage Changes Time Series
Gravity residuals (Δ
g) with an hourly time resolution are provided by the GFZ database [
28]. These residuals are obtained from SG038 data after subtraction for the Earth tides, atmospheric and oceanic loading, polar motion effects, instrumental drift, and global both atmospheric and hydrological effects [
36]. Additionally, a moving average filter with a window length of 6 days is applied to the data series in order to reduce the non-hydrological effects that can be distinguished in gravity residuals.
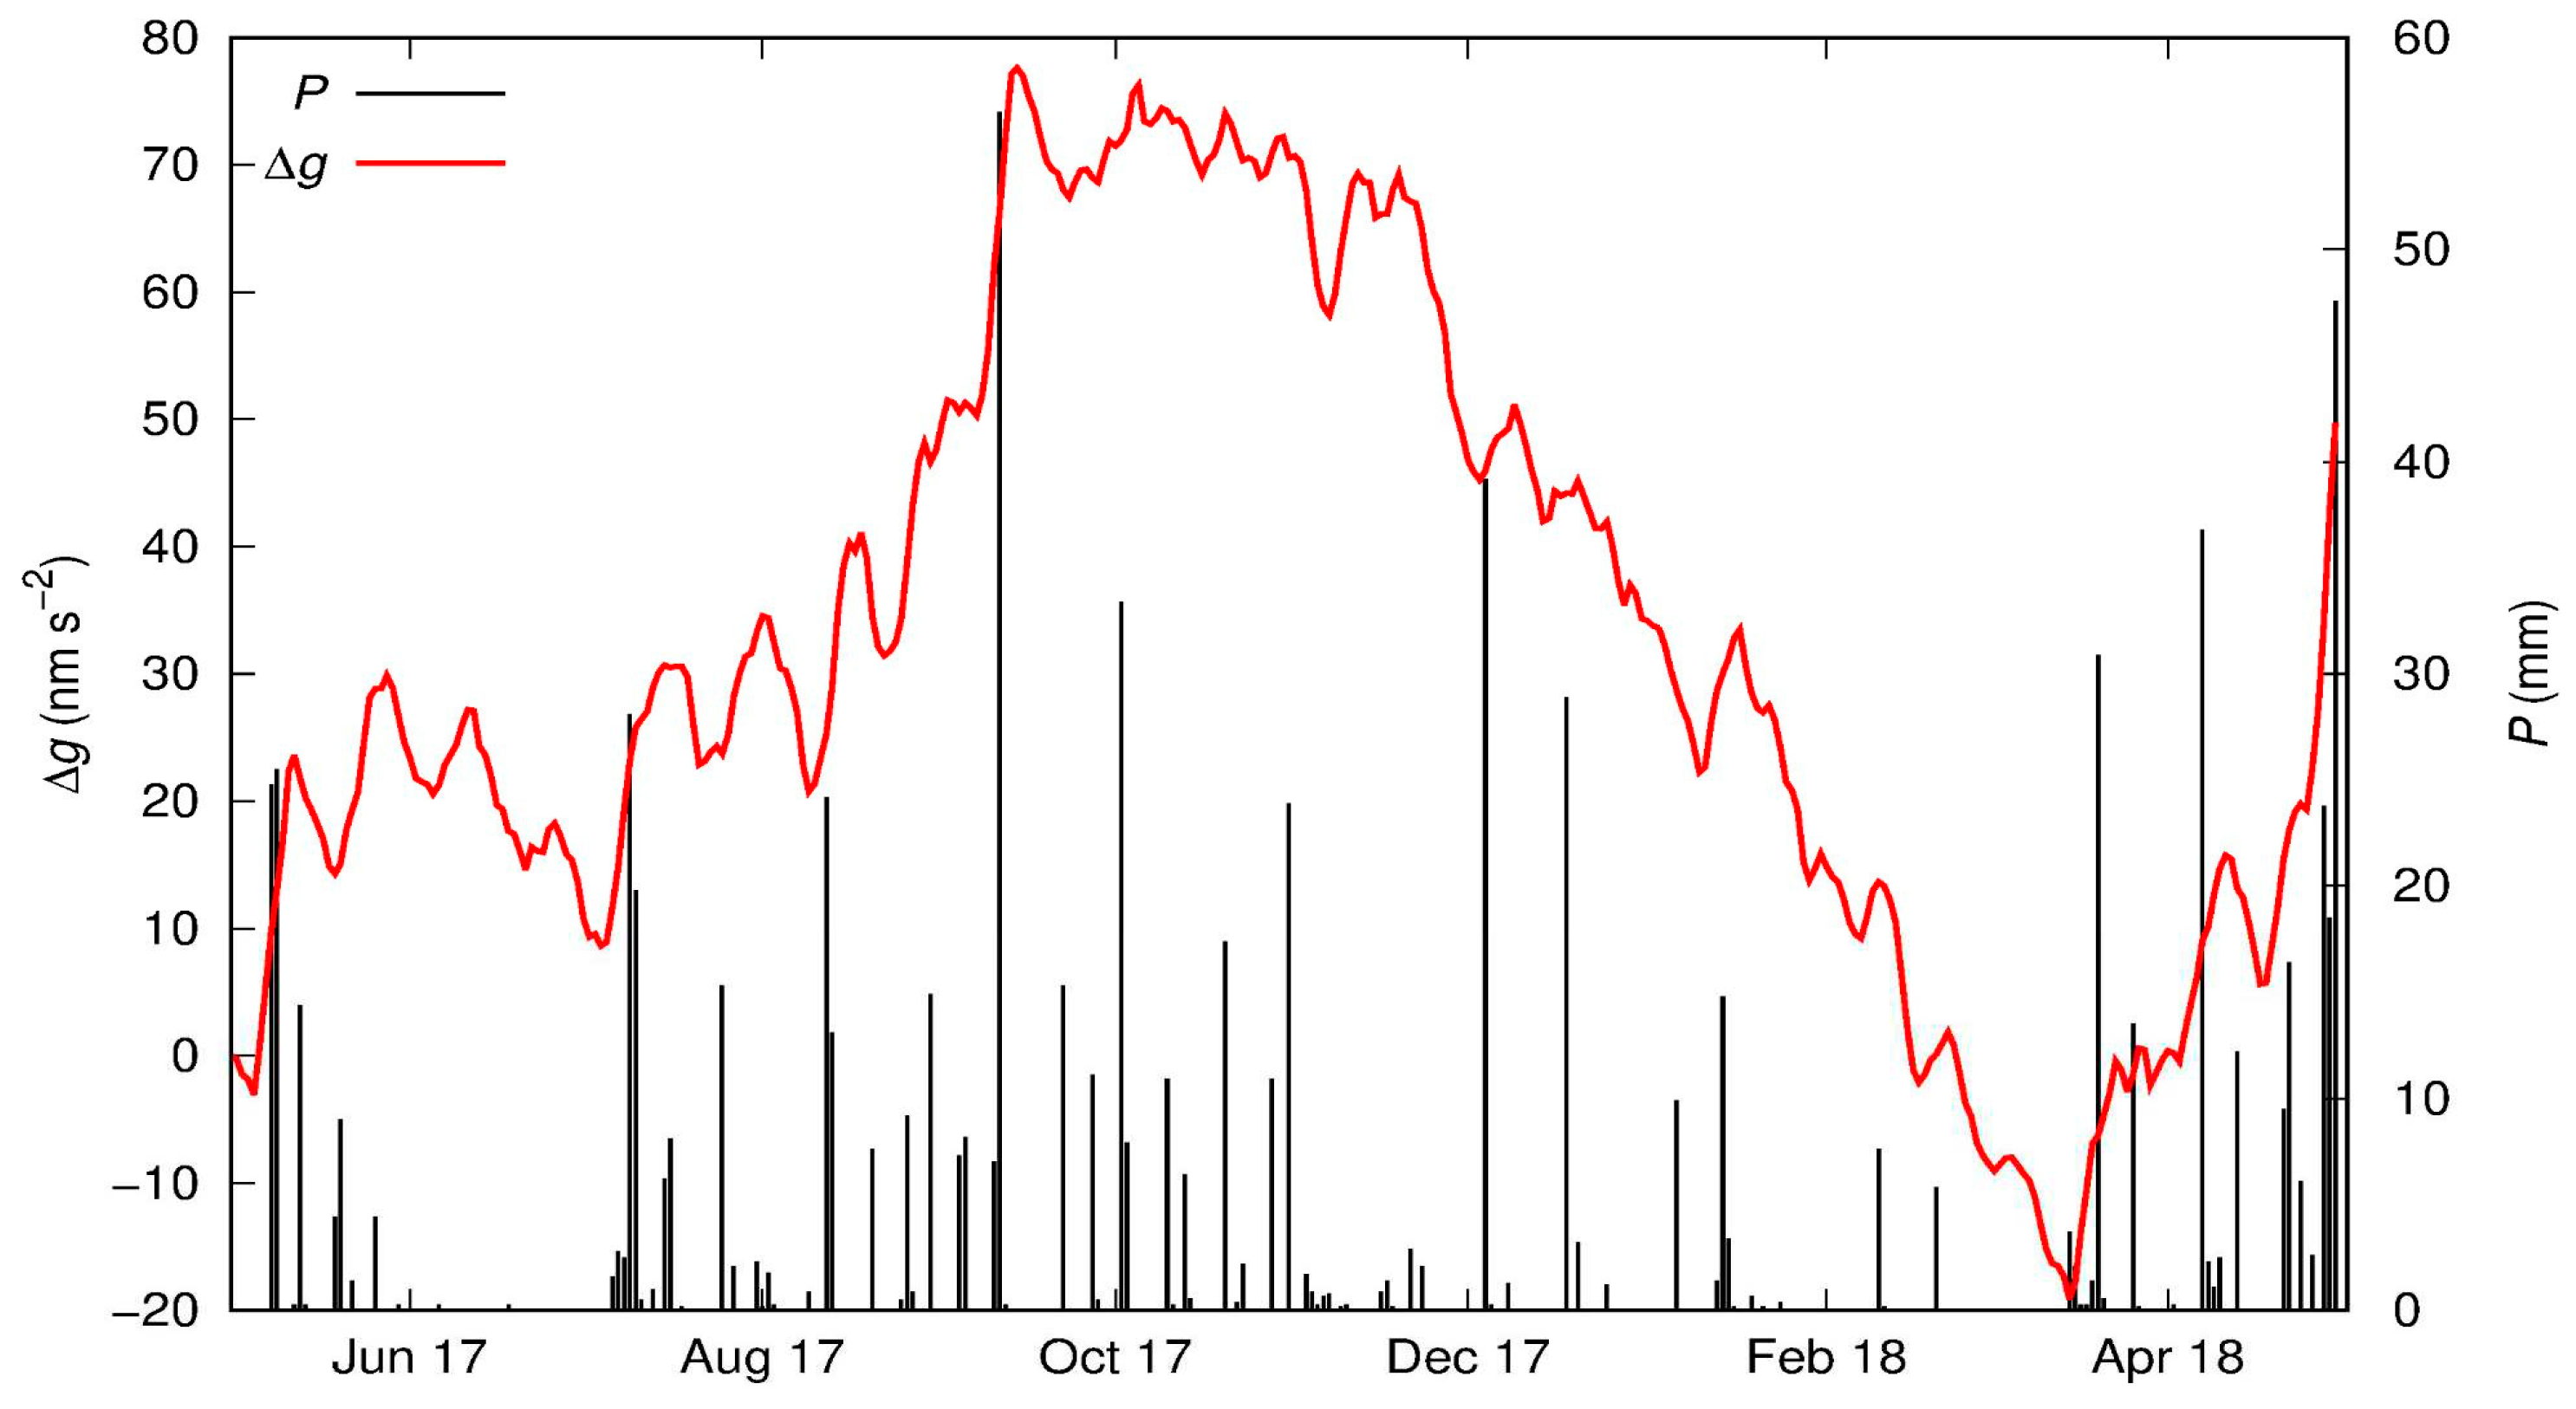
Figure 4 shows gravity residual time series which is assumed to reflect the main local water storage changes in the surroundings of SG038. For the period November 2017 - March 2018, it is assumed that the water storages decrease significantly since the gravity residual is directly proportional to water storage changes (see Equation (5)).
Note that, despite the filtering applied to the gravity data, a non-hydrologic signal with a period of approximately 14 days persists, identified from a spectral analysis.
2.4.2. Precipitation
Precipitation (
P) is recorded in hourly time steps by two rain gauges. They are located at a distance of 10.9 m from each other near the SG038. Both time series are pre-processed and then merged to obtain a precipitation series without missing values [
36].
Figure 4 shows the precipitation series for the study period. The cumulative precipitation is 838 mm, which is less than the mean annual value (1007 mm). April 2018 is the rainiest month of the study period (
P = 180 mm), followed by September and October 2017, while June is the driest month (
P = 1.1 mm).
2.4.3. Satellite Data (MOD16A2)
MOD16 is selected for this study since to our knowledge it is the most widely used remote-sensing-based
ET data set at the global scale. MOD16 is usually used to evaluate modelled
ET due to its high spatial resolution, extensive historical data availability, and global coverage. However, it is not applicable in ice-driven catchments, desert areas, and water bodies where the MOD16 algorithm cannot derive
ET [
37]. The MOD16 product has been evaluated against ground measurements derived from eddy flux towers in several parts of the world, resulting in varying levels of accuracy across different regions, including North America, Europe, South America, and Asia [
37,
38,
39,
40]. In all of these comparisons, it is important to highlight that the ground measurements themselves have inherent uncertainties, typically ranging from 10% to 30% when
ET is estimated by eddy flux towers.
The MOD16A2 version 6 data is provided by Earth Data-National Aeronautics and Space Administration (NASA). The algorithm to calculate
ET is based on the Penman-Monteith equation [
41]. Inputs come from the reanalysis global daily meteorological dataset Modern-Era Retrospective analysis for Research and Applications (MERRA), and from MODIS data: land cover (MOD12Q1) product, Leaf Area Index/Fraction of Photosynthetically Active Radiation (LAI/FPAR MOD15) product, and Albedo (MCD43A2/A3) product. MOD16A2 is based on the algorithm first proposed by Mu
et al. [
37]. The actual
ET is retrieved from remote sensing data as the sum of evaporation losses from the wet canopy, actual plant transpiration, and actual soil evaporation [
37,
42]. The MOD16A2 estimates
ET in 8-day time intervals. This time period allows capturing changes in
ET patterns on a global scale. Additionally, the 8-day interval is also related to the satellite data acquisition used in the product, resulting in good accuracy. However, some updates have been implemented in the operational code to fix some issues. These updates are detailed in Running
et al. [
43].
The MOD16A2 version 6 product is provided with a spatial resolution of 500 m per pixel. To obtain representative ET values for the study site, average values are computed for a 3x3 pixel grid with the SG as the central point. Note that the grid size of 3x3 pixel (1500 m) is similar to the radius of influence of the SG, which is approximately 1300 m (see Equation (2)).
2.5. Statistical Performance Metrics
To compare the performance of MOD16A2 products in relation to the
ET estimated by the gravity-based approach, three statistics metrics are computed: (1) Mean Absolute Error (
MAE), (2) Root Mean Square Error (
RMSE), and (3) Pearson correlation coefficient (
r):
where
N represent the number of total observations,
and
are MOD16A2 data and
ET gravity-based approach at time period
j, respectively. The symbol <> indicates the mean value of the variable for the whole period of the analysis.
3. Results
3.1. ET Estimates on an 8-Day Timescale
ET is estimated by the gravity-based method using Equation (6) on an 8-day time scale and compared to the MOD16A2 product (
ETM).
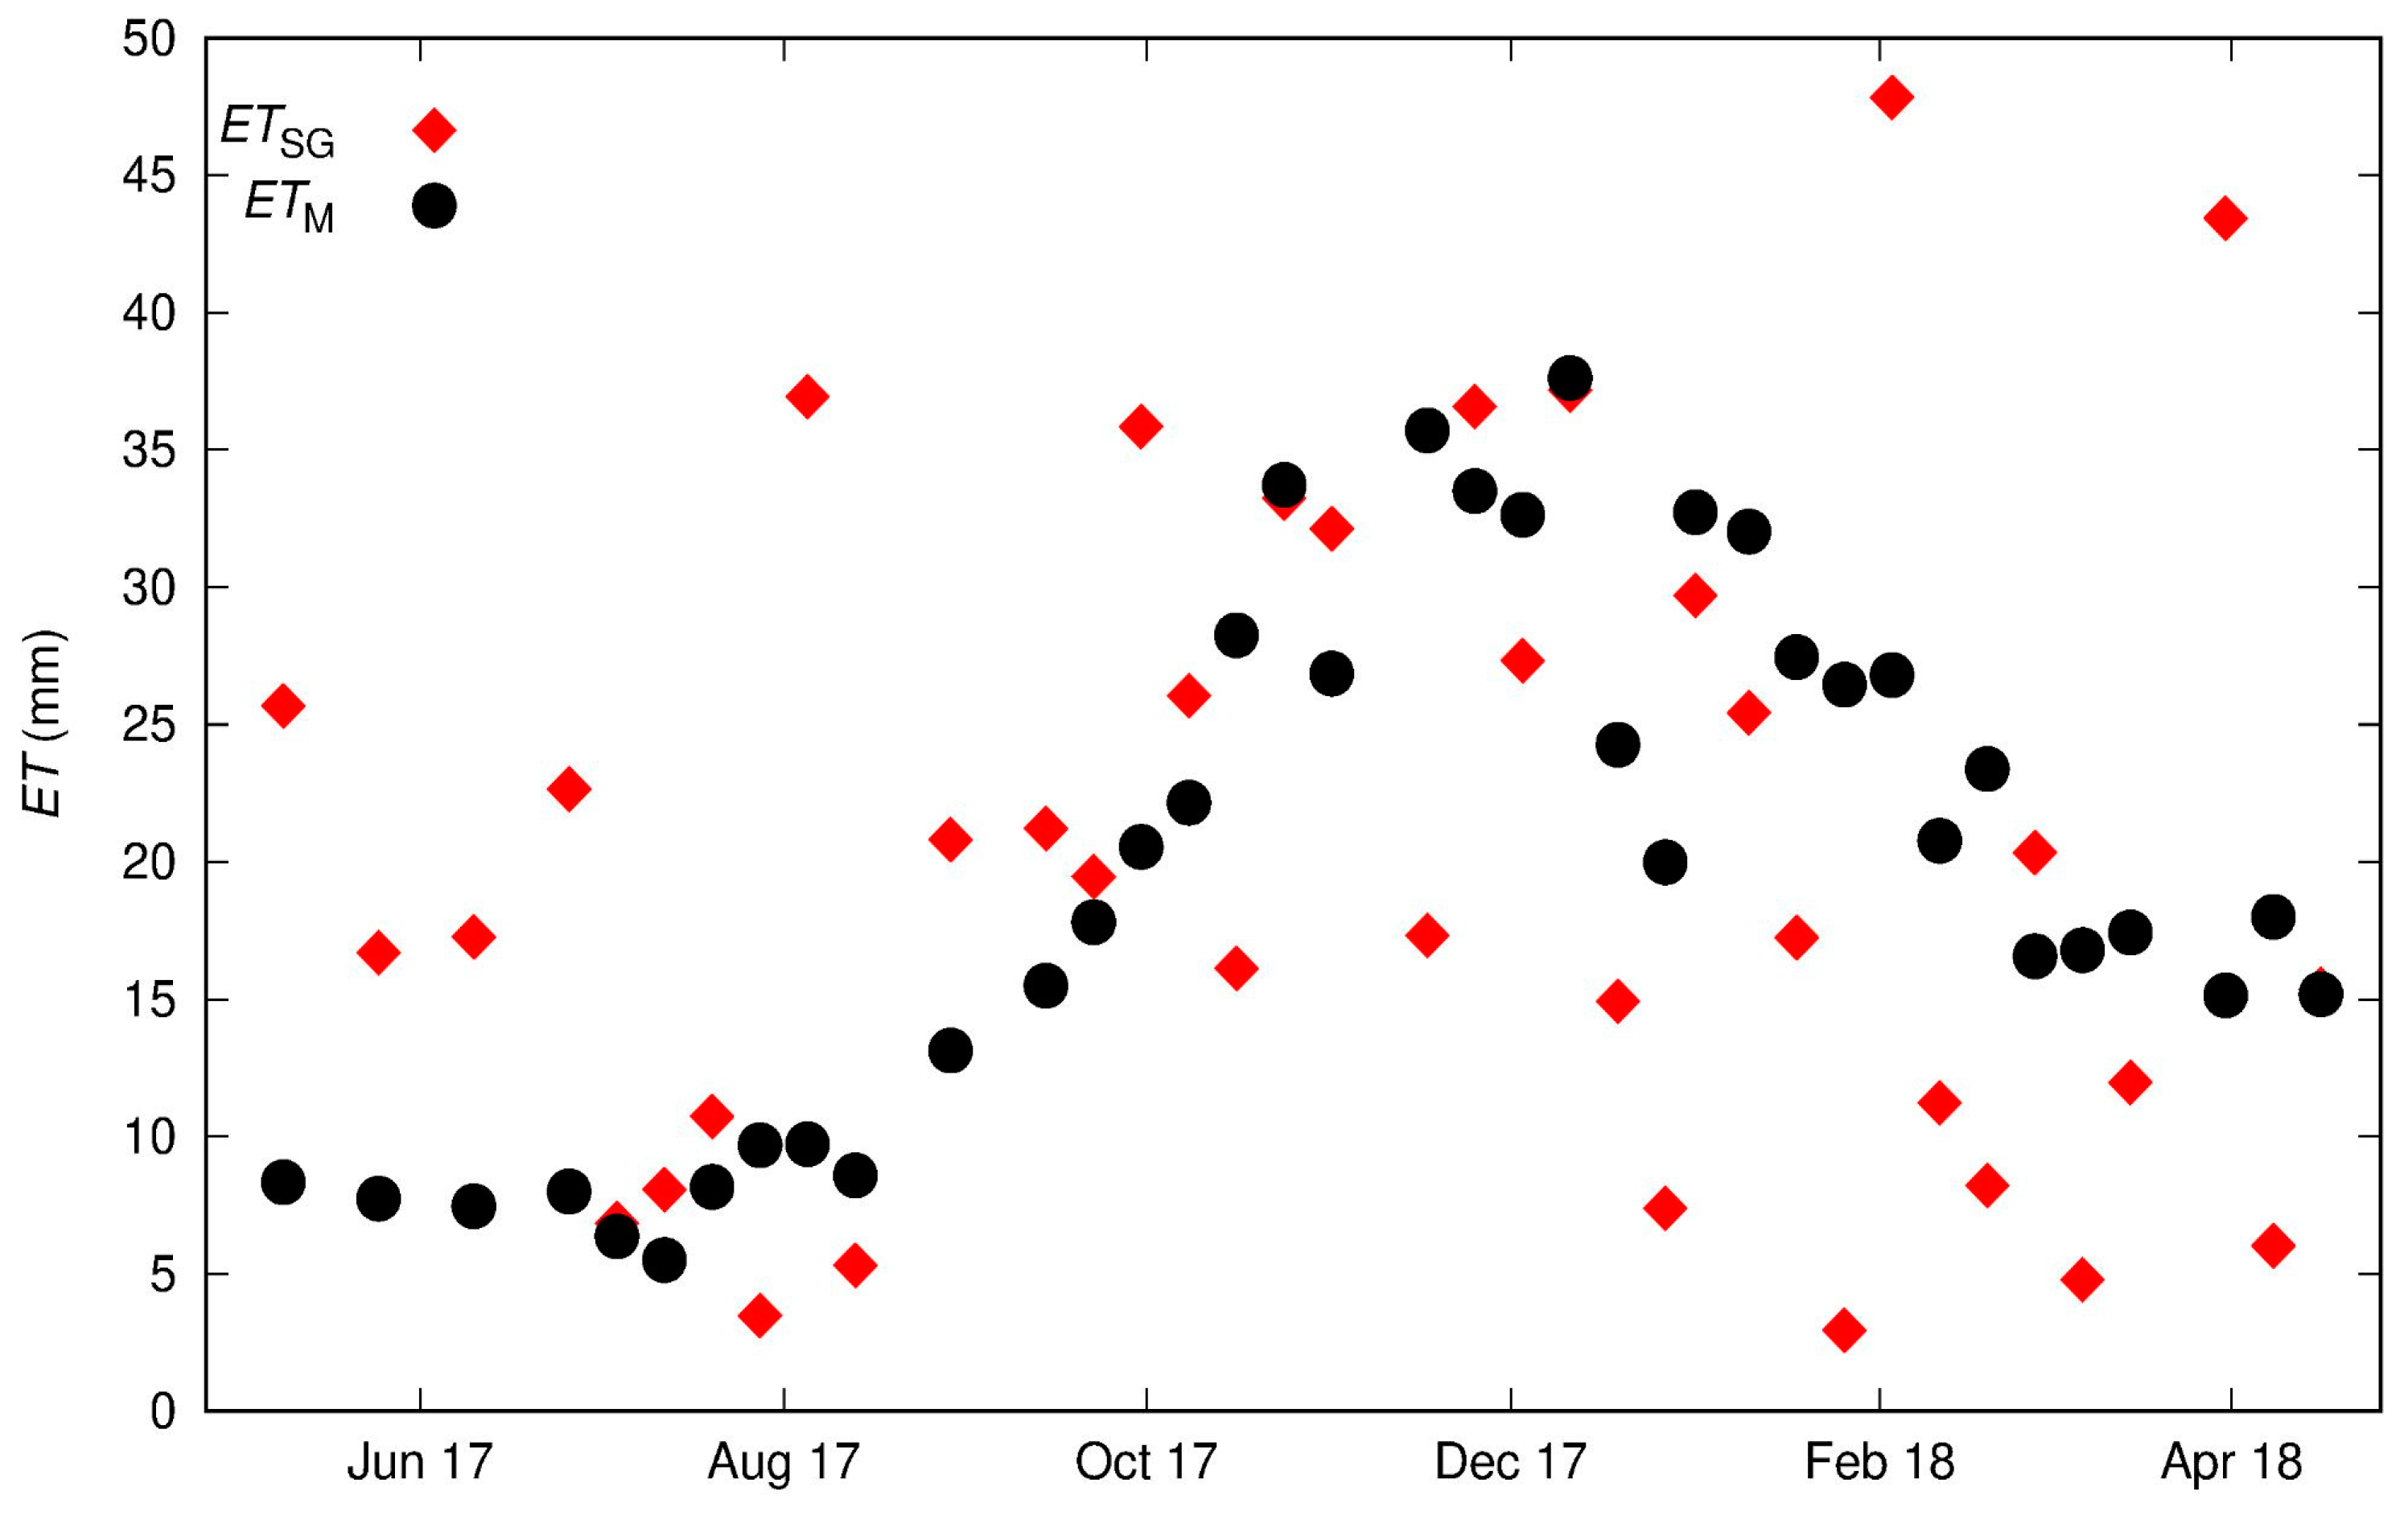
Figure 5 shows
ET gravity-based approach (
ETSG) and
ETM time series. Negative values of
ETSG estimated by the gravity-based technique are not realistic and were removed from this analysis.
ETM shows a clear seasonal pattern where the maximum values are observed in the period November 2017 - December 2018, whereas, values of
ETSG show dispersion. Moreover, the gravity-based technique yields high
ET values for the cold period May 2017 - June 2017. Statistical metrics are calculated using Equations (7)–(9) and the obtained values are listed in
Table 1. The estimated
MAE and
RMSE values are 9.32 (1.2 mm day
-1) and 11.9 mm (1.5 mm day
-1), respectively. In addition, the estimated value of the correlation coefficient is
r = 0.4, indicating a weak correlation due to the significant dispersion of
ETSG.
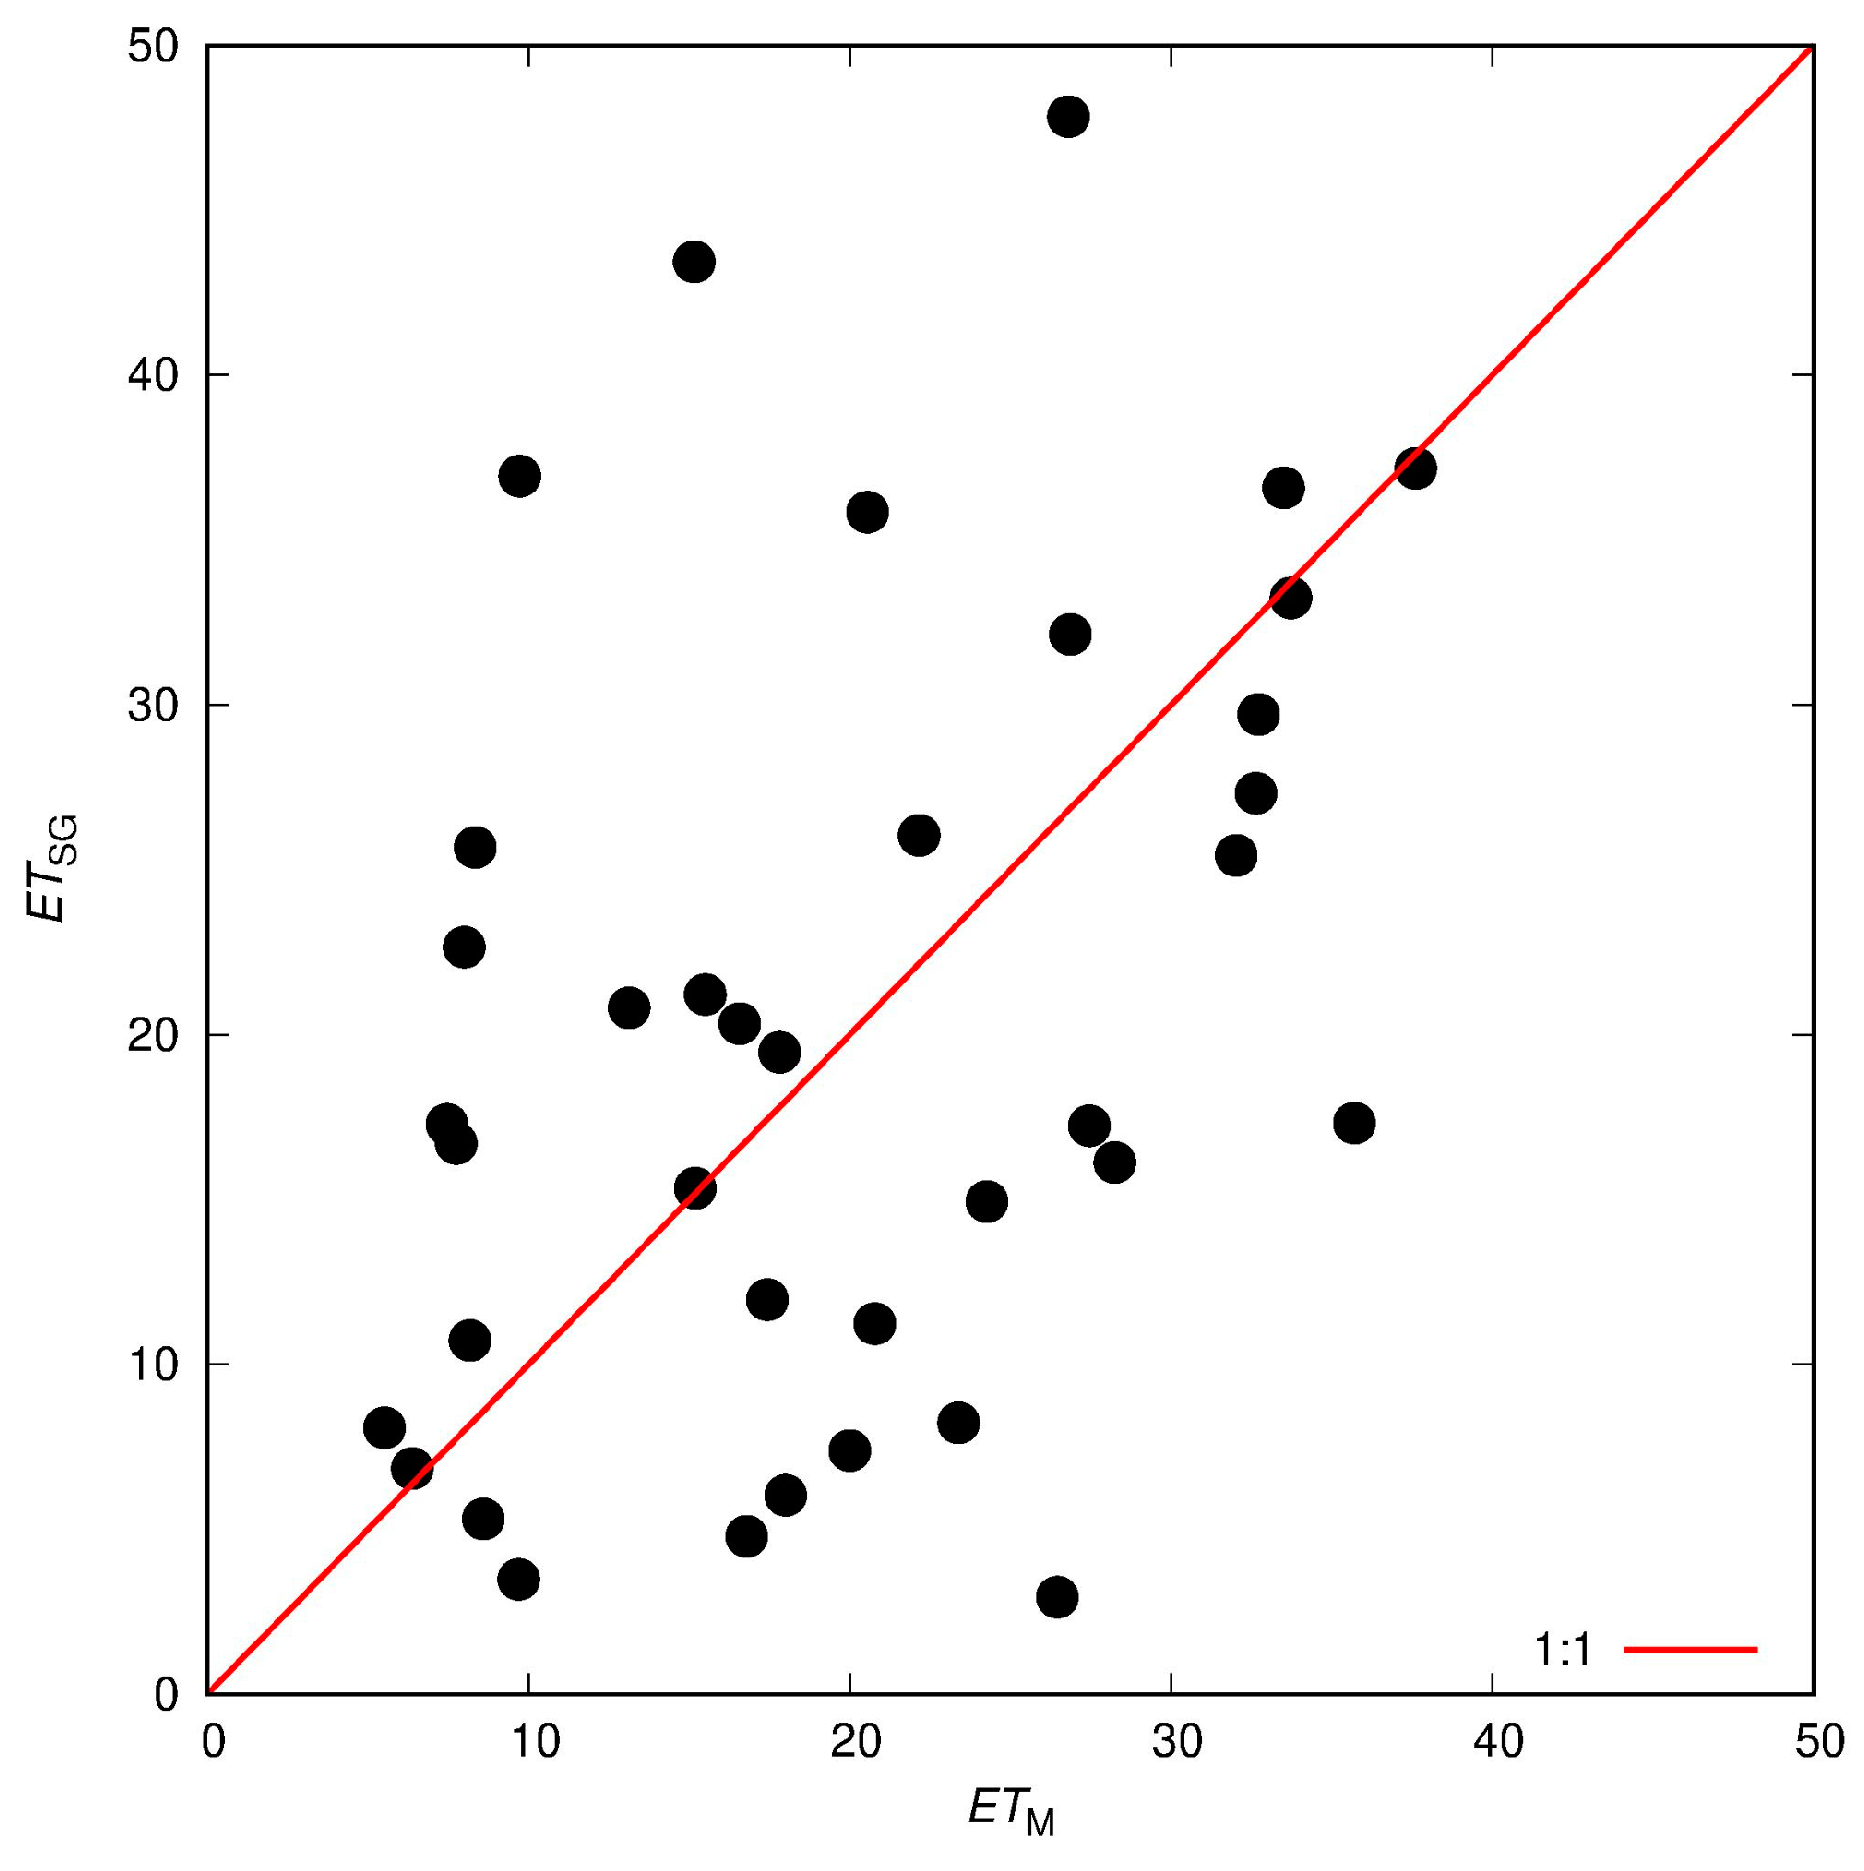
In order to visualise the dispersion between
ET series, a crossplot of
ETSG and
ETM is shown in
Figure 6. The discrepancies between the
ET series could be attributed to a non-hydrological signal with a period of approximately 14 days observed in gravity data (
Figure 4). This periodical signal on the gravimetric residuals may be associated with the global non-tidal oceanic and atmospheric loading effect, which was probably not completely removed in the gravity signal processing stage. At timescales longer than 14 days this signal is expected to attenuate. In the next section,
ET estimated by both methods at monthly timescale are compared.
3.2. Estimation of Monthly ET
In this section,
ETSG is estimated from the Equation (6) using cumulative precipitation and gravity residuals data with a monthly period of time Δ
t. To obtain MOD16A2
ET values at a monthly timescale, a temporal upscaling approach is applied to
ETM at an 8-day.
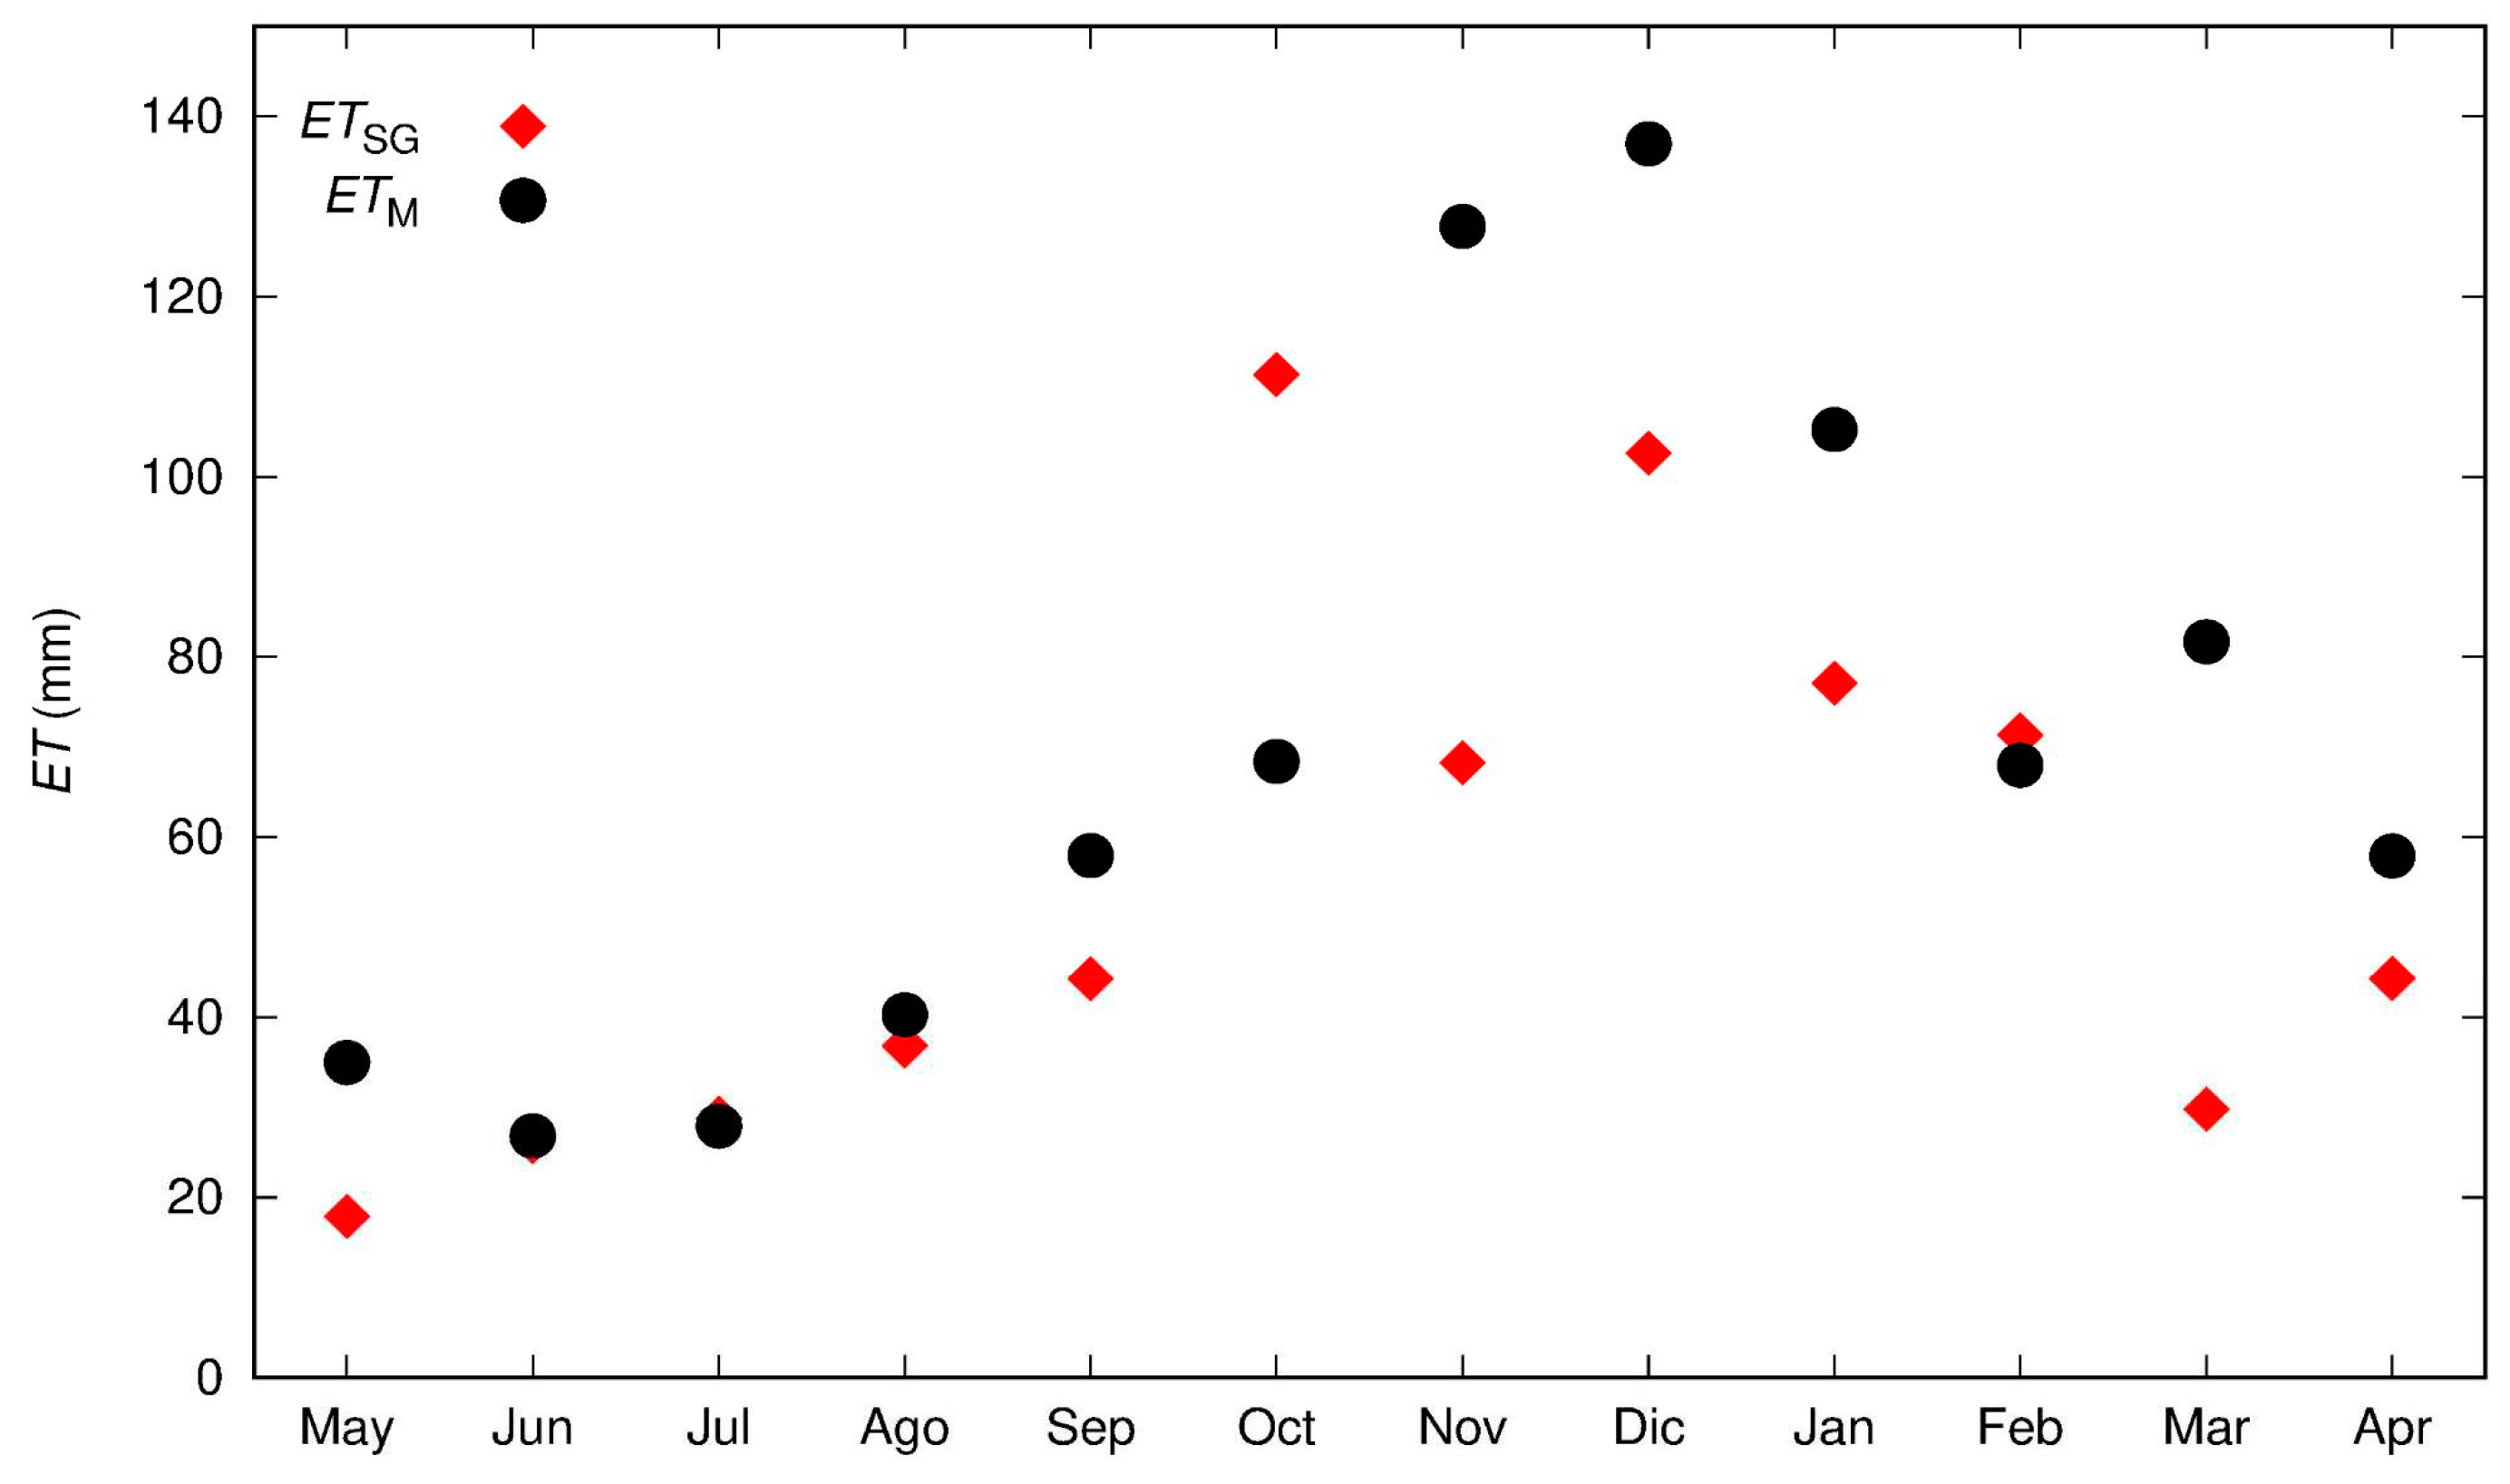
Figure 7 shows monthly values of
ETSG and
ETM and now no dispersion is observed. The
ET estimated by both methods show a seasonal pattern where minimum and maximum values are observed in winter and summer, respectively. Note that
ET estimates are similar for the winter season. The largest discrepancies between
ET gravity-based approach and
ETM are observed in the spring-summer period whose values ranging from 42 to 59 mm. In addition,
ETM values tend to be higher than
ET values. This period coincides with the beginning of a marked drop in water storage observed in the soil moisture sensors located in AGGO and which can also be inferred from the gravimetric residuals shown in
Figure 4. The differences between
ETSG and
ETM can be mainly attributed to the MOD16A2 algorithm. Specifically, the MOD16A2 algorithm does not directly consider soil moisture variations when estimating
ET. Instead, it is constrained by daily vapour pressure deficit, relative humidity, and minimum air temperature [
37]. This approach is based on the assumption of congruence between near surface atmosphere and soil moisture conditions at coarser spatio-temporal scales [
44,
45].
At the monthly timescale, the values of all statistical metrics improve. Certainly,
MAE (24.5 mm = 0.8 mm day
-1) and
RMSE (32.6 mm = 1.1 mm day
-1) values are reduced compared to those obtained at 8-day timescale (see
Table 1). Besides, a higher value of the Pearson correlation coefficient
r = 0.7 is obtained, indicating a positive monotonic relationship between
ETM and
ETSG.
To verify the effect of the time scale on
ET gravity-based approach estimates, an additional comparison between
ETSG and
ETM at 16 days is also performed. The comparison of both data sets gives values of
MAE = 13.5 mm (0.8 mm day
-1),
RMSE = 19.6 mm (1.2 mm day
-1) and
r = 0.58. Note that these statistical values improve in relation to those obtained for 8 days, but are worse than those of the monthly scale (see
Table 1). These results confirm that, as the time scale increases, a better agreement is observed between the
ET series.
4. Conclusions
This study proposes a novel methodology to validate remote sensing estimates of evapotranspiration (ET) using ground-truth ET data obtained from a superconducting gravimeter at mesoscale. This validation is consistent since the radius of influence of the superconducting gravimeters (50 to 4000 m) is similar with the horizontal resolution of several satellite observations (e.g., Soil Moisture Active Passive, Global Land Evaporation Amsterdam and Priestley-Taylor Jet Propulsion Laboratory Model). In particular the MOD16A2 products used in this study have a spatial resolution of 500 m, which provides good representativeness on a global scale.
The gravity-based technique estimates ET as a residual of the classical water balance equation using precipitation and superconducting gravimeter data. ET gravity-based approach is used for validating the global ET products MOD16A2 in a study site located in Buenos Aires Province for one year from May 2017 to April 2018. This analysis is performed at two different time scales: 8 days and one month. At 8-day scale, a greater dispersion is observed between ET time series, with RMSE values of 11.9 mm (1.5 mm day-1) and correlation coefficient r = 0.4. The discrepancies observed could be associated with the persistence of a 14-day non-hydrological periodical signal in the gravity residuals. This effect impacts directly on ET data resulting in some unrealistic values.
At the monthly timescale, both ET time series show similar seasonal patterns. The estimated RMSE value for this analysis is 32.6 mm month-1 (1.1 mm day-1) which is within the expected range for satellite products. Moreover, a better correlation is observed between ET gravity-based approach and satellite data (r = 0.7) since the 14-day periodic signal is attenuated by temporal upscaling. This result shows the potential of gravity-based approach as a ground truth ET data at a monthly timescale and spatial mesoscale, which represents a major step forward in the field of remote sensing validation.
The current state of the art for gravimetric data processing can only guarantee good ET estimates at monthly scales. For short time periods, gravity reductions need to be available with high accuracy to asses ET patterns. However, it is expected that with the increasing use of superconducting gravimetry, data reduction models will improve, leading to better results at smaller time scales.
Author Contributions
“Conceptualization, Rivas, R. and Guarracino, L.; methodology, Pendiuk, J. and Degano M. F.; software, Pendiuk, J.; validation, Pendiuk, J. and Degano M. F.; formal analysis, Pendiuk, J., Degano M. F., Guarracino, L. and Rivas, R.; investigation, Pendiuk, J., Degano M. F., Guarracino, L. and Rivas, R.; resources, Pendiuk, J., Degano M. F. and Guarracino, L.; data curation, Pendiuk, J. and Degano M. F.; writing—original draft preparation, Pendiuk, J. and Guarracino, L.; writing—review and editing, Degano M. F.; visualization, Pendiuk, J., Degano M. F.; supervision, Rivas, R. and Guarracino, L.; project administration, Pendiuk, J., Degano M. F., Guarracino, L. and Rivas, R.; funding acquisition, Pendiuk, J., Degano M. F., Guarracino, L. and Rivas, R. All authors have read and agreed to the published version of the manuscript.”
Funding
This research received no external funding.
Data Availability Statement
Acknowledgments
The authors would like to thank the Instituto de Hidrología de Llanuras "Dr. Eduardo Jorge Usunoff", the Consejo Nacional de Investigaciones Científicas Técnicas, the Facultad de Ciencias Astronómicas y Geofísicas and the Comisión de Investigaciones Científicas de la provincia de Buenos Aires.
Conflicts of Interest
“The authors declare no conflict of interest.”
References
- Zhang, K. , Kimball, J. S., Running, S.W. A review of remote sensing based actual evapotranspiration estimation. Wiley Interdisc. Rev.: Water 2016, 3, 834–853. [Google Scholar] [CrossRef]
- Güntner, A. , Reich, M., Mikolaj, M., Creutzfeldt, B., Schroeder, S., Wziontek, H. Landscape-scale water balance monitoring with an iGrav superconducting gravimeter in a field enclosure. Hydrol. Earth Syst. Sci. 2017, 21, 3167–3182. [Google Scholar] [CrossRef]
- Schrader, F. , Durner, W., Fank, J., Gebler, S., Pütz, T., Hannes, M., Wollschläger, U. Estimating Precipitation and Actual Evapotranspiration from Precision Lysimeter Measurements. Procedia Env. Sci. 2013, 19, 543–552. [Google Scholar] [CrossRef]
- Rana, G. , Katerji, N. Measurement and estimation of actual evapotranspiration in the field under Mediterranean climate: a review, Eur. Jour. of Agr. 2000, 13, 125–153. [Google Scholar] [CrossRef]
- Creutzfeldt, B. , Güntner, A , Wziontek, H., Merz, B. Reducing local hydrology from high precision gravity measurements: A lysimeter-based approach, Geophys. J. Int. 2010, 183, 178–187. [Google Scholar] [CrossRef]
- Huo, S. , Jin, M., Liang, X. et al. Estimating impacts of water-table depth on groundwater evaporation and recharge using lysimeter measurement data and bromide tracer. Hydrogeol J. 2020, 28, 955–971. [Google Scholar] [CrossRef]
- Tapley, B.D. , Watkins M.M., Flechtner F., Reigber C., Bettadpur S. et al. Contributions of GRACE to understanding climate change. Nat Clim Chang. 2019, 9, 358–369. [Google Scholar] [CrossRef] [PubMed]
- Long, D. , Longuevergne, L., Scanlon, B. R. Global analysis ofapproaches for deriving total waterstorage changes from GRACE satellites, Water Resour. Res. 2015, 51, 2574–2594. [Google Scholar] [CrossRef]
- Rodell, M. , Velicogna, I., Famiglietti, J.S. Satellite-based estimates of groundwater depletion in India. Nature 2009, 460, 999–1002. [Google Scholar] [CrossRef]
- Ciracì, E. , Velicogna, I., Swenson, S. Continuity of the mass loss of the world's glaciers and ice caps from the GRACE and GRACE Follow-On missions. Geophy. Res. Let. 2020, 47, e2019GL086926. [Google Scholar] [CrossRef]
- Cesanelli, A. , Guarracino, L., Estimation of regional evapotranspiration in the extended Salado Basin (Argentina) from satellite gravity measurements. Hydrogeol. J. 2011, 19, 629–639. [Google Scholar] [CrossRef]
- Swenson, S. , Wahr, J., Milly, P.C.D. Estimated accuracies of regional water storage variations inferred from the Gravity Recovery and Climate Experiment (GRACE). Water Resour. Res. 2003, 39, 1121–1134. [Google Scholar] [CrossRef]
- Sriwongsitanon, N. , Suwawong, T., Thianpopirug, S., Williams, J., Jia, L., Bastiaanssen, W. Validation of seven global remotely sensed ET products across Thailand using water balance measurements and land use classifications. J. Hydrol.: Regional Studies 2020, 30, 100709. [Google Scholar] [CrossRef]
- Dile, Y. , Ayana E., Worqlul, A., Xie, H., Srinivasan, R., Lefore, N., You, L., Clarke N. Evaluating satellite-based evapotranspiration estimates for hydrological applications in data-scarce regions: A case in Ethiopia. Sci. Tot. Env. 2020, 743, 140702. [Google Scholar] [CrossRef]
- Luo, Z. , Shao, Q., Wan, W., Li, H., Chen, X., Zhu, S., Ding, X. A new method for assessing satellite-based hydrological data products using water budget closure. J. Hydrol. 2021, 594, 125927. [Google Scholar] [CrossRef]
- Creutzfeldt, B. , Güntner, A, Vorogushyn, S., Merz, B. The benefits of gravimeter observations for modelling water storage changes at the field scale, Hydrol. Earth Syst. Sci. 2010, 14, 1715–1730. [Google Scholar] [CrossRef]
- Naujoks, M. , Kroner, C, Weise, A., Jahr, T., Krause, P., Eisner, S. Evaluating local hydrological modelling by temporal gravity observations and a gravimetric three-dimensional model, Geophys. J. Int., 2010, 182, 233–249. [Google Scholar] [CrossRef]
- Kennedy, J. , Ferré, TP.A., Creutzfeld, B. Time-lapse gravity data for monitoring and modeling artificial recharge through a thick unsaturated zone, Water Resour. Res. 2016, 52, 7244–7261. [Google Scholar] [CrossRef]
- Pendiuk, J.E. , Guarracino, L., Reich, M., Brunini, C., Güntner, A. Estimating the specific yield of the Pampeano aquifer, Argentina, using superconducting gravimeter data, Hydrogeology J. 2020, l, 28, 2303–2313. [CrossRef]
- Van Camp, M. , de Viron, O, Pajot-Métivier, G., Casenave, F., Watlet, A., Dassargues, A., Vanclooster, M. Direct measurement of evapotranspiration from a forest using a superconducting gravimeter, Geophys. Res. Lett. 2016, 43, 10225–10231. [Google Scholar] [CrossRef]
- Carrière, S.D. , Loiseau, B., Champollion, C., Ollivier, C., Martin-StPaul, N. K., Lesparre, N., et al. The first evidence of correlation between evapotranspiration and gravity at a daily time scale from two vertically spaced superconducting gravimeters. Geophy. Res. Lett. 2021, 48, e2021GL096579. [Google Scholar] [CrossRef]
- Pendiuk, J. Modelado y análisis de problemas hidrogravimétricos Ph.D. Thesis. National University of La Plata, 2022. [Google Scholar]
- Tasumi, M. Estimating evapotranspiration using METRIC model and Landsat data for better understandings of regional hydrology in the western Urmia Lake Basin. Agric. Water Manag. 2019, 226, 105805. [Google Scholar] [CrossRef]
- Xiang, K. , Li, Y., Horton, R., Feng, H. Similarity and difference of potential evapotranspiration and reference crop evapotranspiration–a review. Agric. Water Manag. 2020, 232, 106043. [Google Scholar] [CrossRef]
- Degano, M.F., Carmona, F., Olivera-Rodríguez, P., Faramiñán, A., Rivas, R., Bayala, M., Niclòs-Corts, R. Analysis of Priestley-Taylor method in different environments and coverages. In XIX Workshop on Information Processing and Control (RPIC) (pp. 1-6). IEEE. 2021. [CrossRef]
- Degano, M.F. , Rivas, R.E., Carmona, F., Niclòs, R., Sánchez, J.M. Evaluation of the MOD16A2 evapotranspiration product in an agricultural area of Argentina, the Pampas region, The Egyptian Journal of Remote Sensing and Space Sciences, 2020, 24, 319–328. [Google Scholar] [CrossRef]
- Wziontek, H. , Wolf, P., Häfner, M., Hase, H., Nowak, I., Rülke, A., Wilmes, H., Brunini, C. Superconducting Gravimeter Data from AGGO/ La Plata - Level 1 GFZ Data Services, 2017. [CrossRef]
- Mikolaj, M. , Güntner, A., Brunini, C., Wziontek, H., Gende, M., Schröder, S., Pasquaré, A., Cassino, A.M., Reich, M., Hartmann, A., Oreiro, F.A., Pendiuk, J., Antokoletz, E.D., Guarracino, L. Hydrometeorological and gravity data from the Argentine-German Geodetic Observatory in La Plata, GFZ Data Services, 2018. [Google Scholar] [CrossRef]
- Nossetto, M.D. , Paez, R.A., Ballesteros, S.I., Jobbágy, E.G. Higher water-table and flooding risk under grain vs. livestock production systems in the subhumid plains of the Pampas, Agriculture, Ecosystems and Environment, 2015, 206, 60–70. [Google Scholar] [CrossRef]
- Hinderer, J. , Crossley D., Warburton, R.J. Superconducting Gravimetry, in Treatise on Geophysics, 2nd edn, 3 Geodesy, pp. 59 – 115., ed.Herring T., Schubert G., (editor-in-chief), Elsevier, 2015. [CrossRef]
- Hector, B. , Hinderer, J., Séguis, L., Boy, J-P., Calvo, M., Descloitres, M., Rosat, S., Galle, S., Riccardi, U. Hydro-gravimetry in West-Africa: First results from the Djougou (Benin) superconducting gravimeter, J.l of Geodynamics, 2014, 80, 34–49. [Google Scholar] [CrossRef]
- Telford, W.M. , Geldart, L.P., Sheriff, R.E. Applied geophysics, 2nd edn. Cambridge University Press, New York, 1992.
- Van Camp, M. , de Viron, O., Watlet A., Meurers, B., Francis, O., Caudron, C. Geophysics from terrestrial time-variable gravity measurements. Rev. of Geoph. 2017, 55, 938–992. [Google Scholar] [CrossRef]
- Voigt, C. , Schulz, K., Koch, F., Wetzel, K.-F., Timmen, L., Rehm, T., Pflug, H., Stolarczuk, N., Förste, C., and Flechtner, F. Technical note: Introduction of a superconducting gravimeter as novel hydrological sensor for the Alpine research catchment Zugspitze. , Hydrol. Earth Syst. Sci. 2021, 25, 5047–5064. [Google Scholar] [CrossRef]
- Reich, M. , Mikolaj, M., Blume, T., Güntner, A. Reducing gravity data for the influence of water storage variations beneath observatory buildings. Geophysics. 2019, 84, EN15-EN31. [CrossRef]
- Mikolaj, M. , Güntner, A., Brunini, C., Wziontek, H., Gende, M., Schröder, S.,Cassino, A.M., Pasquaré, A., Reich, M., Hartmann, A., Oreiro, F.A., Pendiuk, J., Guarracino, L., Antokoletz, E.D. Hydrometerological and gravity signals at the Argentine-German Geodetic Observatory (AGGO) in La Plata. Earth Syst Sci Data Discuss 2019, 11, 1501–1513. [Google Scholar] [CrossRef]
- Mu, Q.Z. , Zhao, M.S., Running, S.W. Improvements to a MODIS global terrestrial evapotranspiration algorithm. Rem. Sens. Env. 2011, 115, 1781–1800. [Google Scholar] [CrossRef]
- Ruhoff, A. L. , Paz, A. R., Aragao, L. E. O. C., Mu, Q., Malhi, Y., Collischonn, W. Assessment of the MODIS global evapotranspiration algorithm using eddy covariance measurements and hydrological modelling in the Rio Grande basin. Hydrological Sciences Journal, 2013, 58, 1658–1676. [Google Scholar] [CrossRef]
- Hu, G. , Jia, L., & Menenti, M. Comparison of MOD16 and LSA-SAF MSG evapotranspiration products over Europe for 2011. Remote Sensing of Environment, 2015, 156, 510–526. [Google Scholar] [CrossRef]
- Kim, H. W. , Hwang, K., Mu, Q., Lee, S. O., & Choi, M. Validation of MODIS 16 global terrestrial evapotranspiration products in various climates and land cover types in Asia. KSCE Journal of Civil Engineering, 2012, 16, 229–238. [Google Scholar] [CrossRef]
- Monteith, J. , Unsworth, M. Principles of Environmental Physics. Edward Arnold (ed.), London, 1990, 291 pp.
- Mu, Q.Z. , Heinsch, F.A., Zhao, M.S., Running, S.W. Development of a global evapotranspiration algorithm based MODIS and global meteorology data. Remote Sensing of Environment. 2007, 111, 519–536. [Google Scholar] [CrossRef]
- Running, S.W. , Mu, Q.Z., Zhao, M.S. MOD16A2 MODIS/Terra Net evapotranspiration 8-Day L4 Global 500m SIN Grid V006 [Data set] NASA EOSDIS Land Processes DAAC, 2017. [CrossRef]
- Fisher, J.B. , Tu, K.P., Baldocchi, D.D. Global estimates of the land–atmosphere water flux based on monthly AVHRR and ISLSCP-II data, validated at 16 FLUXNET sites. Rem. Sens. of Env. 2008, 112, 901–919. [Google Scholar] [CrossRef]
- Brust, C. , Kimball, J.S., Maneta, M.P., Jencso, K., He, M., Reichle, R.H. Using SMAP Level-4 soil moisture to constrain MOD16 evapotranspiration over the contiguous USA. Rem. Sens. of Env. 2021, 255, 112277. [Google Scholar] [CrossRef]
|
Disclaimer/Publisher’s Note: The statements, opinions and data contained in all publications are solely those of the individual author(s) and contributor(s) and not of MDPI and/or the editor(s). MDPI and/or the editor(s) disclaim responsibility for any injury to people or property resulting from any ideas, methods, instructions or products referred to in the content. |
© 2023 by the authors. Licensee MDPI, Basel, Switzerland. This article is an open access article distributed under the terms and conditions of the Creative Commons Attribution (CC BY) license (http://creativecommons.org/licenses/by/4.0/).
