1. Introduction
Biomaterials are widely used in medical procedures for the replacement of tissues, organs, or bodily functions. Depending on the application, these materials differ in terms of structure, chemical composition, and processing. Under certain conditions, they may present limitations because they can suffer deformation, corrosion, and wear, increasing the possibility of failure of the implanted material [
1].
There are important concerns regarding the effects of metallosis caused by the infiltration of debris generated by the wear of metallic implants. Metallosis can occur in soft tissues and bones, with effects including infection and tissue necrosis, due to material corrosion that is usually associated with the improper use of metal in permanent implants in contact with body fluids. The problem of metallosis can necessitate implant replacement after periods shorter than ten years [
2].
Among the various types of metals used in implants, the present work investigates 316L stainless steel and Ti6Al4V alloy, which are both used in the femoral arches of total hip arthroplasty. These metals are currently used because their mechanical properties are favorable for the machining of implants, due to their low deformability, and they have moderate resistance to corrosion [
1,
2].
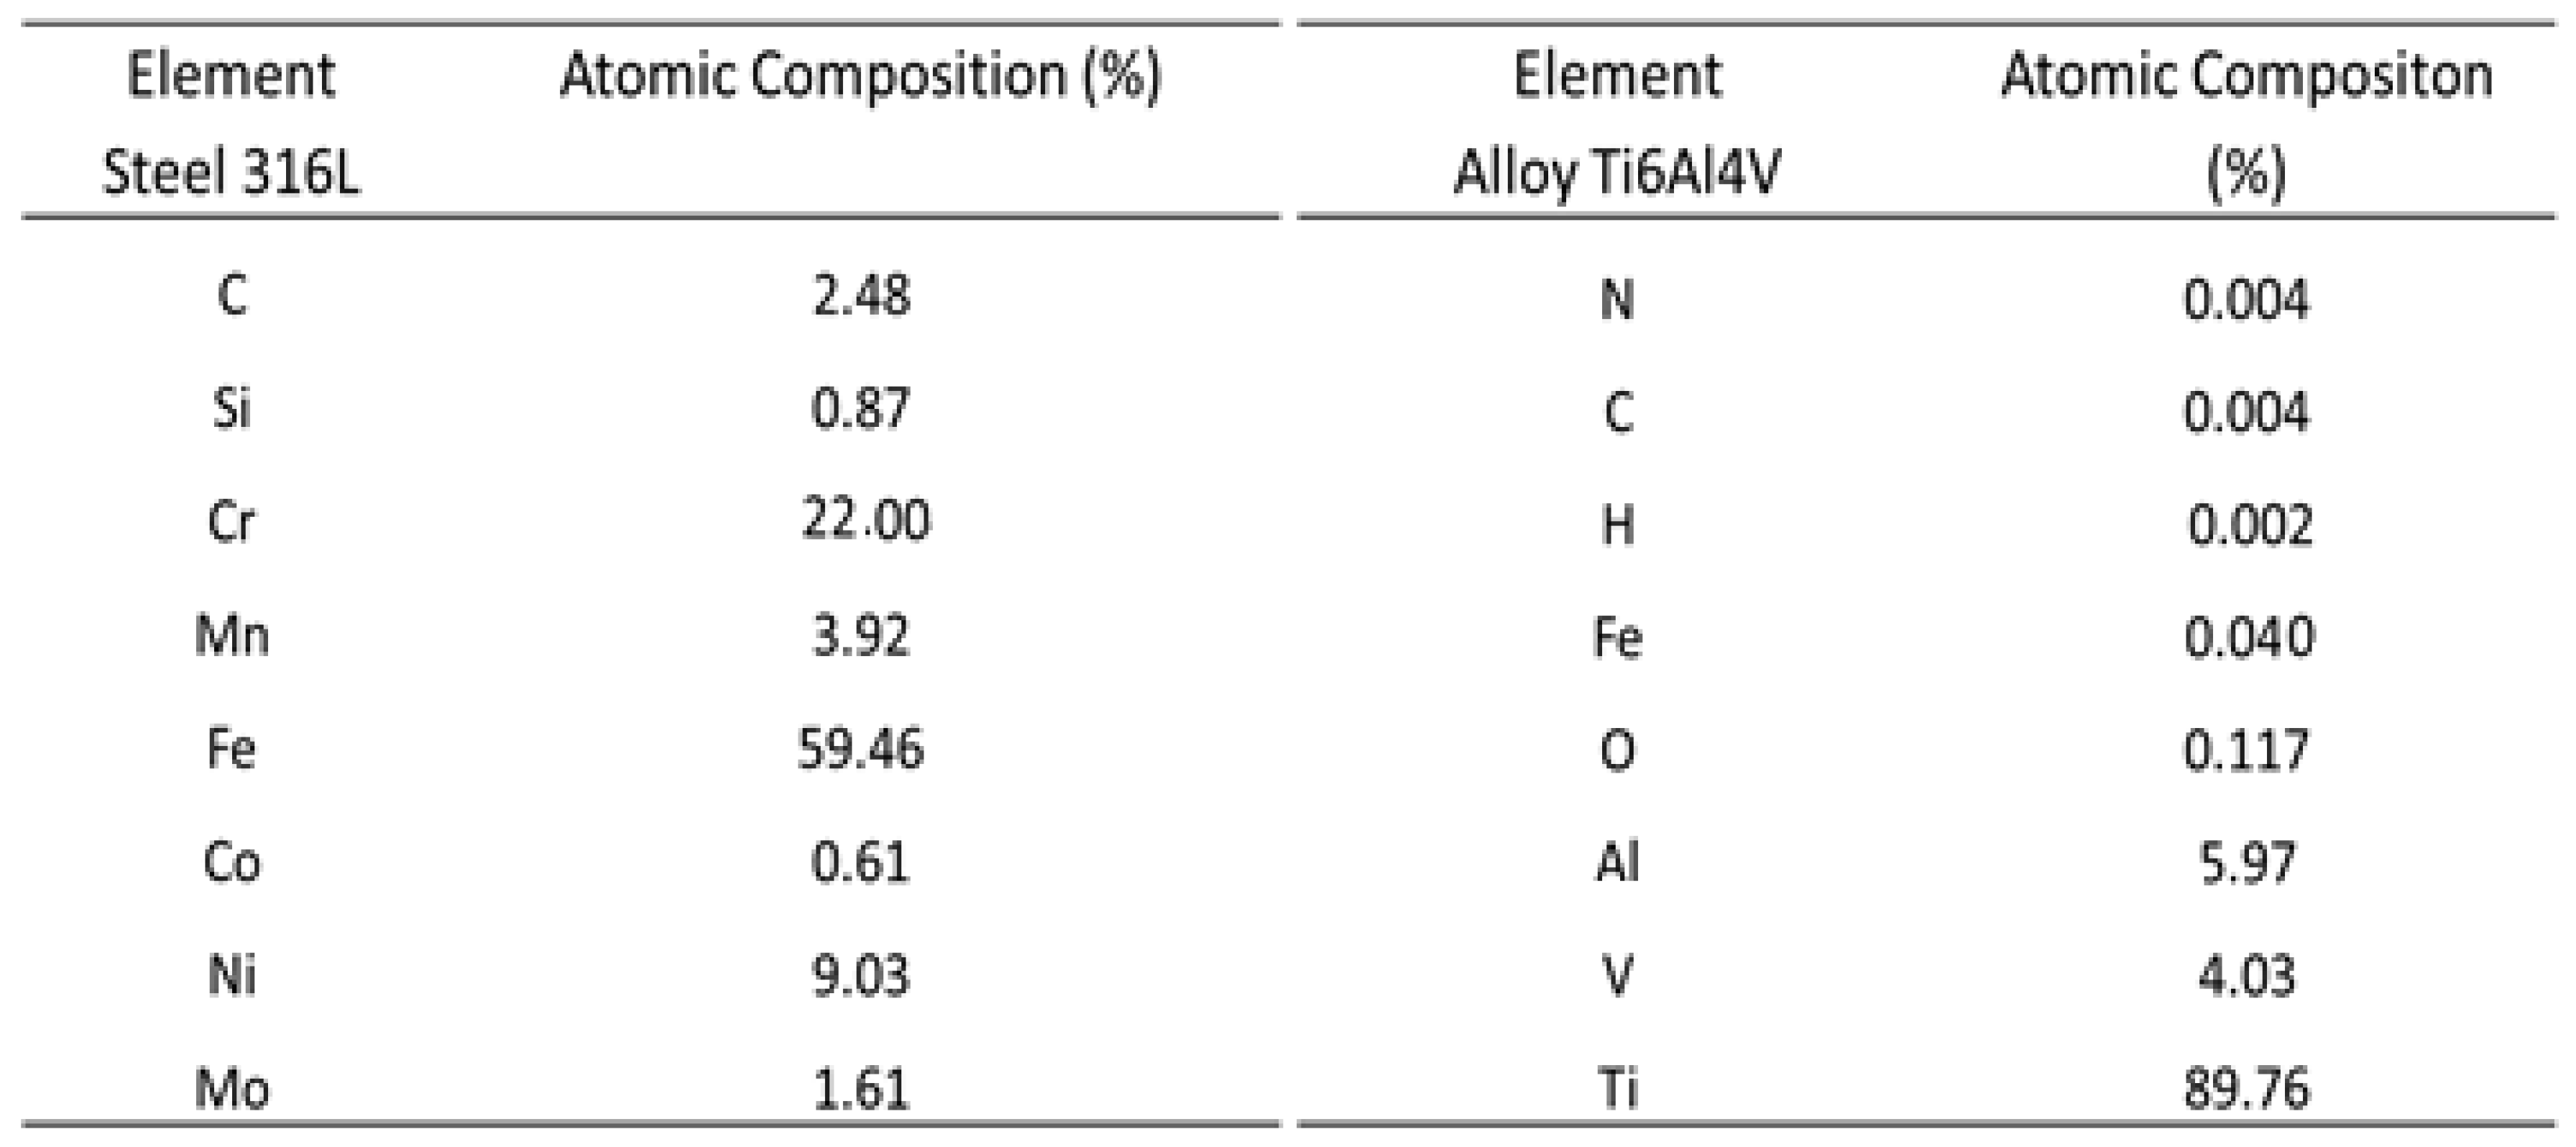
Table 1 shows the chemical compositions of the 316L steel and the titanium alloy, including metallic, nonmetallic, and semi-metallic (such as silicon) elements. It can be seen that SS316L contains 22% chromium, which, during the deterioration of implants, may be delivered to the body in the form of ions including Cr
6+, which can cause the development of cancer [
3]. Other chemical elements present in lower concentrations include nickel, carbon, silicon, manganese, cobalt, and molybdenum. It has been suggested that the aluminum and vanadium found in titanium alloy may be responsible for Alzheimer’s disease [
4]. Nitrogen, carbon, hydrogen, iron, and oxygen are also present as contaminants in Ti6Al4V.
Despite its advantages, SS316L presents a high rate of biocorrosion when in contact with body fluids, requiring the use of surface treatments. In particular, diamond-like carbon (DLC) has attracted attention as a coating, due to its low friction coefficient and good biocompatibility [
5].
Considering that SS316L and Ti6Al4V are still present in most of the implants used in the Brazilian Unified Health System (SUS), the aim of the present work was to perform a comparative study to evaluate the improvement of these metallic materials using DLC coatings to protect against tribocorrosion and to reduce cell damage.
1.1. Plasma and DLC deposition parameters
Diamond-like carbon [
6] is a metastable form of amorphous hydrogenated carbon (a-C: H) [
7] with sp
3 bonds, sp
2 carbon atoms, and hybridized hydrogen, as can be seen in the ternary diagram available elsewhere [
8]. DLC can be deposited using various processes with different gaseous or liquid precursors, such as acetylene, benzene, ethylene, methane, or hexane. Briefly, deposition consists of three steps: plasma reactions (dissociation or ionization), interaction of the plasma with the surface, and reactions of the substrate with the coating [
9].
The quality of DLC coatings is directly related to the deposition parameters, the type of source used, and the energy of the ions present in the chemical reactions that determine the percentages of hydrogen and carbon bound in chains and in graphite rings [
10].
The configuration of deposition parameters such as voltage, current, power supply, work cycle, working pressure, and precursor type should provide a plasma environment with high ion density and the pulsed power supply favored a low free path between ions and the substrate surface, avoiding strong collisions [
11]. The aim is to achieve an optimal collection of charged particles with ideal electrical conductivity, which collectively responds to the electromagnetic forces and chemical reactions during deposition. Inside the plasma reactor, the gas precursors undergoing ionization may take the form of bundles of neutral ions, while also acting as highly charged gas clouds that may contain particulate material in the form of dust. During the deposition process, these particles can be deposited onto the surface of the coating, causing the formation of porous dimples or pinholes [11-12] that act as sites for the permeation of corrosive liquids or vapors through the coatings onto the substrate. The pores generated by dust from the deposition process are starting points for corrosion that reduces the lifetime of the coating. The use of DLC coatings with high hardness, high resistivity to etching, high electrical resistivity [
13,
14], low friction coefficient [
15], and low pore content can be one way to protect the metal substrate and avoid corrosion.
2. Materials and Methods
2.1. Sample pretreatment and DLC deposition parameters
Eight samples of SS316L and Ti6Al4V with dimensions of 2 cm × 2 cm × 0.5 mm were used for mechanical tests, while twelve circular samples of the metals were used for biological tests. All the samples were prepared using sandpaper and polishing, followed by cleaning with enzymatic detergent (B4184Brij® L23 solution-Sigma Aldrich) and isopropyl alcohol (Synth), under ultrasonication system (Dubësser), to remove impurities such as dust and oils remaining from the preceding steps. During the deposition process, these impurities could evaporate inside the vacuum chamber and compromise the adhesion of the coatings to the substrate.
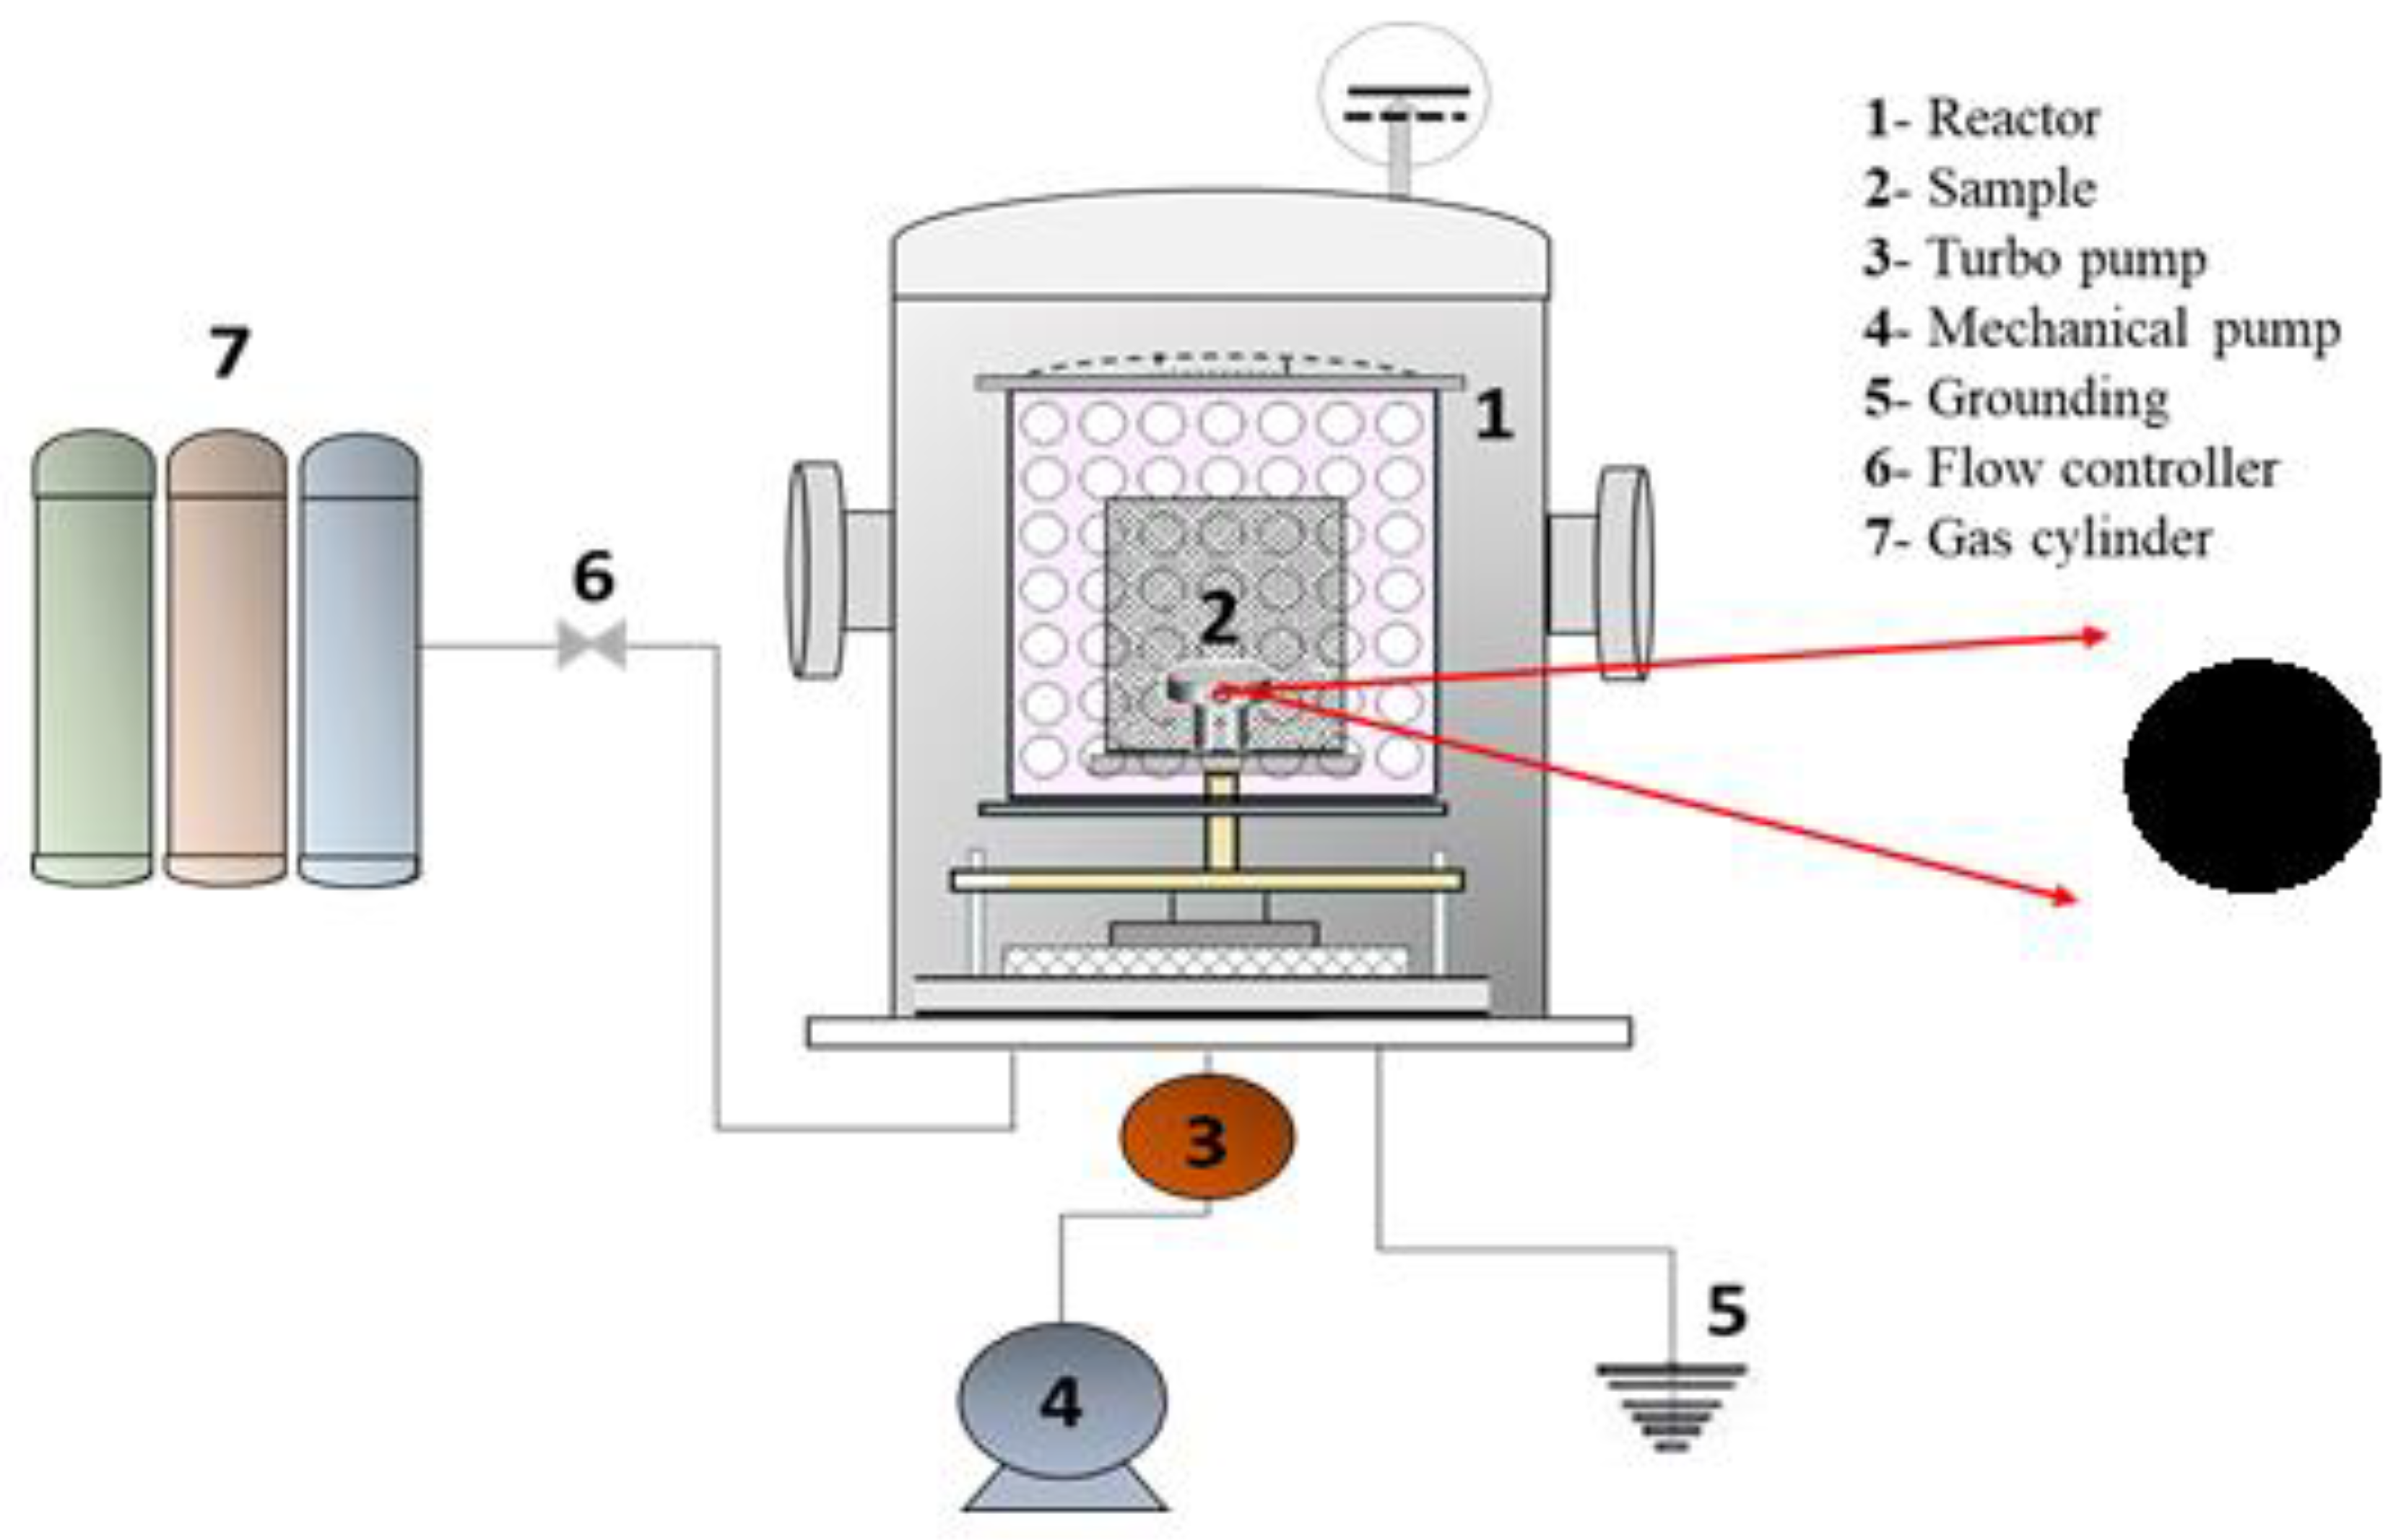
Figure 1 shows the PECVD system (a homemade reactor) used to prepare the DLC coatings, consisting of a cylindrical chamber made of stainless steel, fitted with a cathode fed by a pulsed or continuous discharge source. A homemade capacitive DC power supply was connected to the sample holder and the bias voltage (Vb) was adjusted by controlling the power level and the pulse. Selection of the correct power supply pulse width was crucial for generating the species and for reducing the free ions pathway whereby the ions collided with the substrate. The vacuum system comprised a turbo pump (Pfeiffer Hipace 300 CF-F – Turbo pump) and an auxiliary mechanical pump (Edwards E2M18) coupled to a homemade deposition chamber, enabling attainment of pressures as low as 0.0013 Pa. Electronic controllers (Cole-palmer mass flow controllers), calibrated for each gas, were used to regulate the flow of the injected gases. Before deposition, the samples were cleaned for 30 min using an argon plasma, with Vb of -500 V, flow rate of 12.0 sccm, and working pressure of 0.39 Pa. Silicon samples was used as a film interface to anchor the DLC on the surface of the metallic substrate. The silicon precursor was silane gas (SiH
4) (WhiteMartins). The amorphous silicon formed in this step provided bonding interaction with the metal and the carbon. The SiH
4 was injected for 15 min, at Vb of -700 V, flow rate of 5.0 sccm, and pressure between 1.33 and 2.66 Pa. Acetylene gas (C
2H
2) (WhiteMartins) was used as the carbon precursor for the DLC coatings produced during 120 min at Vb of -700 V, flow rate of 15.0 sccm, and pressure between 0.66 and 0.93 Pa.
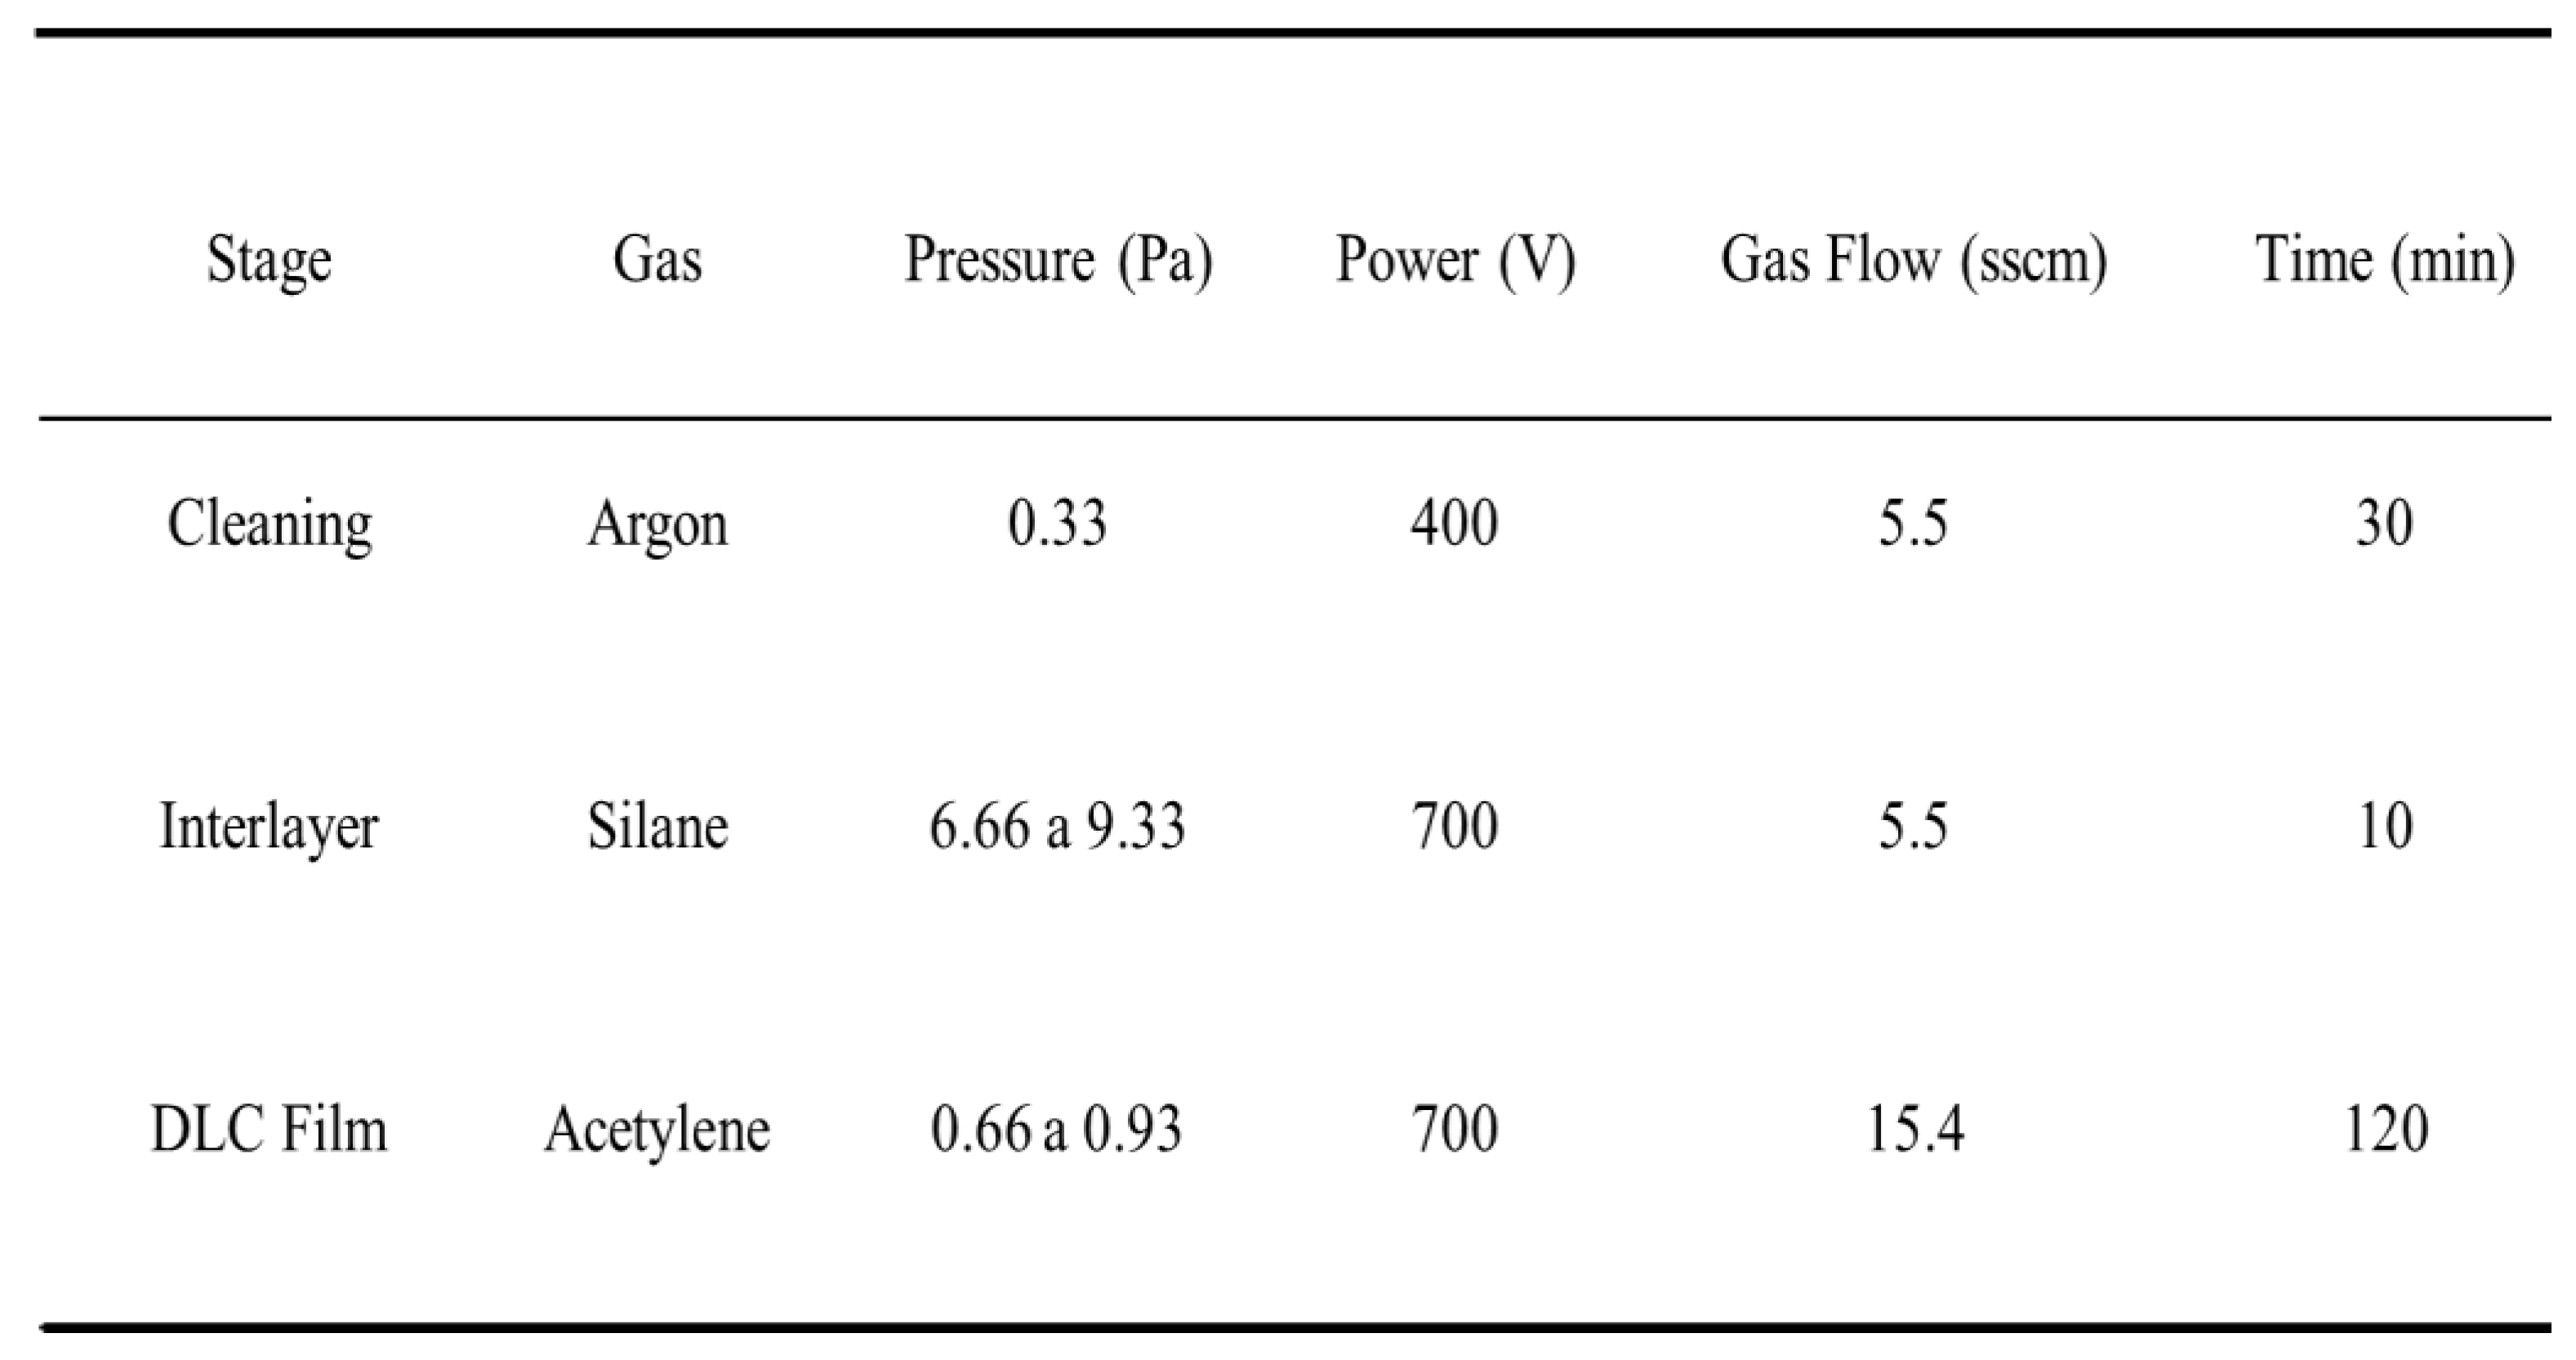
Table 2 shows the setup for production of the DLC coatings in a deposition process consisting of the three stages of plasma cleaning, interlayer deposition, and DLC coating deposition, with specific conditions used for each stage.
2.2. Characterization of the DLC coatings
2.2.1. Raman spectroscopy
Spectra were acquired using a (Renishaw 2000 micro-Raman system) equipped with an argon ion laser (λ = 514.5 nm), operating in backscattering geometry, as a nondestructive characterization technique. The laser power used was 0.6 mW and the laser beam diameter was 1.0 μm. The Raman signal was calibrated using the diamond peak at 1332 cm
-1 [
12]. The measurements were performed at room temperature (21 °C) [
12].
2.2.2. Optical profiling
This characterization technique was used to analyze the surface roughness, thickness of the DLC coating, and pore depth. The thickness was measured by the height of the step between the substrate and the DLC coating [
12,
16]. These analyses employed a Veeco NT9100 instrument fitted with a set of optical interferometry lenses and operating in phase-shifting interferometry (PSI) mode.
2.2.3. X-ray photoelectron spectroscopy (XPS)
XPS is one of the most common spectroscopy techniques used for the chemical analysis of coating components. Analysis of the DLC coatings considered the hybridized sp
2/sp
3 carbon content obtained by deconvolution over the total area of the peak corresponding to C 1s [
17]. For XPS analysis, after the initial vacuum step, the samples were subjected to an argon atmosphere to remove oxides present on the surface. The analyses employed a (Thermo Scientific K-Alpha) spectrometer operating with base pressure below 1.0x10
-4 Pa. The Al Kα line (hν = 1486.6 eV) was used as the ionization source and the analyzer pass energy was adjusted to 200 and 50 eV for survey and scan spectra, respectively.
2.2.4. Tribological analysis
Tribological analysis of the DLC coatings employed a (Bruker UMT 2( tribometer. Determination was made of the friction coefficient, as a measure of the lubrication capacity of the coatings. Scratch tests were used to investigate the adhesion of the coatings on the metallic substrates, while tribocorrosion tests were performed to analyze the corrosion susceptibility of the coatings.
For friction analysis, the tribological pairs employed were SS316L/SS316L and Ti6Al4V/Ti6Al4V plates and spheres. The tests were performed using a frequency of 1.0 Hz, time of 1000 s, and normal force of 5 N, with a reciprocating linear movement and track distance of 10 mm. Each sample was analyzed after 500 passes at 1 Hz.
The scratch testing was performed using a diamond tip (Rockwell C), with progressive normal load from 0 to 20 N and velocity of 0.1 mm/s over 10 mm. After the end of the experiment, analysis was made of the critical load (LC1), which was used to identify the exact time that the coating was broken (without exposing the substrate).
For the tribocorrosion analysis, the sample was attached to a support and immersed in Ringer’s lactate solution with composition (
Table 3) approximating that of extracellular fluids. The analysis was performed at 36 °C to simulate body fluid temperature.
The tribocorrosion tests were performed according to ASTM standard G119 [
18], as described in an earlier work [
12]. A ceramic alumina sphere (ϕ = 4.76 mm) was used for the friction tests, with normal force of 1.5 N, frequency of 2.5 Hz, amplitude of 2 mm, and sliding time of 1200 s, corresponding to 3000 cycles. The counter bodies used were SS316L steel and Ti6Al4V alloy, with and without DLC coatings.
The open circuit potential (OCP) was measured for 20 min in static mode, 20 min in reciprocating sliding mode, and another 20 min after the friction test to check for recovery of the equilibrium potential. The corrosion potential is the potential at which corrosion starts to occur, enabling measurement of how susceptible a material is to corrosion [
19].
2.2.5. Hardness tests
Hardness tests were performed using a triboindenter (Hysitron Ti950) with a standard nanoindentation head. A Berkovich tip indenter with maximum load of 10 mN was applied at 8 points of each sample, with a 15 μm distance between indentations, obtaining the average value. The analyses were based on the method of Oliver and Pharr [
20]. The depth of tip penetration was approximately 10% of the coating thickness, so the influence of the substrate could be neglected in determination of the coating hardness and elasticity modulus [
20].
2.3. Biological tests using L-929 mouse fibroblasts
2.3.1. Cell proliferation clonogenic assays using crystal violet dye
Crystal violet (hexamethyl pararosaniline chloride) from(Sigma Aldrich), a dye also known as gentian violet or methyl violet, can be absorbed by cells in culture. This basic dye stains the nucleus of the cells, so the rate of cell growth is reflected by the colorimetric determination of stained cells [
21,
22].
After the exposure time in culture plates, the culture medium was removed from the wells. The wells were then washed once with phosphate-buffered saline (PBS) from(Sigma Aldrich),, at 37 °C, to remove detached post-death cells, followed by incubation with 100 μL of violet crystal solution for 3 min at room temperature. After the incubation period, the plates were washed with tap water to remove excess dye and the cells that remained attached were incubated with 200 μL of sodium dodecyl sulfate (SDS) elution solution, for 1 h, in the absence of light. At the end of the incubation period, cell proliferation was determined by measuring the absorbance at a wavelength (λ) of 570 nm, using a Packard SpectraCount spectrophotometer.
2.3.2. Mitochondrial activity (MTT test)
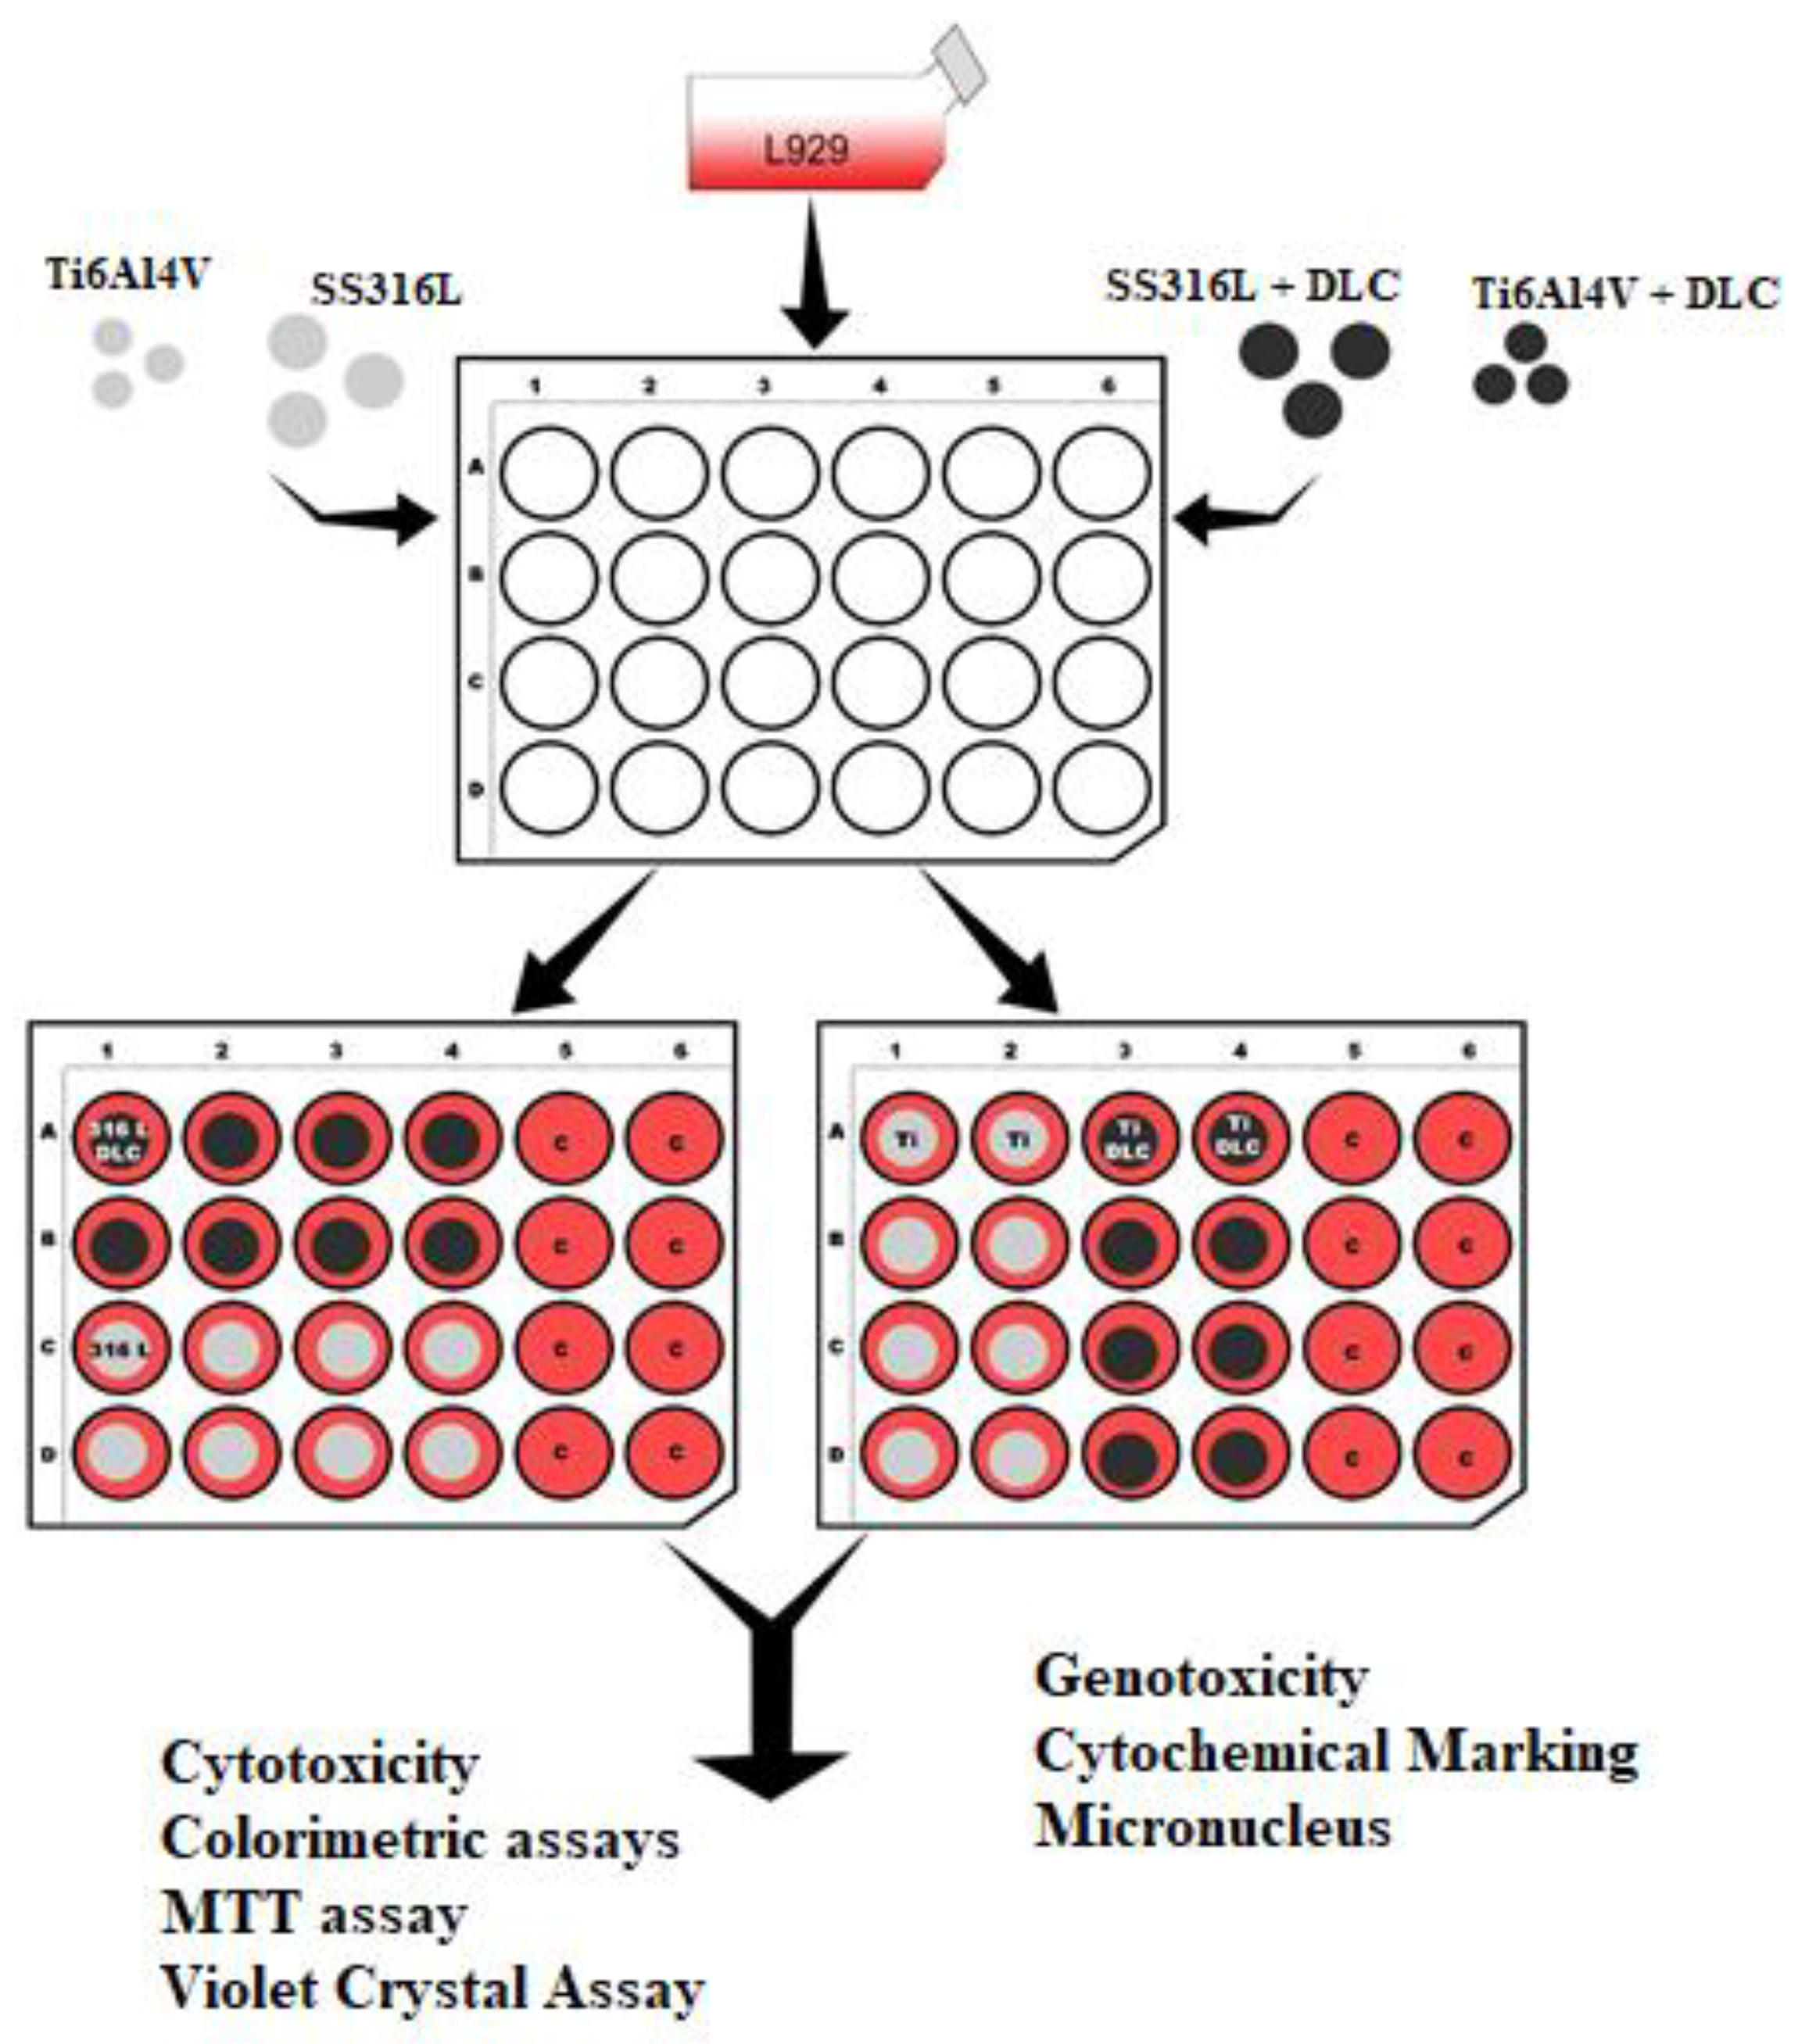
Figure 2 shows a schematic illustration of the distribution of the wells for the mitochondrial activity analysis using MTT (3-(4,5-dimethylthiazol-2-yl)-2,5-diphenyltetrazolium bromide) from(Sigma Aldrich). The assay is based on the ability of metabolically active cells to convert MTT, a yellow tetrazolium dye, into purple formazan crystals by reducing the dye with mitochondrial enzymes. The amount of formazan produced is proportional to the number of viable cells and reflects the activity of mitochondrial enzymes [
23].
The MTT solution was prepared at a concentration of 5 mg/mL in PBS, in a sterile atmosphere. For this procedure, 24-well plates were used, which were previously washed with 100 μL of phosphate-buffered saline (PBS) at pH 7.4. After washing, a 150 μL volume of MTT (Sigma) solution, at a concentration of 5 mg/mL, was added to each well. The plates containing cells and MTT solution were placed in a humidified oven, at 37 ± 0.5 °C, under an atmosphere of 5% CO2. After 2 h of incubation, dimethyl sulfoxide (DMSO) solution was used to solubilize the crystals formed in the metabolization. The plates were homogenized for 3 min on a shaker, followed by measurement of the absorbance at λ = 570 nm, using a (Packard SpectraCount spectrophotometer).
2.3.3. Morphology and surface adhesion of L-929 mouse fibroblast cells
The morphology and surface adhesion of L-929 mouse fibroblast cells on Ti6Al4V or SS306L, with and without DLC coatings, were analyzed by scanning electron microscopy (SEM). The L-929 mouse fibroblast cells were provided by the Rio de Janeiro Cell Line Bank (CR019). The cells were maintained as sub-confluent monolayers in minimum essential medium with 1.5 mM l-glutamine, adjusted to contain 85% of 2.2 g/L sodium bicarbonate and 10% fetal bovine serum (Gibco), 100 units/mL of penicillin-streptomycin (Sigma), and 25 g/mL of l-ascorbic acid (Sigma). Incubation was performed at 37 °C, under an atmosphere of 5% CO2.
In order to analyze the surface and adhesion morphology of the cells on Ti6Al4V or SS306L, with or without DLC coatings, the cell culture (5×10⁵ cells/mL) was seeded on the samples and incubated for 24 h, at 37 °C, under a 5% CO2 atmosphere. After this, the medium was removed and the samples were fixed with a 3% glutaraldehyde (0.1 M) sodium cacodylate buffer for 2 h, followed by dehydration using a gradient of acetone solutions (50, 70, 90, and 100%, each for 10 min). The drying stage used a 1:1 solution of ethanol with hexamethyldisilazane (HMDS), with final drying of the samples using pure HMDS at room temperature. After the deposition of a thin gold layer, the spreading of the cells on the samples was examined by SEM, using a Zeiss EVO MA10 instrument.
2.3.4. Chromosomal damage assessment by micronucleus assay
The protocol adopted in the micronucleus assay was previously described and tested by Tian and Carvalho [
24,
25]. The L929 cells were plated after treatment for 24 h. The samples were treated with 200 μL of 3 μg/mL cytochalasin B (Invitrogen, Thermo Fisher Scientific, Waltham, MA, USA) to prevent cytokinesis and facilitate observation of micronuclei. The cells were then washed twice with PBS and fixed using 4% paraformaldehyde in phosphate buffer for 10 h at room temperature. The cells were washed again with PBS and incubated with 200 μL of DAPI (4’,6-diamino-2-phenylindole) (Sigma-Aldrich, St. Louis, MO, USA) in 300 nM phosphate buffer for 10 min at room temperature. The micronucleus experiments were performed in triplicate. A group treated with 6 μM ethyl methanesulfonate (EMS) (Invitrogen, Thermo Fisher Scientific, Waltham, MA, USA), a genotoxic agent, was included in this assay as a control for the formation of micronuclei [
26,
27].
The numbers of micronuclei in the cells were counted using a Leica DMIL fluorescence microscope coupled to a Leica DFC310FX camera, operated with Leica Application Suite v3 software. The images were acquired in 10 different fields of each well, totaling 30 fields per experimental group. Determination was made of the frequency of micronuclei per 100 cells in the different groups after 24 and 48 h (n = 8). The analyses included a double-blind test to confirm the numbers of micronuclei in the images. The criteria used to identify micronuclei were those defined previously by Fenech and Nersesyan [
28,
29]. The collected data were submitted to statistical analysis.
3. Results and discussion
3.1. DLC chemical structure: Raman and XPS analyses
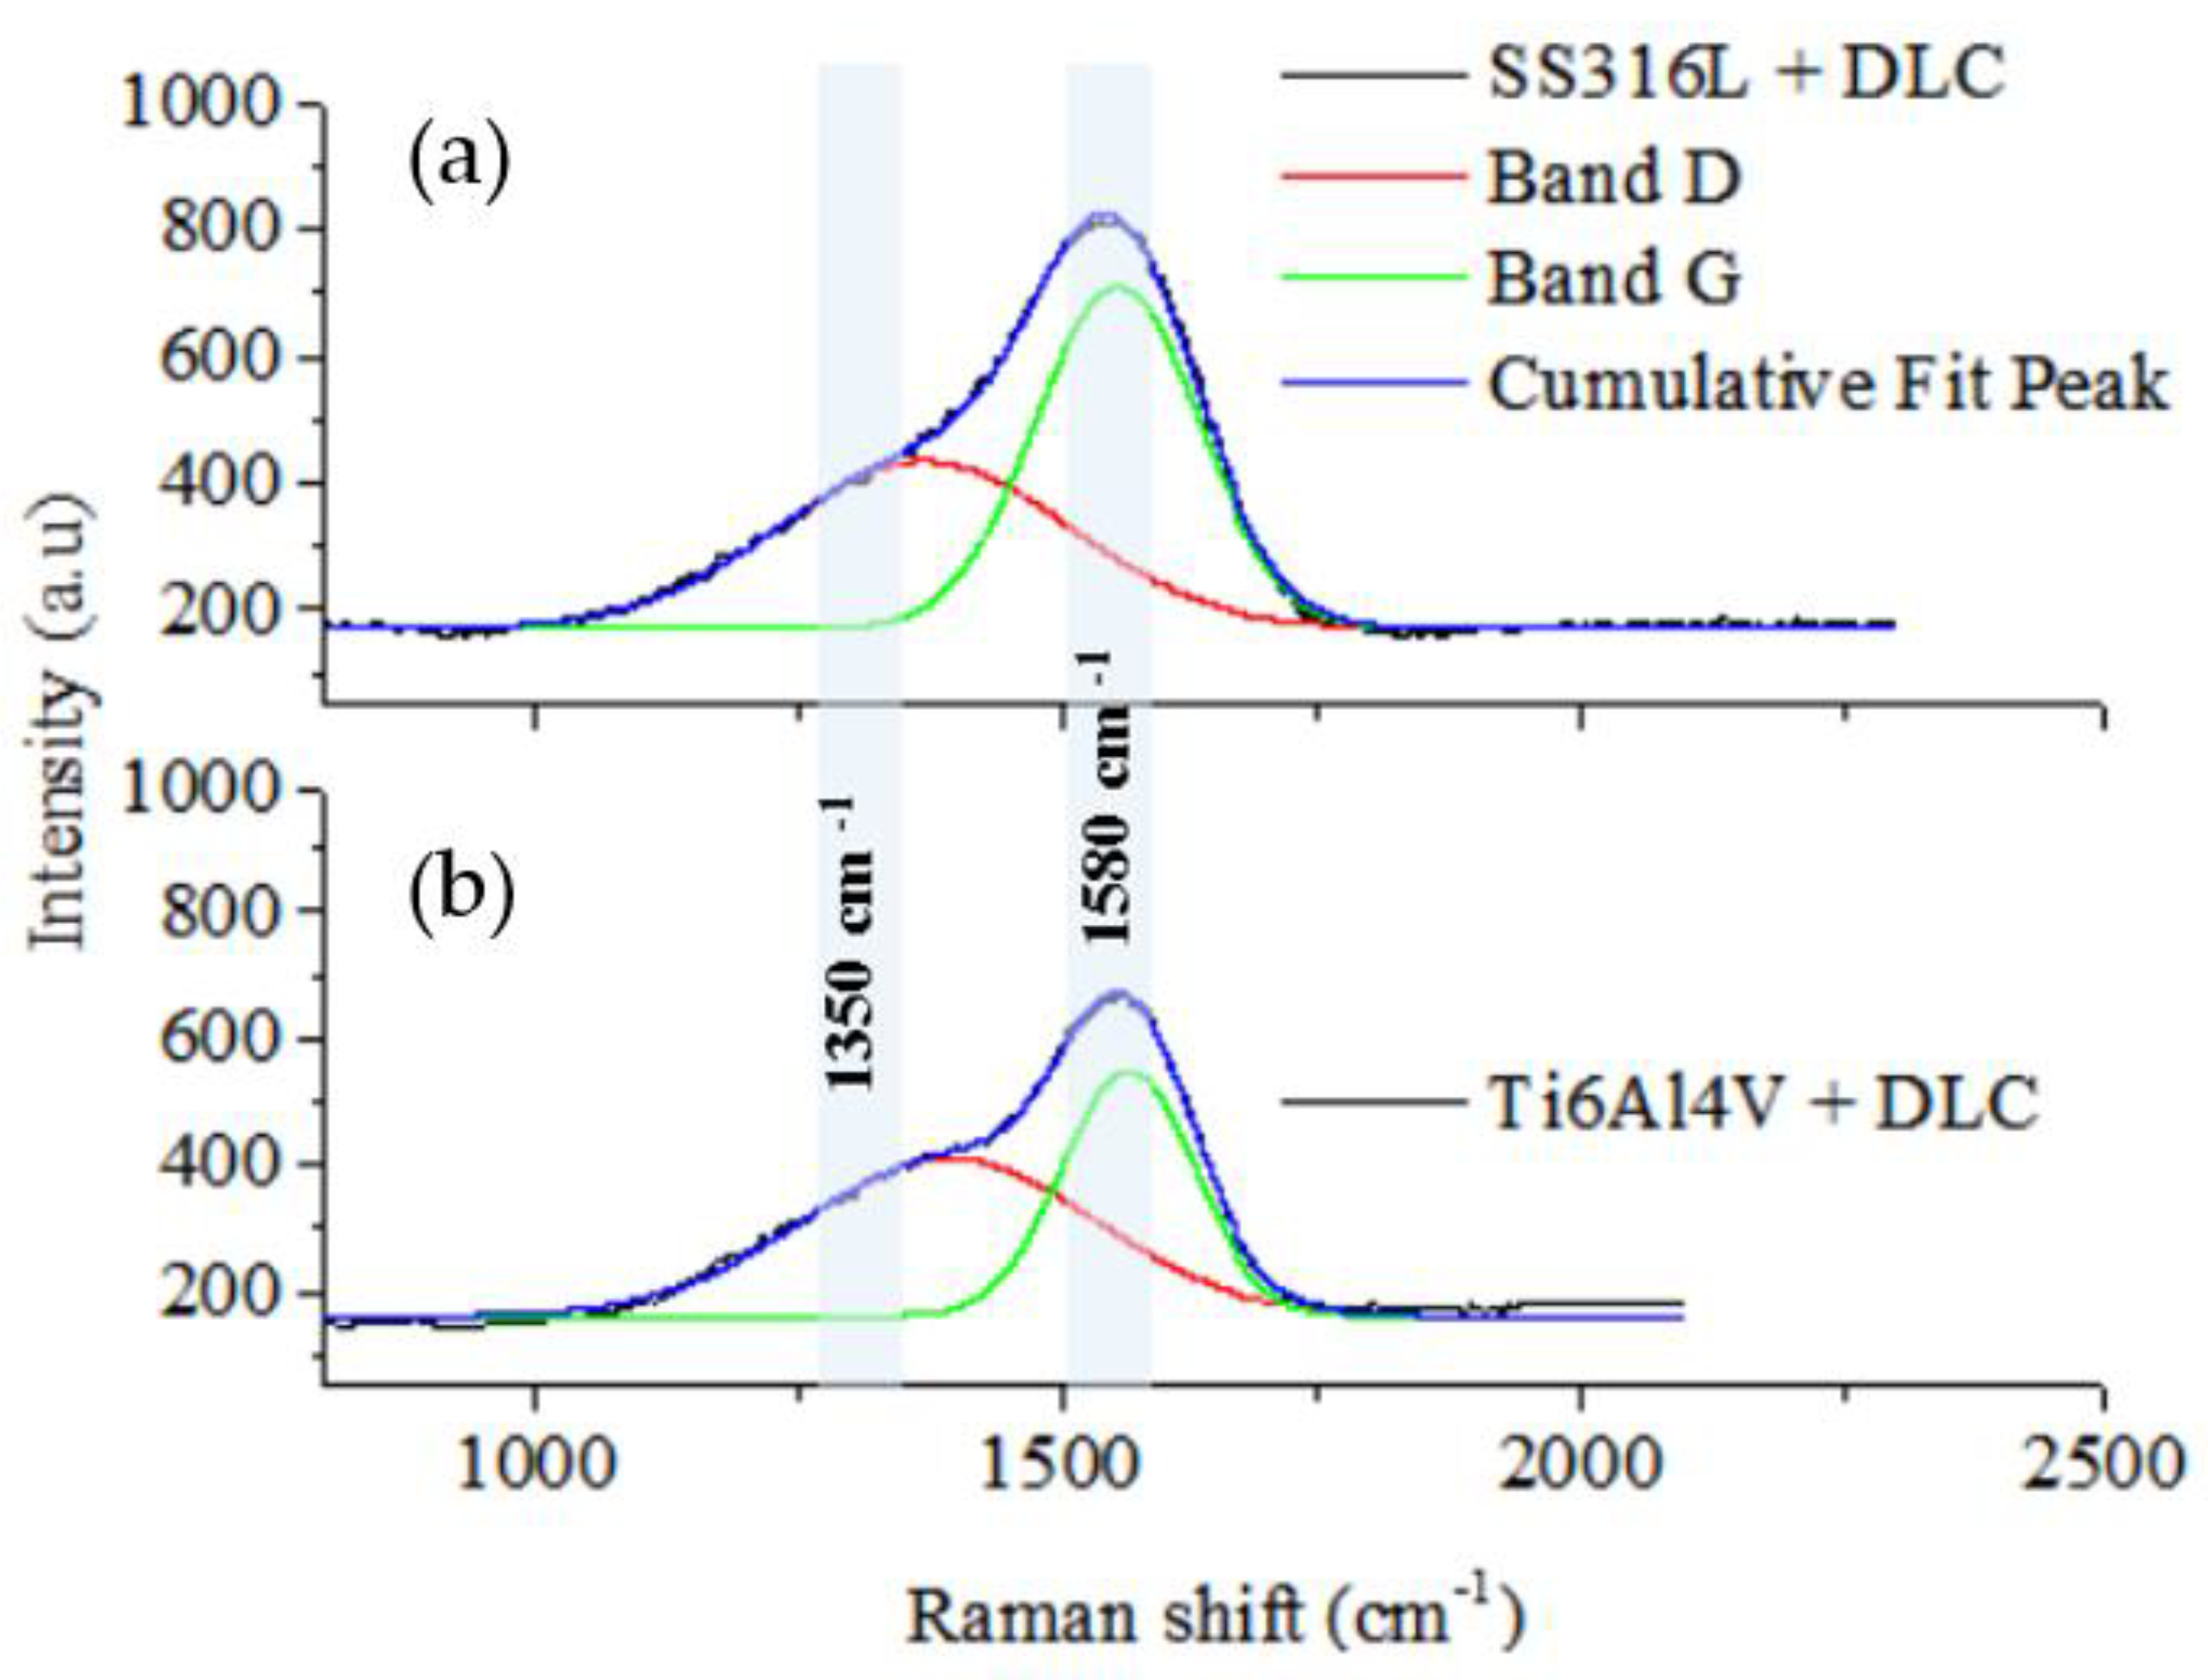
Figure 3 shows the Raman spectra of the DLC coatings deposited on the SS316L and Ti6Al4V substrates. The original D and G bands were fitted by the red and green lines, respectively, with the 1350 and 1580 cm
-1 positions corresponding to the original D and G band centers. The spectra for the DLC coatings were obtained with laser excitation at 514.5 nm. The spectra indicated the predominance of the G band, shown by the peak centered at 1580 cm
-1, together with a small shoulder centered at 1350 cm
-1, related to the D band. The green and red lines in the spectrum are the deconvolutions of the bands used to determine the I
D/I
G ratio.
The Raman analysis of the DLC coating microstructures indicated that the coatings were formed by micro graphitic rings and open chains, as shown by the I
D/I
G ratios, calculated as described previously by Robertson [
9]. The I
D/I
G ratios were 0.62 and 0.58 for the coatings deposited on SS316L and Ti6Al4V, respectively, using the same deposition parameters for the two substrates. The physical properties of DLC coatings are directly related to the I
D/I
G ratio. The D (disorder) band corresponds to the vibrational modes associated with sp, sp
2, and sp
3 hybridizations. A right shift of the D band is associated with the presence in the coatings of clusters with aromatic carbon rings and carbon bonds in open chains. The G band is due to a tangential elongation of the sp
2 hybridization mode [
30]. A right shift of the G band corresponds to the existence of sp
2 bonds of a mixture of carbon chains with aromatic rings. The intensity of the G band is directly proportional to the content of sp
2 bonds [
31].
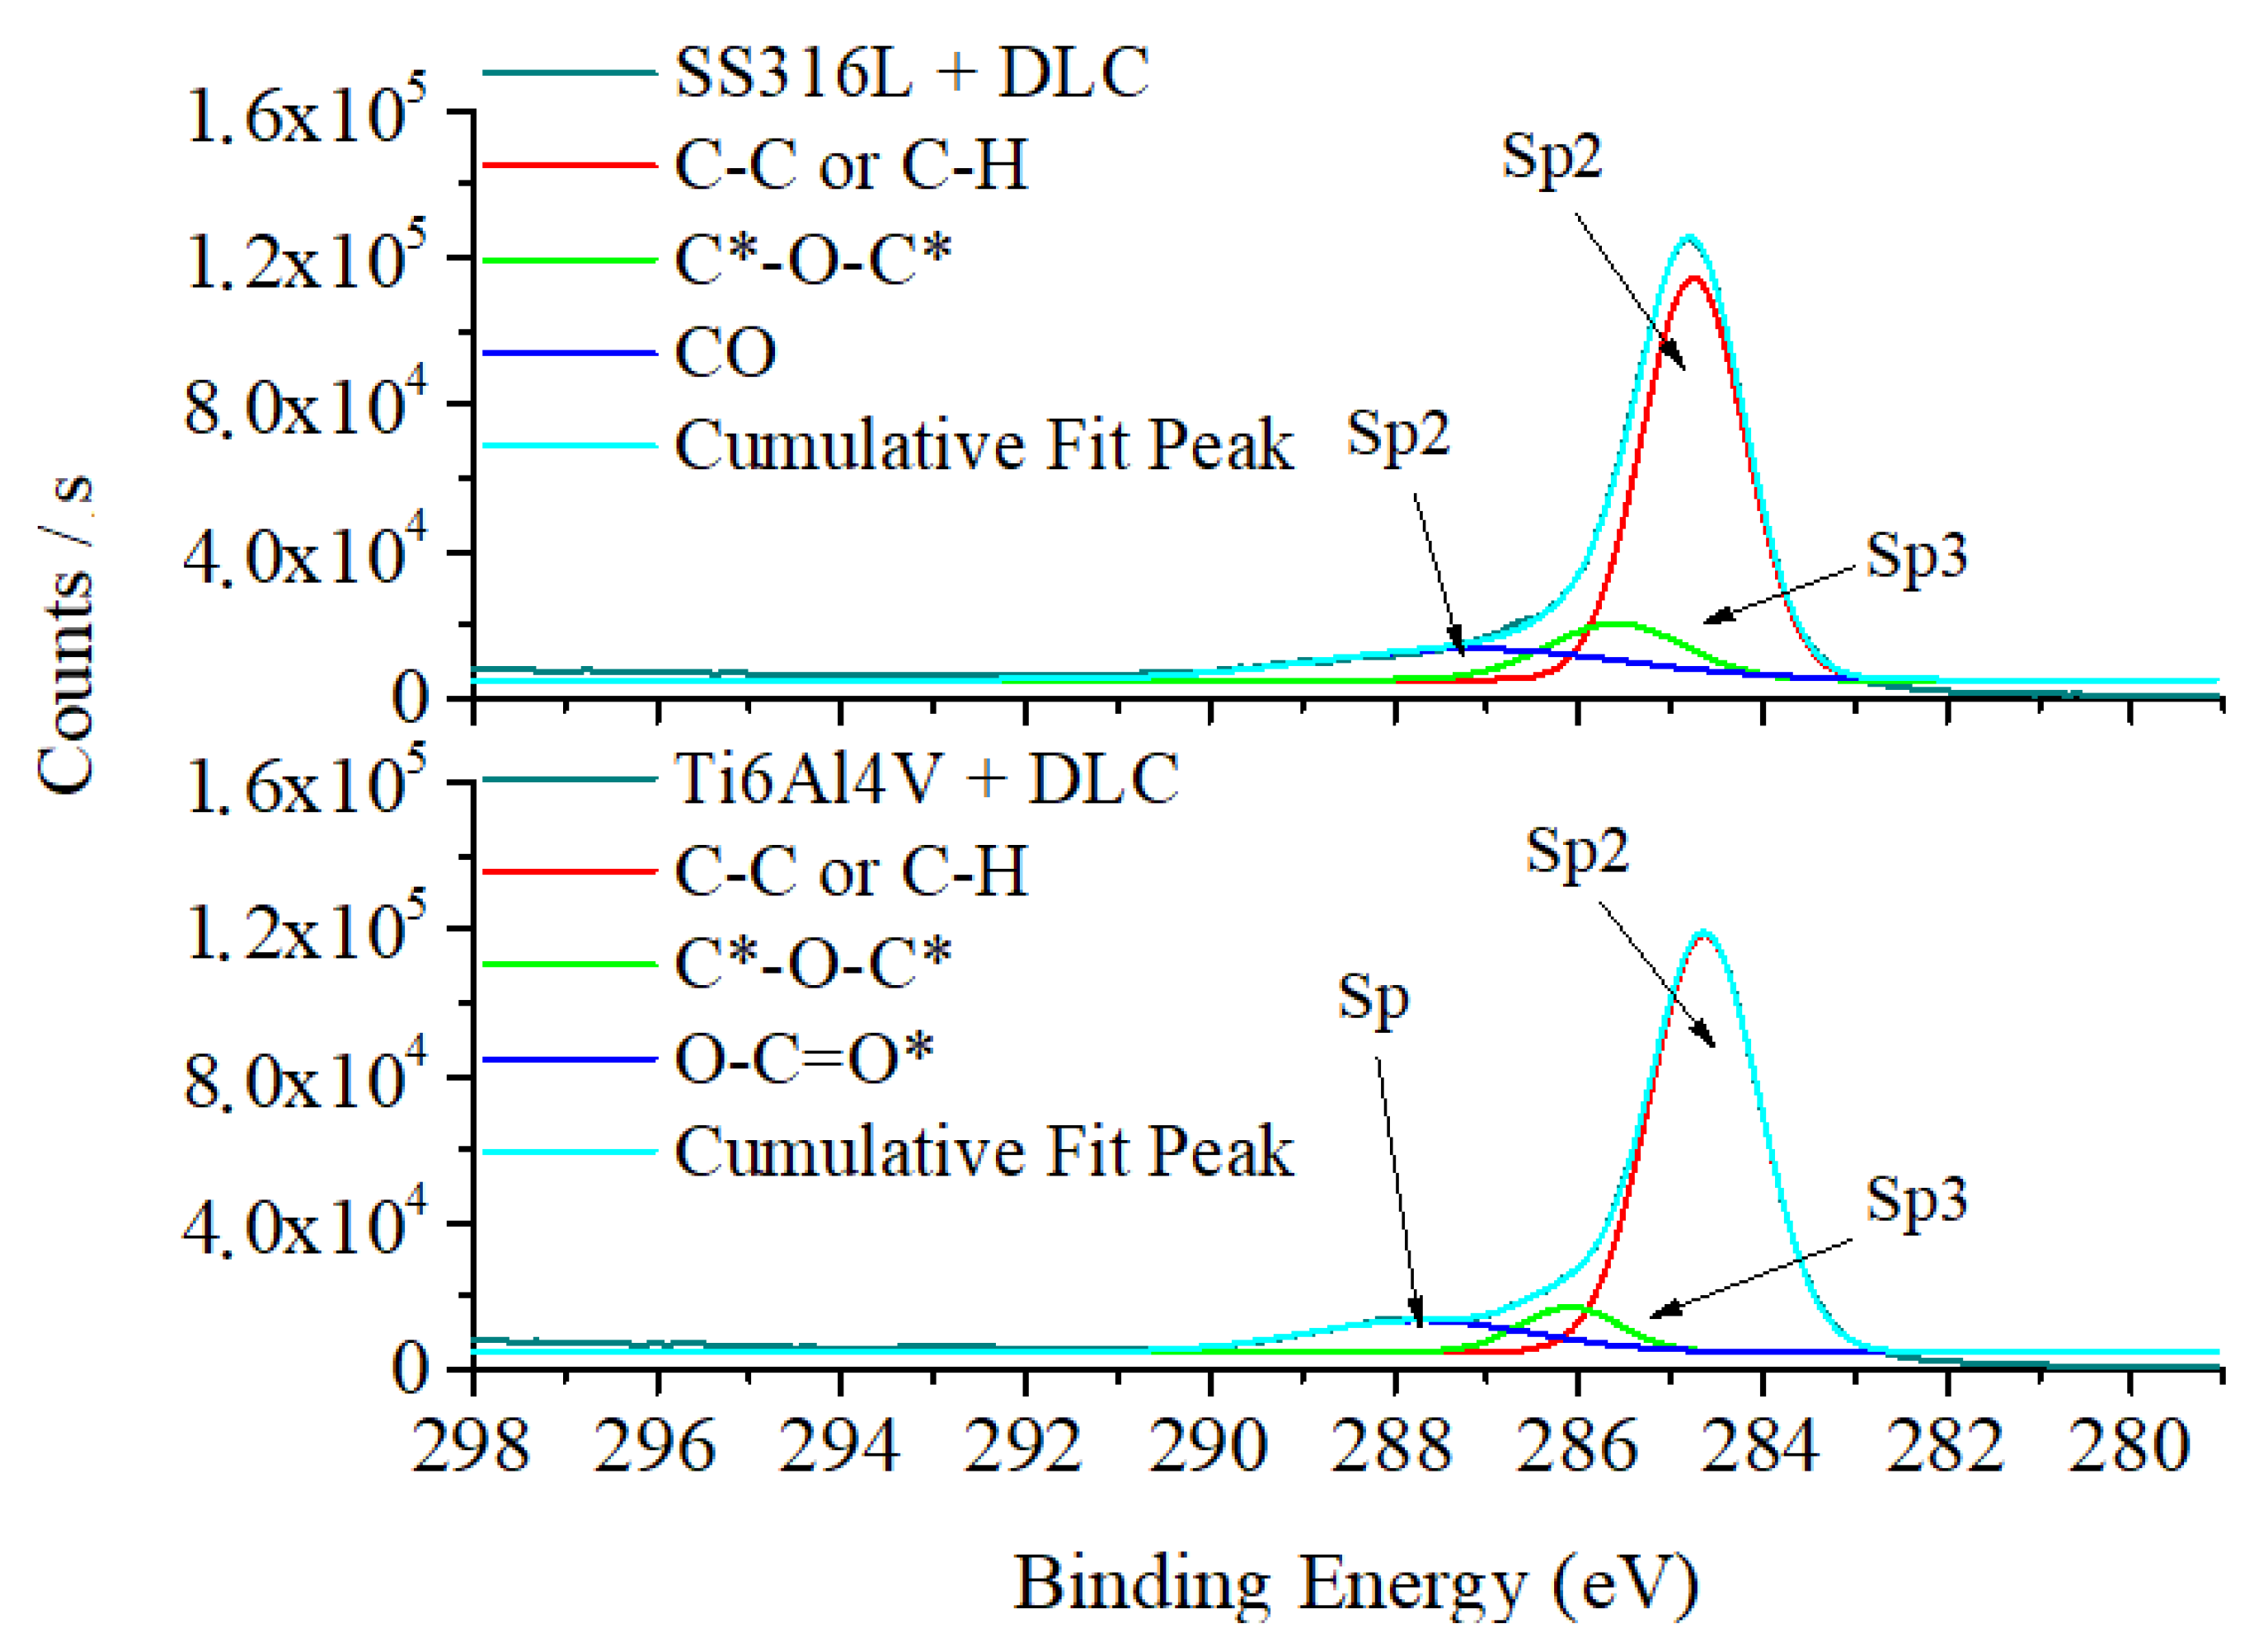
Figure 4 shows the XPS spectra for the DLC coatings. The spectra were dominated by the C 1s bands, providing information on the chemical bonding environment and the components of the DLC. The SS316L spectrum presented three main bands, corresponding to C-C/C-H at 284.8 eV, C=O=C at 285.8 eV, and C-O at 287.4 eV. The Ti6Al4V spectrum showed main bands corresponding to C-C/C-H bonds at 284.6 eV, C-O-C at 285.9 eV, and O=C=O at 287.4 eV. The binding energy values found for the sp
2 and sp
3 components of the C 1s spectra were consistent with the binding energies reported in the literature for the peaks corresponding to graphite and diamond [
32]. The presence of oxygen in the chemical bonds found in the analysis was due to residual air in the vacuum process applied before deposition of the DLC coatings. The presence of oxygen in DLC films could lead to bonds resulting from chemical corrosion during tribocorrosion tests.
3.2. DLC film thickness and roughness measurements
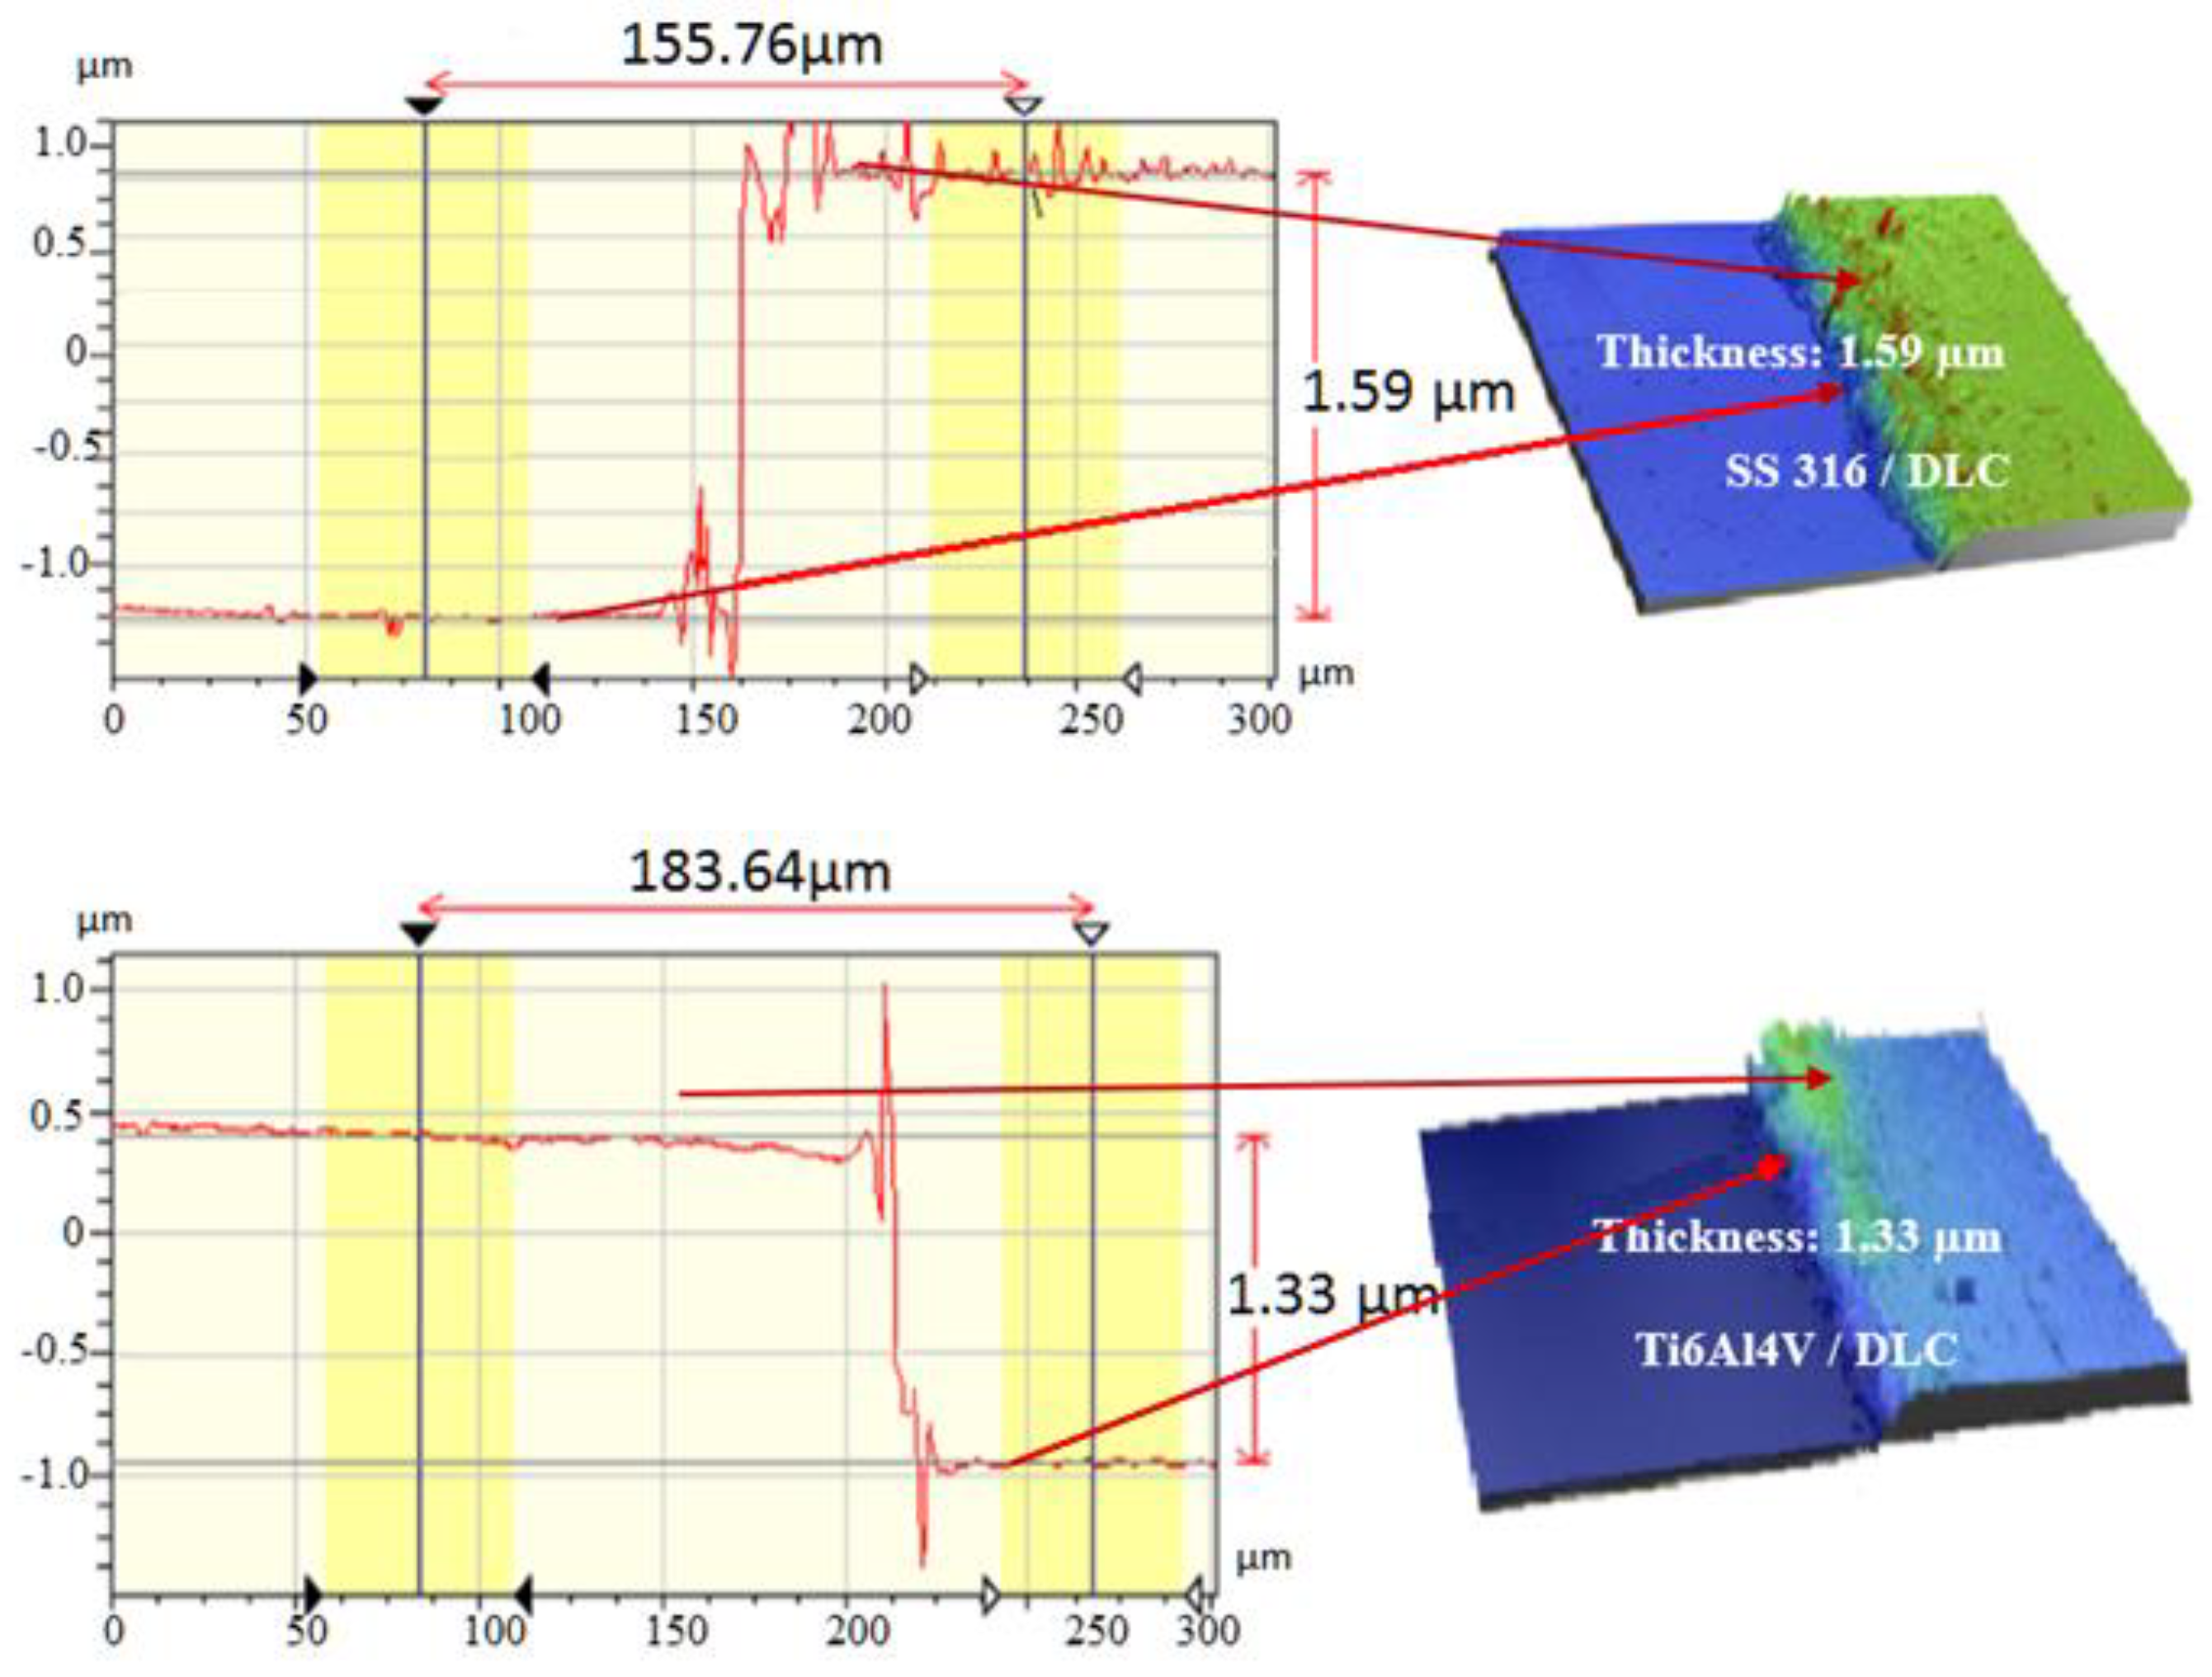
Figure 5 shows the results for the optical profilometry measurements of the thicknesses of the DLC coatings on the SS316L and Ti6Al4V substrates, determined from the step heights in the line profiles shown in
Figure 5. The thickness values were similar, since the deposition parameters employed were the same, with deposition during 120 min at Vb of -700 V. The thicknesses of the DLC coatings deposited on SS316L and Ti6Al4V were 1.59 and 1.33 μm, respectively. The deposition rates were approximately 2-fold higher than those obtained using DLC in a previous study by the same research group [
11]. The growth rates observed here were 0.013 and 0.011 μm/min for the SS316L and Ti6Al4V substrates, respectively. Bradley and co-workers reported the relation between the deposition and the sputtering rate due to ion beam bombardment during the deposition process, which is also common in PVD processes [
33].
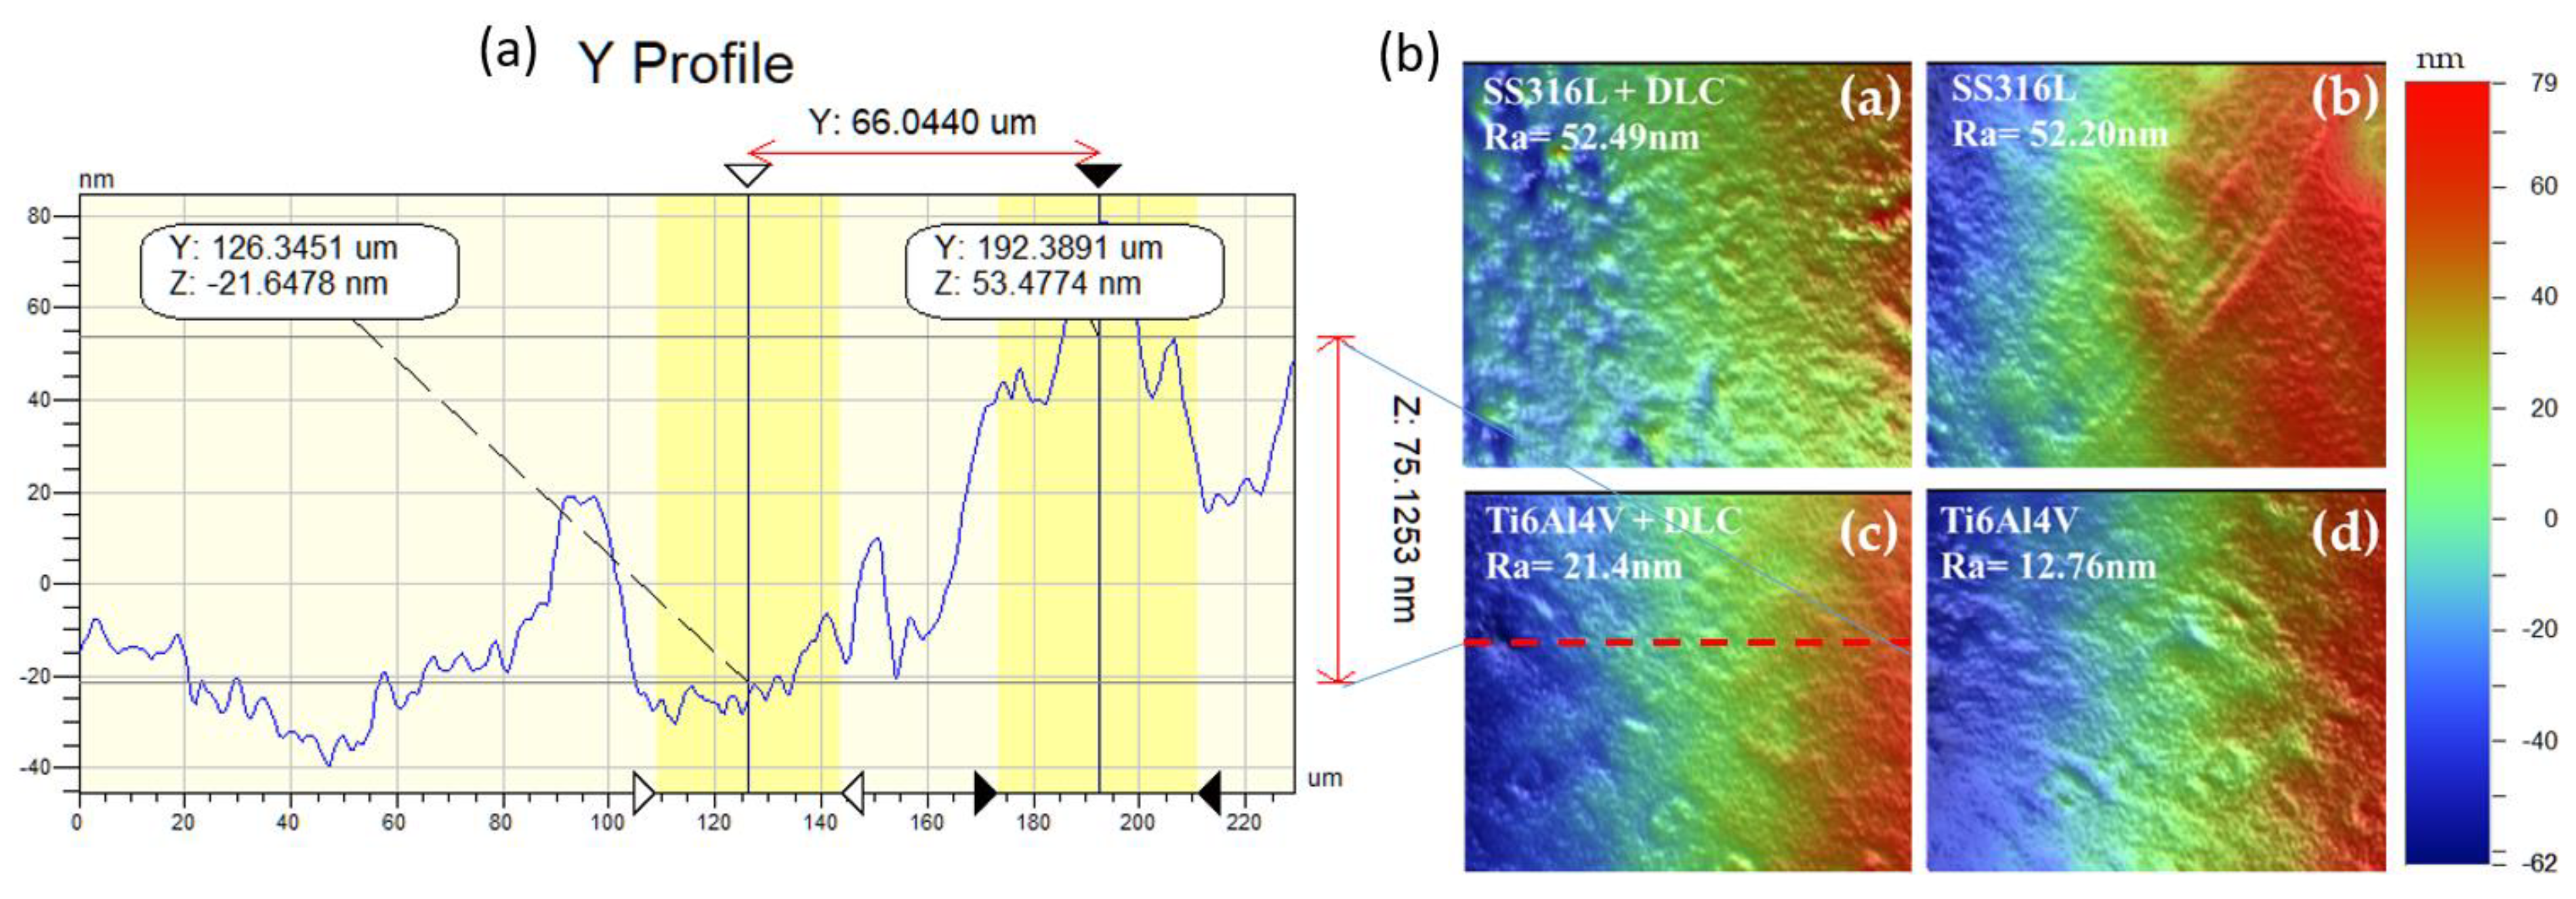
The images in
Figure 6 shows (a) Ti6Al4V+DLC profile. The colors are indicate the peaks and valleys on the surface (the dimensions are shown in the color bar on the left side of the images).
Figure 6(b) shows the surface morphologies of the SS316L and Ti6Al4V substrates with and without DLC coatings. Roughness analyses were performed using areas measuring 301 x 229 μm. For SS316L , the roughness values were 52.49 nm with the DLC coating and 52.20 nm in the absence of the coating. For Ti6Al4V, the corresponding values were 21.4 nm and 12.76 nm respectively. Hence, despite the nanometric scale, the surface roughness was increased by the presence of the DLC coating, in both cases.
3.3. Adherence and hardness of the DLC coatings
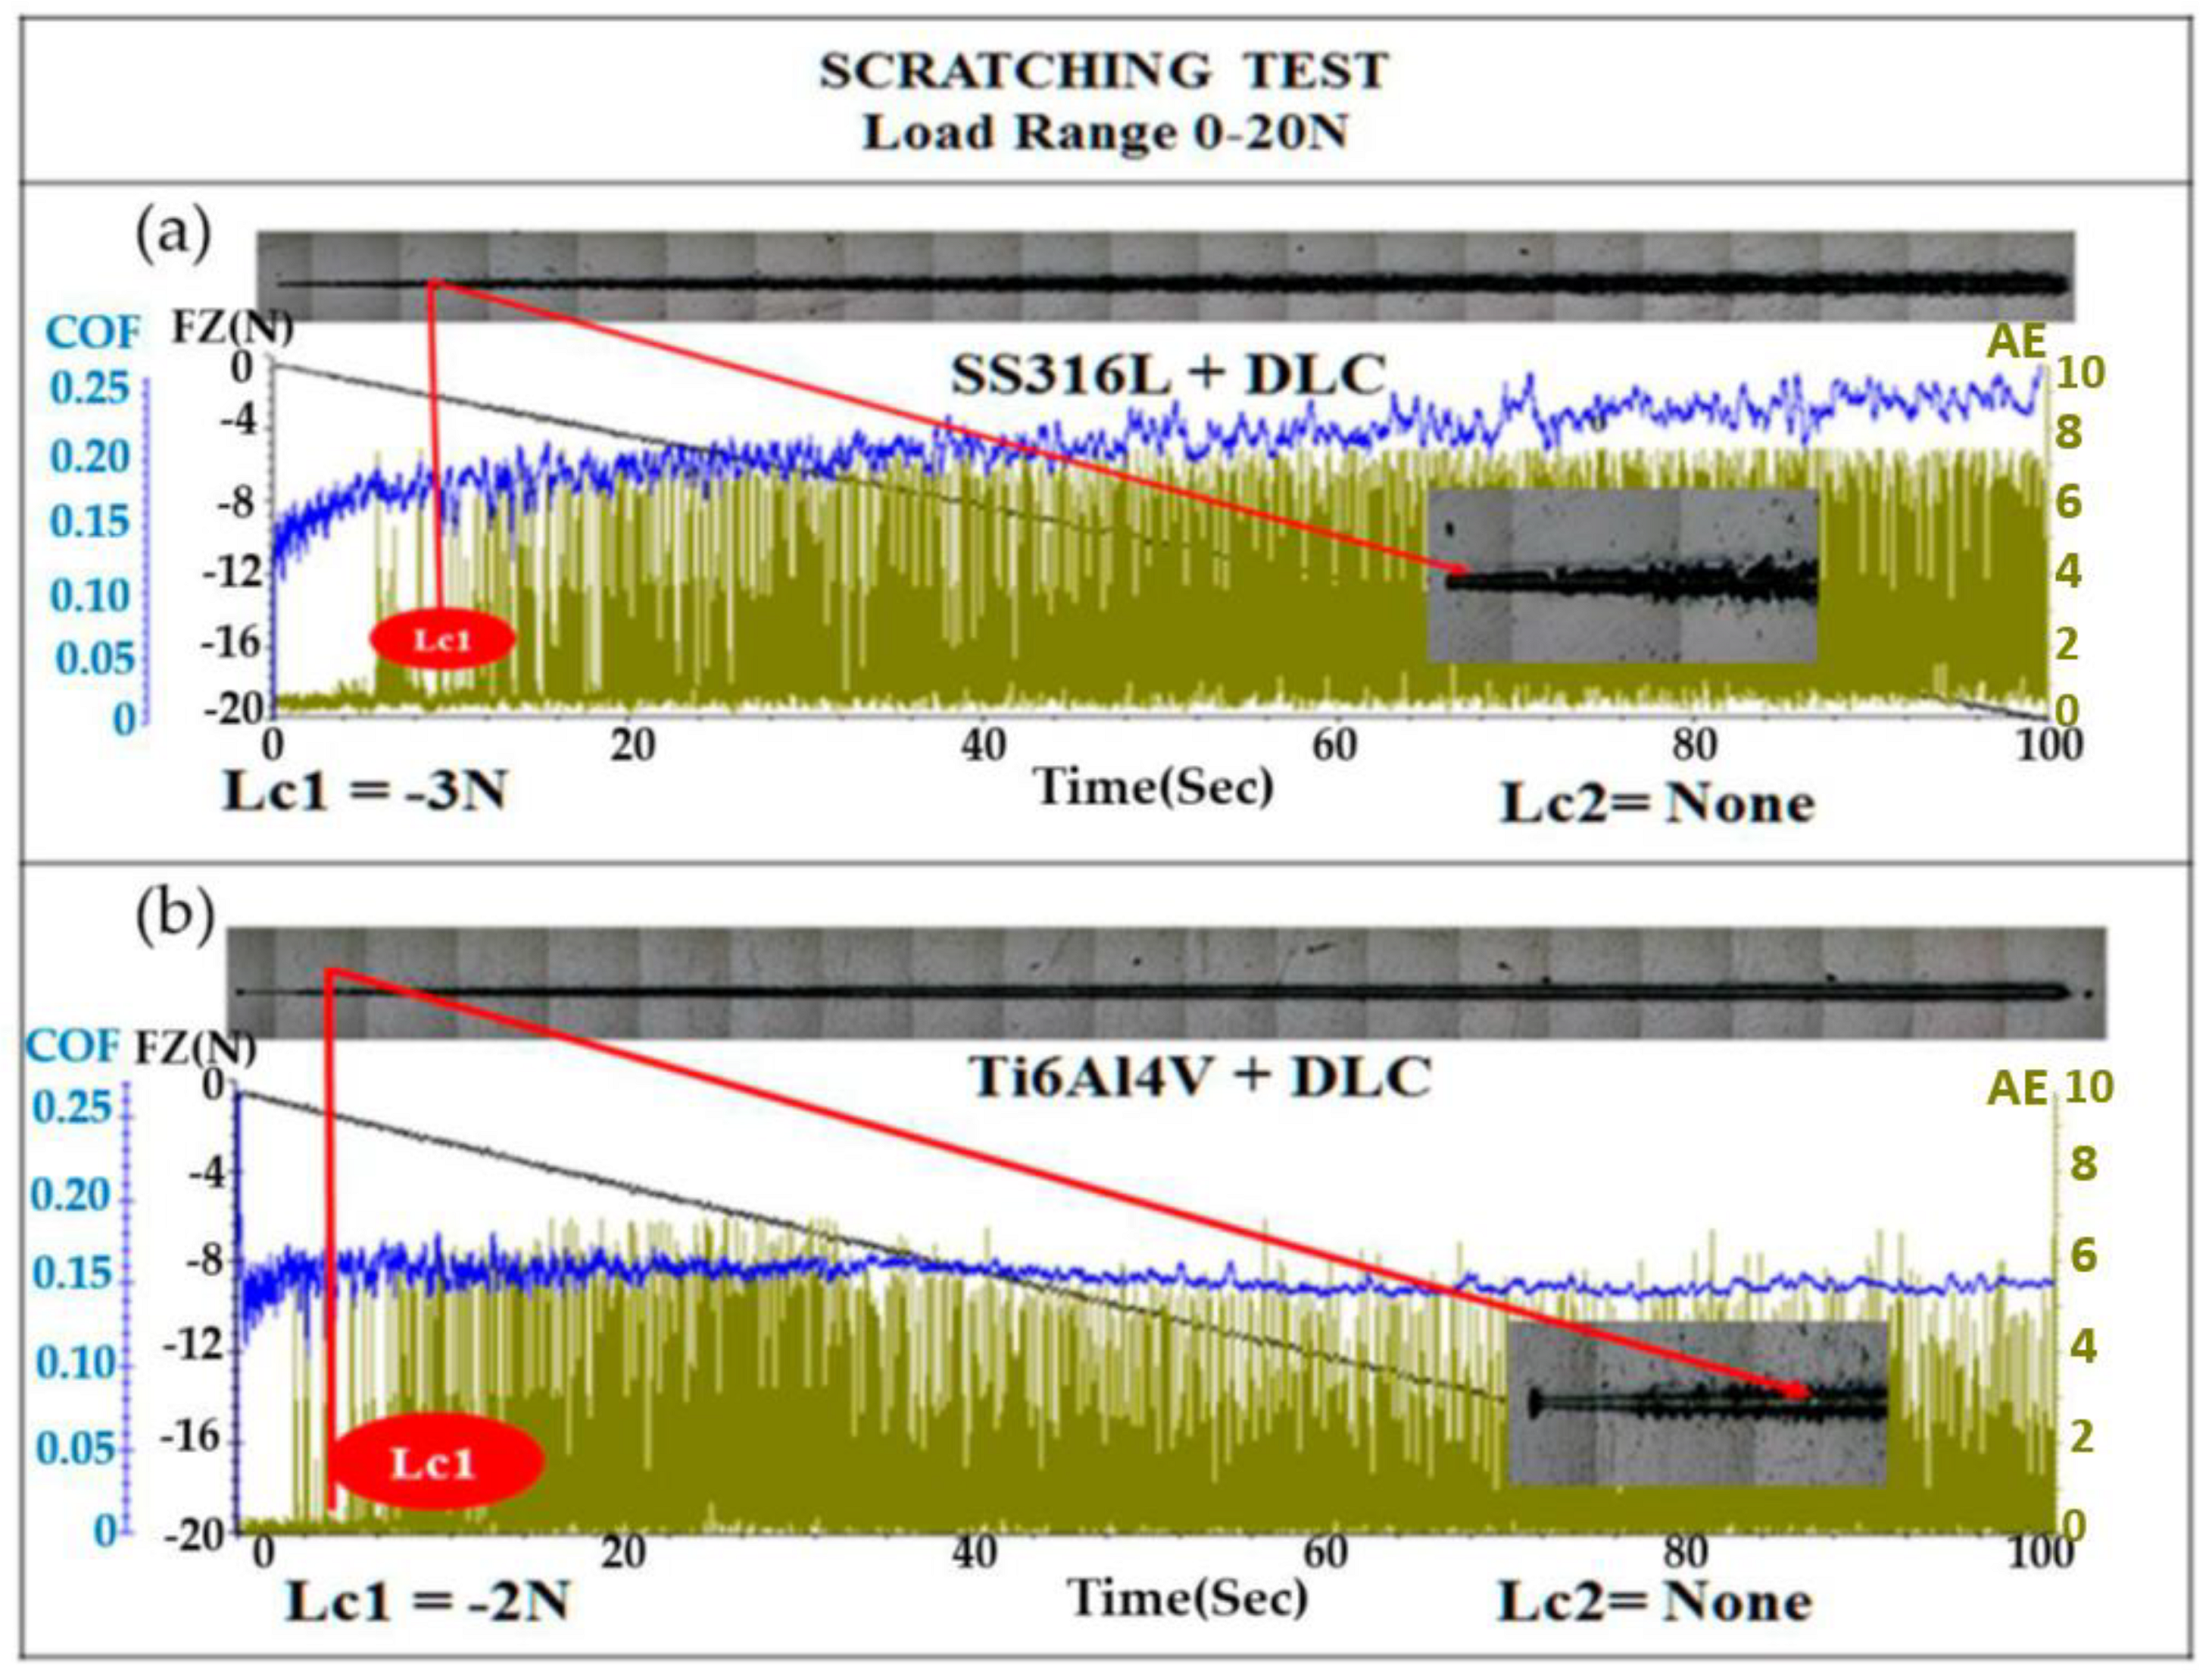
Figure 7 shows the results for adherence, evaluated using the scratch test. The test was performed with a diamond tip, in accordance with ASTM C1624-05 [
34]. An optical microscopy image of the scratch track on the SS316L substrate coated with DLC is shown in
Figure 7(a). The first crack occurred after 8 s, at a critical load (Lc1) of -3 N, indicated by the red line, with the image showing progressive failures in the form of waves in that region. The first critical load (Lc1), which is indicated by the first sign of damage or cracks in the coating, without substrate exposure, was evidenced by the increase of the acoustic emission signal (green line), as well as by failures shown in the optical microscopy image. The second critical load (Lc2) is related to the complete failure of the coating [7-8]. The DLC-coated SS316L sample showed no substrate exposure (Lc2) up to a force of 20 N. In the case of the DLC-coated Ti6Al4V sample, there was also no substrate exposure (Lc2) up to 20 N, although the Lc1 occurred at -2 N.
Hardness testing of the DLC coatings was performed using eight indentations to obtain an average. The diamond tip was penetrated to a depth of only 10% of the thickness of the DLC coatings, in order to avoid any influence of the hardness of the substrate. The literature reports DLC hardness values in the range from 10 to 80 GPa [
9].
Table 4 shows the hardness values obtained from an average of eight measurements on the surfaces of the SS316L andTi6Al4V samples with and without DLC coatings. It can be seen that the hardness values were considerably higher for the coatings, compared to the substrates. These hardness values might suggest that the DLC film could scratch the counter body. However, this was unlikely, considering the low friction coefficients obtained for the DLC coatings (
Figure 8).
3.4. Friction tests
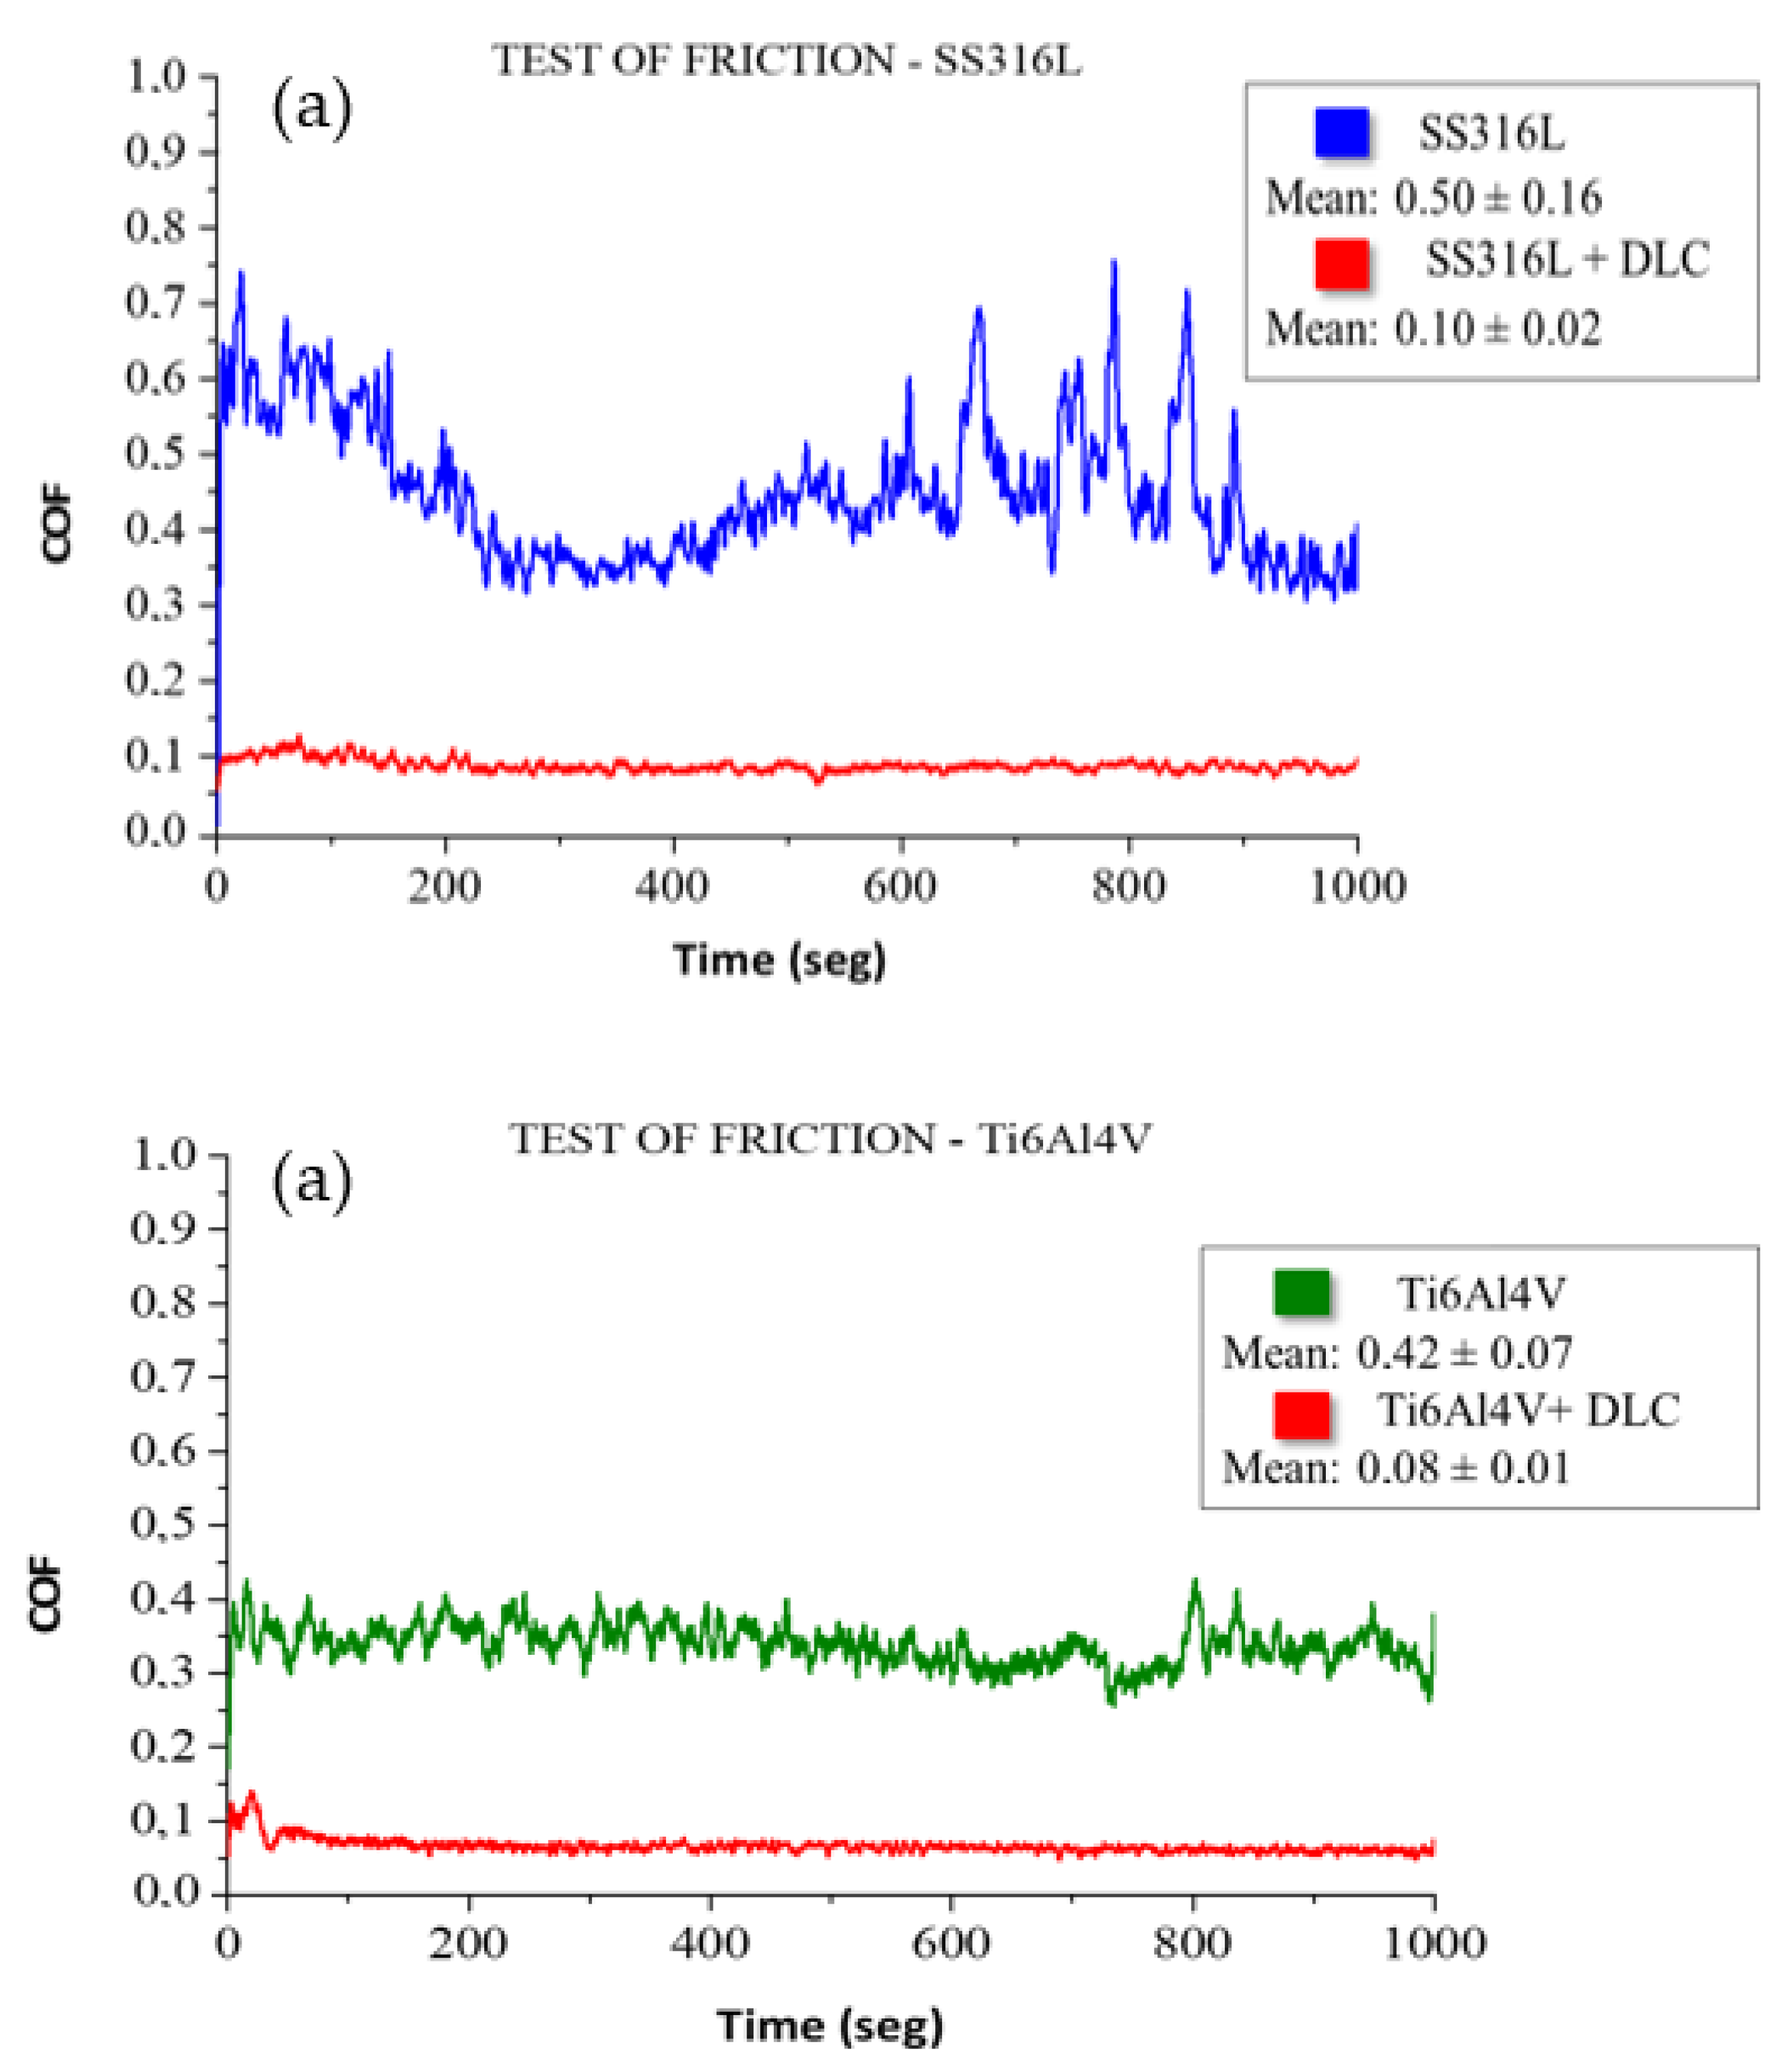
Figure 8 shows the friction coefficient results obtained in an air environment, using the tribological pairs consisting of a sphere and the substrate plates with and without DLC coatings. The friction coefficient measured for SS316L without the DLC coating was 0.50 ± 0.16, while the value for the corresponding coating was 0.10 ± 0.01, representing a reduction of 81%. The friction coefficient obtained for the Ti6Al4V substrate was 0.42±0.07, while a value of 0.08±0.01 was obtained for the corresponding DLC coating, representing a reduction of 80%. The lower friction coefficients measured for the DLC coatings demonstrated the excellent lubrication properties of DLC, making this material highly suitable for reducing friction [
35]. Furthermore, in addition to conferring a low friction coefficient, the use of DLC coatings can increase the shelf life of metallic implants.
3.5. Tribocorrosion
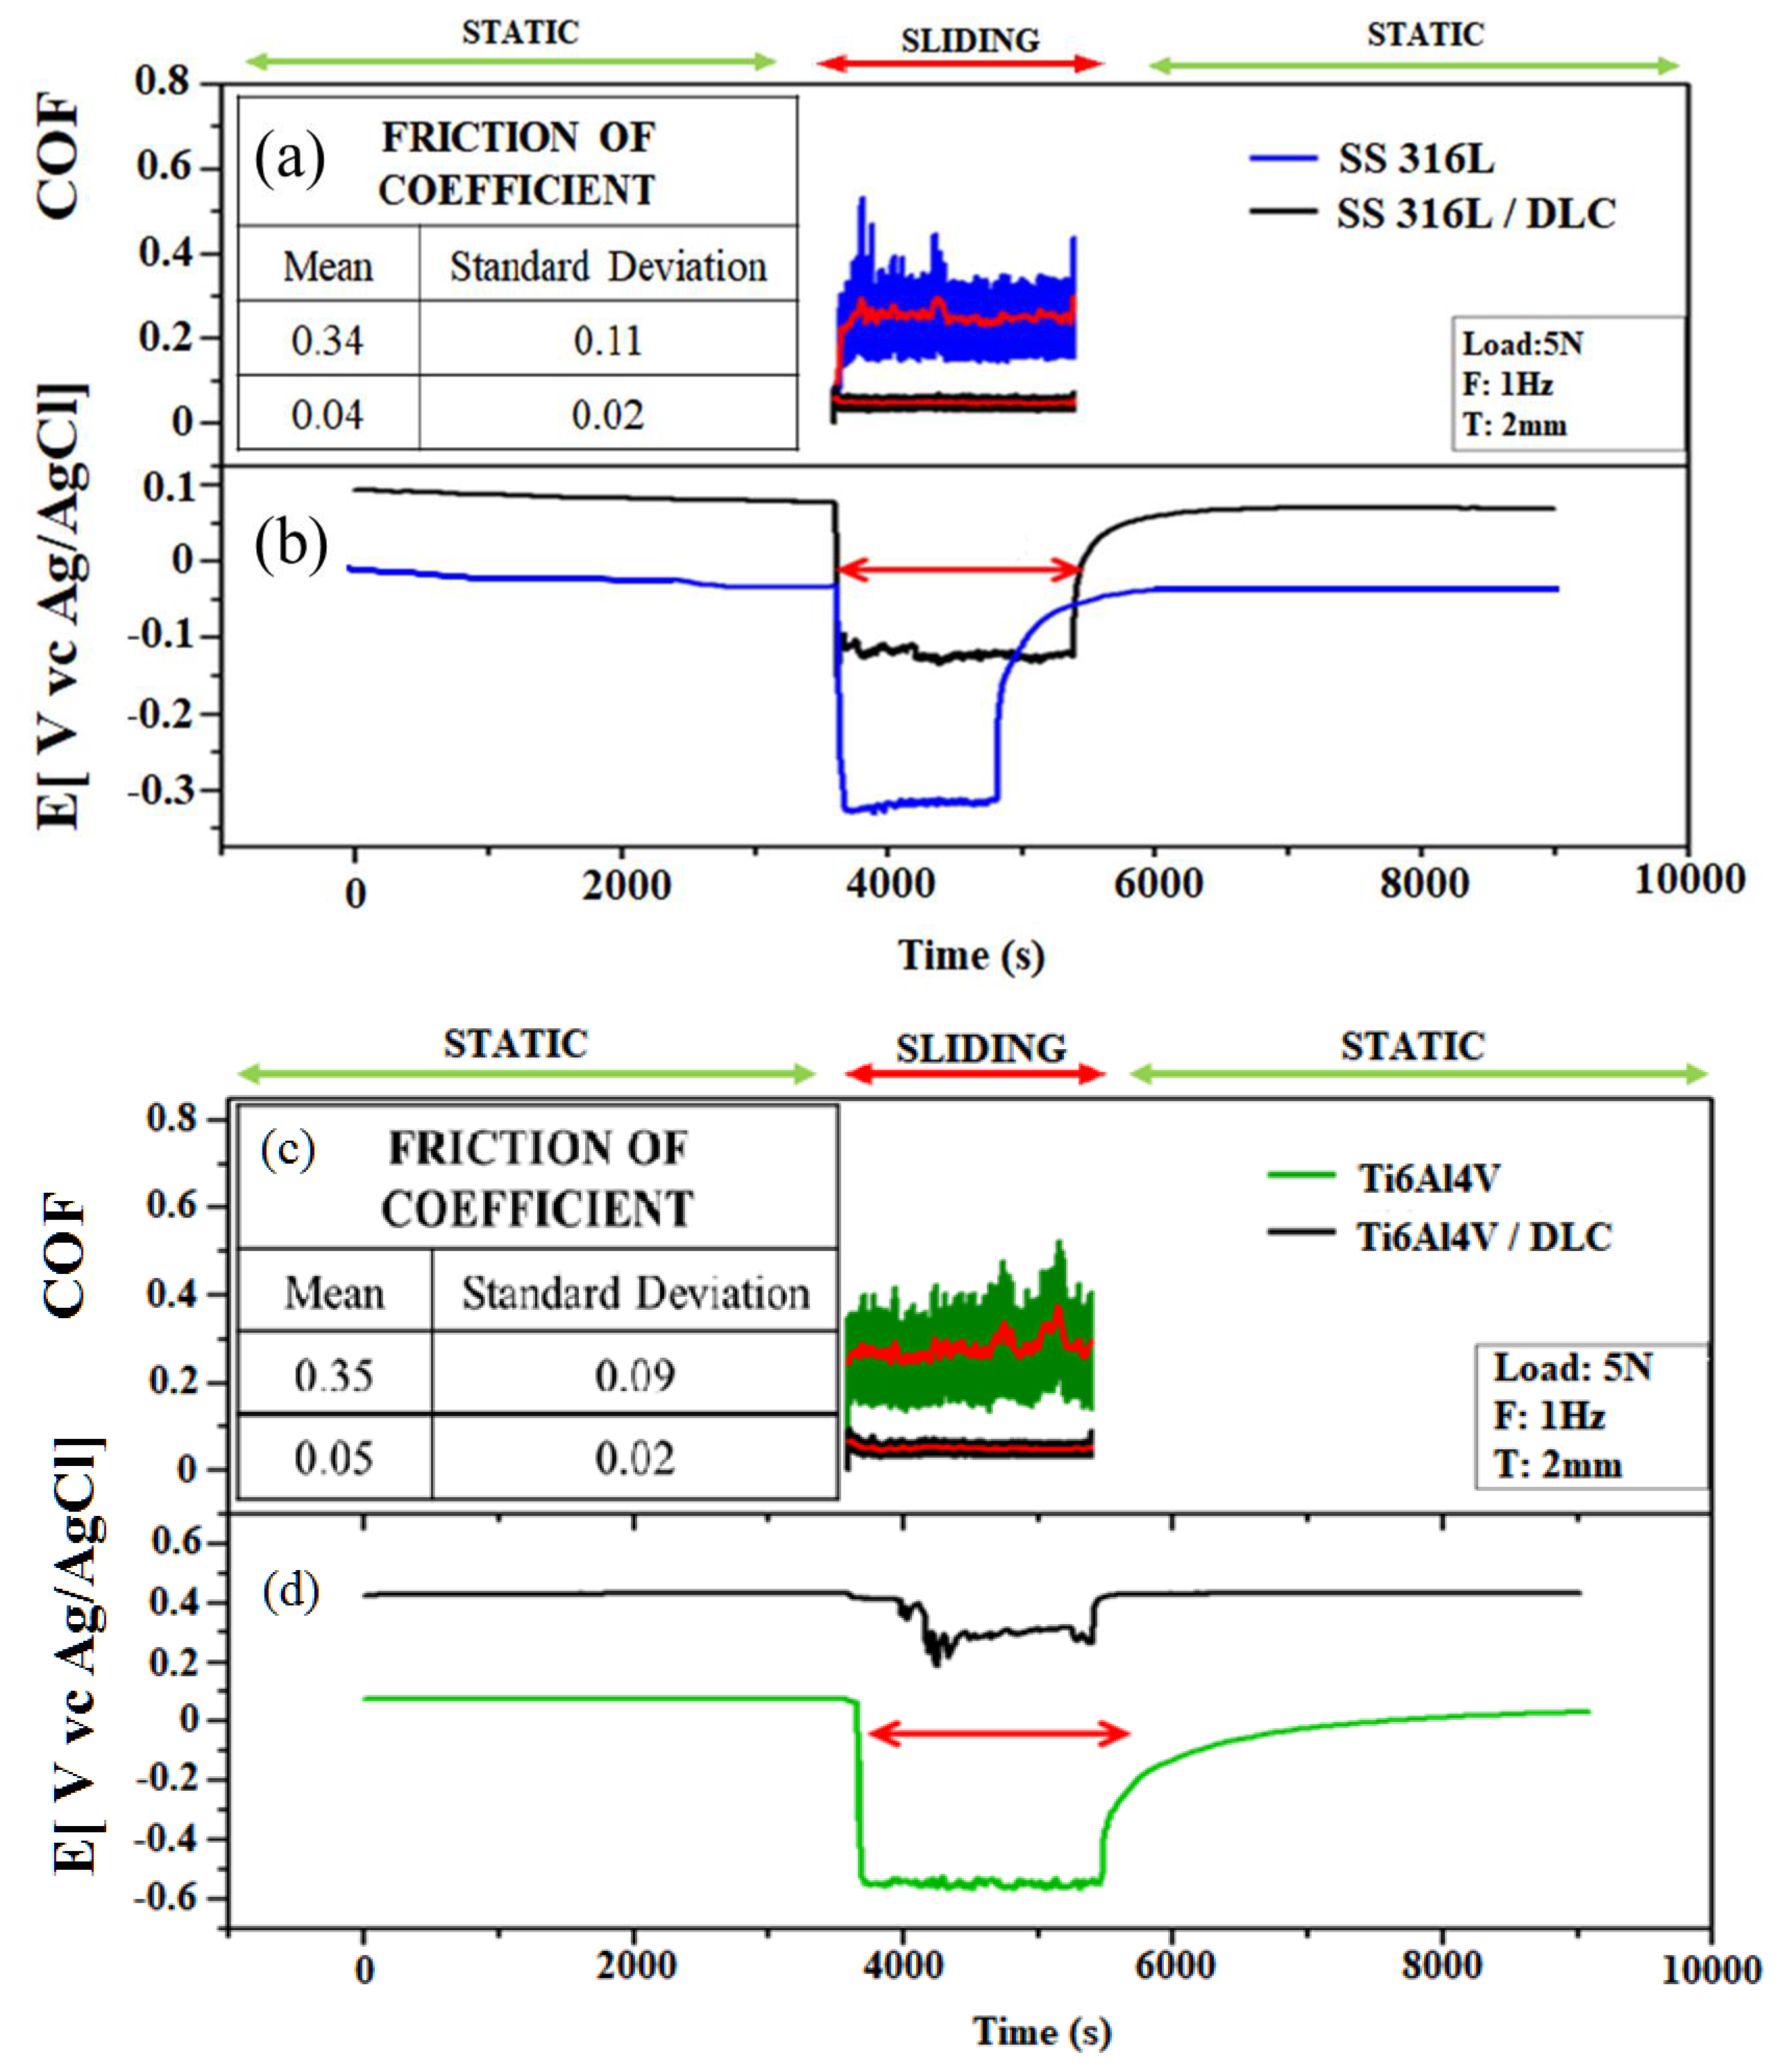
Figure 9(a-d) shows the friction coefficient and open circuit potential (OCP) curves obtained for the tribocorrosion tests using Ringer’s lactate solution. The OCP was measured at steady state under static conditions, in order to obtain the equilibrium potential. Fluctuation of the OCP was then measured during the sliding tests. The average friction coefficient is shown by the red line, with the values being used for comparison of the friction in an air environment and in Ringer’s lactate solution.
Figure 9(a) shows the friction coefficients for the tribological pairs consisting of the SS316L sphere and the SS316L plates with and without DLC, immersed in Ringer’s lactate solution. The friction coefficient for the SS316L in the solution was 0.34±0.11, while the value decreased to 0.04±0.02 for the pair composed of the SS316 sphere and the SS316L+ DLC plate, representing a reduction of 88%.
Figure 9(b) shows that during the tribocorrosion in reciprocating mode, the bare SS316L sample (blue line) presented an abrupt decrease of the OCP from 0 to -0.35 V, indicating the removal of passive protection due to wear damage, with an increased tendency for corrosion on the wear track. This effect was also observed for the SS316L+DLC sample, although the OCP decrease was only -0.1 V, demonstrating that the DLC coating provided increased resistance to corrosion.
Figure 9(c) shows the friction coefficient plots for the pairs consisting of the Ti6Al4V sphere and the Ti6Al4V plates with and without DLC, in Ringer’s lactate solution. The mean friction coefficient obtained using the plate without DLC was 0.35±0.05, while a value of 0.05±0.02 was obtained using the DLC-coated Ti6Al4V plate, representing a reduction of 85%.
The friction test results for the Ti6Al4V and SS316L substrates with and without DLC coatings showed that the protective DLC coating reduced the friction in both cases, with similar values obtained, considering the error bars.
For the DLC-coated Ti6Al4V sample, the initial OCP was around +0.4 V, with a slight change to around +0.3 V during the tribocorrosion test (
Figure 9(d), black line). The positive potential value showed that corrosion protection was maintained after the sliding test. This indicated that the Ti6Al4V sample had better corrosion protection than the SS316L substrate, since the latter presented a rapid decrease in OCP from 0 to -0.35 V, indicating the removal of passive protection and susceptibility to corrosion.
In terms of tribocorrosion susceptibility, the results (
Figure 9(b) and 9(d)) showed that the Ti6Al4V was two times more susceptible to corrosion than SS316L, while the presence of the DLC coating provided greater protection of Ti6Al4V, compared to SS316L, since the potential showed a greater decrease for SS316L, compared to Ti6Al4V. The different behaviors of the DLC films as protective coatings could be related to an effect of the surface roughness, which differed for the two substrate (
Figure 6).
Titanium alloy (Ti6Al4V) is more resistant to corrosion in Ringer’s lactate solution, compared to stainless steel (SS316L). This is due to formation of the passive layer on the surface of the titanium alloy, which prevents further corrosion, while SS316L can corrode in Ringer’s lactate solution because chloride ions react with the iron in stainless steel, leading to pitting corrosion. As shown in
Table 1, SS316L has 59.46% of iron in its composition, indicating a probable interaction with chloride ions during the reciprocating mode tribocorrosion tests.
In previous work with titanium nitride thin films grown on titanium during different deposition times, it was observed that an increased thickness provided better corrosion protection and wear resistance [
36]. Corrosion protection is related to an absence of pores in the coating. In thin films, discontinuities and the presence of high pore concentrations or dimples provide corrosion pathways that lead to failure of the coating.
3.6. Crystal violet assays
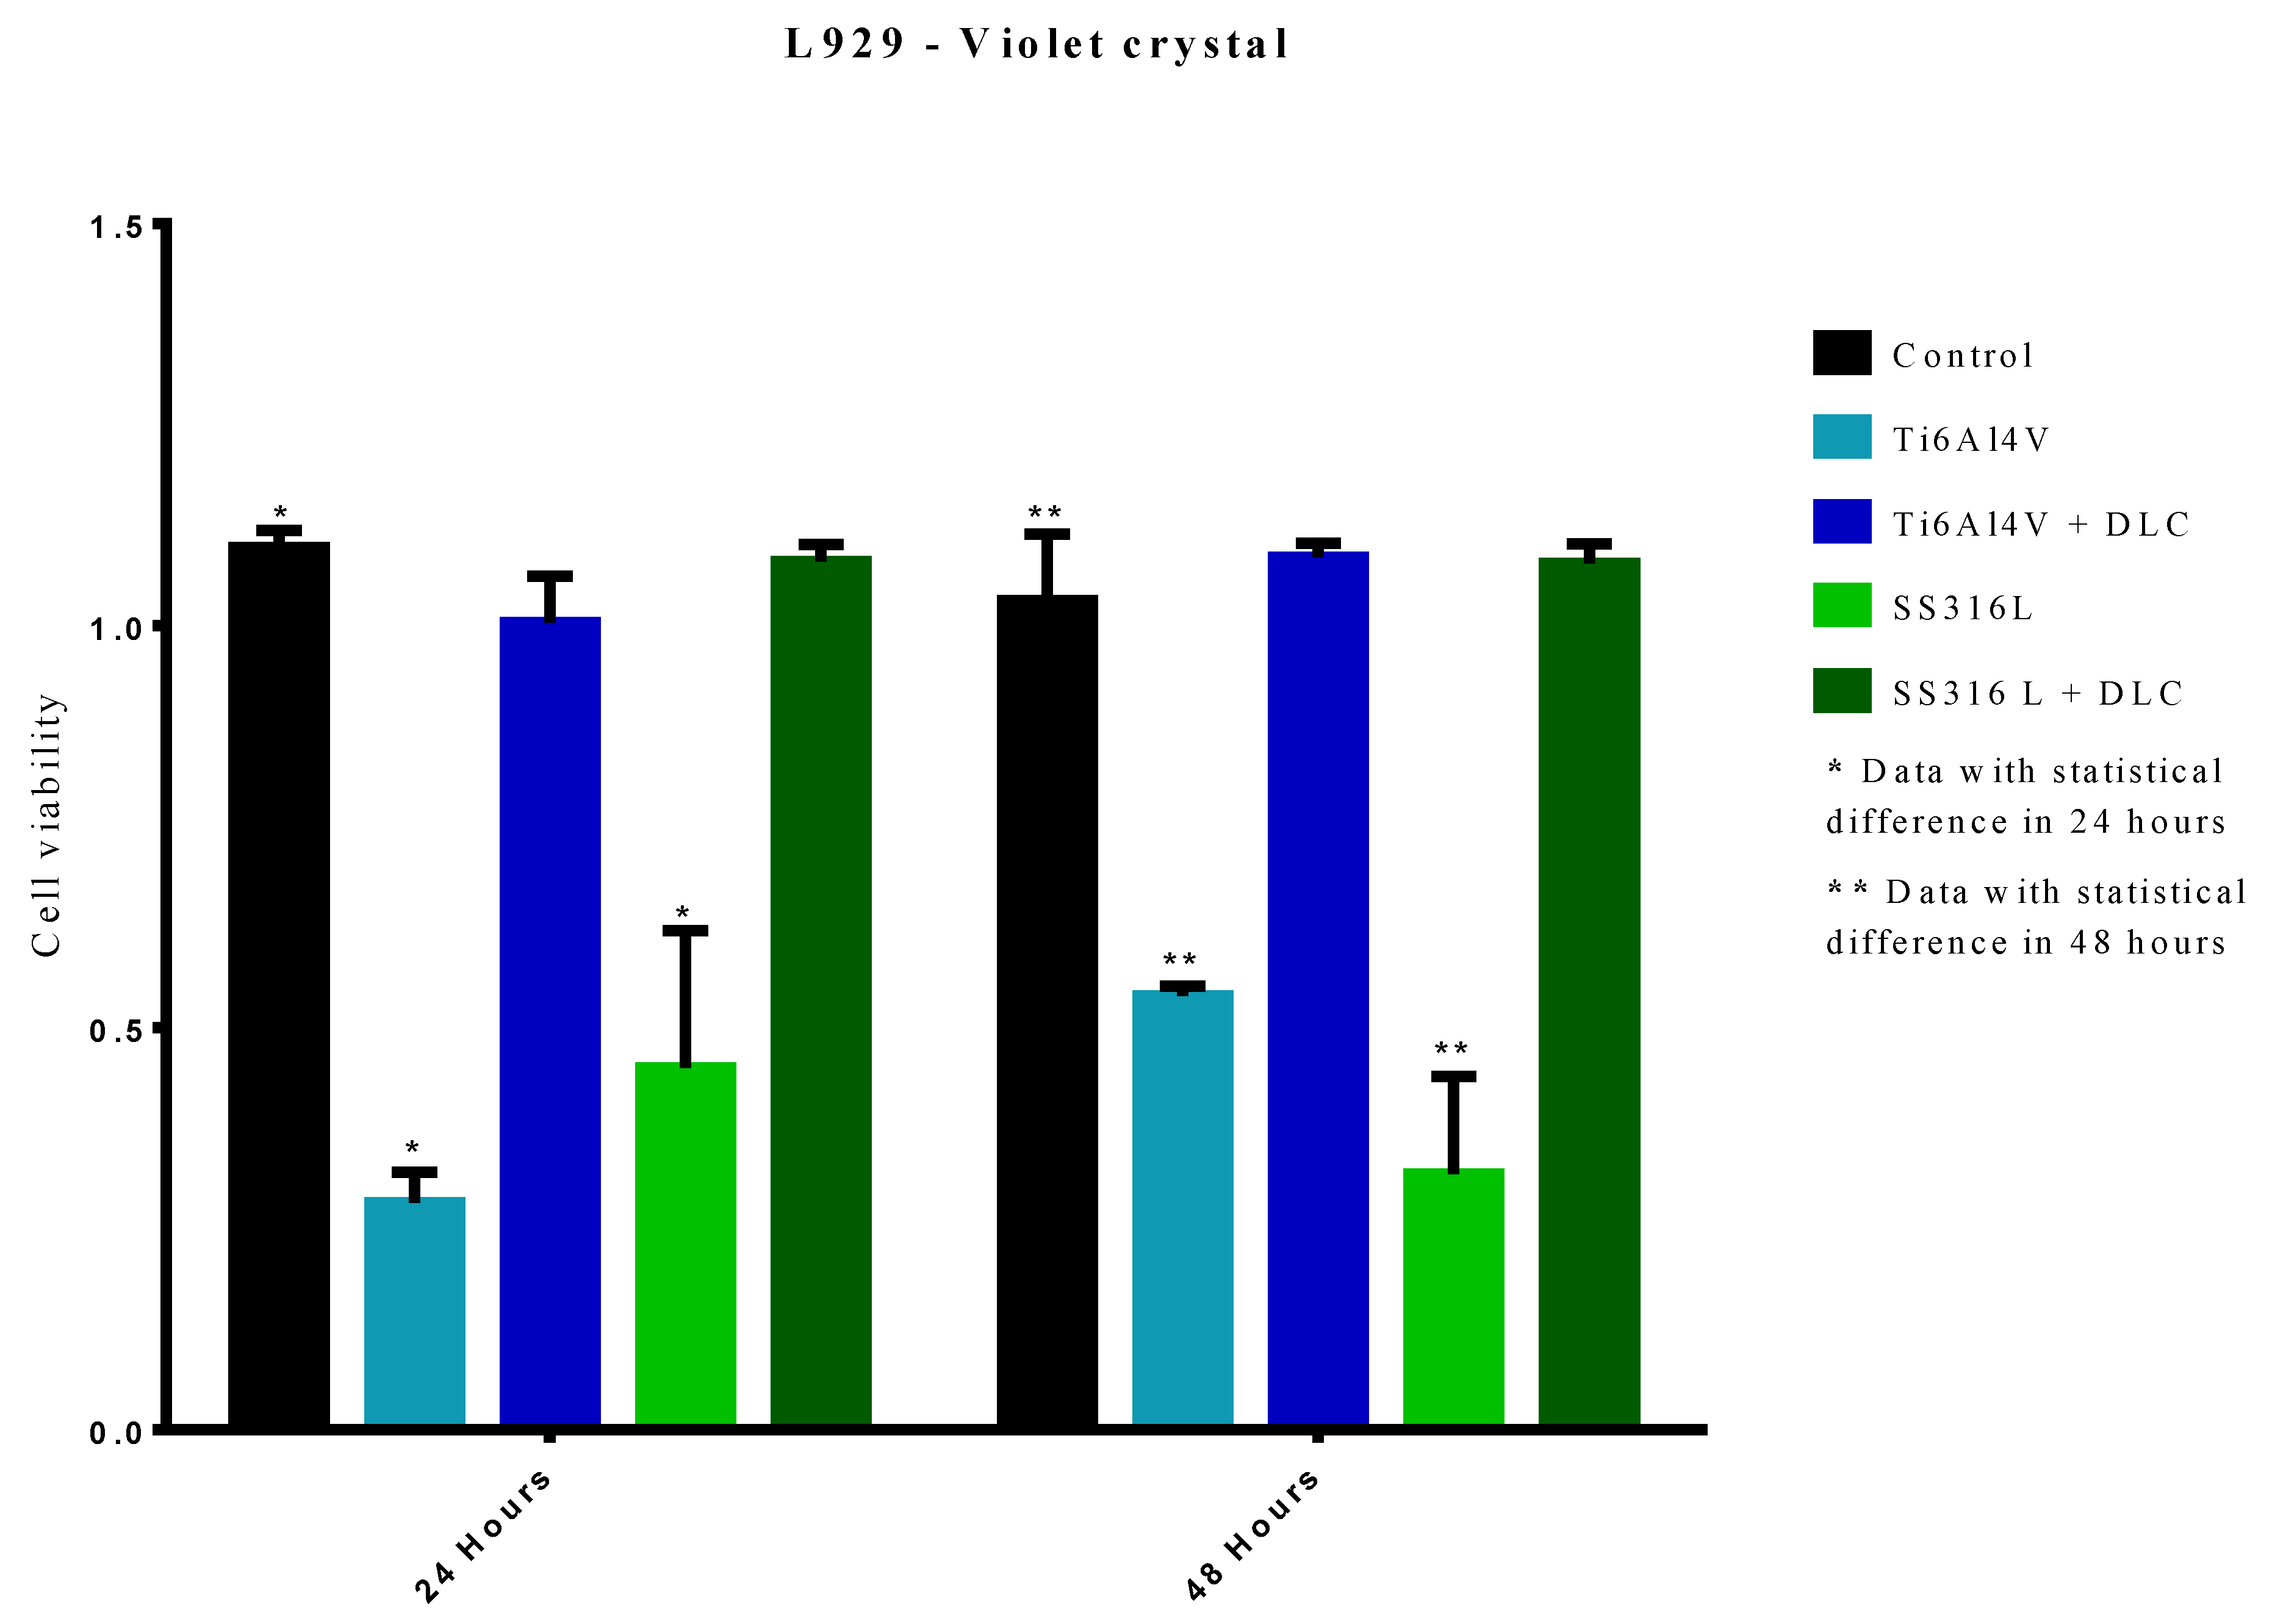
Figure 10 shows the results of the crystal violet assays of cell viability, after 24 and 48 h, for the control, SS316L, SS316L+DLC, Ti6Al4V, and Ti6Al4V+DLC groups. At 24 h, the Ti6Al4V group showed a statistically significant difference from the control group (p<0.0001). However, there was no significant difference between the Ti6Al4V+DLC and control groups, indicative of similar cellular growth. For the 48 h exposure, the Ti6Al4V group presented a statistically significant difference to the control group (p<0.0001), with decreased cell viability. The higher cell viability value at 48 h reflected cell division that occurred after the 24 h period. The Ti6Al4V+DLC group was not statistically different from the control, indicating that these groups remained constant in terms of cell proliferation.
For the 24 h period, the cell viability of the SS316L group was significantly different in comparison to the control group (p<0.0001). However, the 316L+DLC group showed no statistical difference to the control group, indicating that cell proliferation remained unchanged.
For the 48 h period, the cell viability of the SS316L group was significantly lower, compared to the control group (p<0.0001), with the lower value at 48 h indicating a toxic environment that led to cell death. The SS316L+DLC group showed no statistically significant difference from the control, consequently remaining the same in terms of cell proliferation. For both metal substrates, the presence of the DLC film increased the cell viability, resulting in values equal to the control. The significantly lower (p<0.0001) cell viability values for the uncoated SS316L and Ti6Al4V indicated that these materials were not suitable for cell growth.
3.7. Mitochondrial activity
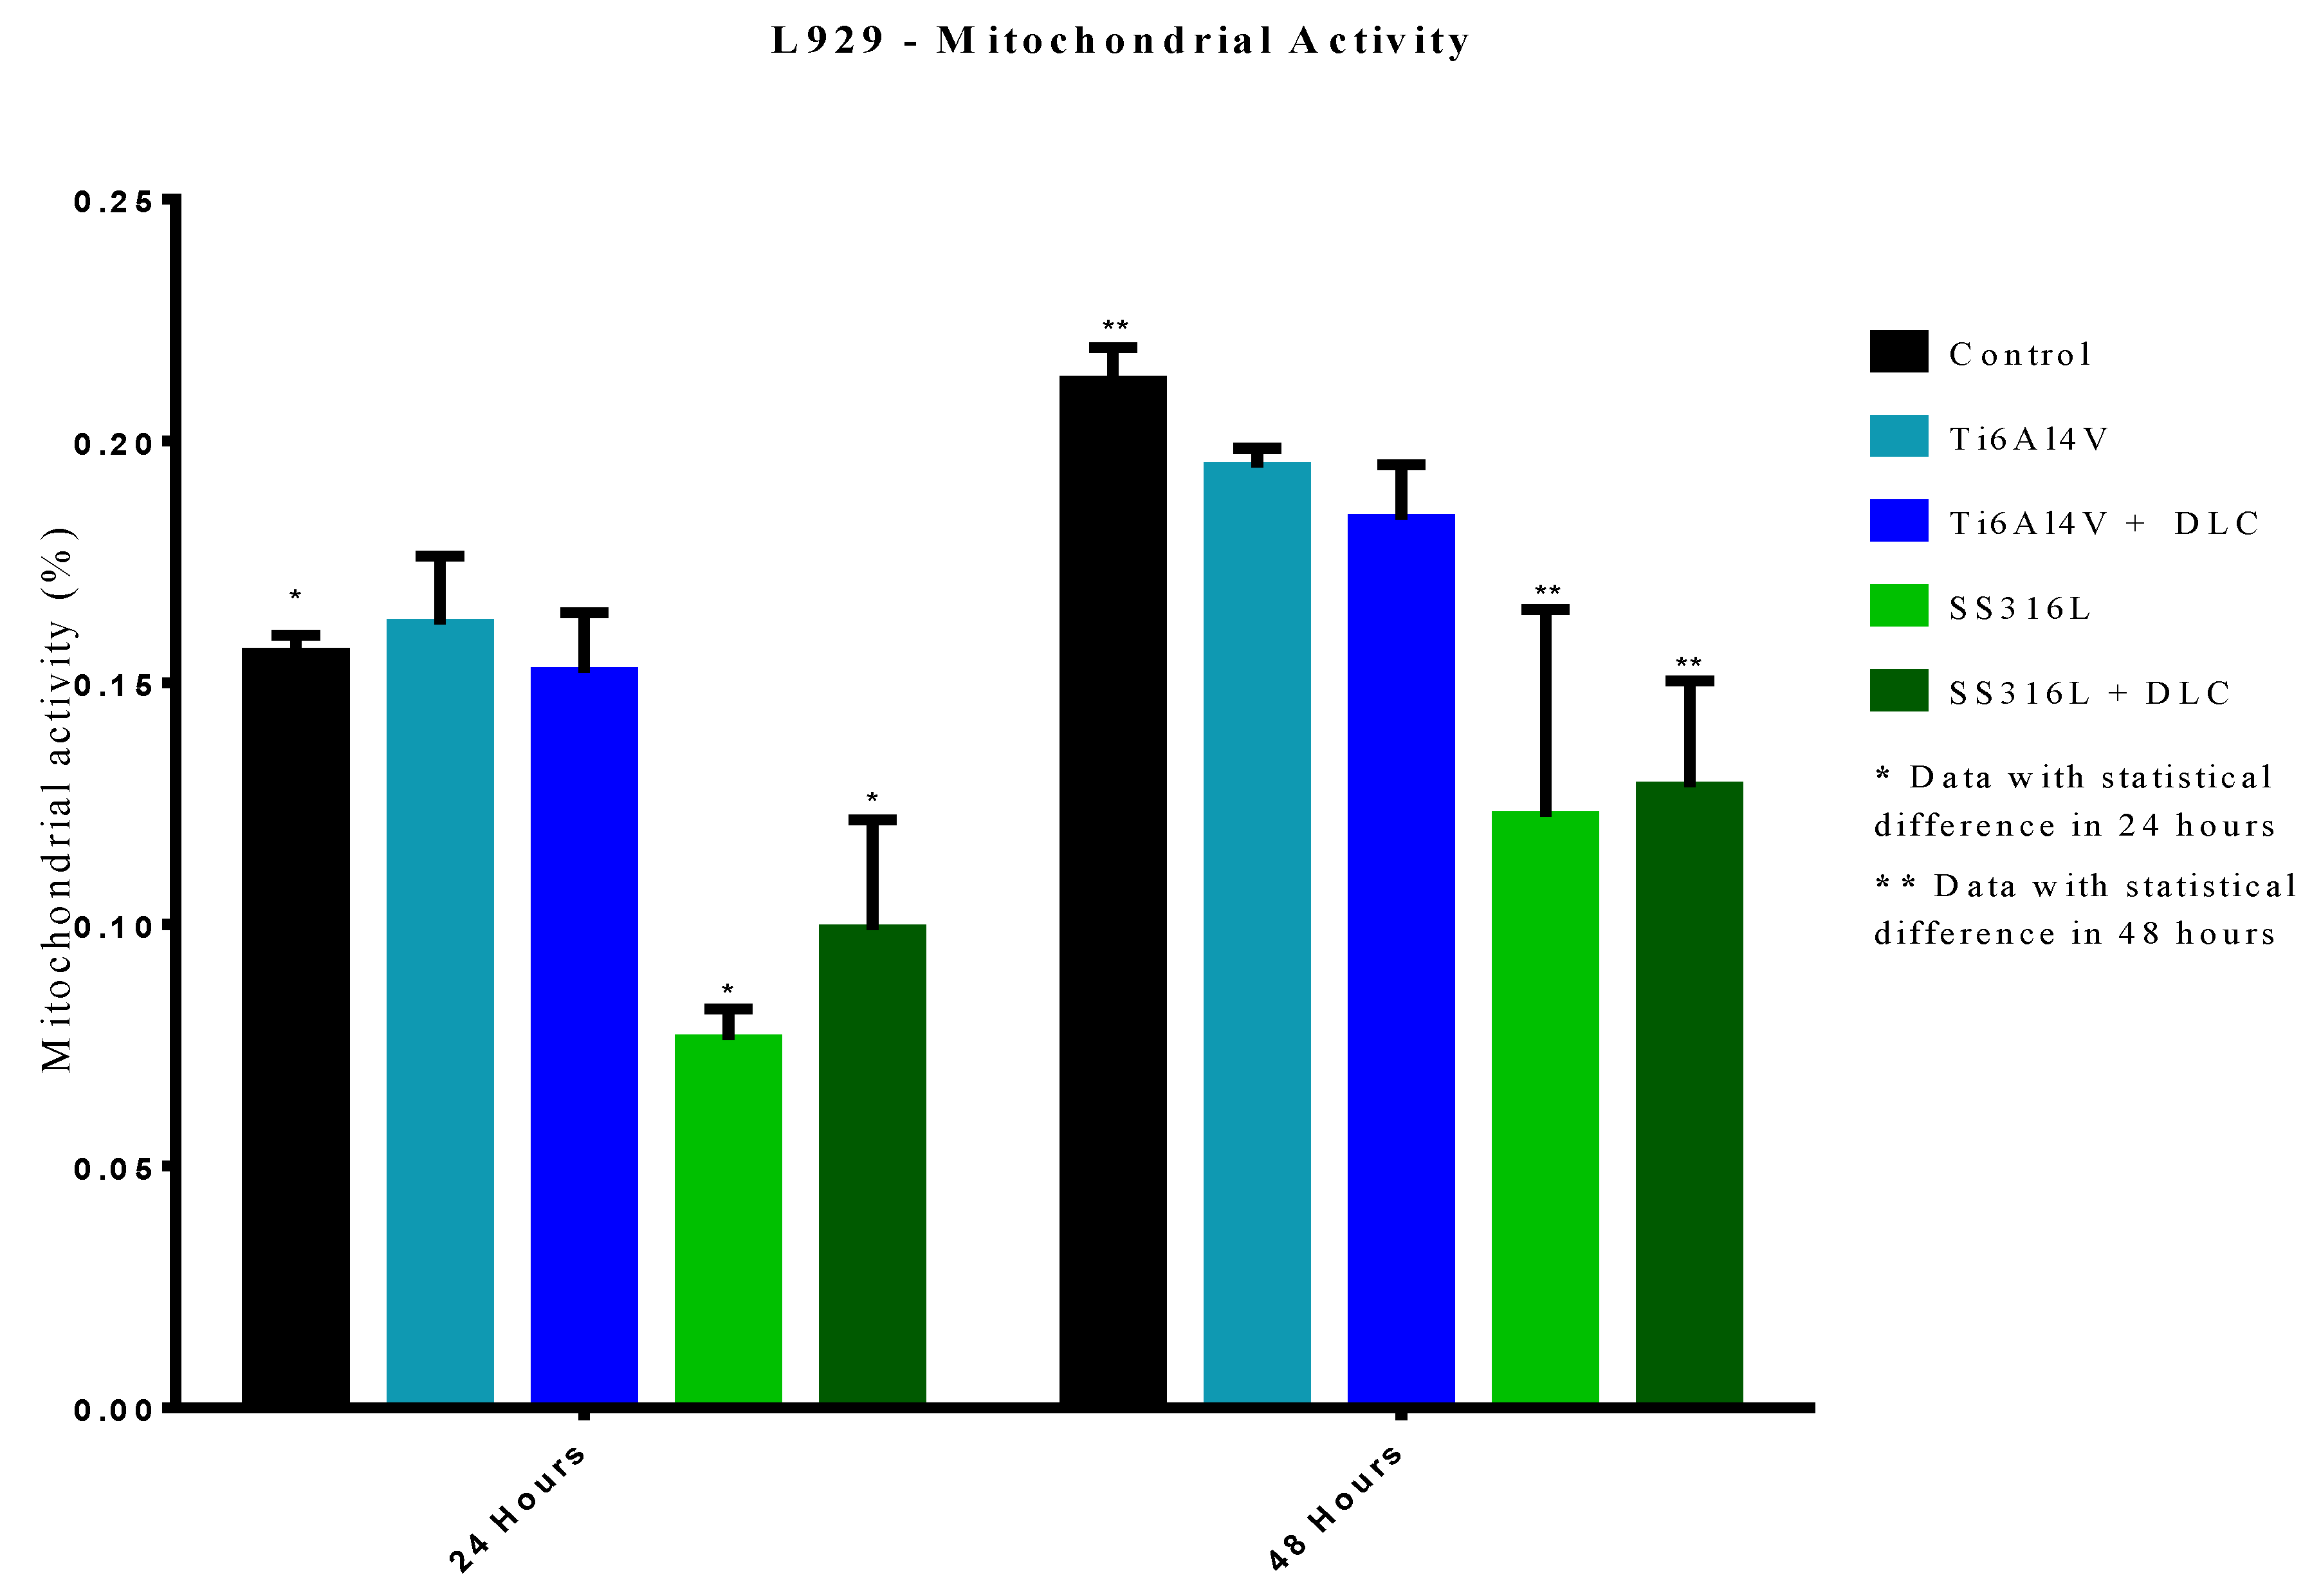
The results of mitochondrial activity evaluation using the MTT assay showed that the Ti6Al4V and Ti6Al4V+DLC samples did not present statistically significant differences in cell death, compared to the control group, for the 24 h evaluation period. Similar results were observed for the 48 h period, indicating that cell metabolism (involving chemical reactions and the production of energy for functioning of the cells) was similar for these groups.
The mitochondrial activity data showed that the SS316L and SS316L+DLC groups differed statistically from the control group (p<0.0001), for the 24 and 48 h periods. The results for the SS316L group were coherent with the crystal violet assay indicating increased cell death. The results for the SS316L+DLC group indicated that although in the crystal violet assay, the cells behaved like the control group, with no difference in cell death, the mitochondrial activity occurred at a lower level, with the cells adapting to the environment.
3.8. Micronucleus assays
Many materials can cause damage to the complex structure of DNA, resulting in the formation of micronuclei, which are small chromosomal fragments dispersed outside the nucleus. Ethyl methanesulfonate (EMS) is a mutagenic substance that can cause the formation of micronuclei after contact for extended periods, enabling its use as a positive control [
37].
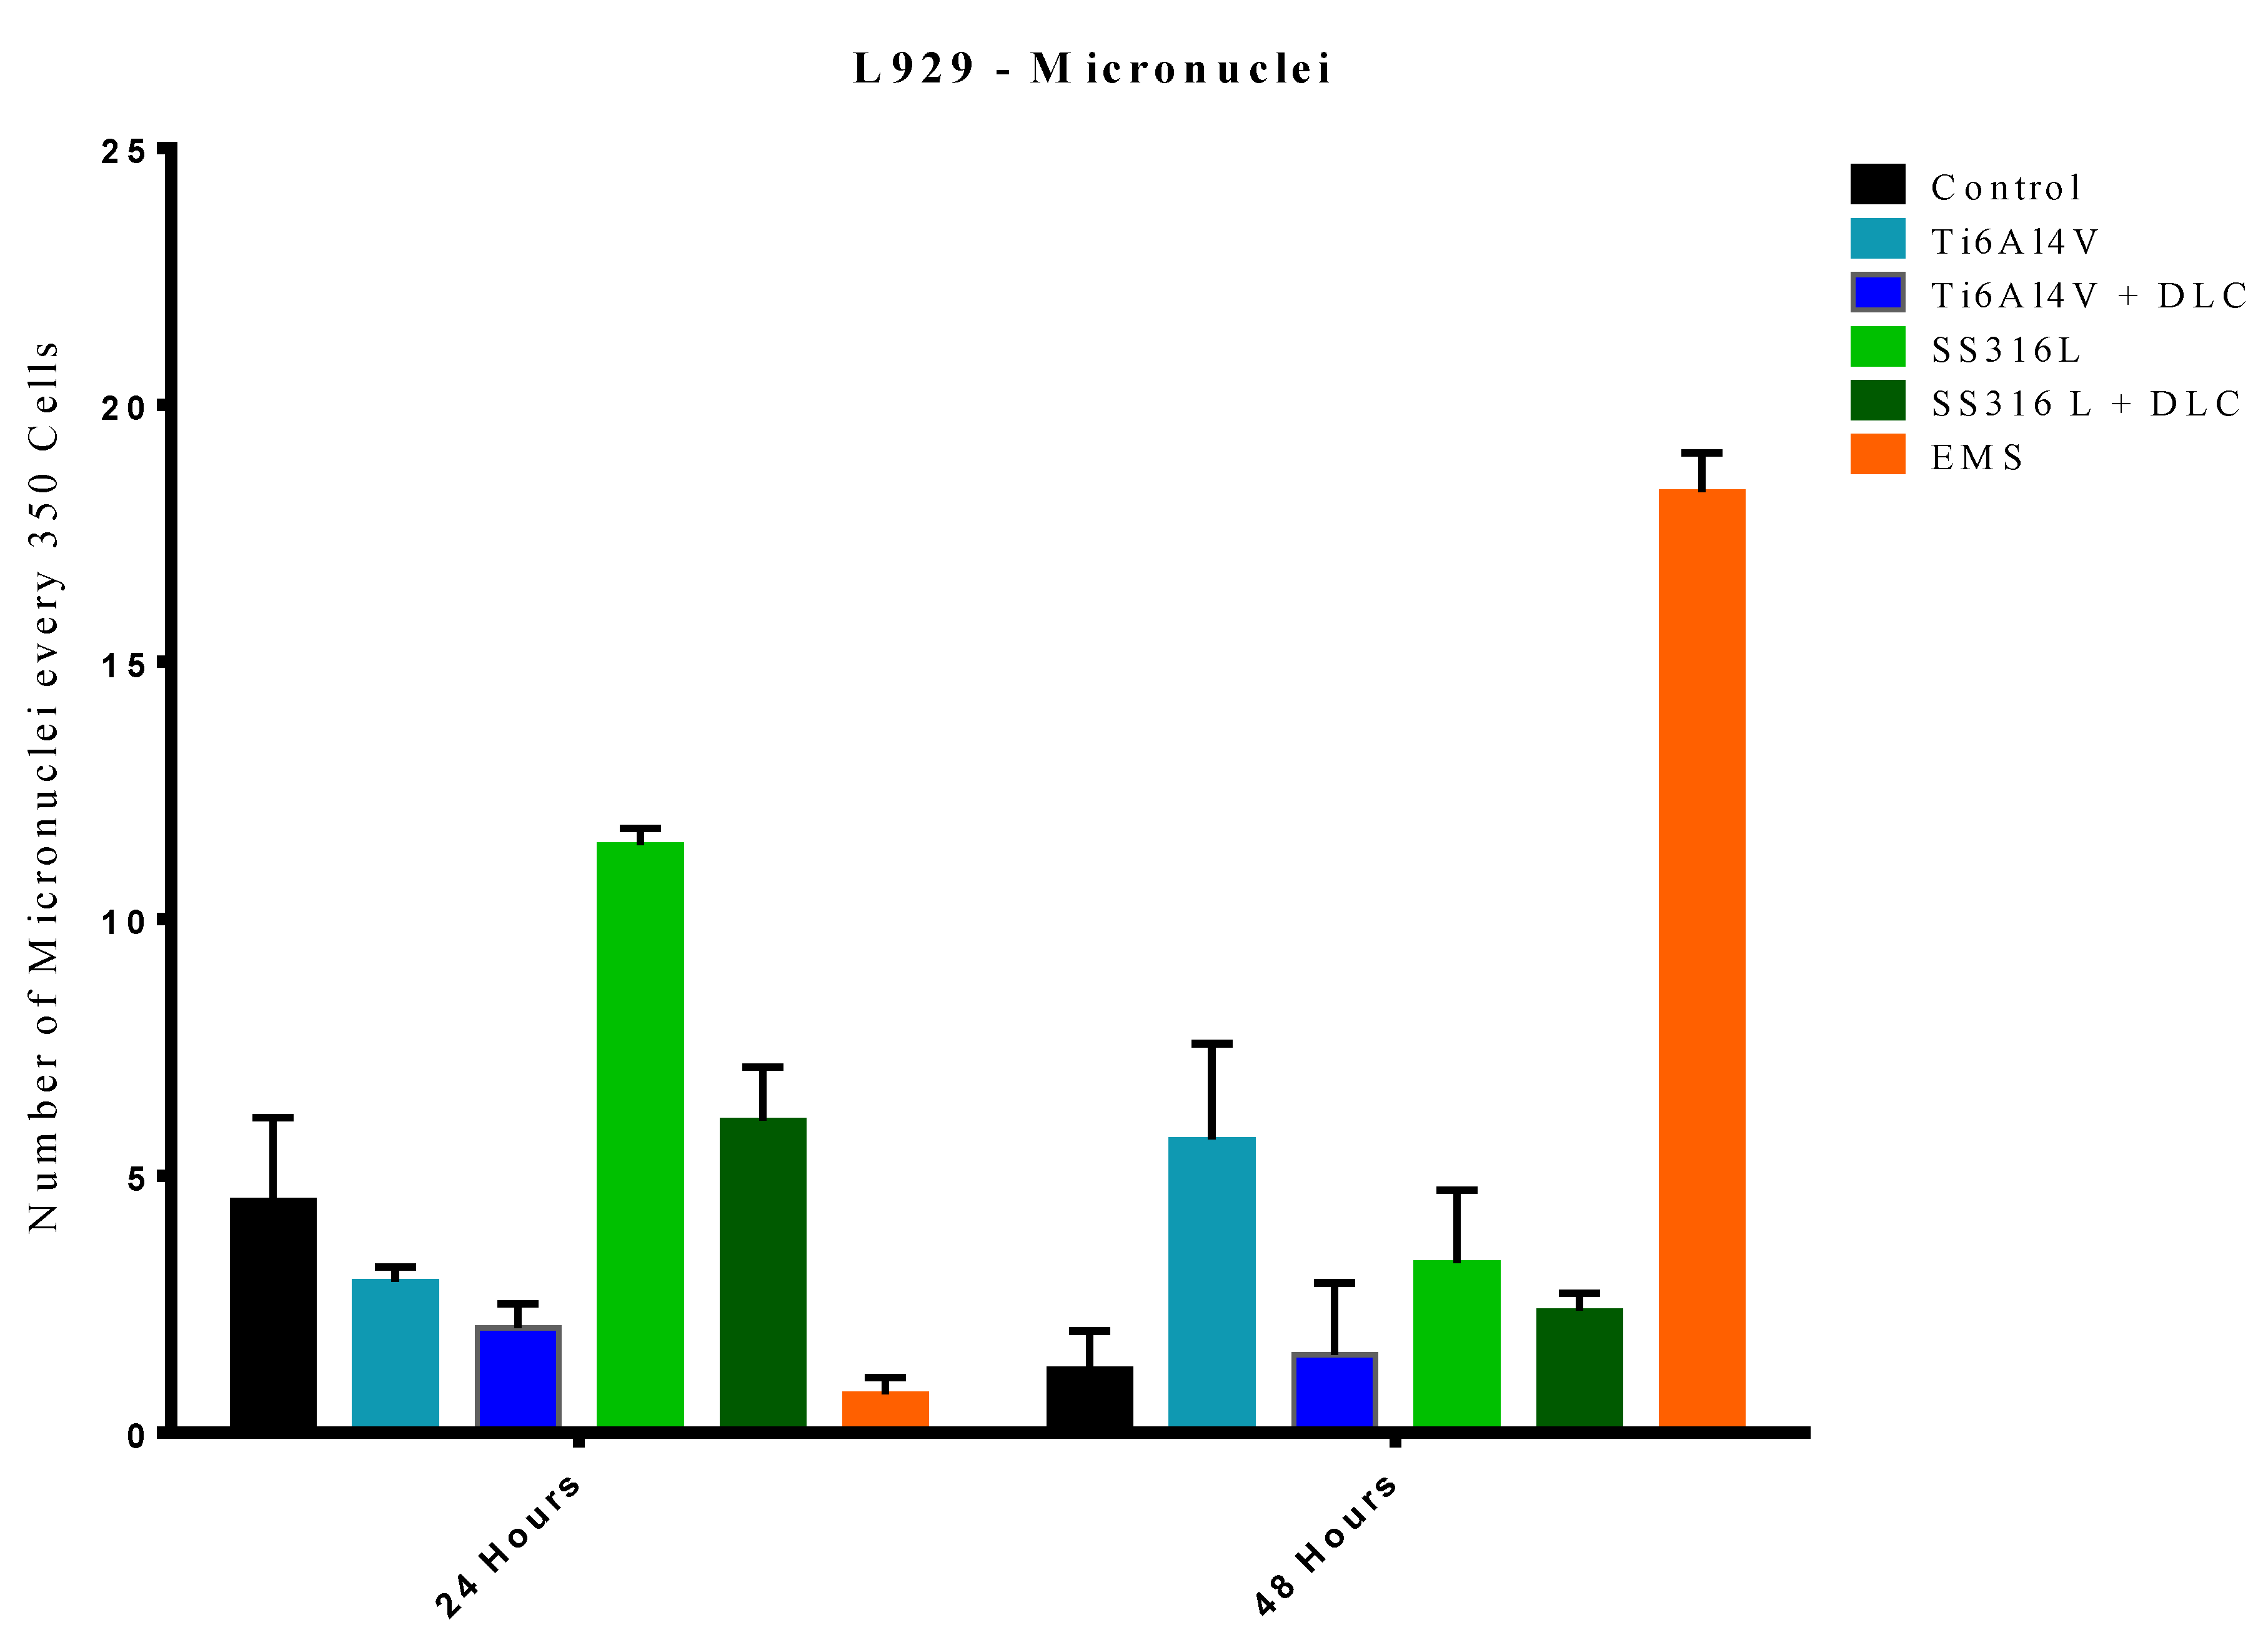
The results of the micronucleus assays are shown in
Figure 12. For the 24 h period, in comparison to the control group, the Ti6Al4V+DLC, SS316L, and EMS groups showed statistical differences (p=0.0190, p<0.0001, and p<0.0001, respectively), while no statistical differences were observed for the Ti6Al4V and SS316L+DLC groups. This heterogeneity of the data was due to a period of adaptation of the cells to the exposure environment. The EMS group (control for micronuclei formation) presented statistical differences when compared to the control, SS316L, and SS316L+DLC groups (p<0.0001, p<0.0001, and p<0.0001, respectively). However, a possible explanation for this observation was the absence of micronucleus formation during the 24 h exposure period, since the action is closely linked to the cycle time of the animal cell, which is typically around 24 h.
For the 48 h period, a statistically significant difference was observed between the Ti6Al4V group and the control group (p<0.0001). However, the Ti6Al4V+DLC, SS316L, and SS316L+DLC groups showed no significant difference when compared to the control group. In comparison to the EMS group, all the other groups were significantly different, evidencing probable non-genotoxicity, considering the substantial micronucleus formation in the EMS group, while much lower micronucleus formation occurred in the other sample groups.
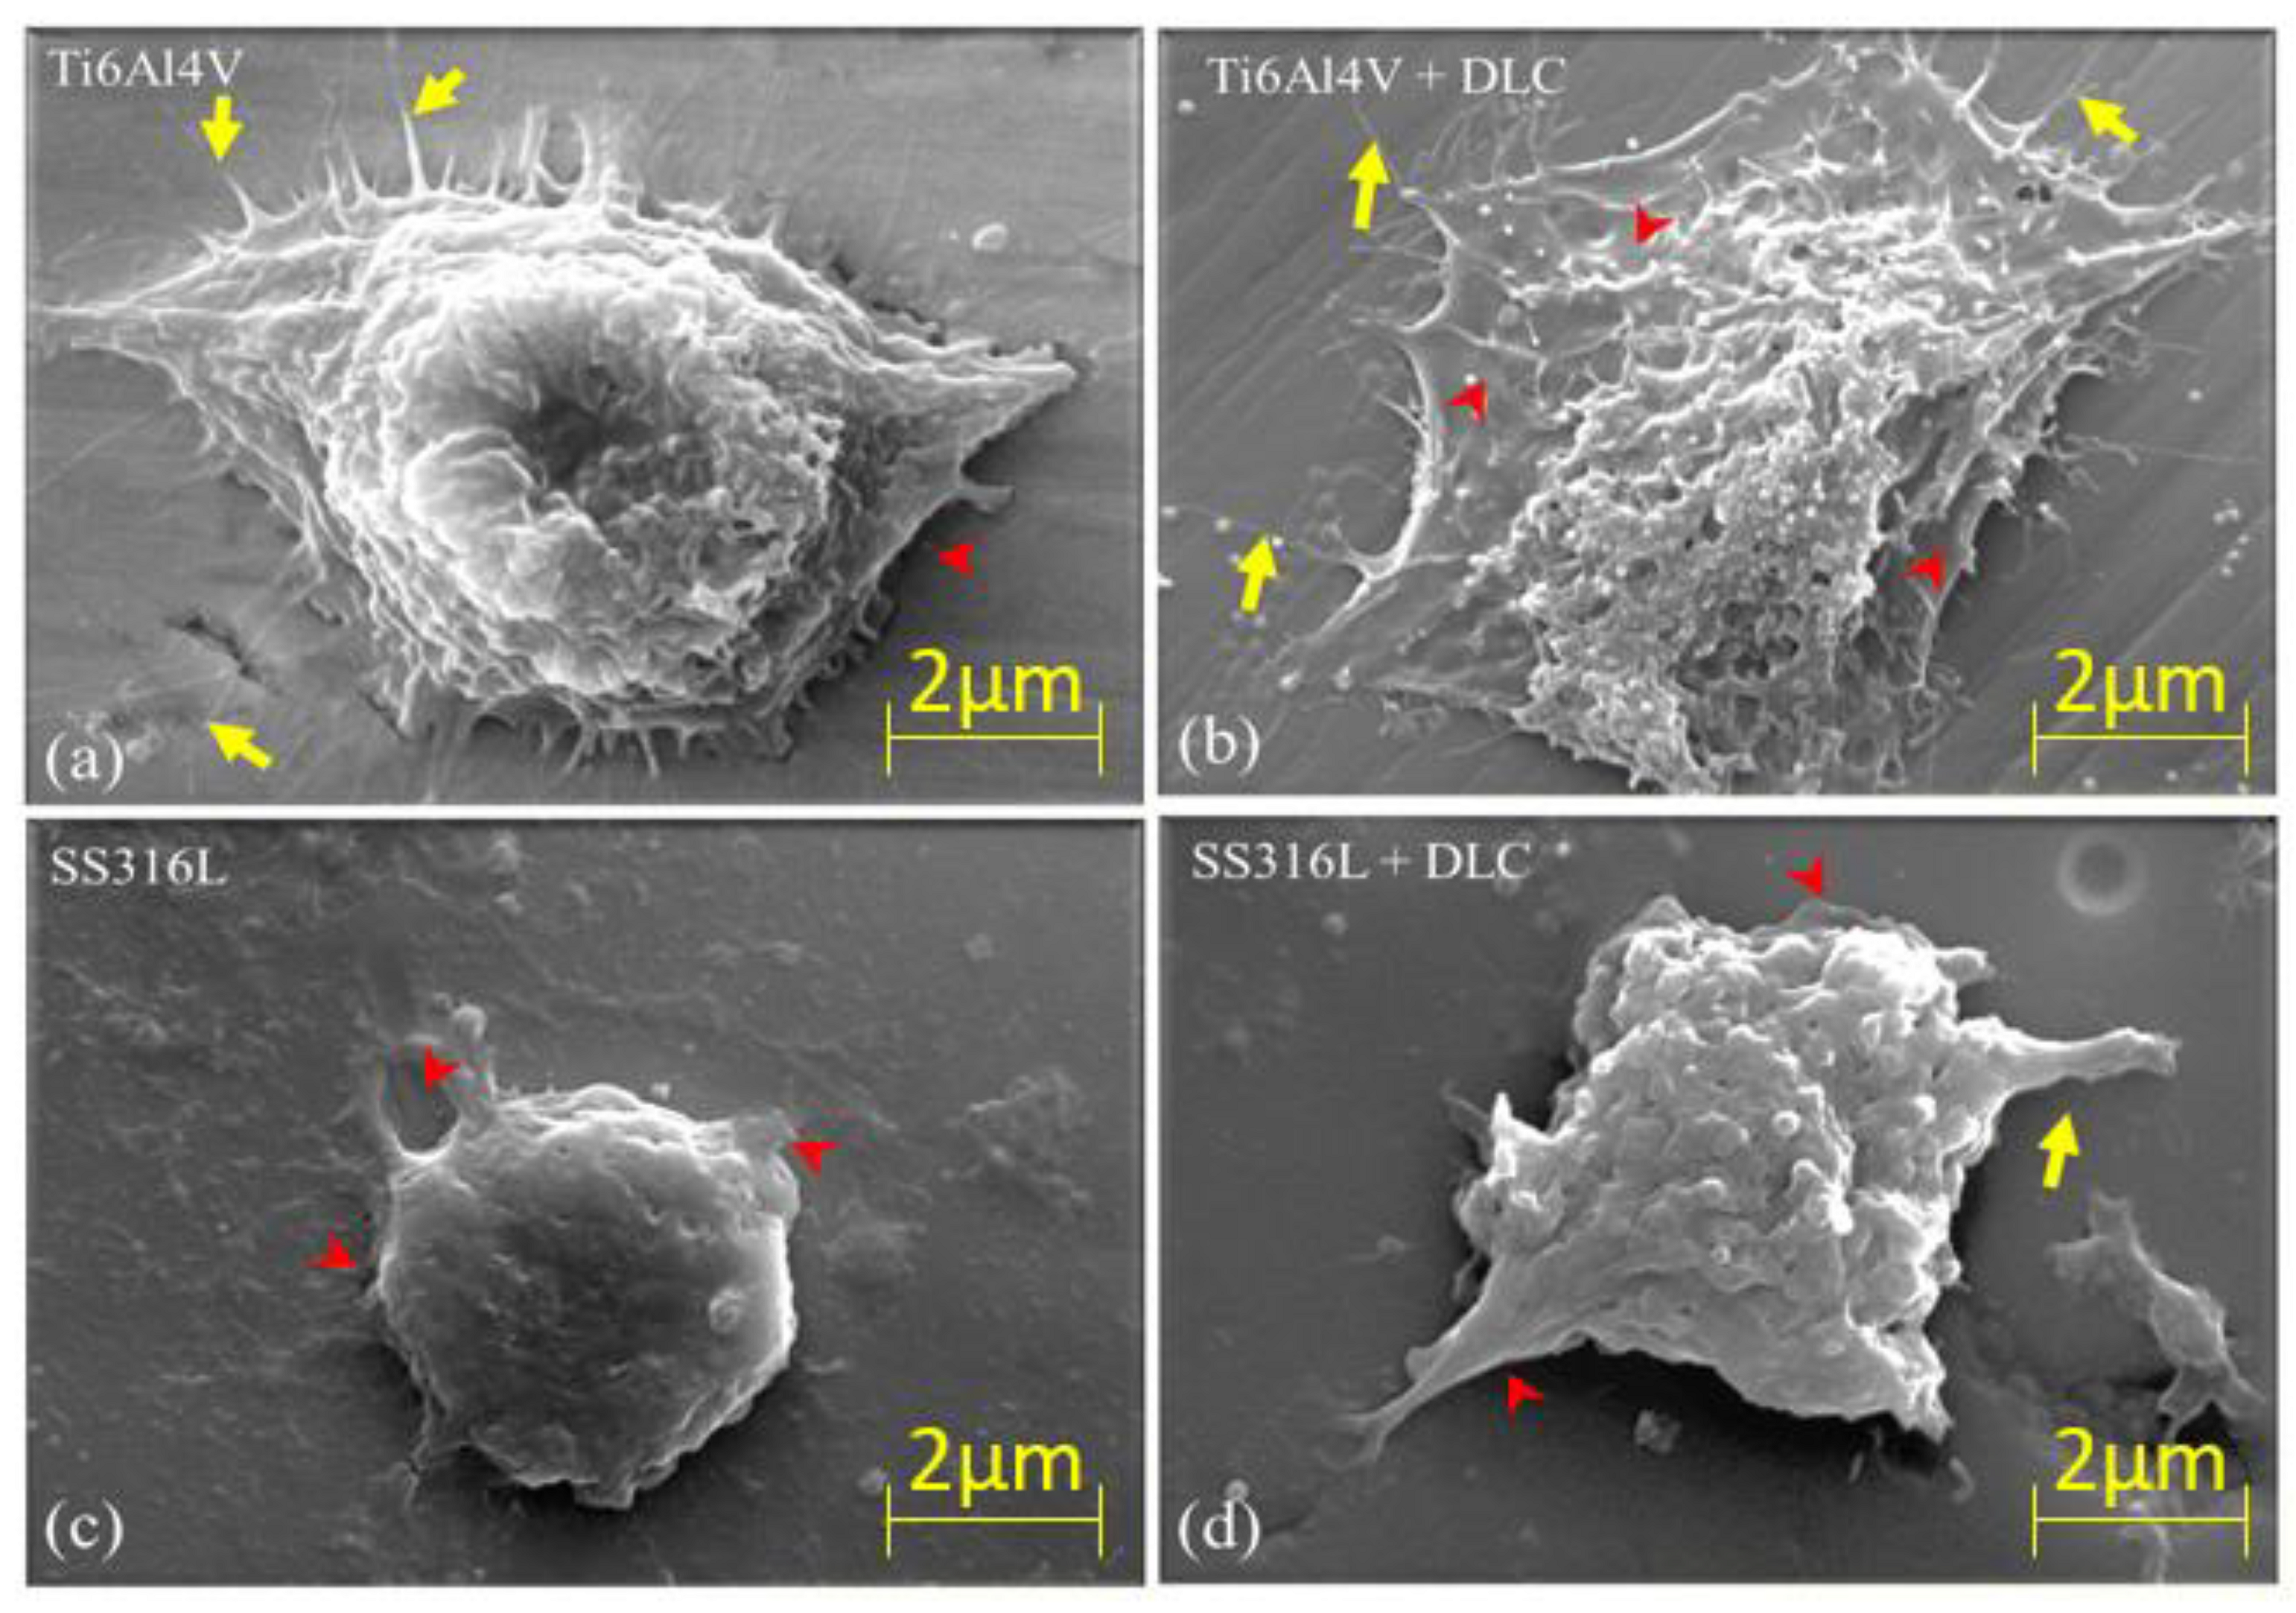
Figure 13 shows SEM images, at 3,000× magnification, of the L929 cells on the Ti6Al4V, Ti6Al4V+DLC, SS316L, and SS316L+DLC substrates. The yellow arrows indicate filopodia, while the red arrowheads indicate lamellipodia. The lamellipodia and filopodia are protuberant extensions originating from the membrane of a cell. Lamellipodia are membrane extensions with several filopodia joined by actin. These structures are formed by the action of a protein that forms microfilaments, with the presence of actin leading to the filopodia becoming sealed in a sheet-like network structure. According to Mattila [
38], the difference between lamellipodia and filopodia is in the size of the extension. The filopodia are primary finger-like structures that extend up to 0.3 μm and have the function of cell mobility and spreading. The lamellipodia are structures containing sealed filopodia in the presence of actin. It can be seen from
Figure 13 that the L929 cells were more consolidated in the Ti6Al4V samples (with and without DLC). In the case of the bare SS316L sample, the cells presented low spreading and appeared to grow in the vertical direction. Comparison of the images for the DLC-coated substrates indicated that there was cell preference for the Ti6Al4V+DLC coating.
4. Conclusions
The deposition of DLC coatings on 316L steel and Ti6Al4V alloy, using the same parameters and with acetylene gas as carbon precursor, produced coatings composed of hydrogenated amorphous carbon containing 80% graphite rings and open chains in its structure.
The carbon bonds presented sp2 hybridization, with graphite type characteristics, while sp3 hybridization was obtained from C-C/C-H and C-O-C bonds. Both sp2 and sp3 were detected by XPS, in the regions of 284 and 285 eV. The thickness of the DLC coating on SS316L was 1.59 μm, with a growth rate of 0.013 μm/min. For the Ti6Al4V substrate, the DLC coating thickness was 1.33 μm and the growth rate was 0.011 μm/min. Both growth rates were as expected for DLC films produced by PECVD processes.
The hardness of the DLC coatings was in the range 23-26 GPa, which provided mechanical resistance up to -20 N in scratch tests, without substrate exposure.
Friction tests showed that the DLC with 80% of the carbon in its structure distributed between carbon rings and open chains acted to increase mechanical strength and provide lubrication. The friction coefficient was reduced by an order of magnitude, compared to the samples without coatings.
Tribocorrosion analyses performed using the samples with and without DLC coatings, immersed in Ringer’s solution, demonstrated that the coatings provided corrosion protection in both static and dynamic modes, reducing the corrosion potential and the friction coefficient.
The use of in vitro biological analyses showed non-cytotoxicity of the DLC-coated samples during periods of 24 and 48 h. However, exposure to the uncoated Ti6Al4V or SS316L led to cell death. In addition, micronucleus analysis showed minimal genotoxic potential, especially for the DLC coatings. It could be concluded that the DLC coatings presented suitable properties of interaction and biocompatibility when exposed to the cellular environment, together with low friction and high hardness, making them suitable for use on fixed implants. It is necessary to control the thickness and roughness of the coating, in order to avoid pinholes and increase the corrosion protection of implants. The use of these DLC coatings with low friction coefficients could facilitate the fixation of implantable pins and screws, including Kirschner wires.
Finally is important to say, this paper shows an approach because the functioning of joints is very complex there is a lot to study to improve the joint range movement that decreases with increasing age. The flexibility needs to be maintained with collagen production, it keeps the skeletal system flexible. Many age people did not replace hormones and their reduction contributes to collagen reduction and also range movement decreasing. In addition, physical exercise in mandatory for all ages people keep range movement and help natural hormones reposition.
Author Contributions
A.C. Sene and L. Vieira conceived the work. P.F. Macário, A.P. Vieira, M.G.P. Silva, and A.C. Sene developed the theory and performed the computations. F.C. Marques and L. Vieira established the analytical methods. N.S. Silva and A.C. Sene performed the cell viability and chromosomal damage assays. M.S.C.M Leite and N.S. Silva performed the SEM analyses of cells. L. Vieira, N.S. Silva, and A.C. Sene provided supervision. All authors discussed the results and contributed to the final manuscript.
Funding
The following Brazilian research agencies supported this work: São Paulo State Research Foundation (FAPESP, grant #11/50773-0), Coordenação de Aperfeiçoamento de Pessoal de Nível Superior (CAPES, Finance Code #001), and Conselho Nacional de Desenvolvimento Científico e Tecnológico (CNPq, grant #317253/2021-2).
Data Availability Statement
The data obtained in this study are available on request from the corresponding author.
Acknowledgments
The authors are grateful to INPE for use of the scanning electron microscope and the Raman system. We also thank IP&D/UNIVAP for provision of the PECVD facilities. The following Brazilian research agencies supported this work: São Paulo State Research Foundation (FAPESP, grant #11/50773-0), Coordenação de Aperfeiçoamento de Pessoal de Nível Superior (CAPES, Finance Code #001), and Conselho Nacional de Desenvolvimento Científico e Tecnológico (CNPq, grant #317253/2021-2).
Conflicts of Interest
The authors declare no conflict of interest.
References
- Azzi, M.; Paquette, M.; Szpunar, J. a.; Klemberg-Sapieha, J.E.; Martinu, L. Tribocorrosion Behaviour of DLC-Coated 316L Stainless Steel. Wear 2009, 267, 860–866. [Google Scholar] [CrossRef]
- Sayed-noor, A.S.; Sjödén, G.O. Severe Metallosis After Total Elbow Arthroplasty — A Case Report. 2010, 86–89. [Google Scholar] [CrossRef]
- Hayes, R.B. The Carcinogenicity of Metals in Humans. Cancer Causes Control 1997, 8, 371–385. [Google Scholar] [CrossRef] [PubMed]
- Niinomi, M. Mechanical Biocompatibilities of Titanium Alloys for Biomedical Applications. J. Mech. Behav. Biomed. Mater. 2008, 1, 30–42. [Google Scholar] [CrossRef] [PubMed]
- Rodrigues, L.B. Aplicações de Biomateriais Em Ortopedia. Estud. Tecnológicos em Eng. 2013, 9, 63–76. [Google Scholar] [CrossRef]
- Erdemir, A. Genesis of Superlow Friction and Wear in Diamondlike Carbon Films. Tribol. Int. 2004, 37, 1005–1012. [Google Scholar] [CrossRef]
- Van der Donck, T.; Muchlado, M.; Zein Eddine, W.; Achanta, S.; Carvalho, N.J.M.; Celis, J.-P. Effect of Hydrogen Content in A-C:H Coatings on Their Tribological Behaviour at Room Temperature up to 150 °C. Surf. Coatings Technol. 2009, 203, 3472–3479. [Google Scholar] [CrossRef]
- Ferrari, A.C.; Robertson, J. Raman Spectroscopy of Amorphous, Nanostructured, Diamond-like Carbon, and Nanodiamond. Philos. Trans. A. Math. Phys. Eng. Sci. 2004, 362, 2477–2512. [Google Scholar] [CrossRef]
- Robertson, J. Diamond-like Amorphous Carbon. 2002, 37, 129–281. [Google Scholar] [CrossRef]
- Casiraghi, C.; Ferrari, A.C.; Robertson, J. Raman Spectroscopy of Hydrogenated Amorphous Carbons. Phys. Rev. B 2005, 72, 1–14. [Google Scholar] [CrossRef]
- Macário, P.F.; Vieira, A.; Manfroi, L.; da Silva, M.G.P.; Leite, P.; Vieira, L. Corrosion Behavior of Al2024-T3, Al5052-H32, and Al6061-T6 Aluminum Alloys Coated with DLC Films in Aviation Fuel Medium, Jet A-1 and AVGAS 100LL. Mater. Corros. 2019, 70, 2278–2291. [Google Scholar] [CrossRef]
- Paula, L.O.; Sene, A.C.; Manfroi, L.A.; Vieira, A.A.; Ramos, M.A.R.; Fukumasu, N.K.; Radi, P.A.; Vieira, L. Tribo-Corrosion and Corrosion Behaviour of Titanium Alloys with and Without DLC Films Immersed in Synthetic Urine. J. Bio- Tribo-Corrosion 2018, 4, 51. [Google Scholar] [CrossRef]
- Ying, X.; Xu, X. CVD Diamond Thin Film for IR Optics and X-Ray Optics. Thin Solid Films 2000, 368, 297–299. [Google Scholar] [CrossRef]
- Burns, R.C.; Hansen, J.O.; Spits, R.A.; Sibanda, M.; Welbourn, C.M.; Welch, D.L. Growth of High Purity Large Synthetic Diamond Crystals. Diam. Relat. Mater. 1999, 8, 1433–1437. [Google Scholar] [CrossRef]
- Ribeiro, F.R.V. Estudo Do Comportamento Tribológico de Filmes DLC Dopados Com Ag. 2012, 55. [Google Scholar]
- Pedersen, H.; Larsson, P.; Aijaz, A.; Jensen, J.; Lundin, D. A Novel High-Power Pulse PECVD Method. Surf. Coatings Technol. 2012, 206, 4562–4566. [Google Scholar] [CrossRef]
- Mérel, P.; Tabbal, M.; Chaker, M.; Moisa, S.; Margot, J. Direct Evaluation of the Sp3content in Diamond-like-Carbon Films by XPS. Appl. Surf. Sci. 1998, 136, 105–110. [Google Scholar] [CrossRef]
- ASTM Astm G119-93. Wear Erosion, Met. Corros. 1994, 93, 1–7. [CrossRef]
- Leslie, N.; Mauzeroll, J. Spatially Resolved Electrochemical Measurements; Elsevier, 2023; ISBN 9780323856690.
- Oliver, W.C.; Pharr, G.M. An Improved Technique for Determining Hardness and Elastic Modulus Using Load and Displacement Sensing Indentation Experiments. J. Mater. Res. 1992, 7, 1564–1583. [Google Scholar] [CrossRef]
- R.J.GILLIES, N.DIDIER, M.D. Determination Og Cell Number in Monolayer Cultures. Anal. Biochem. 1986, 159, 109–113. [CrossRef]
- Vega-Avila, E.; Pugsley, M.K. An Overview of Colorimetric Assay Methods Used to Assess Survival or Proliferation of Mammalian Cells. Proc. West. Pharmacol. Soc 2011, 54, 10–14. [Google Scholar] [PubMed]
- Mosmann, T. Rapid Colorimetric Assay for Cellular Growth and Survival: Application to Proliferation and Cytotoxicity Assays. J. Immunol. Methods 1983, 65, 55–63. [Google Scholar] [CrossRef] [PubMed]
- Tian, Y.; Shen, L.; Gao, Y.; Yamauchi, T.; Shen, X.-M.; Ma, N. Comparison of 4′, 6′-Diamidino-2-Phenylindole and Giemsa Stainings in Preimplantation Mouse Embryos Micronucleus Assay Including a Triple Dose Study. Ind. Health 2007, 45, 343–347. [Google Scholar] [CrossRef] [PubMed]
- Carvalho, I.C.S.; Dutra, T.P.; De Andrade, D.P.; Balducci, I.; Pacheco-Soares, C.; da Rocha, R.F. High Doses of Alcohol during Pregnancy Cause DNA Damages in Osteoblasts of Newborns Rats. Birth Defects Res. Part A - Clin. Mol. Teratol. 2016, 106, 122–132. [Google Scholar] [CrossRef]
- Kirsch-Volders, M.; Sofuni, T.; Aardema, M.; Albertini, S.; Eastmond, D.; Fenech, M.; Ishidate, M.; Kirchner, S.; Lorge, E.; Morita, T.; et al. Report from the in Vitro Micronucleus Assay Working Group. Mutat. Res. - Genet. Toxicol. Environ. Mutagen. 2003, 540, 153–163. [Google Scholar] [CrossRef] [PubMed]
- C. Lasne, Z.W Gu, W. Venegas, I.C. The m Vitro Micronucleus Assay for Detection of Cytogenetic Effects Induced by Mutagen-Carcinogens: Comparison with the in Vitro Slster-Chromatid Exchange Assay. Mutat. Res. - Genet. Toxicol. Environ. Mutagen. 1984, 130, 273–283. [Google Scholar] [CrossRef]
- Fenech, M. Cytokinesis-Block Micronucleus Cytome Assay. Nat. Protoc. 2007, 2, 1084–1104. [Google Scholar] [CrossRef]
- Nersesyan, A.; Fenech, M.; Bolognesi, C.; Mišík, M.; Setayesh, T.; Wultsch, G.; Bonassi, S.; Thomas, P.; Knasmüller, S. Use of the Lymphocyte Cytokinesis-Block Micronucleus Assay in Occupational Biomonitoring of Genome Damage Caused by in Vivo Exposure to Chemical Genotoxins: Past, Present and Future. Mutat. Res. - Rev. Mutat. Res. 2016, 770, 1–11. [Google Scholar] [CrossRef]
- Ouyang, Y.; Cong, L.M.; Chen, L.; Liu, Q.X.; Fang, Y. Raman Study on Single-Walled Carbon Nanotubes and Multi-Walled Carbon Nanotubes with Different Laser Excitation Energies. Phys. E Low-Dimensional Syst. Nanostructures 2008, 40, 2386–2389. [Google Scholar] [CrossRef]
- Fontaine, J.; Donnet, C.; Erdemir, A. Fundamentals of the Tribology of DLC Coatings. Tribol. Diamond-Like Carbon Film. Fundam. Appl. 2018, 139–154. [Google Scholar] [CrossRef]
- Paik, N. Raman and XPS Studies of DLC Films Prepared by a Magnetron Sputter-Type Negative Ion Source. Surf. Coatings Technol. 2005, 200, 2170–2174. [Google Scholar] [CrossRef]
- Bradley, R.M.; Harper, J.M.E.; Smith, D.A. Theory of Thin-Film Orientation by Ion Bombardment during Deposition. J. Appl. Phys. 1986, 60, 4160–4164. [Google Scholar] [CrossRef]
- Ceramics, A. Standard Test Method for Adhesion Strength and Mechanical Failure Modes Of. ASTM Int. 2012, C1624-05, 1–29. [Google Scholar] [CrossRef]
- Donnet, C.; Erdemir, A. Tribology of Diamond-Like Carbon Films; ISBN 9780387302645.
- Çaha, I.; Alves, A.C.; Affonço, L.J.; Lisboa-Filho, P.N.; da Silva, J.H.D.; Rocha, L.A.; Pinto, A.M.P.; Toptan, F. Corrosion and Tribocorrosion Behaviour of Titanium Nitride Thin Films Grown on Titanium under Different Deposition Times. Surf. Coatings Technol. 2019, 374, 878–888. [Google Scholar] [CrossRef]
- Dailton Guedes de Oliveira Moraes, C.; Henrique Godoi, B.; Chaves Silva Carvalho, I.; Cristina Pinto, J.; Carvalho Rossato, R.; Soares da Silva, N.; Pacheco Soares, C. Genotoxic Effects of Photodynamic Therapy in Laryngeal Cancer Cells – An in Vitro Study. Exp. Biol. Med. 2019, 153537021982654. [Google Scholar] [CrossRef]
- Mattila, P.K.; Lappalainen, P. Filopodia: Molecular Architecture and Cellular Functions. Nat. Rev. Mol. Cell Biol. 2008, 9, 446–454. [Google Scholar] [CrossRef]
Figure 1.
Schematic illustration of the plasma-enhanced chemical vapor deposition (PECVD) system (a), and sample with DLC coating (b).
Figure 1.
Schematic illustration of the plasma-enhanced chemical vapor deposition (PECVD) system (a), and sample with DLC coating (b).
Figure 2.
Schematic illustration of the distribution of the wells for the mitochondrial activity (MTT) analysis.
Figure 2.
Schematic illustration of the distribution of the wells for the mitochondrial activity (MTT) analysis.
Figure 3.
Raman spectra of the DLC coatings deposited on the SS316L (a) and Ti6Al4V (b) substrates. The original D and G bands were fitted by the red and green lines, respectively. The positions at 1350 and 1580 cm-1 correspond to the original D and G band centers.
Figure 3.
Raman spectra of the DLC coatings deposited on the SS316L (a) and Ti6Al4V (b) substrates. The original D and G bands were fitted by the red and green lines, respectively. The positions at 1350 and 1580 cm-1 correspond to the original D and G band centers.
Figure 4.
XPS plots for DLC coatings deposited on the SS316L (a) and Ti6Al4V (b) substrates.
Figure 4.
XPS plots for DLC coatings deposited on the SS316L (a) and Ti6Al4V (b) substrates.
Figure 5.
Measurement of the thicknesses of the DLC coatings on the SS316L and Ti6Al4V substrates.
Figure 5.
Measurement of the thicknesses of the DLC coatings on the SS316L and Ti6Al4V substrates.
Figure 6.
(a) Ti6Al4V+DLC profile, (b) Roughness analysis of the DLC coatings deposited on the SS316L and Ti6Al4V substrates: (a-b) SS316L substrate with and without DLC coating; (c-d) Ti6Al4V substrate with and without DLC coating. The colors indicate the peaks and valleys on the surface (the dimensions are shown in the color bar on the left side of the images).
Figure 7.
Results for scratch testing of the DLC coatings deposited by PECVD on Ti6Al4V and SS316L, indicating the first critical load (Lc1) values. Images of the tracks are shown above the scratch plots. The second critical load (Lc2) was not reached for either sample. COF: coefficient of friction; Fz: normal force.
Figure 8.
Results of friction testing of the different materials: (a) SS316L and SS316L+DLC; (b) Ti6Al4V and Ti6Al4V+DLC.
Figure 8.
Results of friction testing of the different materials: (a) SS316L and SS316L+DLC; (b) Ti6Al4V and Ti6Al4V+DLC.
Figure 9.
Evolution of friction coefficient and open circuit potential (OCP vs. Ag/AgCl) before, during, and after the tribocorrosion tests using the bare and DLC-coated SS316L and Ti6Al4V substrates in Ringer’s solution.
Figure 9.
Evolution of friction coefficient and open circuit potential (OCP vs. Ag/AgCl) before, during, and after the tribocorrosion tests using the bare and DLC-coated SS316L and Ti6Al4V substrates in Ringer’s solution.
Figure 10.
Results of the crystal violet cell viability assays with exposure of cells to the Ti6Al4V and SS316L samples with and without DLC coatings.
Figure 10.
Results of the crystal violet cell viability assays with exposure of cells to the Ti6Al4V and SS316L samples with and without DLC coatings.
Figure 11.
Results of the mitochondrial activity assays after exposure of the cells to the Ti6Al4V and SS316L samples, with and without DLC coatings, for periods of 24 and 48 h.
Figure 11.
Results of the mitochondrial activity assays after exposure of the cells to the Ti6Al4V and SS316L samples, with and without DLC coatings, for periods of 24 and 48 h.
Figure 12.
Results of the micronucleus assays after exposure of the cells to the Ti6Al4V and SS316L samples, with and without DLC coatings, for periods of 24 and 48 h.
Figure 12.
Results of the micronucleus assays after exposure of the cells to the Ti6Al4V and SS316L samples, with and without DLC coatings, for periods of 24 and 48 h.
Figure 13.
SEM images of L929 cells on (a) Ti6Al4V, (b)Ti6Al4V+DLC, (c) SS316L, and (d) SS316L+DLC. All the images are at 3,000× magnification. The arrows in yellow and arrowheads in red are indicating filopodia and lamellipodia, respectively.
Figure 13.
SEM images of L929 cells on (a) Ti6Al4V, (b)Ti6Al4V+DLC, (c) SS316L, and (d) SS316L+DLC. All the images are at 3,000× magnification. The arrows in yellow and arrowheads in red are indicating filopodia and lamellipodia, respectively.
Table 1.
Chemical compositions of SS316L and Ti6Al4V.
Table 1.
Chemical compositions of SS316L and Ti6Al4V.
Table 2.
Stages and setup for production of the DLC coatings.
Table 2.
Stages and setup for production of the DLC coatings.
Table 3.
Components of Ringer’s lactate* solution.
Table 3.
Components of Ringer’s lactate* solution.
Table 4.
Results of hardness testing of the SS316L and Ti6Al4V substrates and the corresponding DLC coatings.
Table 4.
Results of hardness testing of the SS316L and Ti6Al4V substrates and the corresponding DLC coatings.
|
Disclaimer/Publisher’s Note: The statements, opinions and data contained in all publications are solely those of the individual author(s) and contributor(s) and not of MDPI and/or the editor(s). MDPI and/or the editor(s) disclaim responsibility for any injury to people or property resulting from any ideas, methods, instructions or products referred to in the content. |
© 2024 by the authors. Licensee MDPI, Basel, Switzerland. This article is an open access article distributed under the terms and conditions of the Creative Commons Attribution (CC BY) license (https://creativecommons.org/licenses/by/4.0/).
