Preprint
Article

A Design of Tree Micro Drill Instrument to Improve the Accuracy of Wood Density Measurement

Altmetrics

Downloads

138

Views

44

Comments

0

Submitted:

29 May 2023

Posted:

30 May 2023

You are already at the latest version

Alerts
Abstract
To improve the measurement accuracy of wood density and study the linear correlation between the drill feed resistance and wood density, a new micro drill instrument that can can simultaneously measure the rotation resistance and feed resistance of the drill needle was designed. The test wood samples included hardwood, softwood and conifer. The absolute dry density of each wood sample was measured. The drill resistance data was tested by using self-developed micro drill instrument and Resistogaph 650-SC. 4 linear models between drill resistance and the absolute dry density of wood . The results showed that: the statistical indicators of each model of the self-made micro drill resistance in-strument were better than the corresponding indicators of Resistogaph 650-SC; the coefficient of determination of the linear regression model between the feed resistance of the self-made micro drill resistance instrument and the absolute dry density of wood was 0.946; the statistical indicators of model including rotation resistance and feed resistance, were better than those of the model only including rotation resistance. Therefor, the design proposed in the article is reasonable, and increasing the feed resistance can improve the measurement accuracy of the micro drill resistance instrument for measuring wood density.
Keywords: 
Subject: Engineering  -   Control and Systems Engineering

1. Introduction

The micro drill resistance instrument is a mechanical drill system that measures the drill resistance profile as a rotating drill is driven into wood at a constant speed [1,2]. The first prototype of the micro drill resistance instrument was developed by Kamm and Voss in 1984 employing a spring-loaded recording mechanism [1]. These mechanically recorded profiles had been shown as being non-reproducible and unreliable. A study conducted at Hohenheim University and Environmental Physics Institute of Heidelberg University made a breakthrough in the drill resistance concept and found that electronic recording of the motor power consumption could achieve much more repeated and reliable resistance profiles than the spring-loaded recording mechanism. Originally, the power consumption of both motors, one for controlling feed speed and the other for controlling rotation speed of the drill, was measured individually while the drill was going forward and backward. So, 4 profiles were recorded per measurement. Detailed analysis showed the power consumption of the feed motor while pulling the drill forward and both motors while pulling the drill backward didn’t contain significant additional information [1]. Therefore, drill resistance usually measured the power consumption of the rotation motor. After thousands of tests, a shaft diameter of 1.5 mm and a 3-mm-wide tip was found to be a good compromise between minimizing damage and maximizing information in the profiles [1,2,3,4]. With those breakthroughs, some thousands drilling instruments were sold in worldwide. At present, several machine types of resistance drills are available from different manufacturers, such as Sibtec(DDD,DDD2000), GPA(XDG400,D400), TEREDO (1,2,3),IML(R1280/1410,M300/400/500,F300/400/500,E300/400/500,and B400), and Rinntech (R2350, R3450,R4450/S, R5450/S, R650/PR/EA/ED/SC)[1,2,3]. These instruments vary significantly in size, weight, resolution and precision. Only a few of these resistance drills that can reveal tree-ring density variations and incipient decay in contrast to soft intact wood are allowed to be labeled with the internationally registered trademark ”Resistograph”[4].
A significant amount of research has been done to explore the use of the micro drill resistance instrument for various application such as tree-ring analysis[2,5,6,7], tree age[3,8], wood density measurement [9,10,11,12,13], tree decay detection[14]and structural timber condition assessment[15]. Rinn et al. demonstrated that Resistograph profiles of coniferous and deciduous wood can reveal density variations inside tree rings caused by earlywood and latewood. They even found the narrow ring caused by the extremely dry summer of 1976 from the resistance profile of Norway spruce(P. abies)[2]. Szewczyk et al. measured the ages of 15 pine trees (Pinus sylvestris L.), 15 oak trees(Quercus robur L.) and 15 birch trees( Betula pendula ROTH.) using IML-Resi E400 and increment corer, respectively. The tree ages measured by IML-Resi E400 underestimated the ages measured by increment corer. The mean bias error values were -6.5,-2.5 and -6.0 years for pine, oak, and birch, respectively. The results showed that IML-Resi E400enables a quick, although approximate, tree age assessment[3]. Isik et al. measured the density of fourteen full-sub families of loblolly pine (Pinus taeda L.) at four sites by increment corer and resistance profiles by Resistograph. Drill resistance had weak (0.29) to moderate (0.65) phenotypic correlations with density on an individual-tree basis over the four sites. The family mean correlation between the two measurements was much stronger(0.92). The results suggest that Resistograph is a reliable and efficient instrument to assess relative wood density of living trees for selection in tree improvement programs [16]. Downes et al. tested the density of approximately 2000 eucalypts trees ( mainly Eucalptus globulus but some E. nitens) at seven studies by increment corer and resistance profiles by IML PD400. Within individual studies the relationship between mean Resi values and core basic density was strong(R2 from 0.662 to 0.868). The results shown that the IML PD400 is an accurate and quick infield tool for estimating wood density in standing trees [11].
Although electronic micro drill resistance instruments have been around for over 30 years[17], they have not yet been widely used in forestry production. The main reason is that the measurement accuracy of the micro drill resistance instrument is still lower than that of the increment corer. For example, Isik et al. found that drill resistance had weak (0.29) to moderate (0.65) phenotypic correlations with density on an individual-tree[16], Guller et al. found that there was still a significant difference between the ring width measured by the micro drill resistance instrument and the ring width measured by the increment corer [5]. In order to further improve the measurement accuracy of the micro drill resistance instrument, Academician Shouzheng Tang of the Chinese Academy of Sciences guided us to study the principle and application of the micro drill resistance instrument in 2017. Although we started relatively late, we have still achieved some important results, which have played a certain promoting role in the development and application of the micro drill resistance instrument[6,7,18,19,20,21,22,23,24,25,26,27,28]. The micro drilling resistance instrument we developed in the early stage used a ball screw as the transmission component [6,7,18,19,20,21,22,23,24]. Due to the weight of the ball screw, the entire instrument was relatively heavy. Affected by Rinn’s research results, we only recorded the rotation resistance of the drill. However, during the use of the micro drill resistance instrument, it was found that the operator’s thrust on the instrument during the drill penetrating into the wood is positively correlated with the wood density. Therefore, it is necessary to further study the correlation between drill feed resistance and wood density. The study improved the self-developed micro drill resistance instrument in the early stage by using belt transmission instead of screw transmission. Two DC motors are used to control the rotation speed and feed speed of the drill. One DC motor controls the rotation speed of the drill needle, called a "rotating motor"; Another DC motor controls the feed speed of the drilling needle, called the "feed motor". The rotation resistance and feed resistance of the drill were both recorded. Using only rotation resistance as the independent variable, only feed resistance as the independent variable, and simultaneously rotation resistance and feed resistance as the independent variables, using wood absolute dry density as the dependent variable, we established linear models between rotation resistance and wood density, between feed resistance and wood density, between rotation resistance , feed resistance and wood absolute dry density. According to the determination coefficients and measurement accuracy of the three linear models, we investigate the correlation between drill feed resistance and wood density, and whether feed resistance has a significant impact on measuring wood density. To verify the feasibility of the design proposed in the article, we compared the measurement accuracy of the self-made micro drill with that of the Resistograph 650-SC.

2. Materials and Methods

2.1. Instrument

2.1.1. Self-made micro drill resistance instrument

The micro drill instrument we proposed in the early stage adopted a threaded screw transmission method. Although the transmission accuracy of threaded screw is high, the overall weight of the micro drilling instrument is very heavy due to the 4kg weight of the threaded screw transmission system, making it inconvenient to operate. In order to reduce the weight of the micro drill, the paper used the timing belt transmission mode to control the drill feed movement (Figure 1).
The drill needle is connected to the rotation motor shaft through the drill needle clamp, so the rotation speed of the drill needle is the same as that of the rotation motor. The feed motor shaft is connected with the reduction gear shaft, the reduction gear shaft is connected with the timing belt driving wheel shaft. The reduction gear ratio is 1:1000, that is, when the feed motor rotates every 1000 revolutions, the driving wheel of the timing belt rotates 1 revolution. The slot on the timing belt driving wheel and the slot on the driven wheel mesh with the rack on the inside of the timing belt. The two ends of the timing belt are fixed on the rotation motor base, the rotation motor base is fixed on the ball slide, the ball slide is installed on the plastic slide, and the ball slide can do reciprocating linear movement on the plastic slide. When the feed motor rotates in the clockwise direction, the reduction gear drives the timing belt to rotate in the clockwise direction, thus pushing the rotation motor seat and the drill needle forward; When the feed motor rotates in the counterclockwise direction, the reduction gear drives the timing belt to rotate counterclockwise, thus pushing the rotation motor base and the drill needle to move backward.
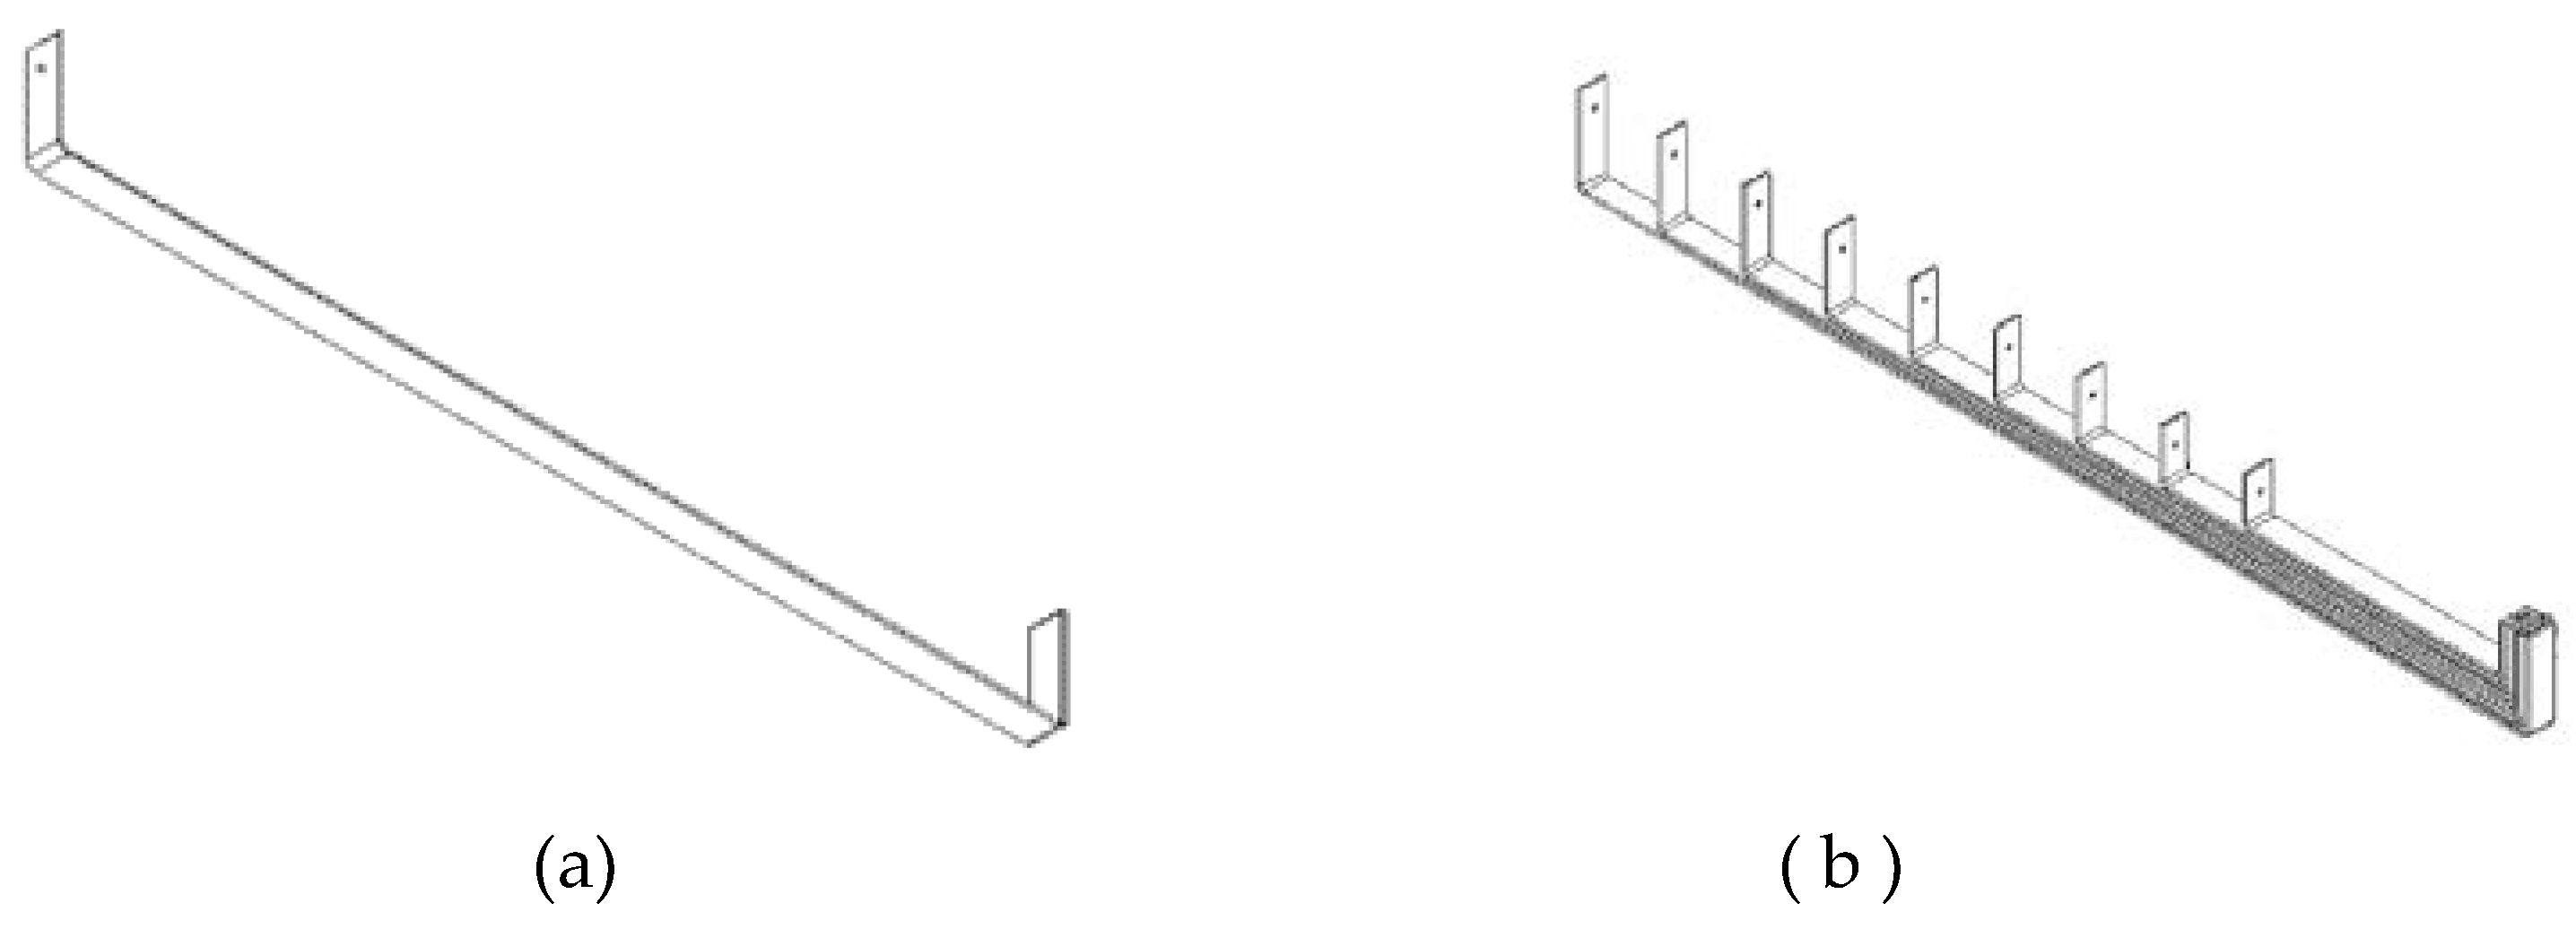
Because the drill needle is thin and long, it is prone to bending when drilling into trees. In order to reduce the bending degree of the drill needle, it is necessary to design a support plate for the drill needle (Figure 2).
The drilling needle passes through a small hole in the middle of the vertical support plate at the front of the drilling needle support plate. The support plate is installed in the support plate groove, and the support plate can perform linear reciprocating motion in the support plate groove. When the rotation motor seat is at the starting position, the vertical support plates at the end of the drilling needle support plate are stacked together, while the vertical support plates at the front of the drilling needle support plate are evenly distributed on the drilling needle shaft. When the rotation motor seat moves forward, the forward pushing component of the support plate pushes the vertical support plate at the front of the drilling needle support plate, thereby pushing the drilling needle support plate forward. The vertical support plates at the front of the drilling needle support plate are gradually overlapped. When the rotation motor base moves to the forefront of the plastic slide, all the vertical support plates at the front of the drill needle support plate are stacked together, and the vertical support plates at the end of the drill needle support plate are evenly distributed in the support plate groove. When the rotation motor seat moves backward, backward push element pushes the vertical support plate at the end of the drill needle support plate, causing the drill needle support plate to move back.
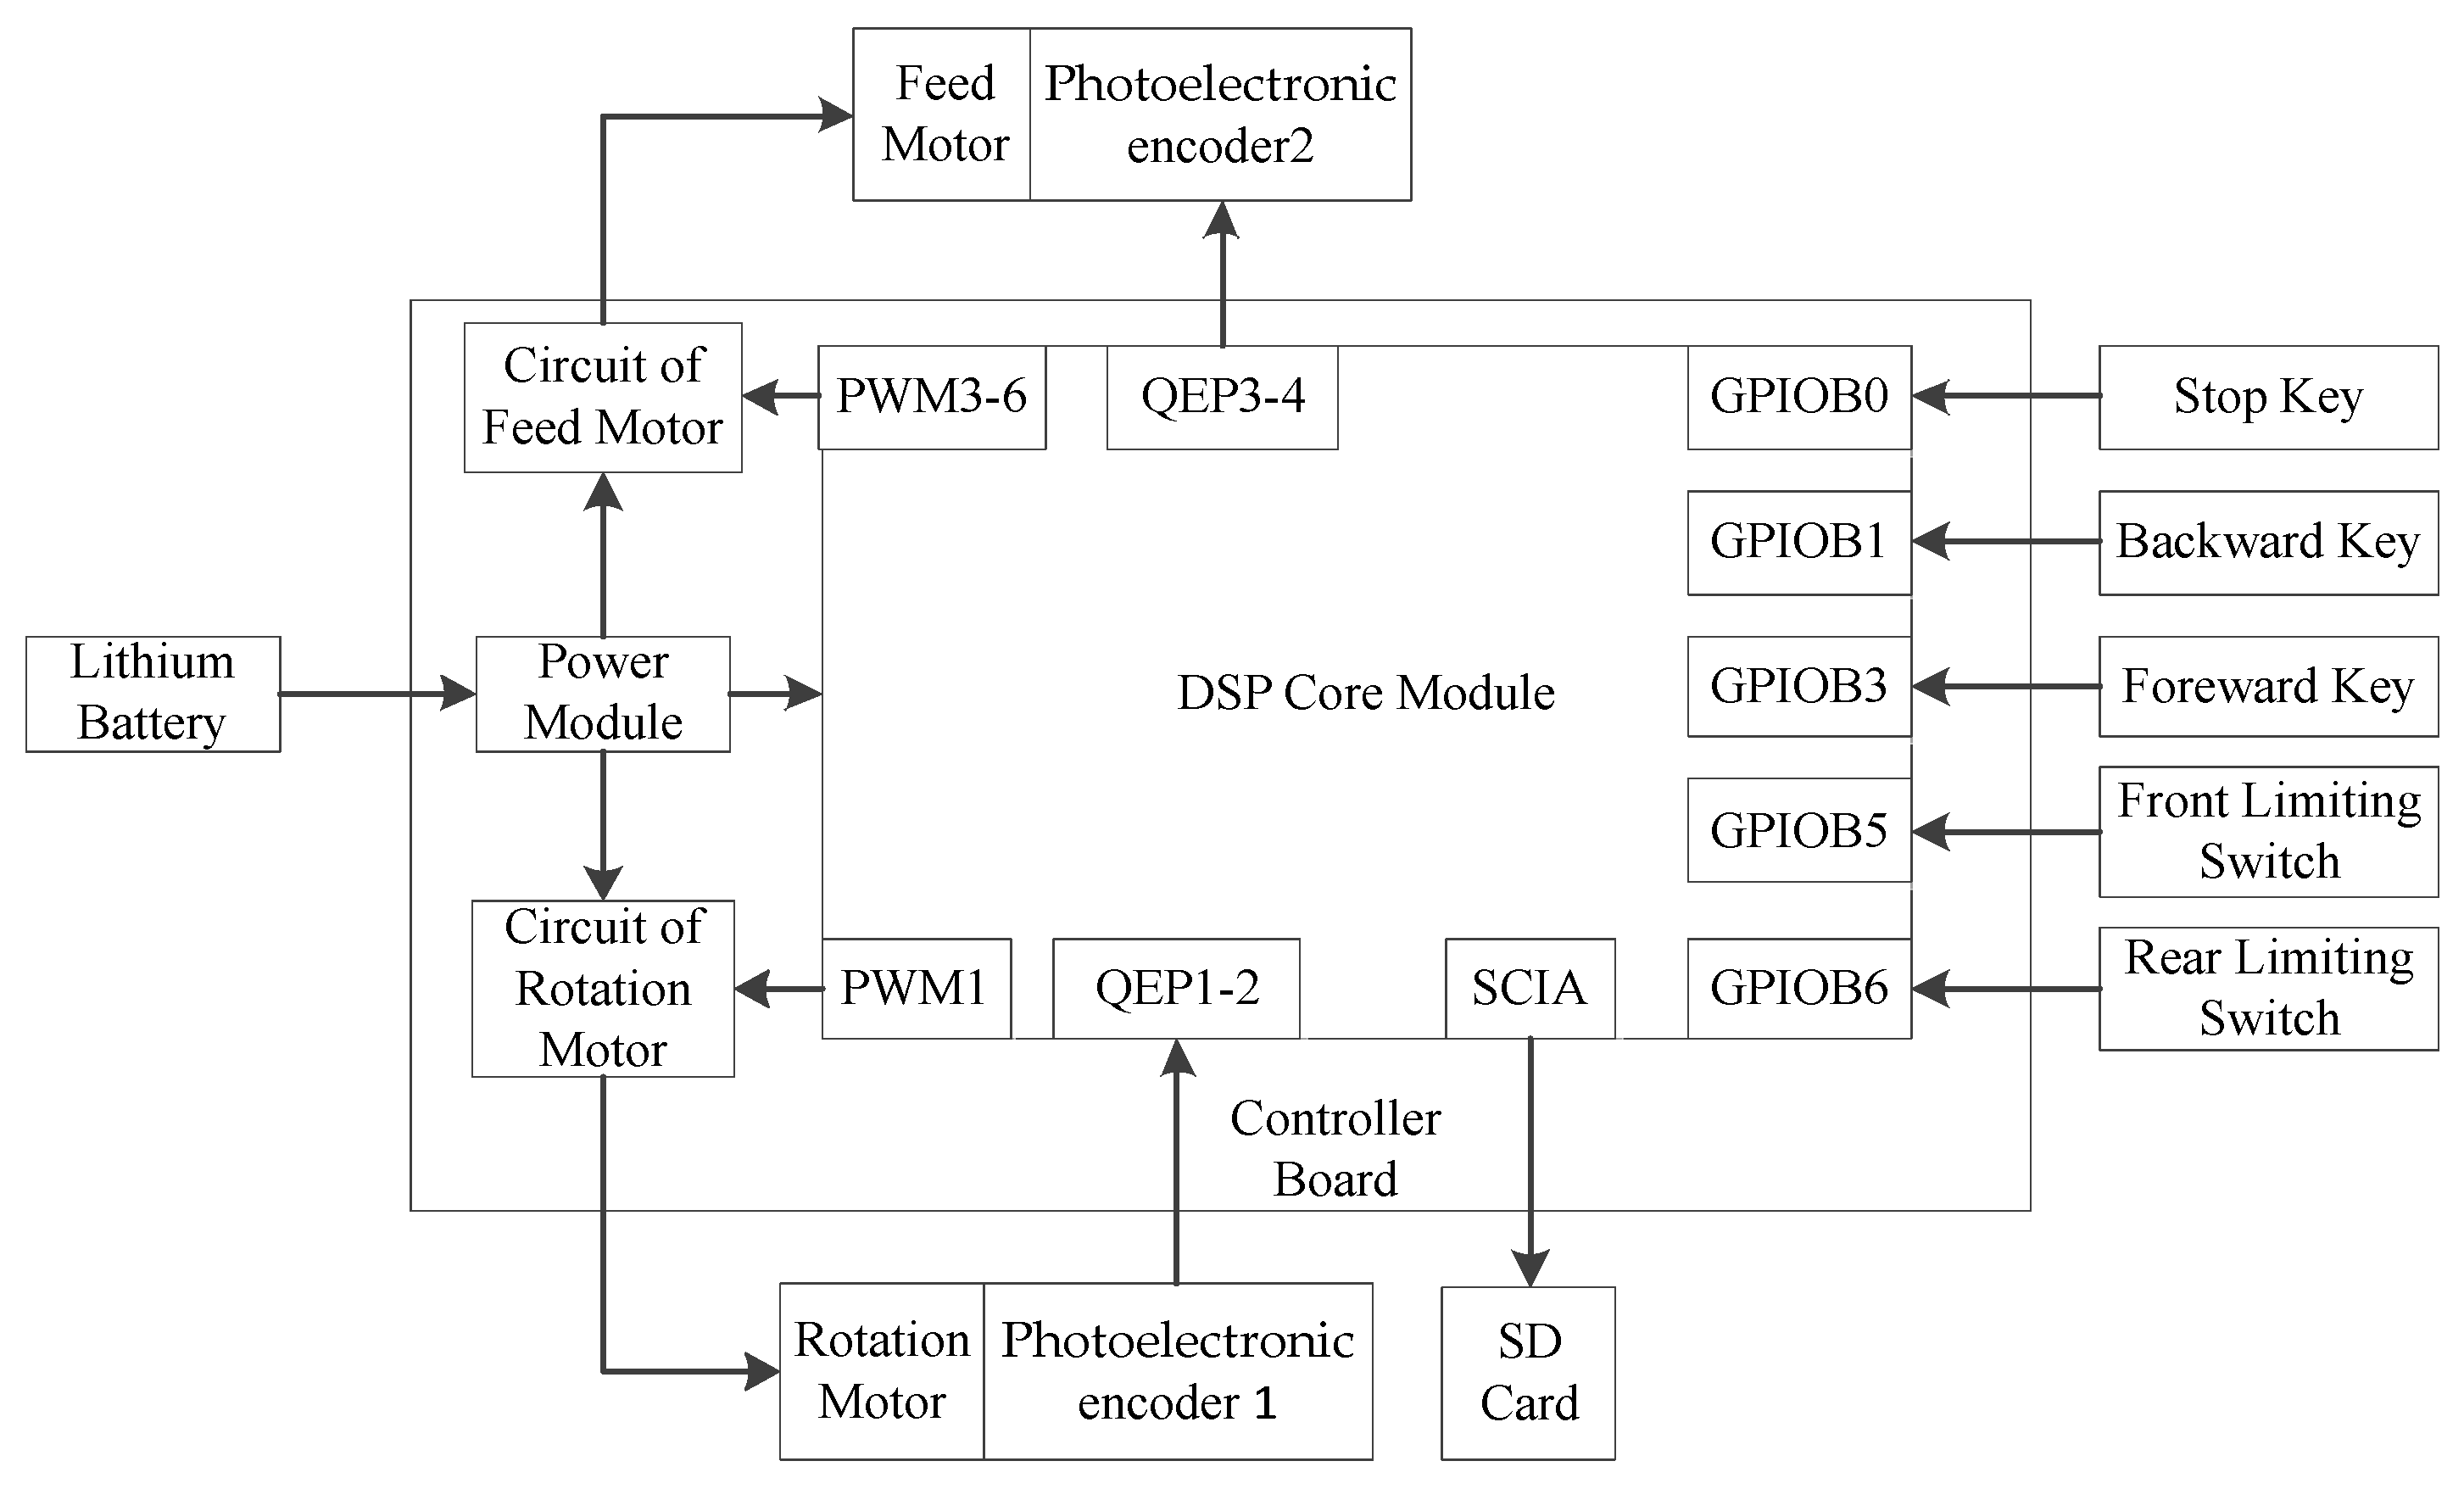
The micro drill controller is responsible for the switch control, speed control, resistance conversion and storage of the rotation motor and feed motor, as well as the drill resistance. The controller hardware includes a DSP (Digital Signal Processing) core module[29], a rotation motor control module, a feed motor control module, and a switch control module. The control system structure is shown in Figure 3.
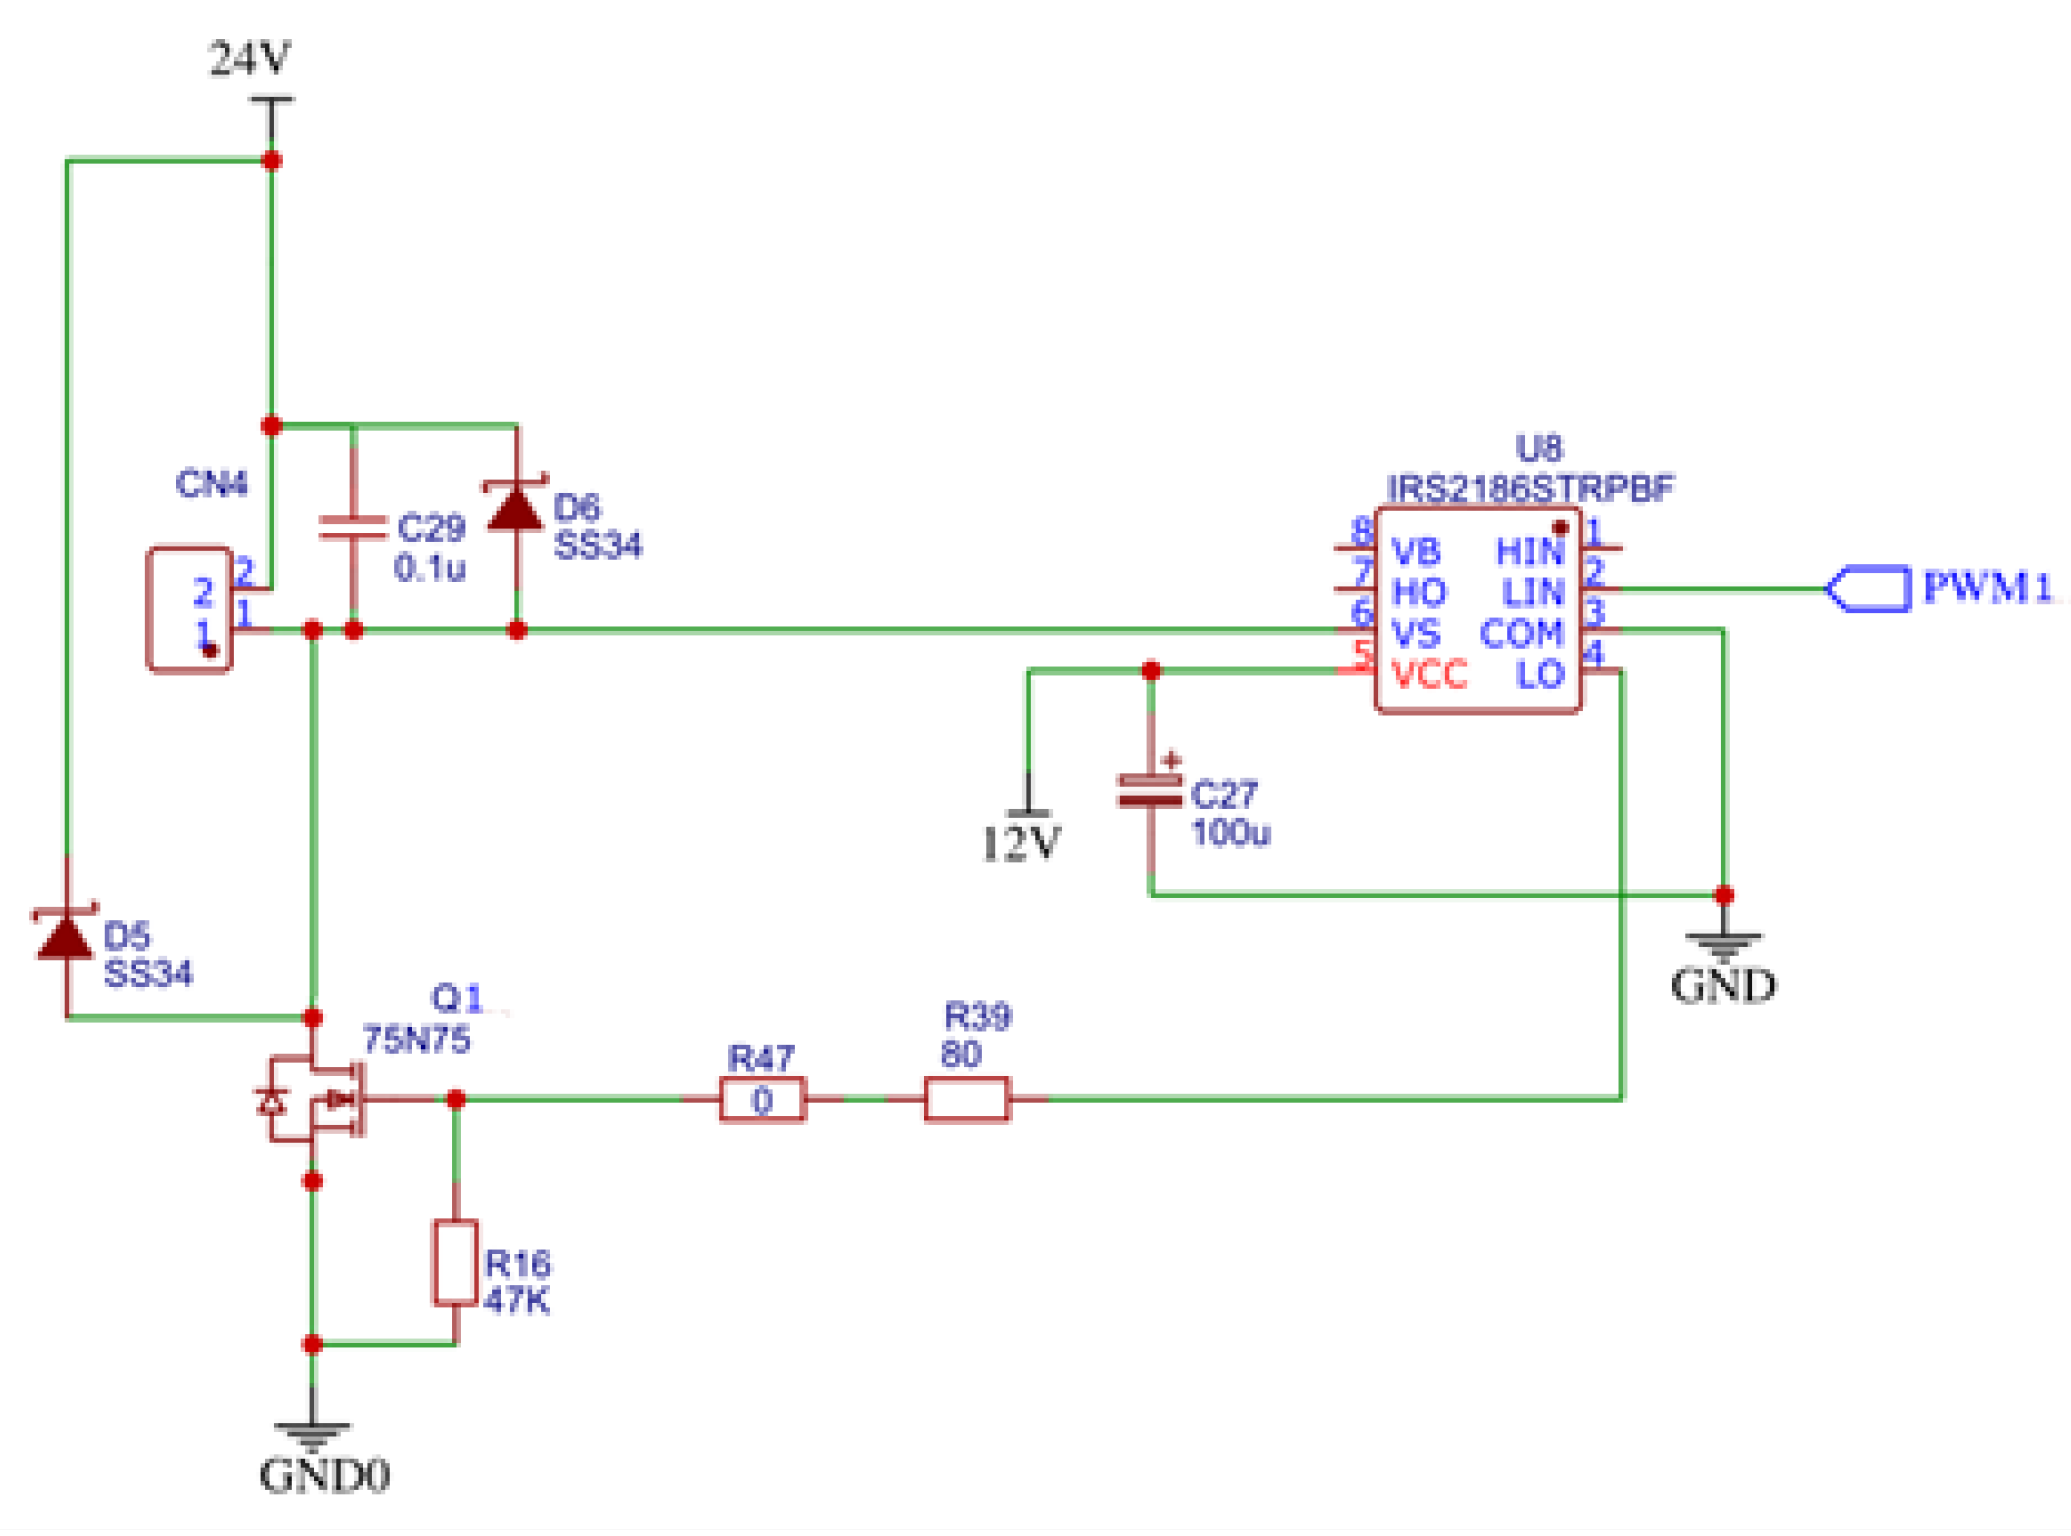
Due to the symmetrical shape of the drill needle, the rotation direction of the drill needle has little effect on the resistance of the drill needle. Therefore, the rotating motor does not need to control the rotation direction of the drill needle. In order to reduce the volume of the controller, the rotating motor is controlled by only one MOS (Metal Oxide Semiconductor) transistor[30], as shown in Figure 4.
The rotation motor is connected to terminal CN4. When the PWM1 pin of the DSP outputs high voltage, the MOS conducts and the rotation motor starts; When the PWM1 pin outputs low voltage, the MOS is cut off and the rotation motor stops. The A and B pins of photoelectronic encoder 1 are respectively connected to the QEP1 and QEP1 pins of the DSP. So, the number of pulses sent by photoelectronic encoder 1 is recorded by the DSP’s universal timer T2.
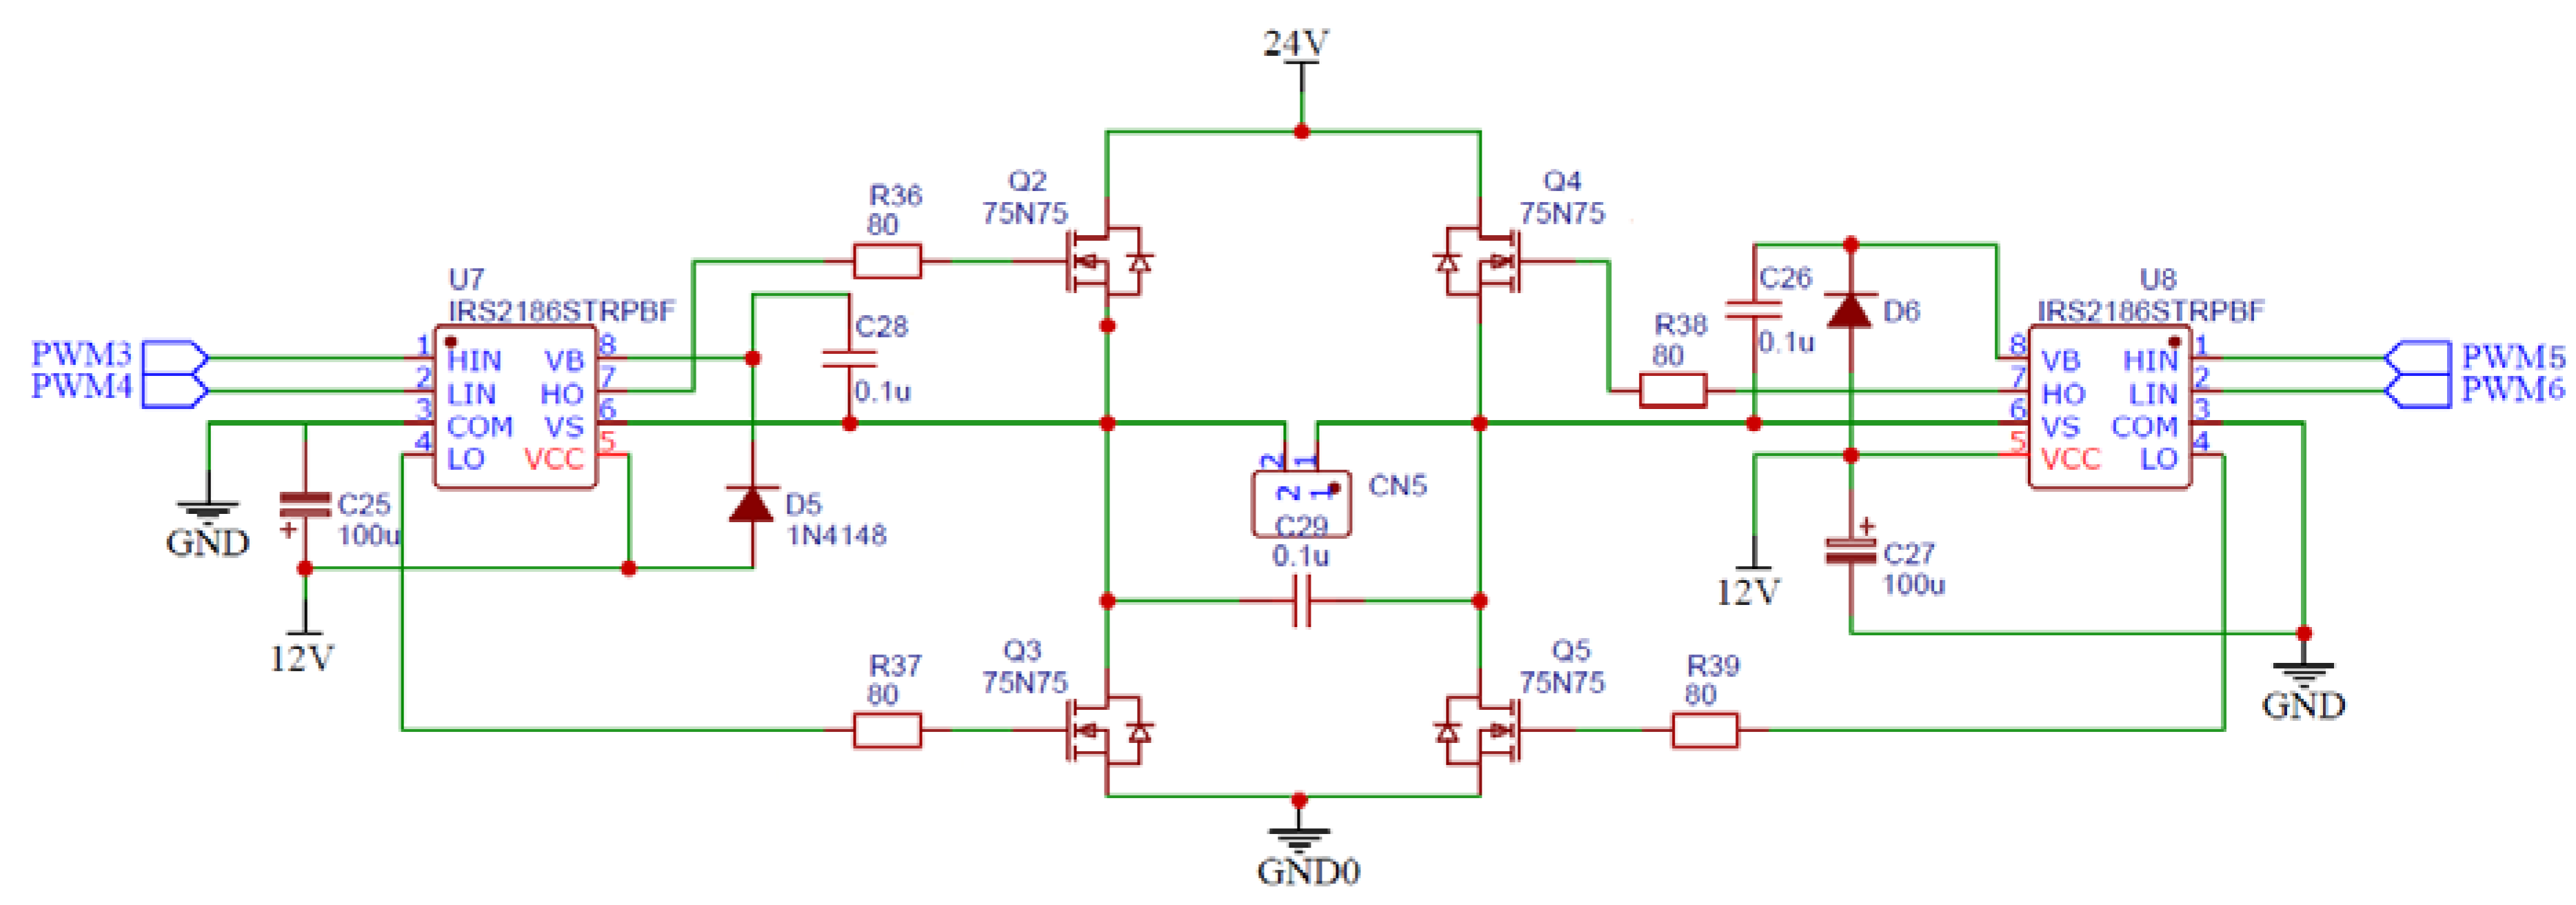
Due to the need for forward and backward movement of the drilling needle, it is necessary to control the rotation direction of the feed motor. The feed motor driving circuit adopts an H-bridge driving circuit [31], which is mainly composed of four MOS transistors. The specific circuit schematic is shown in Figure 5.
The gates of the 4 MOS transistors are respectively controlled by the DSP processors PWM3~PWM6 pins. When the PWM3 and PWM6 pins output a high level, meanwhile the PWM4 and PWM5 pins output a low level, the MOS tubes Q2 and Q5 conduct, while Q3 and Q4 cut off. The feed motor rotates counterclockwise and the drill needle advances. When the PWM4 and PWM5 pins output a high level, meanwhile the PWM3 and PWM6 pins output a low level, the MOS tubes Q3 and Q4 conduct, Q2 and Q5 cut off, and the feed motor rotates clockwise, causing the drill needle to retreat. The pins A and B of photoelectronic encoder 2 are connected to the QEP3 and QEP 4 pins of the DSP, respectively, So, the number of pulses sent by photoelectronic encoder 2 is recorded by the DSP’s universal timer T4.
The switch control module mainly includes button switches and limiting switches. The button switch controls the drilling needle status of the micro drill resistance instrument, with two buttons for forward and backward movement. Limiting switch is a device that limits the movement of the screw slide within the movable range, preventing the screw slide from exceeding the movable range and damaging the equipment. There are two limiting switches: front limiting switch and rear limiting switch. When the front limiting switch is in an invalid state and the forward key is pressed, the drill needle is set to be forward state. The DSP controls the rotation motor rotating, and simultaneously controls the feed motor rotating in a counterclockwise direction. So, the drill needle moves forward. When the rear limiting switch is in an invalid state and the back button is pressed, the drill needle is set to be backward state. The DSP controls the rotation motor rotating, and controls feed motor rotating in a clockwise direction. So, the drill needle moves backward. When the drilling needle is in the forward state, if the front limiting switch becomes effective or the stop key is pressed, the drilling needle will become in the stopped state; When the drill needle is in a backward state, if the rear limiting switch becomes effective or the stop key is pressed, the drill needle will become in a stopped state.
The controller program of the micro drill resistance instrument is divided into the main program design and the timer T3 interrupt processing program design. In the main program, first call the DSP initialization module, then activate the timer T3 interrupt, and finally loop the switch control module. In the timer T3 interrupt processing program, the feed motor speed control module, rotating motor speed control module and drill needle resistance conversion and storage module are called to complete the speed control of two DC motors and drill resistance conversion processing.
The digital I/O pins of the TMS320FS128 series DSP are mostly multifunctional multiplexing pins, which can be set as universal I/O functions or as peripheral control signal functions through the function selection control register GPxMUX (x is the group number of the DSP pin). If it is set as a universal I/O function, it is also necessary to set the pin direction through the direction control register GPxDIR. According to the pin connections in Figure 1, the pins were set the corresponding functions.
The universal timer T1 was used to control the PWM signal frequency of two DC motors. In order to periodically generate PWM control signals, timer T1 in the design was set to a continuous increasing counting mode. The counting register T1CNT starts counting from 0. After each clock cycle T1CLK, the value of T1CNT increases by 1. When the value of T1CNT equals the value of cycle register T1PR, the value of T1CNT automatically resets to 0, and then the above process is repeated. Therefore, the cycle TPWM of the PWM signal is:
T P W M = ( T 1 P R + 1 ) × T 1 C L K
The frequency of PWM signal has a significant impact on the operating characteristics of DC motors. When the PWM signal frequency is too low, the motor speed is unstable, and the motor vibration is large. When the PWM signal frequency is too high, the inductance of the armature coil of the DC motor is large, the armature current is small, the output torque of the DC motor is small, and the load capacity is poor. After extensive experiments, when the PWM frequency of this design was set to 10KHz, the motor speed run smoothly, the motor vibration was small, and the motor had good load carrying capacity. Therefore, the PWM period TPWM=0.1ms. In this design, the clock signal of timer T1 is selected as the internal clock HSPCL=75MHz, and the clock pre-scale factor is set to 1. Therefore, the counting clock period T1CLK of timer T1 is 0.0133 μ s and the register of T1PR was set 7499.
The behavior control register ACTRA of the event manager EVA controls the level status of the PWM1~PWM6 pins. According to the function of PWM1~PWM6 pins, the ACTRA register was set. The 3 full comparison registers CMPR1~CMPR3 control the duty cycle of three channels of PWM signals, respectively. The formula for calculating the duty cycle is:
D i = CMPR i / ( T 1 PR + 1 )
where Di is the duty cycle of the i-th channel PWM signal, CMPRi is the value of the full comparison register of the i-th channel.
Register CMPR1 controls the duty cycle D1 of the rotation motor, register CMPR2 controls the duty cycle D2 of the feed motor when the drill moves forward, and register CMPR3 controls the duty cycle D3 of the feed motor when the drill moves backward. The initial values of these three registers are all 0.
The universal timers T2 and T4 are used to record the pulses of the rotation motor encoder and the feed motor encoder, respectively. Both timers T2 and T4 were set with directional increase/decrease mode, and the clock source is set to the QEP circuit. The universal timer T3 was used to generate an interrupt signal, generating an interrupt request signal every 1ms. The sampling period was set to 1ms, the clock signal of timer T3 selects internal clock HSPCL is 75MHz, the clock pre-scale factor was set to 128, the timer was set to increase count mode, and the cycle register T3PR of timer T3 was set to 584.
After the DSP initialization is completed, the DSP takes turns querying the button status and limit switch status, and sets the control status of the drill needle based on the button status and limiting switch status.
The timer T3 interrupt processing program is responsible for controlling the rotation speed of the rotation motor and feed motor, as well as converting and storing the resistance of the drill needle. When the drilling needle is in a forward or backward state, the rotation motor speed control module and the feed motor speed control module are called separately.
The speed control module of rotation motor calculates the real-time speed of the rotation motor based on the count value N2 of timer T2. In the design, the encoder grating disk of the rotation motor has 1024 gratings. For each revolution of the rotation motor, the A and B pulse signals of the optoelectrical encoder 1 send 1024 pulses to the DSP respectively. The DSP counts both the rising and falling edges of the encoder’s two pulse signals A and B. Therefore, for every revolution of the rotation motor, the count value N2 of timer T2 is 4096. The sampling period was set to 1ms, the formula for calculating the rotational speed of the rotating motor is:
n 1 = 60 N 2 / ( 4096 × 1 × 10 3 )
where n1 is the real-time speed of the rotation motor, measured in r/min.
The speed control module of rotation motor uses PID control algorithm[32,33,34] to calculate the value of the duty cycle register CMPR1 based on the set speed value n0 (r/min) and real-time speed n1.
The speed control module of feed motor calculates the real-time speed of the rotation motor based on the count value N4 of timer T4. In the design, the encoder grating disk of the feed motor has 1000 gratings. For each revolution of the rotation motor, the A and B pulse signals of the optoelectrical encoder 2 send 1000 pulses to the DSP respectively. The DSP counts both the rising and falling edges of the encoder’s two pulse signals A and B. Therefore, for every revolution of the feed motor, the count value N4 of timer T4 is 4000. The sampling period was set to 1ms, the formula for calculating the rotational speed of the rotating motor is:
n 2 = 60 N 4 / ( 4000 × 1 × 10 3 )
where n2 is the real-time speed of the feed motor, measured in r/min.
In this design, the reduction ratio k of the reduction gear is 1:1000, the diameter d of the driving wheel of the timing belt is 3 cm, that is, every 1000 r of the feed motor, the driving wheel of the timing belt rotates 1 r, the drill needle moves forward or backward 3 π cm. Therefore, the formula for calculating the feed speed of the drilling needle is:
v = d k n 2 π
where v is the real-time speed of the drill, measured in cm/min.
The speed control module of feed motor uses PID control algorithm to calculate the value of the duty cycle register CMPR2 or CMPR3 based on the set speed value v0 (cm/min) and real-time speed v.
When the drill needle is in a forward state, it is necessary to call the drill needle resistance conversion and storage module to save the drill needle resistance value. The resistance in the rotation direction of drilling needle is directly proportional to the control voltage of the rotation motor and inversely proportional to the speed of the rotation motor. Therefore, the resistance in the rotation direction of drilling needle can be indirectly represented by the control voltage of the rotation motor after speed correction. The calculation formula is:
f 1 = U D 1 n 0 / n 1
where f1 is the rotation resistance of the drill, measured in V; U is the power voltage, measured in V.
Similarly, the calculation formula for the feed resistance of the drill needle is:
f 2 = U D 2 v 0 / v
where f2 is the feed resistance of the drill, measured in V.
After the conversion of drill needle resistance is completed, the SCI serial port sending function is used to send resistance f1 and f2 to the SD card.
After extensive test, when n0 is set to 3500 r/min and v0 is set to 20 cm/min, the of the self-made micro drill resistance instrument operates normally.

2.1.2. Resistograph 650-SC

Resistograph 650-SC is a micro drilling resistance instrument produced by Rinntech in Germany, which is a real Resistograph. The feed speed of the drill of Resistograph 650-SC is 60cm/min, and the rotation speed of the drill is unknown. The distance between resistance sampling points is 0.001cm. Resistograph 650-SC only records the rotation resistance of the drill needle, expressed in "resi", but the specific representation method is unknown.

2.2. Materials

The experimental materials were 6 windblown fallen trunk trees sampled from a natural secondary forest on the campus of Xinyang Normal University in November 2022, including 2 pine trees (Pinus massoniana), 2 oak trees (Quercus acutissima), 1 paulownia tree (Paulownias fortune), and 1 poplar tree (Populus tomentosa). The experimental tree species included hard broad-leaved trees, coniferous trees, and soft broad-leaved trees.
Select a straight and flawless trunk near the tree heights of 1.3m, 5.3m, and 9.3m for each tree, and cut 3 trunks with a length of 0.6 meters. Then, remove the bark and process the trunk into cubic wooden blocks of 3.0cm×3.0cm ×3.0cm. 20 wood blocks without obvious defects were selected for each tree species at each sampling height. Therefore, 60 wood blocks were selected for each tree species, and the total number of wood blocks in the experiment was 240.
Due to the significant impact of wood moisture content on drill needle resistance[28,35] in order to reduce the impact of wood moisture content on drill needle resistance, the wood block is baked to an absolute dry state before measuring the wood density and drill needle resistance. Place the test sample in an oven, set the oven temperature to 60 ℃, and dry it at a constant temperature for 6 hours; Set the oven temperature to 105 ℃ and dry it to an absolute dry state; Turn off the oven and store the test sample in a glass dryer when the temperature drops to room temperature. Use a balance to measure the absolute dry mass m of each sample, the measurement accuracy is 0.01g. Use a vernier caliper to measure the length a, width b, and height h of each sample, the measurement accuracy is 0.001cm. The formula for calculating the absolute dry density of each sample is:
ρ = 1000 m / ( a b h )
where ρ is the absolute dry density of each sample, its unit is kg/m3.

2.3. Methods

We used a self-made micro drill resistance instrument and Resistograph 650-SC to drill into wood blocks along the radial direction of the sample. In order to prevent the drill needle paths of the two instruments from overlapping, the drill needle entry points of the two instruments were approximately 1cm apart. Then we used a vernier caliper to measure the length l of the drilling needle path in the wood.
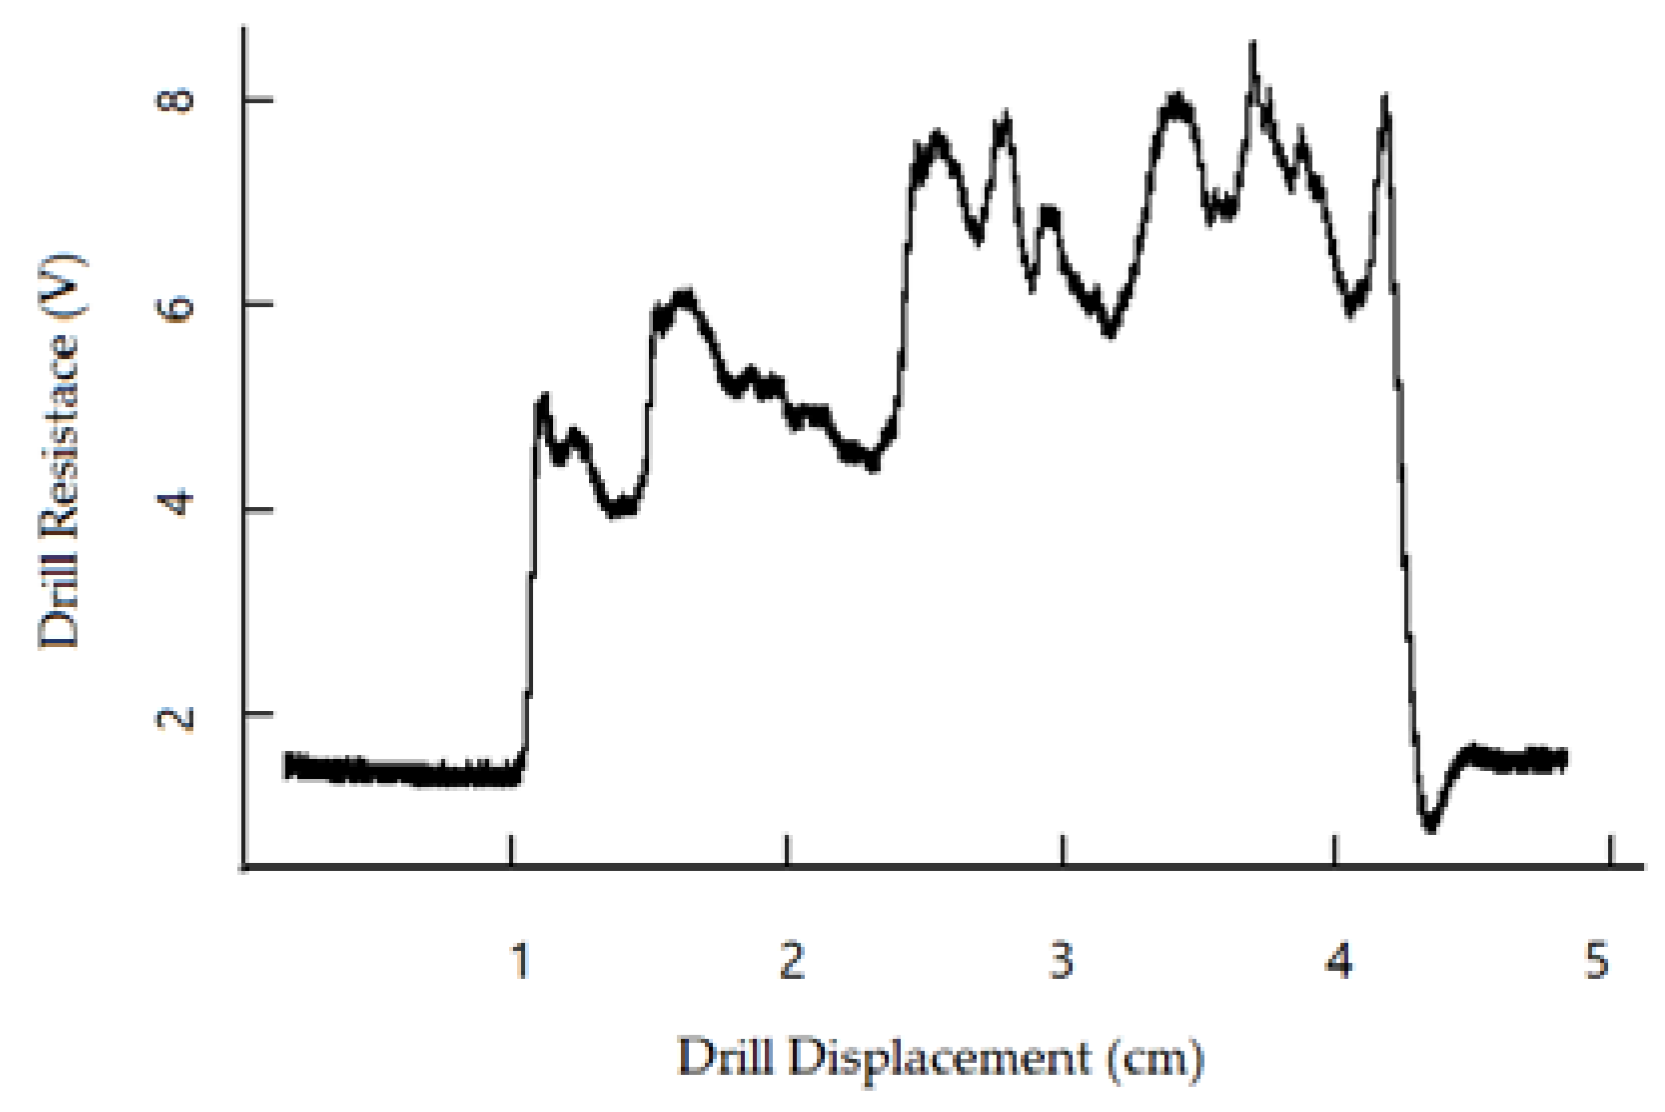
The drill needle penetrated the wood after advancing 1cm in the drill needle socket, and the micro drilling instrument was stopped after the drill needle drilled 1-2cm out of the wood. Figure 6 shows the resistance variation curve of the drill needle during the entire process of drilling into wood, taking rotation resistance of the self-made micro drill resistance instrument as an example.
To self-made micro drill resistance instrument, firstly, based on the set value of the drill needle feed speed and the cycle of timer T3, the average distance between adjacent resistance sampling points can be calculated. Then, based on the front unloaded displacement of the drill needle before drilling into the wooden block and the length of the drill needle path inside each wooden block, the range of drill needle resistance data and the number of resistance sampling points of the drill needle in each test sample are calculated. Finally, the average rotation resistance F1 and average feed resistance F2 of the drill needle in each test sample are calculated separately. To Resistograph 65-SC, the distance between resistance sampling points is 0.001cm, and the average resistance FR of the drill needle within each test sample was calculated using the same method.
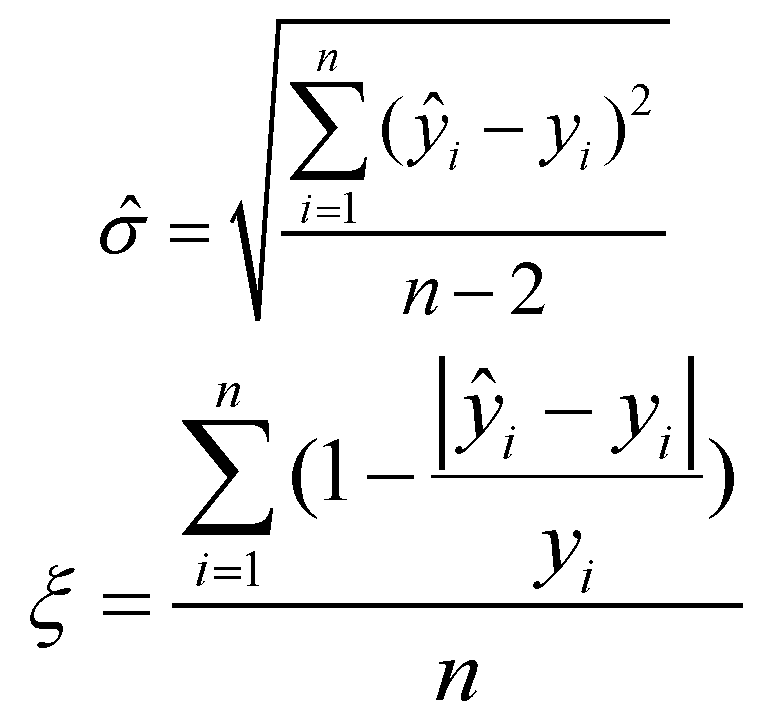
Randomly select 2/3 of the data from each tree species as modeling dataset, so the total modeling dataset was 160 records. Using the absolute dry density ρ as the dependent variable, 4 linear regression models between F1 and ρ, between F2 and ρ, between FR and ρ, between F1 and F2 and ρ were established separately with R language [36]. Using the remaining 1/3 of the data as the test dataset, the standard error and average accuracy of each model were calculated separately. The calculation formulas for standard error and average accuracy are:
Preprints 74986 i001 where yi is measurement value of the absolute dry density of the i-th wood block, ŷi is estimated density of the i-th wooden block, n is the number of test wood blocks.

3. Results

The linear model LM1 between the rotation resistance F1 and the absolute dry density, the linear model LM2 between feed resistance F2 and the absolute dry density, The linear model LM3 between resistance FR and the absolute dry density of wood is shown in Figure 7.
The coefficient of determination of the linear regression model LM4 between the rotation resistance F1 and feed resistance F2 of the self-made micro drill resistance instrument and the absolute dry density of wood is 0.965. The parameters of the linear regression model LM4 are shown in Table 1.
The testing accuracy of each model is shown in Table 2.

4. Discussion

Rinn et al. found that the feed resistance of the drill needle does not contain additional important information. Therefore, most scholars have studied the correlation between drill needle rotation resistance and wood density[37,38,39,40]. In order to study the correlation between the feed resistance of drilling needles and wood density, the paper designed a micro drilling instrument that can simultaneously measure the rotation resistance and feed resistance of drilling needles. The results showed that the feed resistance of drill needles was positively correlated with wood density, but the correlation between feed resistance and wood density was lower than that between rotational resistance and wood density. This may be caused by the following reasons: 1) The mechanical time constants of the two DC motors are different. The rotation motor adopted a DC motor produced by MAXON company in Swiss, with a time constant of only 5ms; The feed motor adopted a DC motor produced by Zhengke Company in China, with a time constant of about 30ms. 2) The impact of operator thrust on the rotation resistance and feed resistance of the drill needle maybe different. The operator’s thrust has a significant impact on the feed resistance of the drill needle, but it has a smaller impact on the rotational resistance. During the measurement process, due to breathing, shaking, and other reasons, the operator’s thrust on the micro drill instrument changes, resulting in changes in the feed resistance of the drill needle. In future research, the feed motor can be replaced with a MAXON motor, and a fixed bracket for the micro drill instrument can be designed to reduce the influence of human factors on the feed resistance of the drilling needle.
The measurement accuracy of the self-made micro drill resistance instrument was higher than that of the Resistoraph 650-SC, but the feed speed of the Resistoraph 650-SC was three times that of the self-made micro drill resistance instrument. The main reason is that the power supply voltage of the Resistoraph 650-SC is 32V, while the power supply voltage of the self-made micro drill resistance instrument is 24V, so the output torque of the two motors in the Resistoraph 650-SC instrument is greater than those of the self-made micro drill resistance instrument. In future designs, high-power motors can be used to control the rotation speed and feed rate of the drill needle in the self-made micro drill resistance instrument.
Compared to the growth corer, the micro drill resistance instrument has the advantages of faster measurement speed and less damage to trees. However, the measurement accuracy of the micro drill resistance instrument is still lower than that of the growth corer. So, currently in some application fields, the drill needle resistance instrument cannot replace the growth corer. Although Rinn et al. has made significant contributions to the development of micro drill resistance instrument, there still need a large number of researchers to further develop the micro drill resistance instrument, and to further improve the measurement accuracy of the micro drilling instrument.

5. Conclusions

The statistical indicators of each model of the self-made micro drill resistance instrument were better than the corresponding indicators of Resistogaph 650-SC. This indicates that the design scheme of the micro drilling resistance instrument proposed in the article is reasonable. The coefficient of determination of the linear regression model between the feed resistance of the self-made micro drill resistance instrument and the absolute dry density of wood was 0.946. So, there is a strong correlation between the feed resistance of drilling needle and wood density. The statistical indicators of model including rotation resistance and feed resistance, were better than those of the model only including rotation resistance, and feed resistance was statistically significant at 94.2%confifence level to the model between the rotation resistance and feed resistance and the absolute dry density of wood. Therefore, increasing the feed resistance of the drilling needle can improve the measurement accuracy of the micro drill resistance instrument for measuring wood density.

Author Contributions

Conceptualization, J.Y. and B.R.; methodology, J.Y. and Z.W.; hardware, J.Y. and Y.Z.; validation, J.Y., B.R. and Y.Z.; formal analysis, Z.L.; investigation, J.Y. and Z.L.; resources, J.Y. and Z.L.; data curation, Y.H. and B.N.; writing—original draft preparation, Z.W.; writing—review and editing, J.Y. and B.R.; visualization, J.Y. and Z.L.; supervision, J.Y.; project administration, J.Y.; funding acquisition, J.Y. All authors have read and agreed to the published version of the manuscript.”

Funding

This research was funded by Natural Science Foundation of Henan Province (232300421167), Key scientific research projects of universities in Henan Province( 22A220002), Xinyang Academy of Ecological Research Open Foundation(2023XYQN04), Xinyang Academy of Ecological Research Open Foundation(2023XYZD02) Natural Science Foundation of Henan Province(222300420274),Academic Degrees & Graduate Education Reform Project of Henan Province (2021SJGLX057Y)and Postgraduate Education Reform and Quality Improvement Project of Henan Province (YJS2023SZ23) .

Acknowledgments

Shouzheng Tang, an academician of the Chinese Academy of Forestry, gave guidance on topic selection; Xiangdong Lei, a researcher of Chinese Academy of Forestry, provided the Resistgraph 650-SC instrument.

Conflicts of Interest

The authors declare no conflict of interest.

References

  1. Rinn, F. Basics of Micro-resistance Drilling for Timber Inspection. Holztechnologie 2012, 53, 24–29. [Google Scholar]
  2. Rinn, F.; Schweingruber, F.H.; Schär, E. Resistograph and X-ray Density Charts of Wood. Comparative Evaluation of Drill Resistance Profiles and X-ray Density Charts of Different Wood Species. Holzforschung 1996, 50, 303–311. [Google Scholar] [CrossRef]
  3. Szewczyk, G.; Wasik, R.; Leszczyński, K.; Podlaski, R. Age Estimation of Different Tree Species Using a Special Kind of an Electrically Recording Resistance Drill. Urban Forestry & Urban Greening 2018, 34, 249–253. [Google Scholar]
  4. Rinn, F. Practical Application of Micro-resistance Drilling for Timber Inspection. Holztechnologie 2013, 54, 32–38. [Google Scholar]
  5. Guller, B.; Guller, A.; Kazaz, G. Is Resistograph an Appropriate Tool for the Annual Ring Measurement of Pinnus Brutia? NDE for Safety/Defektoskopie 2012, 89–94. [Google Scholar]
  6. Hu, X.; Zheng, Y.; Liang, H.; Zhao, Y. Design and Test of a Microdestructive Tree-ring Measurement System. Sensors 2020, 20, 3253. [Google Scholar] [CrossRef]
  7. Hu, X.; Zheng, Y.; Xing, D.; Sun, Q. Research on Tree Ring Micro-Destructive Detection Technology Based on Digital Micro-Drilling Resistance Method. Forests 2022, 13, 1139. [Google Scholar] [CrossRef]
  8. Oh, J.; Seo, J.; Kim, B. Determinate the Number of Growth Rings Using Resistograph with Tree-ring Chronology to Investigate Ages of Big Old Trees. Journal of the Korean Wood Science and Technology 2019, 47, 700–708. [Google Scholar] [CrossRef]
  9. Downes, G.M.; Nyakuengama, J.G.; Evans, R.; Northway, R.; Blakemore, P.; Dickson, R.L.; Lausberg, M. Relationship between Wood Density, Microfibril Angle and Stiffness in Thinned and Fertilized Pinus Radiata. IAWA J. 2002, 23, 253–265. [Google Scholar] [CrossRef]
  10. Nickolas, H.; Williams, D.; Downes, G.; Harrison, P.A.; Vaillancourt, R.E.; Potts, B.M. Application of Resistance Drilling to Genetic Studies of Growth, Wood Basic Density and Bark Thickness in Eucalyptus globulus. Aust. For. 2020, 83, 172–179. [Google Scholar] [CrossRef]
  11. Downes, G.M.; Lausberg, M.; Potts, B.M.; Pilbeam, D.L.; Bird, M.; Bradshaw, B. Application of the Iml Resistograph to the Infield Assessment of Basic Density in Plantation Eucalypts. Aust. For. 2018, 81, 177–185. [Google Scholar] [CrossRef]
  12. Wang, X. Recent Advances in Nondestructive Evaluation of Wood. In-Forest Wood Quality Assessments. Forests 2021, 12, 949. [Google Scholar] [CrossRef]
  13. Gao, S.; Wang, X.; Wiemann, M.C.; Brashaw, B.K.; Ross, R.J. A critical analysis of methods for rapid and nondestructive determination of wood density in standing trees. Ann. For. Sci. 2017, 74, 77. [Google Scholar] [CrossRef]
  14. Johnstone, D.M.; Ades, P.K.; Moore, G.M.; Smith, I.W. Predicting Wood Decay in Eucalypts Using an Expert System and the IML-Resistograph Drill. Arboriculture and Urban Forestry 2007, 33, 76–82. [Google Scholar] [CrossRef]
  15. Zhang, T.; Du, D.; Li, D.; Xu, F.; Chen, P. The Inspection and Appraisal of the Yonghemen Structure of the Qing Dynasty in Beijing. International Journal of Archaeology 2018, 6, 56–66. [Google Scholar]
  16. Isik, F.; Li, B. Rapid Assessment of Wood Density of Live Trees Using the Resistograph for Selection in Tree Improvement Programs. Canadian Journal of Forest Research 2003, 33, 2426–2435. [Google Scholar] [CrossRef]
  17. Rinn, F. Device for material testing, especially wood inspection by drill resistance measurements. German Patent 1990, 4122494. [Google Scholar]
  18. Chen, X. Design of Needle Measurement System for Tree Annual Ring. Master’s Thesis, Beijing Forestry University, Beijing, China, 2019. [Google Scholar]
  19. Yao, J. Research on Principle and Realization of Tree Ring Measuring Instrument Based on Micro Drill Resistance Method. Doctor’s Thesis, Chinese Academy of Forestry, Beijing, China, 2020. Doctor’s Thesis, Chinese Academy of Forestry, Beijing, China, 2020. [Google Scholar]
  20. Yao, J.; Zhao, Y.; Lu, J.; Zheng, Y.; Gao, R.; Tang, S. Annual-ring Measurement Method Based on Adaptive Filtering Algorithm. Trans. Chin. Soc. Agric. Mach. 2020, 51, 216–222. [Google Scholar]
  21. Yao, J.; Lu, J.; Zheng, Y.; Wang, X.; Zhao, Y.; Chen, X.; Lei, G.; Tang, S. DC Motor Speed Control of Annual-ring Measuring Instrument Based on Variable Universe Fuzzy Control Algorithm. Transactions of the Chinese Society of Agricultural Engineering 2019, 35, 57–63. [Google Scholar]
  22. Yao, J.; Zhao, Y.; Fu, L.; Song, X.; Lu, J.; Li, S. Tree-rings Measurement Method Based on Micro Drill Resistance. Trans. Chin. Soc. Agric. Mach. 2022, 53, 52–59. [Google Scholar]
  23. Yao, J.; Zhao, Y.; Zhang, H.; Song, X.; Lei, X.; Tang, S. Drill Resistance Expression Method of Tree Micro Drill Instrument. Trans. Chin. Soc. Agric. Mach 2021, 52, 271–277, 286. [Google Scholar]
  24. Yao, J.; Fu, L.; Song, X.; Wang, X.; Zhao, Y.; Zheng, Y.; Ye, Q.; Zhai, S. Feasibility Study on Measuring Density of Earlywood and Latewood by Micro Drill Resistance Method. Journal of Forestry Engineering 2022, 7, 66–73. [Google Scholar]
  25. Yao, J.; Guo, X.; Fu, L.; Wang, X.; Lei, X.; Lu, J.; Zheng, Y.; Song, X. Indirect measurement of wood density by micro drill resistance method[J]. Sci. Silvae Sin. 2022, 58, 138–147. [Google Scholar]
  26. Pan, H.; Lu, J.; Lei, X.; Guo, X.; Yao, J.; Tang, S. Tree Age Estimation Based on Resistograph Stationary Kalman Filter. Sci. Silvae Sin. 2021, 57, 14–23. [Google Scholar]
  27. Yao, J.; Guo, X.; Song, X.; Wang, J.; Qi, K.; Dai, Q. Research on Peak-valley Tree-ring Recognition Method Based on Gray Image. Journal of Xinyang Normal University 2022, 35, 475–480. [Google Scholar]
  28. Yao, J.; Lei, X.; Wang, X.; Fu, L.; Zheng, Y.; Guo, X.; Duan, G.; Song, X. Effect of Moisture Content on Drill Resistance of Micro Drill Resistance Instrument. Journal of Central South University of Forestry & Technology 2022, 42, 137–147. [Google Scholar]
  29. Zhang, Q.; Pei, W. DSP Processer-in-the-Loop Tests Based on Automatic Code Generation. Inventions 2022, 7, 12. [Google Scholar] [CrossRef]
  30. Toh, E.H.; Wang, G. H.; Lo, G. Q.; Chan, L.; Samudra, G.; Yeo, Y. C. Performance Enhancement of N-channel Impact-ionization Metal-oxide-semiconductor Transistor by Strain Engineering. Applied Physics Letters 2007, 90, 971–163. [Google Scholar] [CrossRef]
  31. Chen, H.-C. An H-bridge driver using gate bias for DC motor control. In Proceedings of the 2013 IEEE International Symposiumon Consumer Electronics (ISCE), Hsinschu, Taiwan, 3–6 June 2013; pp. 265–266. [Google Scholar]
  32. Hernández-Alvarado, R.; García-Valdovinos, L.G.; Salgado-Jiménez, T.; Gómez-Espinosa, A.; Fonseca-Navarro, F. Neural Network-Based Self-Tuning PID Control for Underwater Vehicles. Sensors 2016, 16, 1429. [Google Scholar] [CrossRef]
  33. Zhu, R.; Wu, H. Dc Motor Speed Control System Based on Incremental pid Algorithm. Instrum. Tech. Sens. 2017, 7, 121–126. [Google Scholar]
  34. Wang, J.; Li, M.; Jiang, W.; Huang, Y.; Lin, R. A Design of FPGA-Based Neural Network PID Controller for Motion Control System. Sensors 2022, 22, 889. [Google Scholar] [CrossRef] [PubMed]
  35. Sharapov, E.; Chernov, V.; Toropov, A.; Smirnova, E. The Impact of Moisture Content on Accuracy of Wood Properties Evaluation by Drilling Resistance Measurement Method. Lesnoy Zhurnal 2016, 2, 7–18. [Google Scholar]
  36. Allaire, J.J.; Xie, Y.; McPherson, J.; Luraschi, J.; Ushey, K.; Atkins, A.; Wickham, H.; Cheng, J.; Chang, W.; Iannone, R. Rmarkdown: Dynamic Documents for R; R Package Version 2. 2022. Available online: https://cran.r-project.org/package=rmarkdown (accessed on 18 April 2022).
  37. Tomczak, K.; Tomczak, A.; Jelonek, T. Measuring Radial Variation in Basic Density of Pendulate Oak: Comparing Increment Core Samples with the Iml Power Drill. Forests 2022, 13, 589. [Google Scholar] [CrossRef]
  38. Fundova, I.; Funda, T.; Wu, H.X. Non-Destructive Wood Density Assessment of Scots Pine (Pinus sylvestris L.) Using Resistograph and Pilodyn. PLoS ONE 2018, 13, e0204518. [Google Scholar] [CrossRef]
  39. Nickolas, H.; Williams, D.; Downes, G.; Harrison, P.A.; Vaillancourt, R.E.; Potts, B.M. Application of Resistance Drilling to Genetic Studies of Growth, Wood Basic Density and Bark Thickness in Eucalyptus globulus. Aust. For. 2020, 83, 172–179. [Google Scholar] [CrossRef]
  40. Isaac-Renton, M.; Stoehr, M.; Statland, C. B.; Woods, J. Tree Breeding and Silviculture: Douglas-fir Volume Gains with Minimal Wood Quality Loss under Variable Planting Densities. Forest Ecology and Management 2020, 465, 118094. [Google Scholar] [CrossRef]
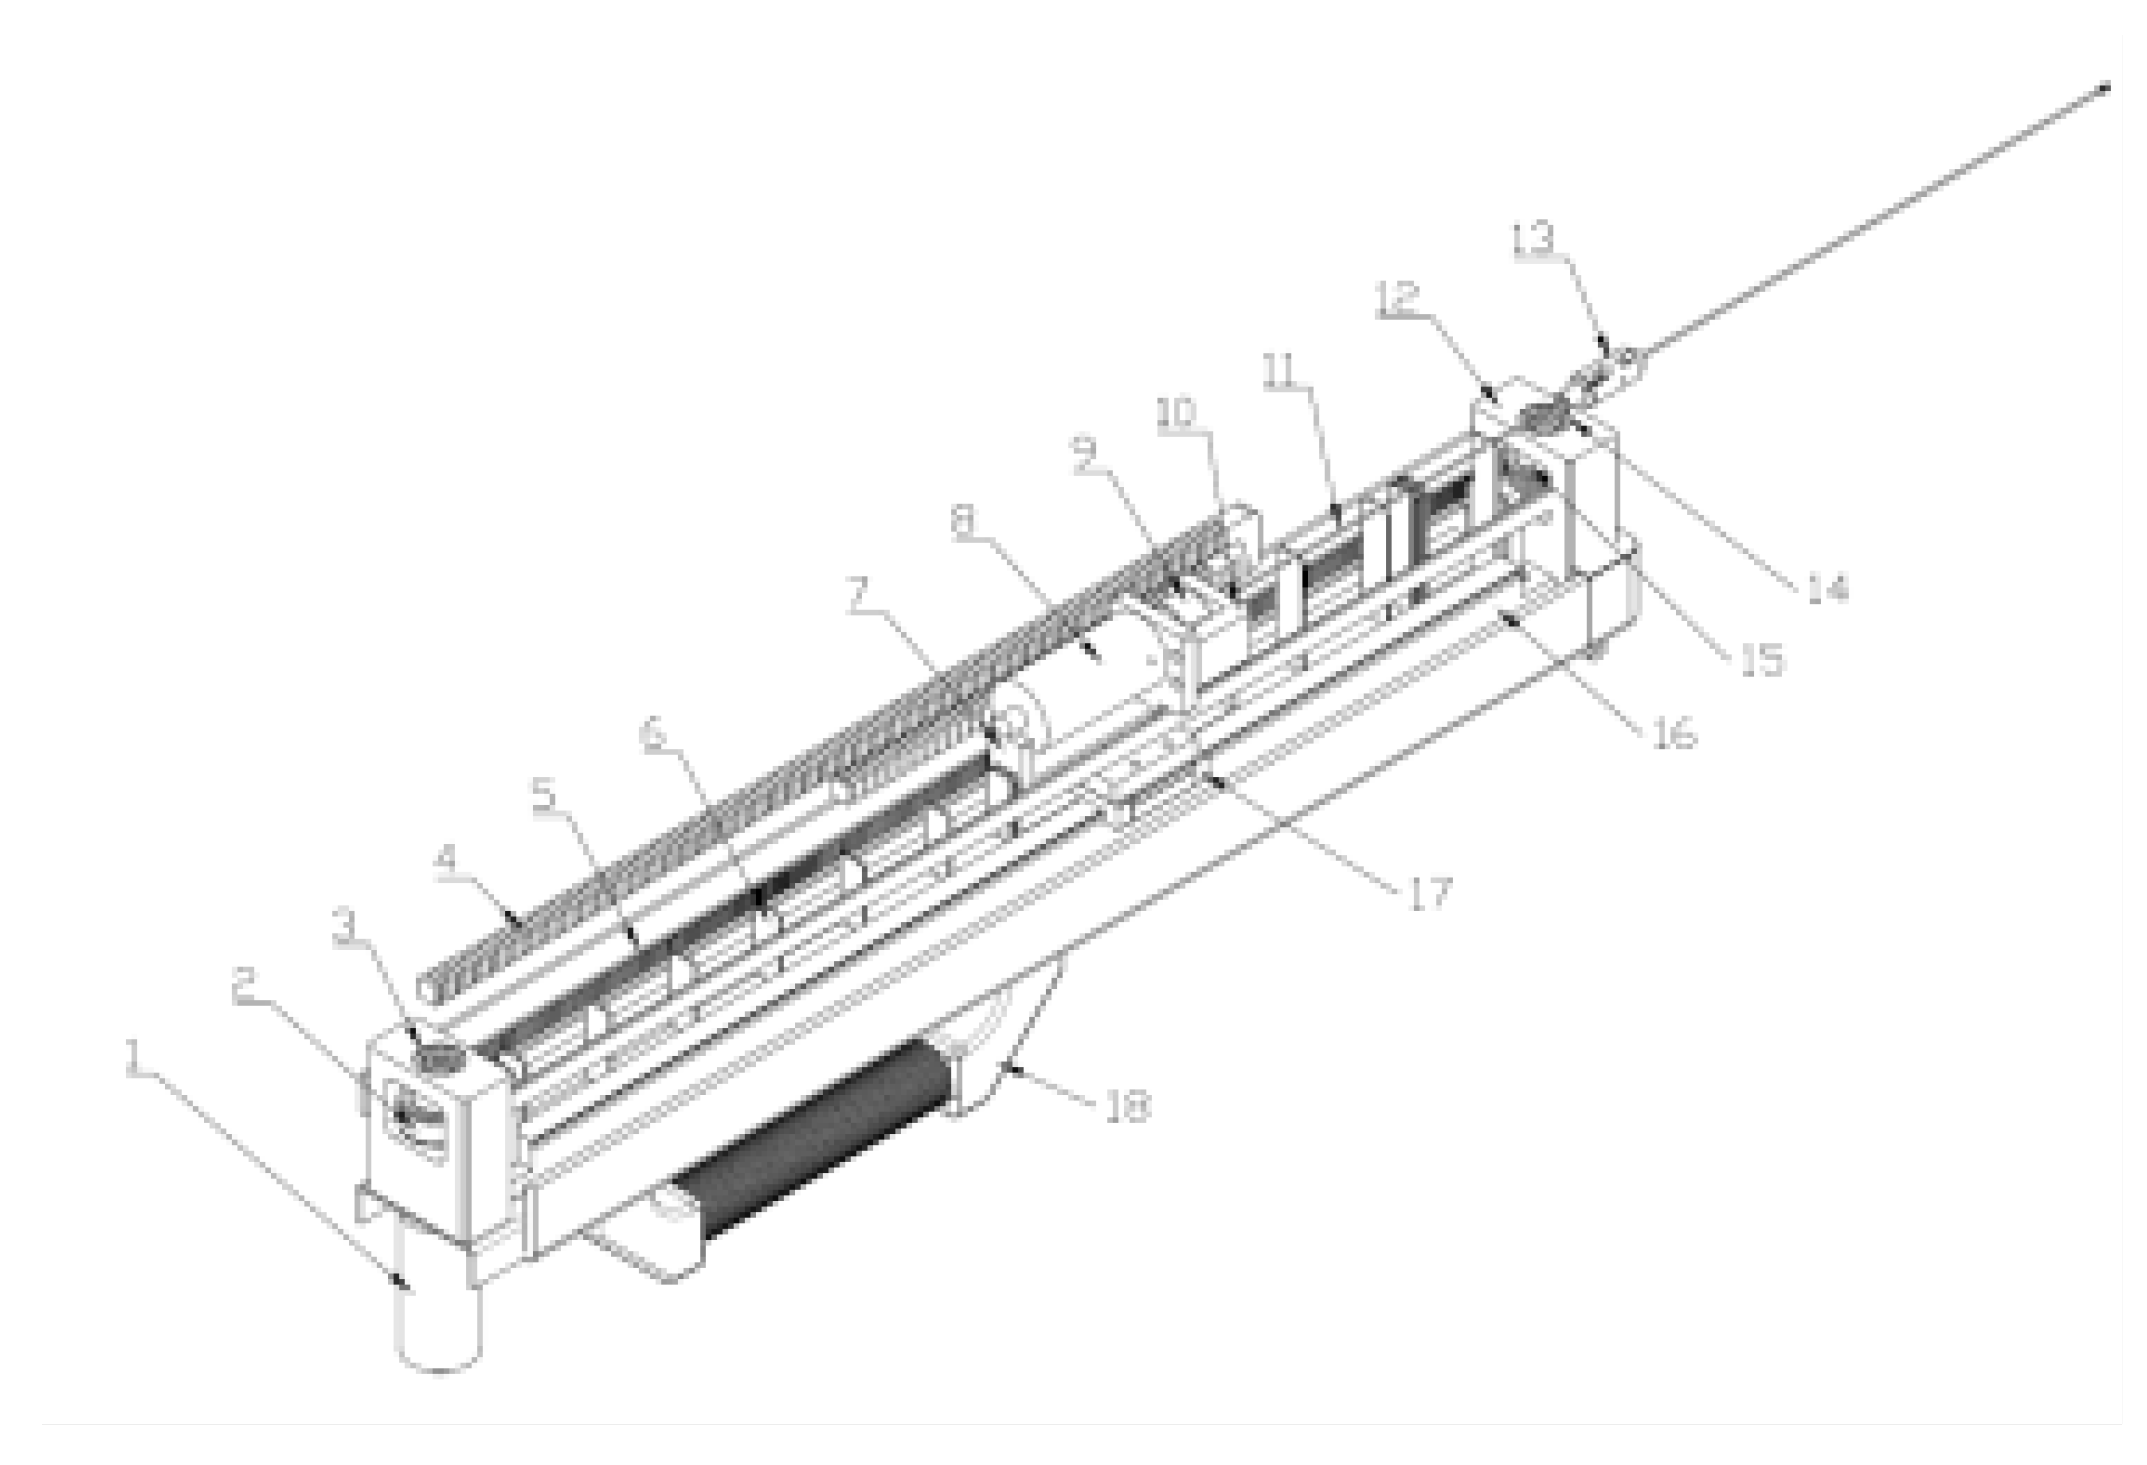
Figure 1. The names of each label are as follows: 1:feed motor ; 2:timing belt driving wheel; 3: driving wheel shaft; 4: cable slot; 5: timing belt; 6: drill needle support plate; 7:backward push element; 8: rotation motor; 9: drill needle clamp;10: forward push element; 11: drill needle; 12: fixing seat of timing belt wheel ; 13: drill needle socket; 14: driven wheel shaft; 15: driven timing belt pulley; 16: plastic slide rail 17: ball slider 18: handle.
Preprints 74986 g001
Figure 2. (a) Geometry of the baffle plate for supporting the drill needle; (b) Stacking method of some baffle plates for supporting the drill needle.
Preprints 74986 g002
Figure 3. Diagram of control system.
Preprints 74986 g003
Figure 4. Circuit of the DC motor for controlling the rotation speed of the drill.
Preprints 74986 g004
Figure 5. Circuit of the DC motor for controlling the feed speed of the drill.
Preprints 74986 g005
Figure 6. This is the resistance variation curve of the drill needle during the entire process of drilling into wood. At the beginning and end of the resistance curve shows that the drill needle is in an empty state, and only the middle part of the resistance curve the drill needle is drilling the wood.
Preprints 74986 g006
Figure 7. The correlation between the absolute dry density and the rotation resistance(a) and the feed resistance (b)of the self-made micro drill resistance instrument is both stronger than the correlation between the absolute dry density and the resistance of Resistograph 650-SC(c).
Preprints 74986 g007
Table 1. The p-value of F2 is 0.058, indicating that F2 is statistically significant at 94.2%confifence level.
Parameter Standard Error t-value p- value
intercept 398.298 -2.564 0.011
F1 5.727 9.147 <0.001
F2 33.966 1.908 0.058
Table 2. The test indicators of each model of the self-made micro drill resistance instrument are better than the corresponding indicators of Resistogaph 650-SC. The test indicators of model LM3, which includes rotational resistance and feed resistance, are better than those of the model LM1, which only includes rotational resistance.
Instrument Model Standard Error
(kg/m-3)
Average Accuracy
(%)
Self-made LM1 32.302 94.910
LM2 43.027 93.864
LM3 31.782 94.970
Resistogaph 650-SC LM4 62.052 90.700
Disclaimer/Publisher’s Note: The statements, opinions and data contained in all publications are solely those of the individual author(s) and contributor(s) and not of MDPI and/or the editor(s). MDPI and/or the editor(s) disclaim responsibility for any injury to people or property resulting from any ideas, methods, instructions or products referred to in the content.
Copyright: This open access article is published under a Creative Commons CC BY 4.0 license, which permit the free download, distribution, and reuse, provided that the author and preprint are cited in any reuse.
Prerpints.org logo

Preprints.org is a free preprint server supported by MDPI in Basel, Switzerland.

Subscribe

© 2024 MDPI (Basel, Switzerland) unless otherwise stated