1. Introduction
As one of the severest forms of natural disaster, earthquakes seriously threaten the safety of human life and property. As such, coseismic deformation is an essential source of data for assisting the parameter estimation of surface deformation models during devastating earthquakes [
1]. Satellite imagery is naturally suited for such measurements, because it regularly provides comprehensive and detailed images of the ground with high radiometric and geometric quality[
2]. Interferometric Synthetic Aperture Radar (InSAR) is one of the most commonly used techniques to provide this data. However, when the coseismic deformation and gradient are large, InSAR faces some challenges, including severe phase decoherence and phase ambiguity. In many cases, these techniques do not offer detailed maps of near-field surface strain, which can be characterized by a complex network of surface ruptures and cracks within a fault zone of finite width. Therefore, InSAR and field measurements are not effective for estimating the total slip across a fault zone and the variability of slip along the fault[
3]. Under these conditions, subpixel correlation methods based on image intensity information are more advantageous, such as optical image correlation (OIC) and pixel offset tracking (POT). Since the measurement accuracy of POT is primarily determined by the image’s pixel size, and the resolution of SAR images is significantly lower than that of optical images, OIC can generally determine the horizontal displacement more precisely than POT [
1]. Furthermore, SAR systems often have longer repetition periods, resulting in more severe temporal de-correlation of image pairs, preventing POT from generating complete deformation fields in the near fracture zone. With an improved understanding of sampling theory, the correlation technique now provides local displacement measurements with precision up to a hundredth of a pixel. This is made possible by enhanced interpolation capabilities[
4].
Co-registration of Optically Sensed Images and Correlation (COSI-Corr) allows for more accurate and robust measurement of the relative displacement between two images [
5]. COSI-Corr has introduced a methodology for automatic and precise ortho-rectification and co-registration of satellite or aerial images. This procedure eliminates the need for external sources such as GPS-based ground control points (GCPs), and solely relies on topography and ancillary data provided with the observing platform. The generated set of ortho-images is then used for sub-pixel change detection. It has produced validated results in many earthquake studies[
6,
7,
8,
9,
10,
11]. In addition, the technology is also widely used in dune displacement, glacier displacement and other fields[
12].
Even so, with respect to practical applications, COSI-Corr still has some problems which need to be solved. Firstly, general optical images with lower or medium spatial resolution are occasionally insufficient to measure fine tomographic displacements [
13]. This can be dealt with via higher spatial resolution optical remote sensing imaging, which can expand the applicability of the technology and improve measurement accuracy. The second issue is related to the correlation window. Its size is an important algorithmic parameter of the correlation, because it determines the measurement scale of the frequency correlation and directly affects the maximum displacement which can be measured [
12]. The larger the correlation window, the lower the correlation uncertainty and bias [
13], while in the opposite direction, smaller correlation windows close to the surface deformation produce more erroneous signals which manifest as noise [
12]. Currently, the common method for selecting the correlation scales is the traversal method or the empirical values reference method [
11], but the former is less efficient whereas the latter is influenced more by the characteristics of the test area.
One particularly notable case was the 2021 Maduo earthquake, to which four different correlation scale sizes were applied, where the variation among the maximum values approached a dozen meters. Even based on these four different outcomes, it was impossible to determine the most reliable technique. A simple average was also attempted for post-processing to seek results agreement, but the effect was not ideal. Furthermore, traditional post-processing divided the east-west and north-south directions without establishing a typical two-dimensional relationship. Therefore, considering the similarity of adjacent surface deformations, high-resolution optical remote sensing data was used to fuse different OIC deformation results for this earthquake, from which consistent results for multi-scale correlation shape changes could be obtained. The method's reliability was demonstrated by comparing its results with those of Sentinel-1-based D-InSAR, POT, and other published studies.
2. Maduo Earthquake and Data Processing
2.1. Maduo Earthquake and Data
On May 22, 2021, a magnitude 7.4 earthquake occurred in Maduo County, Guoluo Tibetan Autonomous Prefecture, Qinghai Province, China. The earthquake took place about 70 km south of the East Kunlun Fault Zone on the northern boundary of the Bayankala block and was caused by an internal fault within the block. The earthquake's surface deformation was extensive, creating a complex co-seismic deformation zone about 151 km in length. The overall deformation showed a left-lateral strike-slip motion with a minor component of reverse faulting. The rupture mainly occurred along the Jiangcuo fault located in the southern part of the East Kunlun Fault Zone, with an overall trend of N105°E and a length of approximately 151 km[
14]. Field investigations indicated that the earthquake caused several meters of surface displacement and triggered many fissures, intermittent springs, and seismic uplifts. The eastern and western parts of the fault experienced the most severe stretching and squeezing deformation[
15]. Finding out the distribution and characteristics of its coseismic surface rupture in time is of great significance for the identification of seismogenic structure, regional earthquake prevention and disaster reduction[
16].
The optical remote sensing images used in this article are high spatial resolution data from the Planet satellite, which is a new type of remote sensing satellite with high-resolution, high-frequency, and global coverage capabilities[
17].
This article conducted experiments using two PSScene3Band products, acquired on May 8 and June 5, located in the western part of the Maduo earthquake rupture zone. The product has a positioning accuracy of less than 10 meters RMSE, has been orthorectified using SRTM, and has a spatial resolution of 3.125 meters. The common area of the two images, which was obtained after cropping, was selected as the study area, with an area of approximately 397 km². In the method validation section of this article, radar data was used to obtain co-seismic deformation in the study area, serving as a reference and comparison for this article's method. The radar data were collected on May 20 and May 26, using up and downlink Sentinel-1 satellite C-band data.
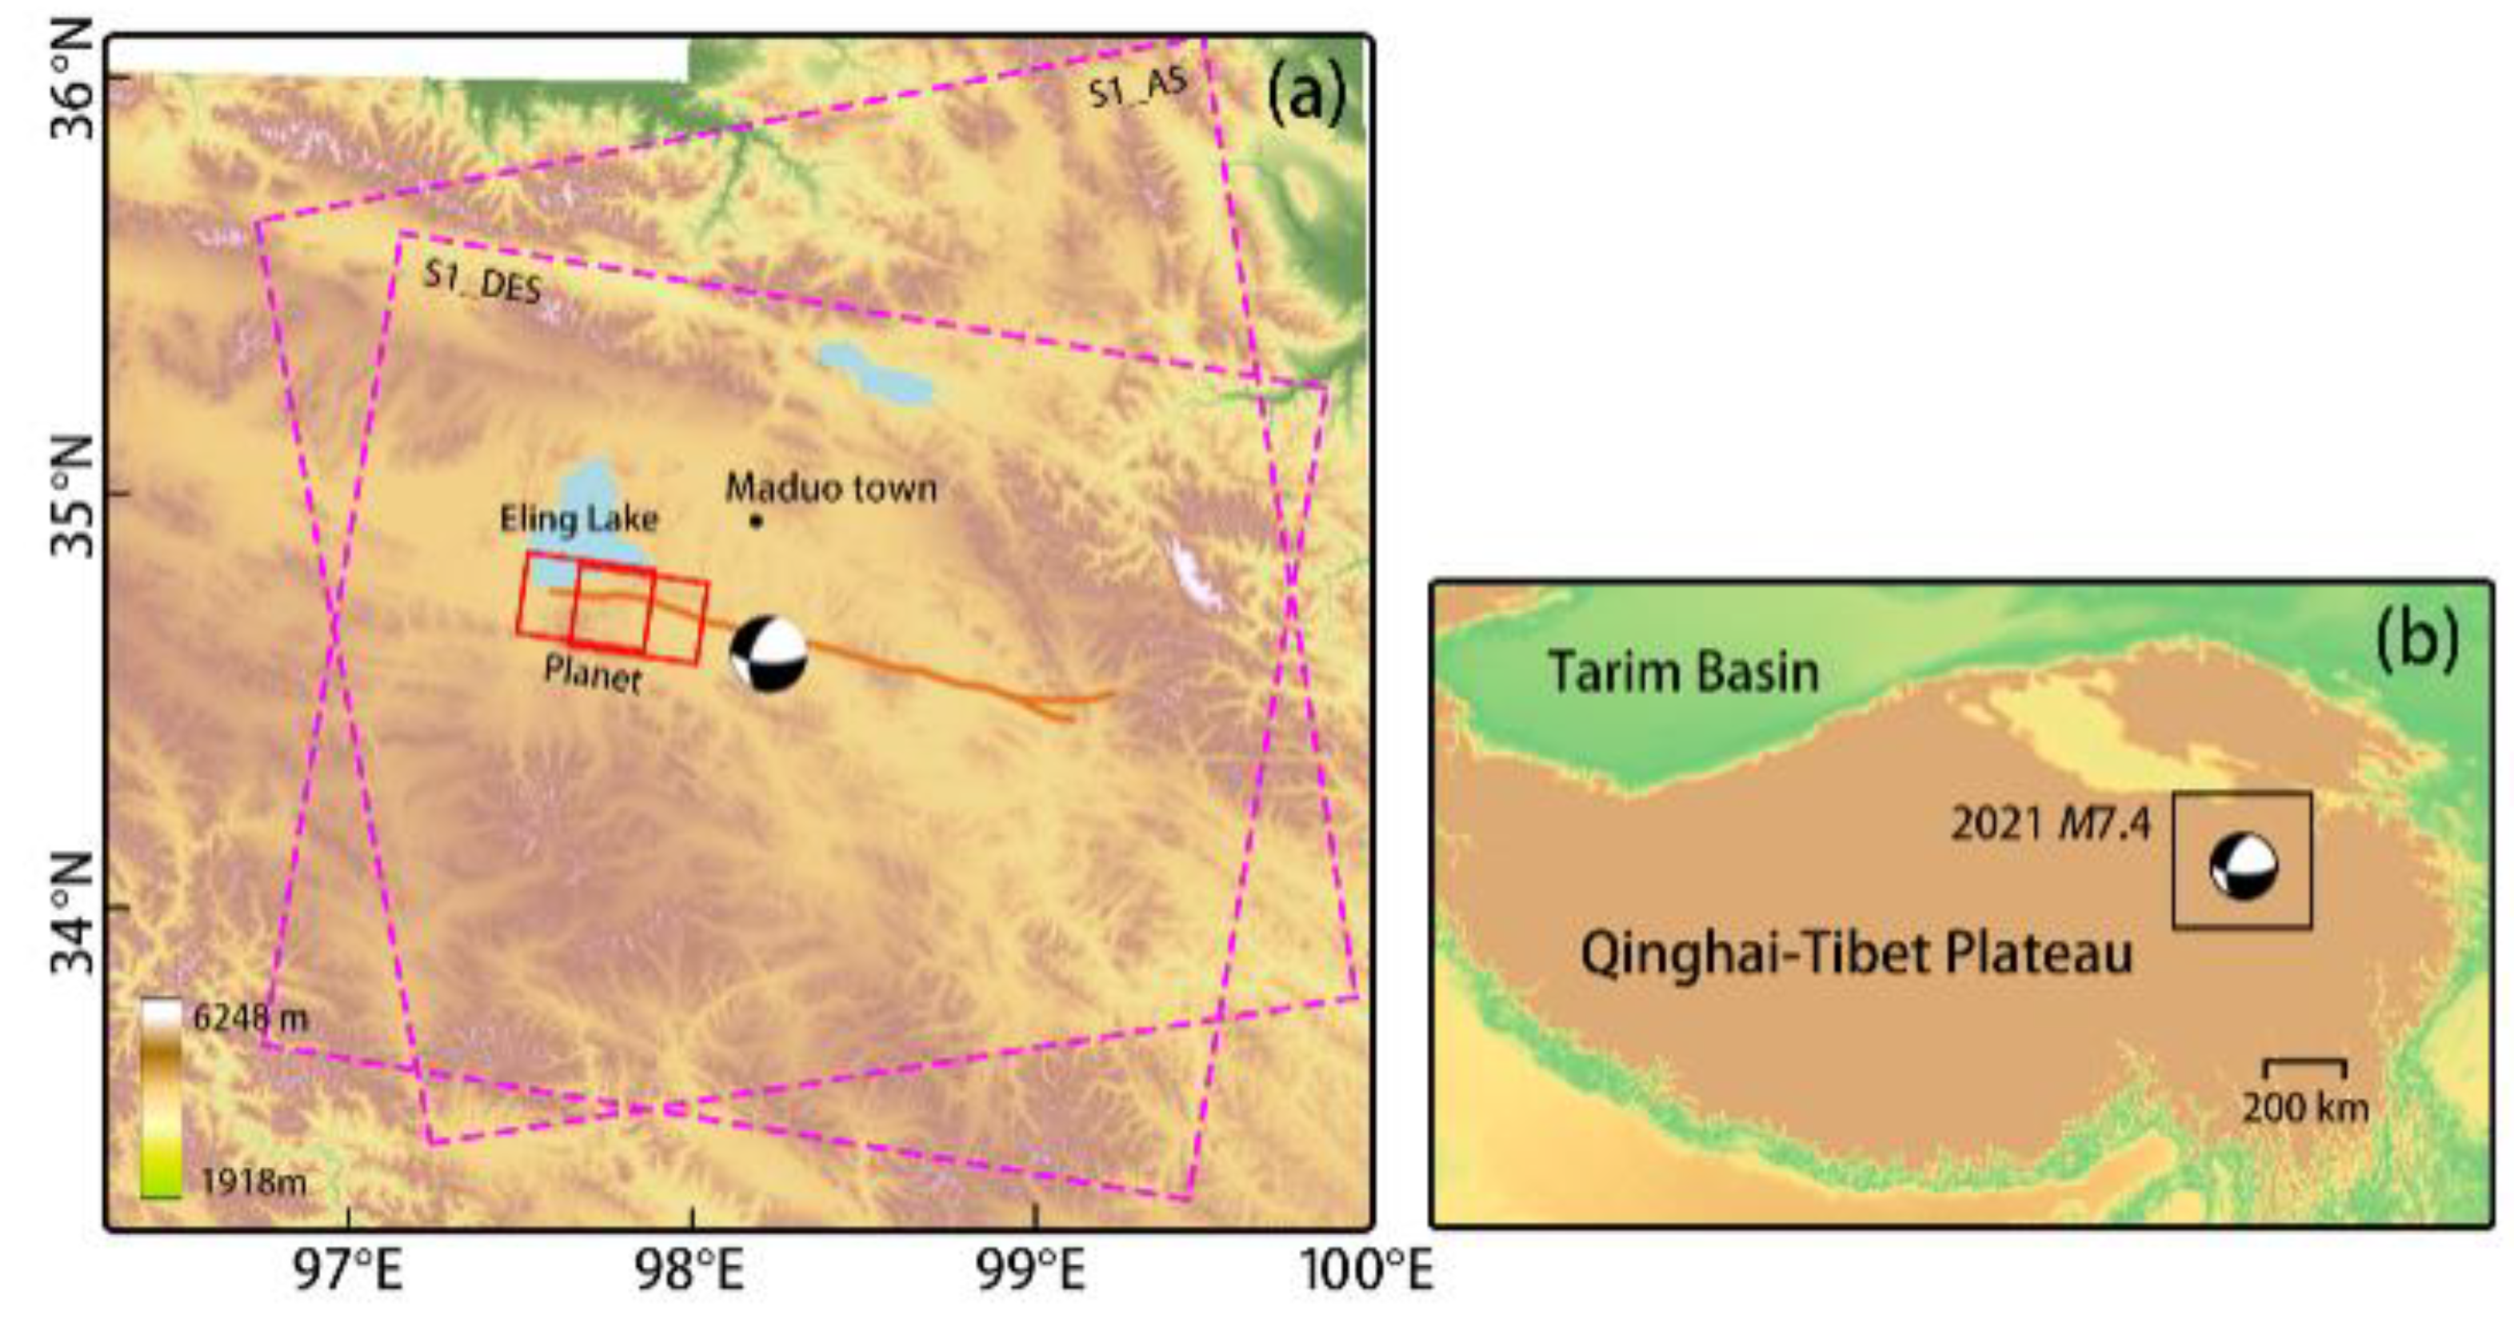
Figure 1.
Color-shaded relief map of the study area. Elevation information is based on ASTER GDEM 30M. The optical data is represented by the red solid line, and the SAR data is represented by the purple dashed box. The yellow-brown line represents the Maduo earthquake fault trace (Liu et al. 2022). Beachball's source mechanism and epicenter locations are based on data from the USGS, and the locations in Maduo County are indicated by black dots.
2.2. D-InSAR and POT Processing
We used the GAMMA software to process the collected Sentinel-1 acquisitions with the D-InSAR and POT techniques. Initially, the single and multi-look complex images (SLC) from the upward and downward Sentinel-1 Synthetic Aperture Radar (SAR) data were extracted for corresponding bursts in respective areas. Using the satellite orbital parameters, the Shuttle Radar Topography Mission (SRTM) digital elevation model (DEM) with a resolution of 90m was converted to the radar coordinate system. The coarse and fine registrations of the interferometric pairs of upward and downward-looking SLC data were performed to improve azimuthal registration accuracy. By eliminating the terrain phase and the flat earth phase by DEM and SAR orbit parameters, respectively, the raw differential interferogram was obtained. To suppress phase noise and improve signal-to-noise ratio (SNR), multi-looking processing was performed with azimuthal and range views 10 and 2, respectively. An adaptive filter was applied to the obtained interferograms to eliminate phase noise and reduce the difficulty of phase unwrapping. To improve the accuracy of phase unwrapping, the low-coherence areas were masked before performing two-dimensional phase unwrapping and converting the deformation phase to displacement values in the LOS direction. Finally, the obtained interferograms were transformed to the geographic coordinate system through geocoding to produce the co-seismic interferogram and deformation field for upward and downward SAR images.
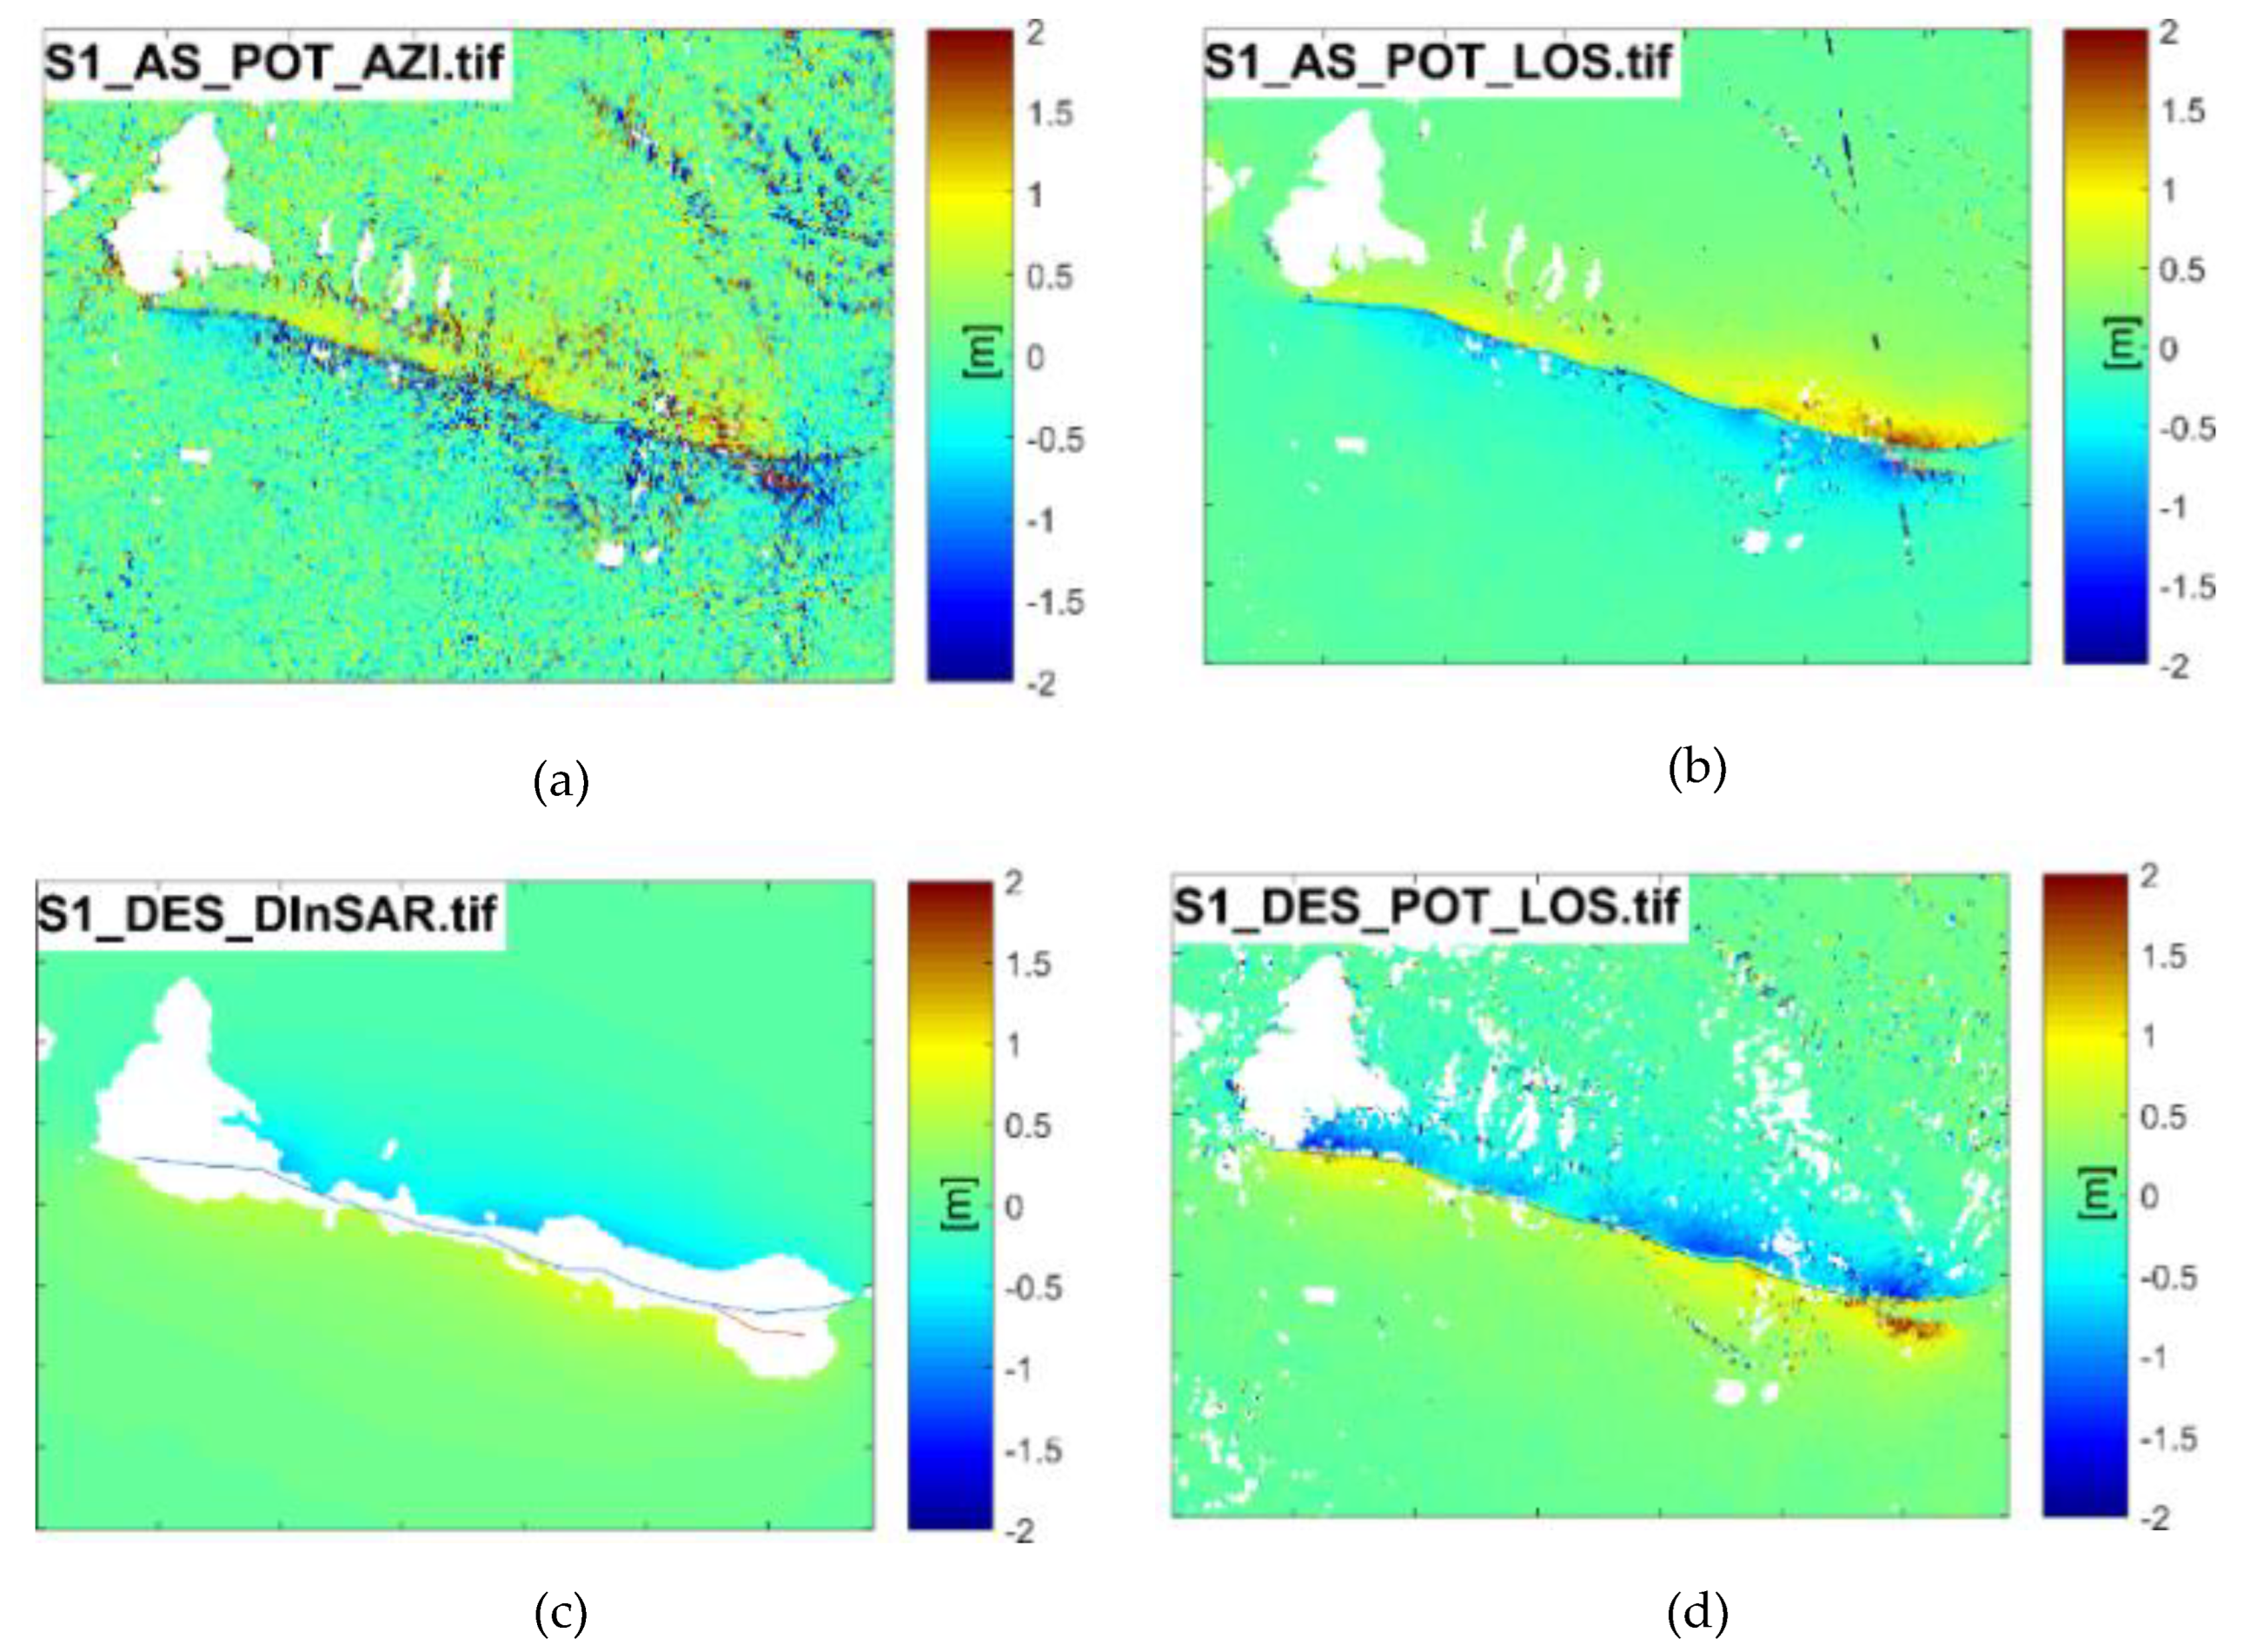
Figure 2 depicts the coseismic displacement observations obtained from SAR data. To represent the corresponding SAR displacement observations, we use a combination of several abbreviated letters connected by underscore characters. For example, S1 AS POT AZI denotes the POT observation of ascending (AS) Sentine1-1 (S1) data along the AZI direction, whereas S1 DES D-InSAR denotes the D-InSAR observation of descending S1 data. The trend and distribution of displacement observations are similar and consistent with the results in published papers[
14,
15,
16,
18,
19,
20,
21,
22,
23,
24,
25,
26,
27].
Severe decoherence and sizable missing areas are noticeable in the InSAR results. The POT generates more noise, and the POT results from downgraded data show small missing areas in the epicenter region. This phenomenon occurs due to the extreme horizontal displacement changes in these regions.
According to data from the China Continental Tectonic Environment Monitoring Network, a permanent east-west displacement of up to 25 cm has been recorded at the Maduo station, located over 30 km away from the epicenter. Meanwhile, the InSAR also detected significant deformation, with the maximum relative Line of Sight (LOS) displacement of about 1.87 m and 2.32 m in ascending and descending directions, respectively[
18]. Our measurements are consistent with published studies, so SAR measurements can be used as reference data for validation of subsequent optical imaging methods. A qualitative comparison showed that POT observation results were less accurate than DInSAR observation results, and were proportional to pixel resolution. The results confirmed a crucial advantage of the POT method, which can provide more complete displacement field information than DInSAR in areas where the latter method is infeasible.
Then, using the method proposed by Liu et al.[
28,
29], the deformation was decomposed into the east-west and north-south directions to compare it with the method proposed in this paper, which is based on optical data.
2.3. Optical Image Correlation
While COSI-Corr has been designed to extract sub-pixel displacements between optical images, it is important to acknowledge that factors such as uncorrected topography, noise, and limited resolution can impact measurement results despite maximizing image utilization[
30]. When calculating pixel offset through correlation analysis, there are two correlators available - frequency and statistical. Among the two, the frequency correlator, which is based on Fourier analysis, is more accurate than the statistical one. It should be used in priority when correlating optical images. However, the frequency correlator is highly sensitive to noise and is recommended only for optical images of good quality. On the other hand, the statistical correlator maximizes the absolute value of the correlation coefficient and is more robust. Although it is coarser than the frequency correlator, it is useful in correlating noisy optical images that have yielded unsatisfactory results using the frequency correlator. Additionally, the statistical correlator is also ideal for images with different contents, such as an optical image combined with a shaded digital elevation model (DEM).
The frequency correlation process involves two main steps. The first step requires an initial estimation of the pixelwise displacement between two patches. If the image is noisy or there is an expected large displacement, a large initial window size should be selected. In theory, the window size should be twice the expected displacement. However, it is recommended to use a larger ratio, such as a 128 or 256 initial window size with an expected displacement of 15 pixels. Once the initial displacement is estimated, a second and final correlation step is performed to retrieve the subpixel displacement. For the final window size, it is customary to choose the smallest size that provides an acceptable level of noise. The researchers suggest, a window size of 32×32 pixels is the minimum necessary, while a window size of either 32×32 or 64×64 is usually sufficient to yield good results with high-quality images[
30]. This is because smaller window sizes increase the density of independent measurements.
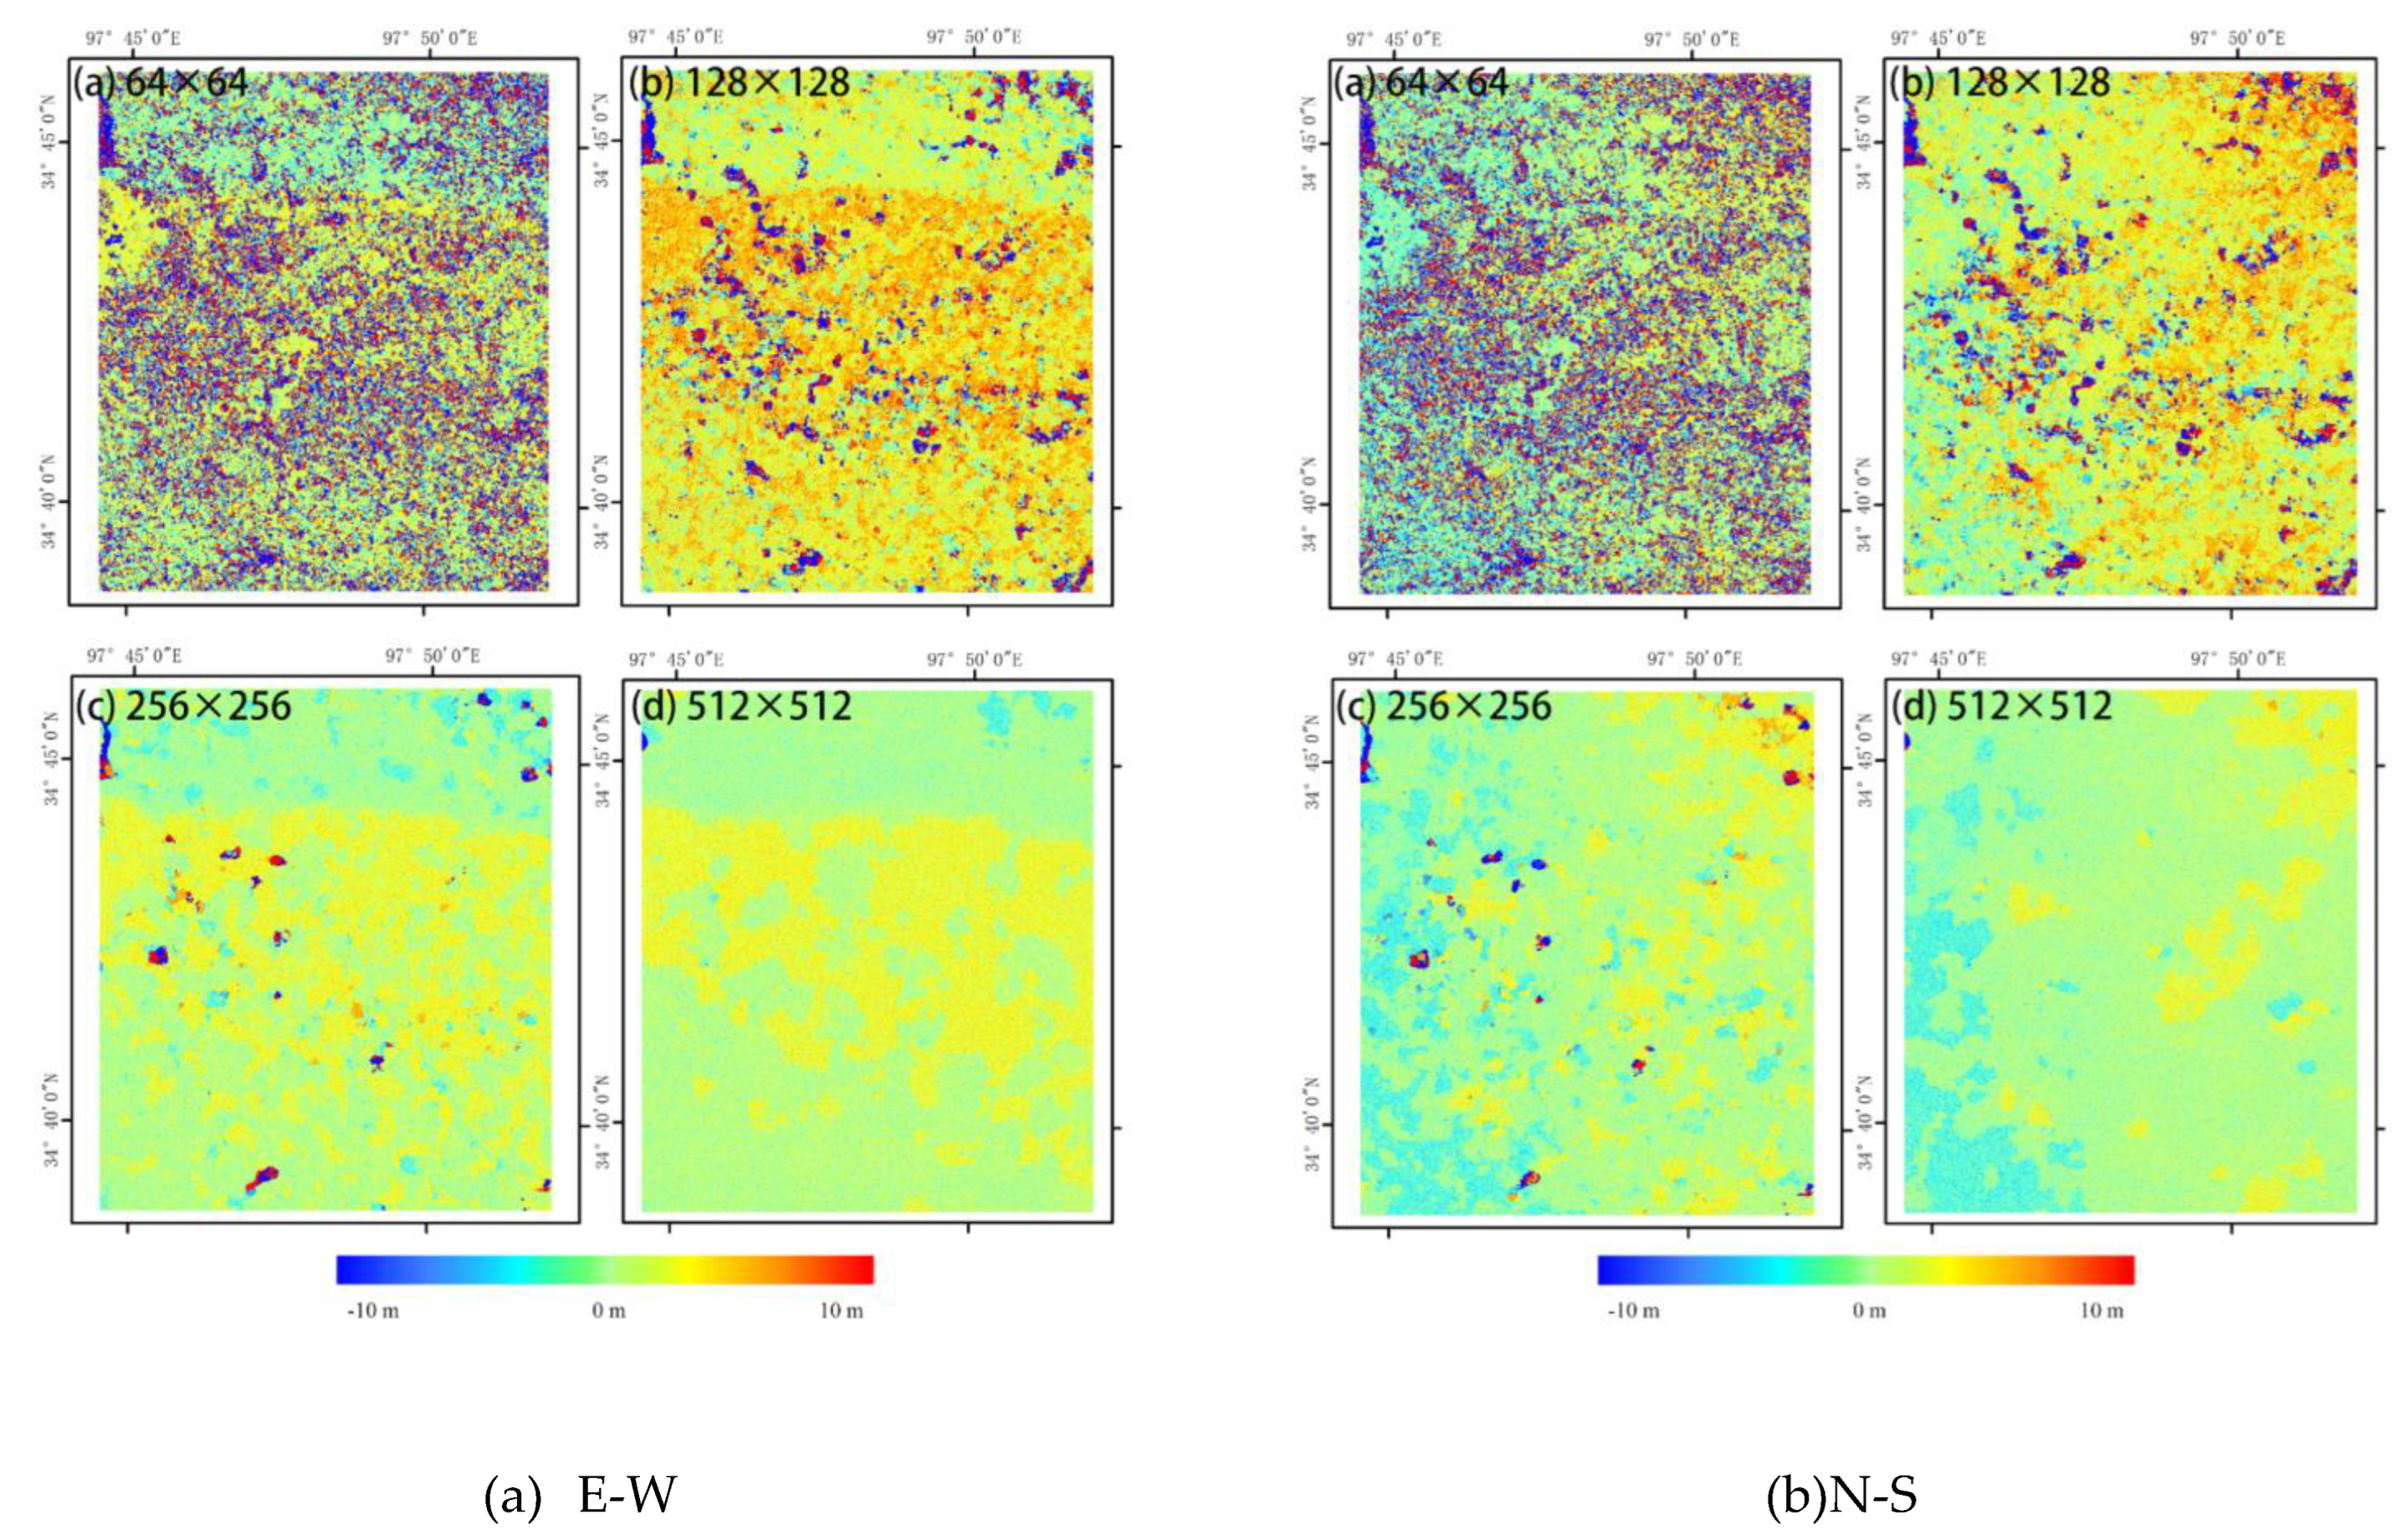
So in this paper, In order to explore the effect of different matching Windows on the results, with the same settings for the remaining parameters (step size of 2 pixels, number of iterations of 2, and signal-to-noise ratio threshold set to the default value of 0.9), correlation was conducted by COSI-Corr at scales of 64×64, 128×128, 256×256, and 512×512 pixels. The east-west and south-north displacements are obtained respectively. Where north and east is positive, south and west is negative. The displacement results are shown in
Figure 3, as below, which demonstrates that the optical data occupied a smaller spatial area than the observations from SAR, but with higher spatial resolution, thus providing richer detailed information. Also, the variations in the coseismic displacement values obtained from the different correlation windows are more noticeable. The average displacement is positively correlated with correlation window size, and the noise significantly decreases under a larger window.
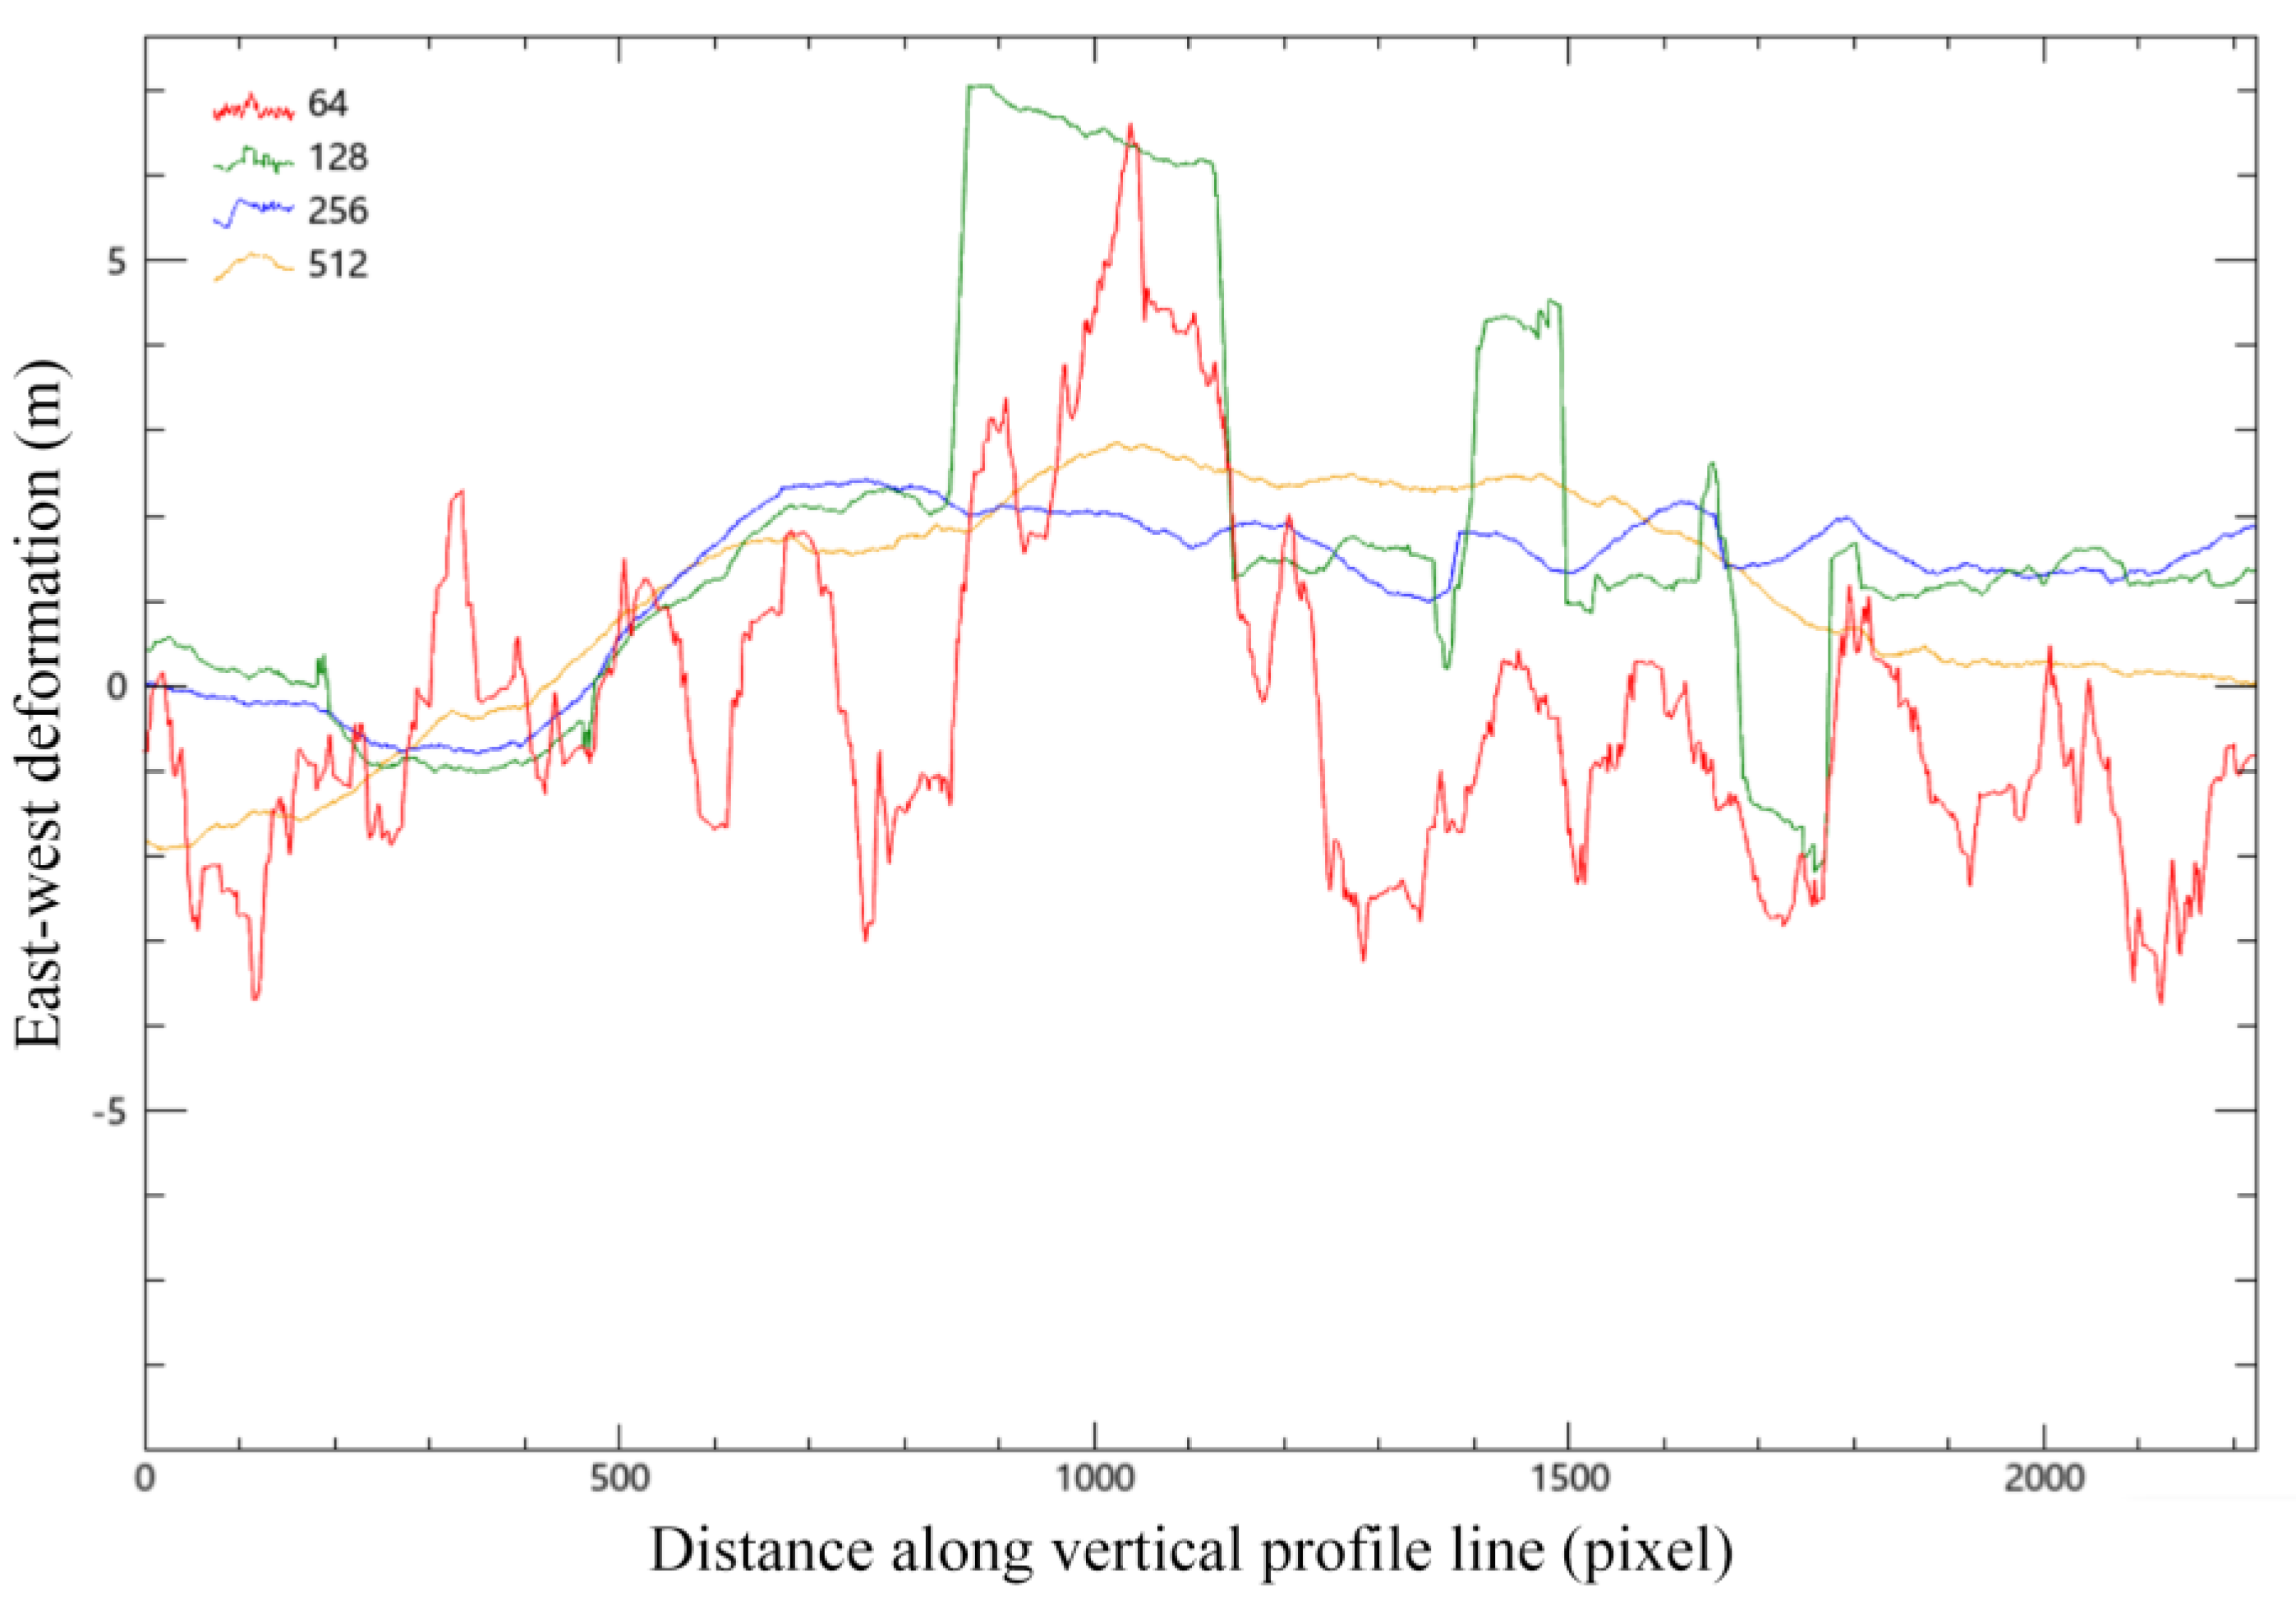
A vertical section line is drawn in the middle of the image, and the change of coseismic deformation with the distance of the section line under each window is analyzed.
Figure 4.
Vertical profile line analysis of the east-west deformation (around the 550th column of the abscissa was the location of the rupture zone); Number in the upper left corner is the size of the relevant window, e.g., 64×64 pixels.
Figure 4.
Vertical profile line analysis of the east-west deformation (around the 550th column of the abscissa was the location of the rupture zone); Number in the upper left corner is the size of the relevant window, e.g., 64×64 pixels.
To select the appropriate fusion scale, profile analysis was carried out, which determined that the four windows detected faults in the same column. The 64×64 pixel window was similar its 128×128 counterpart, wherein both exhibited more wavelet peaks. Analogously, the 256×256 and 512×512 pixel windows were also similar. Overall, across all window sizes, the performance was relatively flat. Nevertheless, determining which method was correct or incorrect was difficult, hence the attempt to fuse the results from a range of correlation scales to achieve greater uniformity. According to the above analysis, the subsequent steps selected the 128×128 and 256×256 pixel windows for interpolation fusion.
3. VACI Fusion Method
To address the issue of the correlation technology of optical images being affected by the size of the correlation window, this study employs a vector analysis method to fuse deformation results of varying scales during the correlation process. The study considers the spatial continuity of the deformation vector and applies weighted fusion to the results of different sized correlation windows for optical images.
With the exception of fault rupture areas, the surface displacements of adjacent points are usually correlated in geophysical processes such as earthquakes, and ignoring this correlation limits the accuracy of determining displacement [
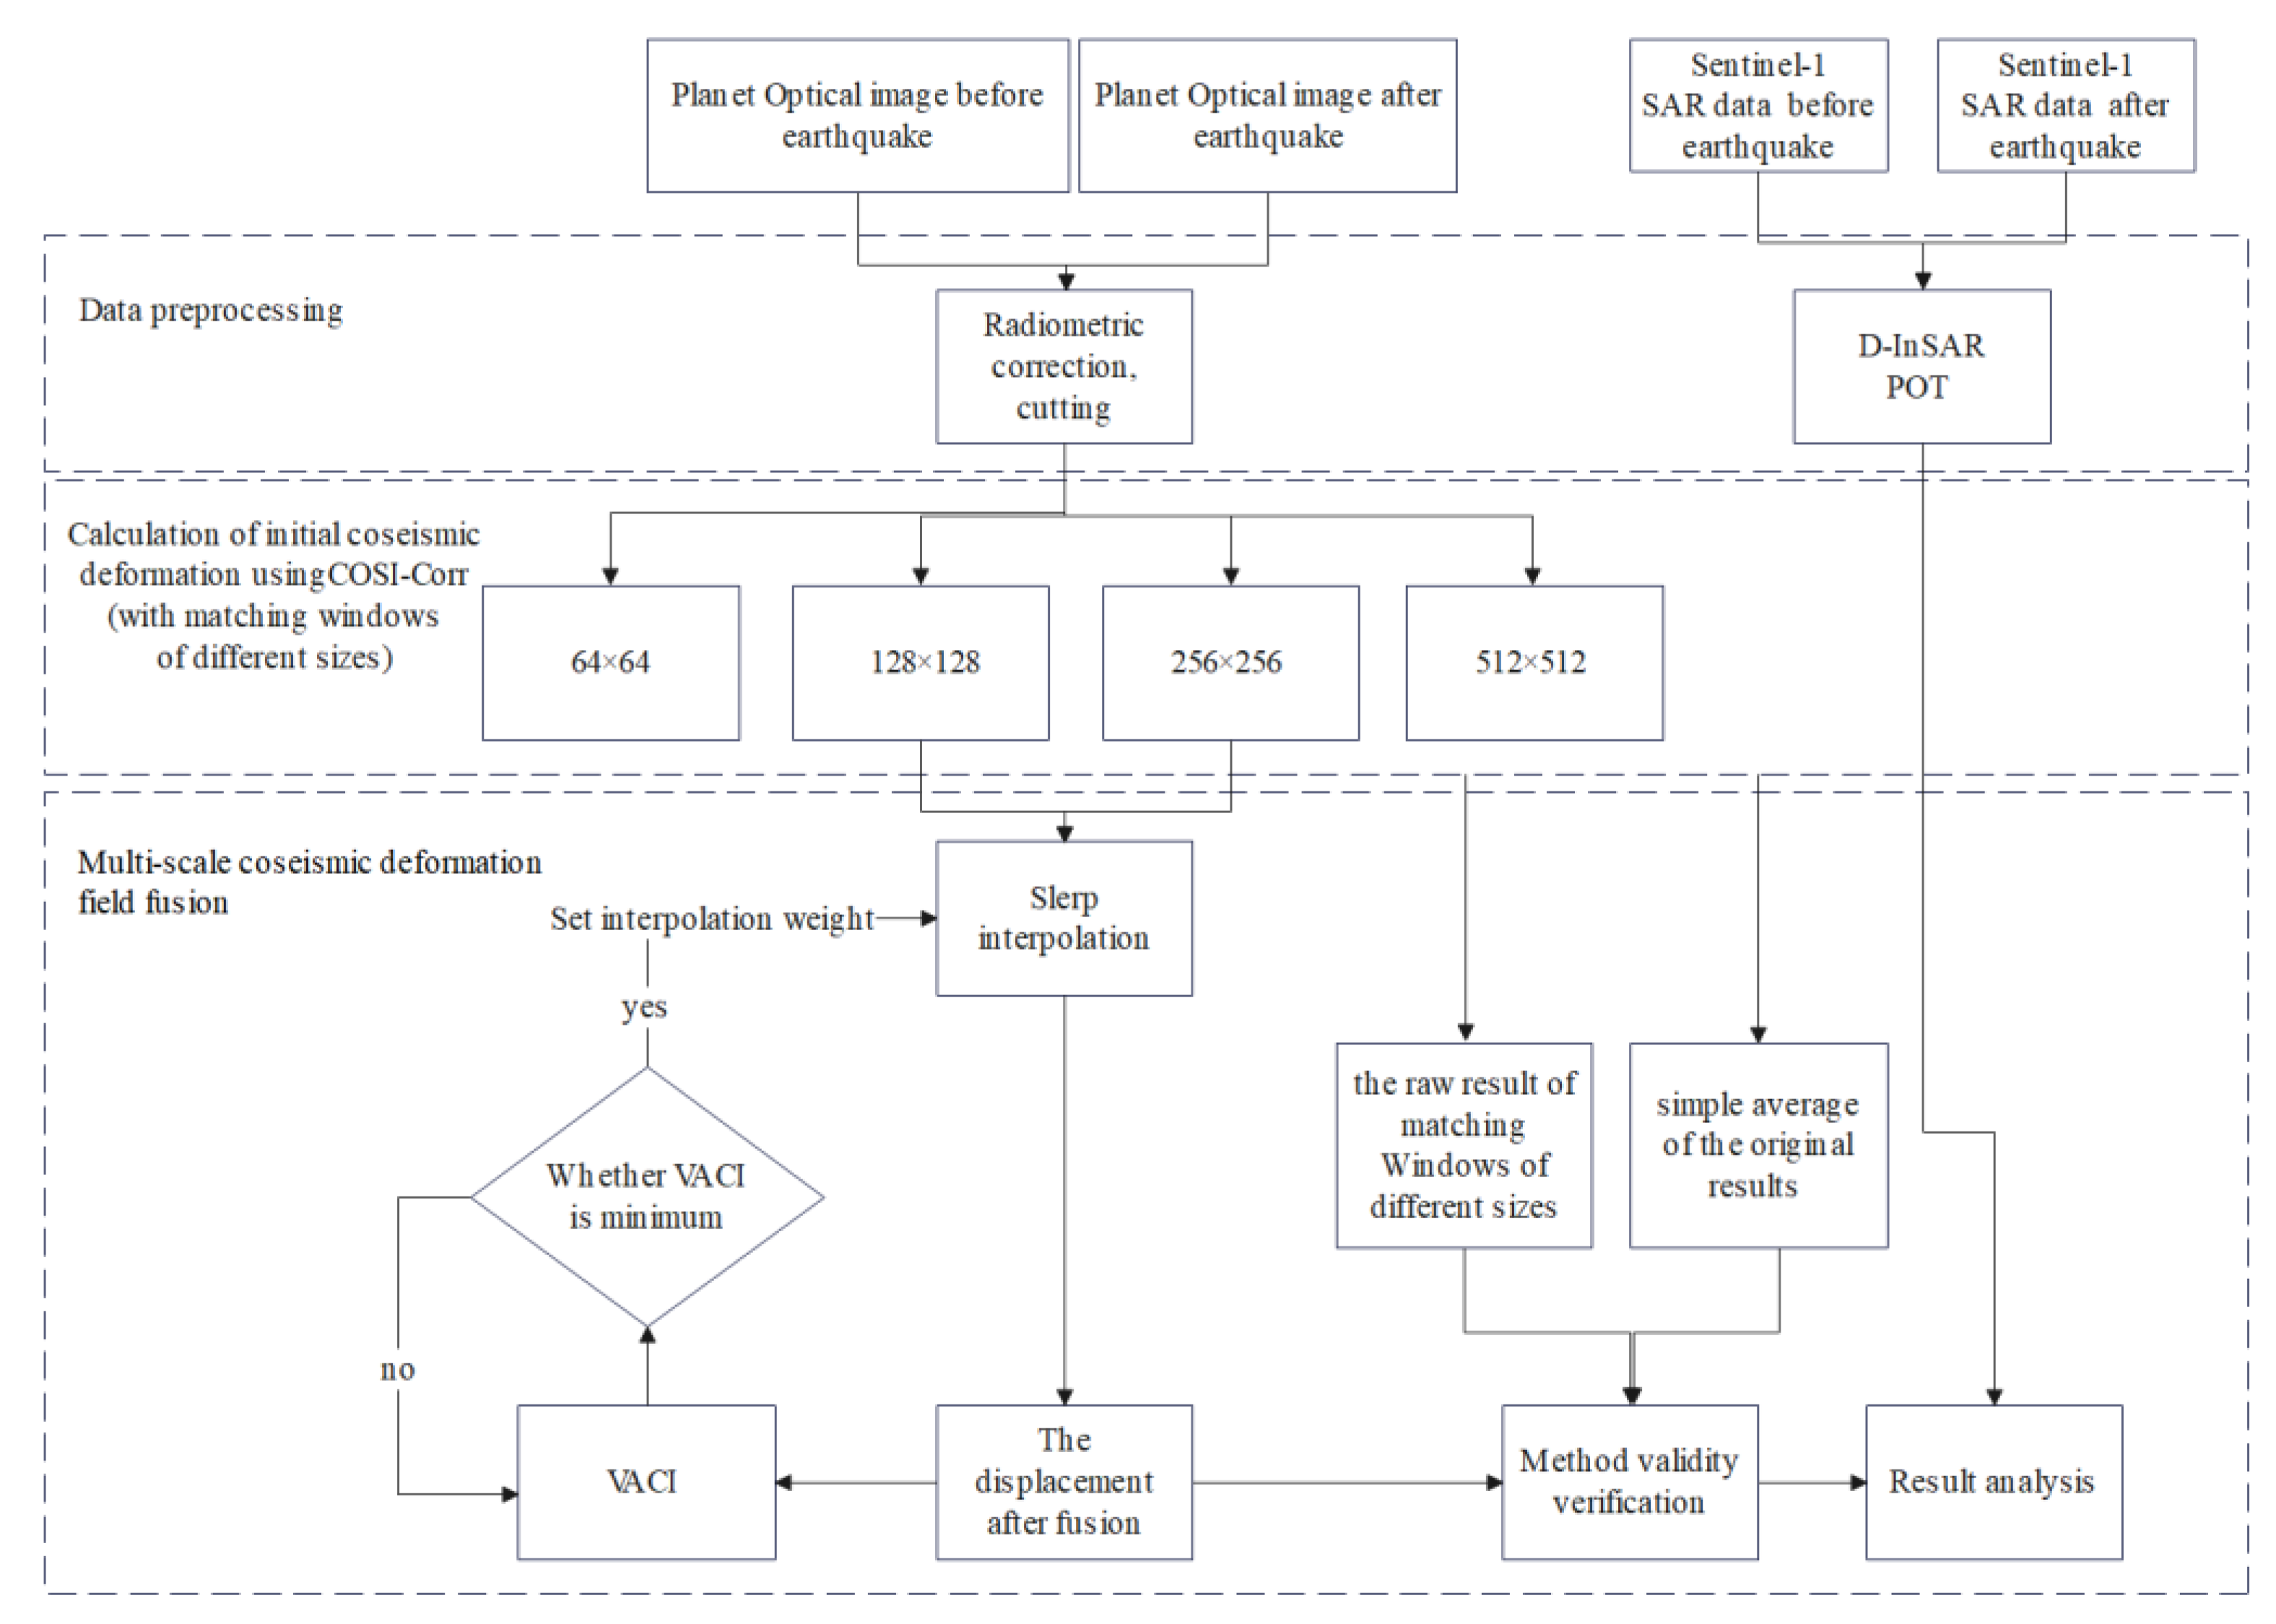
22]. Taking this into consideration, the Vector Angular Continuity Index (VACI) of coseismic deformation was used to determine the pixel-by-pixel adaptive fusion weights, and then the optical cross-correlation offsets of different size matching Windows in the above process are fused together. The following
Figure 5 is the technical flow chart of this article.
3.1. Coseismic Deformation Vector Angle Continuity Index
Displacement fields resulting from co-seismic or inter-seismic events can be represented by a three-dimensional vector for any given ground point. In the local reference system, this vector may be expressed as its North, East, and Vertical components. When generating a 2D displacement image, each pixel represents a single ground point displacement measurement. This is achieved by taking the scalar product of the real displacement and a vector (including North, East, and Vertical components) that represents the projection of the measurement onto the local reference system[
4]. The deformation components in the east-west and north-south directions were analyzed simultaneously in this paper. To do so, a two-dimensional vector
was used to represent the horizontal displacement of each pixel point by designating the east-west and north-south directions as the x- and y-axes, respectively (eastward and northward being positive directions). The angle between the deformation vector and the eastward direction was defined as the horizontal coseismic deformation angle, which was calculated by the arc-cosine function.
If each pixel center is taken as the origin, with the east-west direction as the x-axis and the north-south direction as the y-axis, with the positive direction being eastward and northward, then the actual horizontal displacement of each pixel can be represented by a two-dimensional vector, denoted as , where the subscript number represents the scale order.
The cosine of the deformation angle and the deformation magnitude can be calculated. Generally, within a certain observation scale, in a certain area far away from the fault with uniform geological characteristics, the spatial distribution of co-seismic deformation angles derived from optical images should exhibit a certain continuity. In the high spatial resolution optical images used in this article, there should be no significant jumps between adjacent pixels. Considering each pixel and its eight neighboring pixels, the displacement vectors can be represented by their coordinates , where i ranges from 1 to 9. To study the variations of the deformation angle between adjacent pixels, it is necessary to calculate the angle between two adjacent vectors. Two calculation methods are proposed: one is to calculate the angle between the two vectors directly using their dot product, i.e., ; the other is to first calculate the angle between each vector and a reference positive direction (horizontal east) separately, denoted as and , respectively, and then take their difference . After standardizing all deformation vectors, the formulas for calculating the angles using the two methods are and , respectively.
The Vector Angular Continuity Index (VACI) is defined as the average absolute difference in angle between the displacement vectors of a pixel and the eight surrounding pixels. This index describes the variation in displacement direction between a pixel and its neighboring pixels. The range of values for VACI should be between 0 and 1, and the unit is in radians. A higher VACI value indicates a larger difference in displacement direction between a pixel and its neighboring pixels, reflecting a more discontinuous and fragmented surface deformation in the neighborhood. A smaller VACI value indicates a smaller difference in displacement direction, reflecting a more continuous and consistent deformation direction in the neighborhood. Below are the formulas for calculating VACI using the two aforementioned methods.
Due to the lower time complexity, the first method of calculation is chosen.
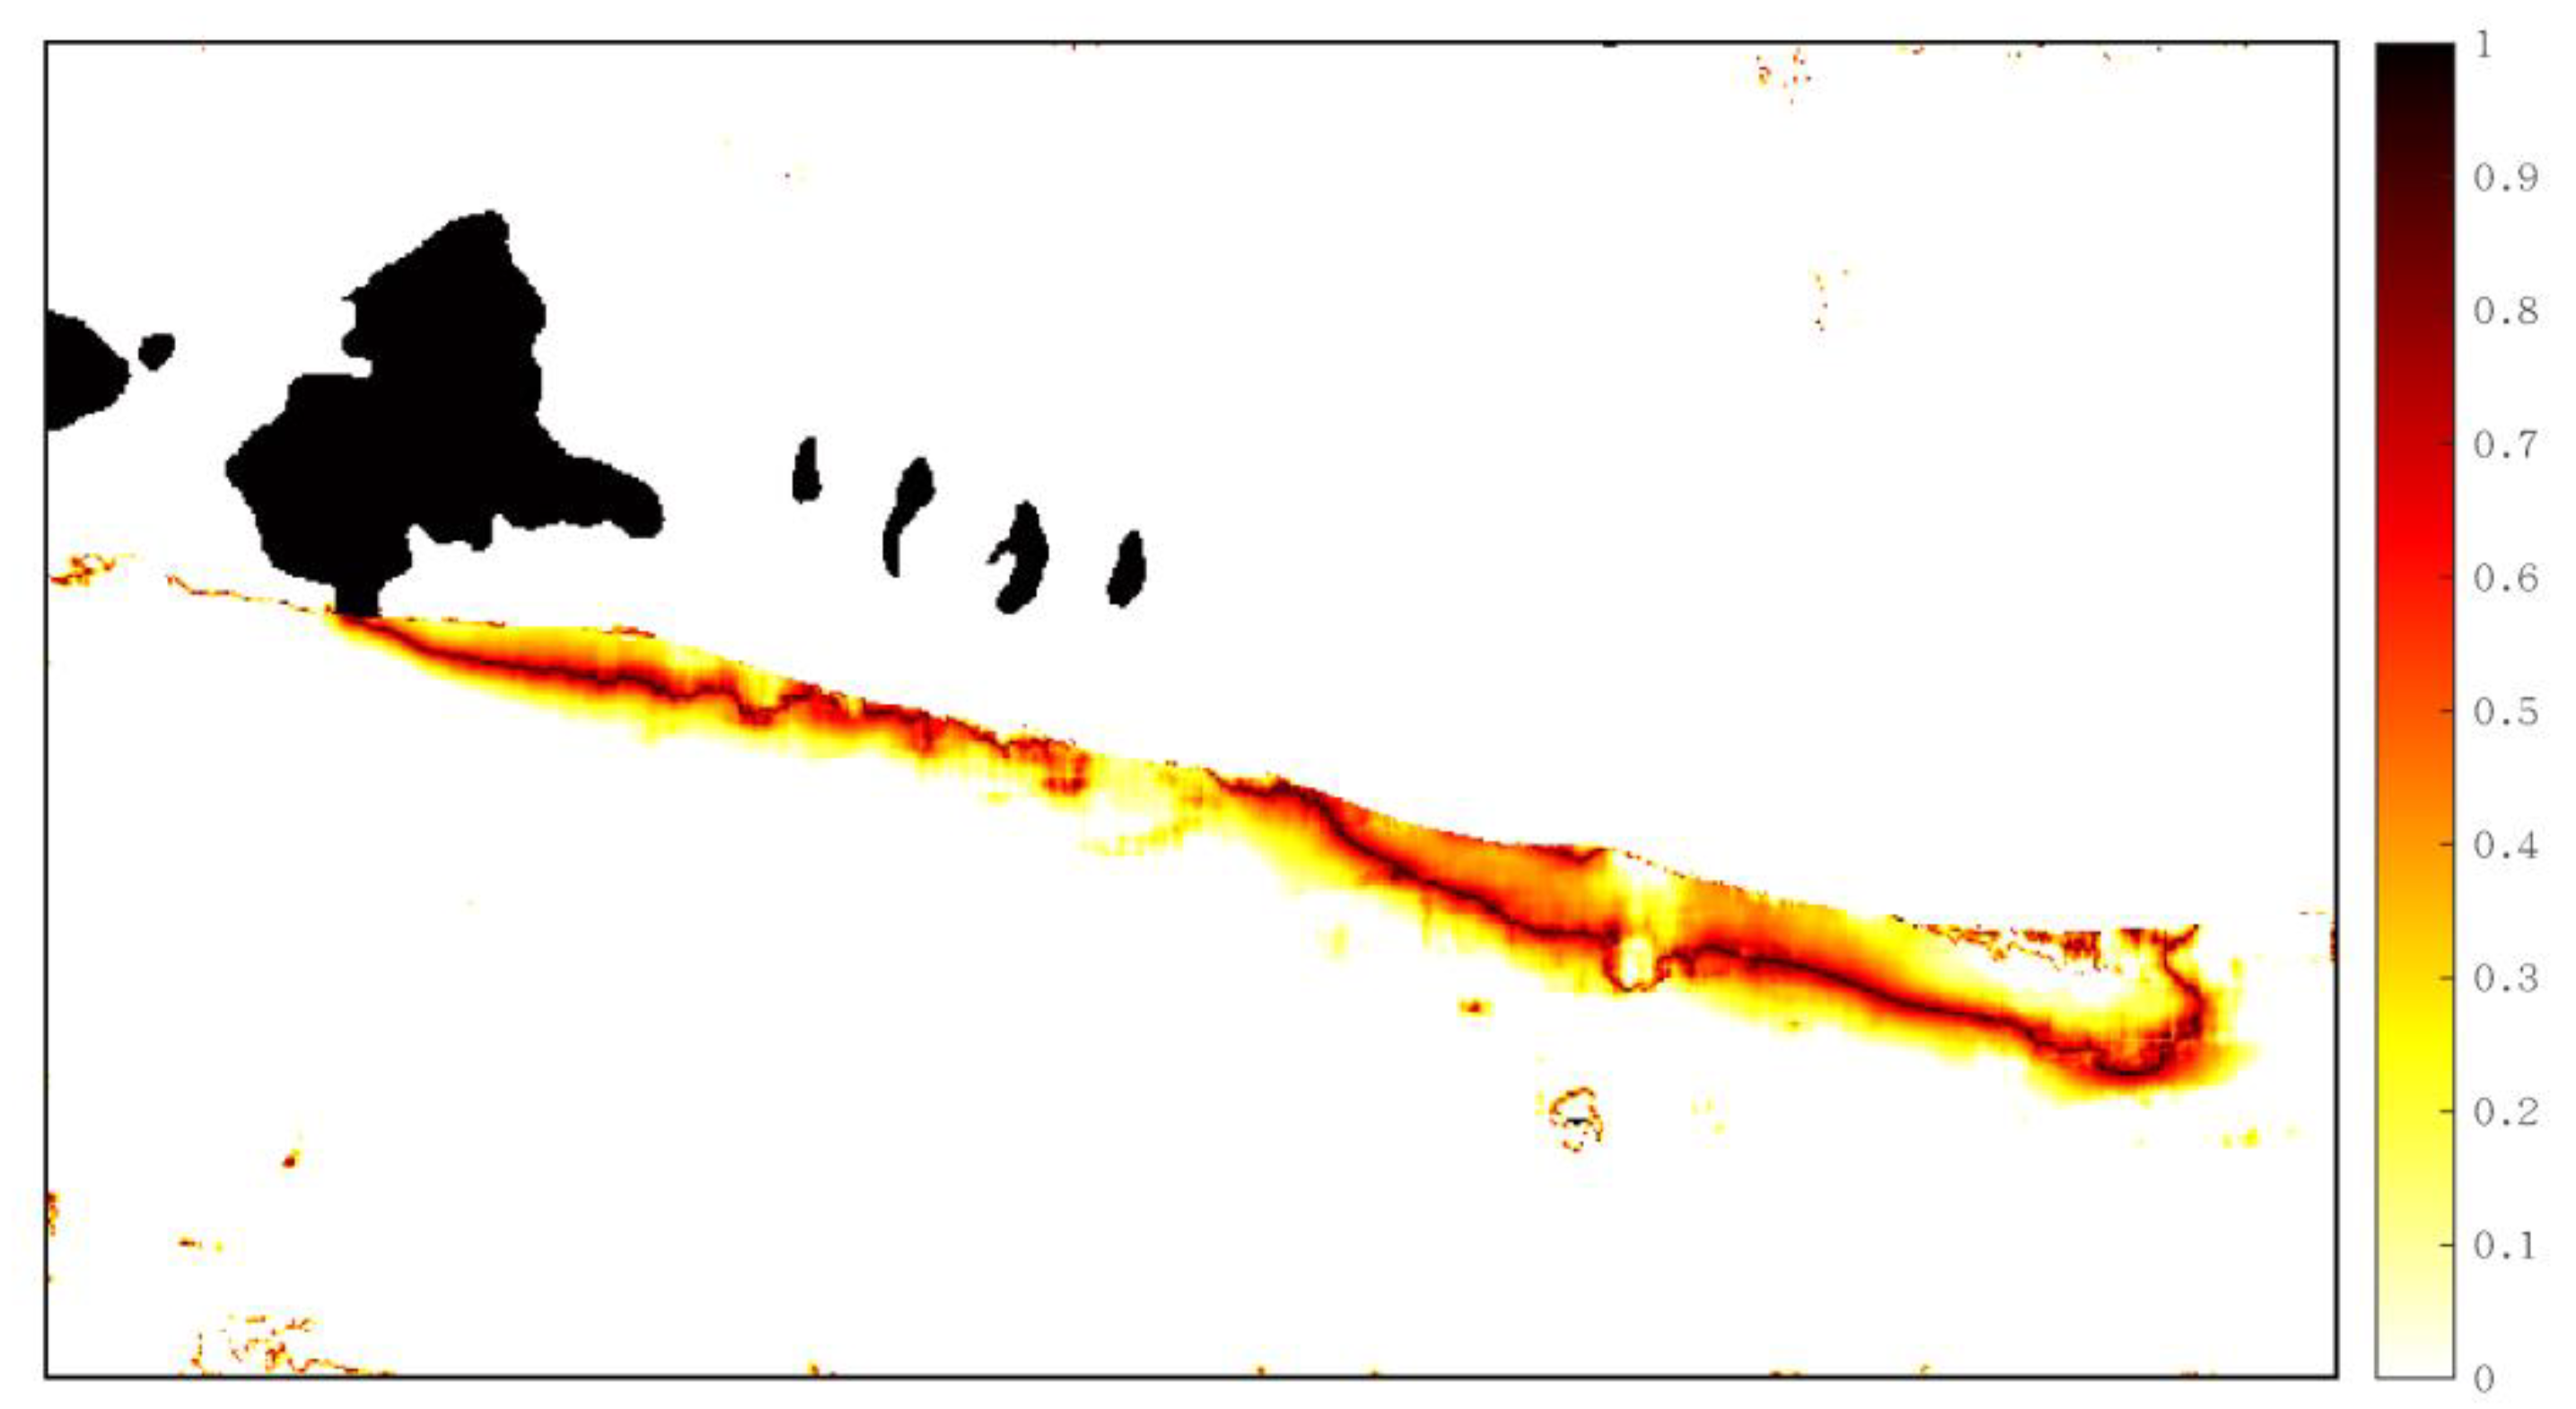
To test the reliability of VACI in detecting the angular properties of deformation vectors in the rupture and non-rupture zones, its distribution with respect to the deformation results obtained using POT from Sentinel-1 was calculated (
Figure 6). The VACI value was clearly greater along the rupture zone, reaching approximately 0.8 radians, and lower in other, more removed, areas. It was demonstrated that aside from the area adjacent to the rupture zone, the horizontal deformation vector retained better angular continuity even when the majority of the surface exhibited definite coseismic displacement. VACI suppressed the obvious burrs in the original image and revealed an obvious rupture zone in the near east direction of the Jiangcuo fault (which extends eastward from Eling Lake and bifurcates in the southeast). This was consistent with previously published optical images and analytical results [
25,
27]. As a result of phase incoherency, a silhouette surrounding the rupture zone appeared.
3.2. Multi-Scale Coseismic Deformation Field Fusion
To comprehensively describe the deformation characteristics at different deformation-related scales, the deformation vectors obtained at different scales are merged. The common merging method is to simply average the East-West and North-South components separately. However, from the perspective of vector analysis, this merging process is actually an interpolation process for two vectors of different sizes and directions. If a simple linear interpolation is used, the endpoint of the computed vector will always fall on the path between the difference of the two vectors, and the size of the resulting vector will always be smaller than the original vector, which is obviously not consistent with the actual situation of coseismic deformation vectors. Therefore, the Spherical Linear Interpolation (SLERP) method commonly used in computer graphics to describe vector movement is considered, since it has long been used in computer animation to interpolate movements between two 3D orientations [
31]. The weight which minimizes VACI was selected by testing a range of values (i.e., it was chosen based on the best angle direction continuity of the coseismic deformation vector).
and are the original deformation vectors obtained at different correlation scales, and is their angle. is the deformation vector obtained after interpolation. is the weight, determined by VACI. The SLERP interpolation results are constrained by the angle continuity index VACI proposed above, the interpolated deformation vector VACI value is calculated and selected to be the minimum, that is, the weight with the best angle direction continuity of the coseismic deformation vector.
4. Result and Discussion
Various errors exist in the horizontal deformation field obtained from data processing, including decorrelation noise, orbital errors, and terrain shadow errors. For decorrelation noise, a signal-to-noise ratio (SNR) threshold of 0.9 is set in the deformation field, and a mask is used to remove regions with an SNR below the threshold. Since there are no large mountains or terrain undulations in the study area, terrain shadow errors are not considered. As optical image correlation methods theoretically cannot detect deformations greater than half the size of the matching window, extremely large and small deformation values greater than half the window size are replaced with null values, and the missing values are then filled using inverse distance weighting, thereby removing decorrelation noise.
Orbital errors appear in the deformation results as a global intrinsic quantity and are often removed using a polynomial surface fitting model. Reference points are established in the non-deformation areas, and the desired parameters are solved using the least-squares principle. The simulated orbit error component of the whole image is subtracted from the original deformation field to obtain the true surface deformation field[
9].
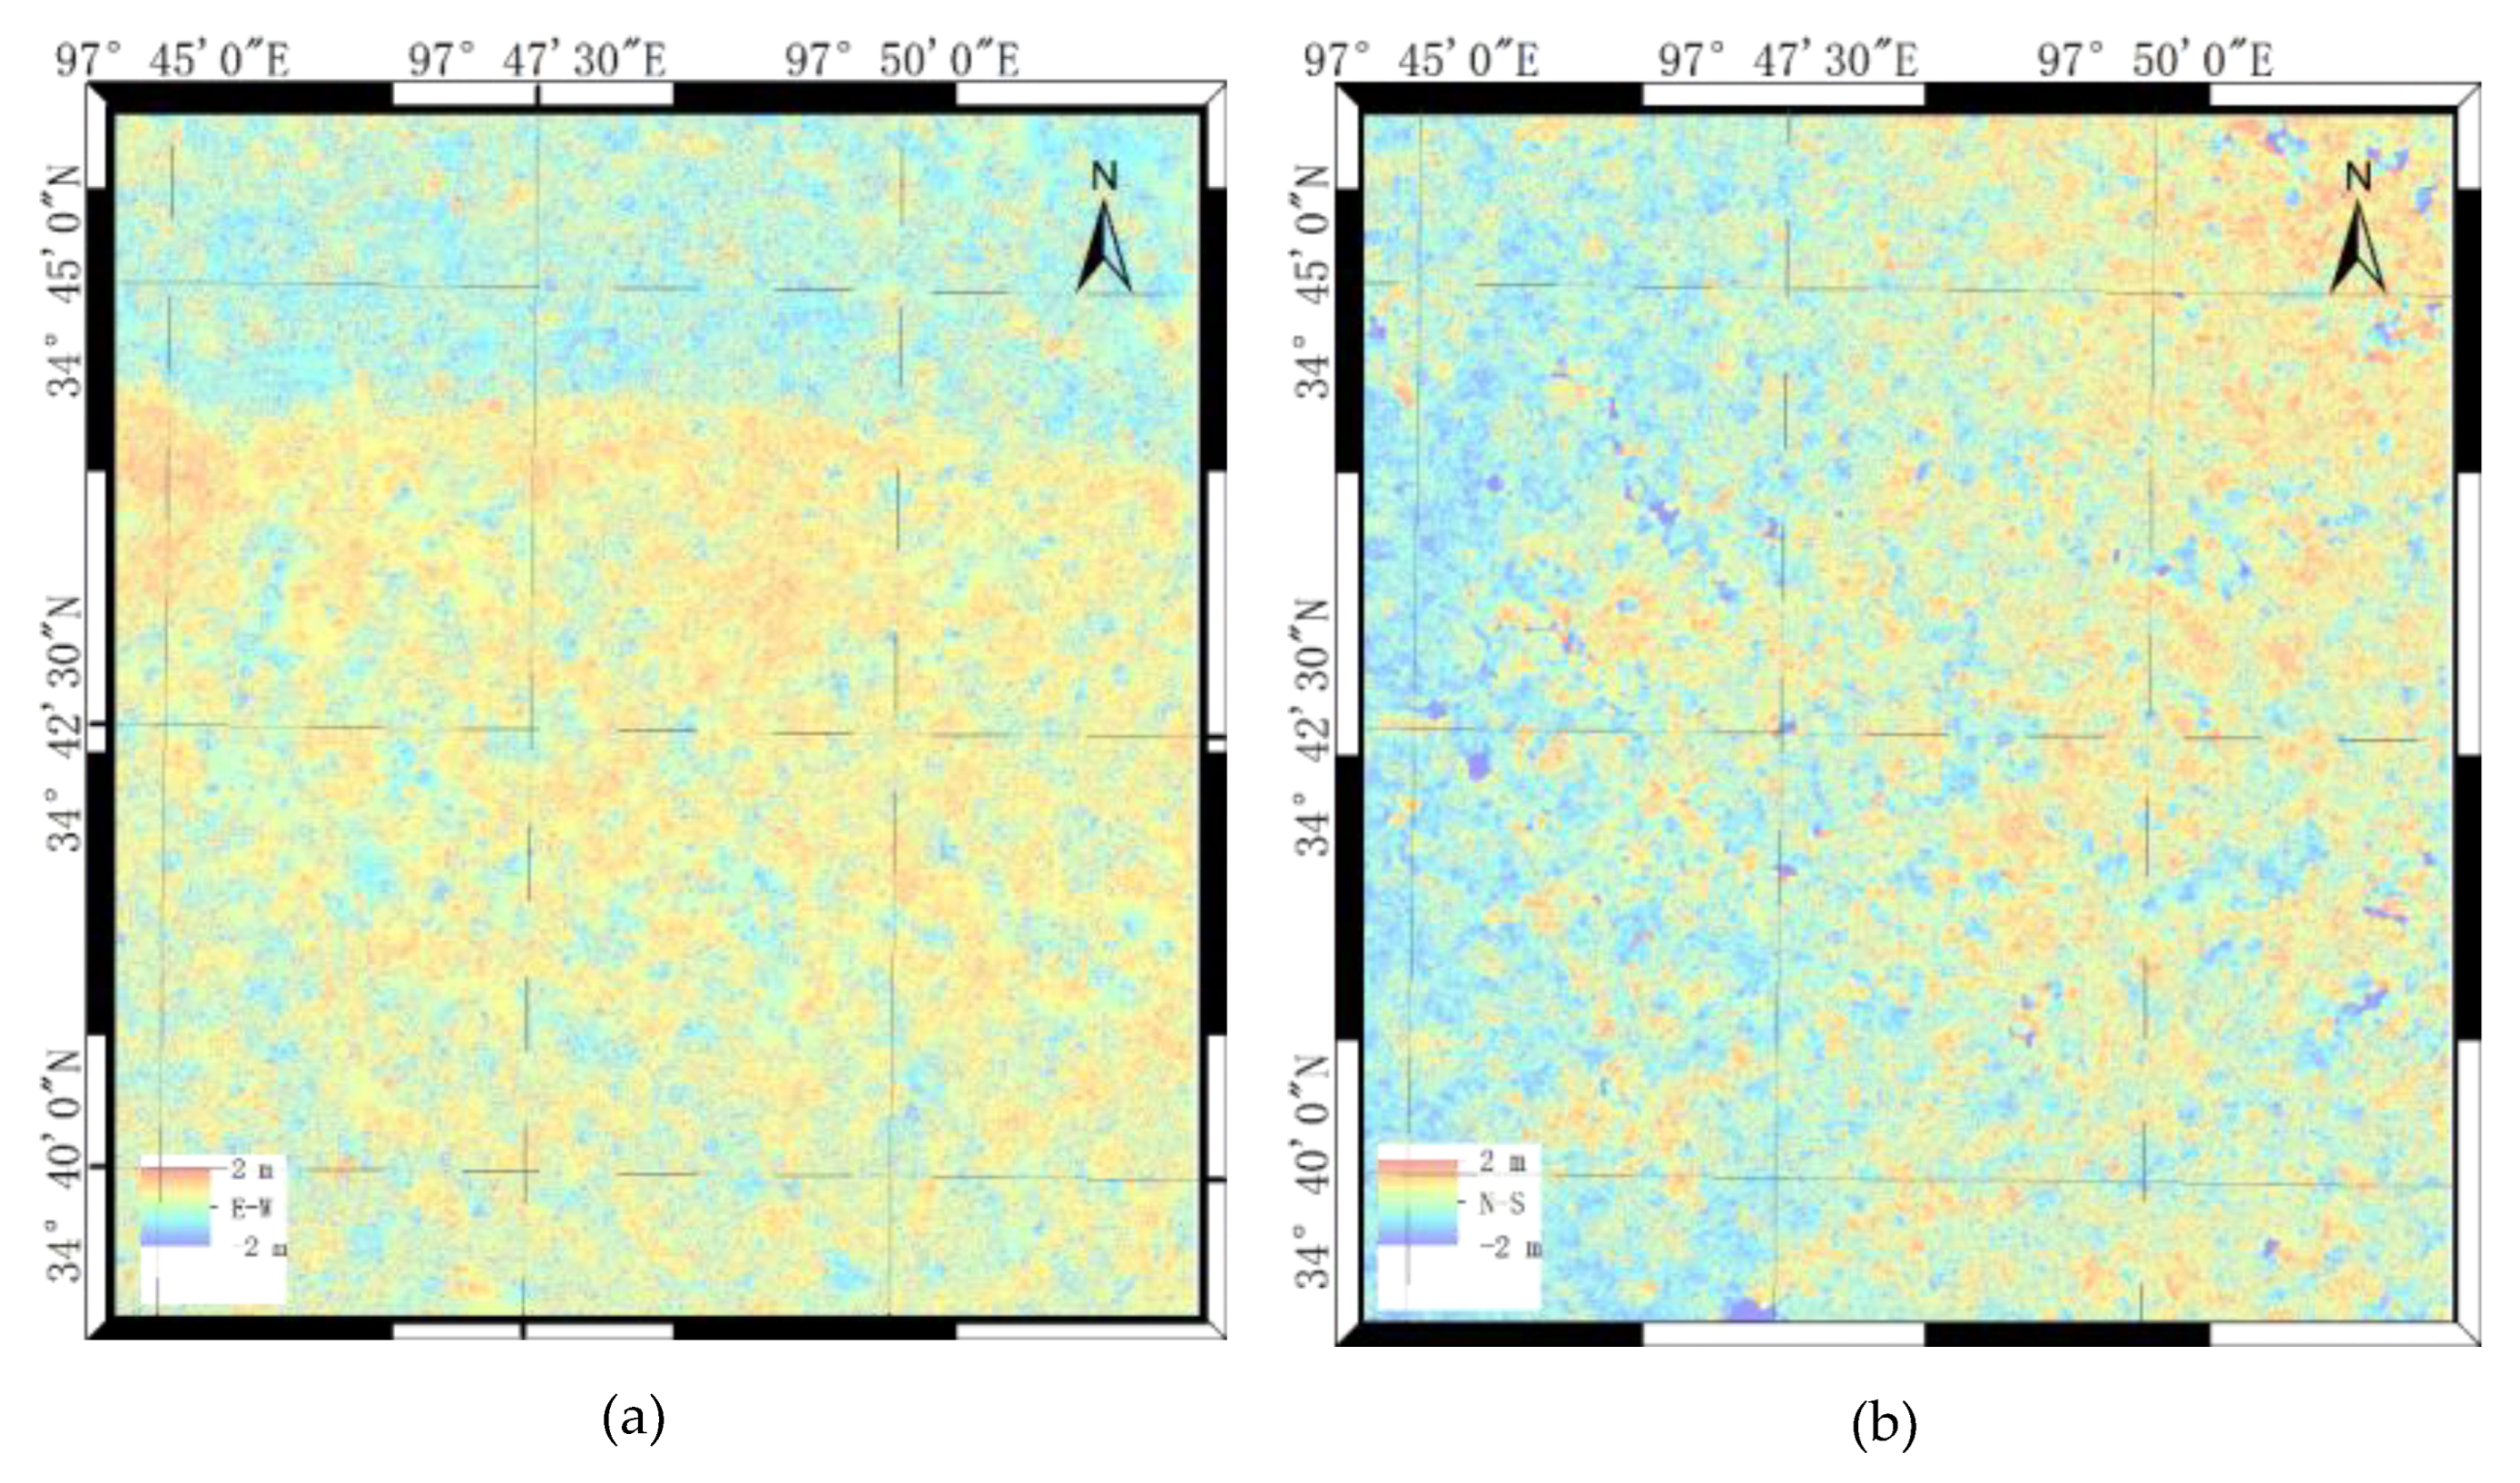
The final result obtained by using the VACI method introduced in the fourth part after error processing is displayed in
Figure 7, in which the strike-slip on the north and south sides of the epicentral rupture zone can be clearly discerned.
4.1. Method Evaluation
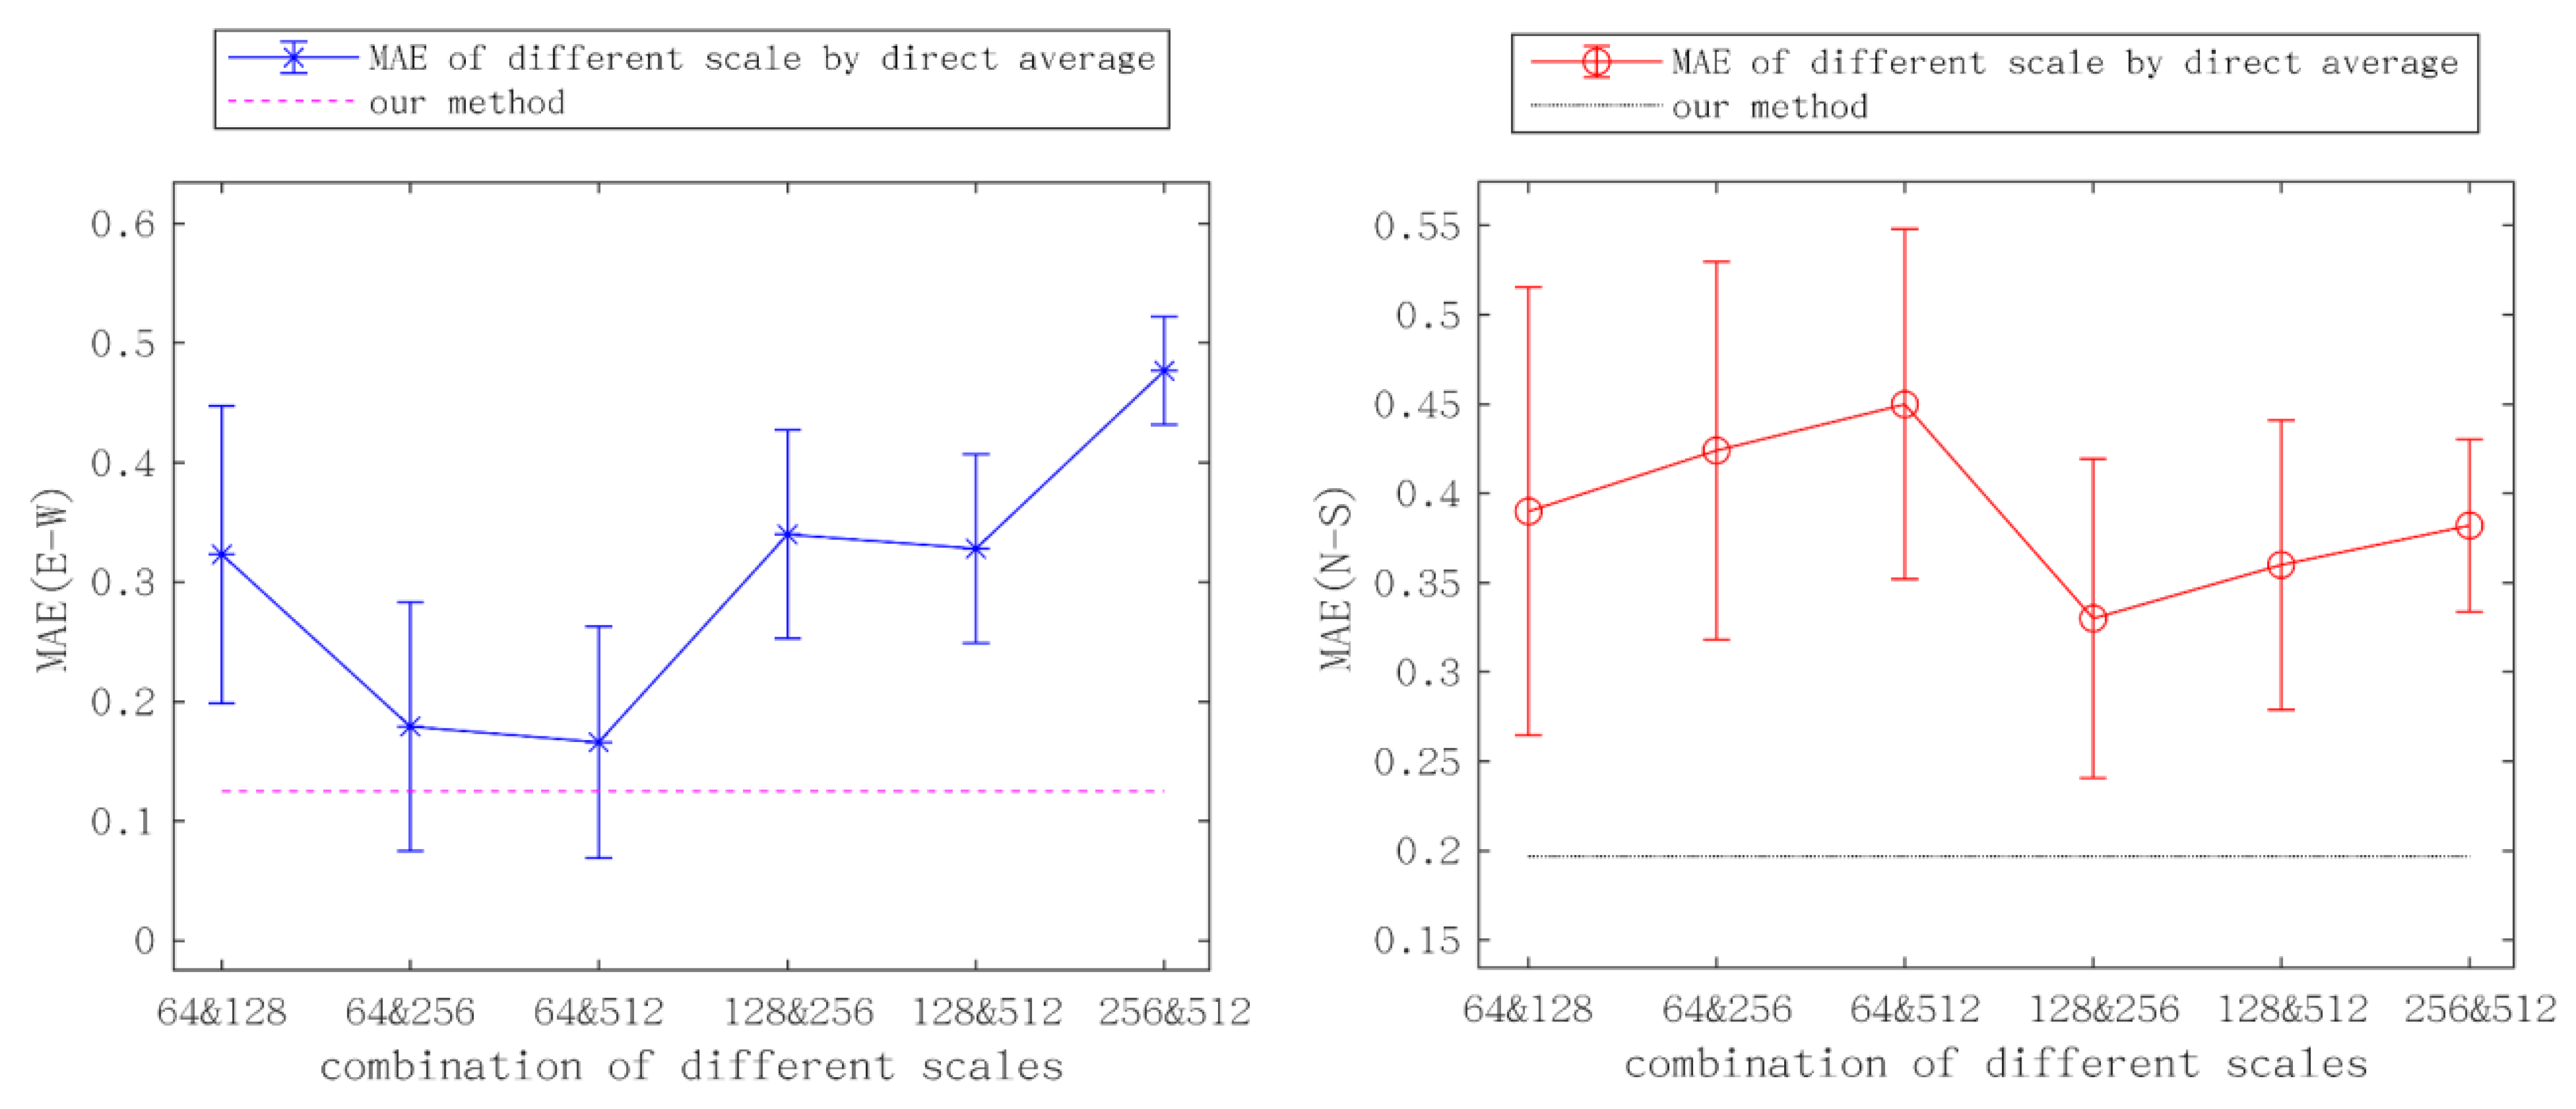
Due to a lack of high-precision field measurement data, results from Sentinel-1 POT were used as a reference, and the proposed method was compared to the original OIC deformation of different cross-correlation scales, as well as to the direct average of all the combinations of the original deformations across four scales, as shown in
Figure 8. The SAR data was parsed from the ascending and descending orbit data collected by Sentinel-1 before and after the earthquake, and processed using GAMMA software. After the first round of traditional registration, interference or calculation of displacement, de-leveling, geocoding, and other relevant steps, the results obtained were consistent with those of published studies, and thus this process was not repeated.
The proposed method significantly reduced the MAE. Specifically, and notably, in the east-west deformation, the average of all correlation scales with a 64×64 pixel size had a lower MAE, whereas it was higher in the north-south deformation for the results of the fusion with same correlation scale. This observation implies that the correlation scale and the deformation direction were heterogeneous, which confirms the influence of correlation scale selection on the results. Additionally, The proposed method also significantly improved the peak signal to noise ratio (PSNR) and reduced the root mean square error (RMSE) as shown in
Table 1. The accuracy of the results of the east-west deformation is significantly improved, with a 99% reduction in STD and a 74% reduction in MAE. The STD of north-south deformation is reduced by 95%, and MAE is reduced by 56%. Despite the fact this method is based on the fusion of two scales, the results were shown to be superior to any single scale’s results, and the east-west and south-north directions show the greatest improvements.
4.2. Results and Discussion
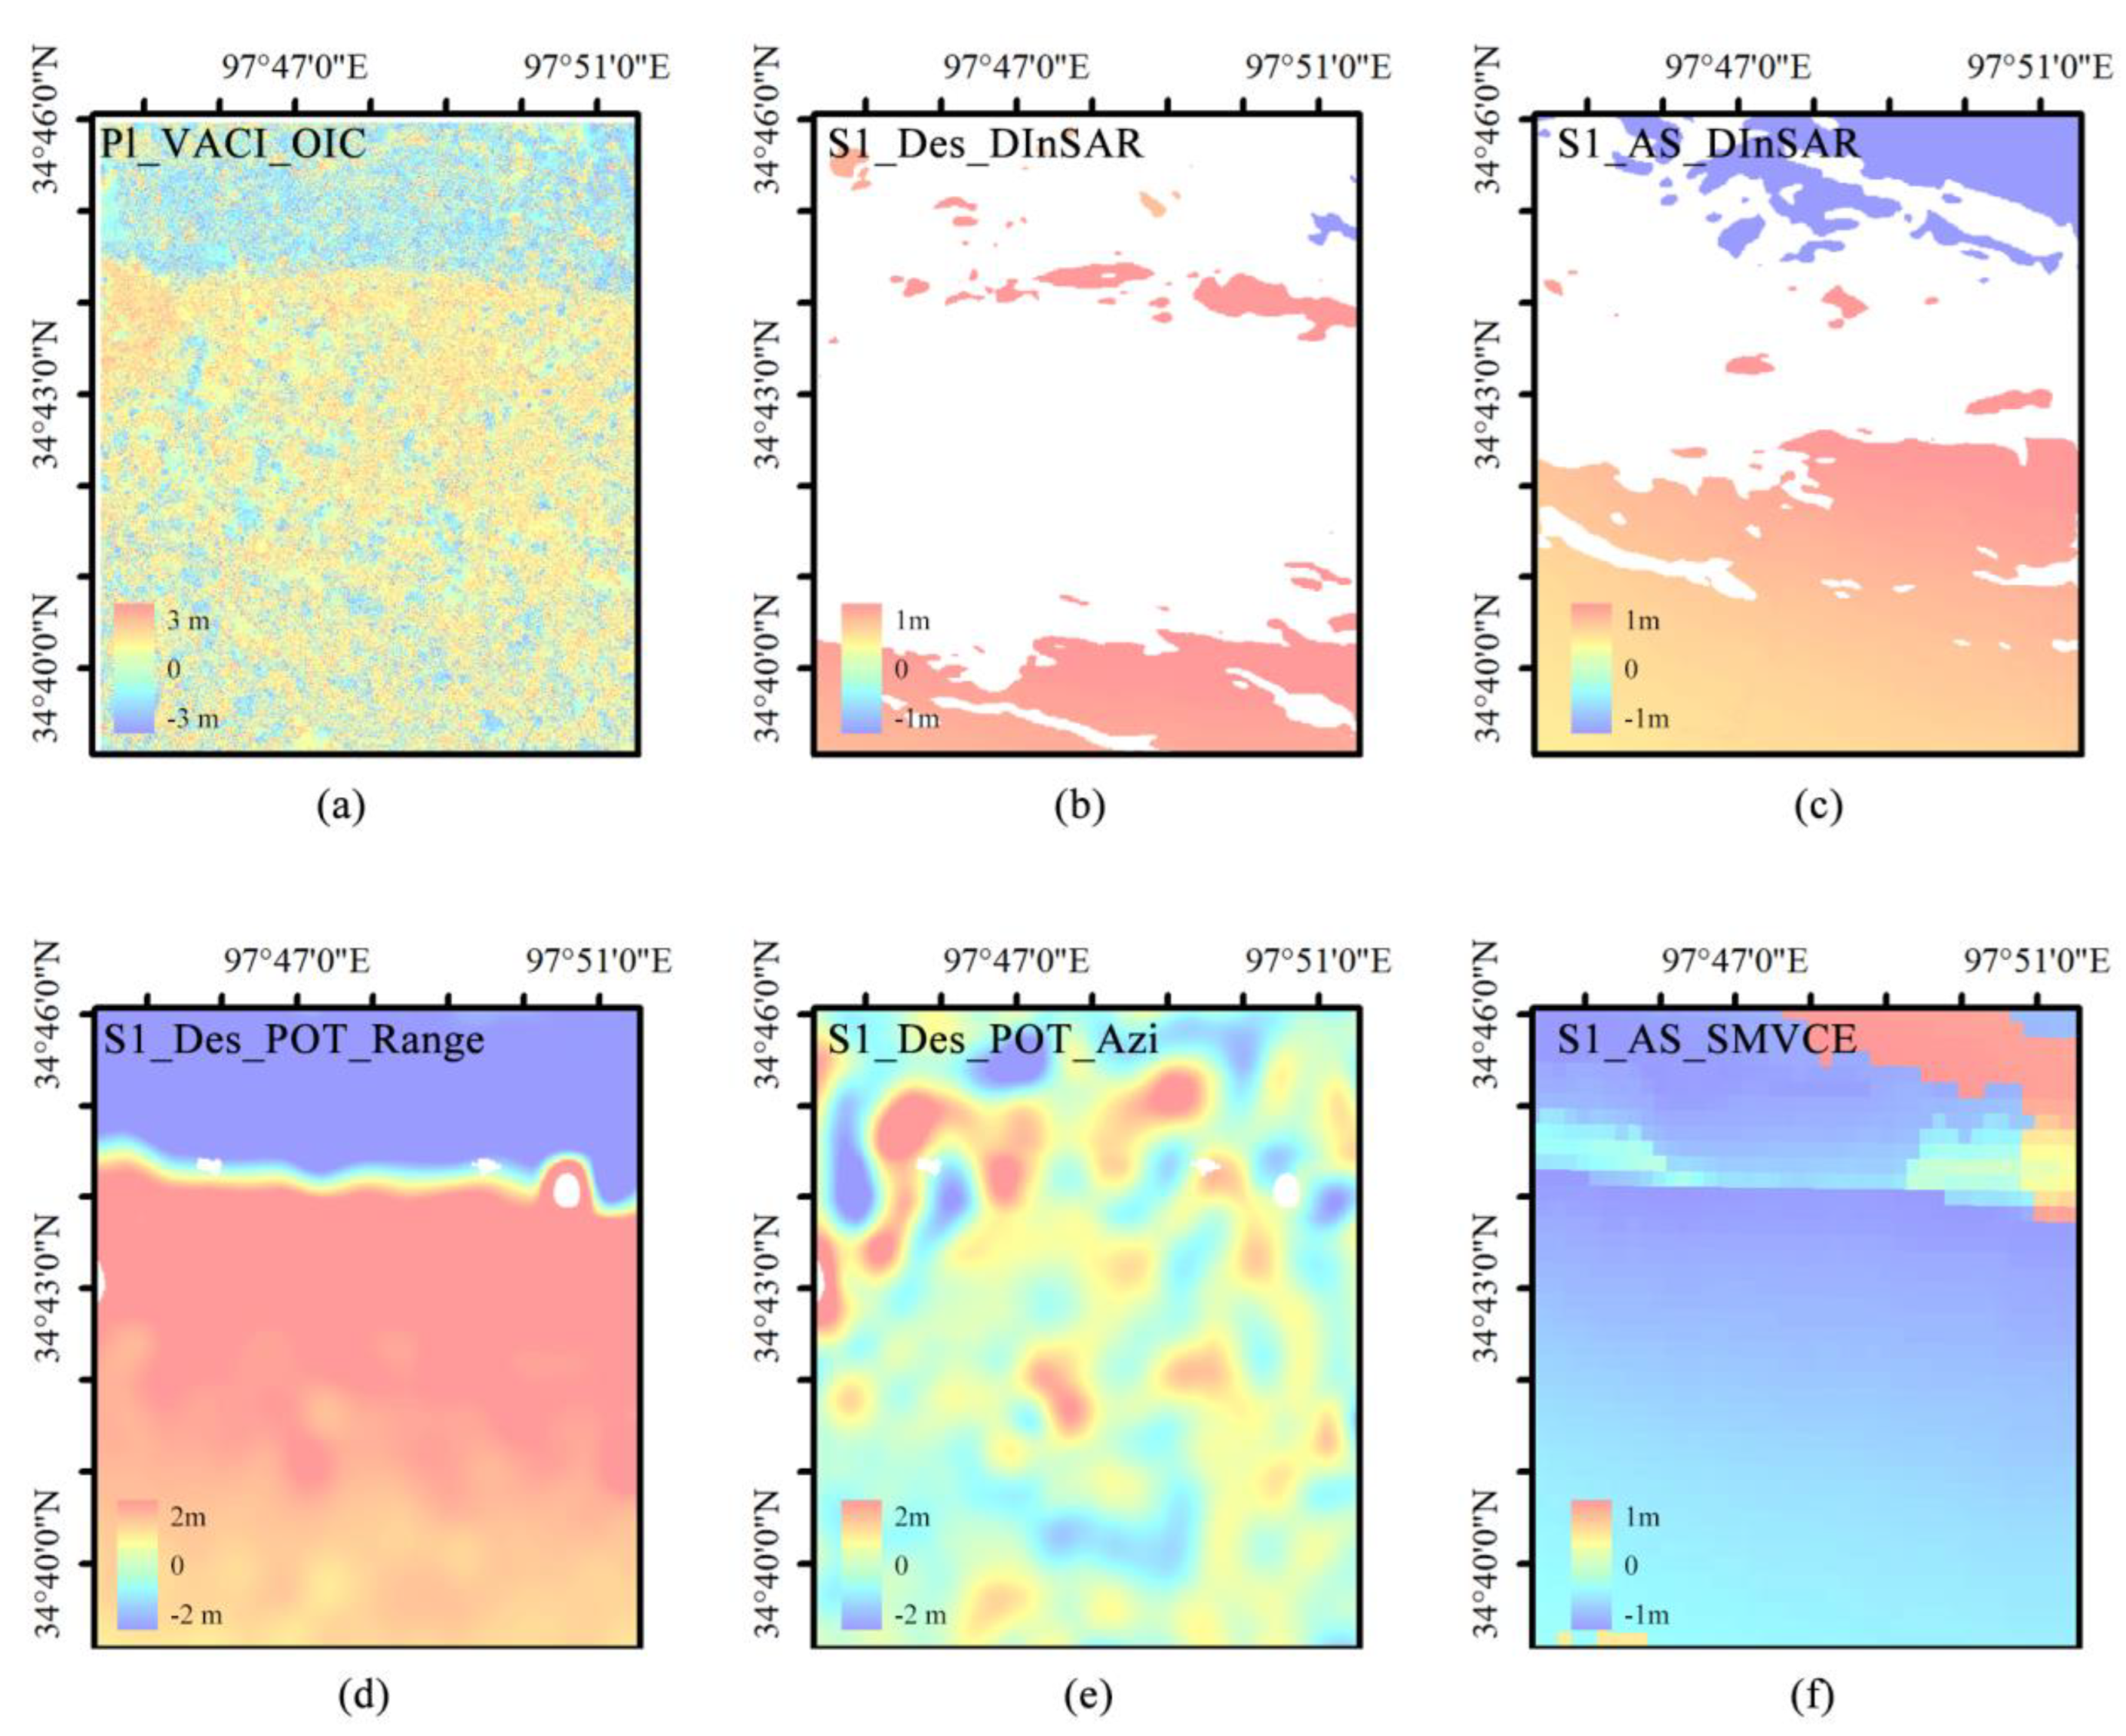
The VACI OIC method results were compared to those obtained via the traditional D-InSAR and SAR POT techniques for the southern part of Eling Lake and the western end of the rupture zone as shown in
Figure 9. To sort the various sets of data, a combination of several abbreviated letters connected by underscore characters was used to represent the corresponding displacement observations (e.g., ‘S1_AS_POT_AZI’ denotes the POT observation of ascending Sentine1-1 data along the AZI direction, whereas ‘S1_DES_D-InSAR’ denotes the D-InSAR observation of descending S1 data).
Severe decoherence and sizable missing areas were noticeable in the InSAR results. Meanwhile, the POT generated more noise, and its results from downgraded data showed small areas missing from the region around the epicenter. This phenomenon was observed due to the extreme horizontal displacement changes which occurred in these regions. The modulus of the deformation vector was calculated to facilitate comparison. Deformation data from areas with poor coherence could be extracted using optical remote sensing images, and the resolution which resulted from this was much higher than that of POT. Moreover, POT was only able to obtain more intuitive results in the distance direction, while the Sentinel-1 orbit descent POT method results were very blurred and in which almost no deformation could be seen.
Among the methods surveyed, SAR POT is the one that best matches the results of this study and provides superior visual effects. Its spatial resolution, however, is limited, and it struggles to capture detailed features (although such limitations are not well demonstrated in this study). In contrast, the use of high-resolution optical imagery, illustrated in Figure (a), enables higher-resolution estimates. In our processing, the original optical cross-correlation offset calculation results were post-processed under the constraints of geophysical significance. This approach involved optimizing the window size and resulted in a less noisy and more reliable estimate, which in turn significantly improved the signal-to-noise ratio of the original optical cross-correlation offset calculation results.
5. Conclusion
In remote sensing technology for obtaining coseismic deformation, optical image correlation has advantages such as high precision and immunity to the influence of decorrelation in the epicentral area. When using the optical correlation offset tracking technique to detect co-seismic deformation, the spatial sampling and measurement accuracy depend greatly on the local image correlation. The calculation of offsets assumes that the two images are only different by a local translation that remains constant over the area represented by the sliding window. The variability of the phase shift on the scale of the sliding window provides an estimation of the measurement's consistency[
32]. To improve the performance of point target analysis in non-uniform motion areas, it is crucial to accurately evaluate the similarity of two candidate pixels, particularly when using small-scale matching windows. Although large matching windows enhance measurement accuracy, they compromise resolution and blur small-scale motion details[
33]. Therefore, achieving a balance between two window sizes is crucial for accurately evaluating pixel similarity. The size of the matching window directly affects the reliability and accuracy of the results. In order to reduce the influence of different correlation scales (matching window sizes) on the results, this paper attempts to merge the deformation window results of large and small scales, with the aim of obtaining a deformation vector field that is superior to any single correlation scale.
In this work, the conventional correlation of surface displacements between adjacent points in the non-fault rupture region was considered. This offered an innovative approach, taking the resonance deformation vector as the research object and including the angular continuity index of the deformation vector (VACI). This index was implemented as a constraint to fuse the deformation results of different correlation scales obtained by OIC to obtain a vector field better than any relevant individual scale. Taking the 2021 Maduo earthquake as the subject of our proposal, high-resolution optical images allowed the generation of two-dimensional deformation fields and vector maps of the study area, from which the rupture zone was successfully detected via VACI.
The effectiveness of the method we proposed here was demonstrated by comparison with the traditional single correlation scale and simple average of two-scale combinations, which showed that the accuracy of the east-west deformation results was clearly improved. Also, in contrast to POT technology, it was able to provide a two-dimensional deformation field with higher spatial resolution and local detail information. Also, when compared to D-InSAR, our method demonstrated superior effectiveness with respect to information from areas with large deformations and severe decoherence near the rupture zone. However, the deformation field obtained in this study only accounted for a small portion of the area affected by the Maduo earthquake deformation field due to the limited range of available Planet images. Consequently, the VACI was defined within the context of only eight neighborhoods. Even so, the VACI of a larger neighborhood can be defined, such that more surrounding pixels are considered, which may be more appropriate for large correlation scales.
Author Contributions
Conceptualization, Qiming. Zeng and Rui.Guo; methodology, Rui.Guo.; software, Rui.Guo.; validation, Rui.Guo; formal analysis, Rui.Guo.; investigation, Rui.Guo.; resources, Rui.Guo.; data curation, Rui.Guo., Shangzong.Lu; writing—original draft preparation, Rui.Guo.; writing—review and editing, Qiming.Zeng.; visualization, Rui.Guo.; supervision, Qiming.Zeng.; project administration, Qiming.Zeng. All authors have read and agreed to the published version of the manuscript.
Data Availability Statement
Acknowledgments
The authors would like to thank the Planet Labs PBC for supplying the Planet images, the European Aeronautics Agency (ESA) for providing the Sentinel-1 SAR satellite data, the California Institute of Technology Tectonic Observatory for providing the software package for using the COSI-Corr technique (
http://www.tectonics.caltech.edu), and Jihong Liu et al. for providing the MATLAB toolkit for using the SM-VCE method.
Conflicts of Interest
The authors declare no conflict of interest.
References
- Lu, C.-H.; Lin, Y.-S.; Chuang, R.Y. Pixel Offset Fusion of SAR and Optical Images for 3-D Coseismic Surface Deformation. IEEE Geoscience and Remote Sensing Letters 2021, 18, 1049–1053. [Google Scholar] [CrossRef]
- Van Puymbroeck, N.; Michel, R.; Binet, R.; Avouac, J.-P.; Taboury, J. Measuring earthquakes from optical satellite images. Applied Optics 2000, 39. [Google Scholar] [CrossRef]
- Leprince, S. Monitoring Earth Surface Dynamics With Optical Imagery. American Geophysical Union 2008, 89, 11. [Google Scholar] [CrossRef]
- VADON, H.n. Earthquake displacement fields mapped by very precise correlation. Complementarity with radar interferometry. IGARSS 2000. IEEE 2000 International Geoscience and Remote Sensing Symposium. Taking the Pulse of the Planet: The Role of Remote Sensing in Managing the Environment. Proceedings (Cat. No.00CH37120);2000;6. 2004. [CrossRef]
- Leprince, S. Co-Registration of Optically Sensed Images and Correlation (COSI-Corr): an Operational Methodology for Ground Deformation Measurements. IGARSS 2007. [Google Scholar]
- François, A. Co-registration and correlation of aerial photographs for ground deformation measurements. ISPRS Journal of Photogrammetry and Remote Sensing 2009, 64, 551–560. [Google Scholar] [CrossRef]
- Aati, S.; Avouac, J.-P. Optimization of Optical Image Geometric Modeling, Application to Topography Extraction and Topographic Change Measurements Using PlanetScope and SkySat Imagery. Remote Sensing 2020, 12. [Google Scholar] [CrossRef]
- Ajorlou, N.; Hollingsworth, J.; Mousavi, Z.; Ghods, A.; Masoumi, Z. Characterizing Near-Field Surface Deformation in the 1990 Rudbar Earthquake (Iran) Using Optical Image Correlation. Geochemistry, Geophysics, Geosystems 2021, 22. [Google Scholar] [CrossRef]
- Leyang, W. Coseismic deformation of 2019 Ridgecrest earthquake sequence obtained by optical images correlation. Engineering of Surveying and Mapping 2021, 30. [Google Scholar]
- HELiji. Coseismicdisplacementsof2016MW7.8Kaikoura,NewZealandearthquake,usingSentinel-2 opticalimages. Acta Geodaetica et Cartographica Sinica 2019.
- Barisin, I.; Leprince, S.; Parsons, B.; Wright, T. Surface displacements in the September 2005 Afar rifting event from satellite image matching: Asymmetric uplift and faulting. Geophysical Research Letters 2009, 36, n. [Google Scholar] [CrossRef]
- Scheidt, S.P.; Lancaster, N. The application of COSI-Corr to determine dune system dynamics in the southern Namib Desert using ASTER data. Earth Surface Processes and Landforms 2013, 38, 1004–1019. [Google Scholar] [CrossRef]
- Leprince, S.; Barbot, S.; Ayoub, F.; Avouac, J.-P. Automatic and Precise Orthorectification, Coregistration, and Subpixel Correlation of Satellite Images, Application to Ground Deformation Measurements. IEEE Transactions on Geoscience and Remote Sensing 2007, 45, 1529–1558. [Google Scholar] [CrossRef]
- PanJiawei, B. , Li Chao, LiuFucai, LiHaibing, LiuDongliang, Marie LuceChevalier, WuKungang, WangPing, LuHaijian, ChenPeng, Li Chunrui. Coseismic surface rupture and seismogenic structure of the 2021-05-22 Maduo (Qinghai) MS7.4earthquake. ActaGeologicaSinic 2021, 95, 15. [Google Scholar] [CrossRef]
- Liu, J.; Hu, J.; Li, Z.; Ma, Z.; Wu, L.; Jiang, W.; Feng, G.; Zhu, J. Complete three-dimensional coseismic displacements related to the 2021 Maduo earthquake in Qinghai Province, China from Sentinel-1 and ALOS-2 SAR images. Science Bulletin 2021. [Google Scholar] [CrossRef]
- L, G.H. Coseismic surface rupture characteristics, causes and significance of the "5.22" MS 7.4 Earthquake in Maduo, Qinghai. Journal of Geomechanics 2021.
- Rossner, C.; Vana, P. Planet-Satellite Nanostructures Made To Order by RAFT Star Polymers. Angewandte Chemie-International Edition 2014, 53, 12639–12642. [Google Scholar] [CrossRef] [PubMed]
- Yang J Y, S.W.K. , HongSY, etal. Coseismic deformation analysis of the 2021 Qinghai Madoi M7.4 earthquake. Chinese J. Geophys. (inChinese) 2021, 64. [Google Scholar] [CrossRef]
- Fang, R.; Lv, H.; Hu, Z.; Wang, G.; Zheng, J.; Zhou, R.; Xiao, K.; Li, M.; Liu, J. GPS/BDS precise point positioning with B2b products for high-rate seismogeodesy: application to the 2021 Mw 7.4 Maduo earthquake. Geophysical Journal International 2022, 231, 2079–2090. [Google Scholar] [CrossRef]
- Ha, G.; Liu, J.; Ren, Z.; Zhu, X.; Bao, G.; Wu, D.; Zhang, Z. The Interpretation of Seismogenic Fault of the Maduo Mw 7.3 Earthquake, Qinghai Based on Remote Sensing Images—A Branch of the East Kunlun Fault System. Journal of Earth Science 2022, 33, 857–868. [Google Scholar] [CrossRef]
- Jing, L.X.-l.X.T.L.-Z. Distributed characteristics of the surface deformations associated with the 2021 MW7.4 Madoi earthquake,Qinghai,China. Seismology and Geology 2022, 44. [Google Scholar] [CrossRef]
- Liu, J.H., Jun; Li, Z.M., Zhangfeng Wu; Jiang, W.F. , Guangcai Zhu, Jianjun. Complete three-dimensional coseismic displacements due to the 2021 Maduo earthquake in Qinghai Province, China from Sentinel-1 and ALOS-2 SAR images. Science China Earth Sciences 2022, 65, 687–697. [Google Scholar] [CrossRef]
- Lyu, M.; Chen, K.; Xue, C.; Zang, N.; Zhang, W.; Wei, G. Overall subshear but locally supershear rupture of the 2021 Mw 7.4 Maduo earthquake from high-rate GNSS waveforms and three-dimensional InSAR deformation. Tectonophysics 2022, 839. [Google Scholar] [CrossRef]
- Xiao, L.; Zheng, R.; Zou, R. Coseismic Slip Distribution of the 2021 Mw7.4 Maduo, Qinghai Earthquake Estimated from InSAR and GPS Measurements. Journal of Earth Science 2022, 33, 885–891. [Google Scholar] [CrossRef]
- Xiong, W.; Chen, W.; Wang, D.; Wen, Y.; Nie, Z.; Liu, G.; Dijin, W.; Yu, P.; Qiao, X.; Zhao, B. Coseismic slip and early afterslip of the 2021 Mw 7.4 Maduo, China earthquake constrained by GPS and InSAR data. Tectonophysics 2022, 840. [Google Scholar] [CrossRef]
- Zhang, G.; Li, Y.; Hu, X. Nucleation mechanism of the 2021 Mw 7.4 Maduo earthquake, NE Tibetan Plateau: Insights from seismic tomography and numerical modeling. Tectonophysics 2022, 839. [Google Scholar] [CrossRef]
- Zhang, Q.; Wu, Y.; Guo, N.; Chen, C. Research on deformation characteristics of the 2021 Qinghai Maduo MS7.4 earthquake through coseismic dislocation inversion. Advances in Space Research 2022, 69, 3059–3070. [Google Scholar] [CrossRef]
- Liu, J.-H.; Hu, J.; Li, Z.-W.; Zhu, J.-J.; Sun, Q.; Gan, J. A Method for Measuring 3-D Surface Deformations With InSAR Based on Strain Model and Variance Component Estimation. IEEE Transactions on Geoscience and Remote Sensing 2018, 56, 239–250. [Google Scholar] [CrossRef]
- Hu, J.; Liu, J.; Li, Z.; Zhu, J.; Wu, L.; Sun, Q.; Wu, W. Estimating three-dimensional coseismic deformations with the SM-VCE method based on heterogeneous SAR observations: Selection of homogeneous points and analysis of observation combinations. Remote Sensing of Environment 2021, 255. [Google Scholar] [CrossRef]
- François Ayoub, S.L., and Jean-Philippe Avouac. User’s Guide to COSI-CORR Co-registration of Optically Sensed Images and Correlation. 2017.
- Richards, C.T. A novel kinematics analysis method using quaternion interpolation – a case study in frog jumping. Journal Of Theroretical Biology 2018. [Google Scholar] [CrossRef]
- Dominguez, S.; Avouac, J.-P.; Michel, R. Horizontal coseismic deformation of the 1999 Chi-Chi earthquake measured from SPOT satellite images: Implications for the seismic cycle along the western foothills of central Taiwan. Journal of Geophysical Research: Solid Earth 2003, 108. [Google Scholar] [CrossRef]
- Cai, J.; Zhang, L.; Dong, J.; Wang, C.; Liao, M. Polarimetric SAR pixel offset tracking for large-gradient landslide displacement mapping. International Journal of Applied Earth Observation and Geoinformation 2022, 112. [Google Scholar] [CrossRef]
|
Disclaimer/Publisher’s Note: The statements, opinions and data contained in all publications are solely those of the individual author(s) and contributor(s) and not of MDPI and/or the editor(s). MDPI and/or the editor(s) disclaim responsibility for any injury to people or property resulting from any ideas, methods, instructions or products referred to in the content. |
© 2023 by the authors. Licensee MDPI, Basel, Switzerland. This article is an open access article distributed under the terms and conditions of the Creative Commons Attribution (CC BY) license (http://creativecommons.org/licenses/by/4.0/).
