Submitted:
29 May 2023
Posted:
31 May 2023
You are already at the latest version
Abstract
Keywords:
1. Introduction
- to find out which muscle is most appropriate for IBM detection and characterization,
- to test the reproducibility of physiological responses of respiratory muscles, and
- to investigate an improved time-frequency (T-F) analysis method for studying respiratory muscle sEMG signals to non-invasively assess skeletal muscle oxygenation and improve physical fitness tests.
2. Database
2.1. Participants and Procedure
2.2. Measurement and Preprocessing
3. Research Objectives and Methods
3.1. Transient Localization and Scalograms
3.2. MODWT-based Multiresolution Analysis
3.2.1. Wavelet Energy Spectrum (WES)
3.2.2. Wavelet Variance
3.2.3. MRA Component Correlation
3.3. Research Objectives and Steps
4. Results and Discussion
4.1. Breath-Hold Duration
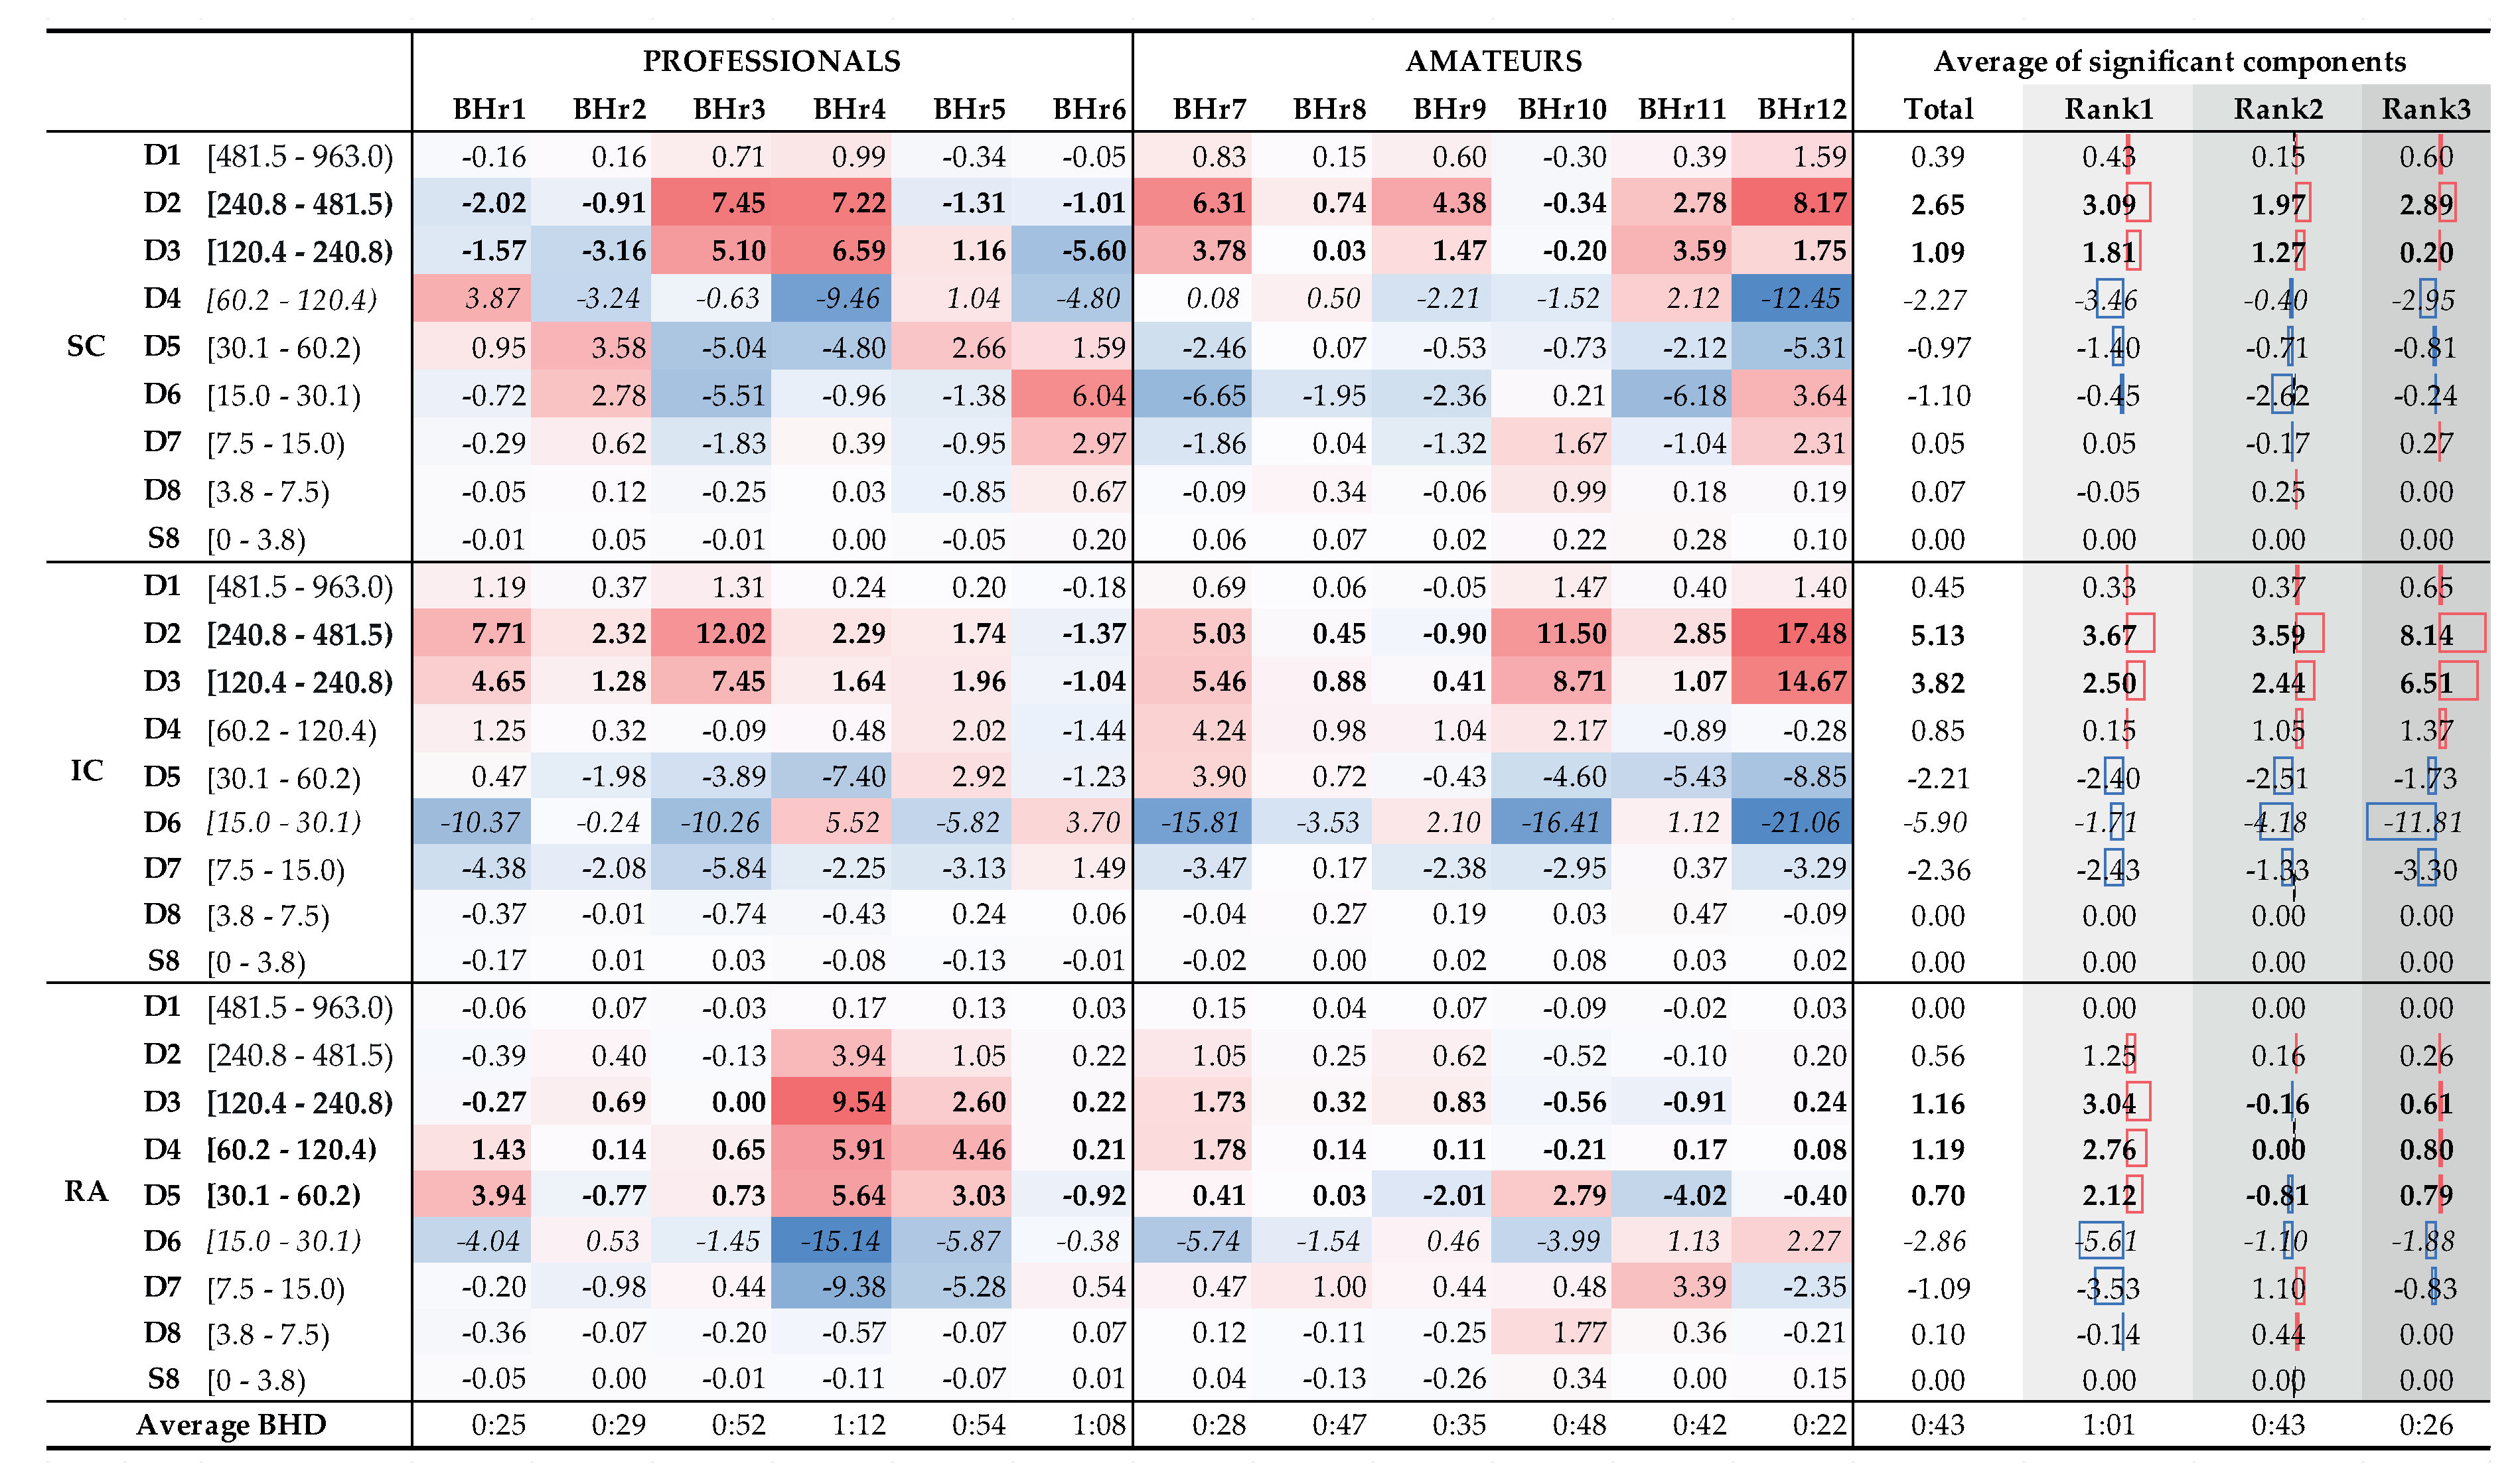
- BHD rank #1 - BHr4 (72.5 p/m), BHr6 (63.0 p/m), BHr5 (54.5 p/m), BHr3 (52.0 p/m),
- BHD rank #2 - BHr10 (48.5 a/m), BHr8 (47.5 a/m), BHr11 (42.5 a/m), BHr9 (35.5 a/m),
- BHD rank #3 - BHr2 (29.5 p/f), BHr7 (28.0 a/m), BHr1 (25.5 p/f), BHr12 (22.5 a/m),
4.2. Respiratory Muscle EMG Response
4.2.1. Power Spectral Analysis
4.2.2. Frequency Range of Muscle Response Using Scalograms
4.2.3. Muscle Response Reproducibility Analyses Using WMRA
4.2.4. Correlation Analyses of Muscle-Activation and BH Duration Using WMRA
5. Conclusions
Author Contributions
Funding
Institutional Review Board Statement
Informed Consent Statement
Data Availability Statement
Acknowledgments
Conflicts of Interest
Abbreviations
| BH | Breath-hold |
| BHD | Breath-hold duration |
| BR | M. brachioradialis |
| CWT | Continuous wavelet transform |
| DWT | Discrete wavelet transform |
| FB | Frequency band |
| FRC | Functional residual capacity |
| IBM | Involuntary breathing movement |
| IC | M. parasternal intercostal |
| LFB | Low frequency band |
| LS | Least-square |
| MAP | Mean arterial pressure |
| MFB | Medium frequency band |
| MODWT | Maximal overlap discrete wavelet transform |
| MRA | Multiresolution analysis |
| MU | Motor unit |
| MUAP | Motor unit action potential |
| OBW | Occupied bandwidth |
| OSAHS | Obstructive sleep apnea-hypopnea syndrome |
| QRS | Ventricular depolarization and contraction (ventricular systole) |
| RA | M. rectus abdominis |
| RMS | Root mean square |
| RWE | Relative wavelet energy |
| SC | M. scalenus anterior at medium |
| sEMG | Surface electromyography |
| TLC | Total lung capacity |
| WES | Wavelet energy spectrum |
| WMRA | Wavelet multiresolution analysis |
| WPS | Wavelet power spectrum |
| WT | Wavelet transform |
Appendix A. Wavelet Transform (WT)
Appendix A.1. Continuous Wavelet Transform (CWT)
Appendix A.2. Discrete Wavelet Transform (DWT)
References
- Parkes, M.J. Breath-holding and its breakpoint. Experimental Physiology 2006, 91, 1–15. [Google Scholar] [CrossRef]
- Lindholm, P.; Lundgren, C.E. The physiology and pathophysiology of human breath-hold diving. Journal of Applied Physiology 2009, 106, 284–292. [Google Scholar] [CrossRef] [PubMed]
- Bain, A.R.; Ainslie, P.N.; Barak, O.F.; Hoiland, R.L.; Drvis, I.; Mijacika, T.; Bailey, D.M.; Santoro, A.; DeMasi, D.K.; Dujic, Z.; et al. Hypercapnia is essential to reduce the cerebral oxidative metabolism during extreme apnea in humans. Journal of Cerebral Blood Flow & Metabolism 2017, 37, 3231–3242. [Google Scholar] [CrossRef]
- Cooper, H.E.; Parkes, M.J.; Clutton-Brock, T.H. CO2-dependent components of sinus arrhythmia from the start of breath holding in humans. American Journal of Physiology-Heart and Circulatory Physiology 2003, 285, H841–H848. [Google Scholar] [CrossRef] [PubMed]
- Foster, G.E.; Sheel, A.W. The human diving response, its function, and its control. Scandinavian Journal of Medicine & Science in Sports 2005, 15, 3–12. [Google Scholar] [CrossRef]
- Dujic, Z.; Breskovic, T. Impact of breath holding on cardiovascular respiratory and cerebrovascular health. Sports Medicine 2012, 42, 459–472. [Google Scholar] [CrossRef] [PubMed]
- Skow, R.J.; Day, T.A.; Fuller, J.E.; Bruce, C.D.; Steinback, C.D. The ins and outs of breath holding: simple demonstrations of complex respiratory physiology. Advances in Physiology Education 2015, 39, 223–231. [Google Scholar] [CrossRef]
- Bain, A.R.; Drvis, I.; Dujic, Z.; MacLeod, D.B.; Ainslie, P.N. Physiology of static breath holding in elite apneists. Experimental Physiology 2018, 103, 635–651. [Google Scholar] [CrossRef]
- Elia, A.; Gennser, M.; Harlow, P.S.; Lees, M.J. Physiology, pathophysiology and (mal)adaptations to chronic apnoeic training: a state-of-the-art review. European Journal of Applied Physiology 2021, 121, 1543–1566. [Google Scholar] [CrossRef]
- Jerath, R.; Crawford, M.W.; Barnes, V.A.; Harden, K. Widespread depolarization during expiration: A source of respiratory drive? Medical Hypotheses 2015, 84, 31–37. [Google Scholar] [CrossRef]
- Palada, I.; Bakovic, D.; Valic, Z.; Obad, A.; Ivancev, V.; Eterovic, D.; Shoemaker, J.K.; Dujic, Z. Restoration of hemodynamics in apnea struggle phase in association with involuntary breathing movements. Respiratory Physiology & Neurobiology 2008, 161, 174–181. [Google Scholar] [CrossRef]
- Willie, C.K.; Ainslie, P.N.; Drvis, I.; MacLeod, D.B.; Bain, A.R.; Madden, D.; Maslov, P.Z.; Dujic, Z. Regulation of Brain Blood Flow and Oxygen Delivery in Elite Breath-Hold Divers. Journal of Cerebral Blood Flow & Metabolism 2015, 35, 66–73. [Google Scholar] [CrossRef]
- Cross, T.J.; Kavanagh, J.J.; Breskovic, T.; Zubin Maslov, P.; Lojpur, M.; Johnson, B.D.; Dujic, Z. The Effects of Involuntary Respiratory Contractions on Cerebral Blood Flow during Maximal Apnoea in Trained Divers. PLOS ONE 2013, 8, 1–10. [Google Scholar] [CrossRef] [PubMed]
- Joulia, F.; Steinberg, J.G.; Faucher, M.; Jamin, T.; Ulmer, C.; Kipson, N.; Jammes, Y. Breath-hold training of humans reduces oxidative stress and blood acidosis after static and dynamic apnea. Respiratory Physiology & Neurobiology 2003, 137, 19–27. [Google Scholar] [CrossRef]
- Trembach, N.; Zabolotskikh, I. Breath-holding test in evaluation of peripheral chemoreflex sensitivity in healthy subjects. Respiratory Physiology & Neurobiology 2017, 235, 79–82. [Google Scholar] [CrossRef]
- Trembach, N.; Zabolotskikh, I. The influence of age on interaction between breath-holding test and single-breath carbon dioxide test. Biomed Res. Int. 2017, 2017, 1010289. [Google Scholar] [CrossRef]
- Barnai, M.; Laki, I.; Gyurkovits, K.; Angyan, L.; Horvath, G. Relationship between breath-hold time and physical performance in patients with cystic fibrosis. European Journal of Applied Physiology 2005, 95, 172–178. [Google Scholar] [CrossRef]
- Yeo, J.; Kim, J.Y.; Kim, M.H.; Park, J.W.; Park, J.K.; Lee, E.B. Utility of the breath-holding test in patients with systemic sclerosis. Rheumatology 2022, 61, 4113–4118. [Google Scholar] [CrossRef]
- Li, Y.; Wang, Y. Obstructive Sleep Apnea-hypopnea Syndrome as a Novel Potential Risk for Aging. Aging and Disease 2021, 12, 586–596. [Google Scholar] [CrossRef]
- Drager, L.F.; Togeiro, S.M.; Polotsky, V.Y.; Lorenzi-Filho, G. Obstructive Sleep Apnea: A Cardiometabolic Risk in Obesity and the Metabolic Syndrome. Journal of the American College of Cardiology 2013, 62, 569–576. [Google Scholar] [CrossRef]
- Athayde, R.A.B.; Oliveira Filho, J.R.B.; Lorenzi Filho, G.; Genta, P.R. Obesity hypoventilation syndrome: a current review. Jornal Brasileiro de Pneumologia 2018, 44. [Google Scholar] [CrossRef] [PubMed]
- Messineo, L.; Taranto-Montemurro, L.; Azarbarzin, A.; Oliveira Marques, M.D.; Calianese, N.; White, D.P.; Wellman, A.; Sands, S.A. Breath-holding as a means to estimate the loop gain contribution to obstructive sleep apnoea. The Journal of Physiology 2018, 596, 4043–4056. [Google Scholar] [CrossRef] [PubMed]
- Stewart, M.; Bain, A.R. Assessment of respiratory effort with EMG extracted from ECG recordings during prolonged breath holds: Insights into obstructive apnea and extreme physiology. Physiological Reports 2021, 9, e14873. [Google Scholar] [CrossRef] [PubMed]
- Ostojić, M.; Milosavljević, M.; Kovačević, A.; Stokić, M.; Stefanović, D.; Mandić-Gajić, G.; Jeličić, L. Changes in power of surface electromyogram during breath-holding. Srpski arhiv za celokupno lekarstvo 2020, 148, 440–446. [Google Scholar] [CrossRef]
- Fidalgo-Herrera, A.; Miangolarra-Page, J.; Carratalá-Tejada, M. Electromyographic traces of motor unit synchronization of fatigued lower limb muscles during gait. Human Movement Science 2021, 75, 102750. [Google Scholar] [CrossRef]
- Barroso-García, V.; Gutiérrez-Tobal, G.C.; Gozal, D.; Vaquerizo-Villar, F.; Álvarez, D.; del Campo, F.; Kheirandish-Gozal, L.; Hornero, R. Wavelet Analysis of Overnight Airflow to Detect Obstructive Sleep Apnea in Children. Sensors 2021, 21, 1491. [Google Scholar] [CrossRef]
- Hermens, H.J.; Freriks, B.; Disselhorst-Klug, C.; Rau, G. Development of recommendations for SEMG sensors and sensor placement procedures. Journal of Electromyography and Kinesiology 2000, 10, 361–374. [Google Scholar] [CrossRef]
- Merletti, R.; Muceli, S. Tutorial. Surface EMG detection in space and time: Best practices. Journal of Electromyography and Kinesiology 2019, 49, 102363. [Google Scholar] [CrossRef]
- De Luca, C.J.; Kuznetsov, M.; Gilmore, L.D.; Roy, S.H. Inter-electrode spacing of surface EMG sensors: Reduction of crosstalk contamination during voluntary contractions. Journal of Biomechanics 2012, 45, 555–561. [Google Scholar] [CrossRef]
- Boyer, M.; Bouyer, L.; Roy, J.S.; Campeau-Lecours, A. Reducing Noise, Artifacts and Interference in Single-Channel EMG Signals: A Review. Sensors 2023, 23, 2927. [Google Scholar] [CrossRef]
- Arts, L.P.A.; van den Broek, E.L. The fast continuous wavelet transformation (fCWT) for real-time, high-quality, noise-resistant time–frequency analysis. Nature Computational Science 2022, 2, 47–58. [Google Scholar] [CrossRef] [PubMed]
- Mallat, S. A Wavelet Tour of Signal Processing: The Sparse Way, 3rd ed.; Academic Press: Boston, 2009. [Google Scholar]
- Percival, D.B.; Walden, A.T. The Maximal Overlap Discrete Wavelet Transform. In Wavelet Methods for Time Series Analysis; Cambridge Series in Statistical and Probabilistic Mathematics; Cambridge University Press, 2000; pp. 159–205. [Google Scholar] [CrossRef]
- Rosso, O.; Martin, M.; Figliola, A.; Keller, K.; Plastino, A. EEG analysis using wavelet-based information tools. Journal of Neuroscience Methods 2006, 153, 163–182. [Google Scholar] [CrossRef] [PubMed]
- Percival, D.B.; Walden, A.T., The Wavelet Variance. In Wavelet Methods for Time Series Analysis; Cambridge Series in Statistical and Probabilistic Mathematics, Cambridge University Press, 2000; pp. 295–339. [CrossRef]
- Lumb, A.B. Chapter 2 - Elastic Forces and Lung Volumes. In Nunn’s Applied Respiratory Physiology, 8th ed.; Lumb, A.B., Ed.; Elsevier, 2017; pp. 17–32. [CrossRef]
- McCulloch, P.F.; Gebhart, B.W.; Schroer, J.A. Large Lung Volumes Delay the Onset of the Physiological Breaking Point During Simulated Diving. Frontiers in Physiology 2021, 12. [Google Scholar] [CrossRef]
- Rahman, A.; Tabassum, T.; Araf, Y.; Al Nahid, A.; Ullah, M.A.; Hosen, M.J. Silent hypoxia in COVID-19: pathomechanism and possible management strategy. Molecular Biology Reports 2021, 48, 3863–3869. [Google Scholar] [CrossRef]
- Kilby, J.; Gholam Hosseini, H. Wavelet analysis of surface electromyography signals. In Proceedings of the The 26th Annual International Conference of the IEEE Engineering in Medicine and Biology Society, Vol. 1; 2004; pp. 384–387. [Google Scholar] [CrossRef]
- ATS/ERS Statement on Respiratory Muscle Testing. American Journal of Respiratory and Critical Care Medicine 2002, 166, 518–624. [CrossRef]
- Wakeling, J.M.; Uehli, K.; Rozitis, A.I. Muscle fibre recruitment can respond to the mechanics of the muscle contraction. Journal of The Royal Society Interface 2006, 3, 533–544. [Google Scholar] [CrossRef] [PubMed]
- Duiverman, M.; de Boer, E.; van Eykern, L.; de Greef, M.; Jansen, D.; Wempe, J.; Kerstjens, H.; Wijkstra, P. Respiratory muscle activity and dyspnea during exercise in chronic obstructive pulmonary disease. Respiratory Physiology & Neurobiology 2009, 167, 195–200. [Google Scholar] [CrossRef]
- Cavalcanti, J.D.; Fregonezi, G.A.F.; Sarmento, A.J.; Bezerra, T.; Gualdi, L.P.; Pennati, F.; Aliverti, A.; Resqueti, V.R. Electrical activity and fatigue of respiratory and locomotor muscles in obstructive respiratory diseases during field walking test. PLoS One 2022, 17, e0266365. [Google Scholar] [CrossRef]
- Schiaffino, S.; Reggiani, C. Fiber Types in Mammalian Skeletal Muscles. Physiological Reviews 2011, 91, 1447–1531. [Google Scholar] [CrossRef]
- Elia, A.; Wilson, O.J.; Lees, M.; Parker, P.J.; Barlow, M.J.; Cocks, M.; O’Hara, J.P. Skeletal muscle, haematological and splenic volume characteristics of elite breath-hold divers. European Journal of Applied Physiology 2019, 119, 2499–2511. [Google Scholar] [CrossRef]
- Wilson, R.J.A.; Day, T.A. CrossTalk opposing view: Peripheral and central chemoreceptors have hypoadditive effects on respiratory motor output. The Journal of Physiology 2013, 591, 4355–4357. [Google Scholar] [CrossRef] [PubMed]
- Teppema, L.J.; Smith, C.A. CrossTalk opposing view: Peripheral and central chemoreceptors have hyperadditive effects on respiratory motor control. The Journal of Physiology 2013, 591, 4359–4361. [Google Scholar] [CrossRef] [PubMed]
- Di Nardo, F.; Morano, M.; Strazza, A.; Fioretti, S. Muscle Co-Contraction Detection in the Time-Frequency Domain. Sensors 2022, 22, 4886. [Google Scholar] [CrossRef] [PubMed]
- Butler, J.E.; McKenzie, D.K.; Gandevia, S.C. Reflex inhibition of human inspiratory muscles in response to contralateral phrenic nerve stimulation. Respiratory Physiology & Neurobiology 2003, 138, 87–96. [Google Scholar] [CrossRef]
- Cirino, C.; Marostegan, A.B.; Hartz, C.S.; Moreno, M.A.; Gobatto, C.A.; Manchado-Gobatto, F.B. Effects of Inspiratory Muscle Warm-Up on Physical Exercise: A Systematic Review. Biology 2023, 12, 333. [Google Scholar] [CrossRef]
- Manchado-Gobatto, F.B.; Torres, R.S.; Marostegan, A.B.; Rasteiro, F.M.; Hartz, C.S.; Moreno, M.A.; Pinto, A.S.; Gobatto, C.A. Complex Network Model Reveals the Impact of Inspiratory Muscle Pre-Activation on Interactions among Physiological Responses and Muscle Oxygenation during Running and Passive Recovery. Biology 2022, 11, 963. [Google Scholar] [CrossRef]
- Daniel, N.; Sybilski, K.; Kaczmarek, W.; Siemiaszko, D.; Małachowski, J. Relationship between EMG and fNIRS during Dynamic Movements. Sensors 2023, 23, 5004. [Google Scholar] [CrossRef]
- Gröchenig, K. , MA, 2001; pp. 3–20. https://doi.org/10.1007/978-1-4612-0003-1_2.Analysis. In Foundations of Time-Frequency Analysis; Birkhäuser Boston: Boston, MA, 2001; pp. 3–20. [Google Scholar] [CrossRef]

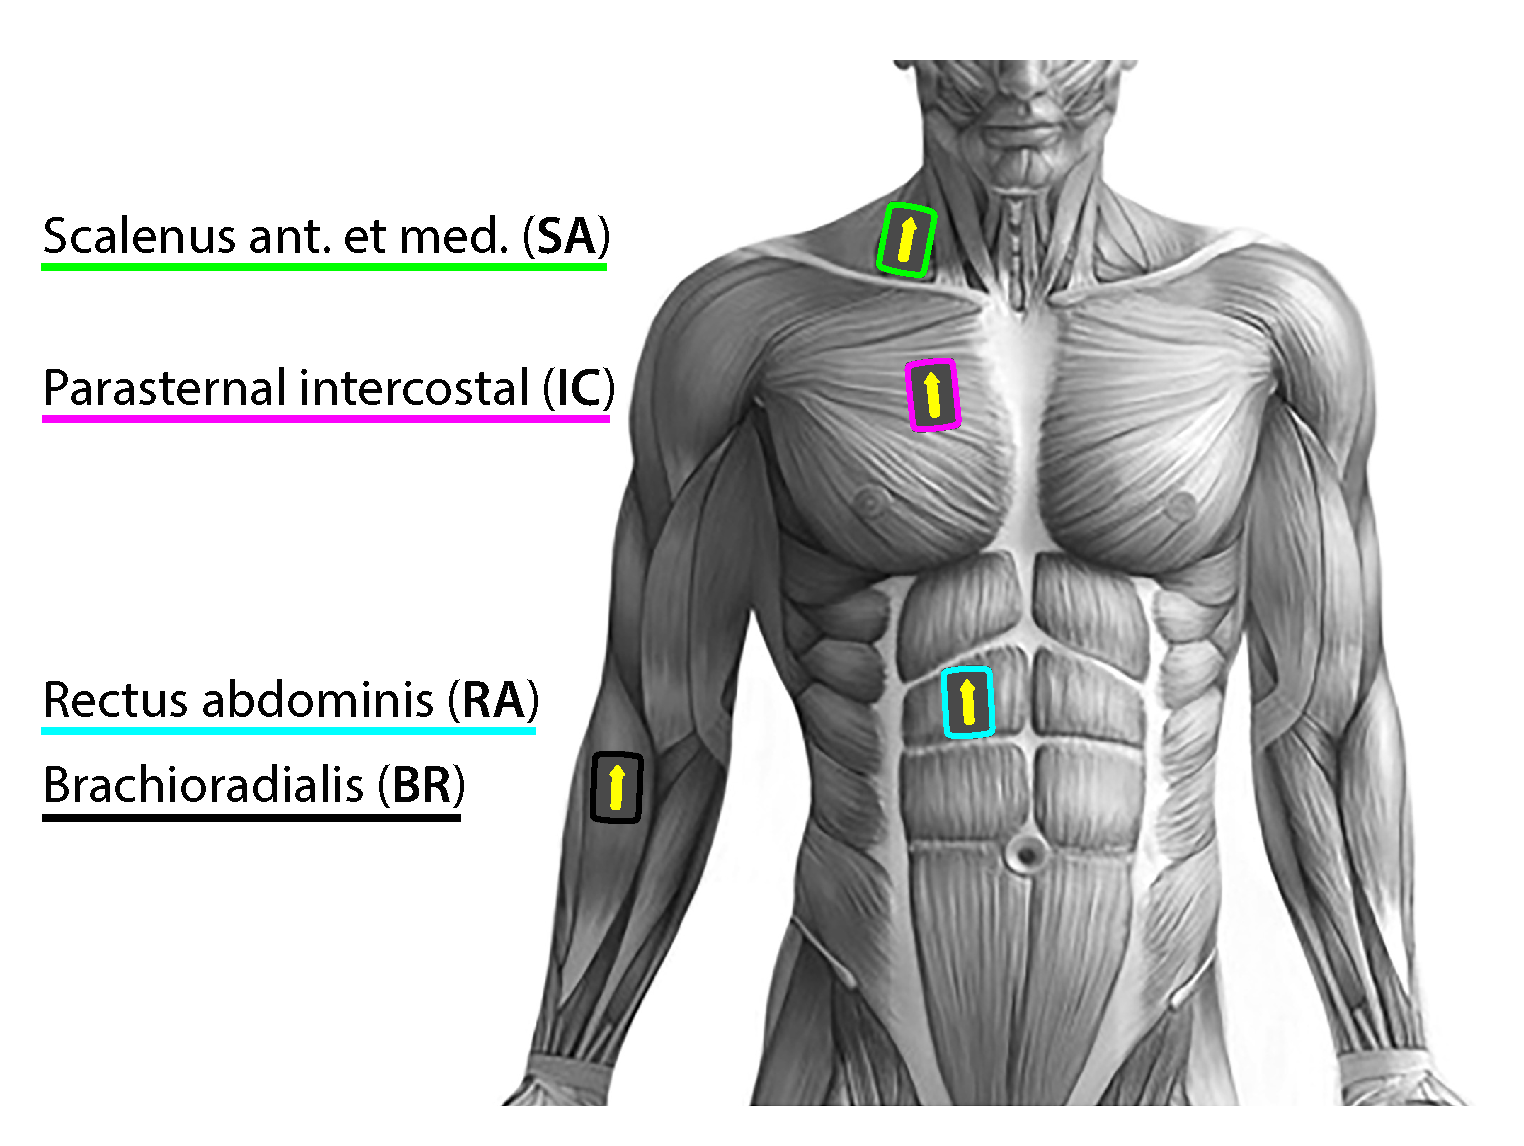
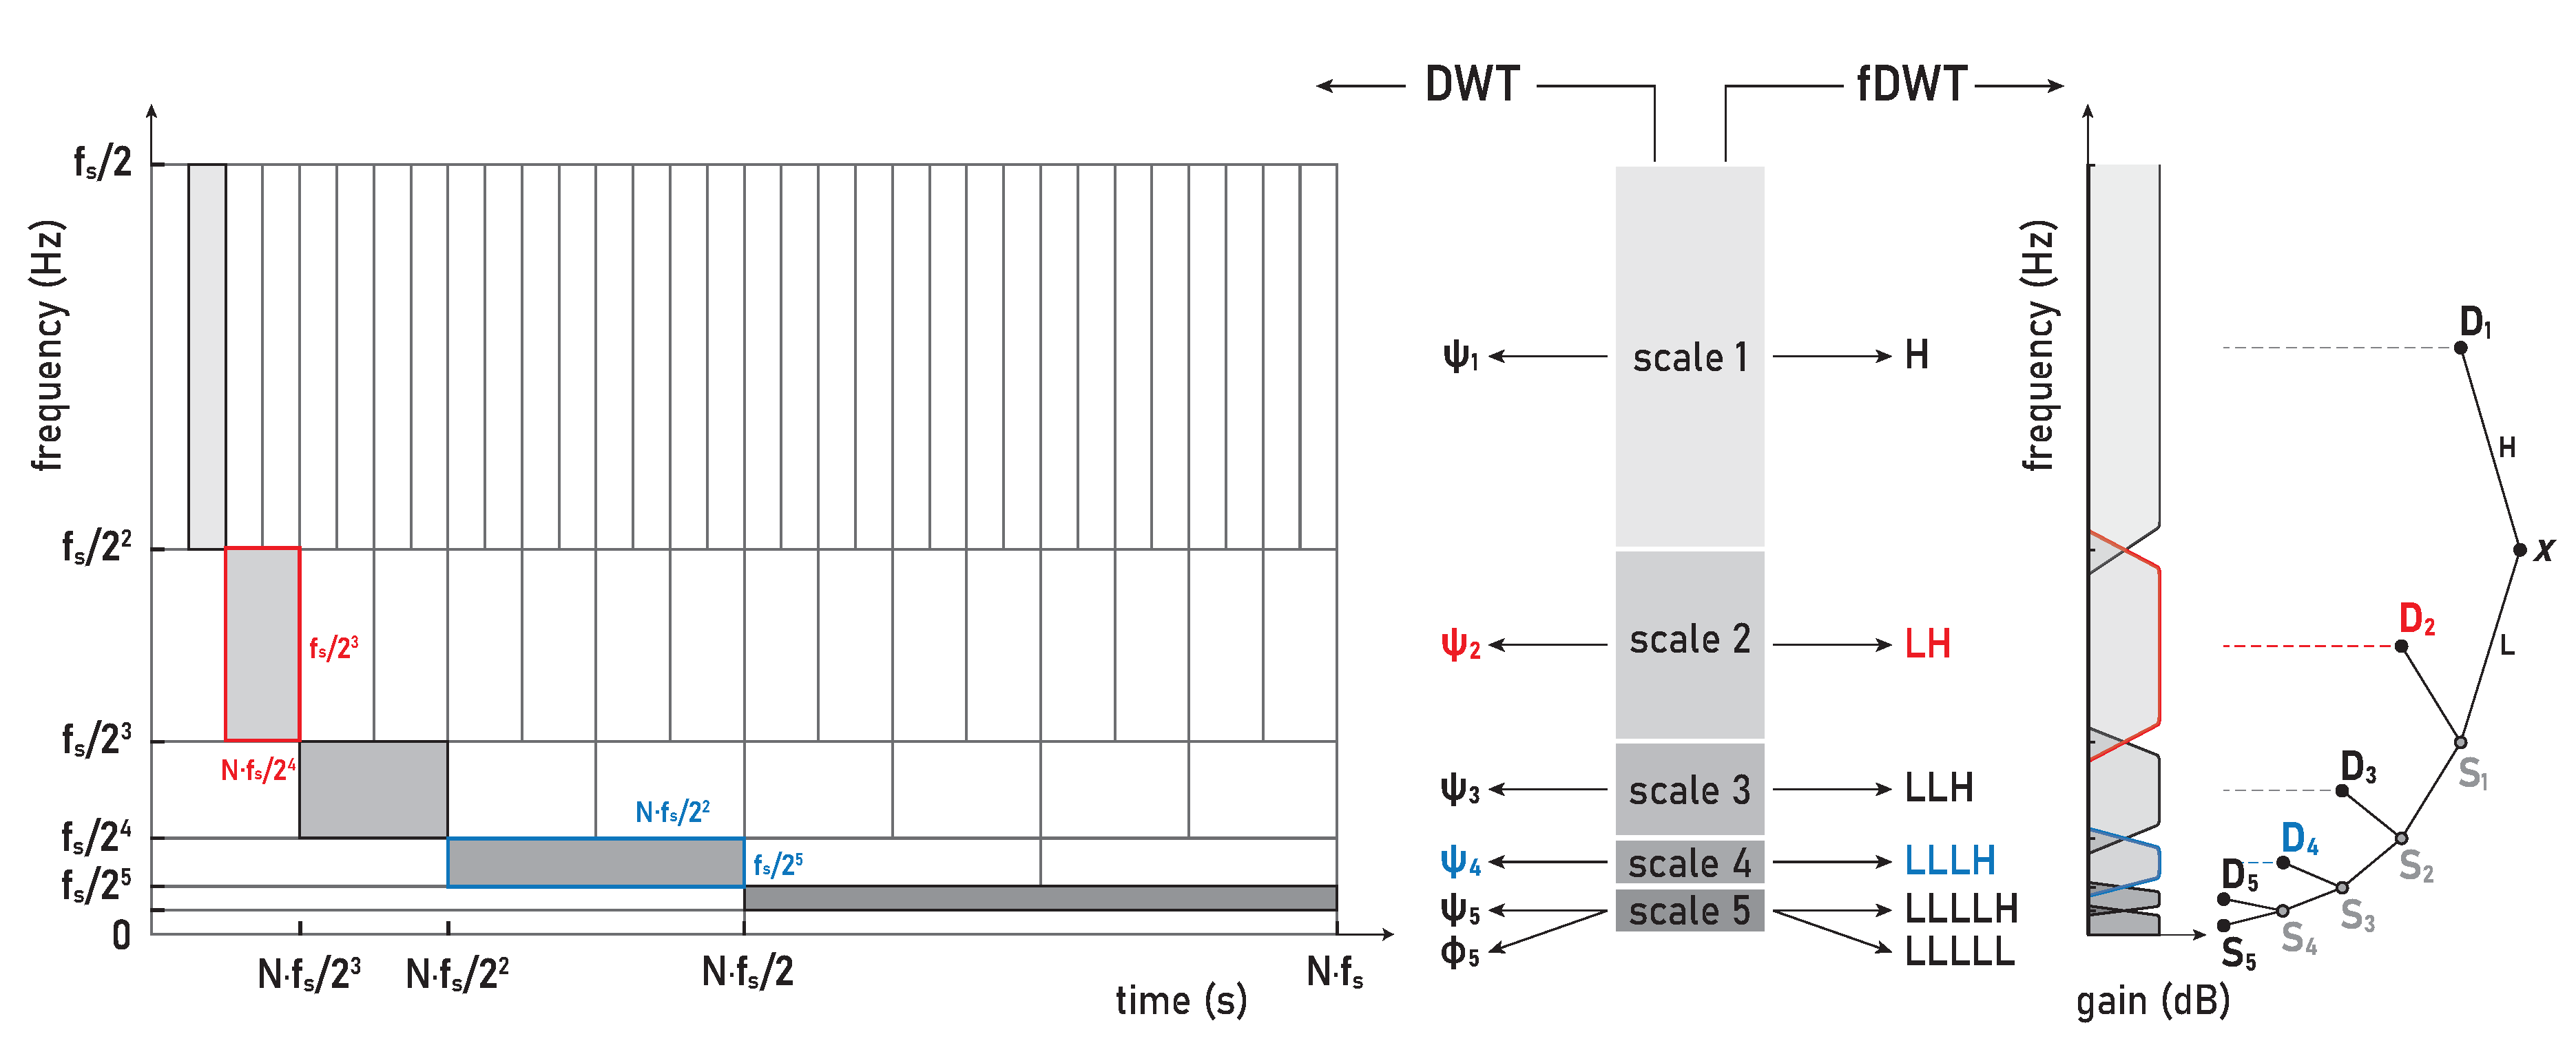
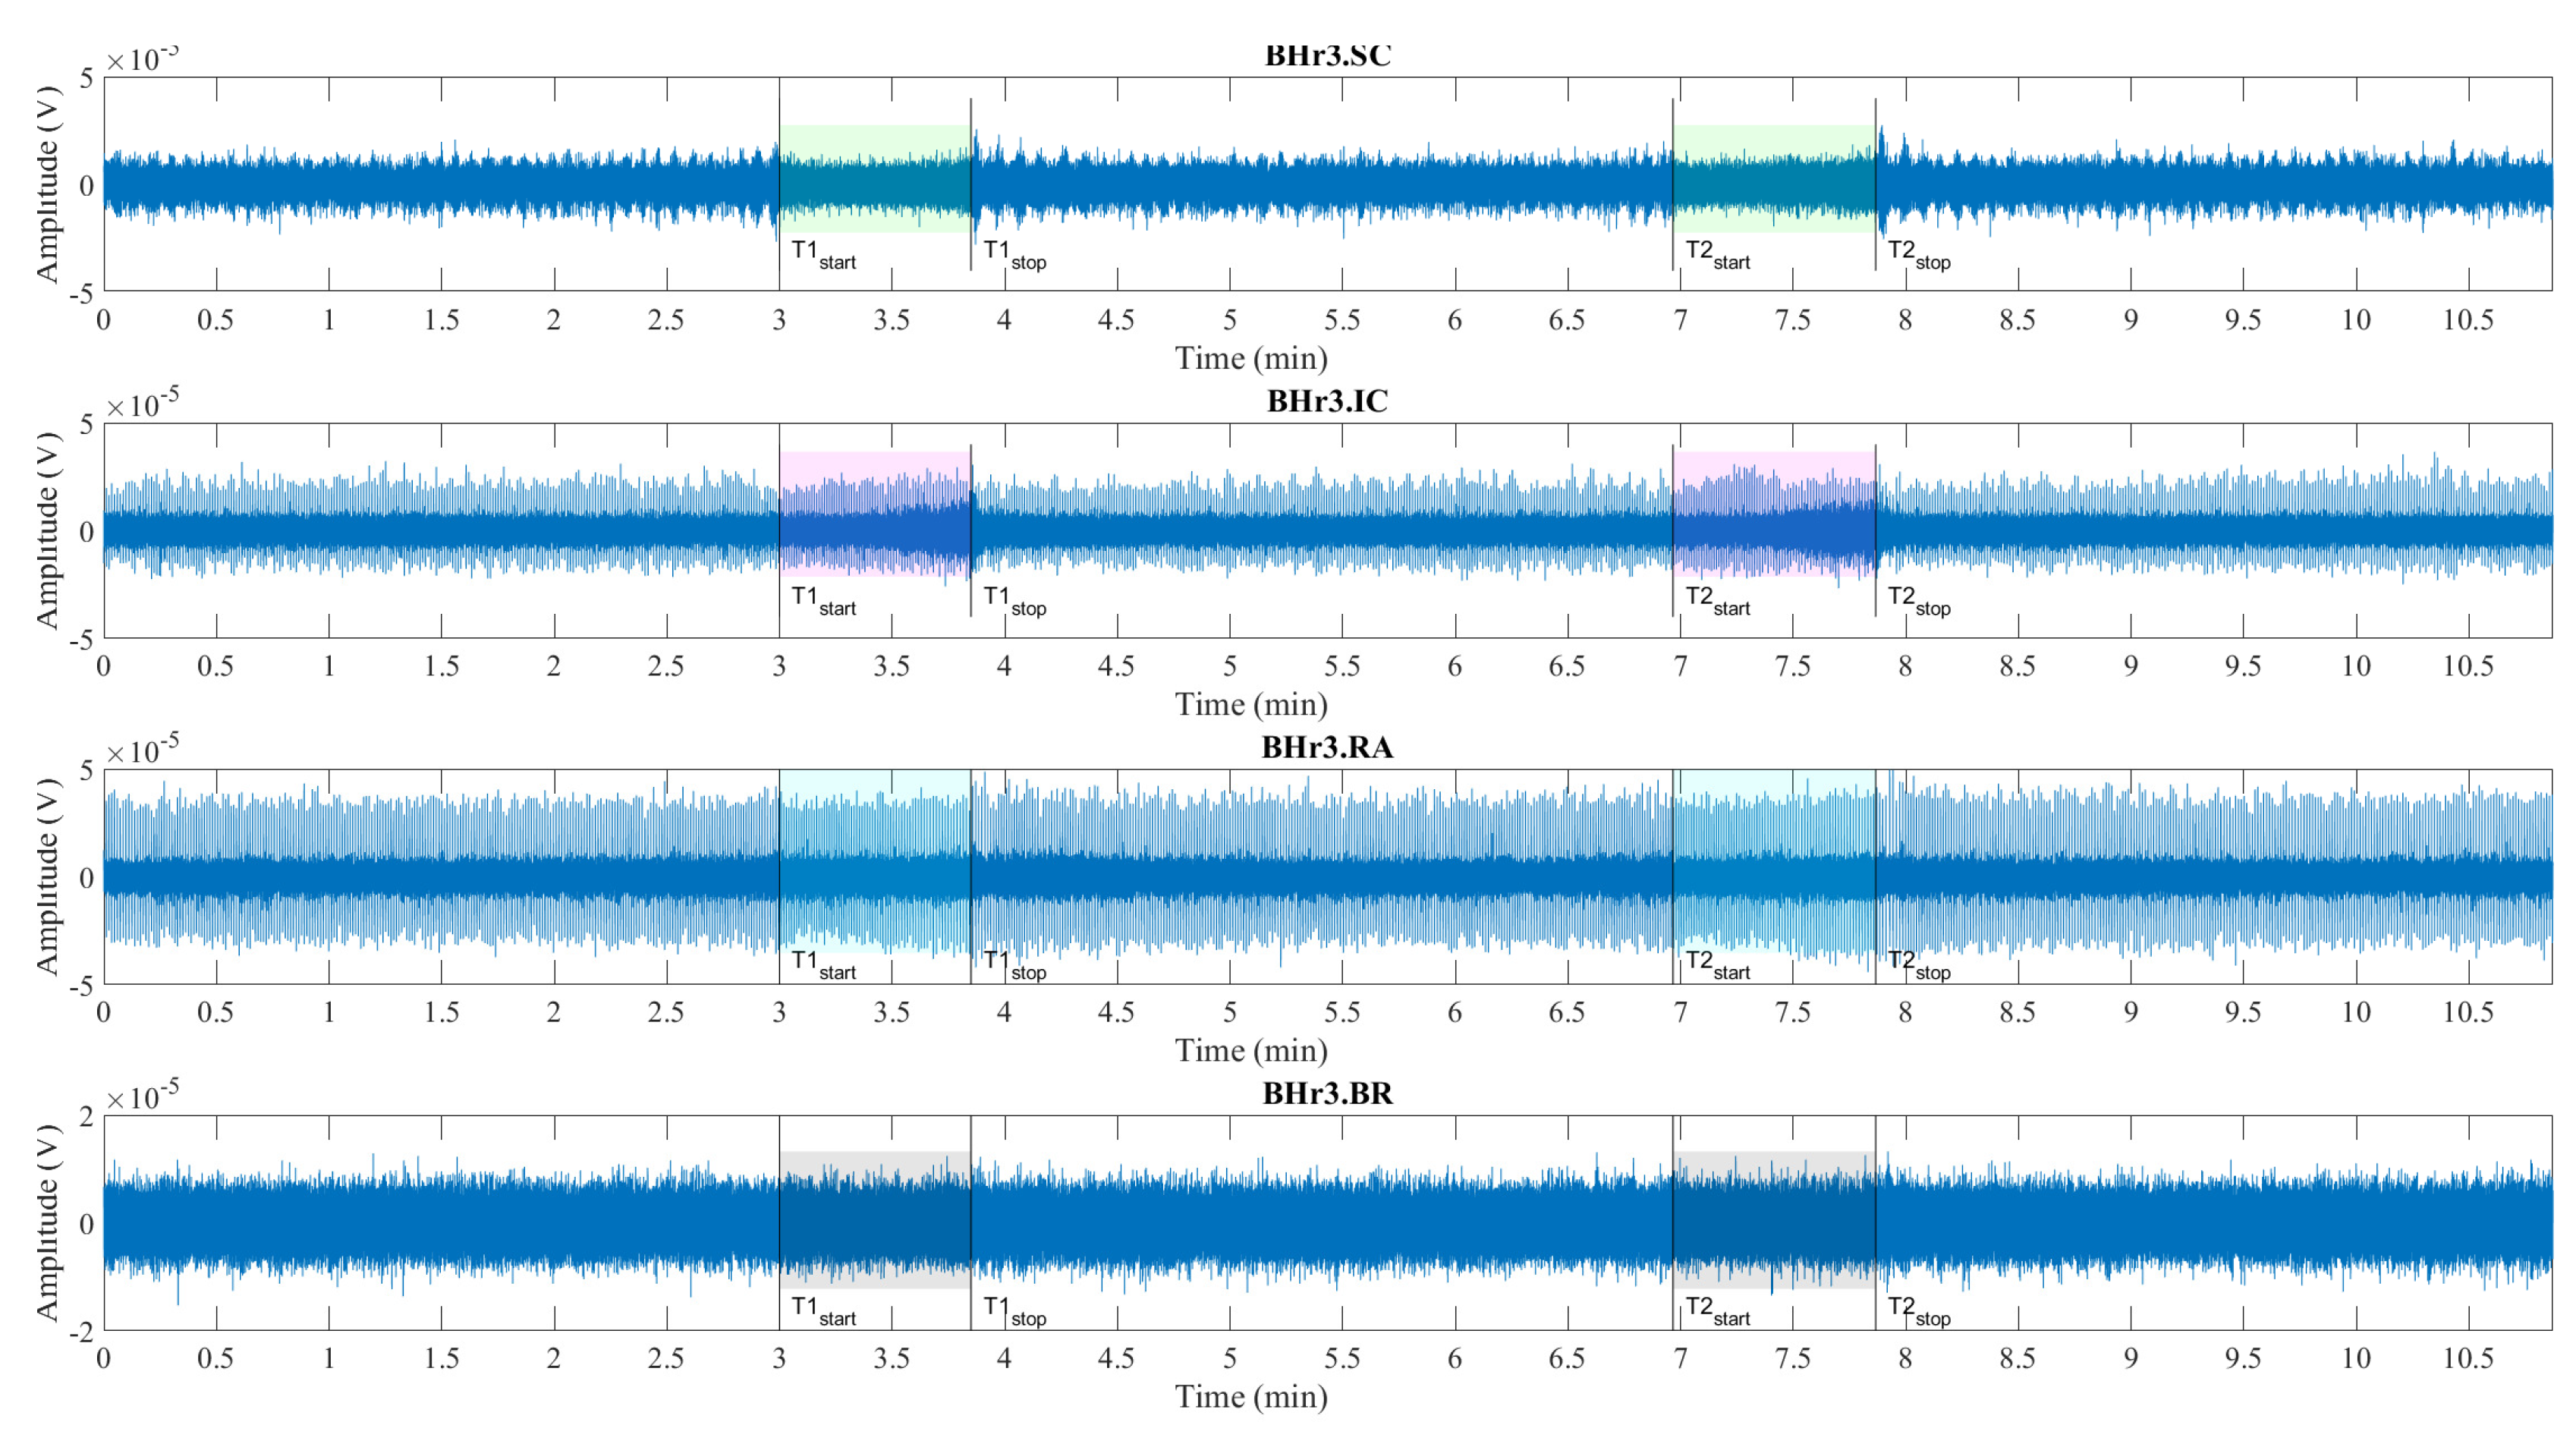
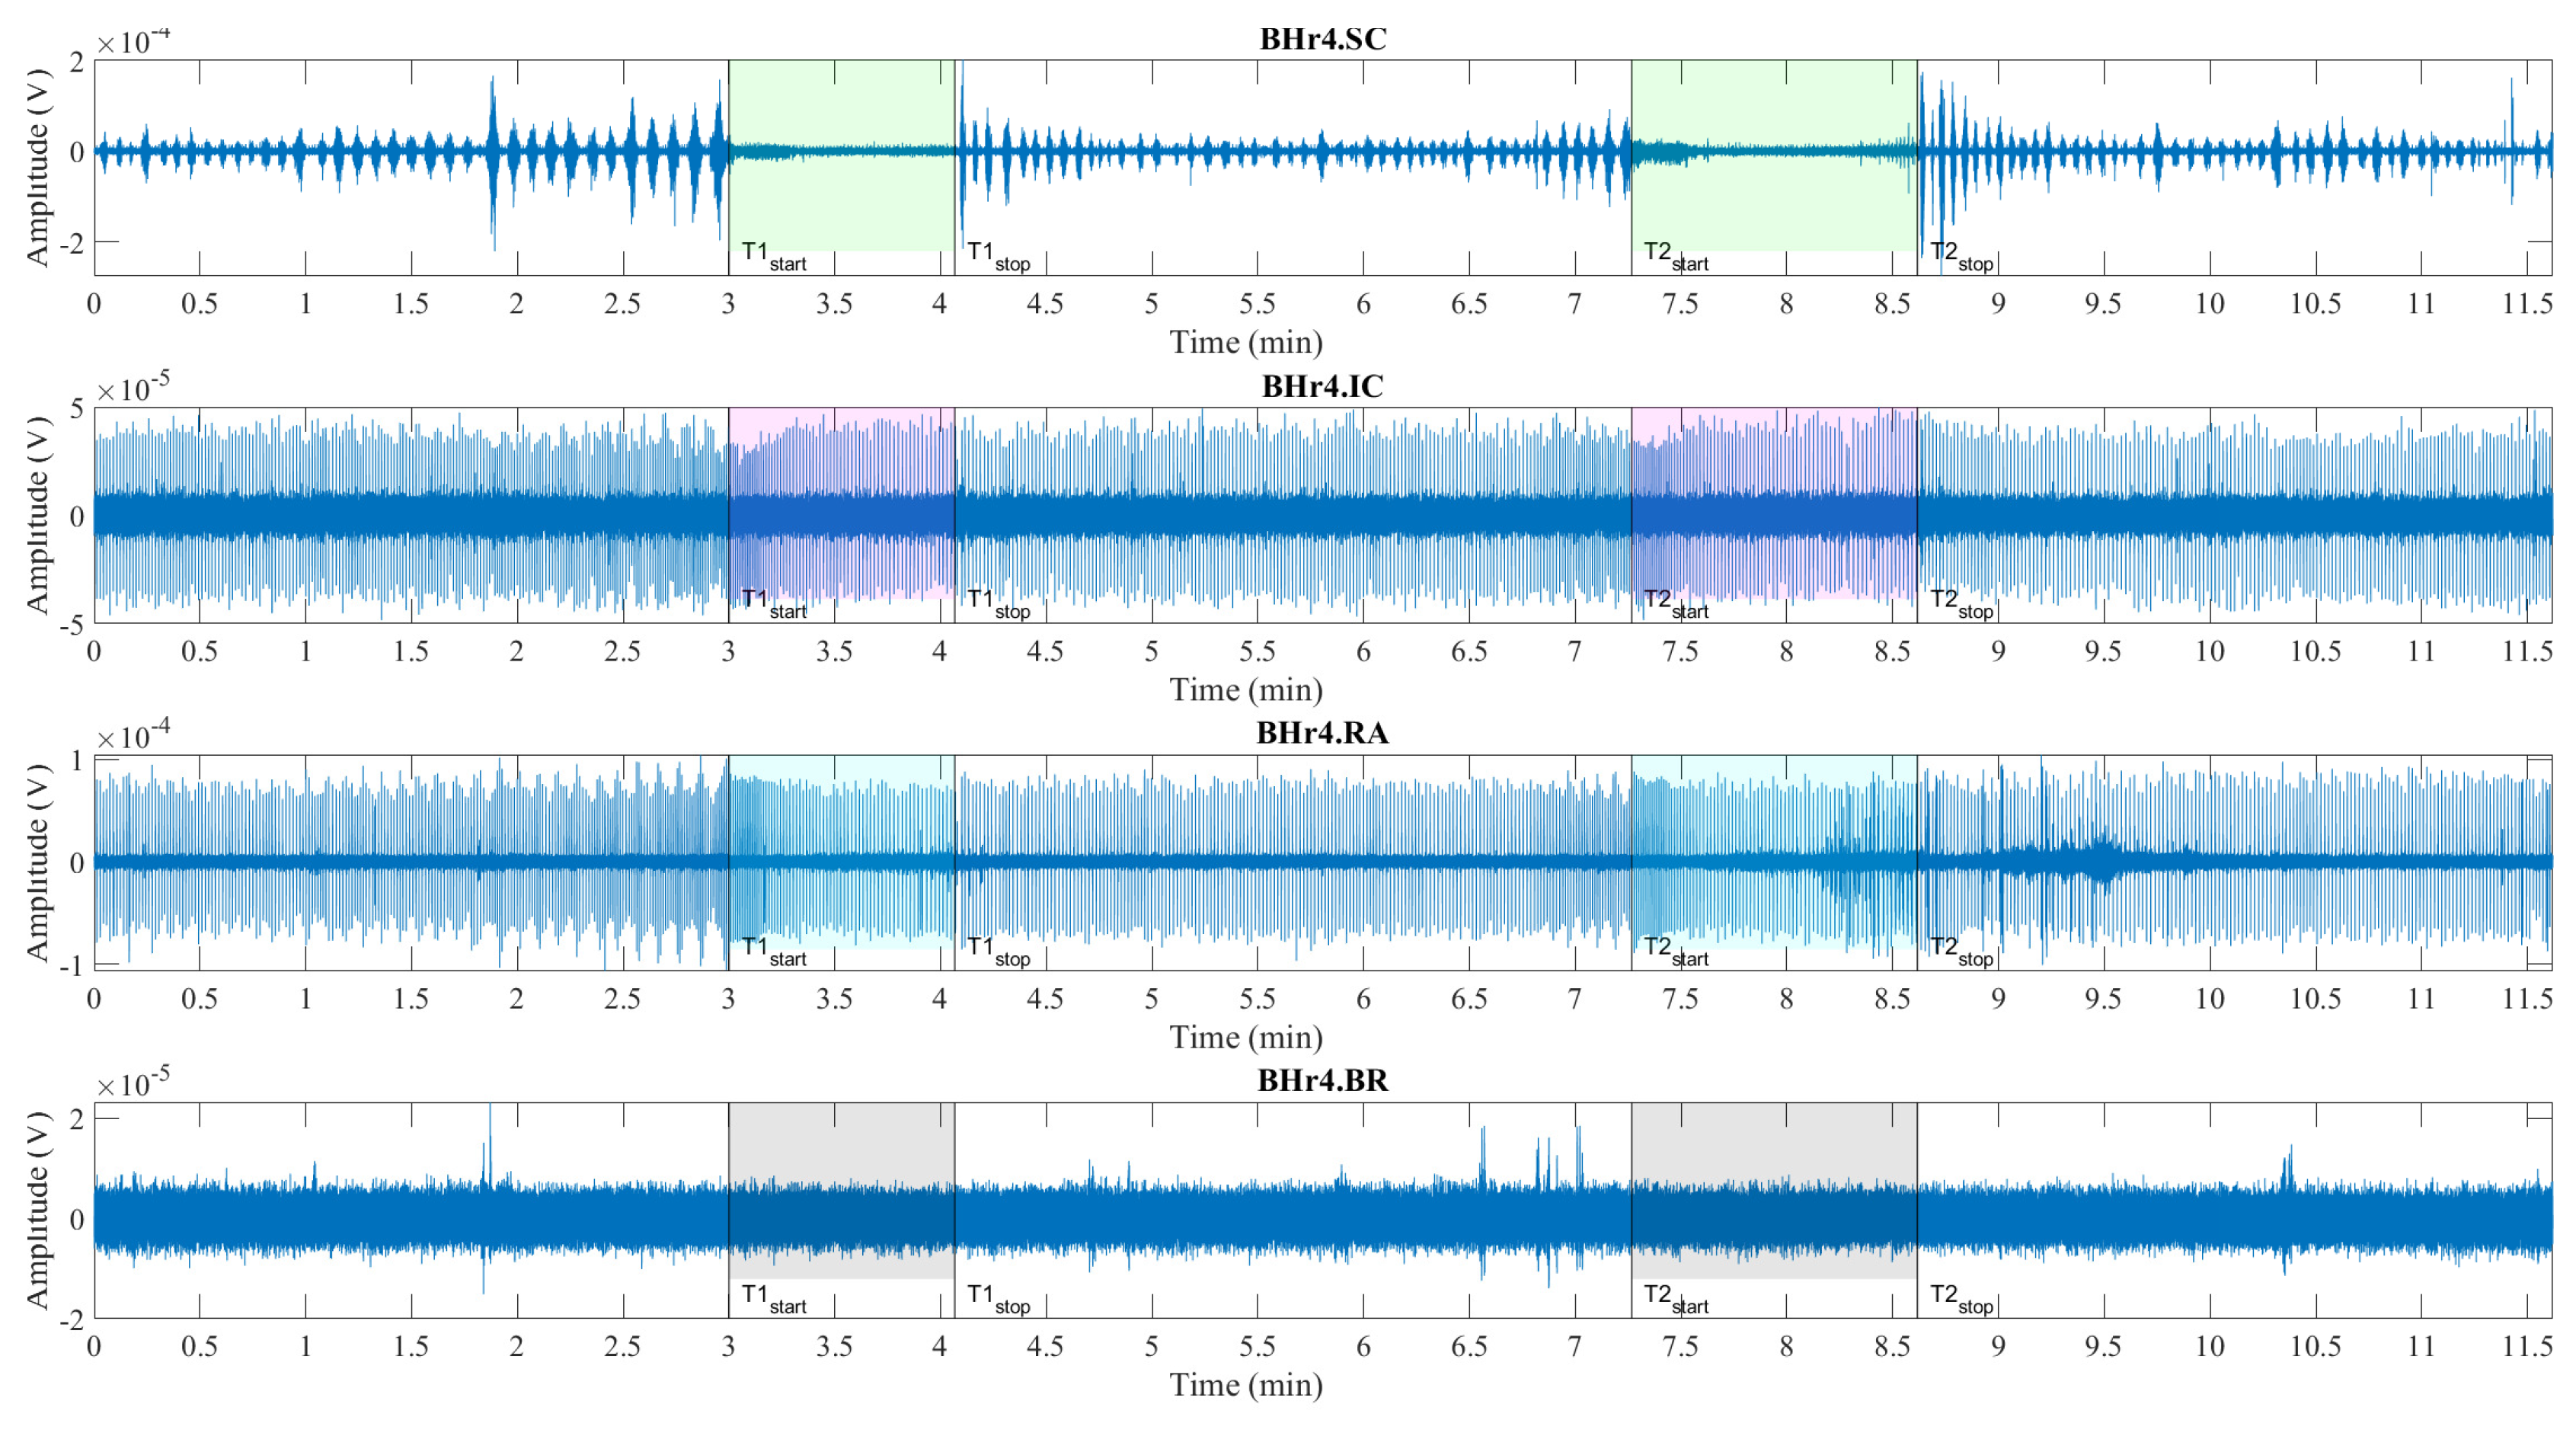
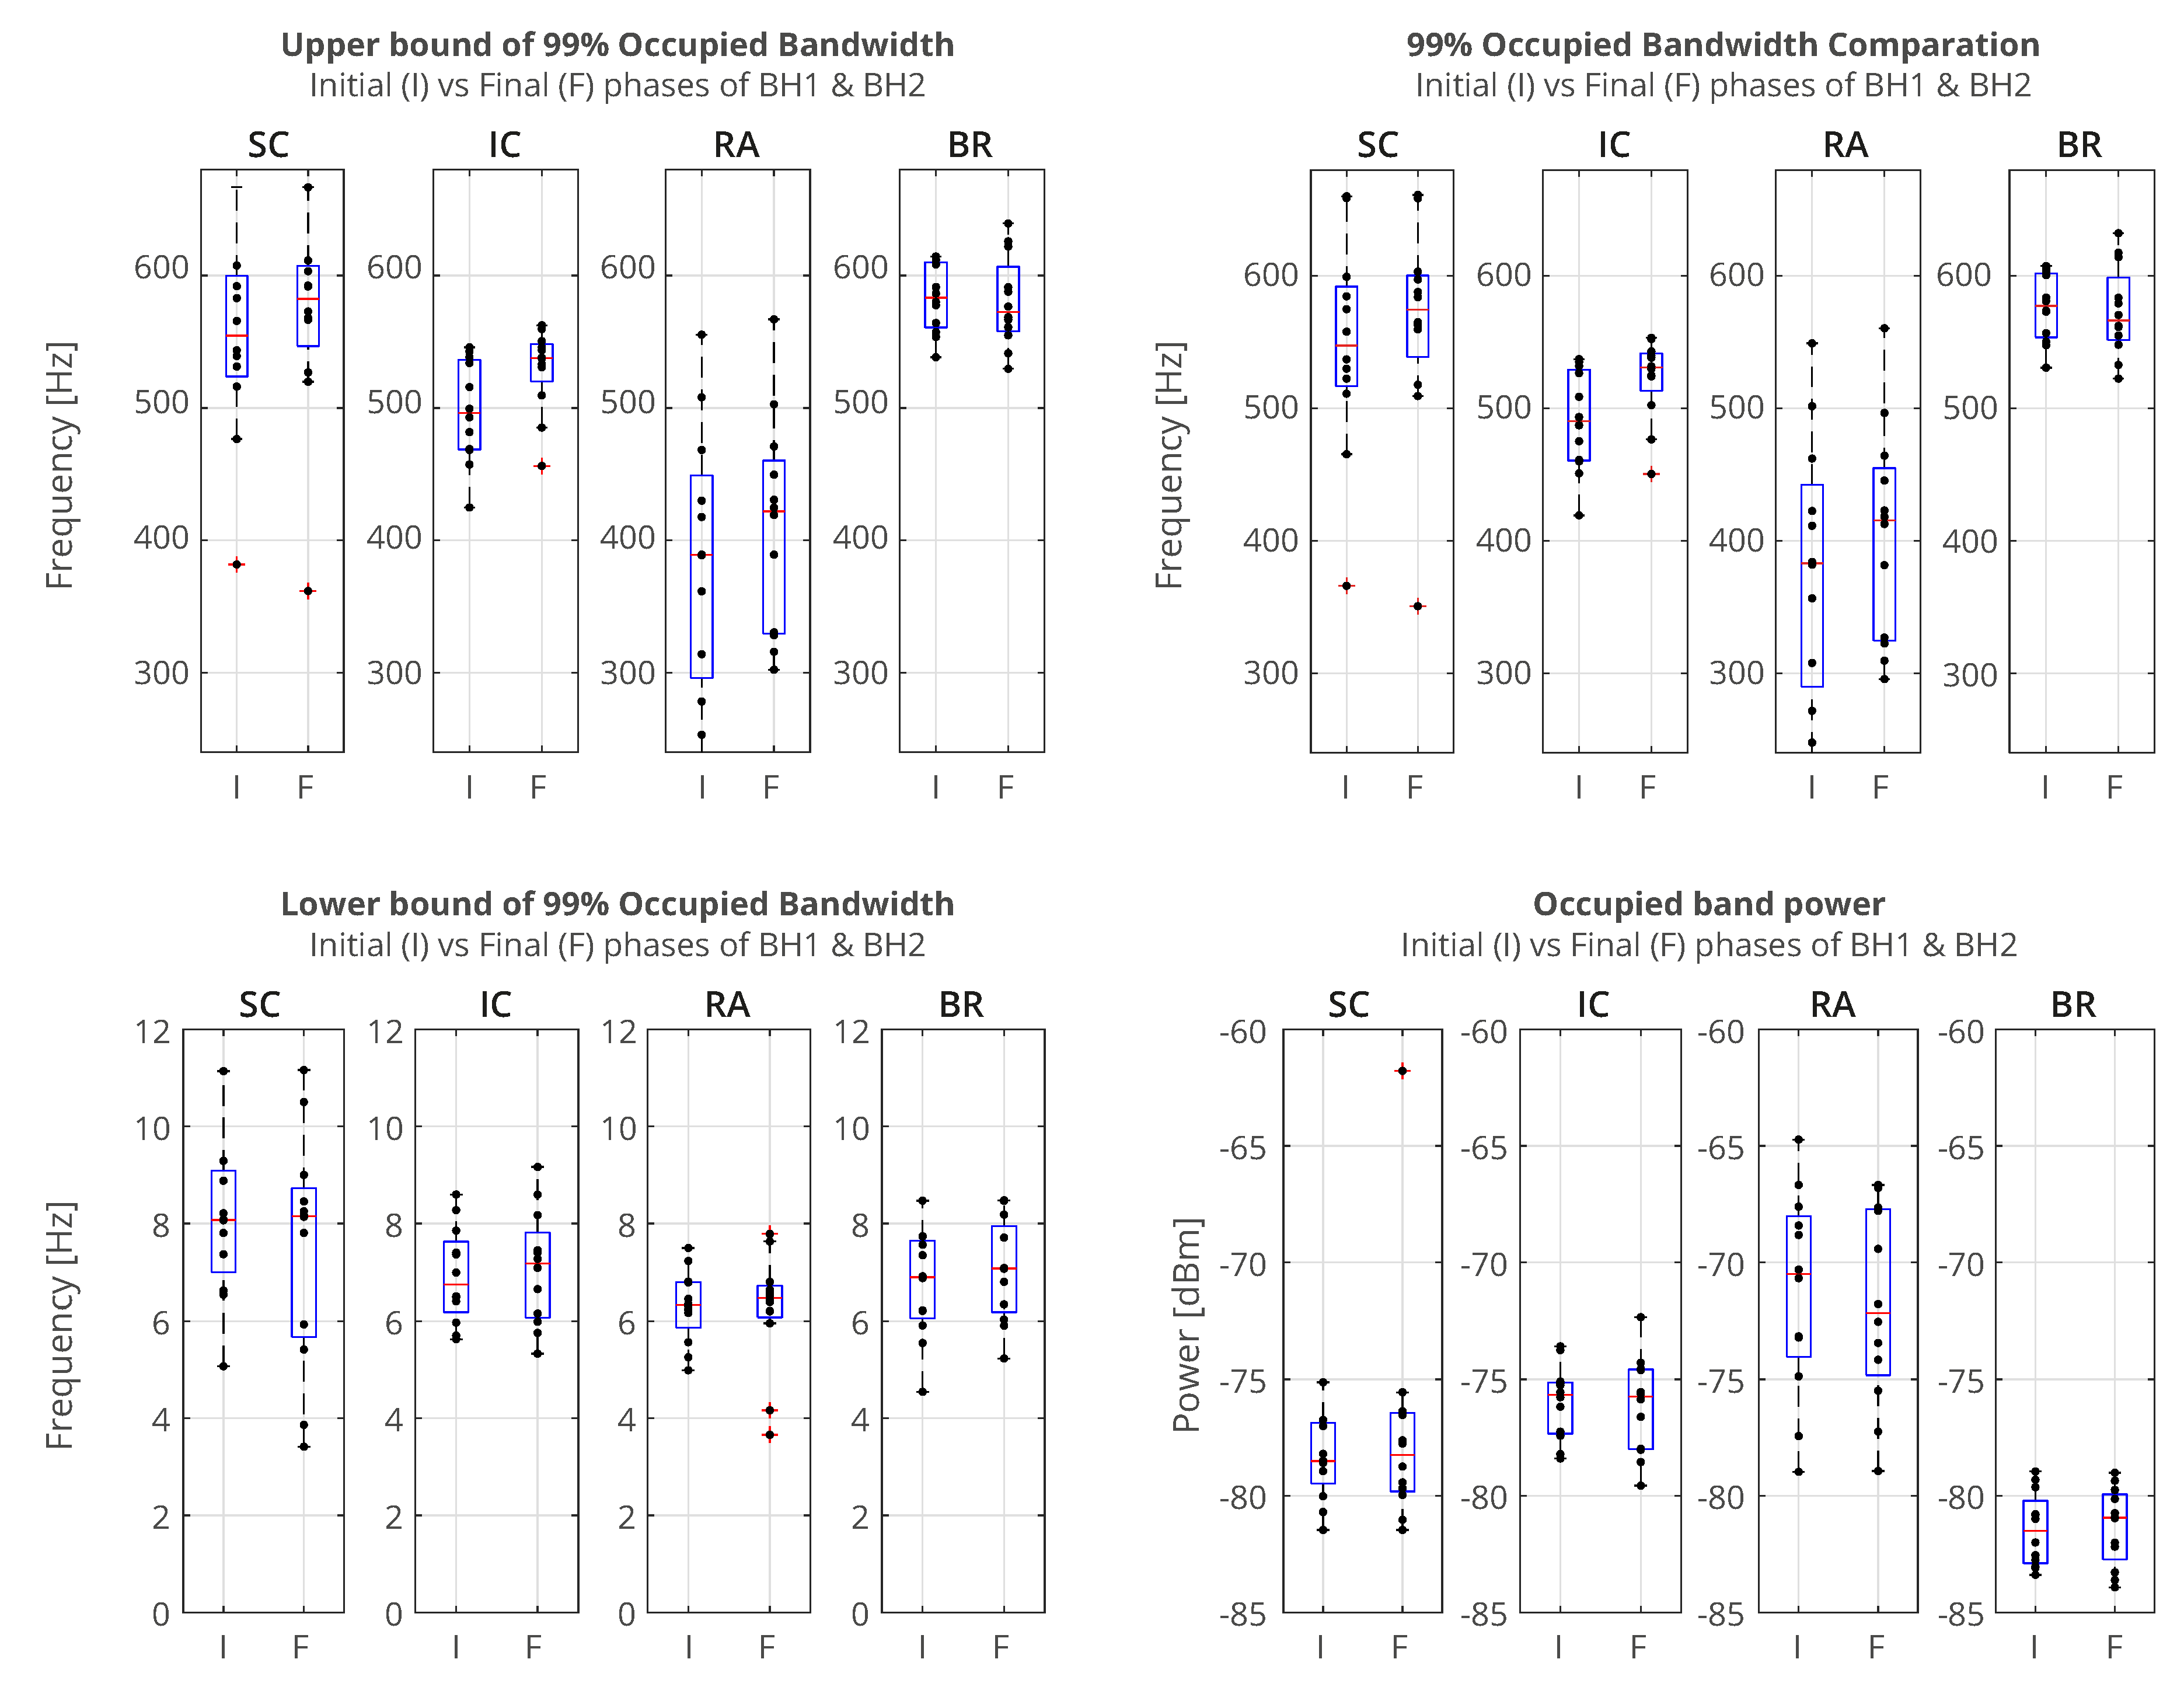
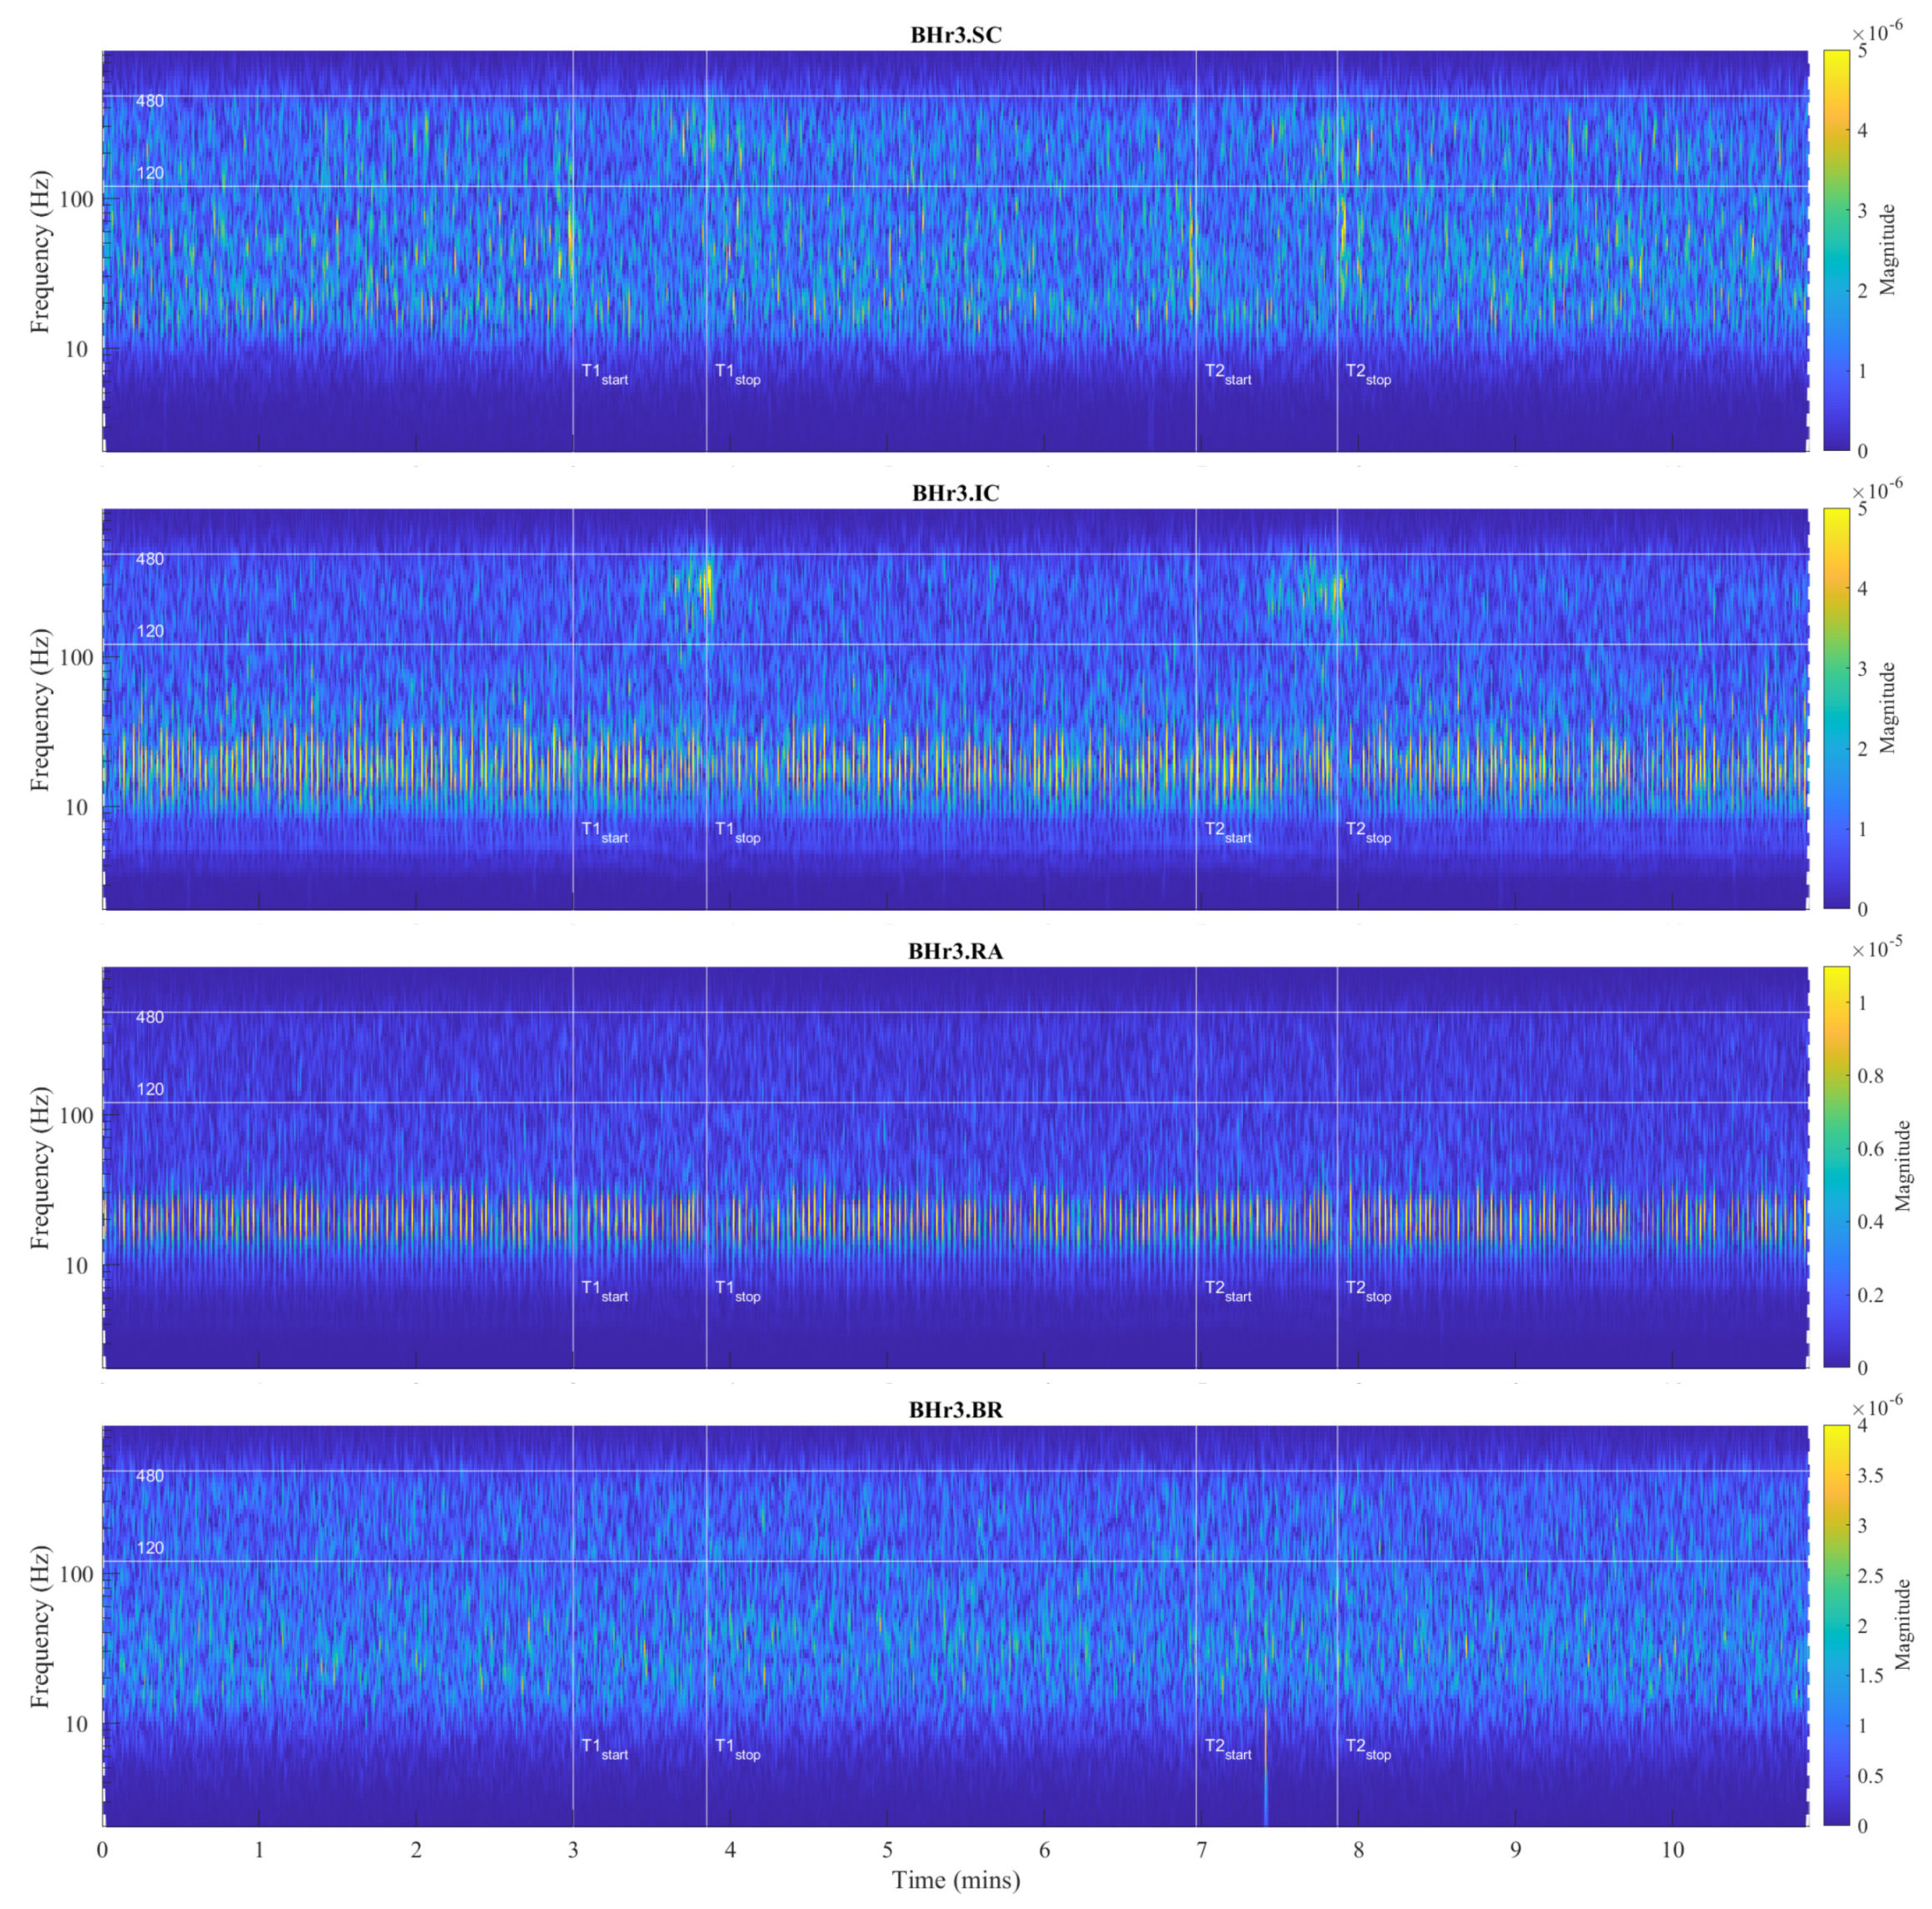
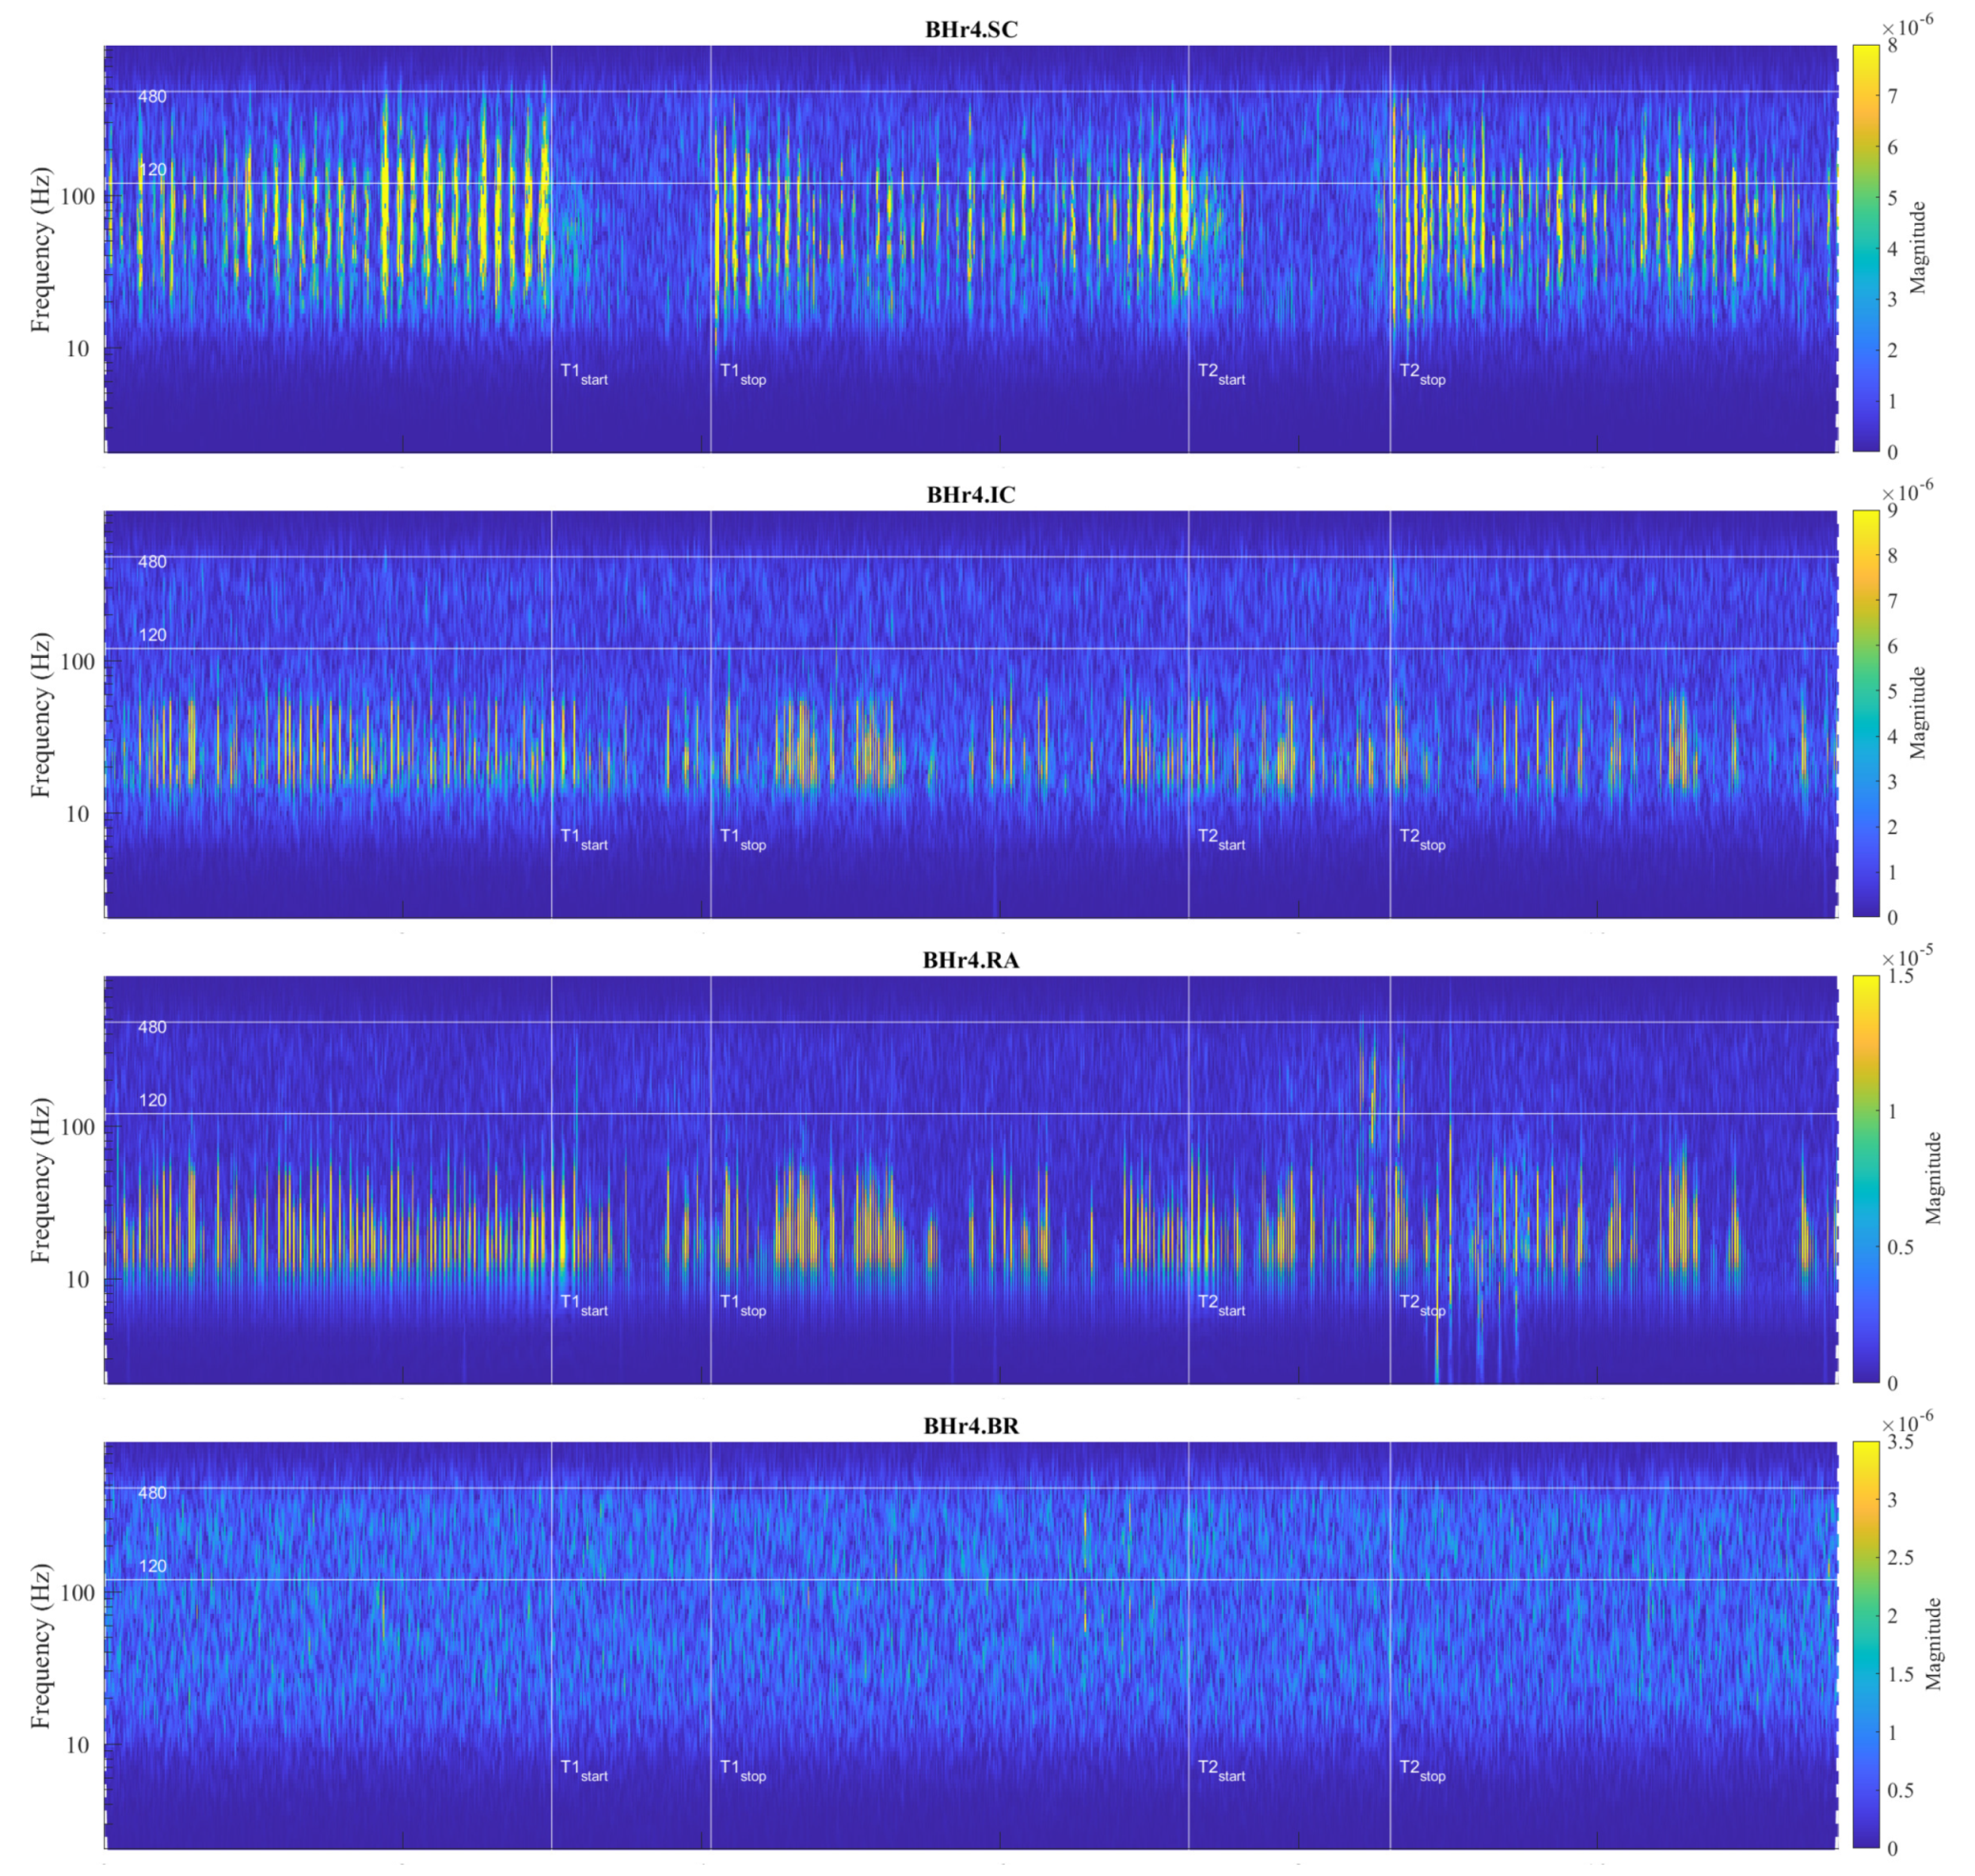
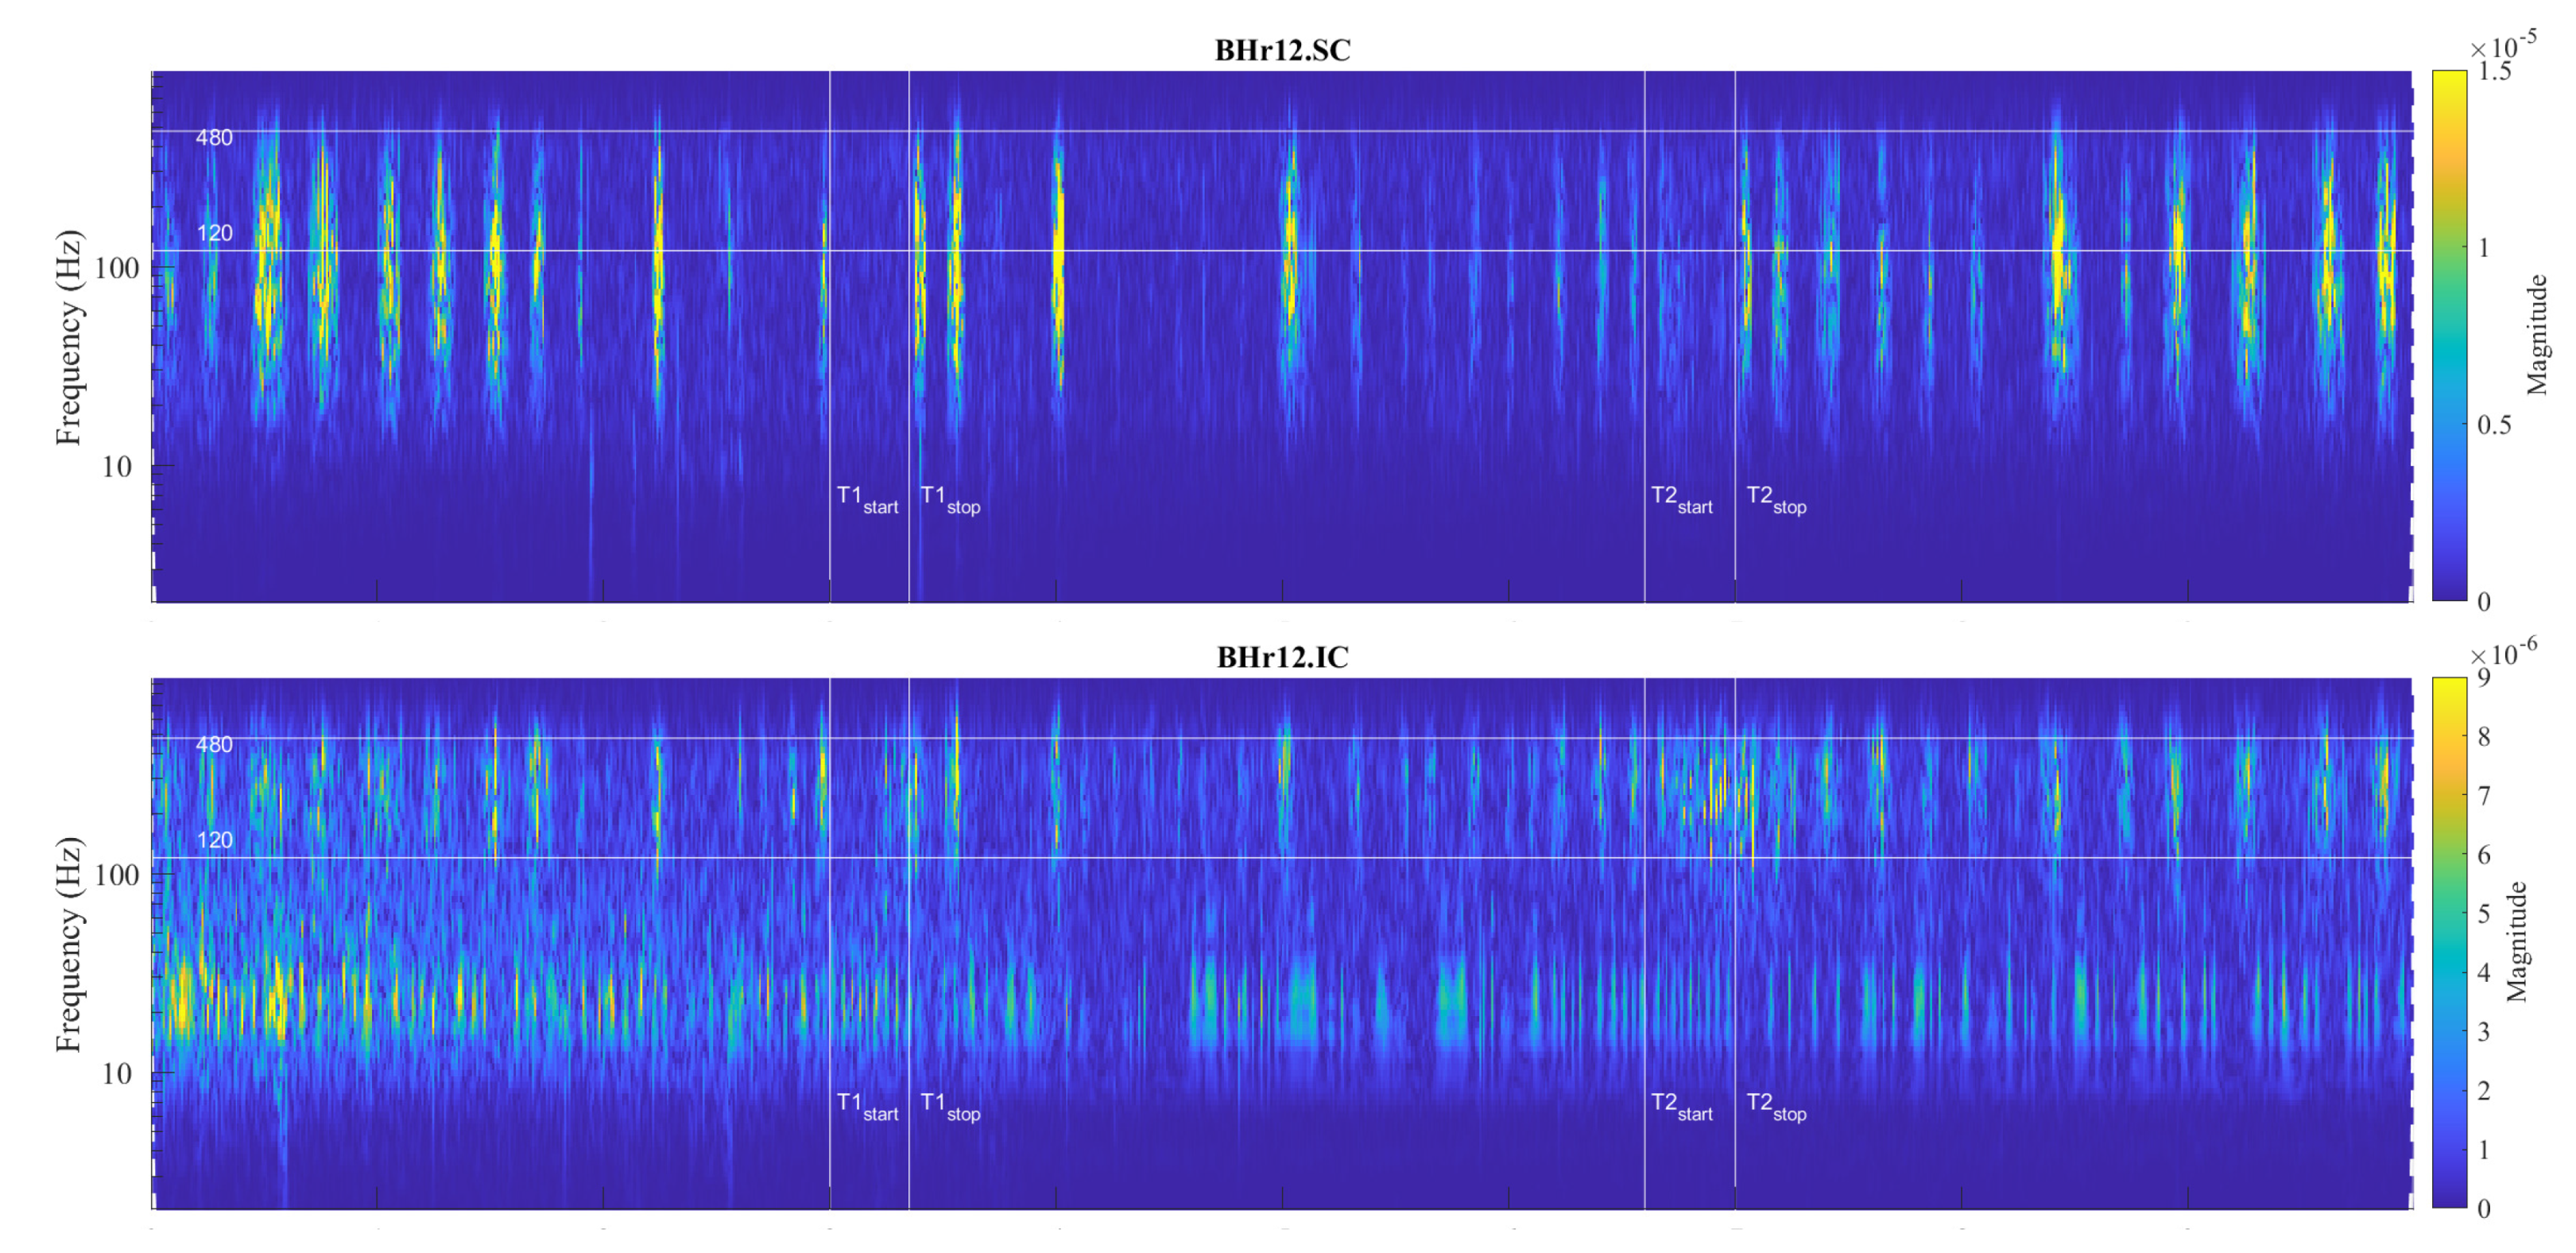

| Age | Height | Weight | BMI | BHD1 | BHD2 | ||||
|---|---|---|---|---|---|---|---|---|---|
| Sports Participation | Sport/Activity | Gender | (years) | (cm) | (kg) | () | (min:sec) | (min:sec) | |
| BHr1 | Professional | Swimming | Female | 20.9 | 168 | 63 | 22.3 | 0:24 | 0:27 |
| BHr2 | Professional | Rowing | Female | 29.4 | 180 | 75 | 23.2 | 0:31 | 0:28 |
| BHr3 | Professional | Rowing | Male | 30.5 | 195 | 92 | 24.2 | 0:51 | 0:53 |
| BHr4 | Professional | Rowing | Male | 26.9 | 197 | 90 | 23.2 | 1:04 | 1:21 |
| BHr5 | Professional | Athletics | Male | 25.1 | 192 | 85 | 23.1 | 0:57 | 0:52 |
| BHr6 | Professional | Scuba diving | Male | 27.2 | 186 | 80 | 23.1 | 1:10 | 1:06 |
| MEAN | 26.7 | 186.3 | 80.8 | 23.2 | 0:49 | 0:51 | |||
| PROFESSIONALS | SD | 3.1 | 10.0 | 9.8 | 0.5 | 0:17 | 0:19 | ||
| BHr7 | Amateur | Volleyball | Male | 20.6 | 204 | 95 | 22.8 | 0:27 | 0:29 |
| BHr8 | Amateur | Jujutsu | Male | 36.7 | 185 | 76 | 22.2 | 0:43 | 0:52 |
| BHr9 | Amateur | Jujutsu | Male | 19.2 | 178 | 69 | 21.8 | 0:34 | 0:37 |
| BHr10 | Amateur | Jujutsu | Male | 44.9 | 180 | 80 | 24.7 | 0:40 | 0:57 |
| BHr11 | Amateur | Jujutsu | Male | 40.1 | 180 | 82 | 25.3 | 0:36 | 0:49 |
| BHr12 | Amateur | Yoga | Male | 45.0 | 197 | 93 | 24.0 | 0:21 | 0:24 |
| MEAN | 34.4 | 187.3 | 82.5 | 23.5 | 0:33 | 0:41 | |||
| AMATEURS | SD | 11.7 | 10.7 | 10.0 | 1.4 | 0:08 | 0:12 | ||
| MEAN | 30.5 | 186.8 | 81.7 | 23.3 | 0:41 | 0:45 | |||
| TOTAL | SD | 9.1 | 10.3 | 9.9 | 1.0 | 0:12 | 0:14 |
Disclaimer/Publisher’s Note: The statements, opinions and data contained in all publications are solely those of the individual author(s) and contributor(s) and not of MDPI and/or the editor(s). MDPI and/or the editor(s) disclaim responsibility for any injury to people or property resulting from any ideas, methods, instructions or products referred to in the content. |
© 2023 by the authors. Licensee MDPI, Basel, Switzerland. This article is an open access article distributed under the terms and conditions of the Creative Commons Attribution (CC BY) license (http://creativecommons.org/licenses/by/4.0/).


