Submitted:
30 May 2023
Posted:
31 May 2023
You are already at the latest version
Abstract
Keywords:
1. Introduction
2. Numerical Simulation Method
2.1. Actuator disk model
2.2. Example Verification
3. Analysis of factors affecting slipstream characteristics
3.1. Introduction of the propeller + wing model
3.2. Propeller diameter
3.3. Relative height of propeller
3.4. Distance between the propeller and wing leading edge
4. Genetic algorithm optimization
4.1. Optimization Introduction
4.2. Analysis of optimization results
5. Conclusion
Author Contributions
Funding
Data Availability Statement
Conflicts of Interest
References
- Patterson, M. D. and German, B., "Conceptual design of electric aircraft with distributed propellers: multidisciplinary analysis needs and aerodynamic modeling development," 52nd Aerospace sciences meeting, 2014, pp. 0534.
- Moore, M. D., "Misconceptions of electric aircraft and their emerging aviation markets," 52nd Aerospace Sciences Meeting, 2014, pp. 0535.
- Borer, N. K., Patterson, M. D., Viken, J. K., Moore, M. D., Bevirt, J., Stoll, A. M. and Gibson, A. R., "Design and performance of the NASA SCEPTOR distributed electric propulsion flight demonstrator," 16th AIAA Aviation Technology, Integration, and Operations Conference, 2016, pp. 3920. [CrossRef]
- Patterson, M. D., Derlaga, J. M. and Borer, N. K., "High-lift propeller system configuration selection for NASA's SCEPTOR distributed electric propulsion flight demonstrator," 16th AIAA Aviation Technology, Integration, and Operations Conference, 2016, pp. 3922.
- Schnulo, S. L., Chin, J., Smith, A. and Paul-Dubois-Taine, A., "Steady state thermal analyses of SCEPTOR X-57 wingtip propulsion," 17th AIAA Aviation Technology, Integration, and Operations Conference, 2017, pp. 3783. [CrossRef]
- Christie, R. J., Dubois, A. and Derlaga, J. M., "Cooling of electric motors used for propulsion on SCEPTOR," Vol. No. 2017, pp.
- Moens, F. and Gardarein, P., "Numerical simulation of the propeller/wing interactions for transport aircraft," 19th AIAA applied aerodynamics conference, 2001, pp. 2404.
- Catalano, F. and Stollery, J., "The effect of a high thrust pusher propeller on the flow over a straight wing," 11th Applied Aerodynamics Conference, 1993, pp. 3436.
- JOHNSON, J., J and White, E., "Exploratory low-speed wind-tunnel investigation of advanced commuterconfigurations including an over-the-wing propeller design," Aircraft Design, Systems and Technology Meeting, 1983, pp. 2531.
- Müller, L., Heinze, W., Kožulović, D., Hepperle, M. and Radespiel, R., "Aerodynamic installation effects of an over-the-wing propeller on a high-lift configuration," Journal of aircraft, Vol. 51, No. 2014, pp. 249-258. [CrossRef]
- Stoll, A. M., Bevirt, J., Moore, M. D., Fredericks, W. J. and Borer, N. K., "Drag reduction through distributed electric propulsion," 14th AIAA aviation technology, integration, and operations conference, 2014, pp. 2851. [CrossRef]
- Patterson, M. D. and Borer, N. K., "Approach considerations in aircraft with high-lift propeller systems," 17th AIAA Aviation Technology, Integration, and Operations Conference, 2017, pp. 3782.
- Litherland, B. L., Patterson, M. D., Derlaga, J. M. and Borer, N. K., "A method for designing conforming folding propellers," 17th AIAA Aviation Technology, Integration, and Operations Conference, 2017, pp. 3781.
- Marcus, E. A., de Vries, R., Raju Kulkarni, A. and Veldhuis, L. L., "Aerodynamic investigation of an over-the-wing propeller for distributed propulsion," 2018 AIAA Aerospace Sciences Meeting, 2018, pp. 2053. [CrossRef]
- De Vries, R., van Arnhem, N., Sinnige, T., Vos, R. and Veldhuis, L. L., "Aerodynamic interaction between propellers of a distributed-propulsion system in forward flight," Aerospace Science and Technology, Vol. 118, No. 2021, pp. 107009. [CrossRef]
- Seo, Y., Hong, Y. and Yee, K., "Numerical investigation of wing–multiple propeller aerodynamic interaction using actuator disk method," International Journal of Aeronautical and Space Sciences, Vol. 23, No. 2022, pp. 805-822. [CrossRef]
- Sinnige, T., van Arnhem, N., Stokkermans, T. C., Eitelberg, G. and Veldhuis, L. L., "Wingtip-mounted propellers: Aerodynamic analysis of interaction effects and comparison with conventional layout," Journal of aircraft, Vol. 56, No. 2019, pp. 295-312. [CrossRef]
- Li, B., Lu, H. and Deng, S., "Validation of an actuator disk model for numerical simulation of propeller," Proceedings of the Institution of Mechanical Engineers, Part G: Journal of Aerospace Engineering, Vol. 229, No. 2015, pp. 1454-1463. [CrossRef]
- Barakos, G., Fitzgibbon, T., Kusyumov, A., Kusyumov, S. and Mikhailov, S., "CFD simulation of helicopter rotor flow based on unsteady actuator disk model," Chinese Journal of Aeronautics, Vol. 33, No. 2020, pp. 2313-2328. [CrossRef]
- O'Brien, D. and Smith, M., "Analysis of rotor-fuselage interactions using various rotor models," 43rd AIAA Aerospace Sciences Meeting and Exhibit, 2005, pp. 468.
- Troldborg, N., "Actuator line modeling of wind turbine wakes," Vol. No. 2009, pp.
- Stokkermans, T. C., Van Arnhem, N., Sinnige, T. and Veldhuis, L. L., "Validation and comparison of RANS propeller modeling methods for tip-mounted applications," AIAA Journal, Vol. 57, No. 2019, pp. 566-580. [CrossRef]
- Patterson, M. D., "Conceptual design of high-lift propeller systems for small electric aircraft," Vol. No. 2016, pp.

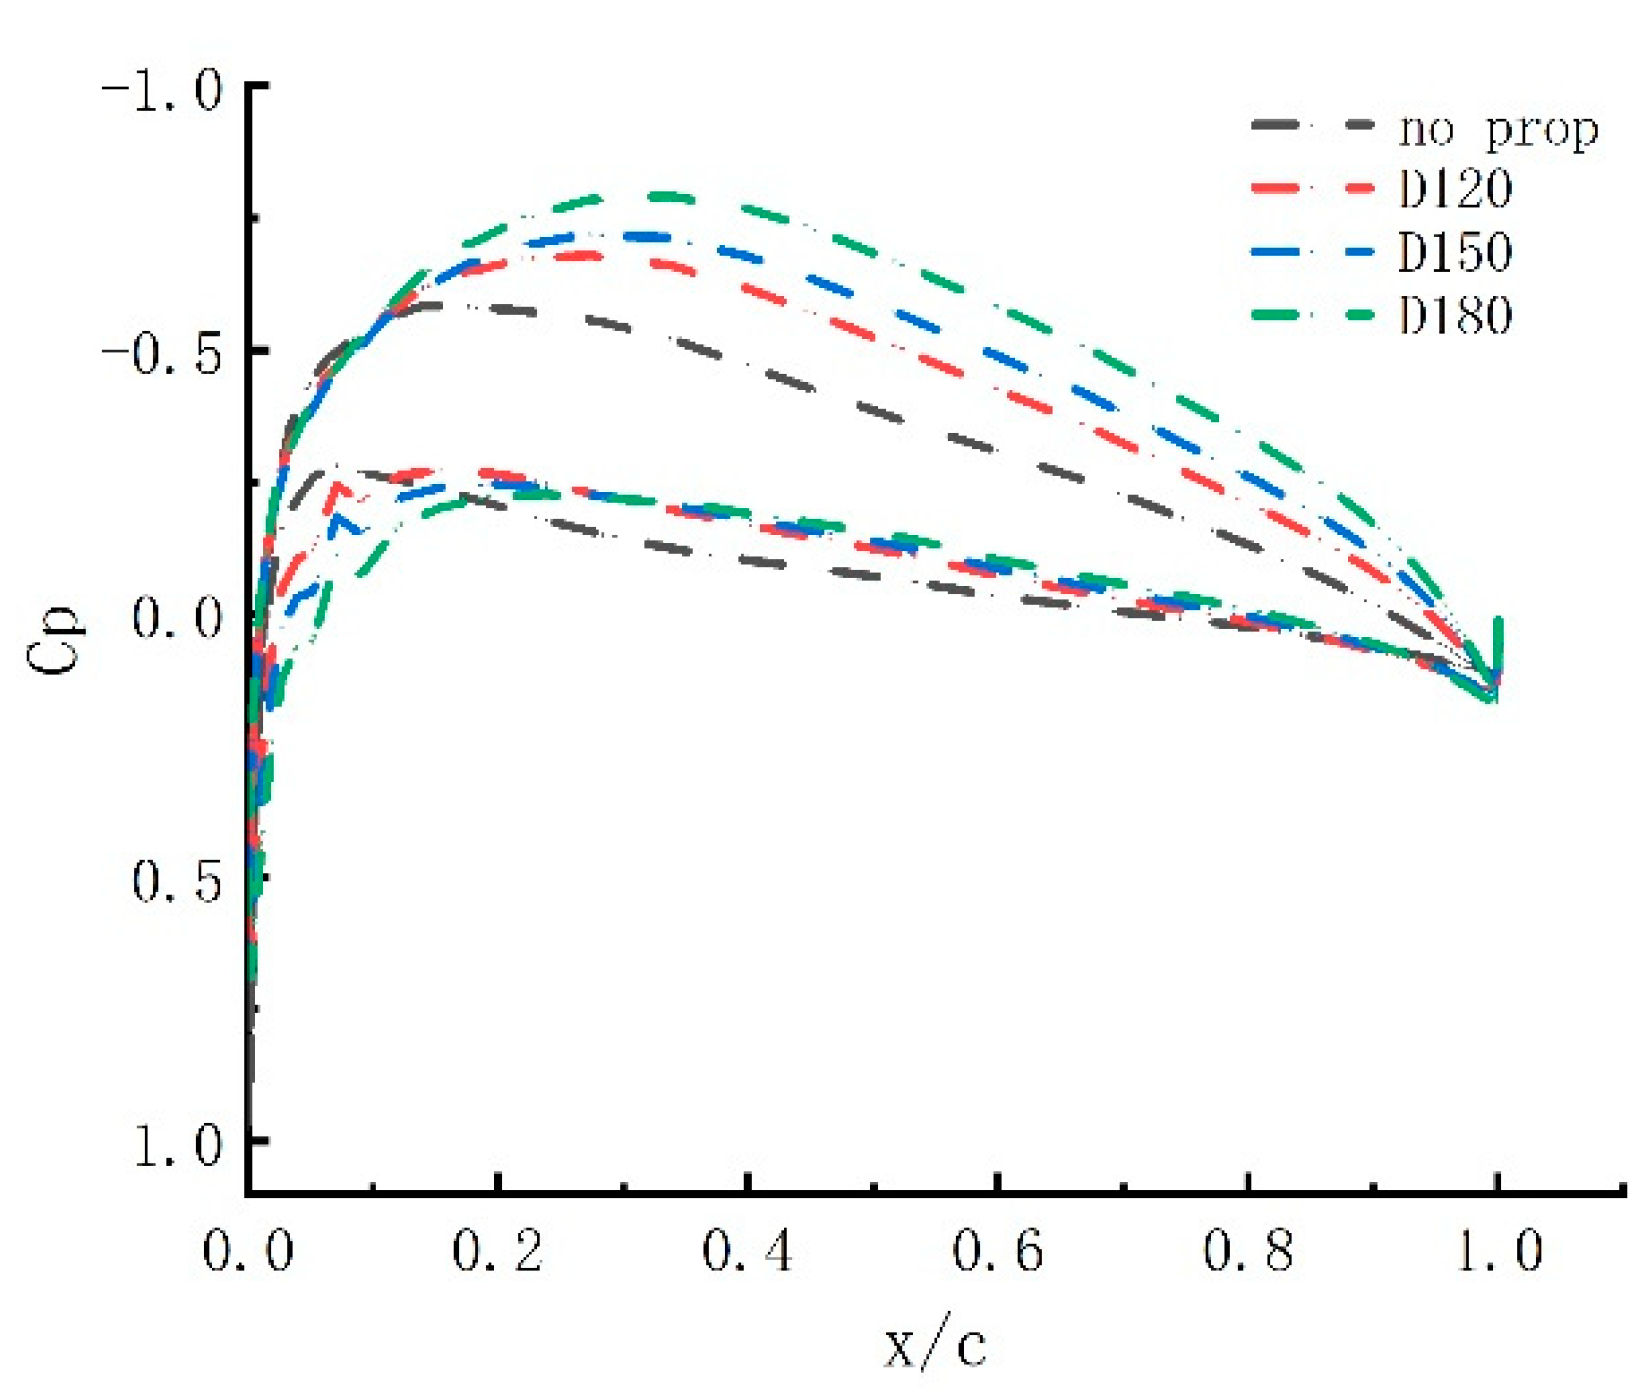

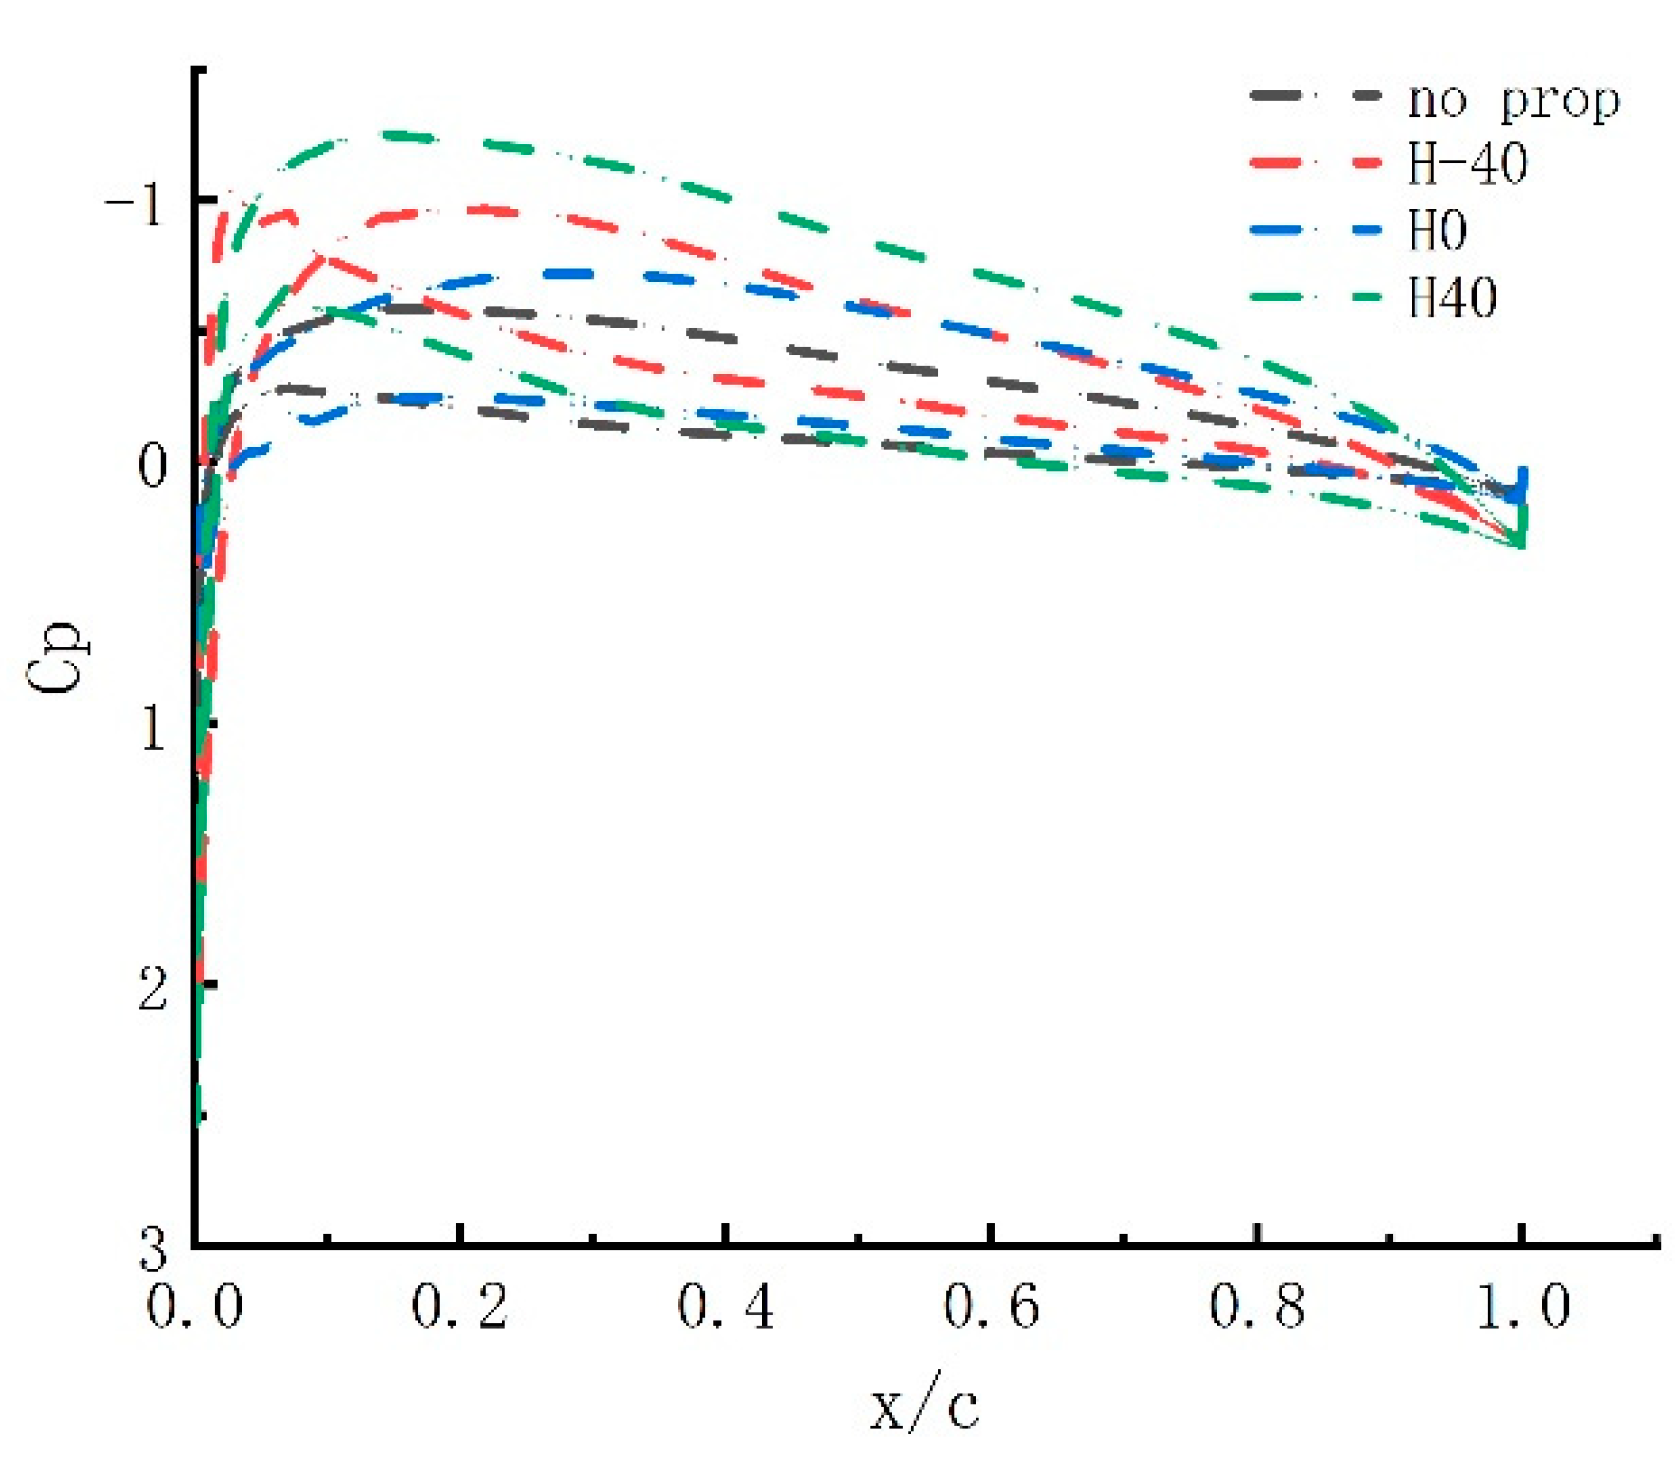

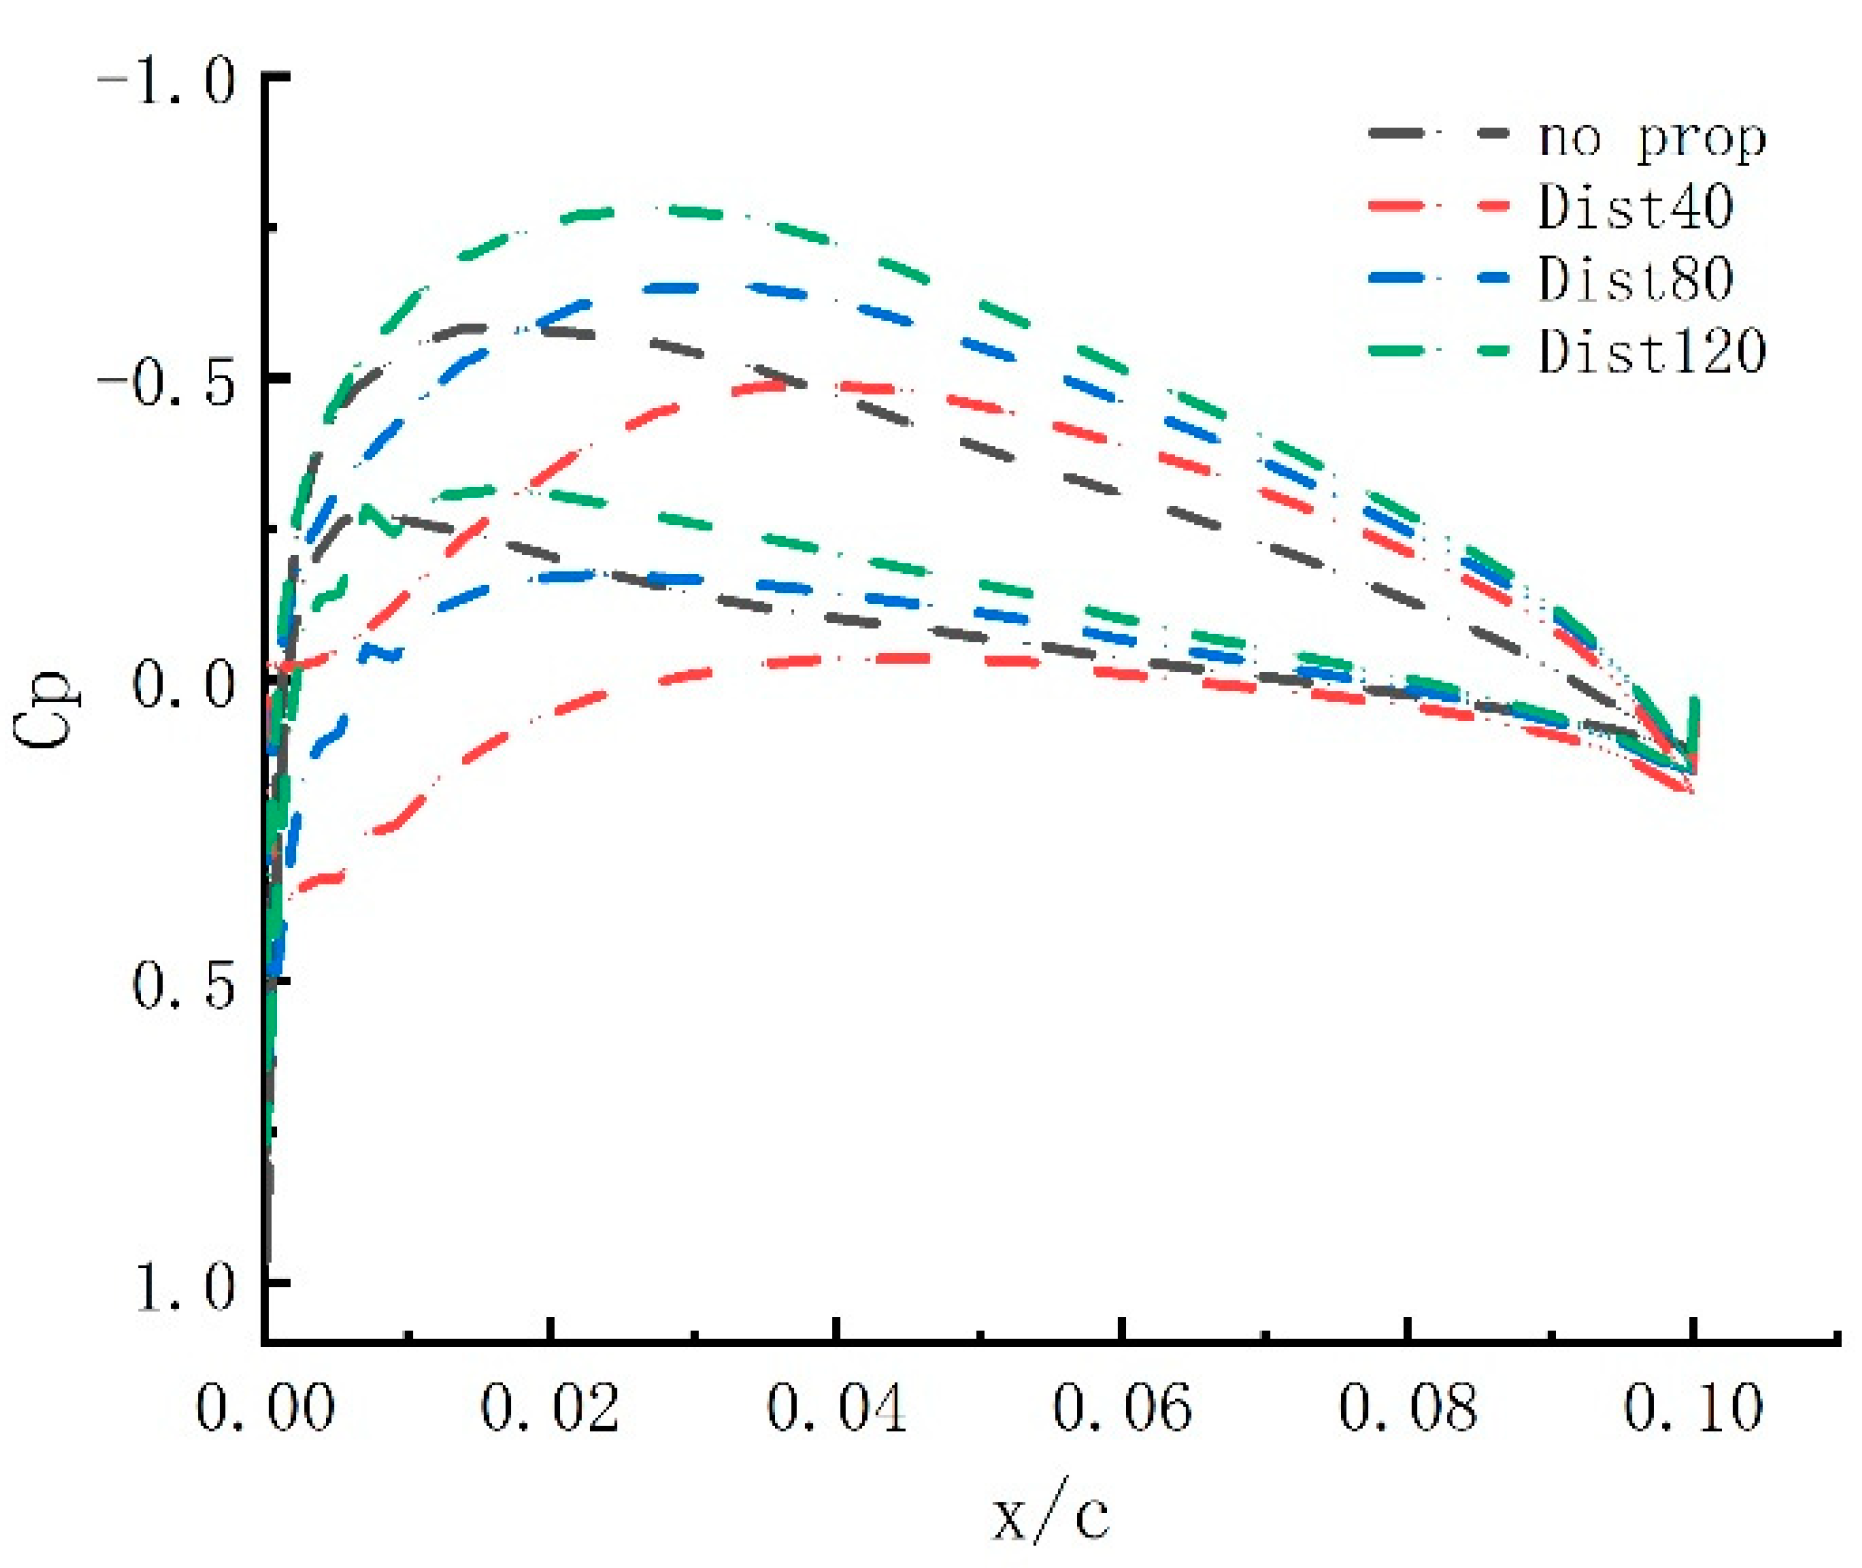
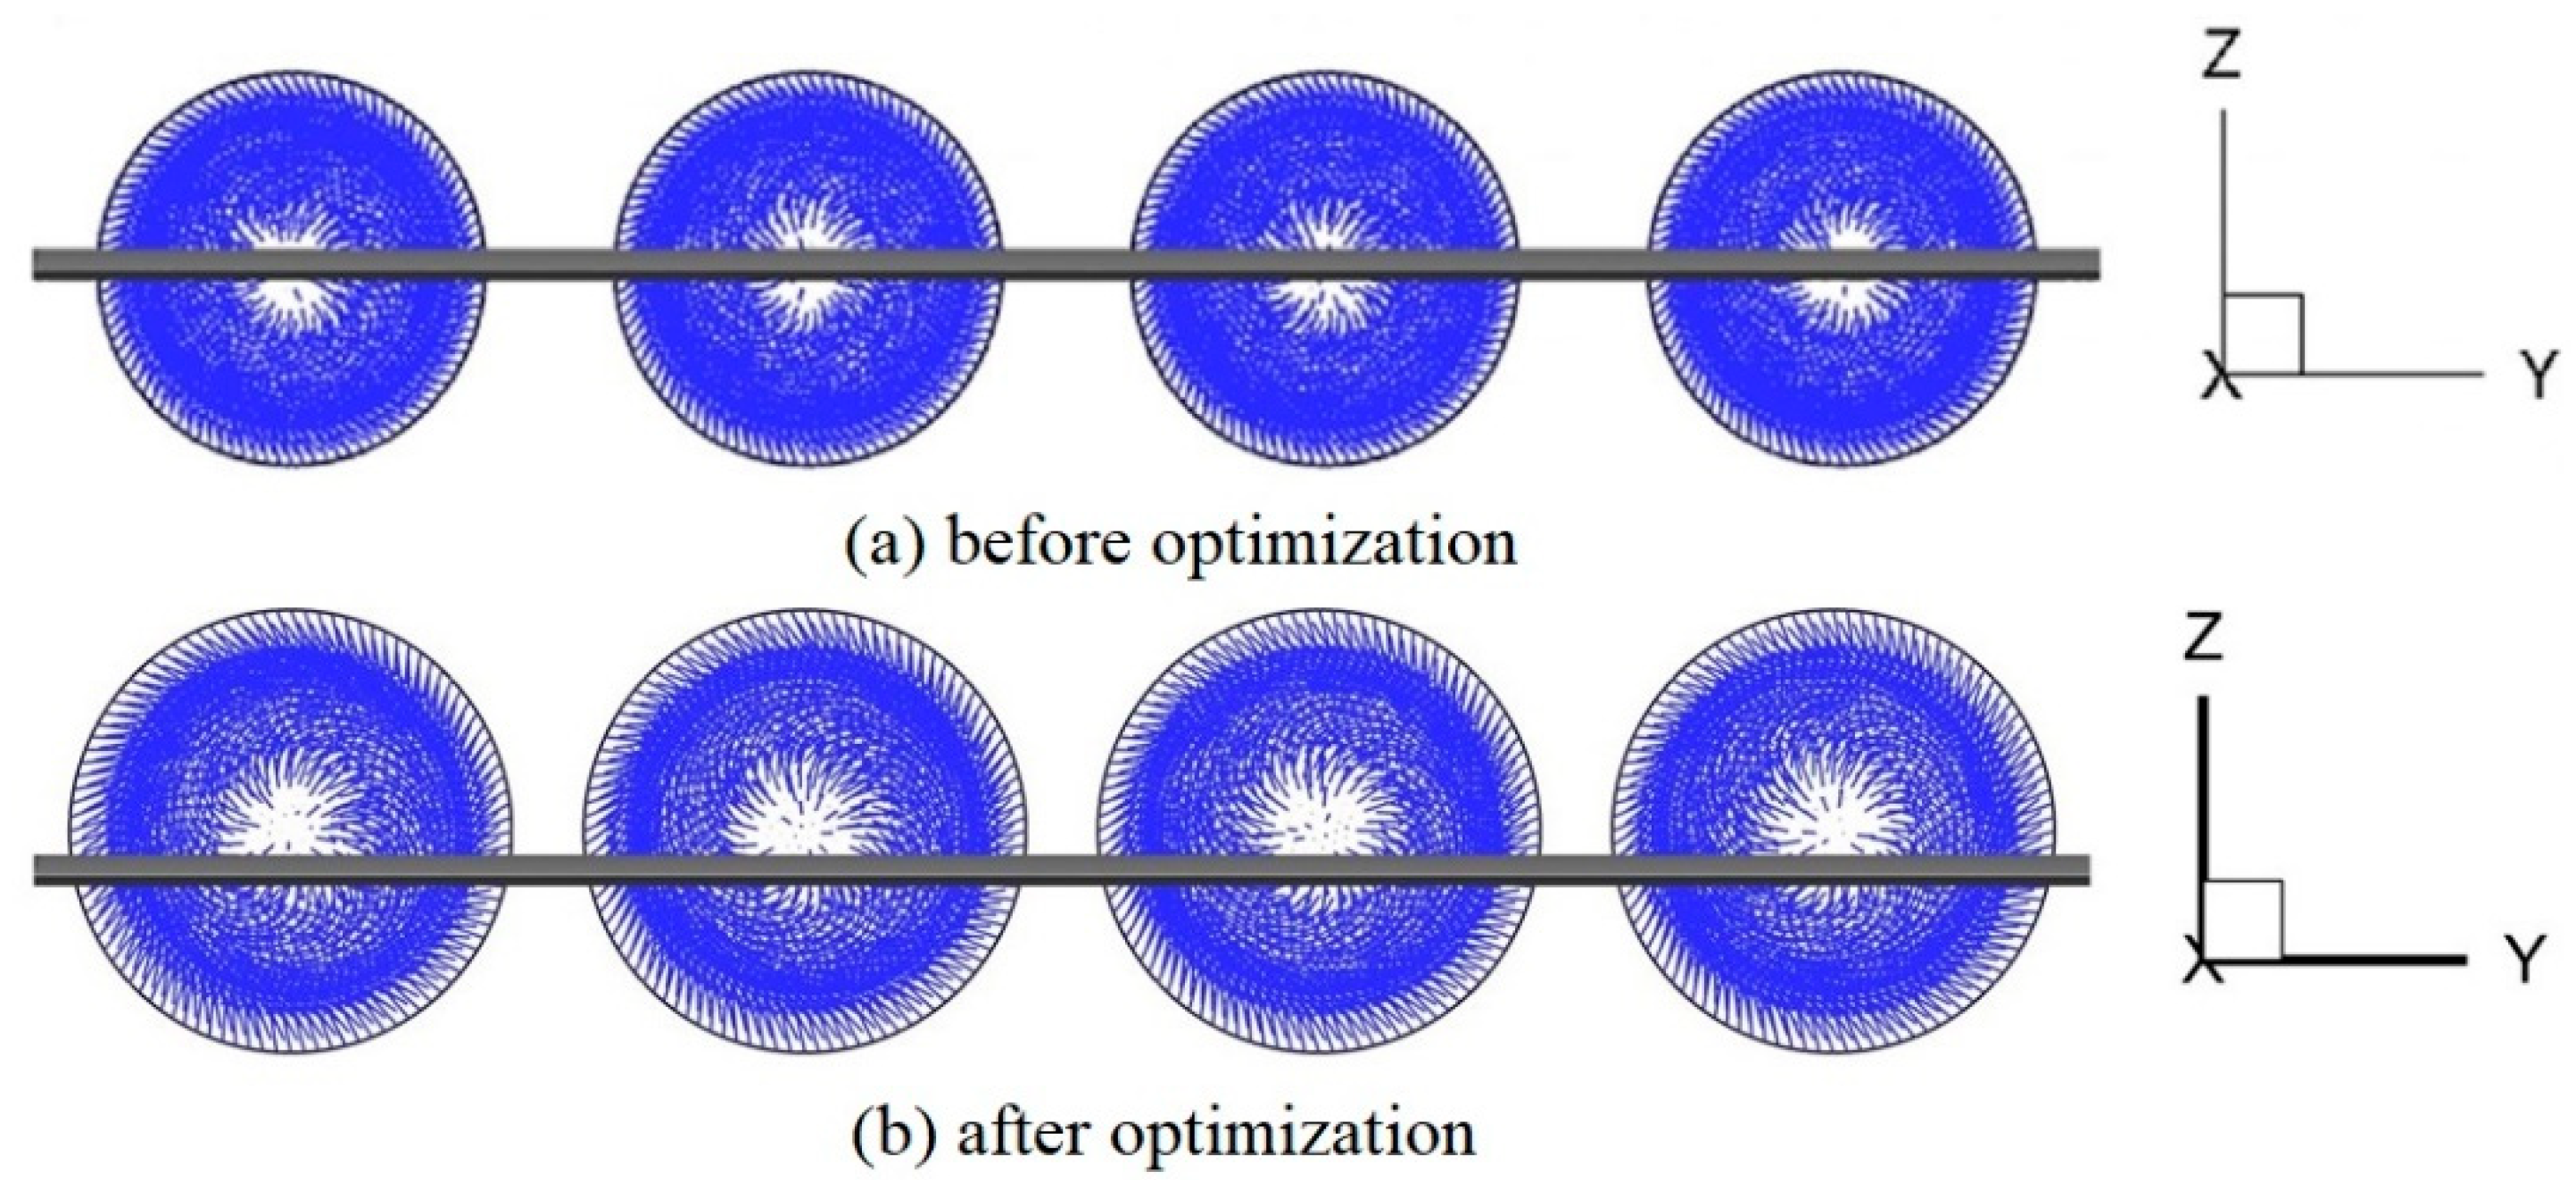
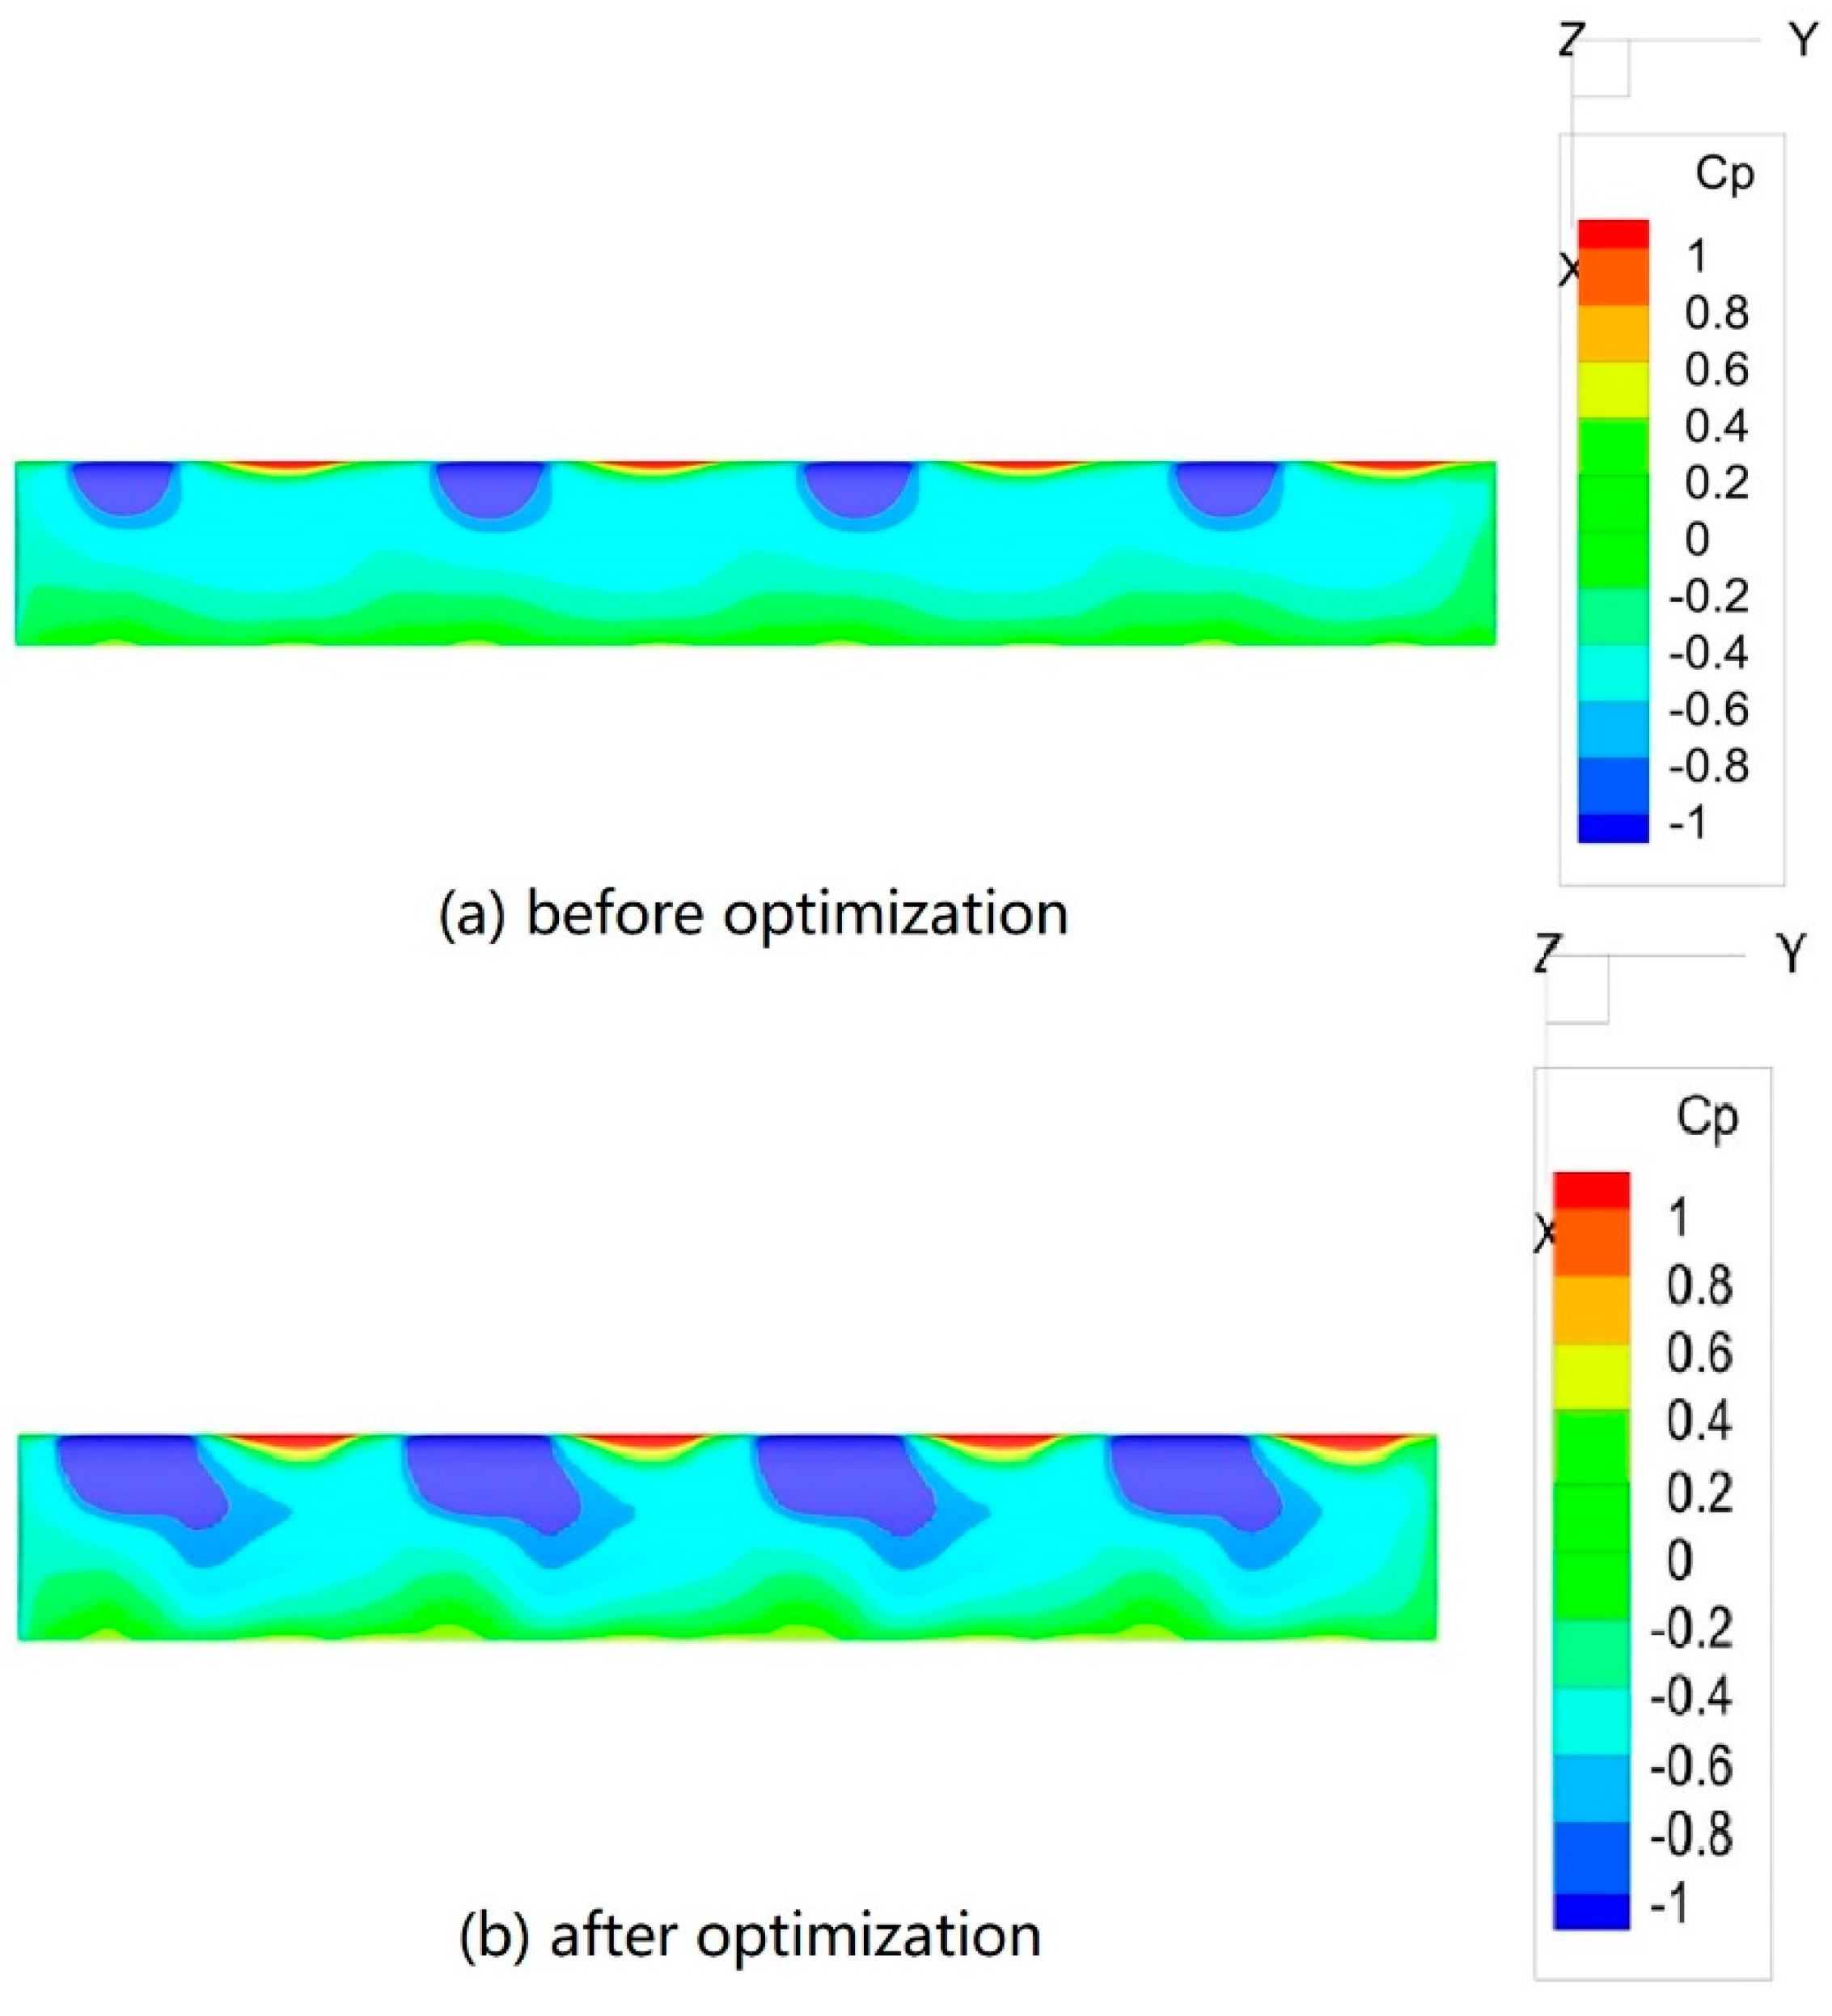
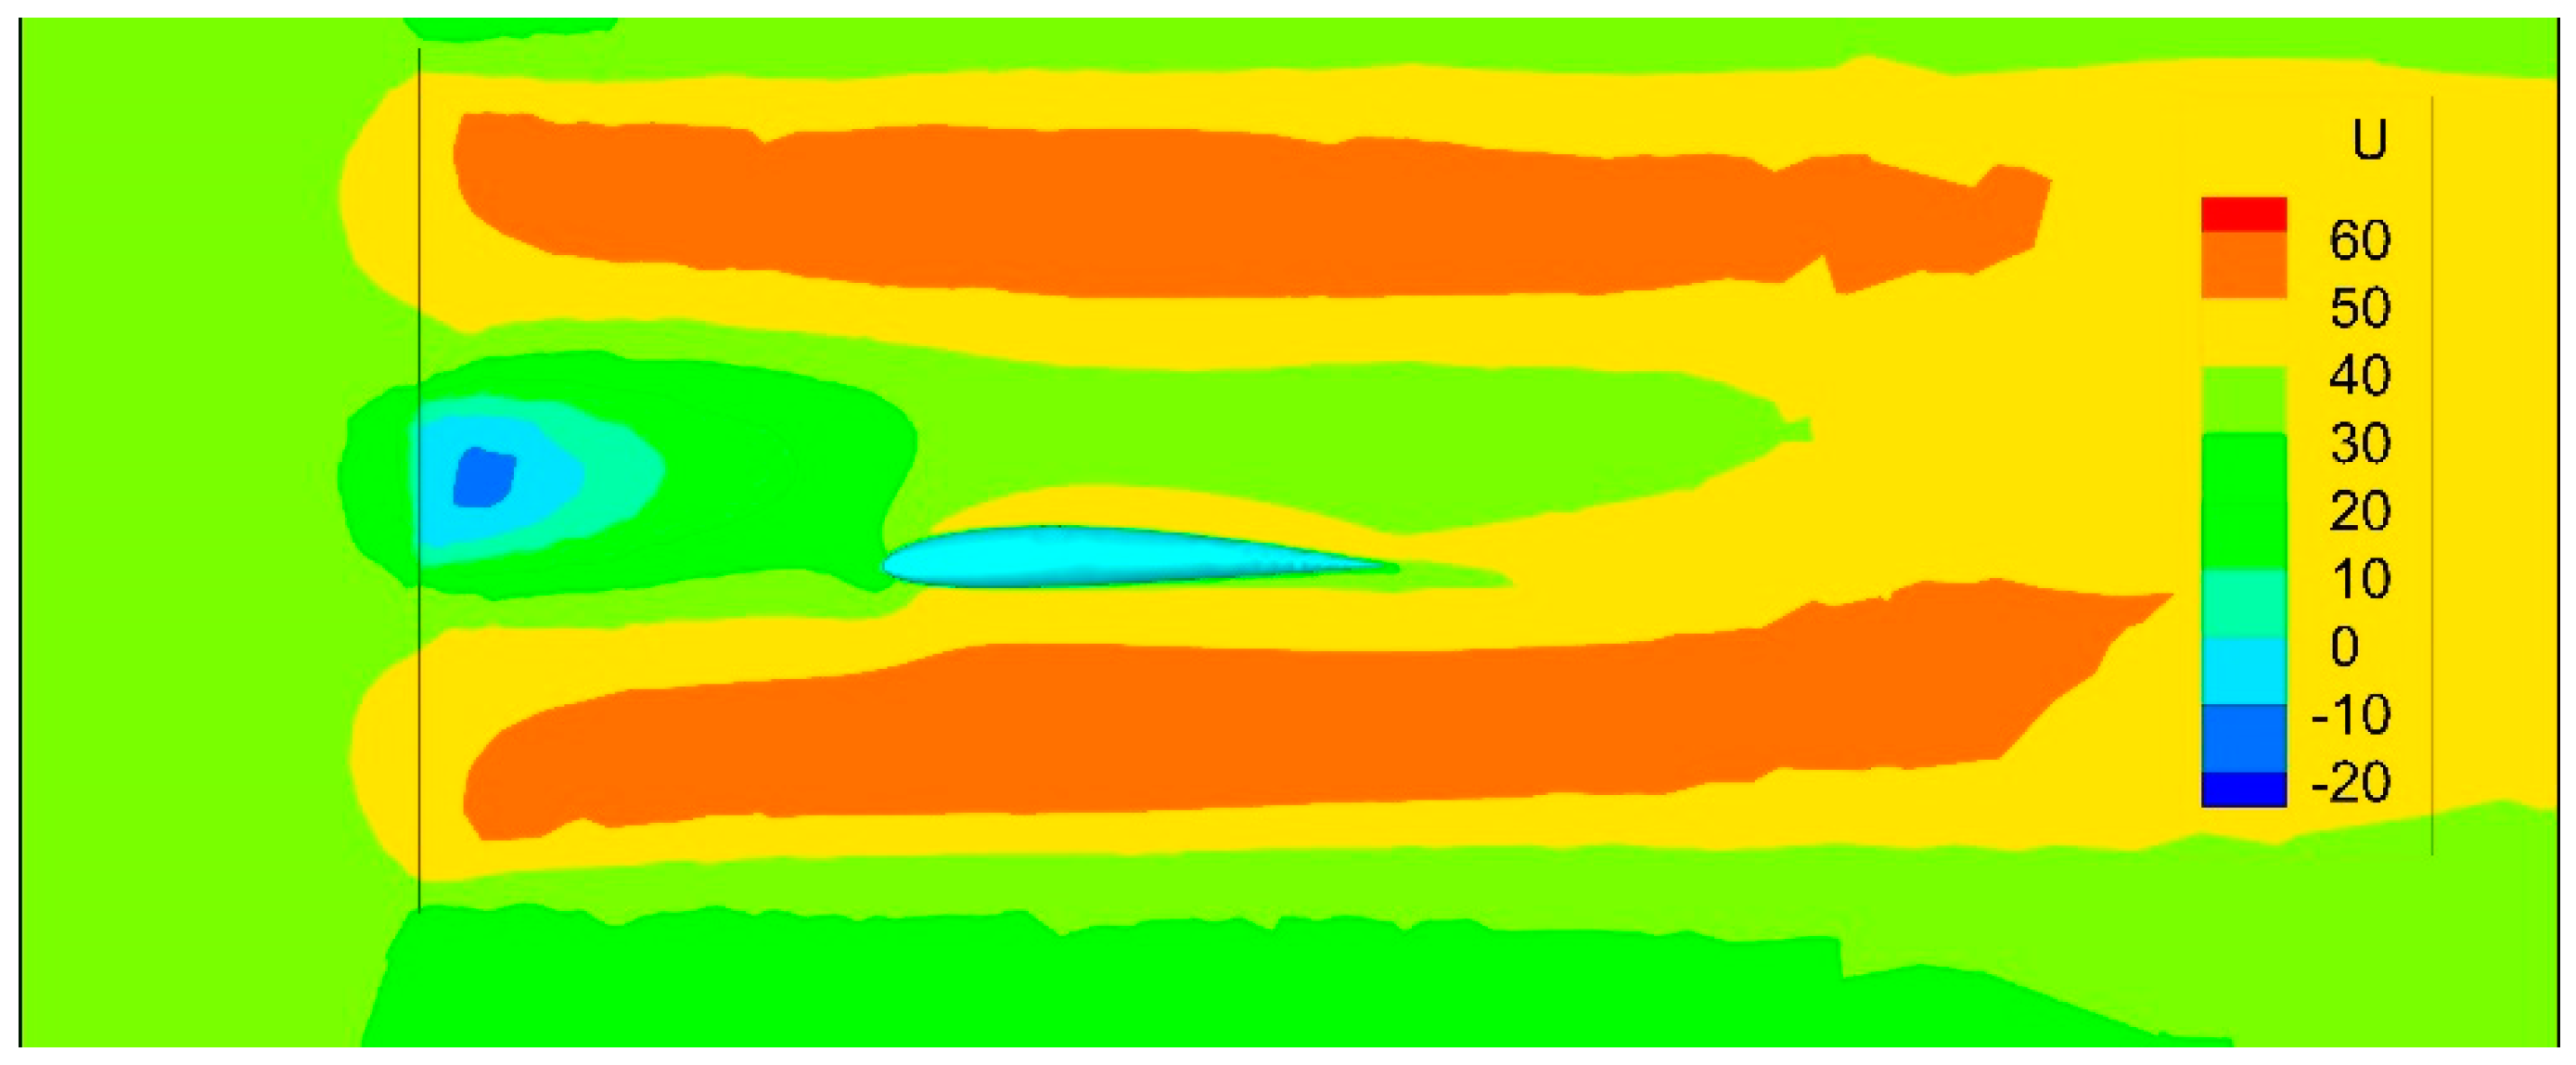
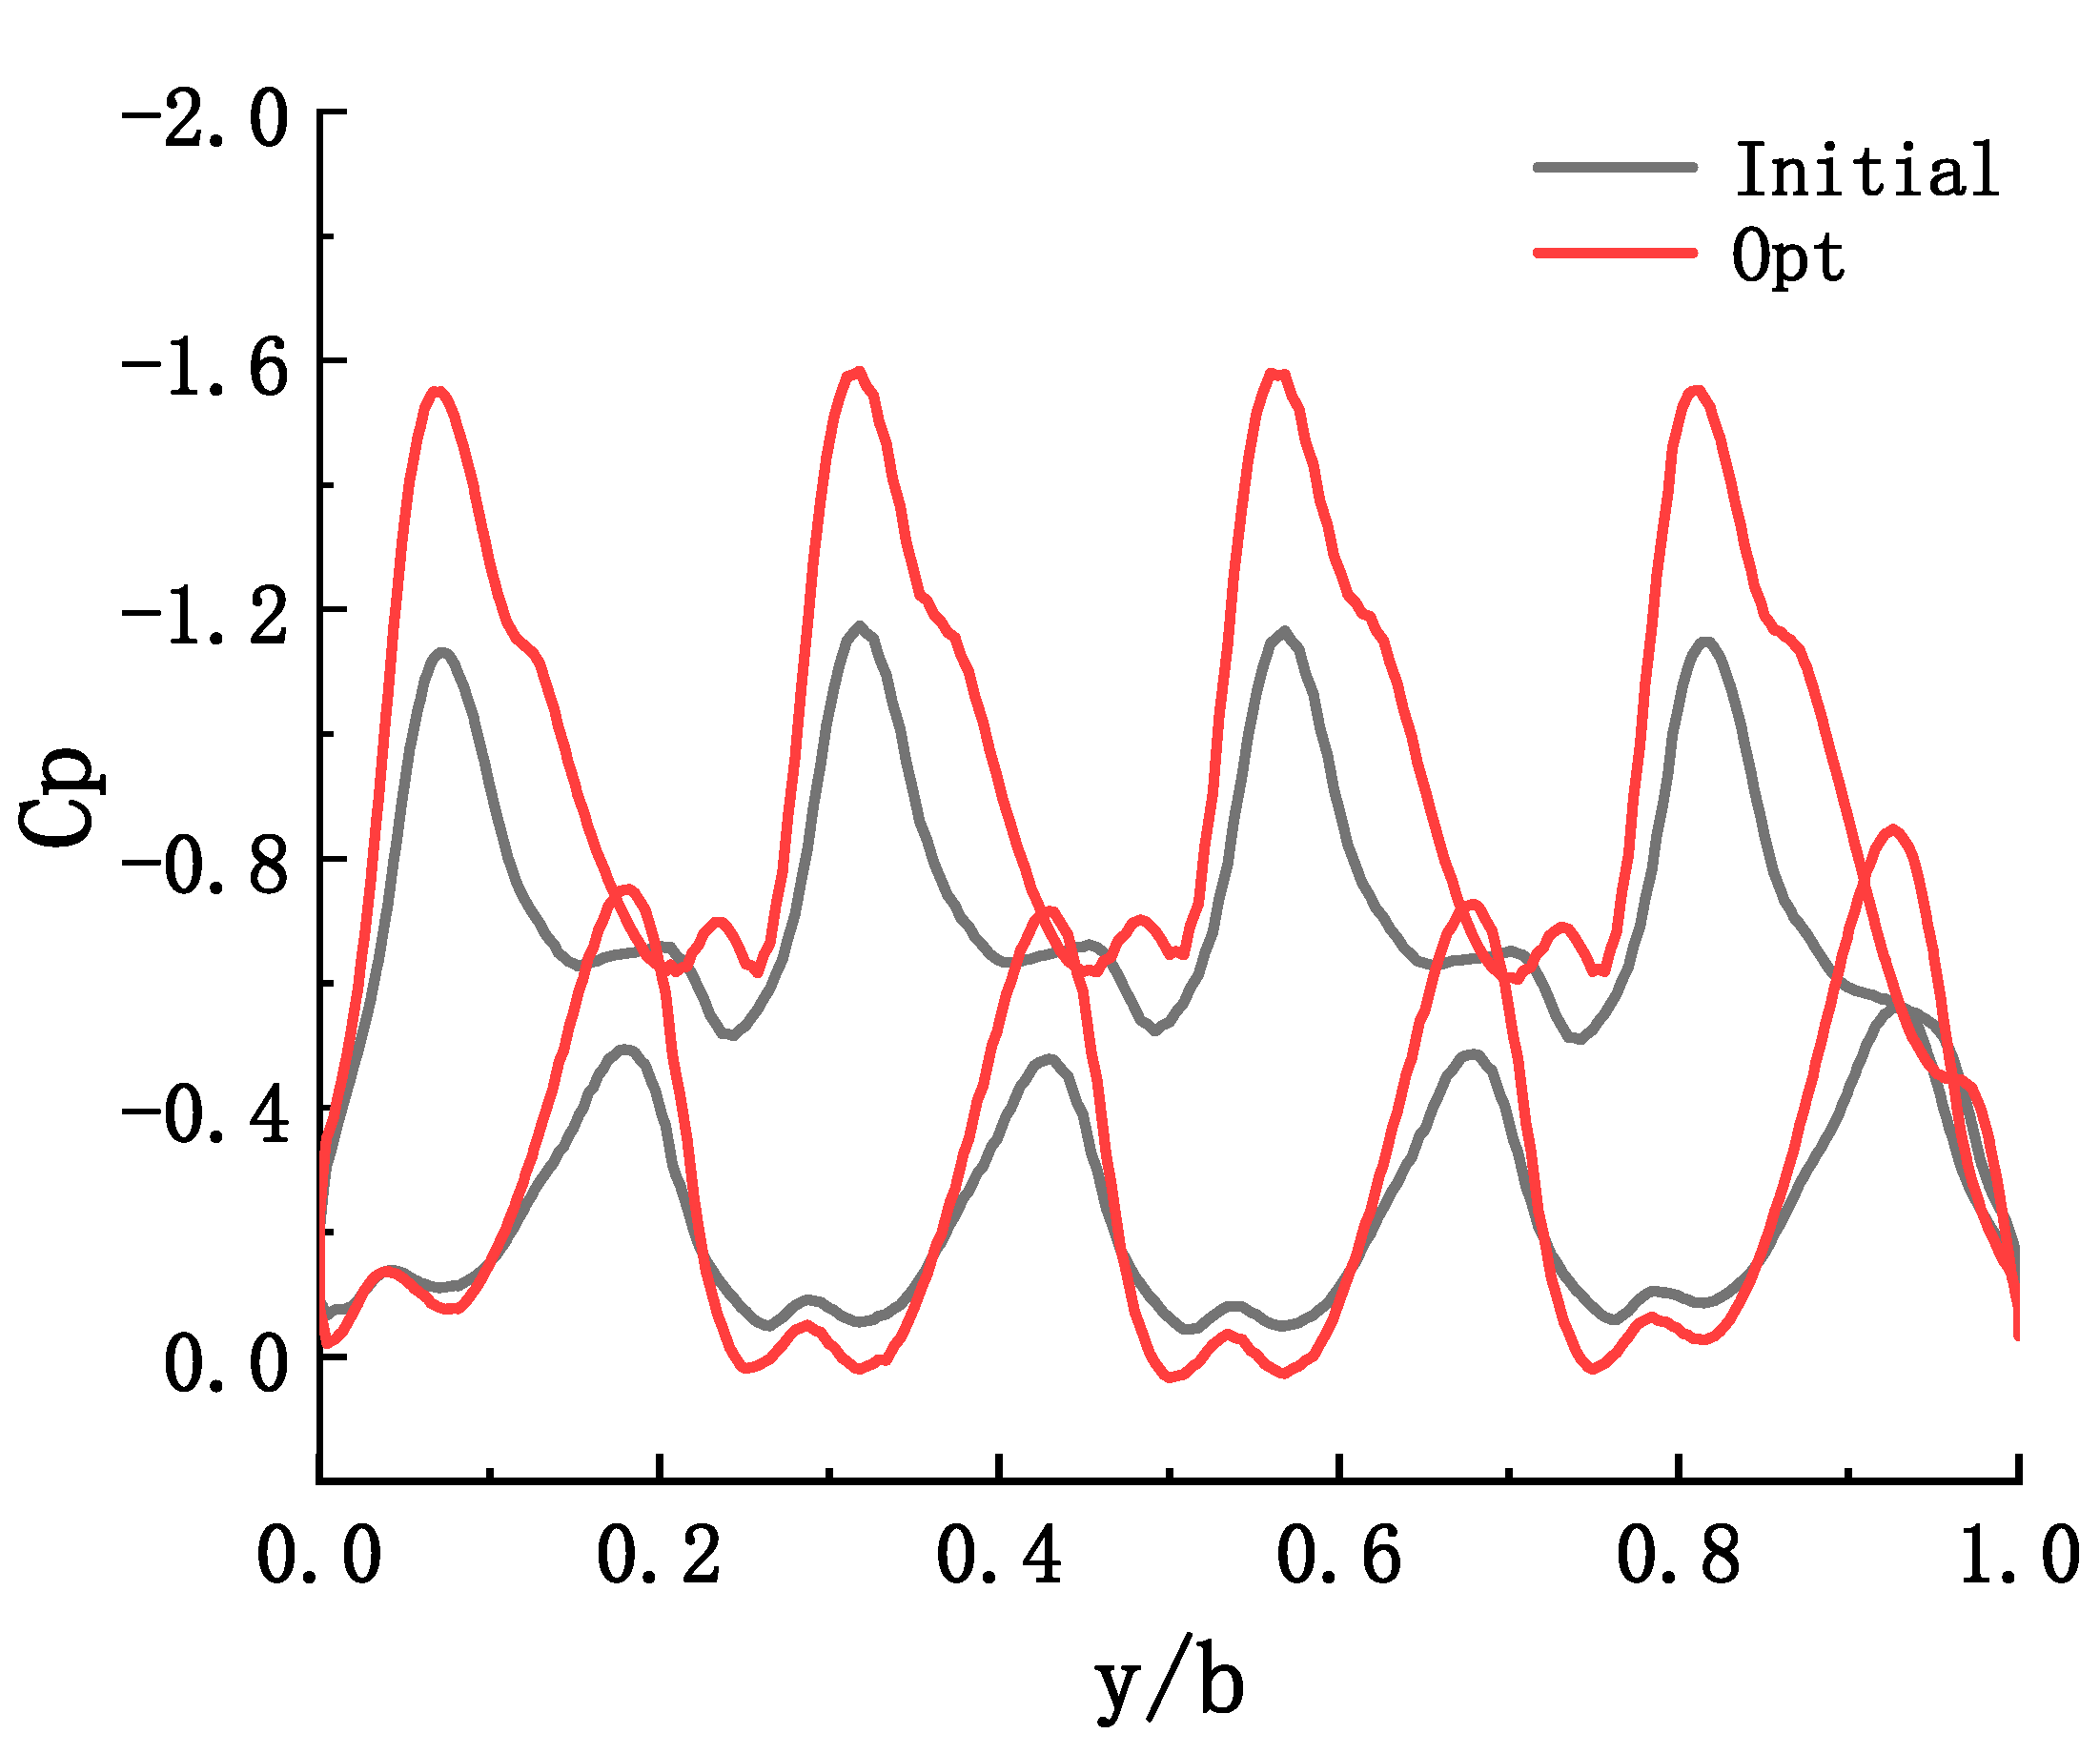
| Relative radius | Local blade Angle | c/R | Relative thickness |
|---|---|---|---|
| 0.2 | 39.88° | 0.107 | 0.350 |
| 0.3 | 30.70° | 0.144 | 0.274 |
| 0.4 | 26.60° | 0.169 | 0.204 |
| 0.5 | 23.00° | 0.178 | 0.171 |
| 0.6 | 19.80° | 0.172 | 0.154 |
| 0.7 | 17.00° | 0.159 | 0.146 |
| 0.8 | 14.65° | 0.139 | 0.140 |
| 0.9 | 13.00° | 0.117 | 0.135 |
| 1.0 | 12.00° | 0.092 | 0.130 |
| Case | Relative error, % | ||
|---|---|---|---|
| 1 | 0.0655 | 0.0639 | 2.43 |
| 2 | 0.0560 | 0.0538 | 3.93 |
| Attribute | Setup |
|---|---|
| Grid type | Tetrahedral unstructured mesh |
| Minimum mesh size | 0.13 mm |
| Grid number | 2462861 |
| Y+ | 1.0 |
| Diameter(mm) | Relative height(mm) | Leading edge distance(mm) | |
|---|---|---|---|
| Before optimization | 150 | 0 | -100 |
| The optimized | 172 | 17 | -92 |
| Cl | Cd | Cl/Cd | |
|---|---|---|---|
| The initial configuration | 0.331655 | 0.019635 | 16.89101 |
| The optimized | 0.490959 | 0.013941 | 35.21773 |
| Difference | 48.03% | -29.00% | 108.50% |
Disclaimer/Publisher’s Note: The statements, opinions and data contained in all publications are solely those of the individual author(s) and contributor(s) and not of MDPI and/or the editor(s). MDPI and/or the editor(s) disclaim responsibility for any injury to people or property resulting from any ideas, methods, instructions or products referred to in the content. |
© 2023 by the authors. Licensee MDPI, Basel, Switzerland. This article is an open access article distributed under the terms and conditions of the Creative Commons Attribution (CC BY) license (http://creativecommons.org/licenses/by/4.0/).


