Submitted:
26 May 2023
Posted:
31 May 2023
You are already at the latest version
Abstract
Keywords:
1. Introduction
2. Materials and Methods
2.1. Preparation and characterization of pristine biochar and Ca-rich biochar
2.2. Experiments to simulate the dry-wet and freeze-thaw aging processes of biochar
2.3. Measure of carbon stability in biochar
2.4. Experiments to simulate the natural aging process of biochar in different farmland soils
2.5. Statistical analysis and quality control
3. Results and discussion
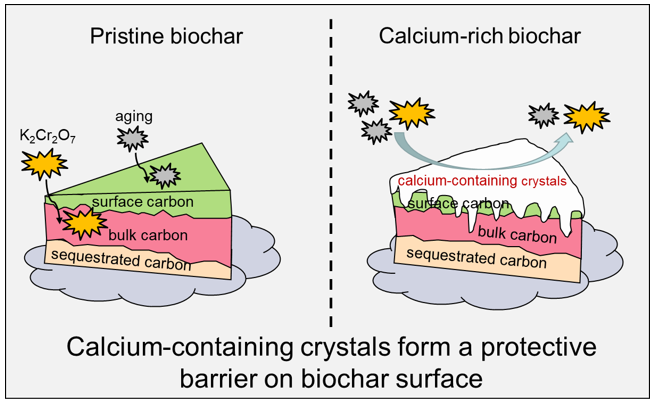
3.1. Exogenous calcium served as an “armor” to protect C during biochar aging
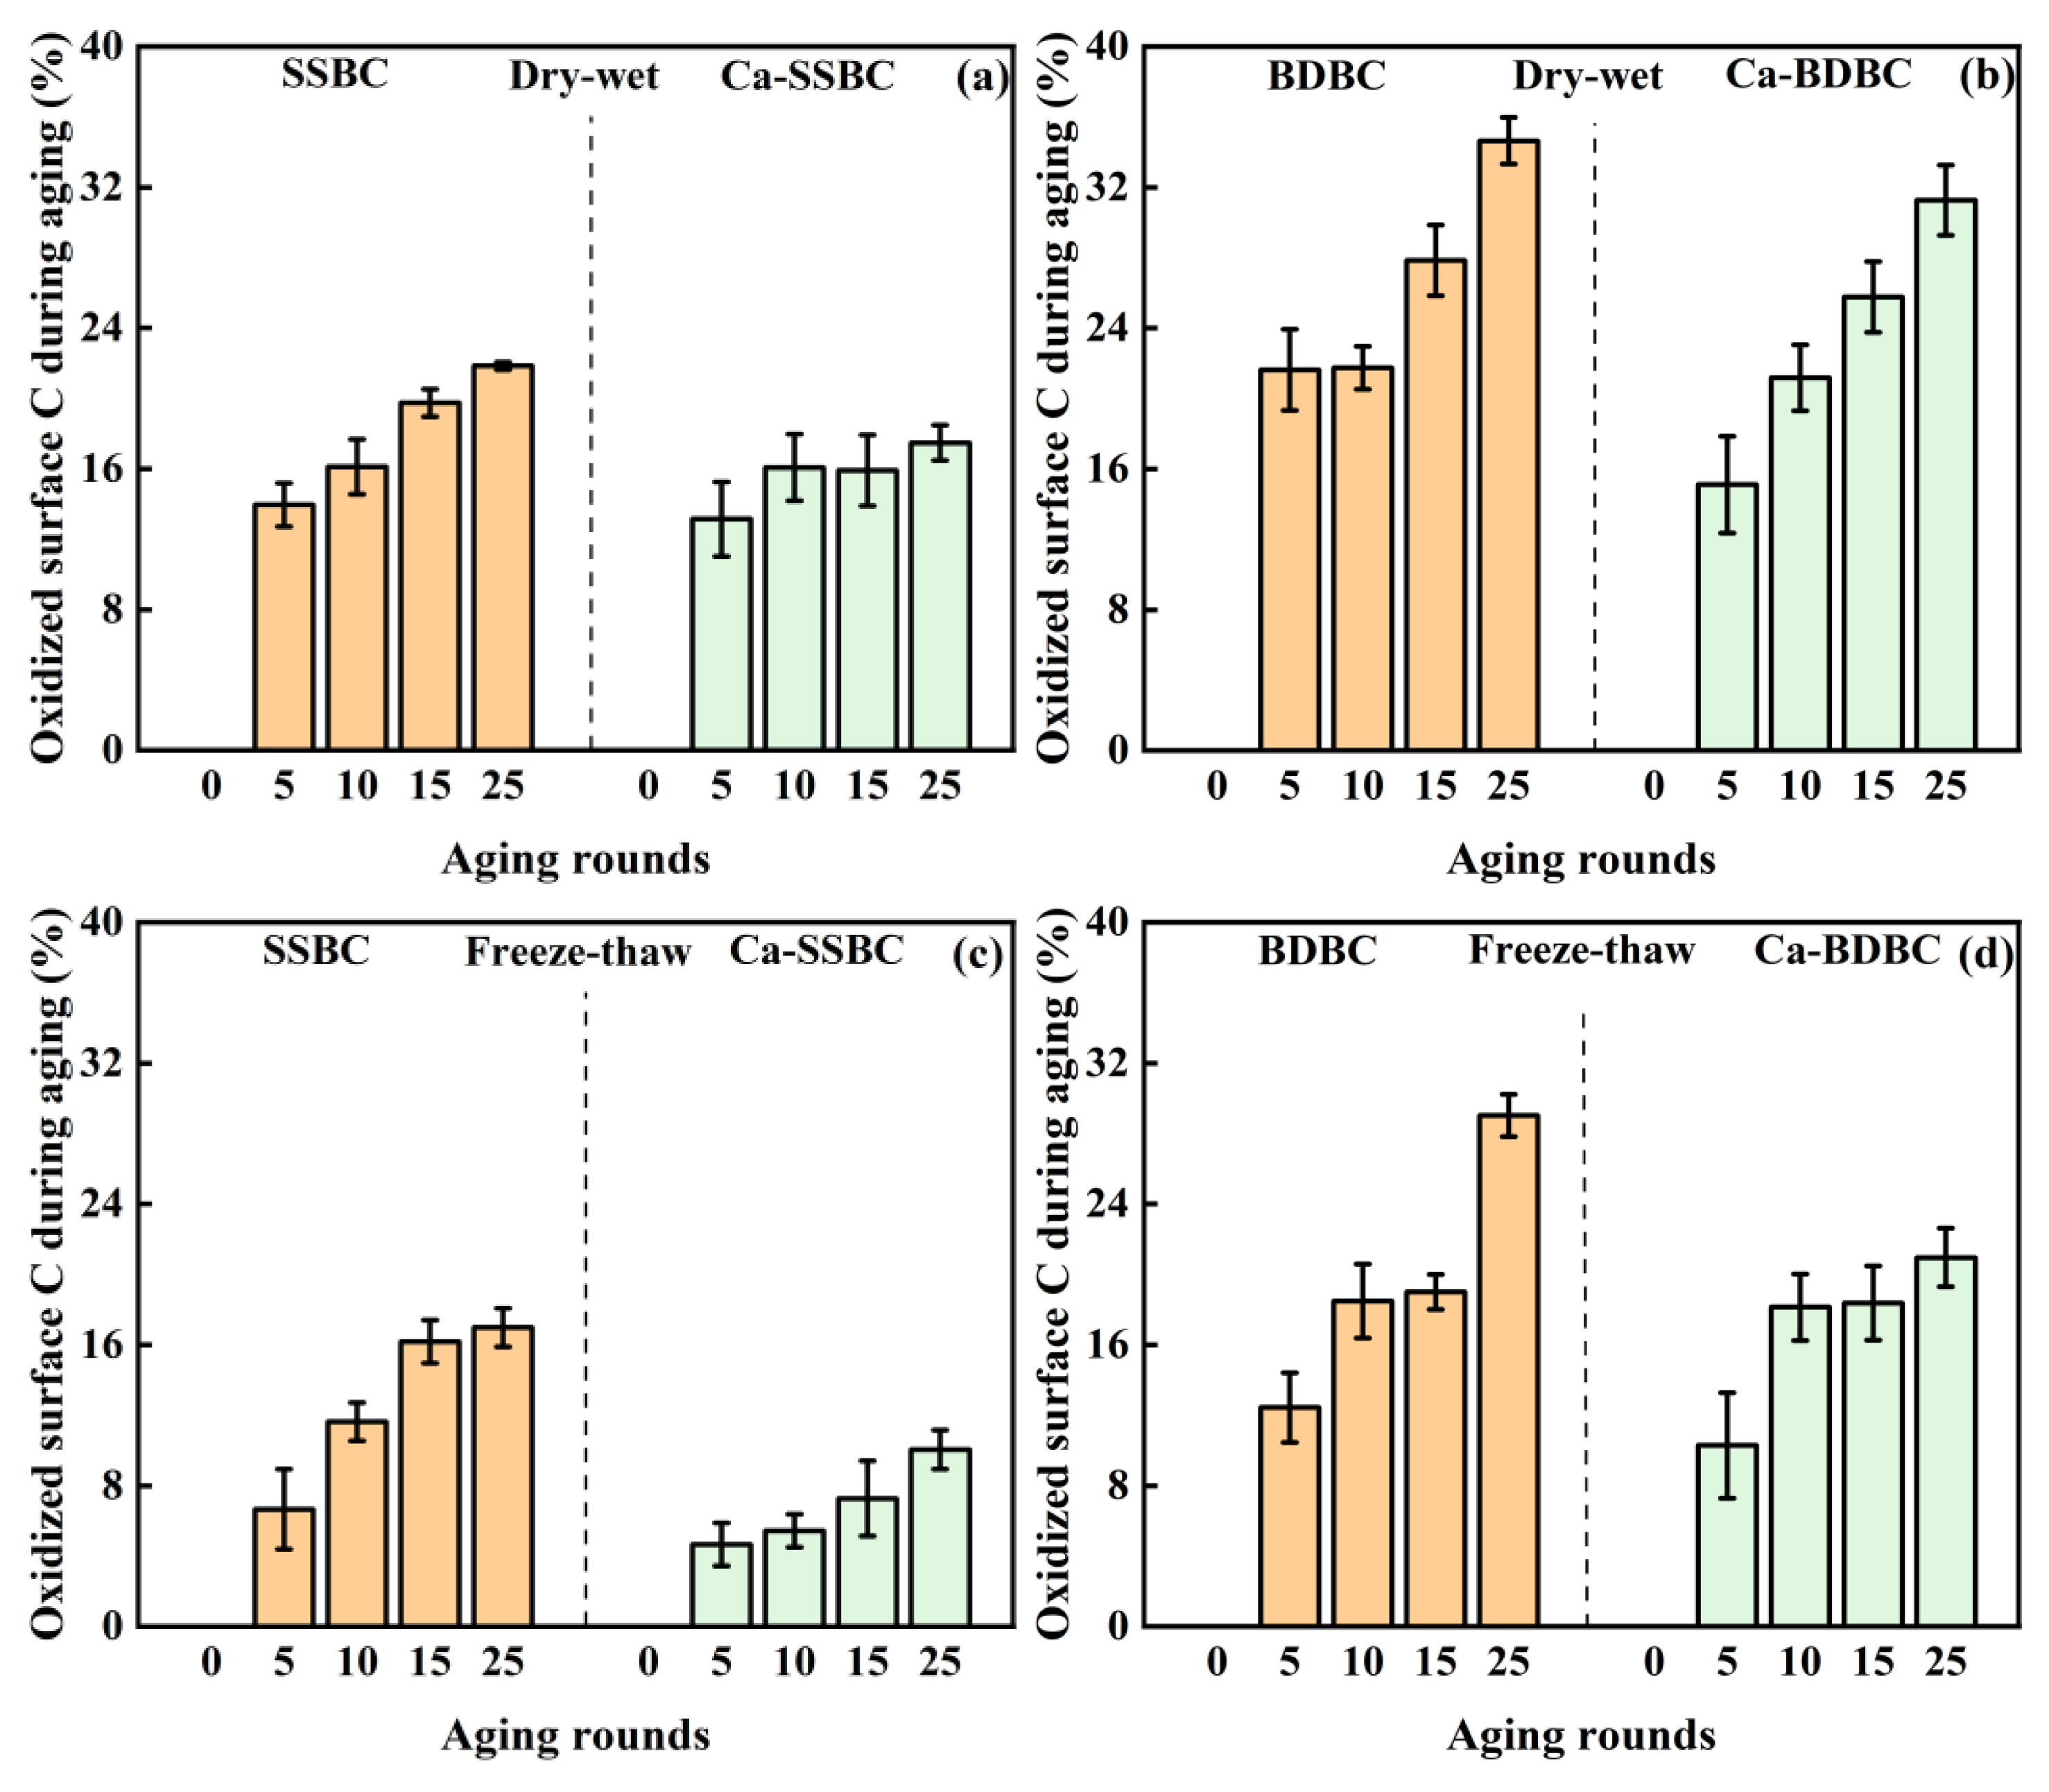
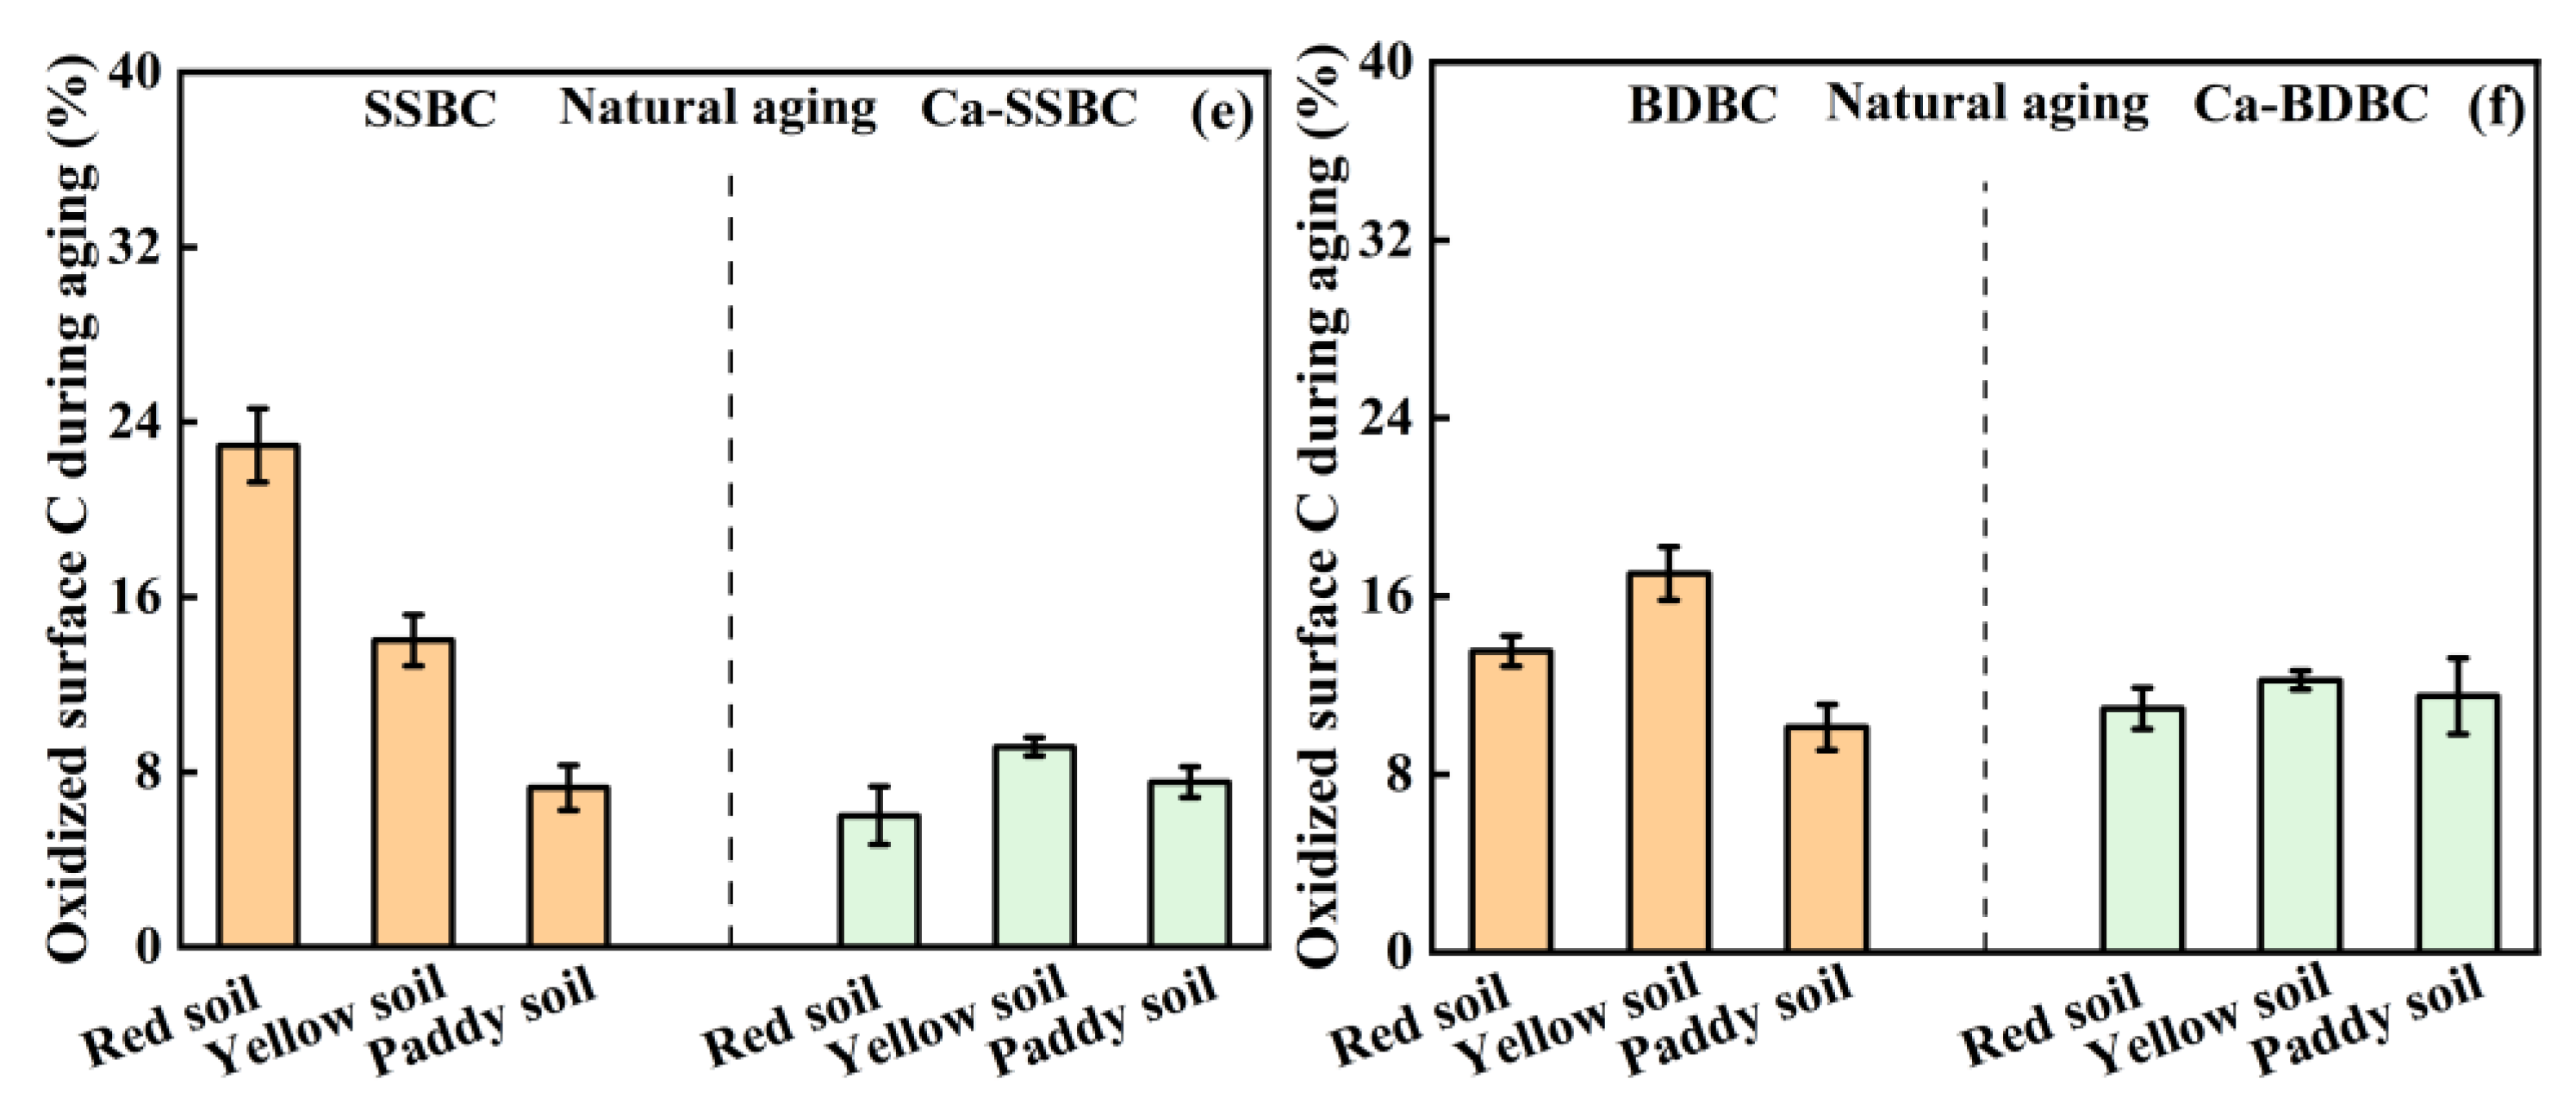
3.2. Exogenous calcium enhanced the surface C stability in biochar during aging process
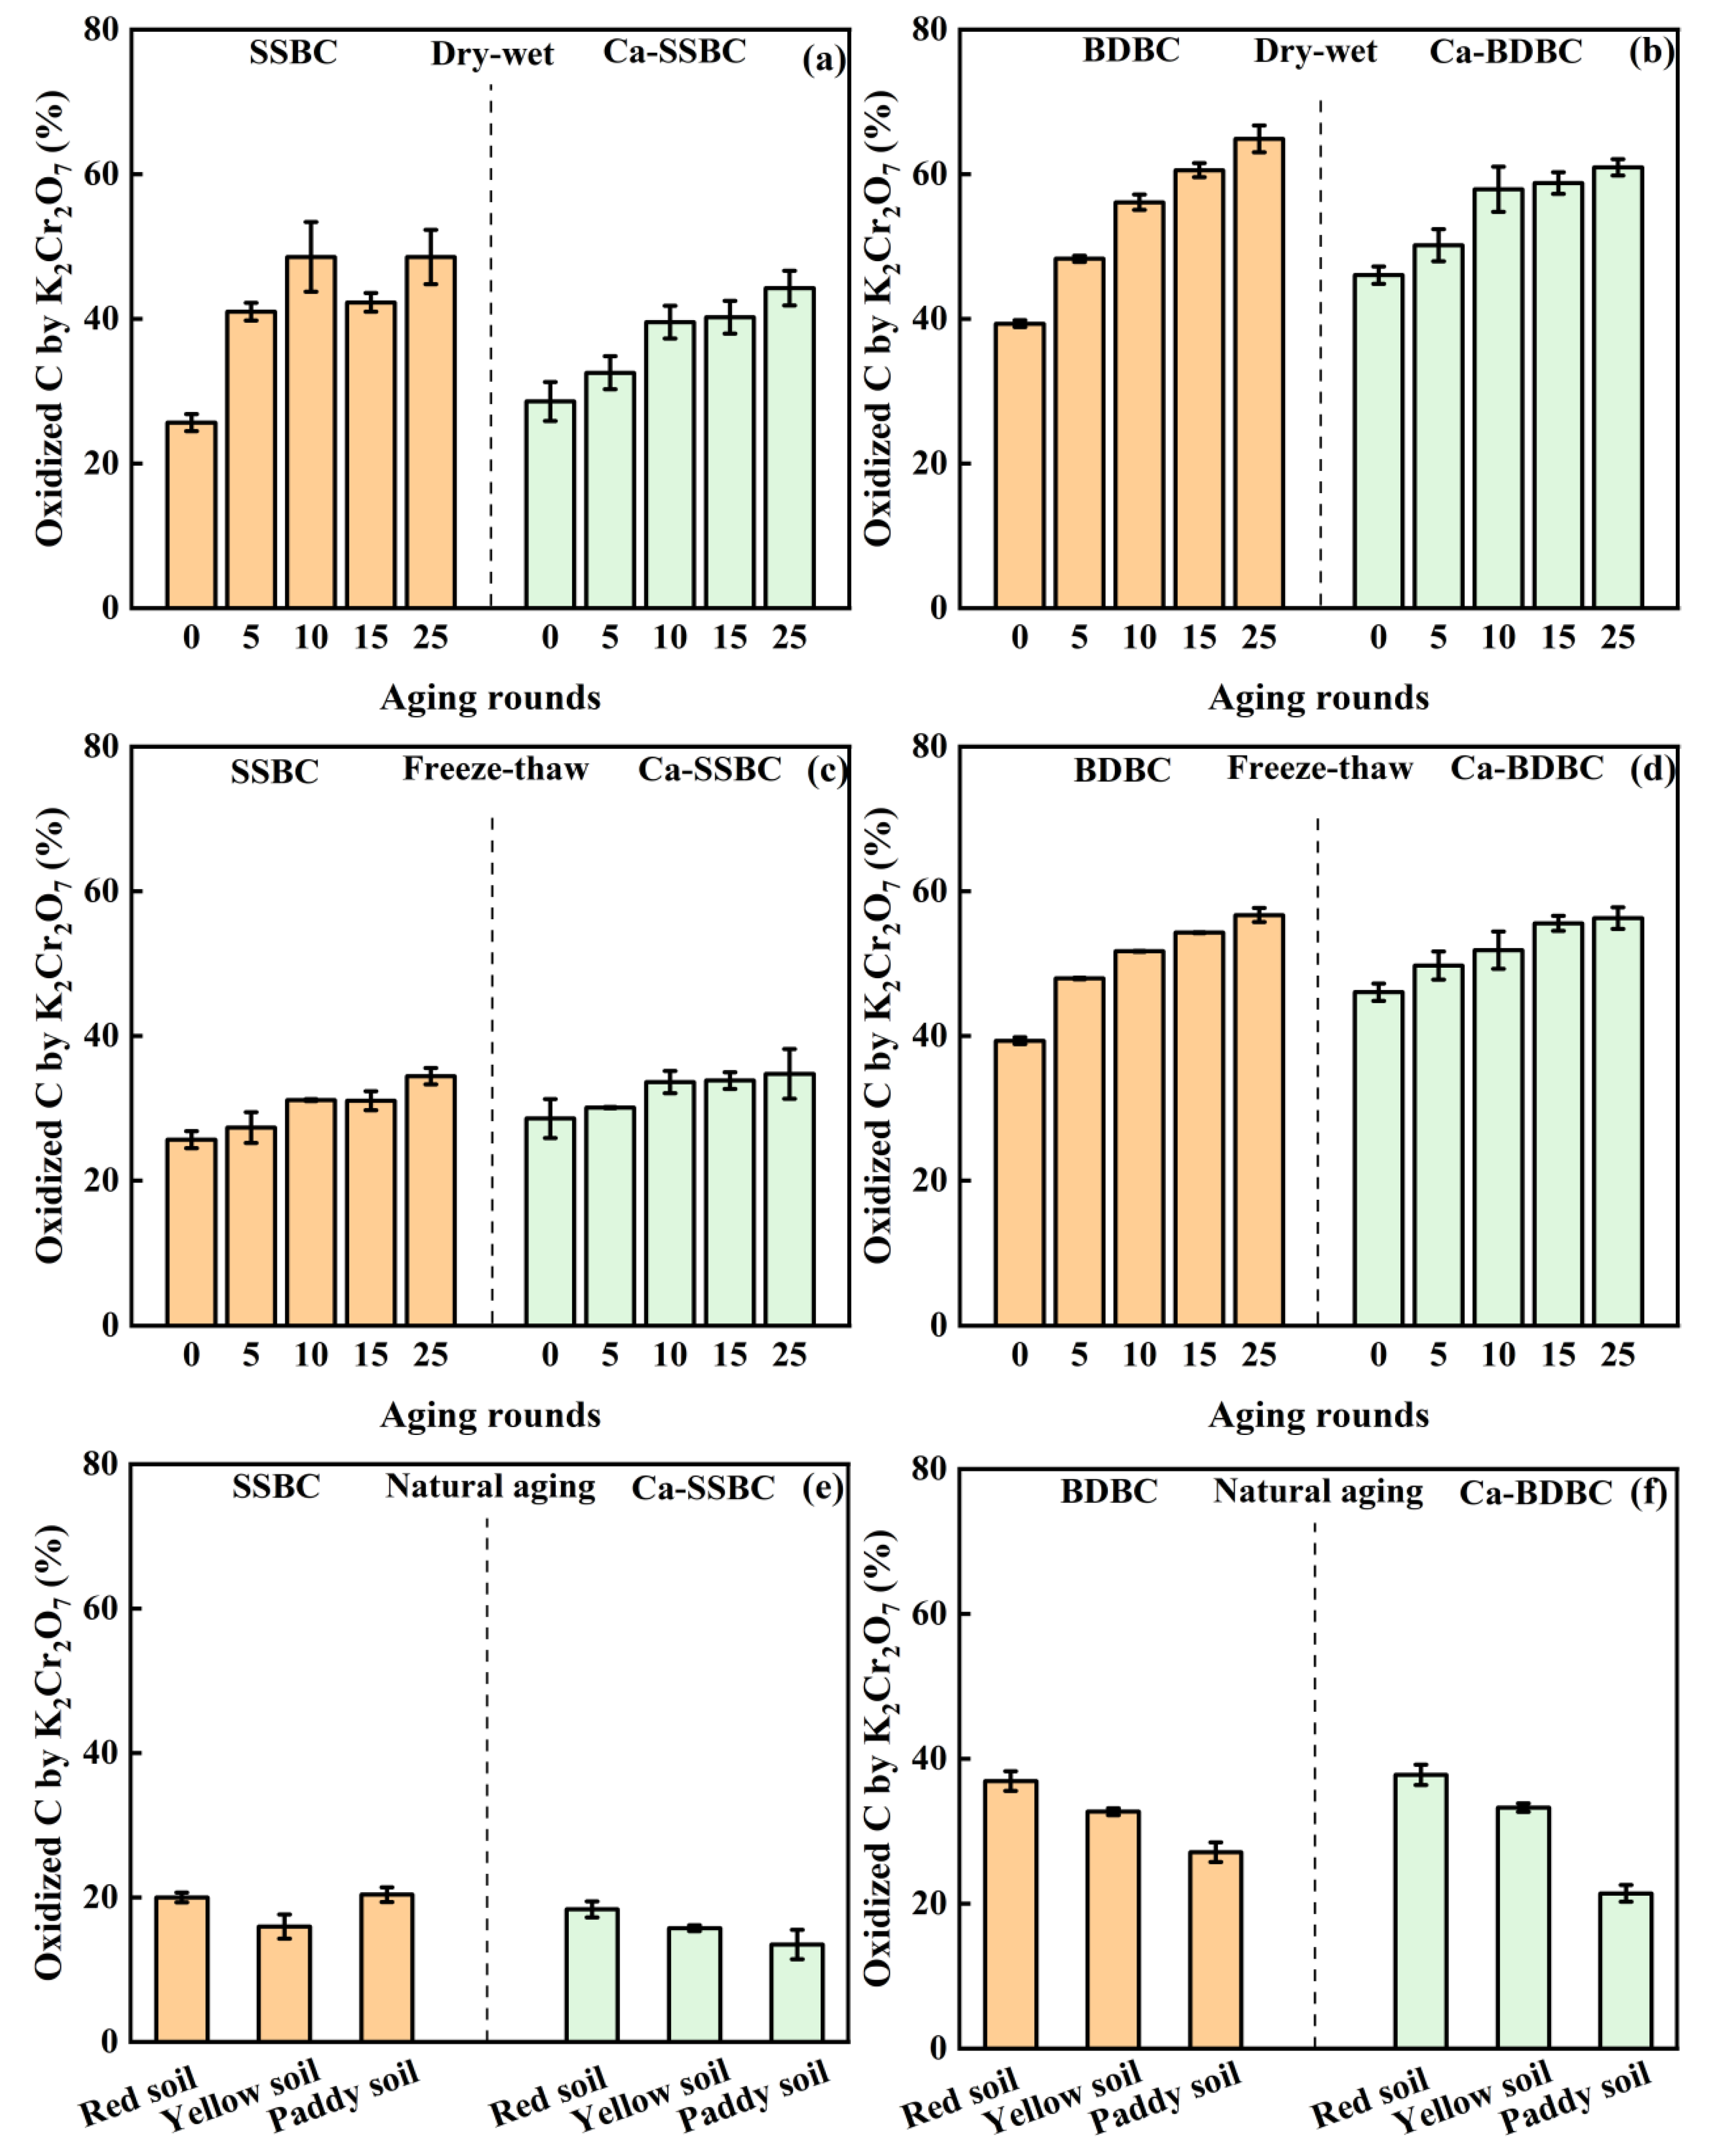
3.3. Exogenous calcium enhanced the bulk C stability in biochar during aging process
3.4. Exogenous calcium enhanced C sequestration ability in biochar during aging process
4. Conclusions
Supplementary Materials
Author Contributions
Funding
Conflicts of Interest
References
- Cheng, C.-H.; Lehmann, J.; Engelhard, M.H. Natural oxidation of black carbon in soils: Changes in molecular form and surface charge along a climosequence. Geochim. et Cosmochim. Acta 2008, 72, 1598–1610. [Google Scholar] [CrossRef]
- Lehmann, J. A handful of carbon. Nature 2007, 447, 143–144. [Google Scholar] [CrossRef] [PubMed]
- Lehmann, J.; Skjemstad, J.; Sohi, S.; Carter, J.; Barson, M.; Falloon, P.; Coleman, K.; Woodbury, P.; Krull, E. Australian climate–carbon cycle feedback reduced by soil black carbon. Nat. Geosci. 2008, 1, 832–835. [Google Scholar] [CrossRef]
- A Spokas, K. Review of the stability of biochar in soils: predictability of O:C molar ratios. Carbon Manag. 2010, 1, 289–303. [Google Scholar] [CrossRef]
- Woolf, D.; Amonette, J.E.; Street-Perrott, F.A.; Lehmann, J.; Joseph, S. Sustainable biochar to mitigate global climate change. Nat. Commun. 2010, 1, 56. [Google Scholar] [CrossRef] [PubMed]
- Sohi, S.P.; Krull, E.; Lopez-Capel, E.; Bol, R. A review of biochar and its use and function in soil. Adv. Agron. 2010, 105, 47–82. [Google Scholar] [CrossRef]
- Hammes, K.; Torn, M.S.; Lapenas, A.G.; Schmidt, M.W.I. Centennial black carbon turnover observed in a Russian steppe soil. Biogeosciences 2008, 5, 1339–1350. [Google Scholar] [CrossRef]
- Mašek, O.; Brownsort, P.; Cross, A.; Sohi, S. Influence of production conditions on the yield and environmental stability of biochar. Fuel 2013, 103, 151–155. [Google Scholar] [CrossRef]
- Singh, B.P.; Cowie, A.L.; Smernik, R.J. Biochar Carbon Stability in a Clayey Soil As a Function of Feedstock and Pyrolysis Temperature. Environ. Sci. Technol. 2012, 46, 11770–11778. [Google Scholar] [CrossRef]
- McBeath, A.V.; Wurster, C.M.; Bird, M.I. Influence of feedstock properties and pyrolysis conditions on biochar carbon stability as determined by hydrogen pyrolysis. Biomass- Bioenergy 2015, 73, 155–173. [Google Scholar] [CrossRef]
- Purakayastha, T.; Kumari, S.; Pathak, H. Characterisation, stability, and microbial effects of four biochars produced from crop residues. Geoderma 2015, 239-240, 293–303. [Google Scholar] [CrossRef]
- Fang, Y.; Singh, B.; Singh, B.P. Effect of temperature on biochar priming effects and its stability in soils. Soil Bio. Biochem. 2015, 80, 136–145. [Google Scholar] [CrossRef]
- Han, L.; Ro, K.S.; Wang, Y.; Sun, K.; Sun, H.; Libra, J.A.; Xing, B. Oxidation resistance of biochars as a function of feedstock and pyrolysis condition. Sci. Total. Environ. 2018, 616-617, 335–344. [Google Scholar] [CrossRef] [PubMed]
- Liu, Y.; Yao, S.; Wang, Y.; Lu, H.; Brar, S.K.; Yang, S. Bio- and hydrochars from rice straw and pig manure: Inter-comparison. Bioresour. Technol. 2017, 235, 332–337. [Google Scholar] [CrossRef] [PubMed]
- Leng, L.; Huang, H. An overview of the effect of pyrolysis process parameters on biochar stability. Bioresour. Technol. 2018, 270, 627–642. [Google Scholar] [CrossRef] [PubMed]
- Xu, X.; Hu, X.; Ding, Z.; Chen, Y. Effects of copyrolysis of sludge with calcium carbonate and calcium hydrogen phosphate on chemical stability of carbon and release of toxic elements in the resultant biochars. Chemosphere 2017, 189, 76–85. [Google Scholar] [CrossRef] [PubMed]
- Du, J.; Zhang, L.; Ali, A.; Li, R.; Xiao, R.; Guo, D.; Liu, X.; Zhang, Z.; Ren, C.; Zhang, Z. Research on thermal disposal of phytoremediation plant waste: Stability of potentially toxic metals (PTMs) and oxidation resistance of biochars. Process. Saf. Environ. Prot. 2019, 125, 260–268. [Google Scholar] [CrossRef]
- Chen, D.; Yu, X.; Song, C.; Pang, X.; Huang, J.; Li, Y. Effect of pyrolysis temperature on the chemical oxidation stability of bamboo biochar. Bioresour. Technol. 2016, 218, 1303–1306. [Google Scholar] [CrossRef]
- Nan, H.; Zhao, L.; Yang, F.; Liu, Y.; Qiu, H. Different alkaline minerals interacted with biomass carbon during pyrolysis: Which one improved biochar carbon sequestration? J. Clean. Prod. 2020, 255, 120162. [Google Scholar] [CrossRef]
- Wu, X.; Radovic, L.R. Inhibition of catalytic oxidation of carbon/carbon composites by phosphorus. Carbon 2006, 44, 141–151. [Google Scholar] [CrossRef]
- Rosas, J.M.; Ruiz-Rosas, R.; Rodríguez-Mirasol, J.; Cordero, T. Kinetic study of the oxidation resistance of phosphorus-containing activated carbons. Carbon 2012, 50, 1523–1537. [Google Scholar] [CrossRef]
- Guo, J.; Chen, B. Insights on the Molecular Mechanism for the Recalcitrance of Biochars: Interactive Effects of Carbon and Silicon Components. Environ. Sci. Technol. 2014, 48, 9103–9112. [Google Scholar] [CrossRef] [PubMed]
- Xiao, X.; Chen, B.; Zhu, L. Transformation, Morphology, and Dissolution of Silicon and Carbon in Rice Straw-Derived Biochars under Different Pyrolytic Temperatures. Environ. Sci. Technol. 2014, 48, 3411–3419. [Google Scholar] [CrossRef] [PubMed]
- Lu, J.; Yang, Y.; Liu, P.; Li, Y.; Huang, F.; Zeng, L.; Liang, Y.; Li, S.; Hou, B. Iron-montmorillonite treated corn straw biochar: Interfacial chemical behavior and stability. Sci. Total Environ. 2020, 708, 134773. [Google Scholar] [CrossRef]
- Hale, S.; Hanley, K.; Lehmann, J.; Zimmerman, A.; Cornelissen, G. Effects of Chemical, Biological, and Physical Aging As Well As Soil Addition on the Sorption of Pyrene to Activated Carbon and Biochar. Environ. Sci. Technol. 2011, 45, 10445–10453. [Google Scholar] [CrossRef]
- Zhang, P.; Fan, J.; Xu, X.; Xu, Z.; Yu, Y.; Zhao, L.; Qiu, H.; Cao, X. Contrasting effects of dry-wet and freeze-thaw aging on the immobilization of As in As-contaminated soils amended by zero-valent iron-embedded biochar. J. Hazard. Mater. 2021, 426, 128123. [Google Scholar] [CrossRef]
- Andrew, R.Z. Abiotic and microbial oxidation of laboratory-produced black carbon (biochar). Environ. Sci. Technol. 2010, 44, 1295–1301. [Google Scholar]
- Liu, D.; Liu, D.; Gao, J.; Yang, Y.; Ding, Y.; Guo, C.; Zhang, X.; Xia, Z.; Xu, W. Influence of addition of two typical activated carbons on fertility properties and mechanical strength of vegetation concrete under freeze-thaw conditions. Sci. Total. Environ. 2022, 838, 156446. [Google Scholar] [CrossRef]
- Mukherjee, A.; Zimmerman, A.R. Organic carbon and nutrient release from a range of laboratory-produced biochars and biochar–soil mixtures. Geoderma 2013, 193-194, 122–130. [Google Scholar] [CrossRef]
- Fan, Q.; Sun, J.; Chu, L.; Cui, L.; Quan, G.; Yan, J.; Hussain, Q.; Iqbal, M. Effects of chemical oxidation on surface oxygen-containing functional groups and adsorption behavior of biochar. Chemosphere 2018, 207, 33–40. [Google Scholar] [CrossRef]
- Shi, K.; Xie, Y.; Qiu, Y. Natural oxidation of a temperature series of biochars: Opposite effect on the sorption of aromatic cationic herbicides. Ecotoxicol. Environ. Saf. 2015, 114, 102–108. [Google Scholar] [CrossRef] [PubMed]
- Singh, B.; Fang, Y.; Cowie, B.C.; Thomsen, L. NEXAFS and XPS characterisation of carbon functional groups of fresh and aged biochars. Org. Geochem. 2014, 77, 1–10. [Google Scholar] [CrossRef]
- Yao, F.; Arbestain, M.C.; Virgel, S.; Blanco, F.; Arostegui, J.; Maciá-Agulló, J.; Macías, F. Simulated geochemical weathering of a mineral ash-rich biochar in a modified Soxhlet reactor. Chemosphere 2010, 80, 724–732. [Google Scholar] [CrossRef]
- Fang, Q.; Chen, B.; Lin, Y.; Guan, Y. Aromatic and Hydrophobic Surfaces of Wood-derived Biochar Enhance Perchlorate Adsorption via Hydrogen Bonding to Oxygen-containing Organic Groups. Environ. Sci. Technol. 2013, 48, 279–288. [Google Scholar] [CrossRef]
- Ren, X.; Sun, H.; Wang, F.; Zhang, P.; Zhu, H. Effect of aging in field soil on biochar's properties and its sorption capacity. Environ. Pollut. 2018, 242, 1880–1886. [Google Scholar] [CrossRef] [PubMed]
- Cao, Y.; Jing, Y.; Hao, H.; Wang, X. Changes in the physicochemical characteristics of peanut straw biochar after freeze-thaw and dry-wet aging treatments of the biomass. BioResources 2019, 14, 4329–4343. [Google Scholar] [CrossRef]
- Wang, L.; O’connor, D.; Rinklebe, J.; Ok, Y.S.; Tsang, D.C.; Shen, Z.; Hou, D. Biochar Aging: Mechanisms, Physicochemical Changes, Assessment, And Implications for Field Applications. Environ. Sci. Technol. 2020, 54, 14797–14814. [Google Scholar] [CrossRef]
- Gao, X.; Wu, H. Aerodynamic Properties of Biochar Particles: Effect of Grinding and Implications. Environ. Sci. Technol. Lett. 2013, 1, 60–64. [Google Scholar] [CrossRef]
- Spokas, K.A.; Novak, J.M.; Masiello, C.A.; Johnson, M.G.; Colosky, E.C.; Ippolito, J.A.; Trigo, C. Physical Disintegration of Biochar: An Overlooked Process. Environ. Sci. Technol. Lett. 2014, 1, 326–332. [Google Scholar] [CrossRef]
- Tan, L.; Ma, Z.; Yang, K.; Cui, Q.; Wang, K.; Wang, T.; Wu, G.-L.; Zheng, J. Effect of three artificial aging techniques on physicochemical properties and Pb adsorption capacities of different biochars. Sci. Total. Environ. 2019, 699, 134223. [Google Scholar] [CrossRef]
- Rosas, J.M.; Ruiz-Rosas, R.; Rodríguez-Mirasol, J.; Cordero, T. Kinetic study of the oxidation resistance of phosphorus-containing activated carbons. Carbon 2012, 50, 1523–1537. [Google Scholar] [CrossRef]
- Nan, H.; Mašek, O.; Yang, F.; Xu, X.; Qiu, H.; Cao, X.; Zhao, L. Minerals: A missing role for enhanced biochar carbon sequestration from the thermal conversion of biomass to the application in soil. Earth-Science Rev. 2022, 234. [Google Scholar] [CrossRef]
- Sigua, G.; Novak, J.; Watts, D.; Cantrell, K.; Shumaker, P.; Szögi, A.; Johnson, M. Carbon mineralization in two ultisols amended with different sources and particle sizes of pyrolyzed biochar. Chemosphere 2014, 103, 313–321. [Google Scholar] [CrossRef] [PubMed]
- Huisman, D.; Braadbaart, F.; van Wijk, I.; van Os, B. Ashes to ashes, charcoal to dust: micromorphological evidence for ash-induced disintegration of charcoal in Early Neolithic (LBK) soil features in Elsloo (The Netherlands). J. Archaeol. Sci. 2012, 39, 994–1004. [Google Scholar] [CrossRef]
- Liu, W.; Wang, Y.; Chen, D.; Lu, P. Effect of aging on physicochemical properties of bio-chars. J. Eng. Thermophy 2021, 42, 1575–1582. [Google Scholar]
- Hillel, D. Introduction to Environmental Soil Physics: Chapter 1- Soil Physics and Soil Physical Characteristics. Academic Press 2003, 3–17. [Google Scholar]
- Yang, F.; Zhao, L.; Gao, B.; Xu, X.; Cao, X. The Interfacial Behavior between Biochar and Soil Minerals and Its Effect on Biochar Stability. Environ. Sci. Technol. 2016, 50, 2264–2271. [Google Scholar] [CrossRef]
- Li, H.; Lu, X.; Xu, Y.; Liu, H. How close is artificial biochar aging to natural biochar aging in fields? A meta-analysis. Geoderma 2019, 352, 96–103. [Google Scholar] [CrossRef]
- Wang, H.; Feng, M.; Zhou, F.; Huang, X.; Tsang, D.C.; Zhang, W. Effects of atmospheric ageing under different temperatures on surface properties of sludge-derived biochar and metal/metalloid stabilization. Chemosphere 2017, 184, 176–184. [Google Scholar] [CrossRef]
- Yang, F.; Xu, Z.; Yu, L.; Gao, B.; Xu, X.; Zhao, L.; Cao, X. Kaolinite Enhances the Stability of the Dissolvable and Undissolvable Fractions of Biochar via Different Mechanisms. Environ. Sci. Technol. 2018, 52, 8321–8329. [Google Scholar] [CrossRef]
- Skjemstad, J.O.; Clarke, P.; Taylor, J.A.; Oades, J.M.; McClure, S.G. The chemistry and nature of protected carbon in soil. Aust. J. Soil Res. 1996, 34, 251–271. [Google Scholar] [CrossRef]
- Li, F.; Cao, X.; Zhao, L.; Wang, J.; Ding, Z. Effects of Mineral Additives on Biochar Formation: Carbon Retention, Stability, and Properties. Environ. Sci. Technol. 2014, 48, 11211–11217. [Google Scholar] [CrossRef] [PubMed]
- Mia, S.; Dijkstra, F.A.; Singh, B. Long-term aging of biochar: a molecular understanding with agricultural and environmental implications. Adv. Agron. 2017, 141, 1–51. [Google Scholar]
- Ren, X.; Wang, F.; Zhang, P.; Guo, J.; Sun, H. Aging effect of minerals on biochar properties and sorption capacities for atrazine and phenanthrene. Chemosphere 2018, 206, 51–58. [Google Scholar] [CrossRef] [PubMed]
- Nguyen, B.T.; Lehmann, J.; Kinyangi, J.; Smernik, R.; Riha, S.J.; Engelhard, M.H. Long-term black carbon dynamics in cultivated soil. Biogeochemistry 2008, 92, 163–176. [Google Scholar] [CrossRef]
- Lin, Y.; Munroe, P.; Joseph, S.; Kimber, S.; Van Zwieten, L. Nanoscale organo-mineral reactions of biochars in ferrosol: an investigation using microscopy. Plant Soil 2012, 357, 369–380. [Google Scholar] [CrossRef]
- Crombie, K.; Mašek, O.; Sohi, S.P.; Brownsort, P.; Cross, A. The effect of pyrolysis conditions on biochar stability as determined by three methods. GCB Bioenergy 2012, 5, 122–131. [Google Scholar] [CrossRef]
- Andrew, C.; Saran, P.S. A method for screening the relative long-term stability of biochar. GCB Bioenergy 2013, 5, 215–220. [Google Scholar]



| Farmland soil | pH | Sand% | Silt% | Clay% | K g·kg−1 | Na g·kg−1 | Ca g·kg−1 | Mg g·kg−1 | Fe g·kg−1 | Al g·kg−1 |
|---|---|---|---|---|---|---|---|---|---|---|
| Red soil | 4.90 | 46.8 | 29.9 | 23.3 | 6.2 | 0.82 | 0.93 | 0.60 | 62.0 | 57.1 |
| Yellow soil | 9.10 | 21.3 | 69.8 | 8.97 | 12.1 | 1.02 | 31.7 | 5.83 | 13.0 | 13.4 |
| Paddy soil | 6.27 | 6.34 | 79.2 | 14.4 | 25.2 | 1.76 | 4.73 | 5.05 | 19.6 | 27.3 |
| Biochar | Content/% | 0 round | Dry-wet/25 rounds | Freeze-thaw/25 rounds |
|---|---|---|---|---|
| SSBC | C-C/C = C | 79.20 | 64.51 | 67.74 |
| C = O | 9.32 | 9.87 | / | |
| O = C-O | 7.19 | 5.28 | 10.58 | |
| C-O | 4.29 | 20.34 | 18.69 | |
| Ca-SSBC | C-C/C = C | 74.79 | 65.06 | 68.60 |
| C = O | 8.52 | 8.39 | 7.39 | |
| O = C-O | 8.42 | 6.29 | 7.96 | |
| C-O | 8.27 | 20.26 | 16.05 | |
| BDBC | C-C/C = C | 67.75 | 57.47 | 59.85 |
| C = O | 7.46 | 11.92 | 8.47 | |
| O = C-O | 8.69 | 11.97 | 9.70 | |
| C-O | 16.1 | 18.65 | 21.97 | |
| Ca-BDBC | C-C/C = C | 65.18 | 60.01 | 62.64 |
| C = O | 7.29 | 8.79 | 9.92 | |
| O = C-O | 14.48 | 10.40 | 5.82 | |
| C-O | 13.04 | 20.81 | 21.63 |
Disclaimer/Publisher’s Note: The statements, opinions and data contained in all publications are solely those of the individual author(s) and contributor(s) and not of MDPI and/or the editor(s). MDPI and/or the editor(s) disclaim responsibility for any injury to people or property resulting from any ideas, methods, instructions or products referred to in the content. |
© 2023 by the authors. Licensee MDPI, Basel, Switzerland. This article is an open access article distributed under the terms and conditions of the Creative Commons Attribution (CC BY) license (http://creativecommons.org/licenses/by/4.0/).


