Submitted:
31 May 2023
Posted:
31 May 2023
You are already at the latest version
Abstract
Keywords:
Introduction
Experimental Part
Materials
Characterization
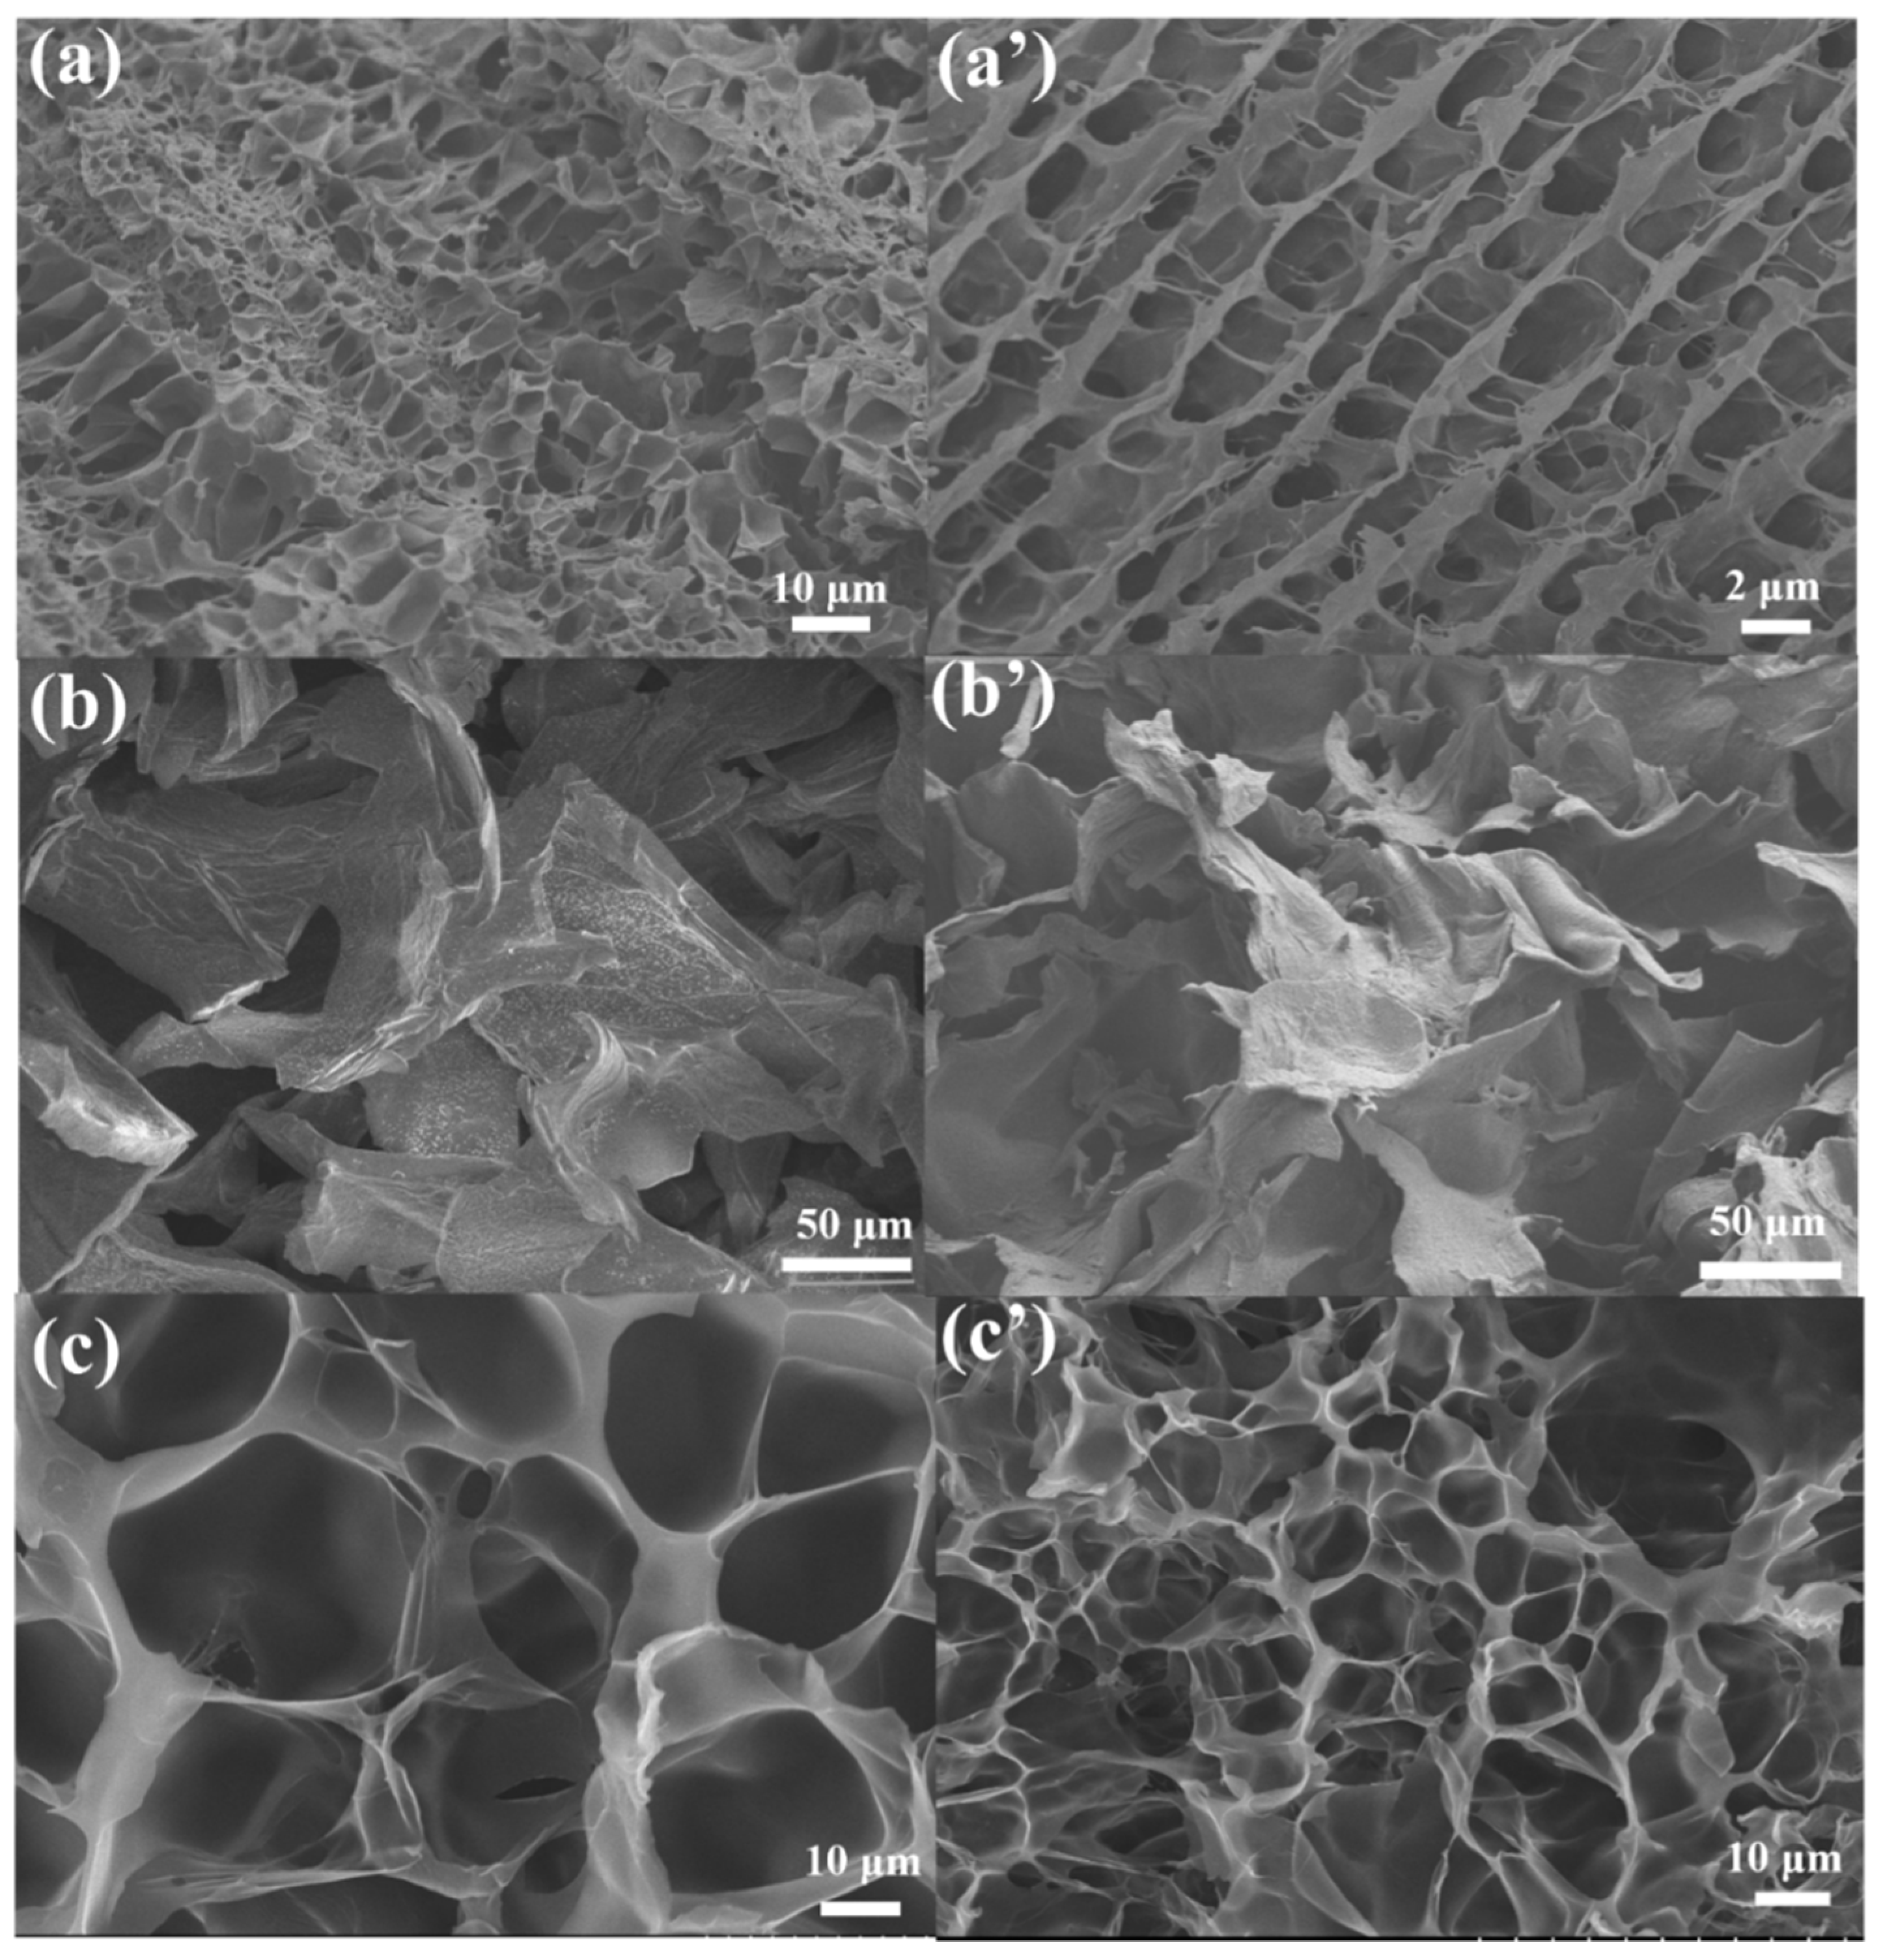
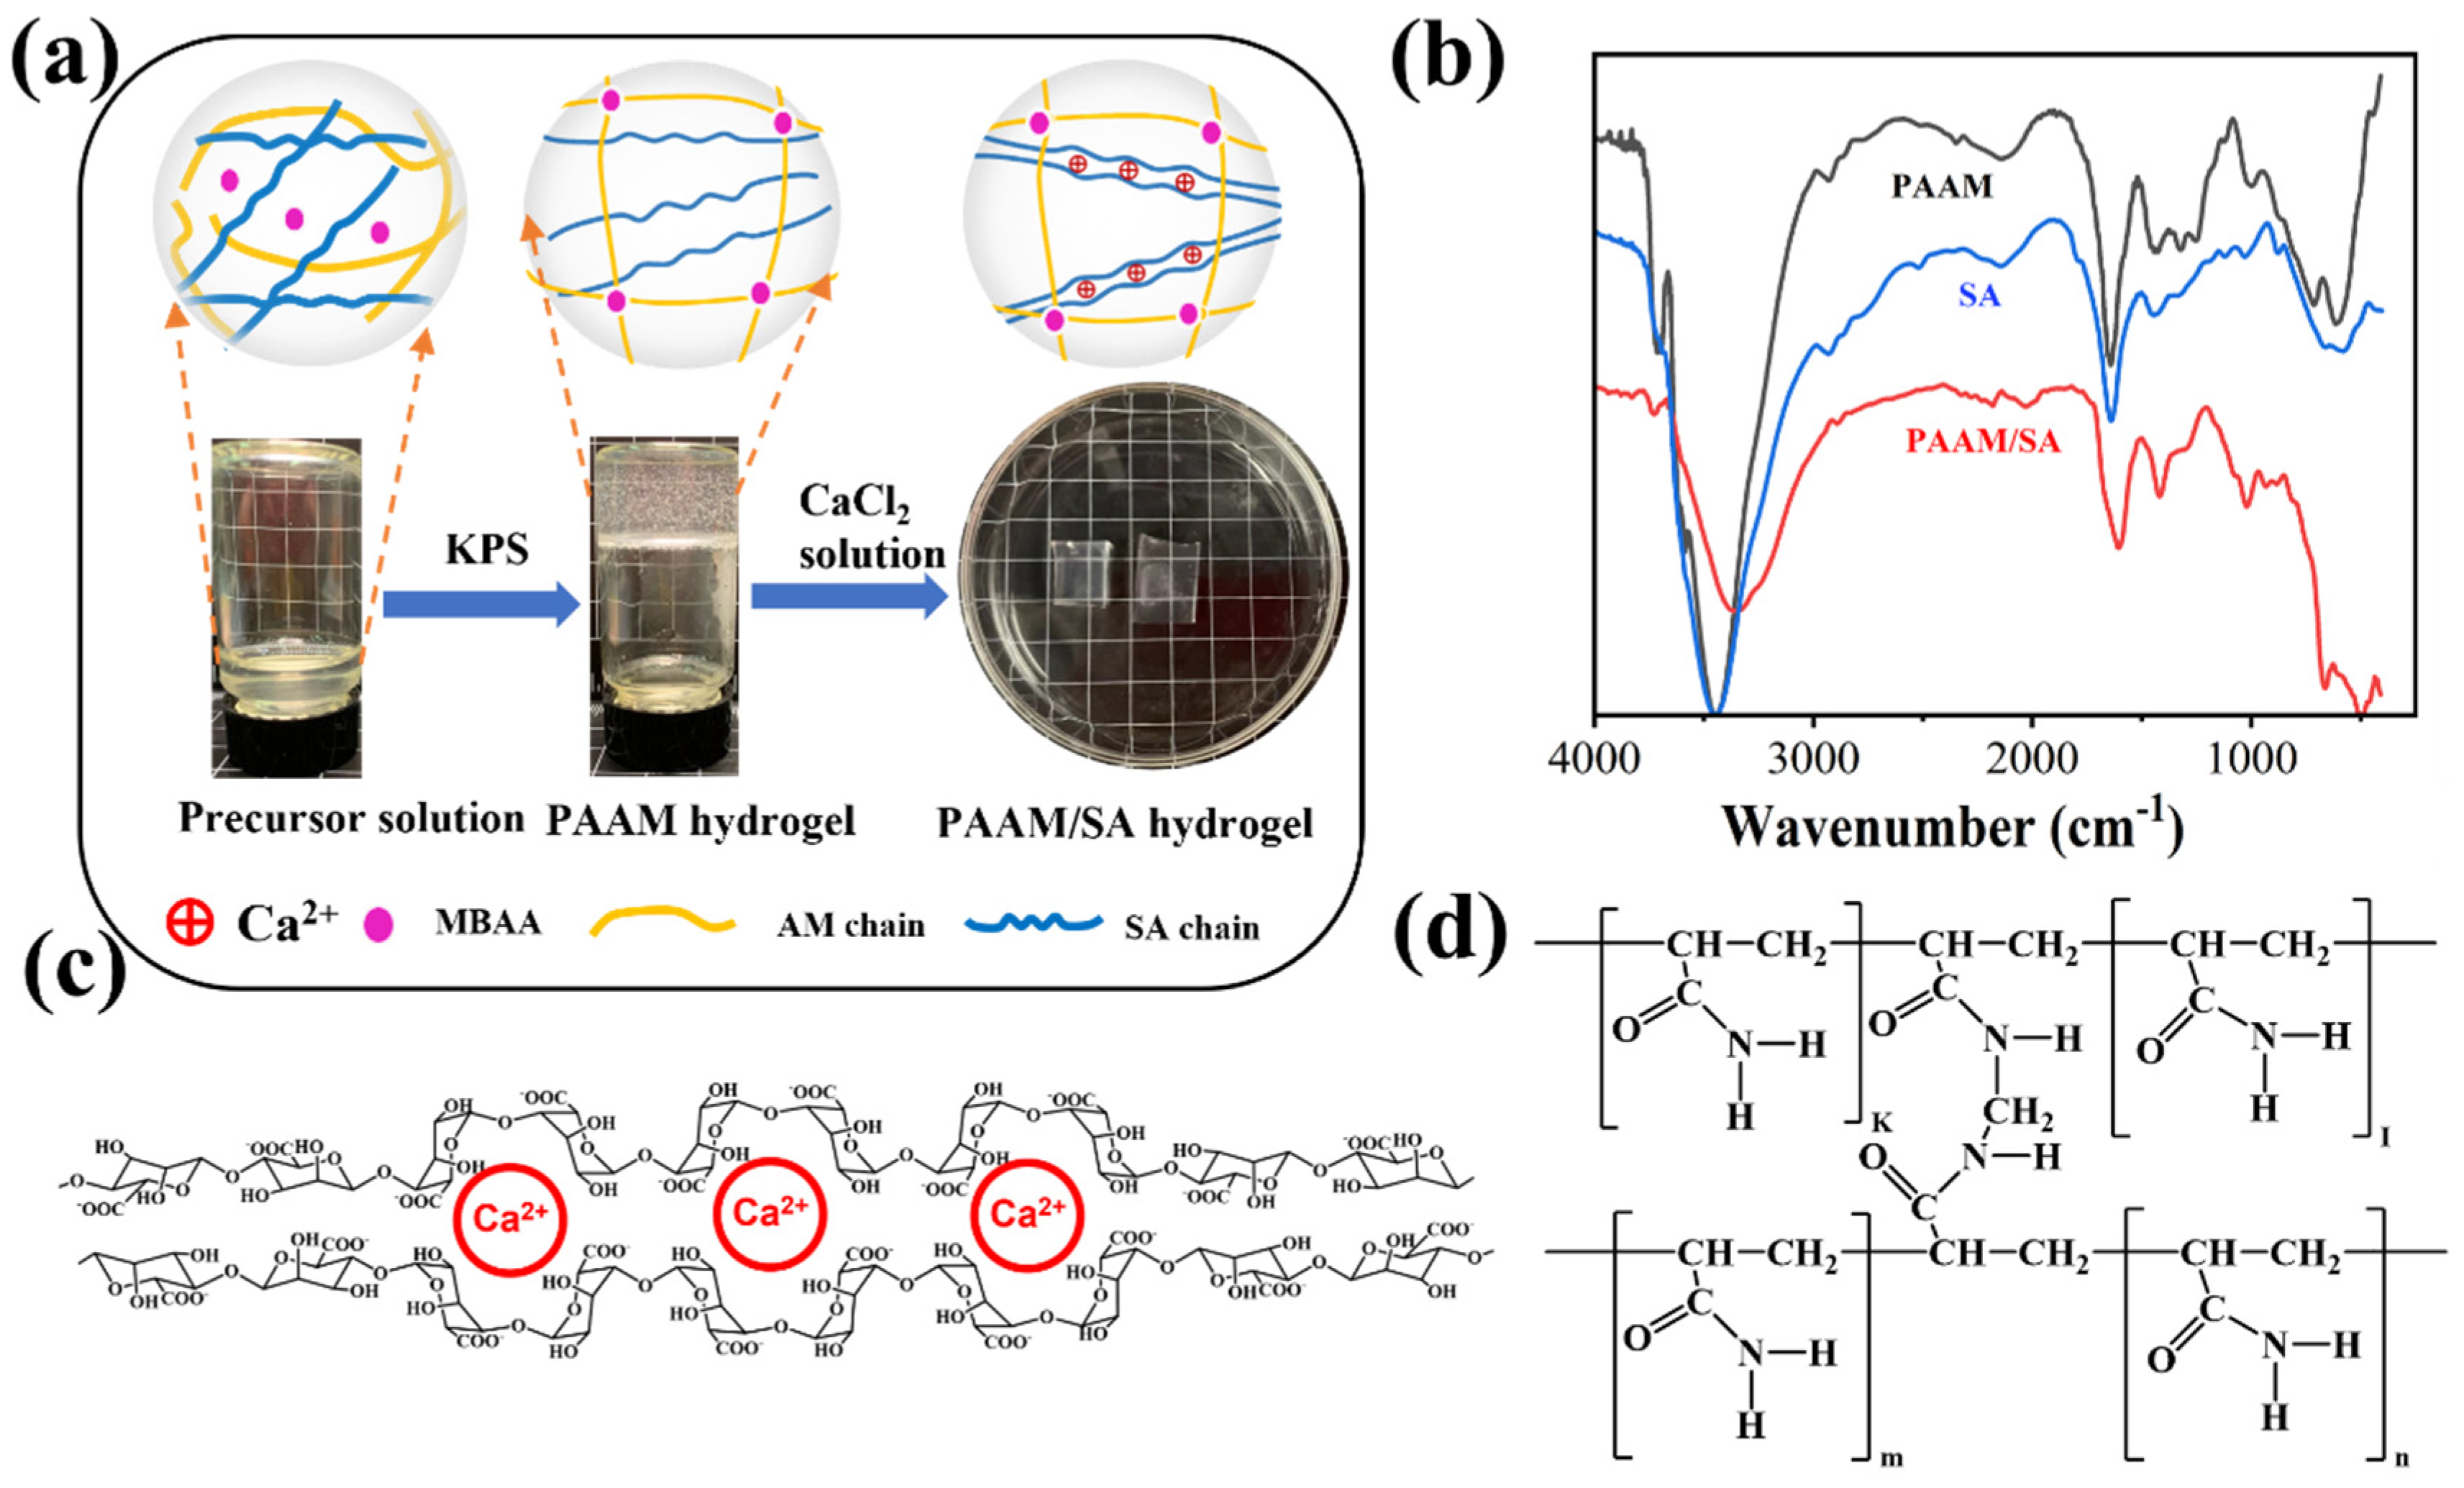
SEM and FTIR
Rheology
Tensile Testing
Results and Discussion
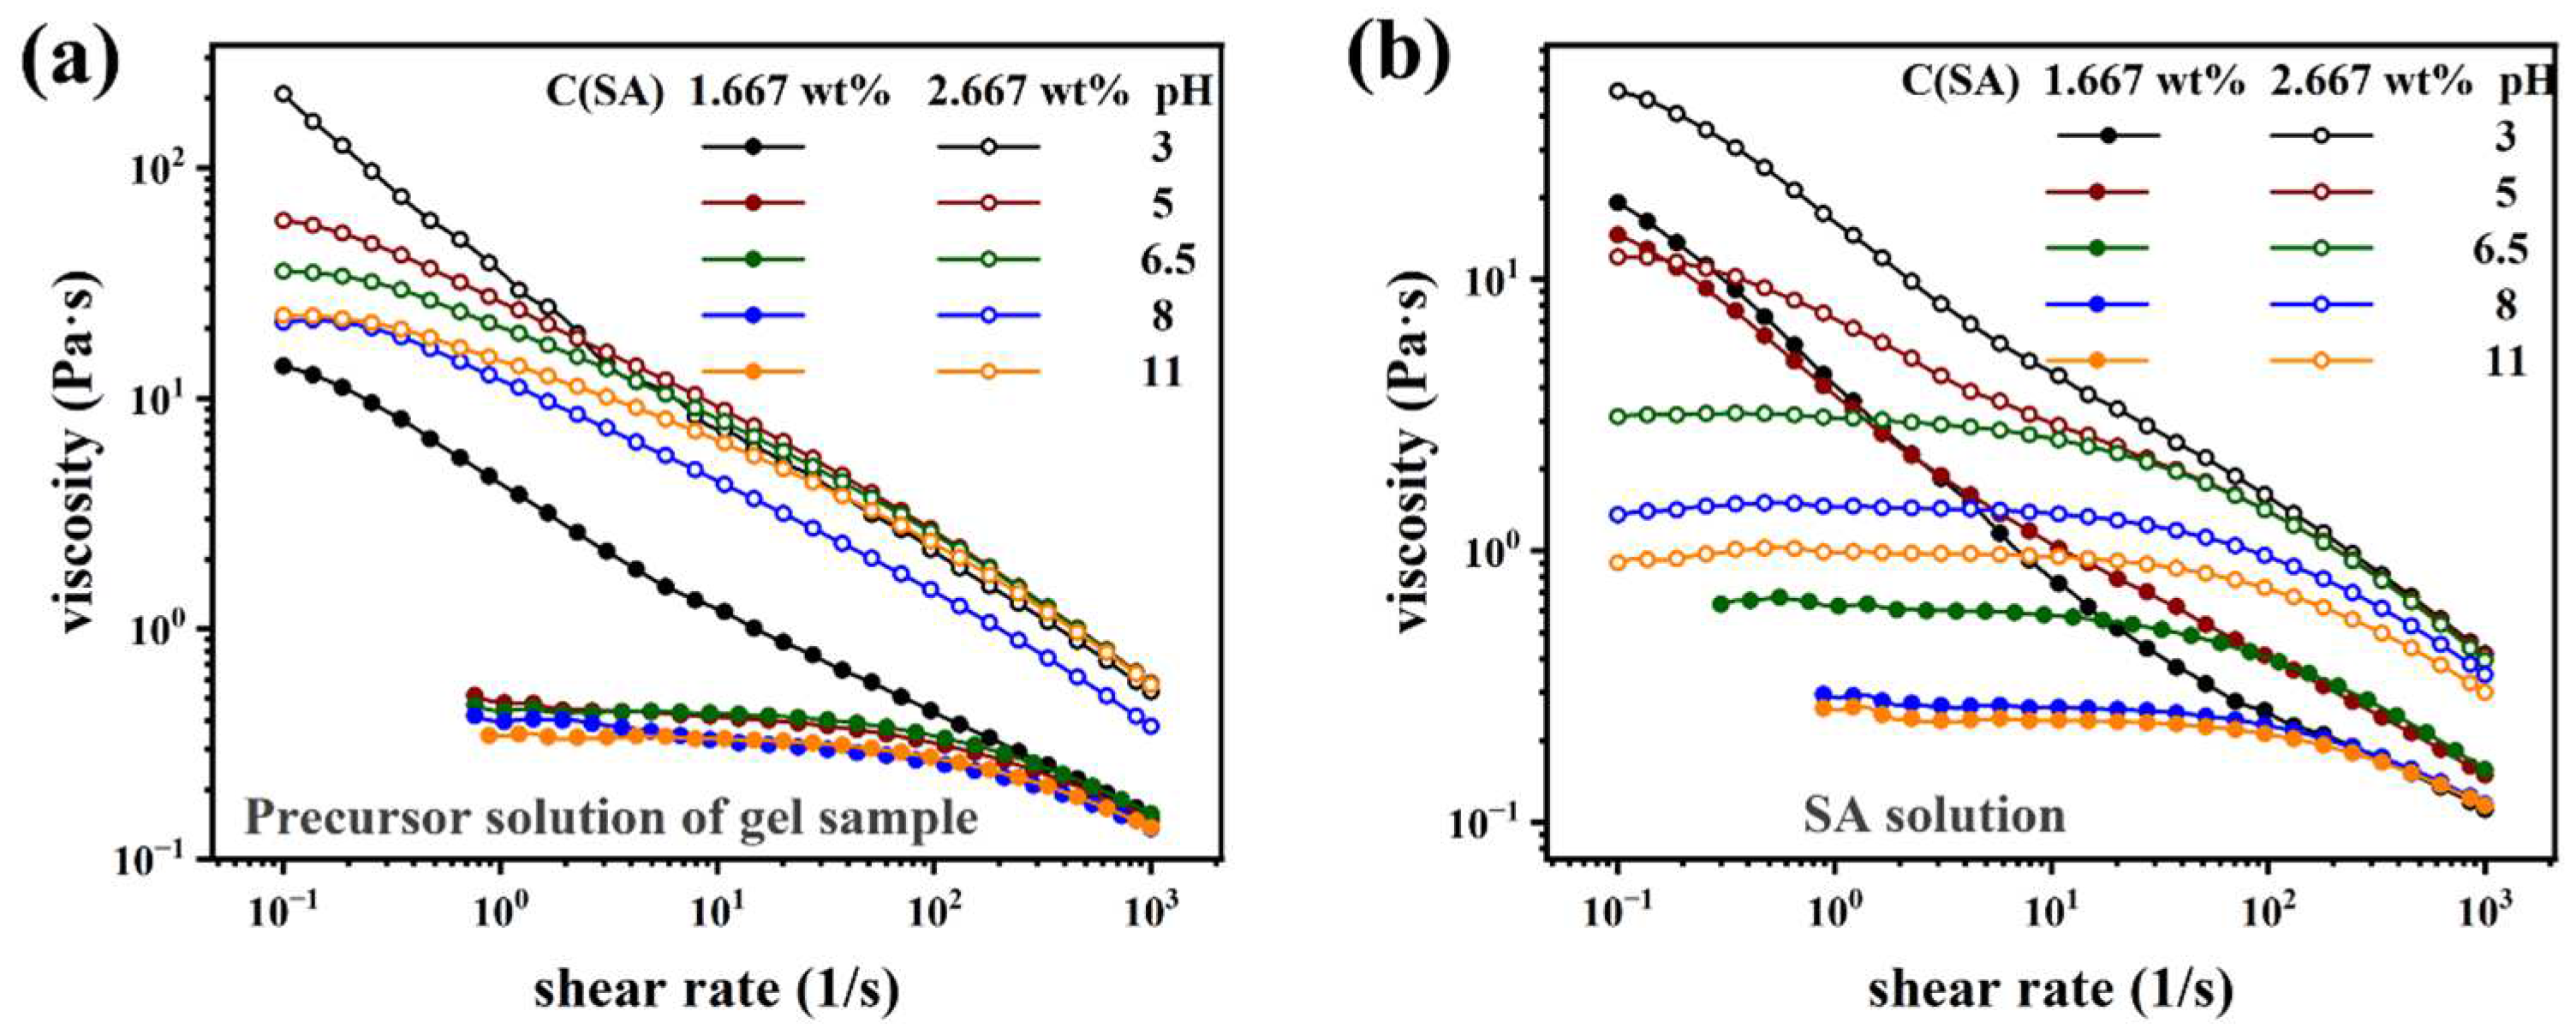
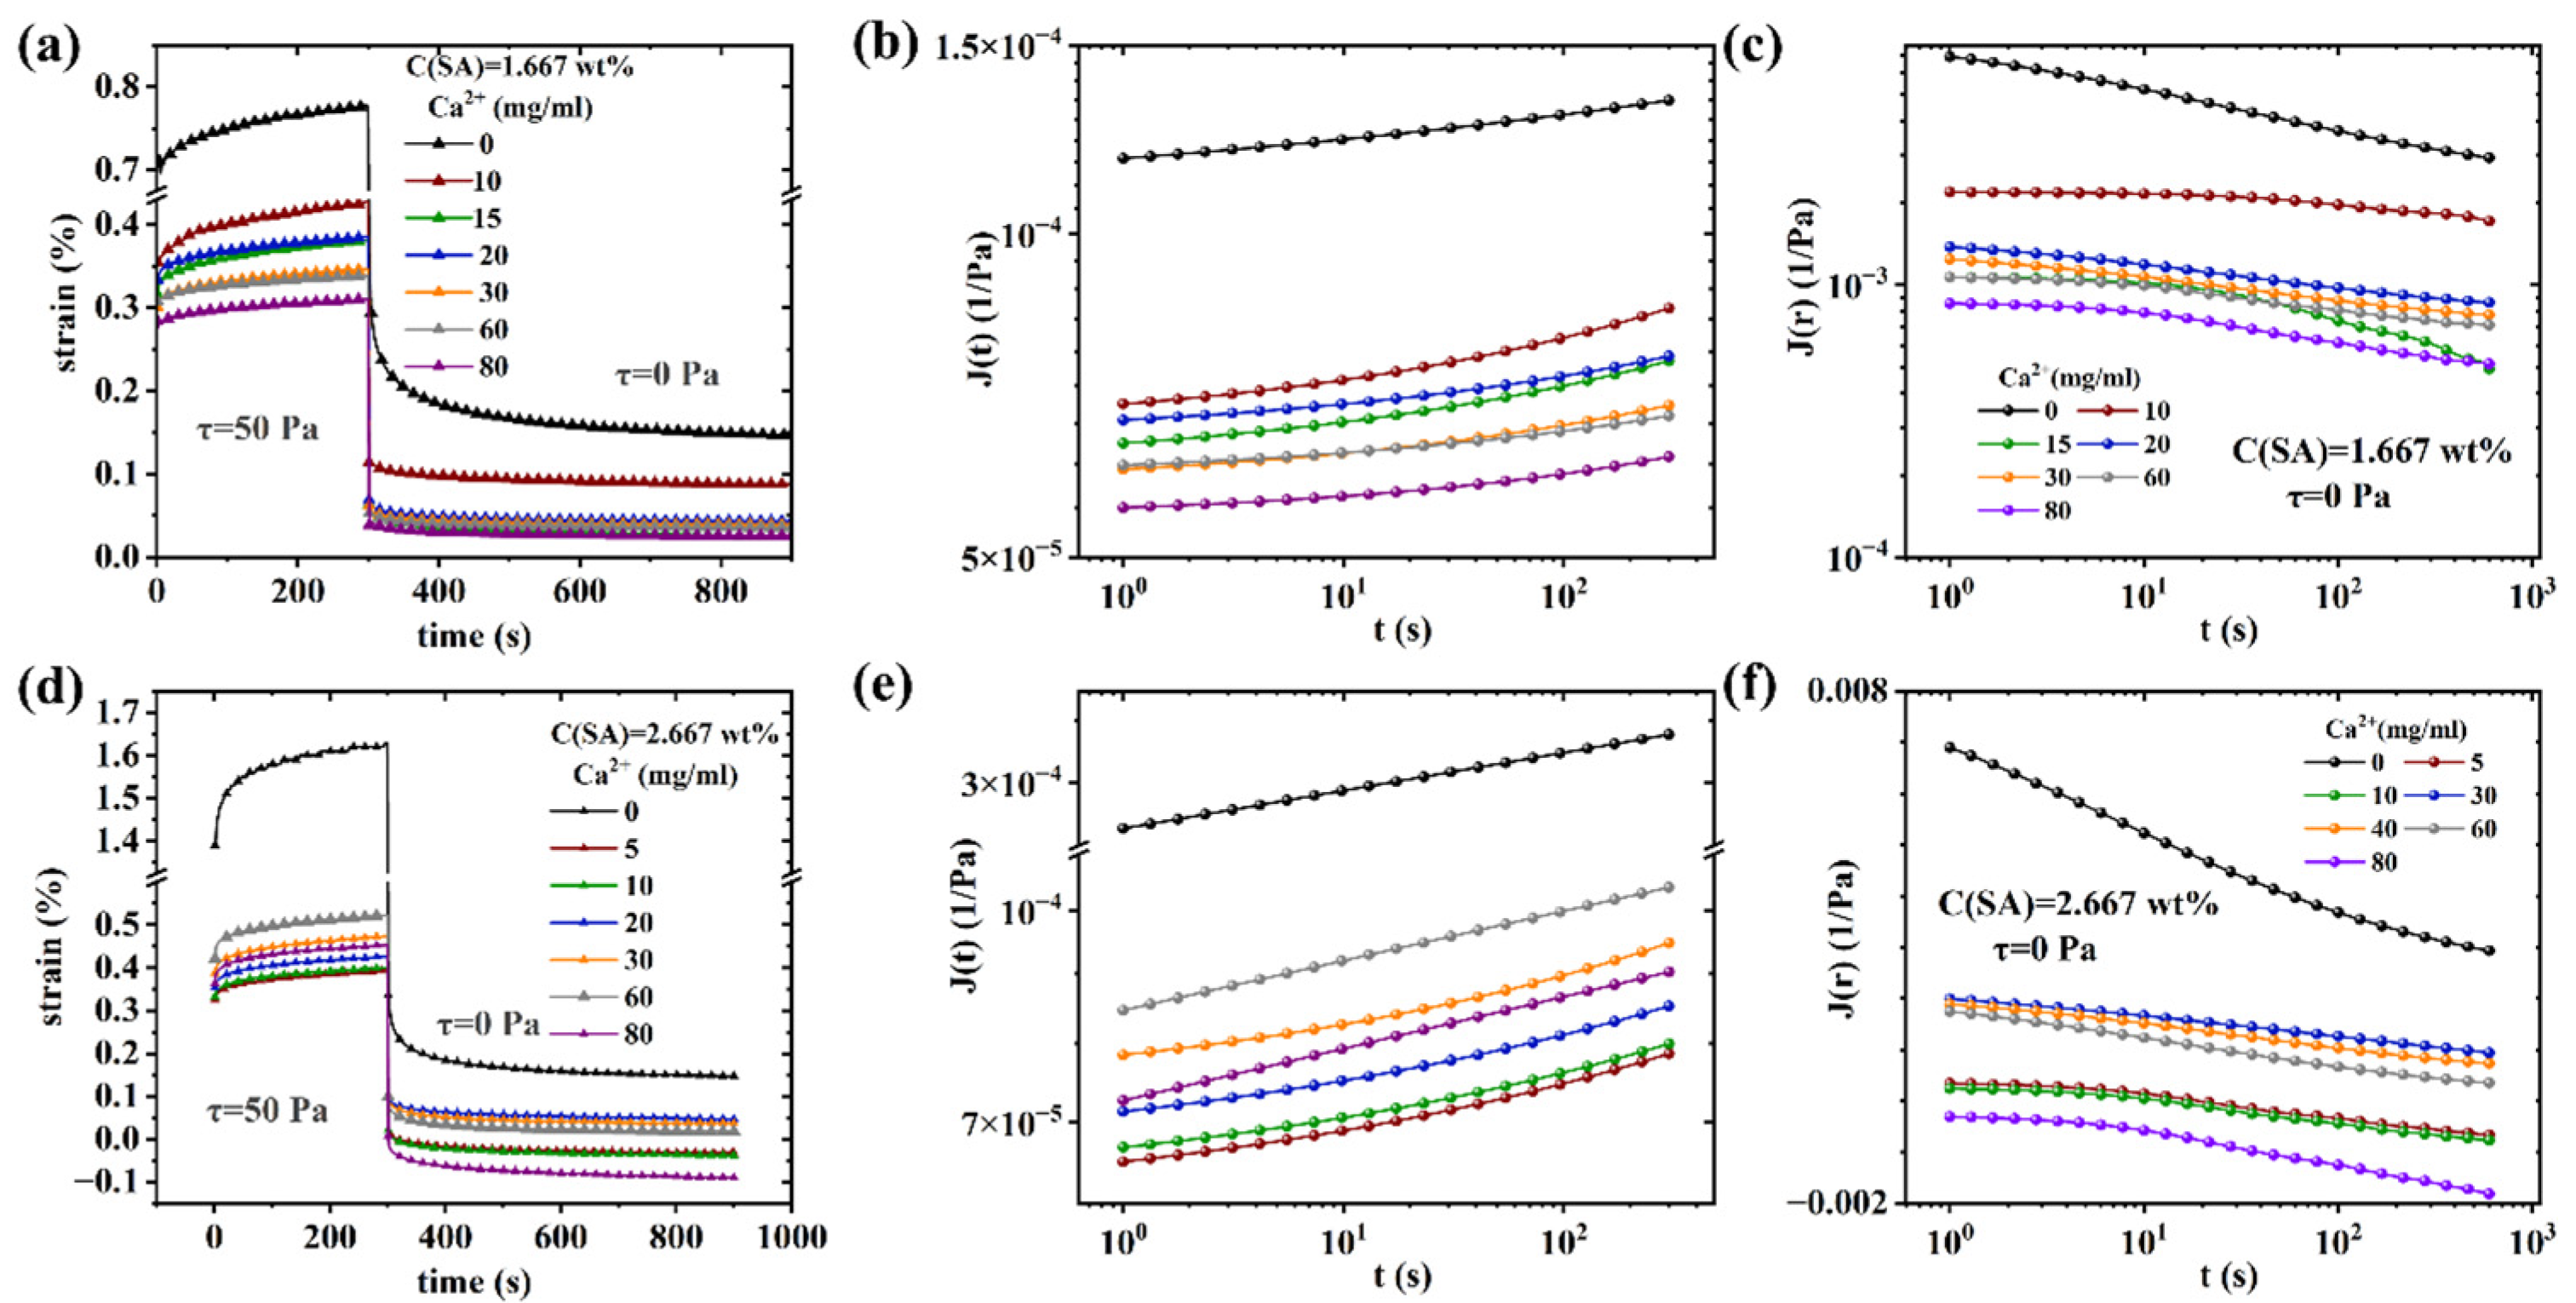
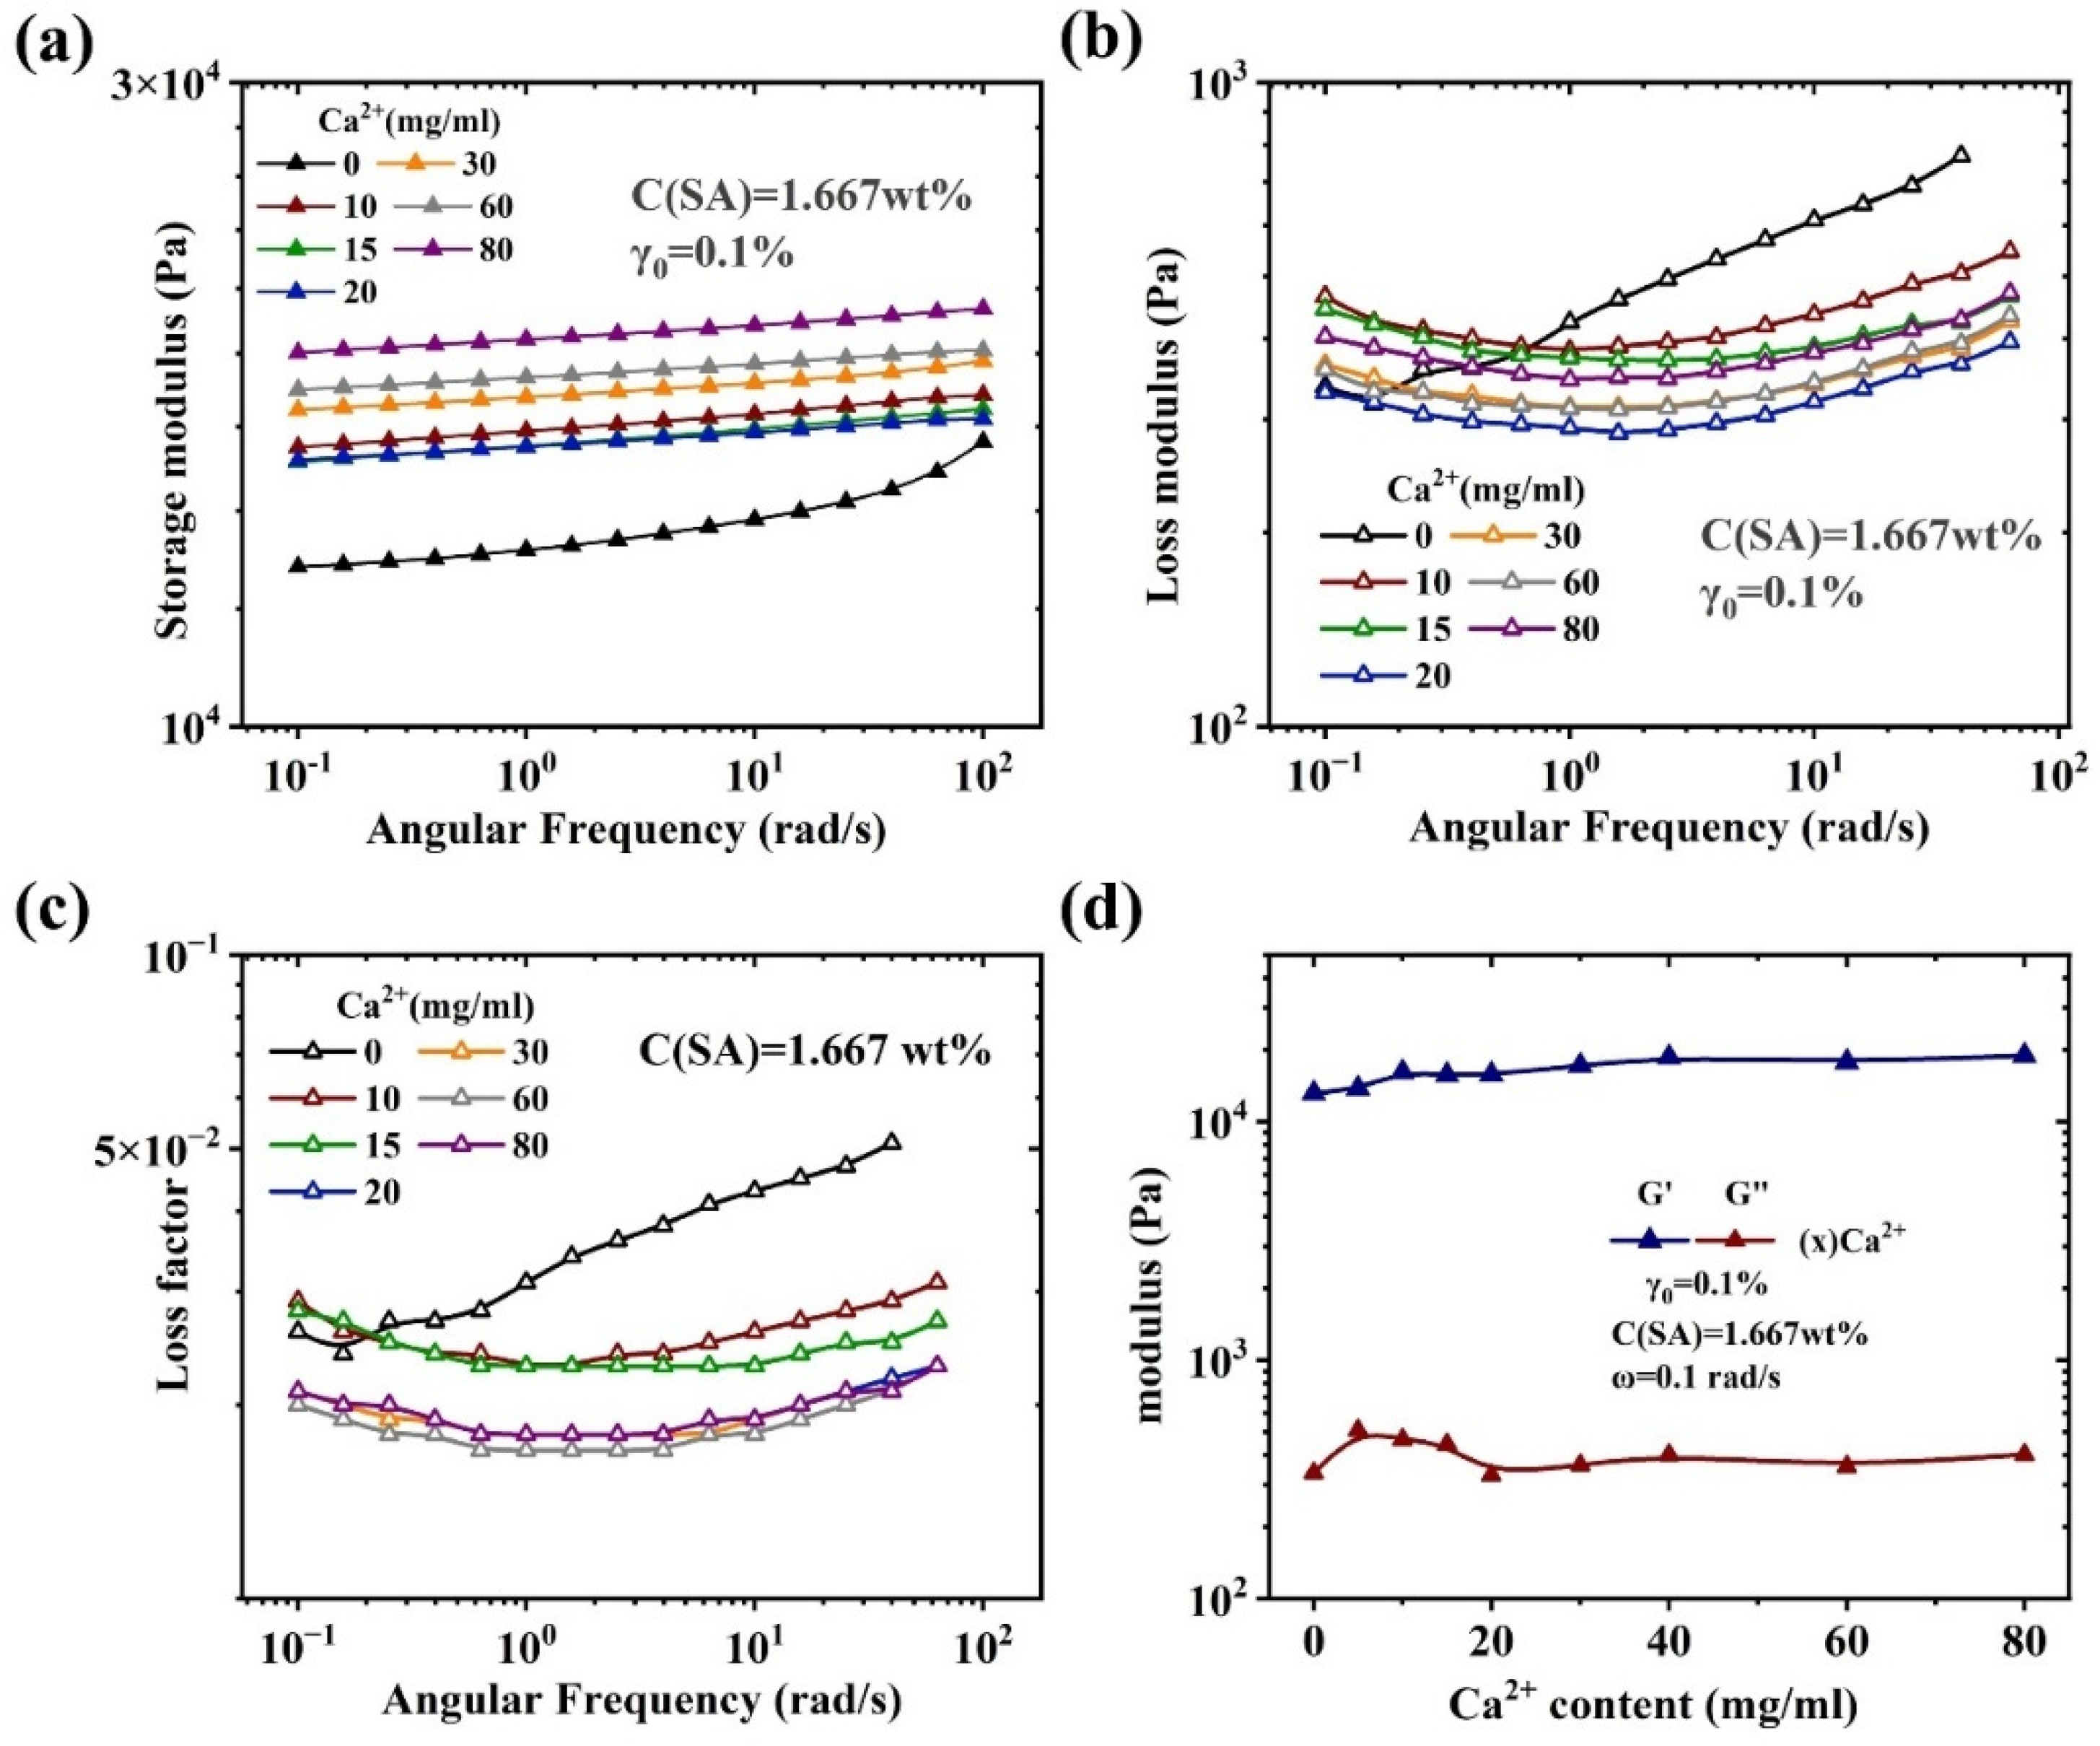
Rheological characterization
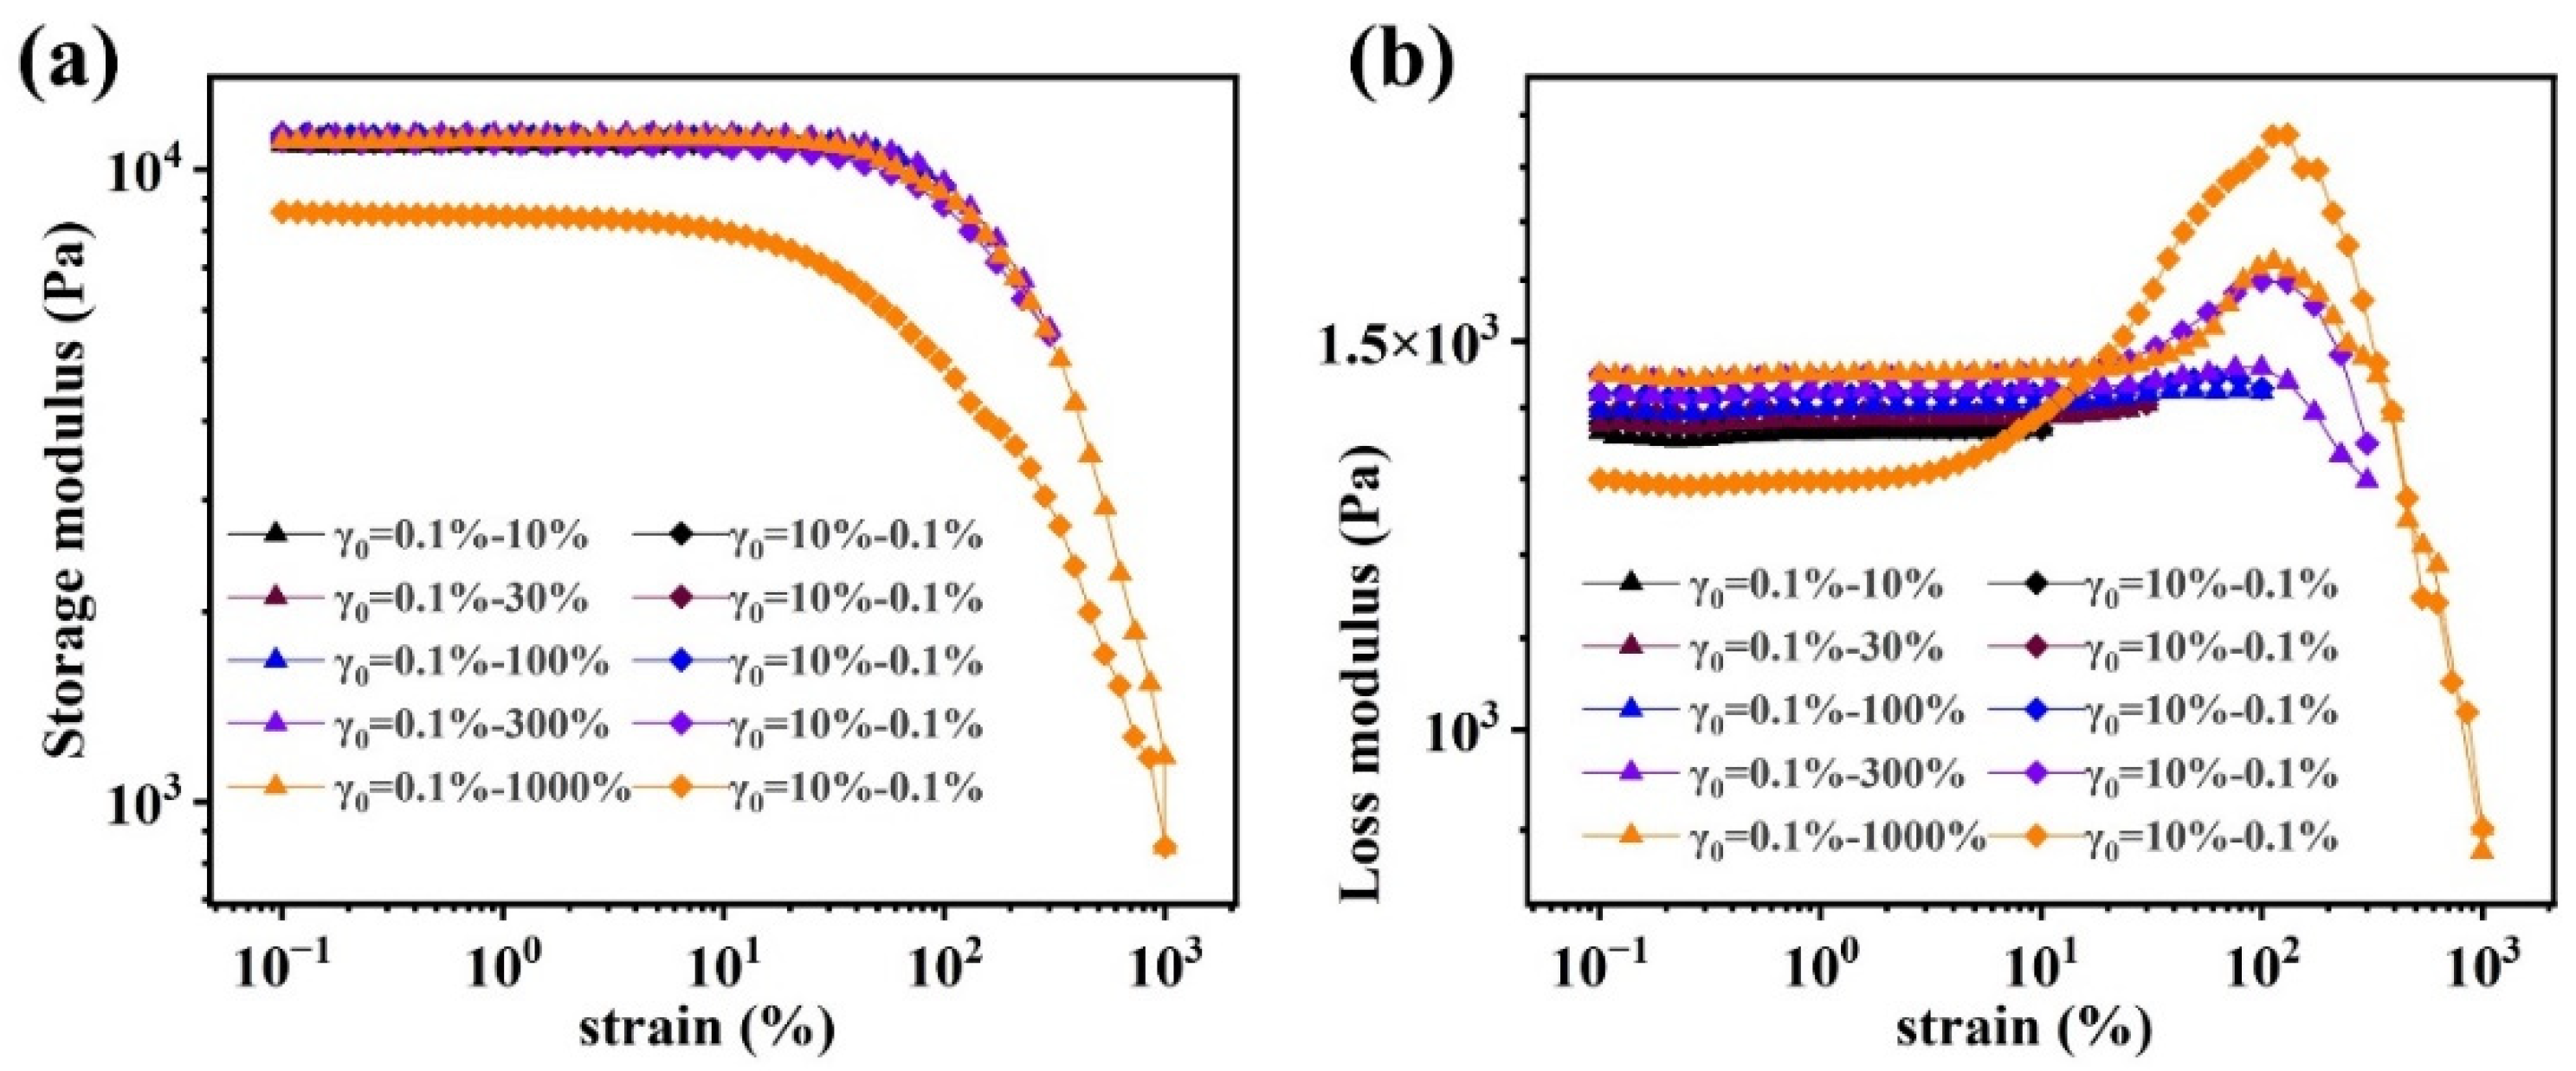
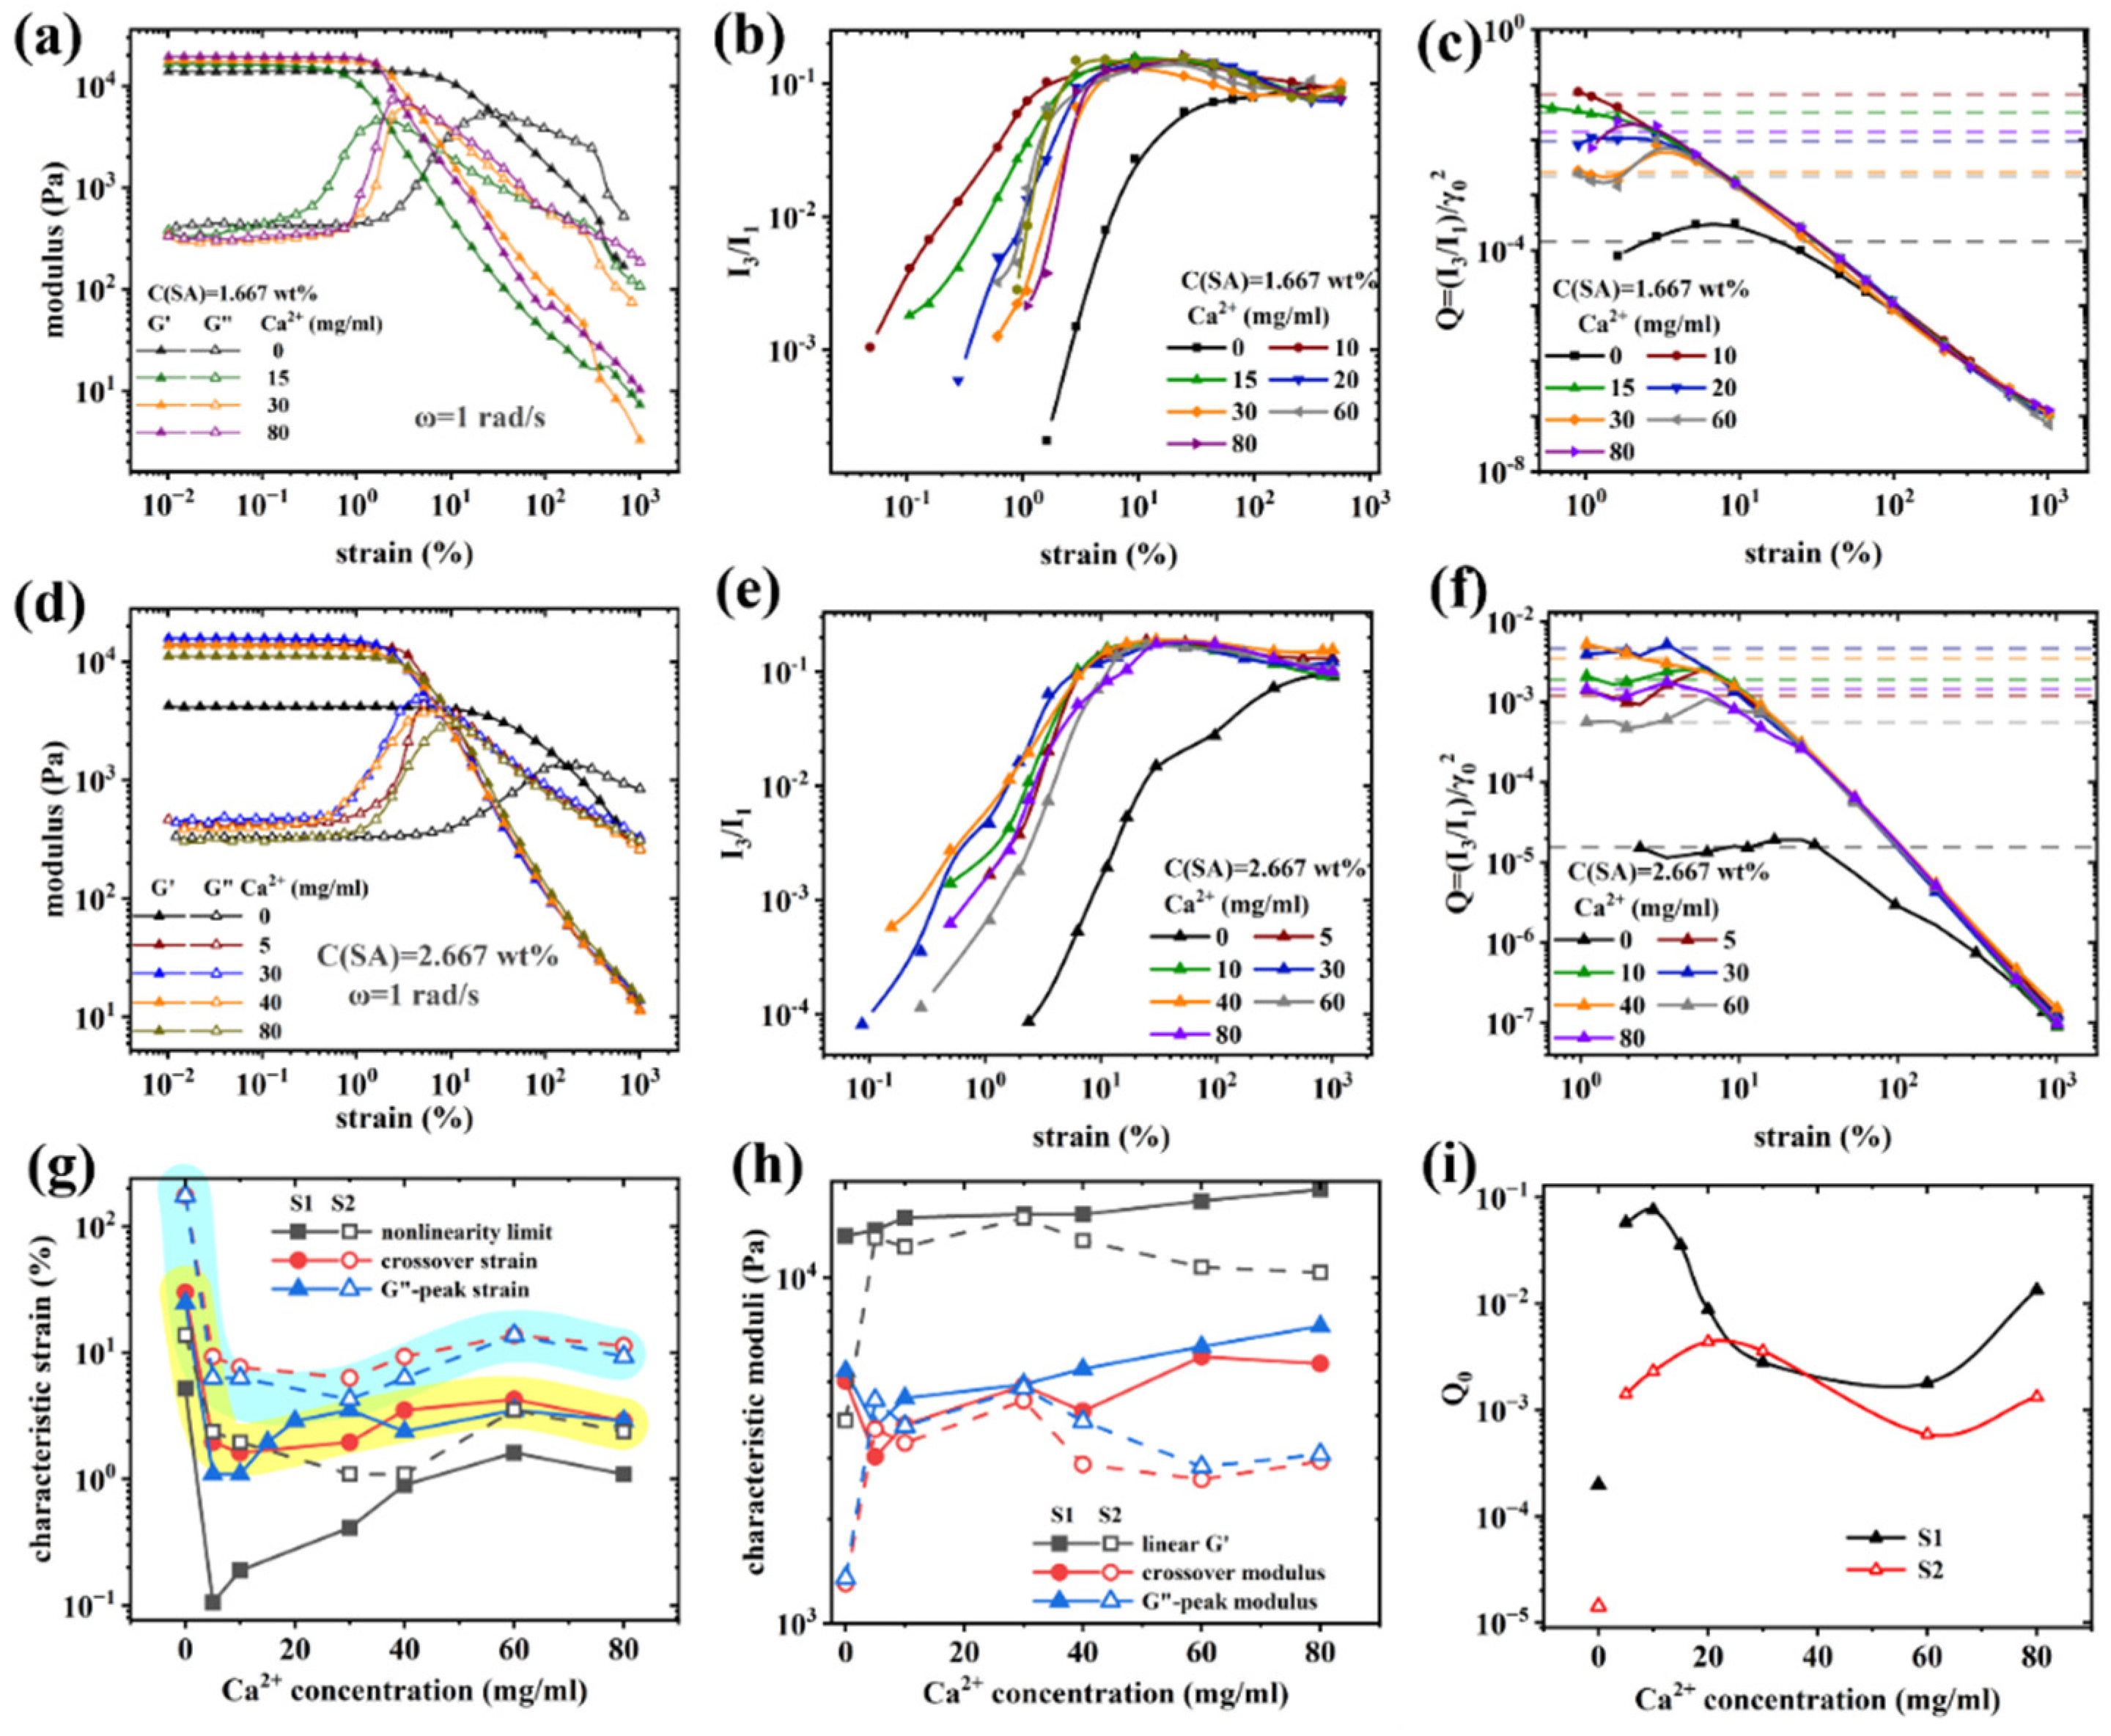
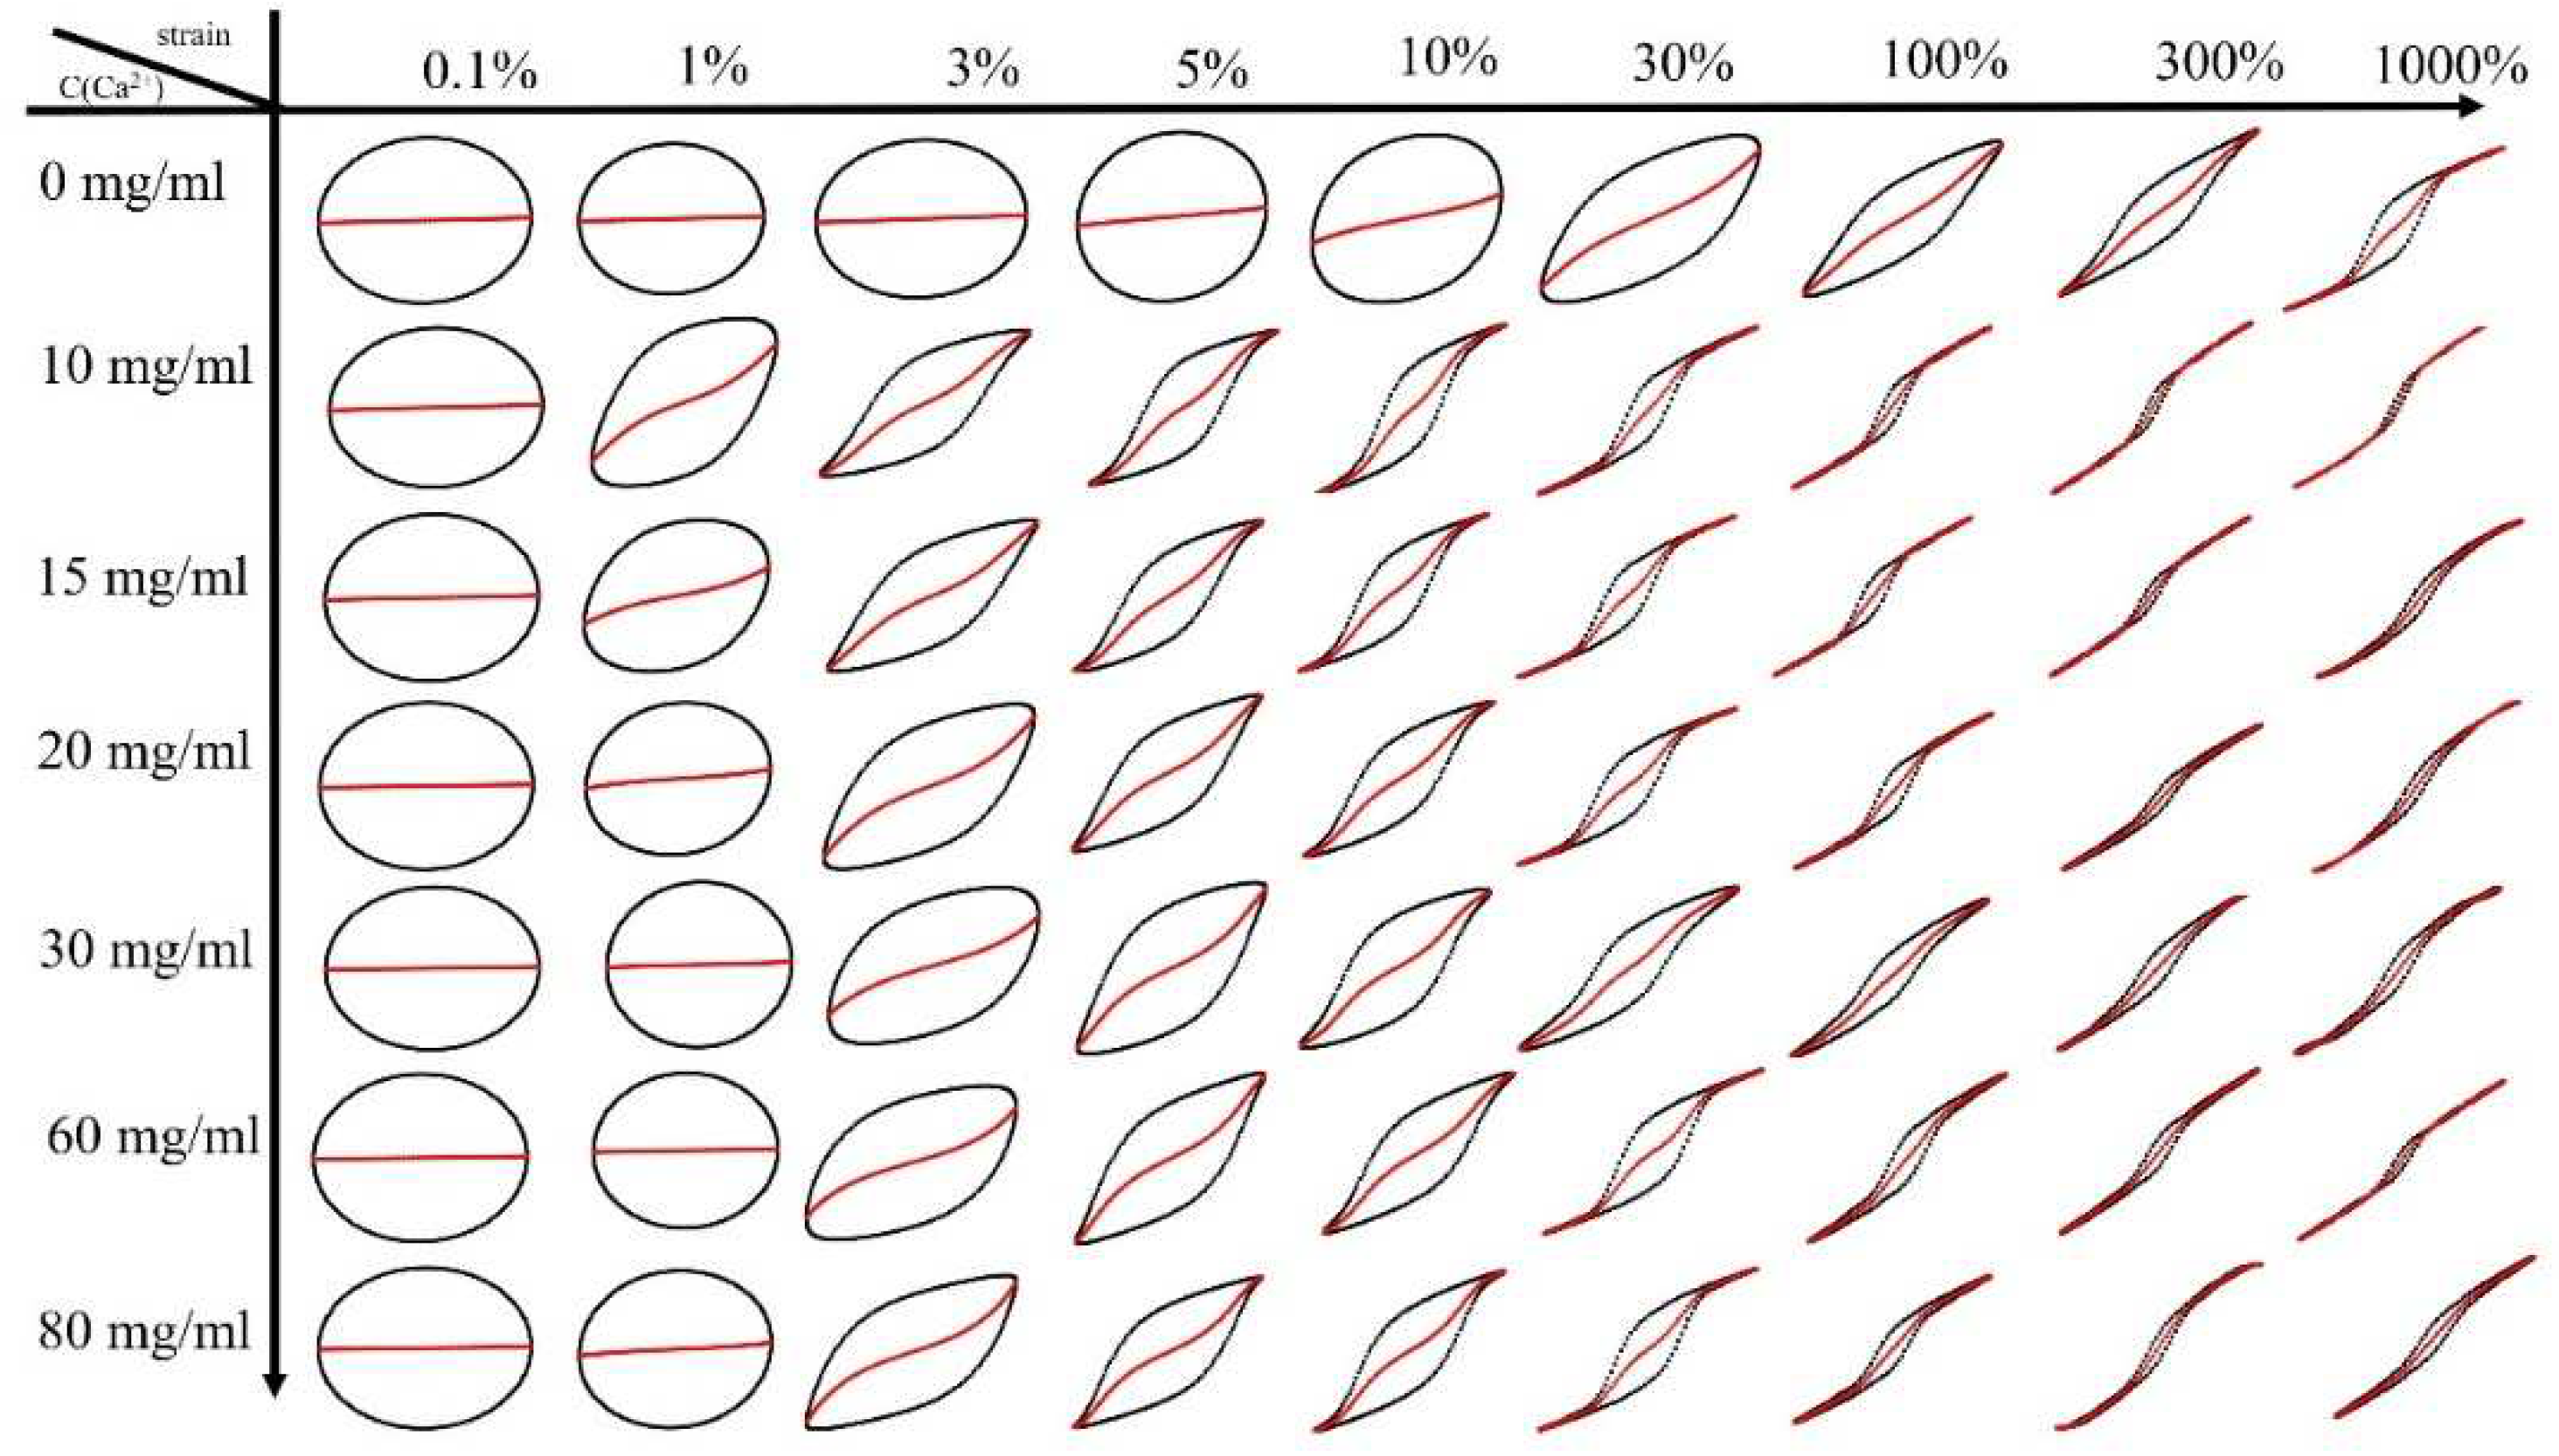
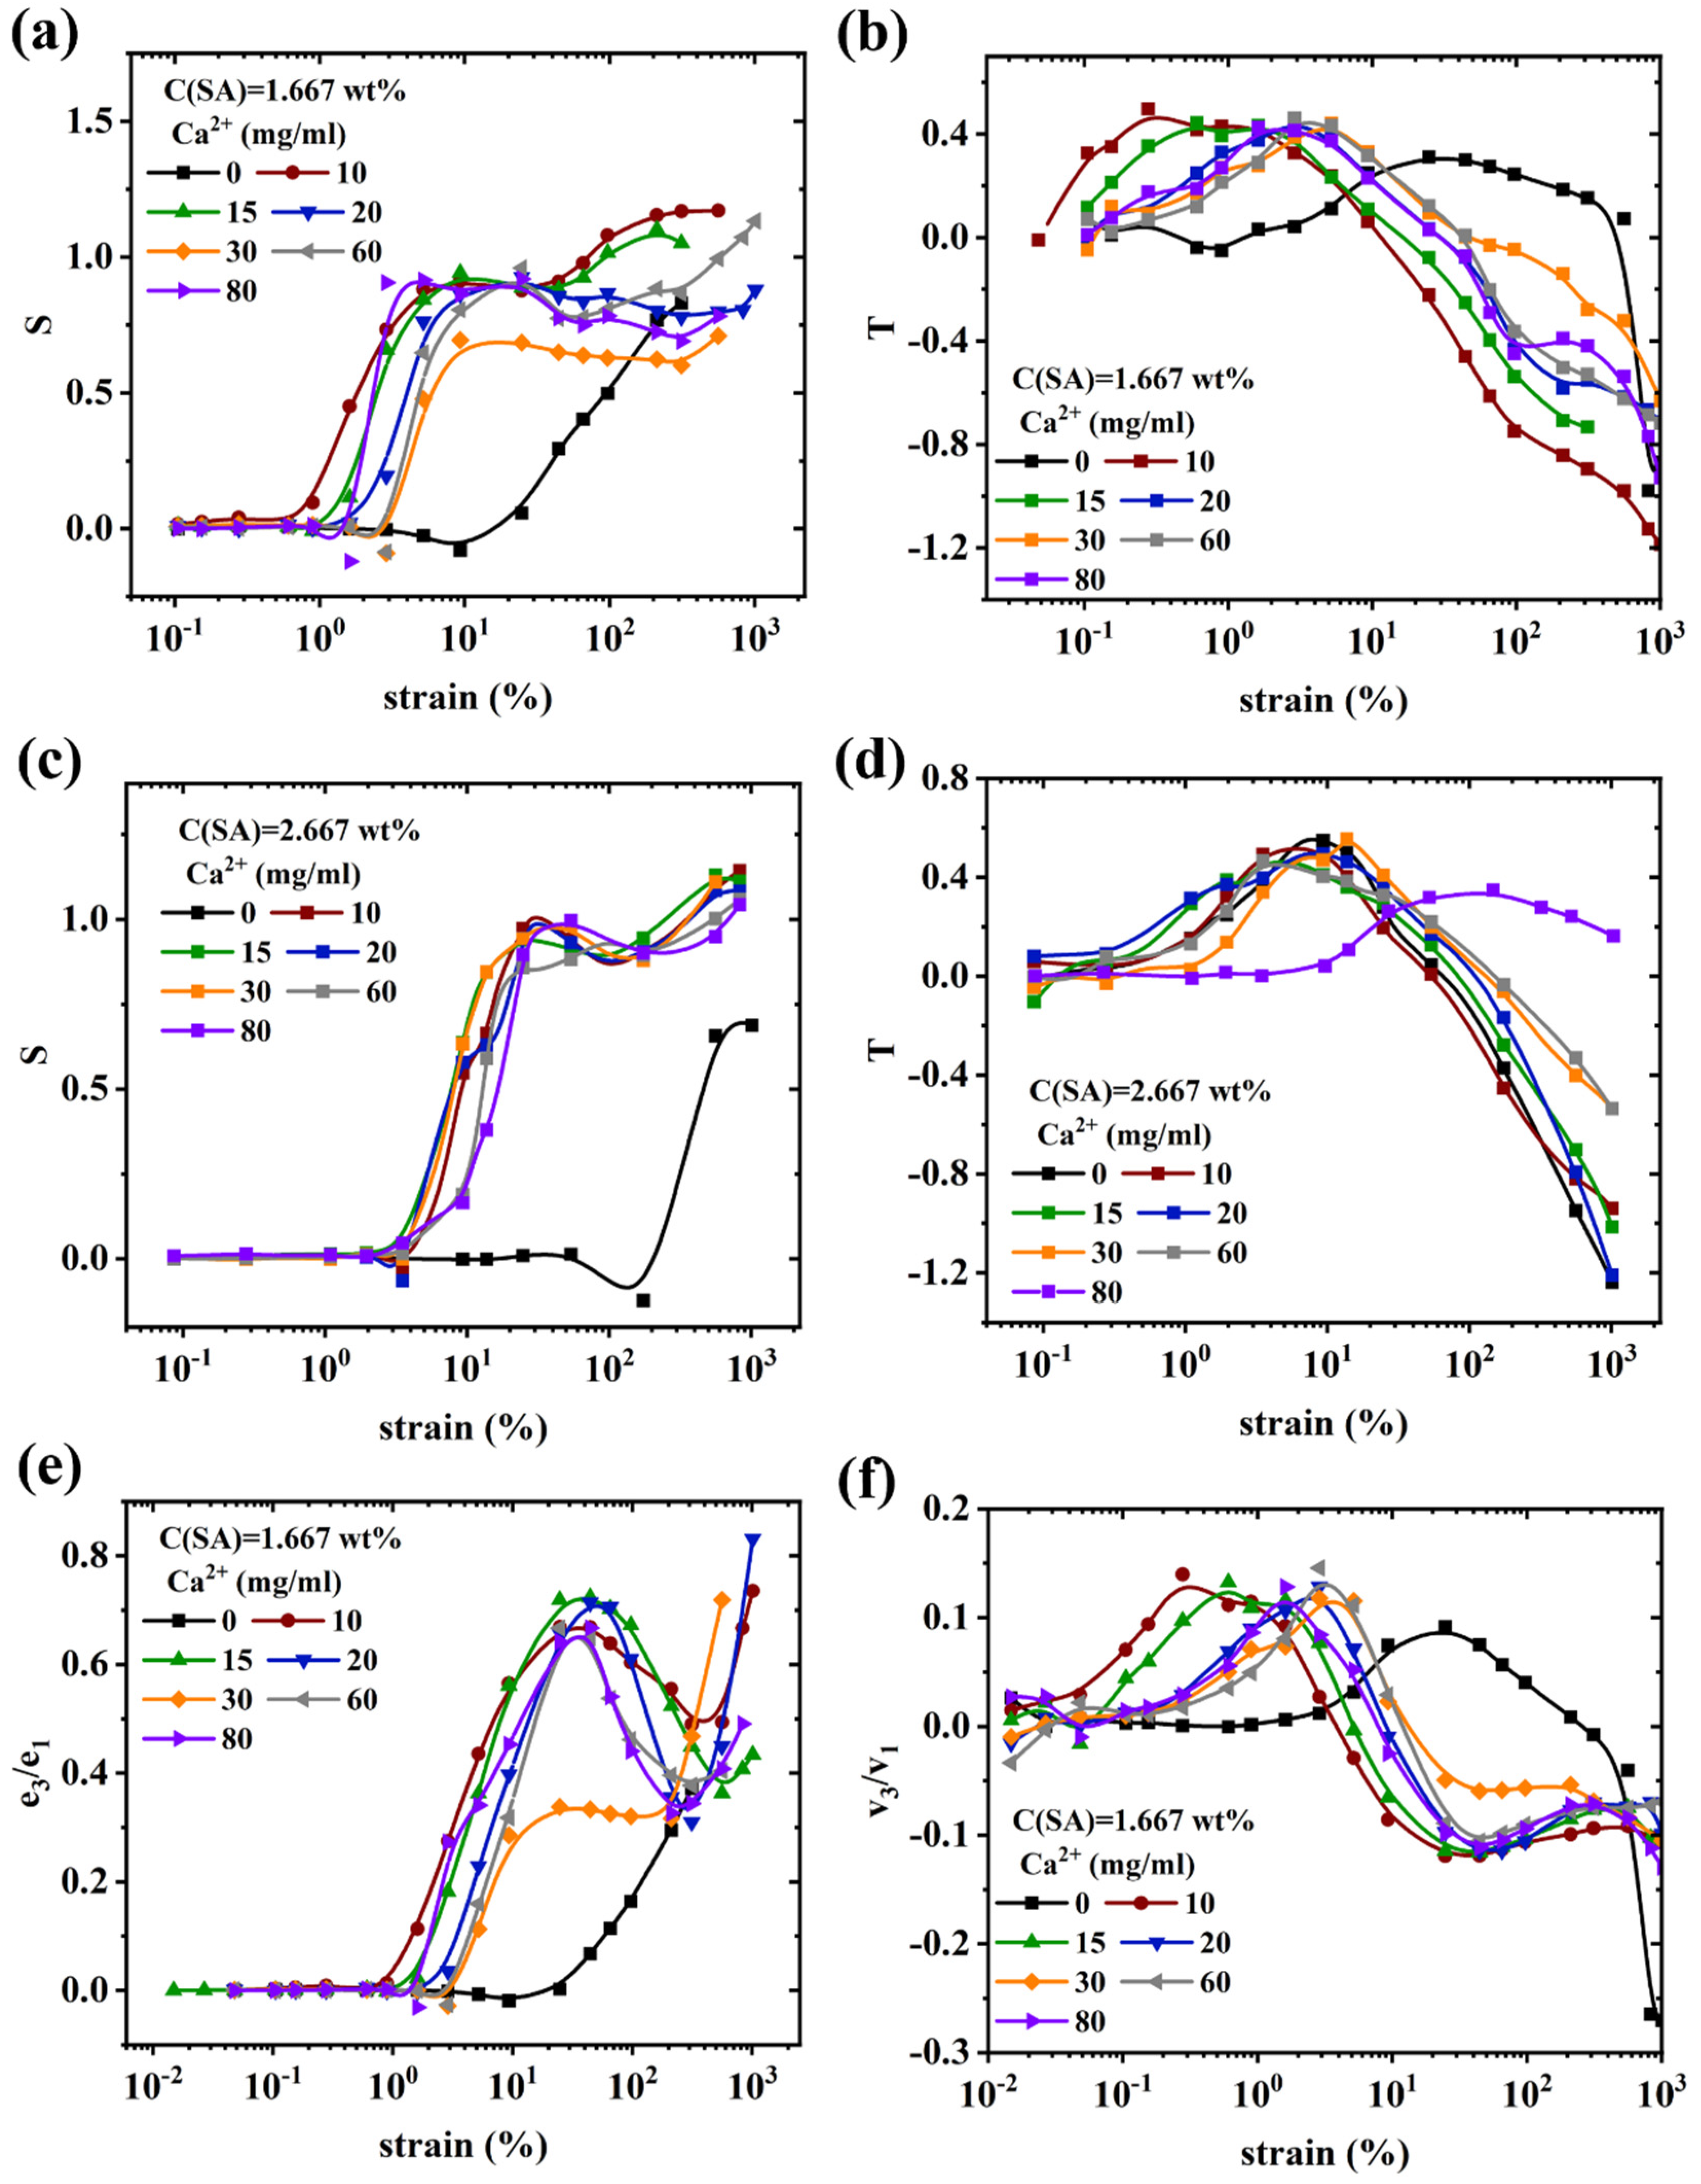
Nonlinear rheological behavior of (PAAM/SA) hydrogels
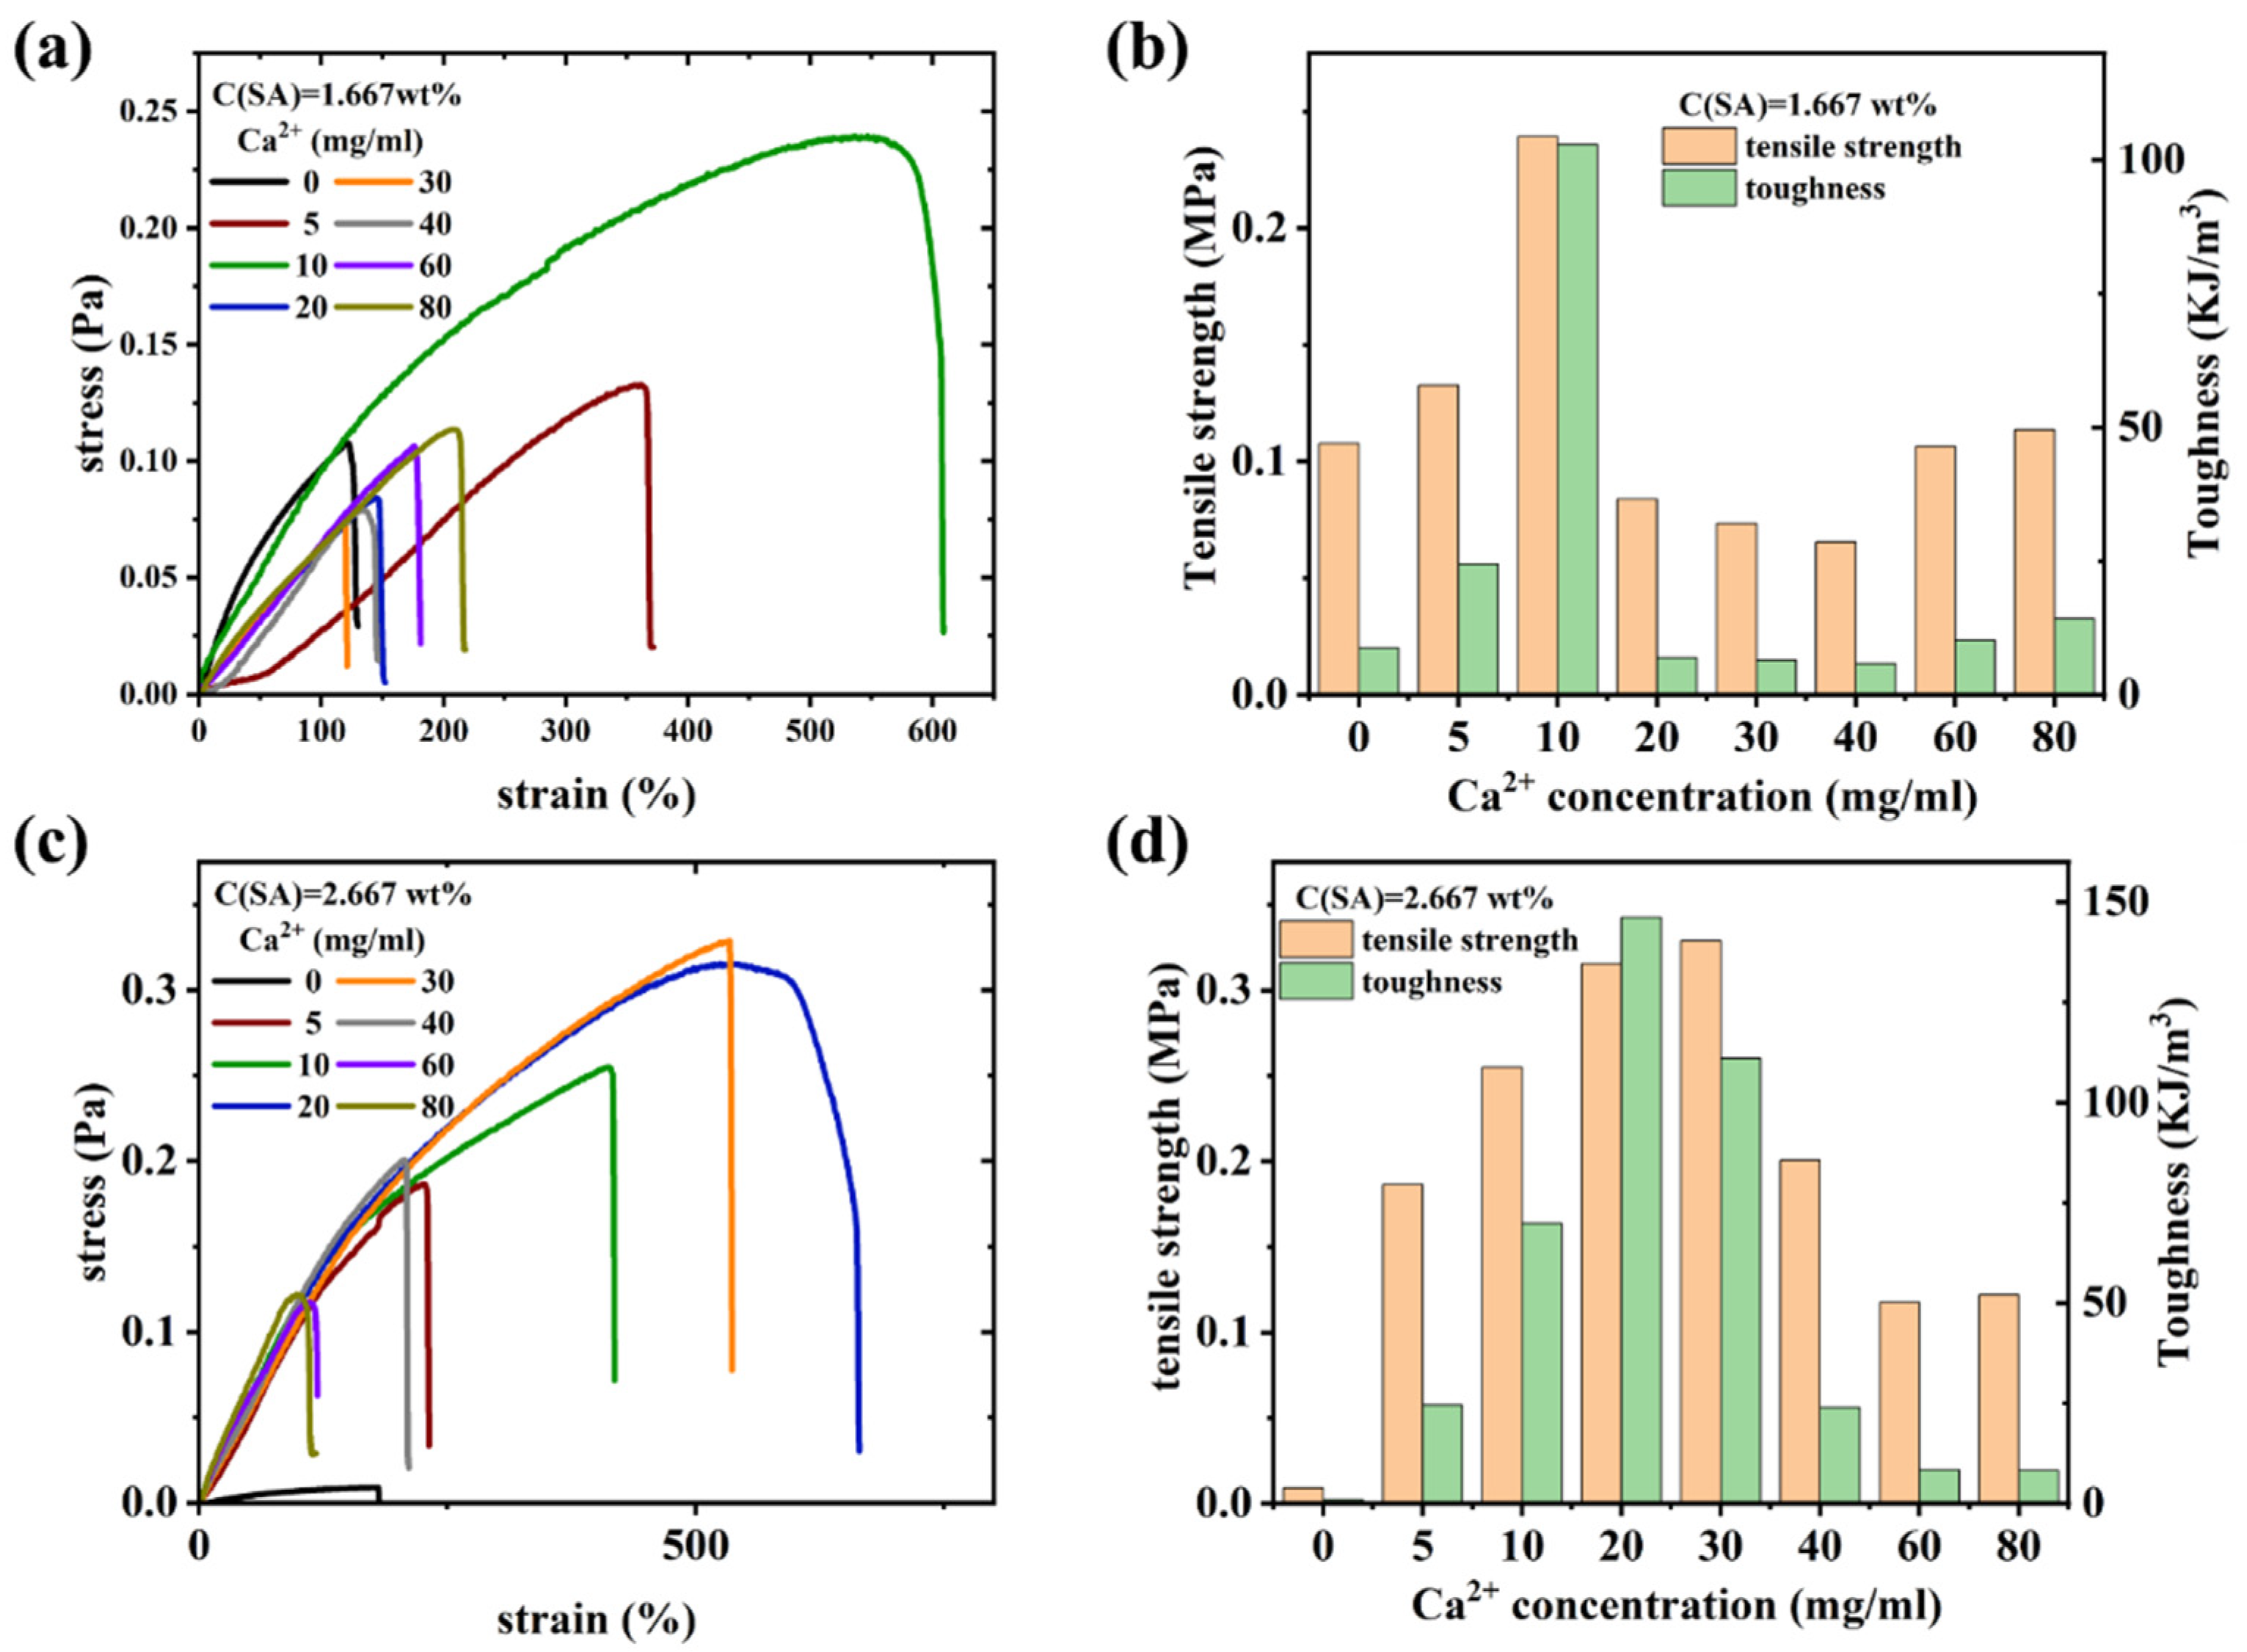
Mechanical properties
Conclusions
Supplementary Materials
Author Contributions
Funding
Data Availability Statement
Acknowledgments
Conflicts of Interest
Sample Availability
References
- Ahmed, E.M. Hydrogel: Preparation, characterization, and applications: A review. J Adv Res 2015, 6, 105-121. https://doi.org/10.1016/j.jare.2013.07.006. [CrossRef]
- Wang, L.; Zhao, W.; Zhao, Y.; Li, W.; Wang, G.; Zhang, Q. Enzymatically-mineralized double-network hydrogels with ultrahigh mechanical strength, toughness, and stiffness. Theranostics 2023, 13, 673-684. https://doi.org/10.7150/thno.77417. [CrossRef]
- Guillet, P.; Mugemana, C.; Stadler, F.J.; Schubert, U.S.; Fustin, C.-A.; Bailly, C.; Gohy, J.-F. Connecting micelles by metallo-supramolecular interactions: towards stimuli responsive hierarchical materials. Soft Matter 2009, 5, 3409-3411. https://doi.org/10.1039/b910325b. [CrossRef]
- GhavamiNejad, A.; Hashmi, S.; Obiweluozor, F.; Vatankhah-Varnoosfaderani, M.; Stadler, F.J. Supramolecular Gels Reinforced by Reduced Graphene Oxide. In Proceedings of the POLYCHAR 21 World Forum on Advanced Materials, Gwangju, Republic of KOREA, 2013.
- Hashmi, S.; GhavamiNejad, A.; Obiweluozor, F.; Vatankhah-Varnoosfaderani, M.; Stadler, F.J. Supramolecular pH-triggered Reversible Foamed Gel - the Surprising Effect of Water. In Proceedings of the POLYCHAR 21 World Forum on Advanced Materials, Gwangju, Republic of KOREA, 2013.
- Hashmi, S.; Vatankhah-Varnoosfaderani, M.; GhavamiNejad, A.; Mespouille, L.; Obiweluozor, F.O.; Stadler, F.J. Rheological Active Self-associating Supramolecular System of NIPAM-based Zwitterionic Copolymer Solutions Macromolecules 2013, submitted.
- Obiweluozor, F.O.; GhavamiNejad, A.; Hashmi, S.; Vatankhah-Varnoosfaderani, M.; Stadler, F.J. A NIPAM-Zwitterion Copolymer: Rheological Interpretation of the Specific Ion Effect on the LCST. Macromol Chem Physic 2014, 215, 1077-1091. https://doi.org/10.1002/macp.201300778. [CrossRef]
- Obiweluozor, F.O.; GhavamiNejad, A.; Hashmi, S.; Vatankhah-Varnoosfaderani, M.; Stadler, F.J. A NIPAM-Zwitterion Copolymer: Rheological Interpretation of the Specific Ion Effect on the LCST. Macromol Chem Physic 2014, 215, 2125. https://doi.org/10.1002/macp.201300778. [CrossRef]
- Hirschberg, J.H.K.K.; Beijer, F.H.; van Aert, H.A.; Magusin, P.C.M.M.; Sijbesma, R.P.; Meijer, E.W. Supramolecular polymers from linear telechelic siloxanes with quadruple-hydrogen-bonded units. Macromolecules 1999, 32, 2696-2705. https://doi.org/10.1021/ma981950w. [CrossRef]
- Clasen, C.; Kulicke, W.M. Determination of viscoelastic and rheo-optical material functions of water-soluble cellulose derivatives. Prog Polym Sci 2001, 26, 1839-1919. https://doi.org/10.1016/S0079-6700(01)00024-7. [CrossRef]
- Guo, L.; Colby, R.H.; Lin, M.Y.; Dado, G.P. Micellar structure changes in aqueous mixtures of nonionic surfactants. J Rheol 2001, 45, 1223-1243, doi:Doi 10.1122/1.1389315. [CrossRef]
- Schmatloch, S.; Gonzalez, M.F.; Schubert, U.S. Metallo-supramolecular diethylene glycol: Water-soluble reversible polymers. Macromol Rapid Commun 2002, 23, 957-961.
- Heller, M.; Schubert, U.S. Terpyridines as supramolecular initiators for living polymerization methods. Macromol Symp 2002, 177, 87-96. https://doi.org/10.1002/1521-3900(200201)177:1<87::Aid-Masy87>3.0.Co;2-1. [CrossRef]
- Song, L.G.; Liu, T.B.; Liang, D.H.; Wu, C.H.; Zaitsev, V.S.; Dresco, P.A.; Chu, B. Coupling of optical characterization with particle and network synthesis for biomedical applications. J Biomed Opt 2002, 7, 498-506. https://doi.org/10.1117/1.1482380. [CrossRef]
- Fischer, P.; Rehage, H.; Gruning, B. Linear flow properties of dimer acid betaine solutions with and without changed ionic strength. J Phys Chem B 2002, 106, 11041-11046. https://doi.org/10.1021/jp0127263. [CrossRef]
- Auzely-Velty, R.; Rinaudo, M. New supramolecular assemblies of a cyclodextrin-grafted chitosan through specific complexation. Macromolecules 2002, 35, 7955-7962. https://doi.org/10.1021/ma020661o. [CrossRef]
- Schmatloch, S.; van den Berg, A.M.J.; Alexeev, A.S.; Hofmeier, H.; Schubert, U.S. Soluble high-molecular-mass poly(ethylene oxide)s via self-organization. Macromolecules 2003, 36, 9943-9949. https://doi.org/10.1021/Ma0350359. [CrossRef]
- Hofmeier, H.; Schubert, U.S. Supramolecular branching and crosslinking of terpyridine-modified copolymers: Complexation and decomplexation studies in diluted solution. Macromol Chem Physic 2003, 204, 1391-1397. https://doi.org/10.1002/macp.200350003. [CrossRef]
- Granick, S.; Kumar, S.K.; Amis, E.J.; Antonietti, M.; Balazs, A.C.; Chakraborty, A.K.; Grest, G.S.; Hawker, C.J.; Janmey, P.; Kramer, E.J.; et al. Macromolecules at surfaces: Research challenges and opportunities from tribology to biology. J Polym Sci Pol Phys 2003, 41, 2755-2793. https://doi.org/10.1002/polb.10669. [CrossRef]
- Li, J.; Ni, X.; Leong, K.W. Injectable drug-delivery systems based on supramolecular hydrogels formed by poly(ethylene oxide)s and alpha-cyclodextrin. J Biomed Mater Res A 2003, 65, 196-202. https://doi.org/10.1002/jbm.a.10444. [CrossRef]
- Andres, P.R.; Schubert, U.S. Metallo-polymerization/-cyclization of a C-16-bridged di-terpyridine ligand and iron(II) ions. Macromol Rapid Commun 2004, 25, 1371-1375. https://doi.org/10.1002/marc.200400177. [CrossRef]
- Schmatloch, S.; van den Berg, A.M.J.; Fijten, M.W.M.; Schubert, U.S. A high-throughput approach towards tailor-made water-soluble metallo-supramolecular polymers. Macromol Rapid Commun 2004, 25, 321-325. https://doi.org/10.1002/marc.200300230. [CrossRef]
- Vermonden, T.; van Steenbergen, M.J.; Besseling, N.A.M.; Marcelis, A.T.M.; Hennink, W.E.; Sudholter, E.J.R.; Stuart, M.A.C. Linear rheology of water-soluble reversible neodymium(Ill) coordination polymers. J Am Chem Soc 2004, 126, 15802-15808. https://doi.org/10.1021/ja0458928. [CrossRef]
- Yao, S.; Beginn, U.; Gress, T.; Lysetska, M.; Wurthner, F. Supramolecular polymerization and gel formation of Bis(merocyanine) dyes driven by dipolar aggregation. J Am Chem Soc 2004, 126, 8336-8348, doi:DOI 10.1021/ja0496367. [CrossRef]
- Park, T.; Zimmerman, S.C. Formation of a miscible supramolecular polymer blend through self-assembly mediated by a quadruply hydrogen-bonded heterocomplex. J Am Chem Soc 2006, 128, 11582-11590. https://doi.org/10.1021/ja0631854. [CrossRef]
- Lv, Y.; Pan, Z.; Song, C.; Chen, Y.; Qian, X. Locust bean gum/gellan gum double-network hydrogels with superior self-healing and pH-driven shape-memory properties. Soft Matter 2019, 15, 6171-6179. https://doi.org/10.1039/c9sm00861f. [CrossRef]
- Wang, X.-H.; Song, F.; Qian, D.; He, Y.-D.; Nie, W.-C.; Wang, X.-L.; Wang, Y.-Z. Strong and tough fully physically crosslinked double network hydrogels with tunable mechanics and high self-healing performance. Chem Eng J 2018, 349, 588-594. https://doi.org/10.1016/j.cej.2018.05.081. [CrossRef]
- Gong, J.P.; Katsuyama, Y.; Kurokawa, T.; Osada, Y. Double-Network Hydrogels with Extremely High Mechanical Strength. Advanced Materials 2003, 15, 1155-1158. https://doi.org/10.1002/adma.200304907. [CrossRef]
- Wang, G.; Zhang, Q.; Wang, Q.; Zhou, L.; Gao, G. Bio-Based Hydrogel Transducer for Measuring Human Motion with Stable Adhesion and Ultrahigh Toughness. ACS applied materials & interfaces 2021, 13, 24173-24182. https://doi.org/10.1021/acsami.1c05098. [CrossRef]
- Yang, J.; Li, Y.; Zhu, L.; Qin, G.; Chen, Q. Double network hydrogels with controlled shape deformation: A mini review. Journal of Polymer Science Part B: Polymer Physics 2018, 56, 1351-1362. https://doi.org/10.1002/polb.24735. [CrossRef]
- Falcone, G.; Mazzei, P.; Piccolo, A.; Esposito, T.; Mencherini, T.; Aquino, R.P.; Del Gaudio, P.; Russo, P. Advanced printable hydrogels from pre-crosslinked alginate as a new tool in semi solid extrusion 3D printing process. Carbohydr Polym 2022, 276, 118746. https://doi.org/10.1016/j.carbpol.2021.118746. [CrossRef]
- Fan, L.; Zeng, Z.; Zhu, R.; Liu, A.; Che, H.; Huo, M. Polymerization-Induced Self-Assembly Toward Micelle-Crosslinked Tough and Ultrastretchable Hydrogels. Chem Mater 2022, 34, 6408-6419. https://doi.org/10.1021/acs.chemmater.2c01001. [CrossRef]
- Zhihui, K.; Min, D. Application of Graphene Oxide-Based Hydrogels in Bone Tissue Engineering. Acs Biomater Sci Eng 2022, 8, 2849-2857. https://doi.org/10.1021/acsbiomaterials.2c00396. [CrossRef]
- Yu, F.; Yang, P.; Yang, Z.; Zhang, X.; Ma, J. Double-network hydrogel adsorbents for environmental applications. Chem Eng J 2021, 426. https://doi.org/10.1016/j.cej.2021.131900. [CrossRef]
- Bahrami, Z.; Akbari, A.; Eftekhari-Sis, B. Double network hydrogel of sodium alginate/polyacrylamide cross-linked with POSS: Swelling, dye removal and mechanical properties. Int J Biol Macromol 2019, 129, 187-197. https://doi.org/10.1016/j.ijbiomac.2019.02.046. [CrossRef]
- Zhou, H.; Lai, J.; Jin, X.; Liu, H.; Li, X.; Chen, W.; Ma, A.; Zhou, X. Intrinsically adhesive, highly sensitive and temperature tolerant flexible sensors based on double network organohydrogels. Chem Eng J 2021, 413. https://doi.org/10.1016/j.cej.2020.127544. [CrossRef]
- Xiao, Y.; Kang, S.; Liu, Y.; Guo, X.; Li, M.; Xu, H. Effect and mechanism of calcium ions on the gelation properties of cellulose nanocrystals-whey protein isolate composite gels. Food Hydrocolloid 2021, 111. https://doi.org/10.1016/j.foodhyd.2020.106401. [CrossRef]
- Varaprasad, K.; Raghavendra, G.M.; Jayaramudu, T.; Yallapu, M.M.; Sadiku, R. A mini review on hydrogels classification and recent developments in miscellaneous applications. Mater Sci Eng C Mater Biol Appl 2017, 79, 958-971. https://doi.org/10.1016/j.msec.2017.05.096. [CrossRef]
- Wu, M.; Pan, M.; Qiao, C.; Ma, Y.; Yan, B.; Yang, W.; Peng, Q.; Han, L.; Zeng, H. Ultra stretchable, tough, elastic and transparent hydrogel skins integrated with intelligent sensing functions enabled by machine learning algorithms. Chem Eng J 2022, 450. https://doi.org/10.1016/j.cej.2022.138212. [CrossRef]
- Kim, J.; Zhang, G.; Shi, M.; Suo, Z. Fracture, fatigue, and friction of polymers in which entanglements greatly outnumber cross-links. Science 2021, 374, 212-216. https://doi.org/10.1126/science.abg6320. [CrossRef]
- Ewoldt, R.H.; Hosoi, A.E.; McKinley, G.H. Nonlinear viscoelastic biomaterials: meaningful characterization and engineering inspiration. Integr Comp Biol 2009, 49, 40-50. https://doi.org/10.1093/icb/icp010. [CrossRef]
- Suman, K.; Shanbhag, S.; Joshi, Y.M. Large amplitude oscillatory shear study of a colloidal gel near the critical state. J Chem Phys 2023, 158, 054907. https://doi.org/10.1063/5.0129416. [CrossRef]
- Moud, A.A.; Kamkar, M.; Sanati-Nezhad, A.; Hejazi, S.H.; Sundararaj, U. Viscoelastic properties of poly (vinyl alcohol) hydrogels with cellulose nanocrystals fabricated through sodium chloride addition: Rheological evidence of double network formation. Colloids and Surfaces A: Physicochemical and Engineering Aspects 2021, 609. https://doi.org/10.1016/j.colsurfa.2020.125577. [CrossRef]
- Hashmi, S.; GhavamiNejad, A.; Obiweluozor, F.O.; Vatankhah-Varnoosfaderani, M.; Stadler, F.J. Supramolecular Interaction Controlled Diffusion Mechanism and Improved Mechanical Behavior of Hybrid Hydrogel Systems of Zwitterions and CNT. Macromolecules 2012, 45, 9804-9815. https://doi.org/10.1021/ma301366h. [CrossRef]
- Echeverria, C.; Mijangos, C. A Way to Predict Gold Nanoparticles/Polymer Hybrid Microgel Agglomeration Based on Rheological Studies. Nanomaterials (Basel) 2019, 9. https://doi.org/10.3390/nano9101499. [CrossRef]
- da Silva, M.A.; Calabrese, V.; Schmitt, J.; Celebi, D.; Scott, J.L.; Edler, K.J. Alcohol induced gelation of TEMPO-oxidized cellulose nanofibril dispersions. Soft Matter 2018, 14, 9243-9249. https://doi.org/10.1039/c8sm01815d. [CrossRef]
- Li, Q.; Xu, M.; Xie, J.; Su, E.; Wan, Z.; Sagis, L.M.C.; Yang, X. Large amplitude oscillatory shear (LAOS) for nonlinear rheological behavior of heterogeneous emulsion gels made from natural supramolecular gelators. Food Res Int 2021, 140, 110076. https://doi.org/10.1016/j.foodres.2020.110076. [CrossRef]
- Dimitriou, C.J.; Ewoldt, R.H.; McKinley, G.H. Describing and prescribing the constitutive response of yield stress fluids using large amplitude oscillatory shear stress (LAOStress). Journal of Rheology 2013, 57, 27-70. https://doi.org/10.1122/1.4754023. [CrossRef]
- Hashmi, S.; GhavamiNejad, A.; Obiweluozor, F.O.; Vatankhah-Varnoosfaderani, M.; Stadler, F.J. Correction to Supramolecular Interaction Controlled Diffusion Mechanism and Improved Mechanical Behavior of Hybrid Hydrogel Systems of Zwitterions and CNT. Macromolecules 2014, 47, 7251-7251. https://doi.org/10.1021/ma501981v. [CrossRef]
- Vatankhah-Varnoosfaderani, M.; GhavamiNejad, A.; Hashmi, S.; Stadler, F.J. Hydrogen bonding in aprotic solvents, a new strategy for gelation of bioinspired catecholic copolymers with N-isopropylamide. Macromol Rapid Commun 2015, 36, 447-452. https://doi.org/10.1002/marc.201400501. [CrossRef]
- Hashmi, S.; Vatankhah-Varnoosfaderani, M.; GhavamiNejad, A.; Obiweluozor, F.O.; Du, B.; Stadler, F.J. Self-associations and temperature dependence of aqueous solutions of zwitterionically modified N-isopropylacrylamide copolymers. Rheol Acta 2015, 54, 501-516. https://doi.org/10.1007/s00397-015-0837-z. [CrossRef]
- GhavamiNejad, A.; Hashmi, S.; Vatankhah-Varnoosfaderani, M.; Stadler, F.J. Effect of H2O and reduced graphene oxide on the structure and rheology of self-healing, stimuli responsive catecholic gels. Rheologica Acta 2016, 55, 163-176. https://doi.org/10.1007/s00397-015-0906-3. [CrossRef]
- Stadler, F.J.; Chun, Y.S.; Han, J.H.; Lee, E.; Park, S.H.; Yang, C.B.; Choi, C. Deriving comprehensive structural information on long-chain branched polyethylenes from analysis of thermo-rheological complexity. Polymer 2016, 104, 179-192. https://doi.org/10.1016/j.polymer.2016.07.084. [CrossRef]
- Zhang, Y.; Lu, Y.; Zhang, R.; Gao, Y.; Mao, L. Novel high internal phase emulsions with gelled oil phase: Preparation, characterization and stability evaluation. Food Hydrocolloid 2021, 121. https://doi.org/10.1016/j.foodhyd.2021.106995. [CrossRef]
- Du, L.; Biswas, C.S.; Wu, Y.; GhavamiNejad, A.; Stadler, F.J. Small and large amplitude oscillatory shear behavior of supramolecular gels based on dopamine-boronic acid interactions. J Rheol 2019, 63, 391-404. https://doi.org/10.1122/1.5068709. [CrossRef]
- Ji, S.H.; Lee, D.; Yun, J.S. Experimental and theoretical investigations of the rheological and electrical behavior of nanocomposites with universal percolation networks. Composites Part B: Engineering 2021, 225. https://doi.org/10.1016/j.compositesb.2021.109317. [CrossRef]
- Rogers, S.A. A sequence of physical processes determined and quantified in LAOS: An instantaneous local 2D/3D approach. J Rheol 2012, 56, 1129-1151. https://doi.org/10.1122/1.4726083. [CrossRef]
- Du, L.; Namvari, M.; Stadler, F.J. Large amplitude oscillatory shear behavior of graphene derivative/polydimethylsiloxane nanocomposites. Rheologica Acta 2018, 57, 429-443. https://doi.org/10.1007/s00397-018-1087-7. [CrossRef]
- Du, L.; GhavamiNejad, A.; Yan, Z.C.; Biswas, C.S.; Stadler, F.J. Effect of a functional polymer on the rheology and microstructure of sodium alginate. Carbohydr Polym 2018, 199, 58-67. https://doi.org/10.1016/j.carbpol.2018.07.001. [CrossRef]
- Creton, C.; Ciccotti, M. Fracture and adhesion of soft materials: a review. Rep Prog Phys 2016, 79, 046601. https://doi.org/10.1088/0034-4885/79/4/046601. [CrossRef]
- Lim, H.T.; Ahn, K.H.; Hong, J.S.; Hyun, K. Nonlinear viscoelasticity of polymer nanocomposites under large amplitude oscillatory shear flow. J Rheol 2013, 57, 767-789. https://doi.org/10.1122/1.4795748. [CrossRef]
- Ewoldt, R.H.; Winter, P.; Maxey, J.; McKinley, G.H. Large amplitude oscillatory shear of pseudoplastic and elastoviscoplastic materials. Rheologica Acta 2009, 49, 191-212. https://doi.org/10.1007/s00397-009-0403-7. [CrossRef]
- Ewoldt, R.H.; McKinley, G.H. On secondary loops in LAOS via self-intersection of Lissajous–Bowditch curves. Rheologica Acta 2009, 49, 213-219. https://doi.org/10.1007/s00397-009-0408-2. [CrossRef]
- Du, L.; Ghavaminejad, A.; Vatankhah-Varnoosfaderani, M.; Stadler, F.J. Study of the Interactions of Zwitterions and Carbon Nanotubes by Nonlinear Rheology in an Aqueous Environment. Langmuir 2019, 35, 1964-1972. https://doi.org/10.1021/acs.langmuir.8b01778. [CrossRef]
- Qu, R.J.; Wang, Y.; Li, D.; Wang, L.J. Rheological behavior of nanocellulose gels at various calcium chloride concentrations. Carbohydr Polym 2021, 274, 118660. https://doi.org/10.1016/j.carbpol.2021.118660. [CrossRef]
- Feng, S.; Xing, J.-J.; Guo, X.-N.; Zhu, K.-X. Nonlinear rheological properties of Chinese cold skin noodle (liangpi) and wheat starch gels by large amplitude oscillatory shear (LAOS). Food Hydrocolloid 2023, 134. https://doi.org/10.1016/j.foodhyd.2022.108030. [CrossRef]
- Song, H.Y.; Park, S.Y.; Kim, S.; Youn, H.J.; Hyun, K. Linear and nonlinear oscillatory rheology of chemically pretreated and non-pretreated cellulose nanofiber suspensions. Carbohydr Polym 2022, 275, 118765. https://doi.org/10.1016/j.carbpol.2021.118765. [CrossRef]
- Wilhelm, M. Fourier-Transform Rheology. Macromolecular Materials and Engineering 2002, 287, 83-105. https://doi.org/10.1002/1439-2054(20020201)287:2<83::Aid-mame83>3.0.Co;2-b. [CrossRef]
- Song, Y.; Kim, B.; Park, J.D.; Lee, D. Probing metal-carboxylate interactions in cellulose nanofibrils-based hydrogels using nonlinear oscillatory rheology. Carbohydr Polym 2023, 300, 120262. https://doi.org/10.1016/j.carbpol.2022.120262. [CrossRef]
- Zhao, X.; Li, D.; Wang, L.J.; Wang, Y. Rheological properties and microstructure of a novel starch-based emulsion gel produced by one-step emulsion gelation: Effect of oil content. Carbohydr Polym 2022, 281, 119061. https://doi.org/10.1016/j.carbpol.2021.119061. [CrossRef]
- Yue, Y.; Wang, X.; Han, J.; Yu, L.; Chen, J.; Wu, Q.; Jiang, J. Effects of nanocellulose on sodium alginate/polyacrylamide hydrogel: Mechanical properties and adsorption-desorption capacities. Carbohydr Polym 2019, 206, 289-301. https://doi.org/10.1016/j.carbpol.2018.10.105. [CrossRef]
- Naseri, N.; Deepa, B.; Mathew, A.P.; Oksman, K.; Girandon, L. Nanocellulose-Based Interpenetrating Polymer Network (IPN) Hydrogels for Cartilage Applications. Biomacromolecules 2016, 17, 3714-3723. https://doi.org/10.1021/acs.biomac.6b01243. [CrossRef]
- Zou, X.; Kui, X.; Zhang, R.; Zhang, Y.; Wang, X.; Wu, Q.; Chen, T.; Sun, P. Viscoelasticity and Structures in Chemically and Physically Dual-Cross-Linked Hydrogels: Insights from Rheology and Proton Multiple-Quantum NMR Spectroscopy. Macromolecules 2017, 50, 9340-9352. https://doi.org/10.1021/acs.macromol.7b01854. [CrossRef]
- Sun, J.Y.; Zhao, X.; Illeperuma, W.R.; Chaudhuri, O.; Oh, K.H.; Mooney, D.J.; Vlassak, J.J.; Suo, Z. Highly stretchable and tough hydrogels. Nature 2012, 489, 133-136. https://doi.org/10.1038/nature11409. [CrossRef]
- Zhao, J.; Zhao, X.; Guo, B.; Ma, P.X. Multifunctional interpenetrating polymer network hydrogels based on methacrylated alginate for the delivery of small molecule drugs and sustained release of protein. Biomacromolecules 2014, 15, 3246-3252. https://doi.org/10.1021/bm5006257. [CrossRef]
- Zou, Z.; Zhang, B.; Nie, X.; Cheng, Y.; Hu, Z.; Liao, M.; Li, S. A sodium alginate-based sustained-release IPN hydrogel and its applications. Rsc Adv 2020, 10, 39722-39730. https://doi.org/10.1039/d0ra04316h. [CrossRef]
- Jafarigol, E.; Salehi, M.B.; Mortaheb, H.R. Synergetic effects of additives on structural properties of acrylamide-based hydrogel. J Disper Sci Technol 2020, 42, 910-919. https://doi.org/10.1080/01932691.2020.1721012. [CrossRef]
- Li, C.; Zhou, X.; Zhou, D.; Chen, F.; Shen, J.; Li, H.; Zhang, J.; Zhou, X. Ionic–Covalent Hybrid Tough Hydrogels Enabled by the in Situ Release of Metal Ions from Insoluble Salts or Alkalis. ACS Applied Polymer Materials 2019, 1, 3222-3226. https://doi.org/10.1021/acsapm.9b00960. [CrossRef]
- Yang, J.; Illeperuma, W.; Suo, Z. Inelasticity increases the critical strain for the onset of creases on hydrogels. Extreme Mechanics Letters 2020, 40. https://doi.org/10.1016/j.eml.2020.100966. [CrossRef]
- Hirayama, S.; Kurokawa, T.; Gong, J.P. Non-linear rheological study of hydrogel sliding friction in water and concentrated hyaluronan solution. Tribol Int 2020, 147. https://doi.org/10.1016/j.triboint.2020.106270. [CrossRef]
- Li, X.; Luo, F.; Sun, T.L.; Cui, K.; Watanabe, R.; Nakajima, T.; Gong, J.P. Effect of Salt on Dynamic Mechanical Behaviors of Polyampholyte Hydrogels. Macromolecules 2022, 56, 535-544. https://doi.org/10.1021/acs.macromol.2c02003. [CrossRef]
- Wang, Y.; Nian, G.; Kim, J.; Suo, Z. Polyacrylamide hydrogels. VI. Synthesis-property relation. J Mech Phys Solids 2023, 170. https://doi.org/10.1016/j.jmps.2022.105099. [CrossRef]
- Kim, J.; Yin, T.; Suo, Z. Polyacrylamide hydrogels. V. Some strands in a polymer network bear loads, but all strands contribute to swelling. J Mech Phys Solids 2022, 168. https://doi.org/10.1016/j.jmps.2022.105017. [CrossRef]
- Hassan, S.; Kim, J.; suo, Z. Polyacrylamide hydrogels. IV. Near-perfect elasticity and rate-dependent toughness. J Mech Phys Solids 2022, 158. https://doi.org/10.1016/j.jmps.2021.104675. [CrossRef]
- Wang, Y.; Yin, T.; Suo, Z. Polyacrylamide hydrogels. III. Lap shear and peel. J Mech Phys Solids 2021, 150. https://doi.org/10.1016/j.jmps.2021.104348. [CrossRef]
- Liu, J.; Yang, C.; Yin, T.; Wang, Z.; Qu, S.; Suo, Z. Polyacrylamide hydrogels. II. elastic dissipater. J Mech Phys Solids 2019, 133. https://doi.org/10.1016/j.jmps.2019.103737. [CrossRef]
- Yang, C.; Yin, T.; Suo, Z. Polyacrylamide hydrogels. I. Network imperfection. J Mech Phys Solids 2019, 131, 43-55. https://doi.org/10.1016/j.jmps.2019.06.018. [CrossRef]
- Li, X.; Wu, C.; Yang, Q.; Long, S.; Wu, C. Low-velocity super-lubrication of sodium-alginate/polyacrylamide ionic-covalent hybrid double-network hydrogels. Soft Matter 2015, 11, 3022-3033. https://doi.org/10.1039/c4sm02783c. [CrossRef]
- Stadler, F.J.; Cui, S.; Hashmi, S.; Handschuh-Wang, S.; Li, W.; Wang, S.; Yan, Z.-C.; Zhu, G. Multiple interval thixotropic test (miTT)—an advanced tool for the rheological characterization of emulsions and other colloidal systems. Rheologica Acta 2022, 61, 229-242. https://doi.org/10.1007/s00397-021-01323-y. [CrossRef]
- Zad Bagher Seighalani, F.; McMahon, D.J.; Sharma, P. Determination of critical gel-sol transition point of Highly Concentrated Micellar Casein Concentrate using multiple waveform rheological technique. Food Hydrocolloid 2021, 120. https://doi.org/10.1016/j.foodhyd.2021.106886. [CrossRef]
- Hyun, K.; Wilhelm, M. Establishing a New Mechanical Nonlinear Coefficient Q from FT-Rheology: First Investigation of Entangled Linear and Comb Polymer Model Systems. Macromolecules 2008, 42, 411-422. https://doi.org/10.1021/ma8017266. [CrossRef]
- Hyun, K.; Wilhelm, M.; Klein, C.O.; Cho, K.S.; Nam, J.G.; Ahn, K.H.; Lee, S.J.; Ewoldt, R.H.; McKinley, G.H. A review of nonlinear oscillatory shear tests: Analysis and application of large amplitude oscillatory shear (LAOS). Prog Polym Sci 2011, 36, 1697-1753. https://doi.org/10.1016/j.progpolymsci.2011.02.002. [CrossRef]
- Rodell, C.B.; Dusaj, N.N.; Highley, C.B.; Burdick, J.A. Injectable and Cytocompatible Tough Double-Network Hydrogels through Tandem Supramolecular and Covalent Crosslinking. Advanced materials 2016, 28, 8419-8424. https://doi.org/10.1002/adma.201602268. [CrossRef]
- Fang, L.; Zhang, J.; Wang, W.; Zhang, Y.; Chen, F.; Zhou, J.; Chen, F.; Li, R.; Zhou, X.; Xie, Z. Stretchable, Healable, and Degradable Soft Ionic Microdevices Based on Multifunctional Soaking-Toughened Dual-Dynamic-Network Organohydrogel Electrolytes. ACS applied materials & interfaces 2020, 12, 56393-56402. https://doi.org/10.1021/acsami.0c14472. [CrossRef]
- Mu, Q.; Zhang, Q.; Yu, W.; Su, M.; Cai, Z.; Cui, K.; Ye, Y.; Liu, X.; Deng, L.; Chen, B.; et al. Robust Multiscale-Oriented Thermoresponsive Fibrous Hydrogels with Rapid Self-Recovery and Ultrafast Response Underwater. ACS applied materials & interfaces 2020, 12, 33152-33162. https://doi.org/10.1021/acsami.0c06164. [CrossRef]
- Li, X.; Wang, H.; Li, D.; Long, S.; Zhang, G.; Wu, Z. Dual Ionically Cross-linked Double-Network Hydrogels with High Strength, Toughness, Swelling Resistance, and Improved 3D Printing Processability. ACS applied materials & interfaces 2018, 10, 31198-31207. https://doi.org/10.1021/acsami.8b13038. [CrossRef]
- Zheng, S.Y.; Ding, H.; Qian, J.; Yin, J.; Wu, Z.L.; Song, Y.; Zheng, Q. Metal-Coordination Complexes Mediated Physical Hydrogels with High Toughness, Stick–Slip Tearing Behavior, and Good Processability. Macromolecules 2016, 49, 9637-9646. https://doi.org/10.1021/acs.macromol.6b02150. [CrossRef]
- Yue, Y.; Han, J.; Han, G.; French, A.D.; Qi, Y.; Wu, Q. Cellulose nanofibers reinforced sodium alginate-polyvinyl alcohol hydrogels: Core-shell structure formation and property characterization. Carbohydr Polym 2016, 147, 155-164. https://doi.org/10.1016/j.carbpol.2016.04.005. [CrossRef]
- Yang, Y.; Liu, X.; Xue, Y.; Xue, C.; Zhao, Y. The process of heat-induced gelation in Litopenaeus vannamei. Food Hydrocolloid 2020, 98. https://doi.org/10.1016/j.foodhyd.2019.105260. [CrossRef]
- Gabriel, C.; Kaschta, J.; Münstedt, H. Influence of molecular structure on rheological properties of polyethylenes I. Creep recovery measurements in shear. Rheologica Acta 1998, 37, 7-20.
- Gabriel, C.; Münstedt, H. Creep recovery behavior of metallocene linear low-density polyethylenes. Rheologica Acta 1999, 38, 393-403.
- Ferry, J.D. Viscoelastic Properties of Polymers; John Wiley and Sons: New York, 1980.
- Tang, G.; Du, B.; Stadler, F.J. A novel approach to analyze the rheological properties of hydrogels with network structure simulation. Journal of Polymer Research 2018, 25, 4. https://doi.org/10.1007/s10965-017-1352-y. [CrossRef]
- Tang, S.C.; Olsen, B.D. Relaxation Processes in Supramolecular Metallogels Based on Histidine-Nickel Coordination Bonds. Macromolecules 2016, 49, 9163-9175. https://doi.org/10.1021/acs.macromol.6b01618. [CrossRef]
- Zhong, M.; Wang, R.; Kawamoto, K.; Olsen, B.D.; Johnson, J.A. Quantifying the impact of molecular defects on polymer network elasticity. Science 2016, 353, 1264-1268. https://doi.org/10.1126/science.aag0184. [CrossRef]
- Wang, R.; Alexander-Katz, A.; Johnson, J.A.; Olsen, B.D. Universal Cyclic Topology in Polymer Networks. Physical review letters 2016, 116, 188302. https://doi.org/10.1103/PhysRevLett.116.188302. [CrossRef]
- Vatankhah-Varnoosfaderani, M.; Hashmi, S.; GhavamiNejad, A.; Stadler, F.J. Rapid self-healing and triple stimuli responsiveness of a supramolecular polymer gel based on boron–catechol interactions in a novel water-soluble mussel-inspired copolymer. Polym Chem-Uk 2014, 5, 512-523. https://doi.org/10.1039/c3py00788j. [CrossRef]
- Bi, C.-h.; Li, D.; Wang, L.-j.; Gao, F.; Adhikari, B. Effect of high shear homogenization on rheology, microstructure and fractal dimension of acid-induced SPI gels. J Food Eng 2014, 126, 48-55. https://doi.org/10.1016/j.jfoodeng.2013.10.040. [CrossRef]
- Acar, H.; Kurt, A. Purified salep glucomannan synergistically interacted with xanthan gum: Rheological and textural studies on a novel pH-/thermo-sensitive hydrogel. Food Hydrocolloid 2020, 101. https://doi.org/10.1016/j.foodhyd.2019.105463. [CrossRef]
- Alves, L.; Ferraz, E.; Lourenco, A.F.; Ferreira, P.J.; Rasteiro, M.G.; Gamelas, J.A.F. Tuning rheology and aggregation behaviour of TEMPO-oxidised cellulose nanofibrils aqueous suspensions by addition of different acids. Carbohydr Polym 2020, 237, 116109. https://doi.org/10.1016/j.carbpol.2020.116109. [CrossRef]
- Khalesi, H.; Sun, C.; He, J.; Lu, W.; Fang, Y. The role of amyloid fibrils in the modification of whey protein isolate gels with the form of stranded and particulate microstructures. Food Res Int 2021, 140, 109856. https://doi.org/10.1016/j.foodres.2020.109856. [CrossRef]
- Gahrooee, T.R.; Abbasi Moud, A.; Danesh, M.; Hatzikiriakos, S.G. Rheological characterization of CNC-CTAB network below and above critical micelle concentration (CMC). Carbohydr Polym 2021, 257, 117552. https://doi.org/10.1016/j.carbpol.2020.117552. [CrossRef]
- Goudoulas, T.B.; Germann, N. Nonlinear rheological behavior of gelatin gels: In situ gels and individual layers. J Colloid Interface Sci 2019, 553, 746-757. https://doi.org/10.1016/j.jcis.2019.06.060. [CrossRef]
- Draget, K.I. Alginates. In Handbook of Hydrocolloids; 2009; pp. 807-828.
- Leibler, L.; Rubinstein, M.; Colby, R.H. Dynamics of reversible networks. Macromolecules 2002, 24, 4701-4707. https://doi.org/10.1021/ma00016a034. [CrossRef]
- Seidel, U.; Stadler, R.; Fuller, G.G. Relaxation Dynamics of Bidisperse Temporary Networks. Macromolecules 2002, 27, 2066-2072. https://doi.org/10.1021/ma00086a014. [CrossRef]
- Klucker, R.; Candau, F.; Schosseler, F. Transient Behavior of Associating Copolymers in a Shear Flow. Macromolecules 2002, 28, 6416-6422. https://doi.org/10.1021/ma00123a005. [CrossRef]
| Sample Name | AM (wt%) | SA (wt%) | MBAA (wt%) | TEMED, (wt%) | KPS (wt%) | X (mg/ml) = C(Ca2+) |
|---|---|---|---|---|---|---|
| S1-X | 16.67 | 1.667 | 0.01 | 0.167 | 0.067 | 0,5,10,20,30,40,60,80 |
| S2-X | 16.67 | 2.667 | 0.01 | 0.167 | 0.067 | 0,5,10,20,30,40,60,80 |
| Interval 1 | Interval 2 | Interval 3 | Interval 4 | Interval 5 | |
|---|---|---|---|---|---|
| (%) |
10 100.01 |
30 300.01 |
100 1000.01 |
300 0.01 |
1000 10000.01 |
| (rad/s) | 1 | 1 | 1 | 1 | 1 |
Disclaimer/Publisher’s Note: The statements, opinions and data contained in all publications are solely those of the individual author(s) and contributor(s) and not of MDPI and/or the editor(s). MDPI and/or the editor(s) disclaim responsibility for any injury to people or property resulting from any ideas, methods, instructions or products referred to in the content. |
© 2023 by the authors. Licensee MDPI, Basel, Switzerland. This article is an open access article distributed under the terms and conditions of the Creative Commons Attribution (CC BY) license (http://creativecommons.org/licenses/by/4.0/).


