Preprint
Article

Investigation the Effect of Design Parameters on Air Tightness with Examples of Balikesir Houses

Altmetrics

Downloads

143

Views

53

Comments

0

Submitted:

01 June 2023

Posted:

01 June 2023

You are already at the latest version

Alerts
Abstract
Energy savings have been a major driver for improving building airtightness in the last period. Air infiltration has an important influence on energy efficiency and significantly influences the indoor air quality and pollutant distribution in residential buildings. Pressure difference lead to air permeability through the building envelope via cracks and un-controlled air leaks, which increase not only energy consumption, also cause noise from the outside and entering particles harmful to human health. Therefore, the issue of airtightness of the building envelope has been included in the standards and regulations. Building airtightness is influenced by various design parameters such as window/wall ratio, type of joinery, size of usage area, wall material and the insulation application also the quality of workmanship. In this study, the airtightness performance of 43 different residentials in Balıkesir was deter-mined by the BlowerDoor test measurement and in the context of airtightness the architectural design parameters impact was investigated. The air exchange rate (n50) values of 43 residences were obtained between 1.94 - 49.02 h-1 and compared with the existing standards. In addition, “usage area” was determined as the most effective parameter, followed by the size of the usage area, the transparency rate of the facades, the wall material type and the insulation status.
Keywords: 
Subject: Engineering  -   Architecture, Building and Construction

1. Introduction

In energy consumption, the building sector has an important share in Turkey as well as all over the world, and the building envelope is one of the important parameters affecting building energy consumption. Cracks in the building envelope and uncontrolled air leaks from joints can cause problems in both building energy efficiency and indoor comfort. Uncontrolled air leaks and leaks in the building envelope increase not only energy consumption, also cause noise from the outside environment and particles harmful to human health to enter the indoor environment, which can adversely affect the health of the user. In the context of energy efficiency, the subject of building envelope sealing has been included in the standards and regulations in European countries; Air-tightness standards such as “Passive house” and “TNI 730 330 Standard” have been developed. In Turkey, yet there is no sufficient standard for the airtightness performance of buildings, only airtightness limit values are defined in the TS 825 Standard for Thermal Insulation Rules in Buildings. In the sealing of the building envelope in addition to the architectural design parameters such as the window/wall ratio of the building, the type of joinery, the size of the usage area, the wall material and the insulation application, the quality of workmanships influence.
Energy savings and environmental protection are essential for achieving sustainable development goals. Because energy use in the building sector represents a very large part of the total energy use and greenhouse gas emissions worldwide, many countries have developed ambitious policies to improve energy efficiency and conservation in that sector. [1]. The building sector is responsible for one-third of greenhouse gas emissions in the world [2]. According to International Energy Agency (IEA), the building sector consumed 30% of global energy in 2020 whereas the share of the residential building energy con-sumption is the highest i.e., 28% of global energy [3] 1 --- 2 2---3.
On the other hand, the European Buildings Energy Performance Directive (EPBD) is committed to achieving a highly efficient and carbon-free building stock, stating that ap-proximately 50% of the final energy consumption is used for heating and cooling in buildings [4]. The building envelope directly affects the amount of consumed energy to provide indoor comfort conditions therefore the construction industry has an important potential in terms of energy efficiency. Nearly half of the energy loss occurs through the building envelope due to heat transfer to/for the surroundings [5]. Therefore, it is aimed to reach the optimum building envelope design. The comfort conditions provided by ventilation in buildings can be provided in a controlled manner by mechanical or natural means. In addition to controlled ventilation, uncontrolled air leaks may occur as a result of the pressure difference in the building envelope. Building envelope airtightness, which is the determining factor in air leakage inside or outside the building facade, can be defined as resistance to air flow passing through the building envelope [6]. Air leaks play an im-portant role in the energy consumption of houses, and increasing air leaks in buildings also increase heat losses [6,7]. For this reason, many European countries have already es-tablished standards aimed at limiting energy consumption through the building enve-lope. Czech Republic, Estonia, France, Germany, Ireland and the United Kingdom identi-fied the airtightness requirements for structures in energy performance regulations or standards [8]. Standards and regulations take into account the limitations of building en-velope airtightness, and specifically the Spanish Building Regulation (CTE), which came into force in Spain in 2006, recommends the implementation of controlled ventilation sys-tems in new and renovated buildings to ensure adequate indoor air quality [9]. According to the TS 825 Standard of Thermal Insulation Rules in Buildings which standard valid on Turkey, the limit values of the airtightness level of the building envelopes as seen in Table 1 classified in two categories as one-flat or multi-flats on floor in buildings.
S. J. Emmerich et al., stated that air leakage in the building envelope in houses with light frame structural systems in USA increase the heating load by 30-40% and the cooling load of by 10-15% [11]. In Athens n50 value measured by BDT of 20 houses in 2008 was found 10 h-1 which put forward low airtightness performance of the buildings [12]. In a study conducted in Italy in 2012, the average air change rate of n50 of buildings built be-fore 1970 was measured between 4.6 h-1and 23.3 h-1, and concluded that the highest values were obtained compared to new buildings [13]. In Lithuania, the BDT was carried out in 27 residences and the average airtightness value of buildings found in energy efficiency class A 0.6 h-1. The n50 values of the buildings in the B and C efficiency classes were measured as 3 h-1 on average, and determined that the airtightness was insufficient [7]. The airtightness measurements commonly carry out with BDT or Pulse test methods; Zheng et al. in their study was found the difference between the results of BDT and Pulse test as 1.6% [14]. Also, Hsu et al. mentioned that there is a relationship between airtight-ness and energy consumption; on the other hand, they stated that the airtightness results obtained from two methods, Pulse technique and BDT, were observed in parallel. In their study using Pulse and BDT in 2022, determined that the difference obtained as a result of the two methods under 50 Pa pressure was 0.8% [15]. Many studies have been carried out throughout Europe on building envelope sealing. However, its stated that the data col-lected in these studies do not represent the existing building stock [9]. Air leakage meas-urements are mostly made to evaluate building design and construction quality, and countries such as England, Belgium, Czech Republic, Estonia and France have created a database to keep track of the measurement results [8]. According to the records from these databases, the average building envelope air leakage rate (n50) in Europe is around 7.50 h-1, while in other studies in Mediterranean countries, the average of air leakage rate is stated as around 7.0 h-1 [12,13]. Although many different factors are responsible for building envelope air leakage and vary in different countries, the most important parameters affecting airtightness are stated as building type, structure and ventilation method [16,17]. G. Hong et al. (2018) has investigated the impact of building envelope components focusing on the thermal performance including windows, interior/exterior walls and roofs. As a result, appointed that air leakage rates (ACH50) were varied between 0.7 and 1.0 h-1 when all opening closed [18]. Additional parameters affecting airtightness include the number of floors, the area of the building envelope, the size of the usable area, the in-ternal volume of the building, the wall material, the heat insulation condition, the type of joinery and the year of construction [19]. Vinha et al. had concluded that the construction method and existing of insulation materials were important on the air exchange rate (n50) in wooden frame houses [16]. In Srba's research in Helsinki, buildings are divided into the sections which are called as low-energy houses with natural or combined ventilation (BDT 4.5), low-energy houses with heat recovery mechanical ventilation (BDT 1) and passive houses with heat and mechanical ventilation, especially buildings with low energy heating (BDT 0, 6). The n50 value of the BDT 4.5 group houses was found 1.48 h-1, the BDT 1 group houses had an n50 value of 1.22 h-1, while the n50 value of the BDT 0.6 group houses was 0.43 h-1 [20]. M. Prignon (2021) stated that the laboratory studies and airtight-ness tests were carried out to investigate the effects of building components on airtight-ness. As result he emphasized that structural components related to airtightness perfor-mance were classified and 93.5% of air leaks were detected, but it was headlight that these air leaks constituted 18% of the total airtightness rate [17]. On the other hand, Domhagen et al. conducted that the humidity in the environment affect both the airtightness perfor-mance and the energy performance of the house. [21]. Besides, study of Paukštys et al. in-dicated a hollow clay unit wall caused 7-11% less airtightness compared to a sand-lime block Wall unit [22]. It is known that the construction year of the building also has an ef-fect on the airtightness performance. Mortensen et al. (2017) determined the air exchange rate (n50 values) of the 16 detached houses which was built 1880-2007 in Denmark. The n50 values according to years found 1.8-4.9 h-1 (1880-1999) and 1.1-1.3 h-1 (2005-2007) and for houses with old construction better than expected [23]. In another study the re-search findings had appeared to support the results in Denmark. In the study [24], which was carried out in 170 detached houses and 56 flats in Finland, the values for the wooden frame structure were found to be slightly more unfavorable for both reinforced concrete structure and conventional system; while the values for light steel frame structures were 6.2 ± 0.2 m3/m2.h which quite high.
In addition to these parameters, workmanship also significantly affects the airtight-ness performance. M. Colijn and et al. (2017) the standard deviation of the BlowerDoor air exchange rates was calculated as 1.137 in measurements made at 44 single-family dwell-ings built by different construction teams of a contractor in the Netherlands. As a result, the attention is drawn to the effect of the quality of workmanship of different construction teams on airtightness belonging to the same company [25].
Yang et al. (2021) examined 30 detached houses newly built were periodically for 3 years and the findings were recorded. As result of measurements was observed that air leaks increased by 18% in the first year and remained constant in the second and third years [26]. Hong's study in South Korea shows that while the n50 values of newly built residential buildings were in the range of 3.6-4.5 h-1 which 10.6-22.2 h-1 in buildings built in 1990s. The results show that the airtightness performance increased approximately 3-4 times compared to build 30 years ago [27]. In this study, BDT measurements were made in 44 residences, 38 flats in the city center and 6 residences in the rural areas to re-veal the design parameters that affect the building envelope performance that determines the indoor quality and energy consumption. An overview of the building envelope air-tightness studies in the literature is given in Table 2.

2. Materials and Methods

The method of the study is summarized in Figure 3. In the study, literature review on the subject was made in line with the purpose, and previous studies on the subject were examined. In the literature review, the information in the sources related to the subject was partially interpreted and compared. The practical equivalents of theoretical knowledge have been observed in the field study in the real environment. Before the fieldwork, a building inspection form was developed in order to determine the characteristics of the buildings to be examined and the air leakage problems. In this review form, features such as the construction year of the building, transparency ratio of facades, location, type of wall material, window/door joinery type, insulation status is included.
In the field study, the air tightness values of the houses were determined with the BlowerDoor Test and the results were compared with the TS 825 standard, TNI 730330 and Passive House Standards applied in various European countries. In addition, the effects of parameters such as the construction year of the building, the size of the usage area, the wall material, transparency ratio of facades, the joinery material and the insulation condition, which are effective in air tightness, on air tightness were examined through examples, and the effect order of these parameters was determined by analysis of variance (ANOVA) and Post Hoc methods.

2.1. Climate Conditions

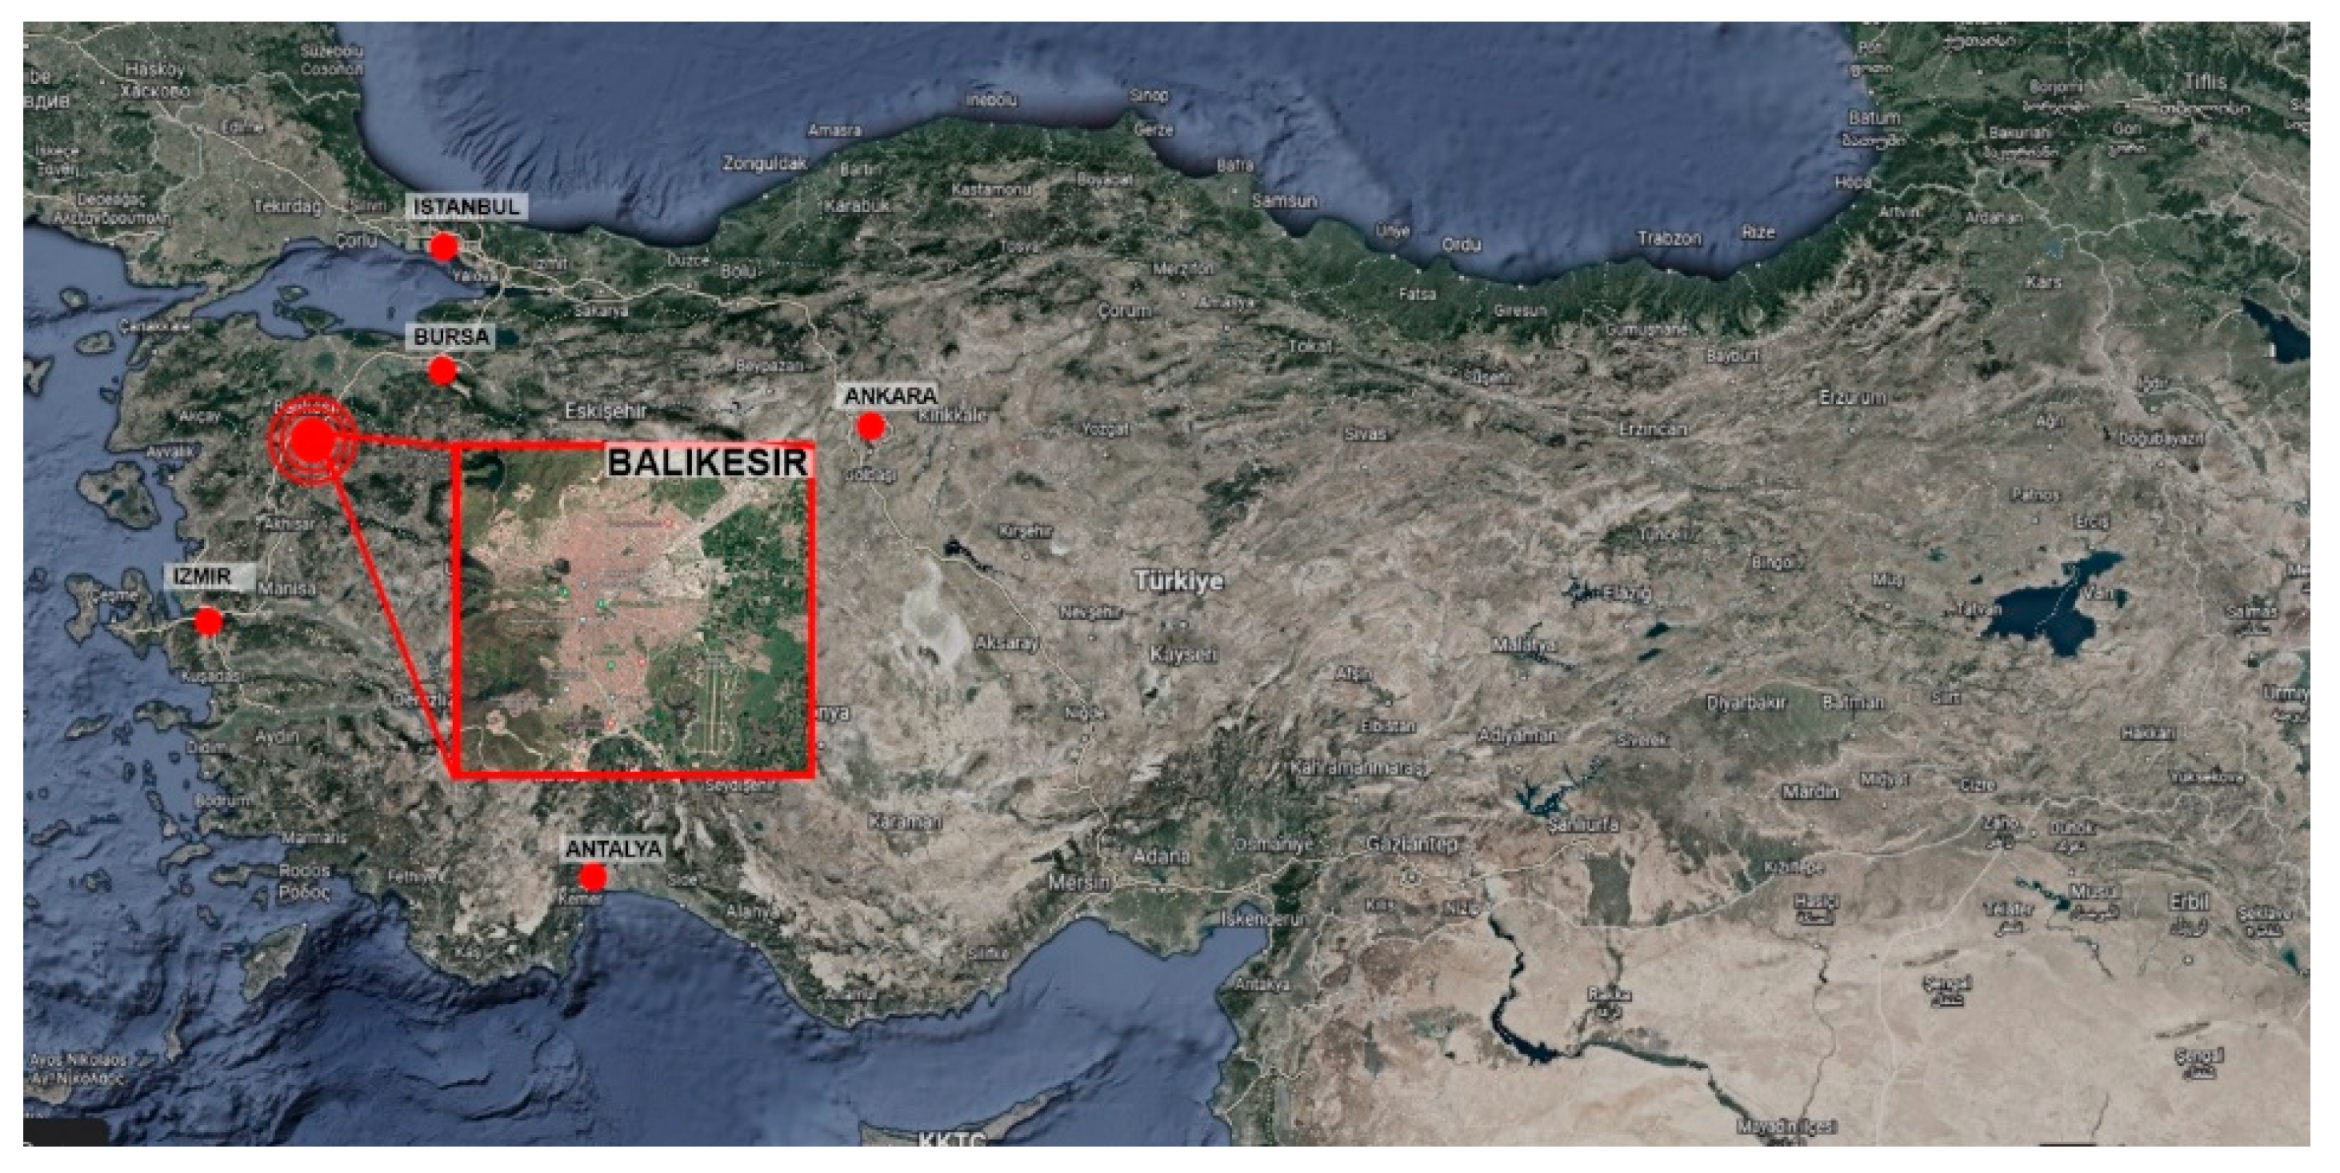
There are many different climate types in Turkey and according to Geiger it has been revealed that there are 13 different climate zones. In this study tested residences are located in Balikesir province in the west of the country (Figure 1). This region has a very dry and hot summer climate (Csa) according to Köppen-Geiger climate types and according to TS 825 (Thermal Insulation Rules in Buildings, Turkish Standard) take part in the 2nd degree-days region of Turkey.
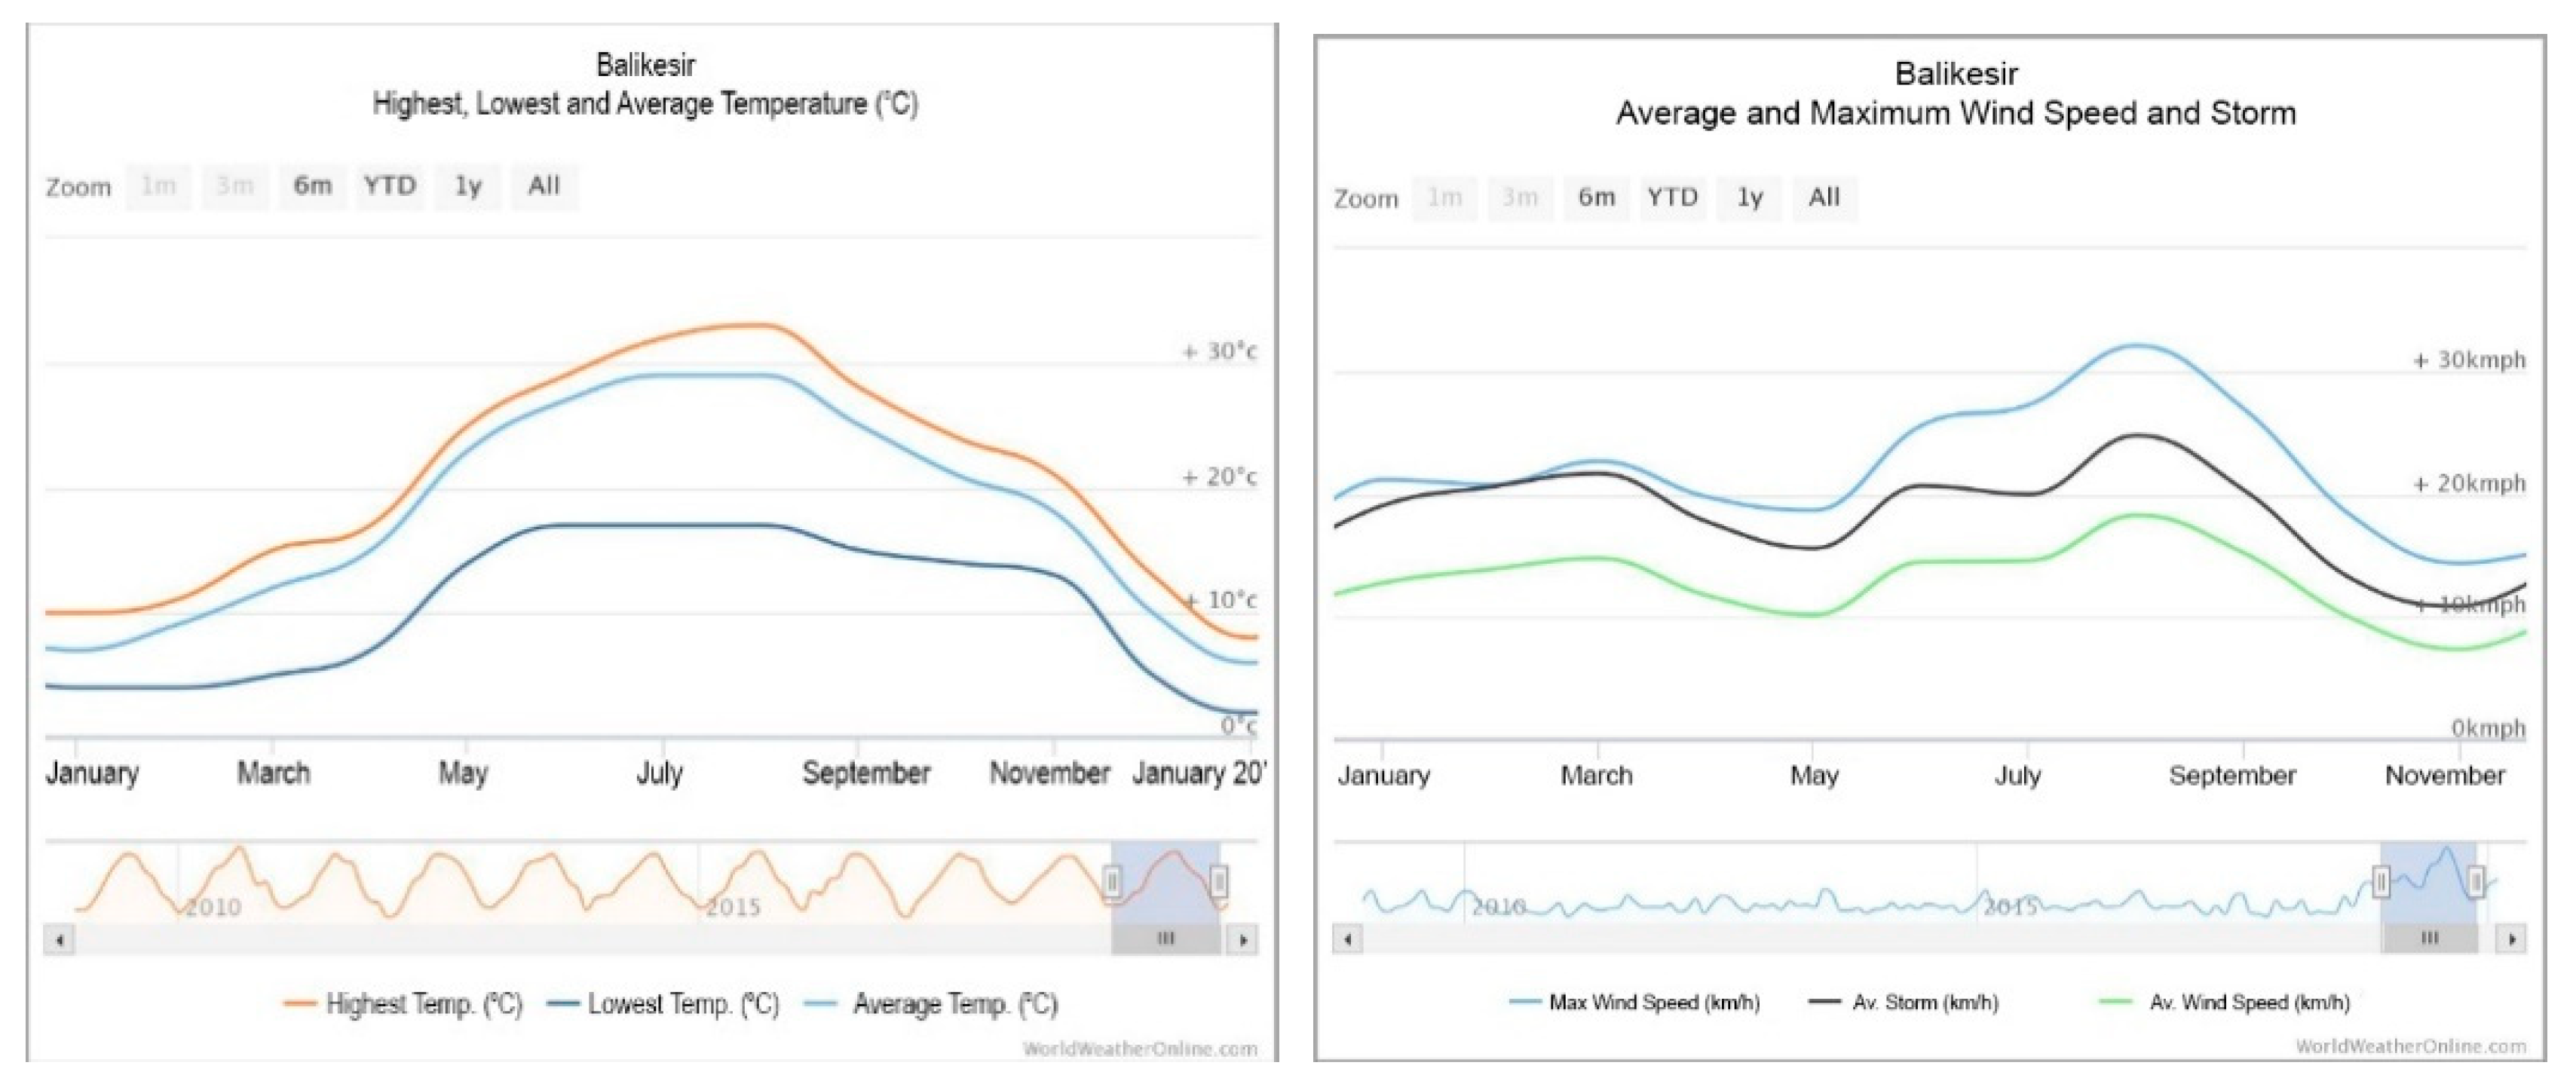
The lowest and highest temperatures of Balıkesir province in January are 4.8 oC and 24.8 oC in July, according to the data between 1937-2017. The average temperature of Balıkesir is 14.5°C, and the highest temperature measured to date is 43.7 °C and the lowest temperature is -21.8 °C [36]. The temperature and wind data of Balıkesir for the year 2019 are shown in Figure 2.
As can be seen in the figure, while the monthly average highest temperature value is 29 oC for the months of July and August, December and January have the lowest monthly average temperature value with 8 oC [37].

2.2. Case Buildings and Evaluations

For the field study, 44 residences located in Balikesir city center and rural areas were randomly selected. BlowerDoor Test measurements were made between November 2019 and February 2020 for 38 dwellings in the city center and 6 detached houses in the countryside in Balıkesir province.
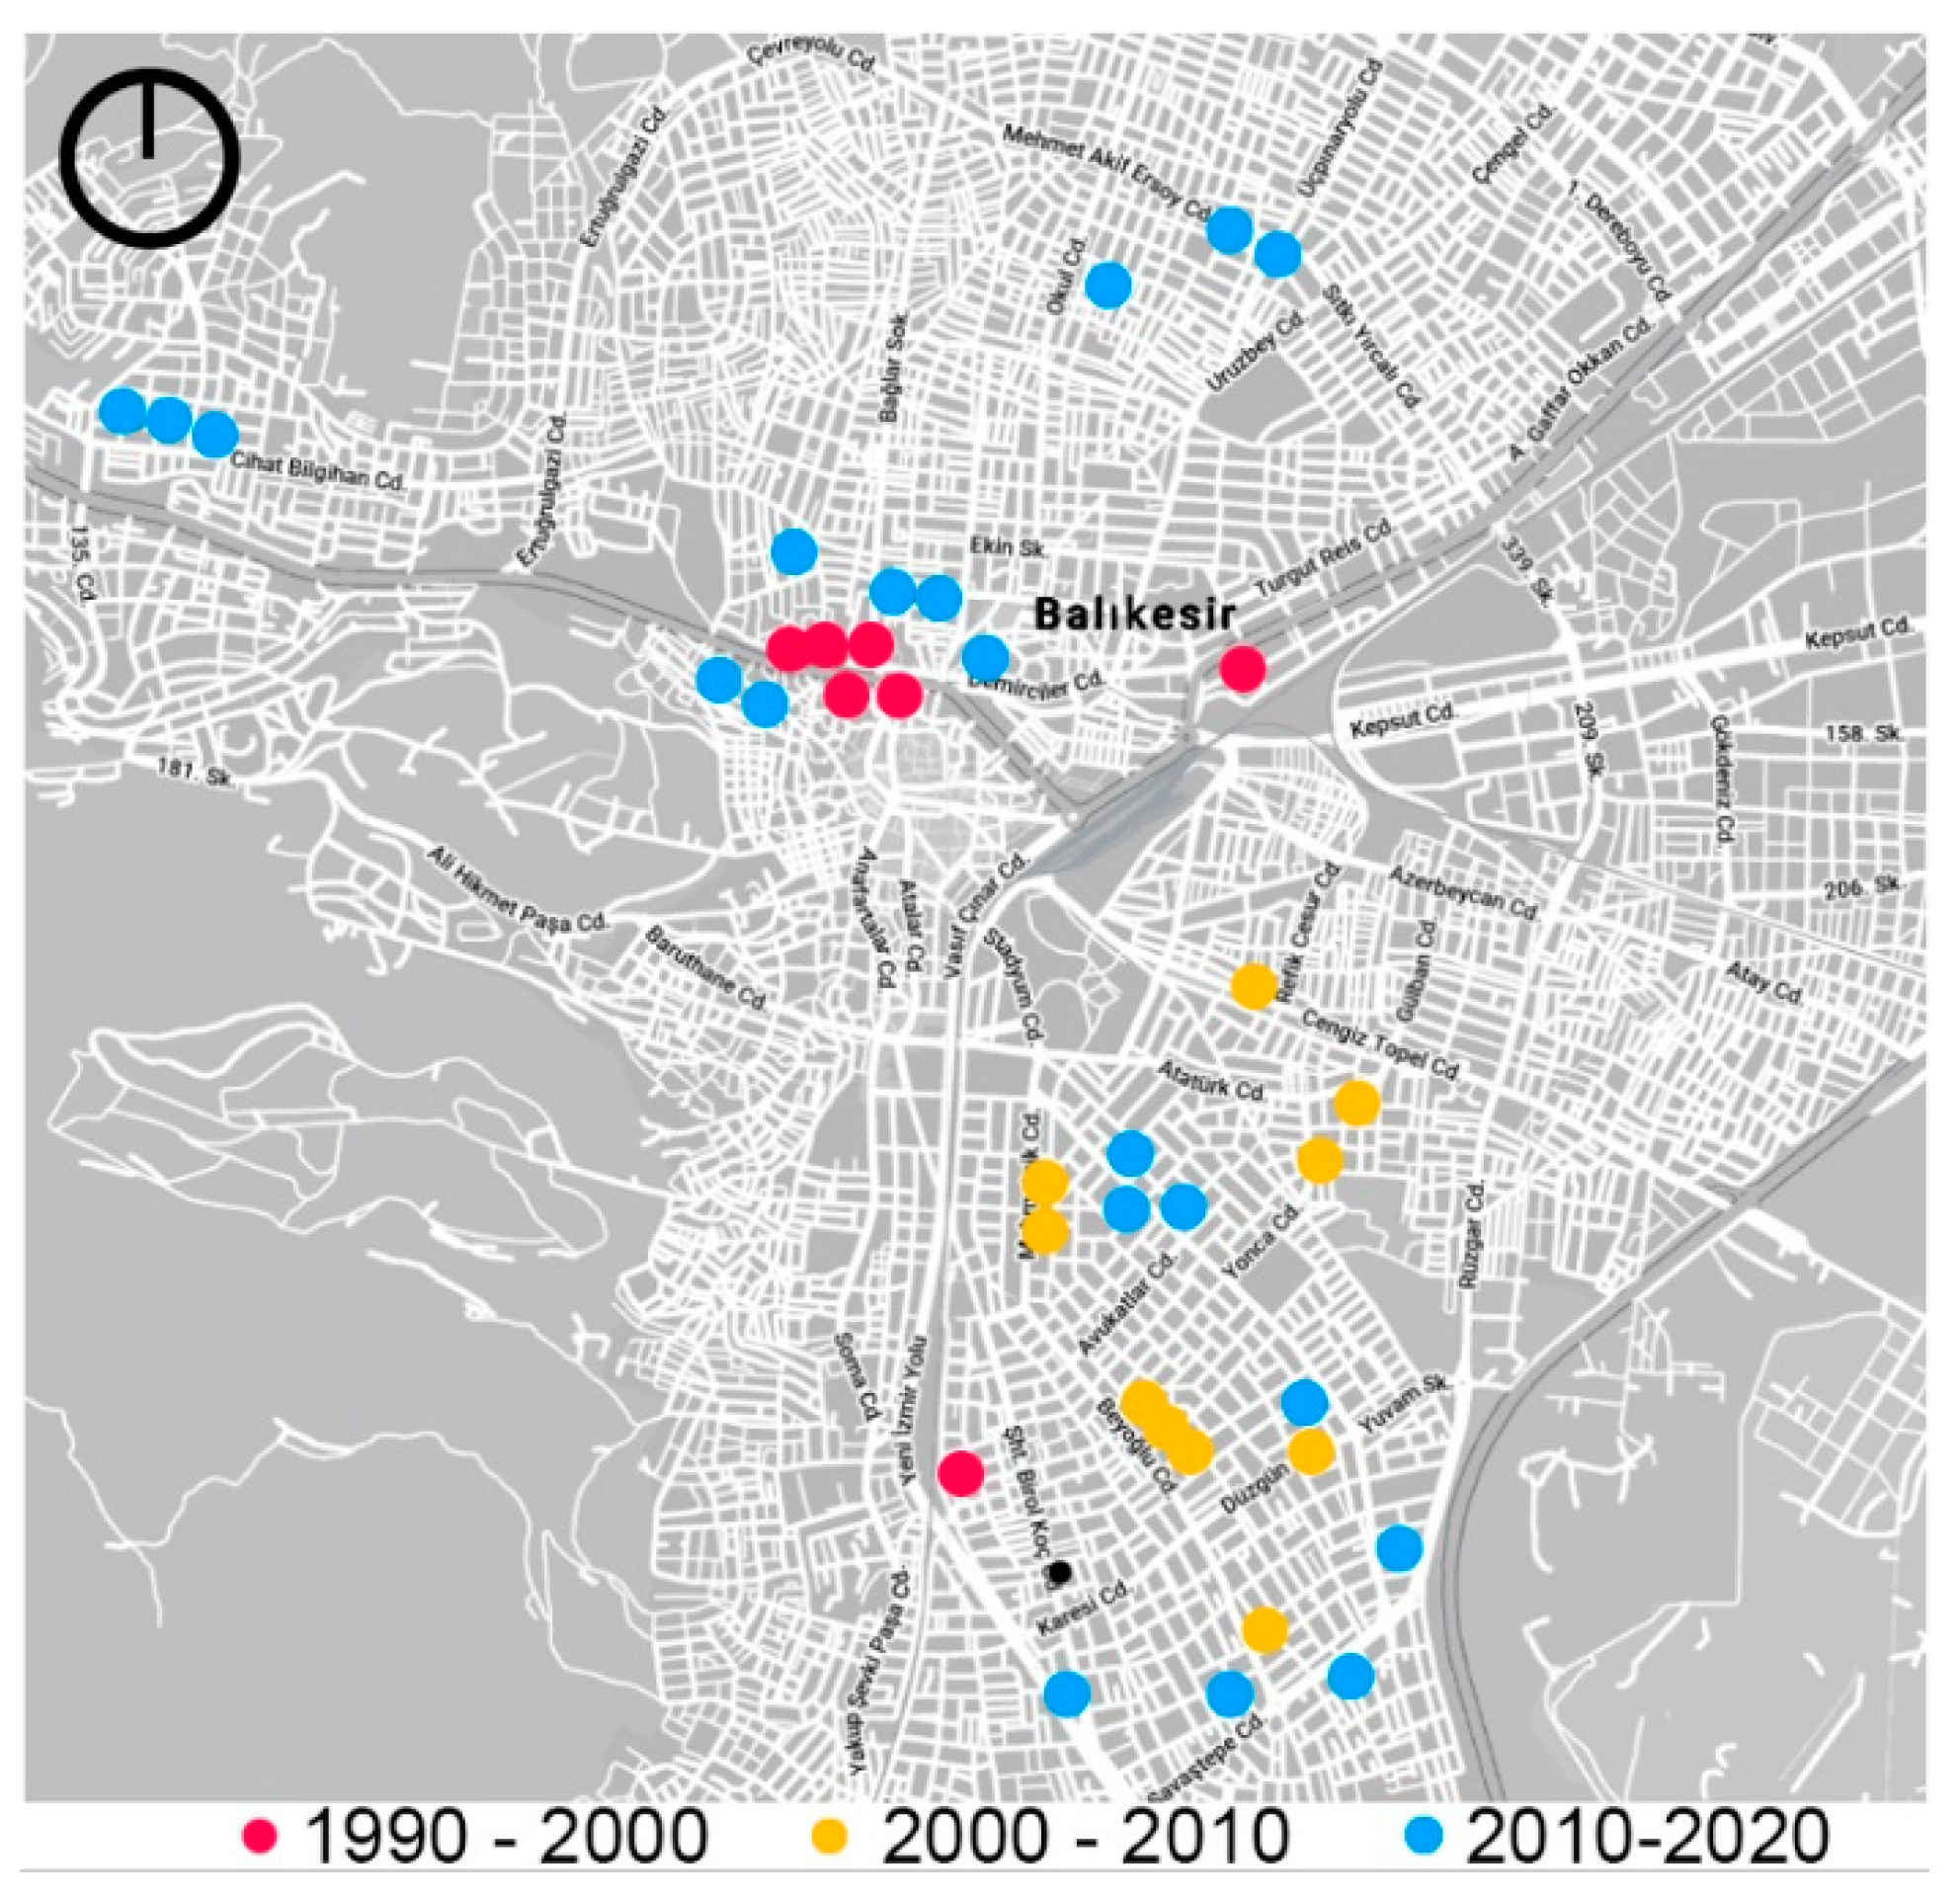
As it is known, building typology and climate data are effective in air leaks that occur in the building envelope. For this reason, wind, which is one of the external environmental factors, is one of the basic elements associated with airtightness [6]. Due to the density of buildings in rural areas, houses are more exposed to wind effects than in the city center. Experimental study was conducted in both city center and rural houses to examine the effect of wind effect on airtightness. Figure 4 shows the locations and construction years of the houses measured which are located in northern and southern Balıkesir city center.
The buildings examined were built between 1993 and 2018 and have different plan types. In addition, the wall materials, the type of windows and glass, ratio of transparency facades, the thermal insulation status and the size of the usage area vary each other. The plans of some measured houses were given in Table 2 and basic features as number of fa-cades, transparent/opaque surface ratio, usage area, wall and insulation materials and joinery types given in Table 3.
Table 2. Plans of examined dwellings.
Preprints 75398 i001
House 1 – 1993
2 facades / Flat
Preprints 75398 i002
House 2 – 1993
2 facades / Flat
Preprints 75398 i003
House 5 – 2017
4 facades / Detached House
Preprints 75398 i004
House 7 – 2014
4 facades / Detached House
Preprints 75398 i005
House 12 – 2014
2 facades / Flat
Preprints 75398 i006
House 14 – 2002
1 façade / Flat
Preprints 75398 i007
House 15 – 2014
2 facades / Flat
Preprints 75398 i008
House 23 – 2007
2 facades / Flat
Preprints 75398 i009
House 22 – 2005
2 facades / Flat
Preprints 75398 i010
House 36 – 1993
2 façade / Flat
Preprints 75398 i011
House 40 – 2008
1 façade / Flat
Preprints 75398 i012
House 41 – 1995
2 façade / Flat
Table 3. The features of the examined dwellings/houses.
House number Construction Year Number of Facades Transparent/Opaque
Surface Ratio
Usage area m2 Wall Material Wall Insulation Materials Joinery Type
B 1 – 1993 2 0,33 79,15 Aerated Concrete - PVC
B 2 – 1993 2 0,32 74,15 Aerated Concrete - PVC
B 3 – 1997 2 0,35 125,04 Aerated Concrete - PVC
B 4 – 1993 2 0,37 64,81 Aerated Concrete - PVC
B 5 – 2017 4 0,16 104,00 Brick - PVC
B 6 – 2005 3 0,40 105,81 Brick XPS PVC
B 7 – 2014 4 0,14 116,19 Brick - PVC
B 8 – 2017 4 0,16 90,30 Brick - PVC
B 9 – 2013 4 0,13 103,19 Brick - PVC
B 10 – 2006 4 0,15 99,32 Brick - PVC
B 11 – 2010 4 0,16 88,35 Brick - PVC
B 12 – 2014 2 0,44 65,25 Brick XPS PVC
B 13 – 2013 1 0,51 39,22 Brick XPS Aluminum
B 14 – 2002 1 0,45 90,44 Brick XPS PVC
B 15 – 2014 2 0,48 59,32 Brick XPS PVC
B 16 – 2010 3 0,35 91,58 Brick XPS PVC
B 17 – 2011 1 0,50 90,44 Brick XPS PVC
B 18 – 2018 2 0,44 74,18 Brick XPS PVC
B 19 – 2009 1 0,65 71,10 Brick XPS PVC
B 20 – 2004 2 0,55 71,93 Aerated Concrete XPS PVC
B 21 – 2003 3 0,43 91,58 Brick - PVC
B 22 – 2005 3 0,40 66,72 Brick XPS PVC
B 23 – 2007 2 0,50 62,65 Aerated Concrete - PVC
B 24 – 2012 2 0,48 56,49 Brick XPS PVC
B 25 – 2005 2 0,52 59,90 Brick - PVC
B 26 – 2016 2 0,65 53,30 Brick XPS PVC
B 27 – 2013 1 0,70 50,80 Brick XPS PVC
B 28 – 2017 1 0,70 31,73 Brick XPS Silicone Glass
B 29 – 2015 2 0,65 44,25 Brick XPS PVC
B 30 – 2012 2 0,70 44,23 Brick XPS PVC
B 31 – 2013 2 0,68 34,22 Brick XPS Aluminum
B 32 – 2018 2 0,50 89,70 Brick XPS PVC
B 33 – 2017 2 0,85 45,49 Brick XPS Silicone Glass
B 34 – 2016 1 0,71 28,95 Brick XPS PVC
B 35 – 2015 2 0,56 39,00 Brick XPS PVC
B 36 – 1993 2 0,70 47,18 Aerated Concrete XPS Aluminum
B 37 – 2009 2 0,64 29,70 Brick XPS Aluminum
B 38 – 2017 1 0,70 43,79 Brick XPS Aluminum
B 39 – 2015 1 0,60 39,26 Brick XPS Aluminum
B 40 – 2008 1 0,50 37,25 Brick XPS Aluminum
B 41 – 1995 2 0,67 61,09 Brick - Wooden
B 42 – 2013 2 0,45 28,01 Brick XPS Aluminum
B 43 – 1996 4 0,70 44,61 Brick - Wooden

2.3. BlowerDoor Test

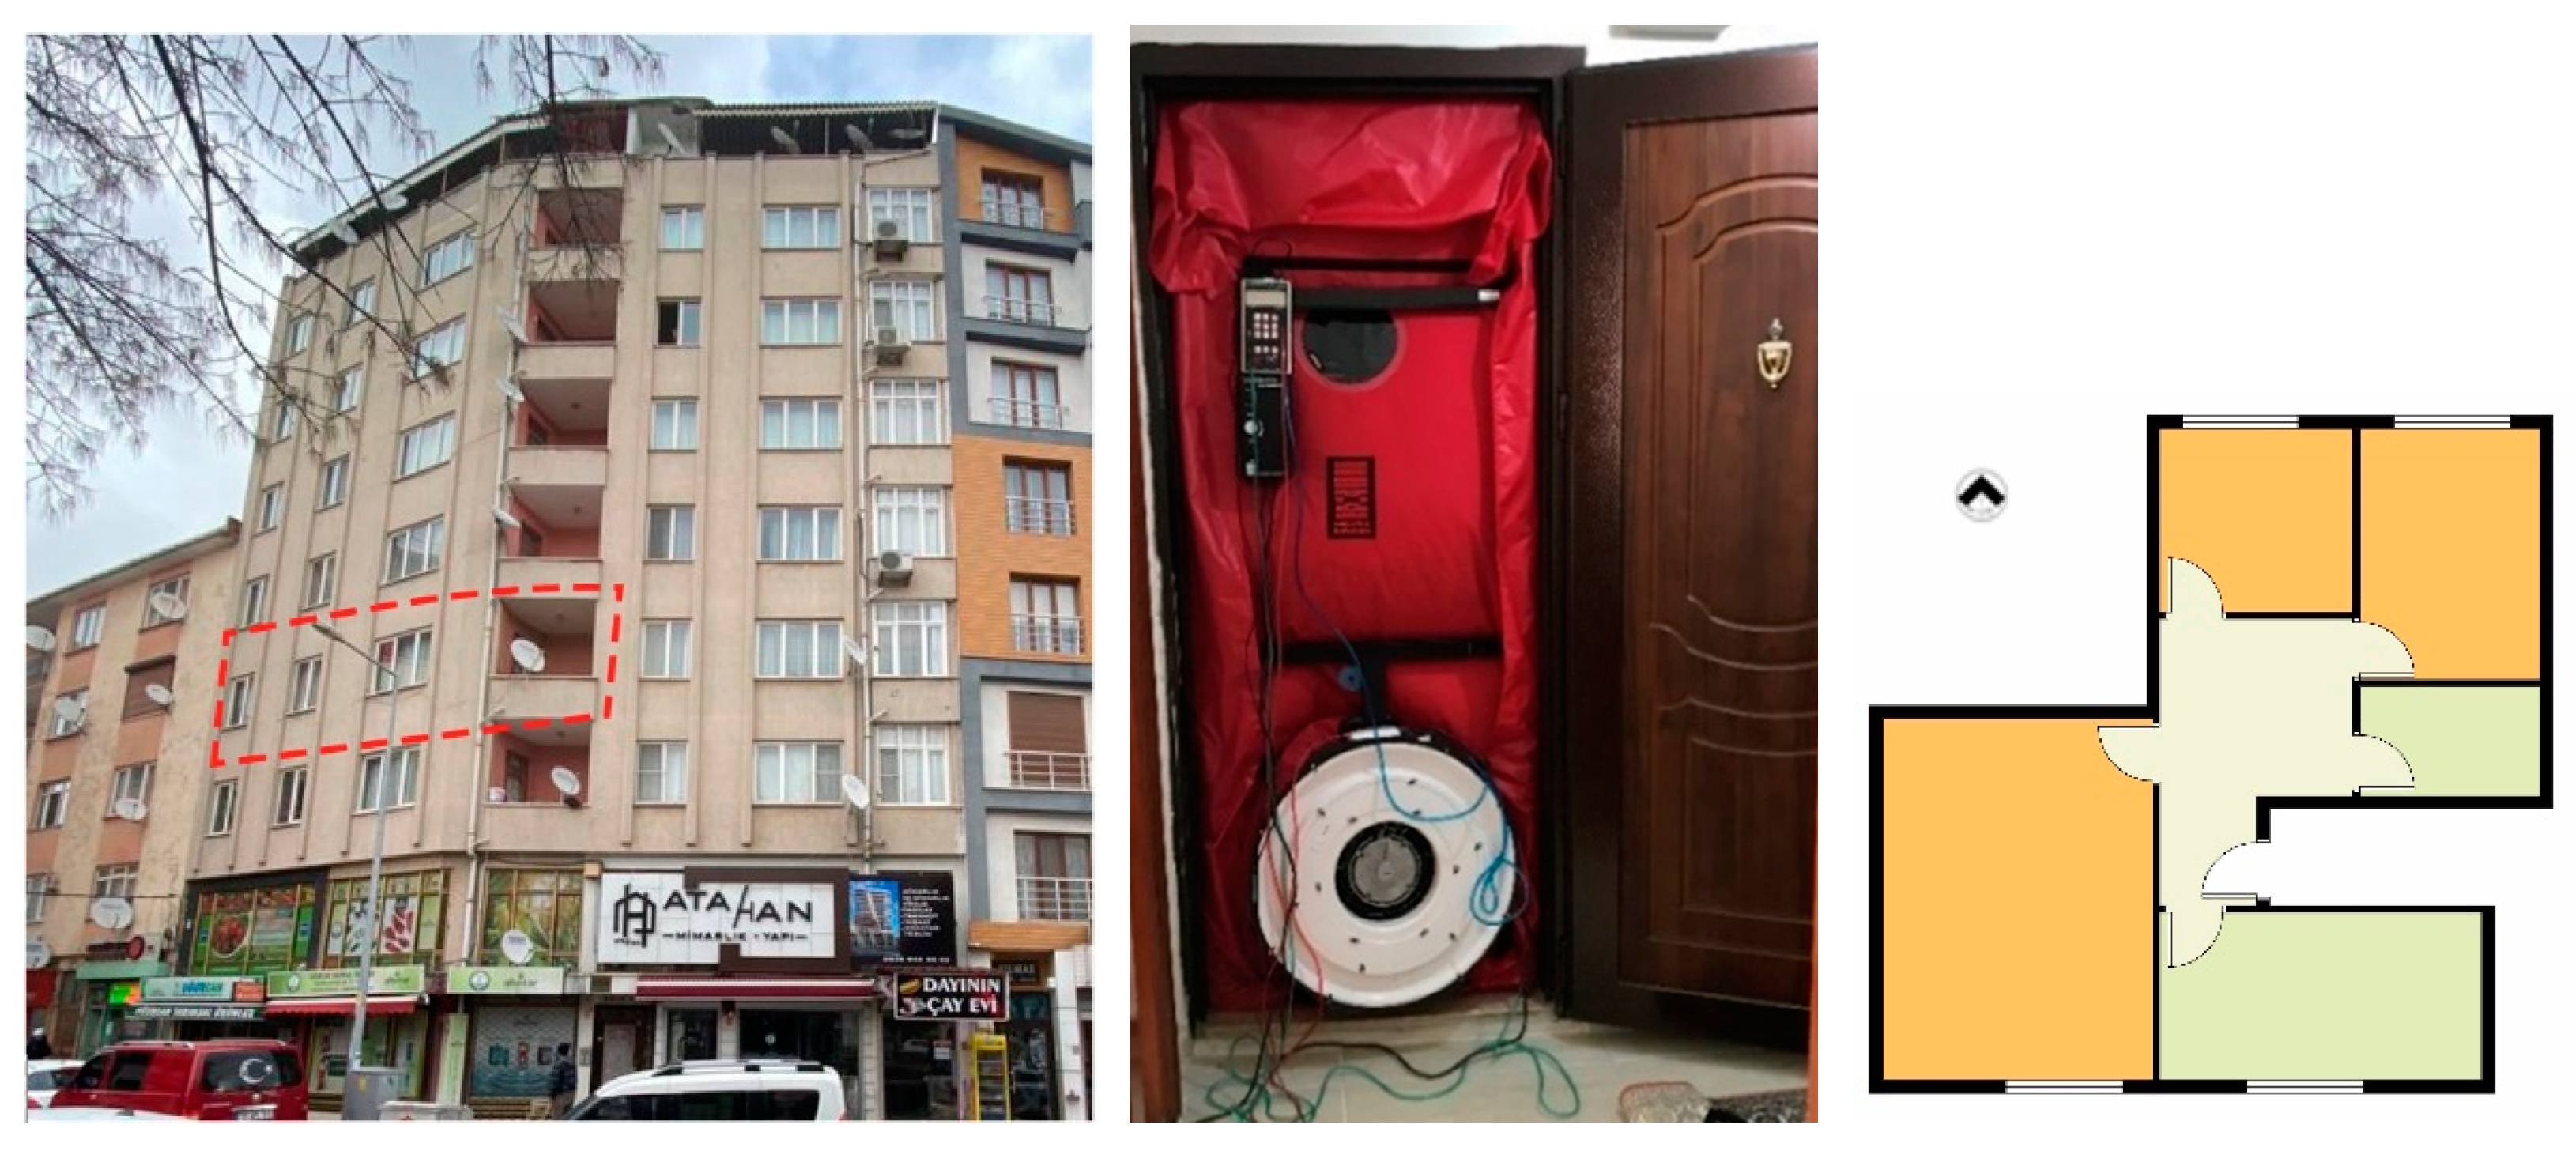
According to the EN 13829:200 standard, leakage and air leaks can be determined by fan pressurization methods [38]. In the study, detached houses and dwellings are dis-cussed. It should be considered that air leaks may occur not only to the outside environ-ment but also to the adjacent flat especially in apartment type residences and leaks are in the form of odor, noise and pollutants which affect user comfort. In the study, the Blow-erDoor Test (BDT), a measurement method used in many countries to detect leaks in the building envelope and to determine the level of air tightness, was used (Figure 5). Assembly includes mounting the frame, membrane shroud and a fan that can be adjusted to fit com-mon door openings. The fan has a variable speed motor to meet the required airflow rates.
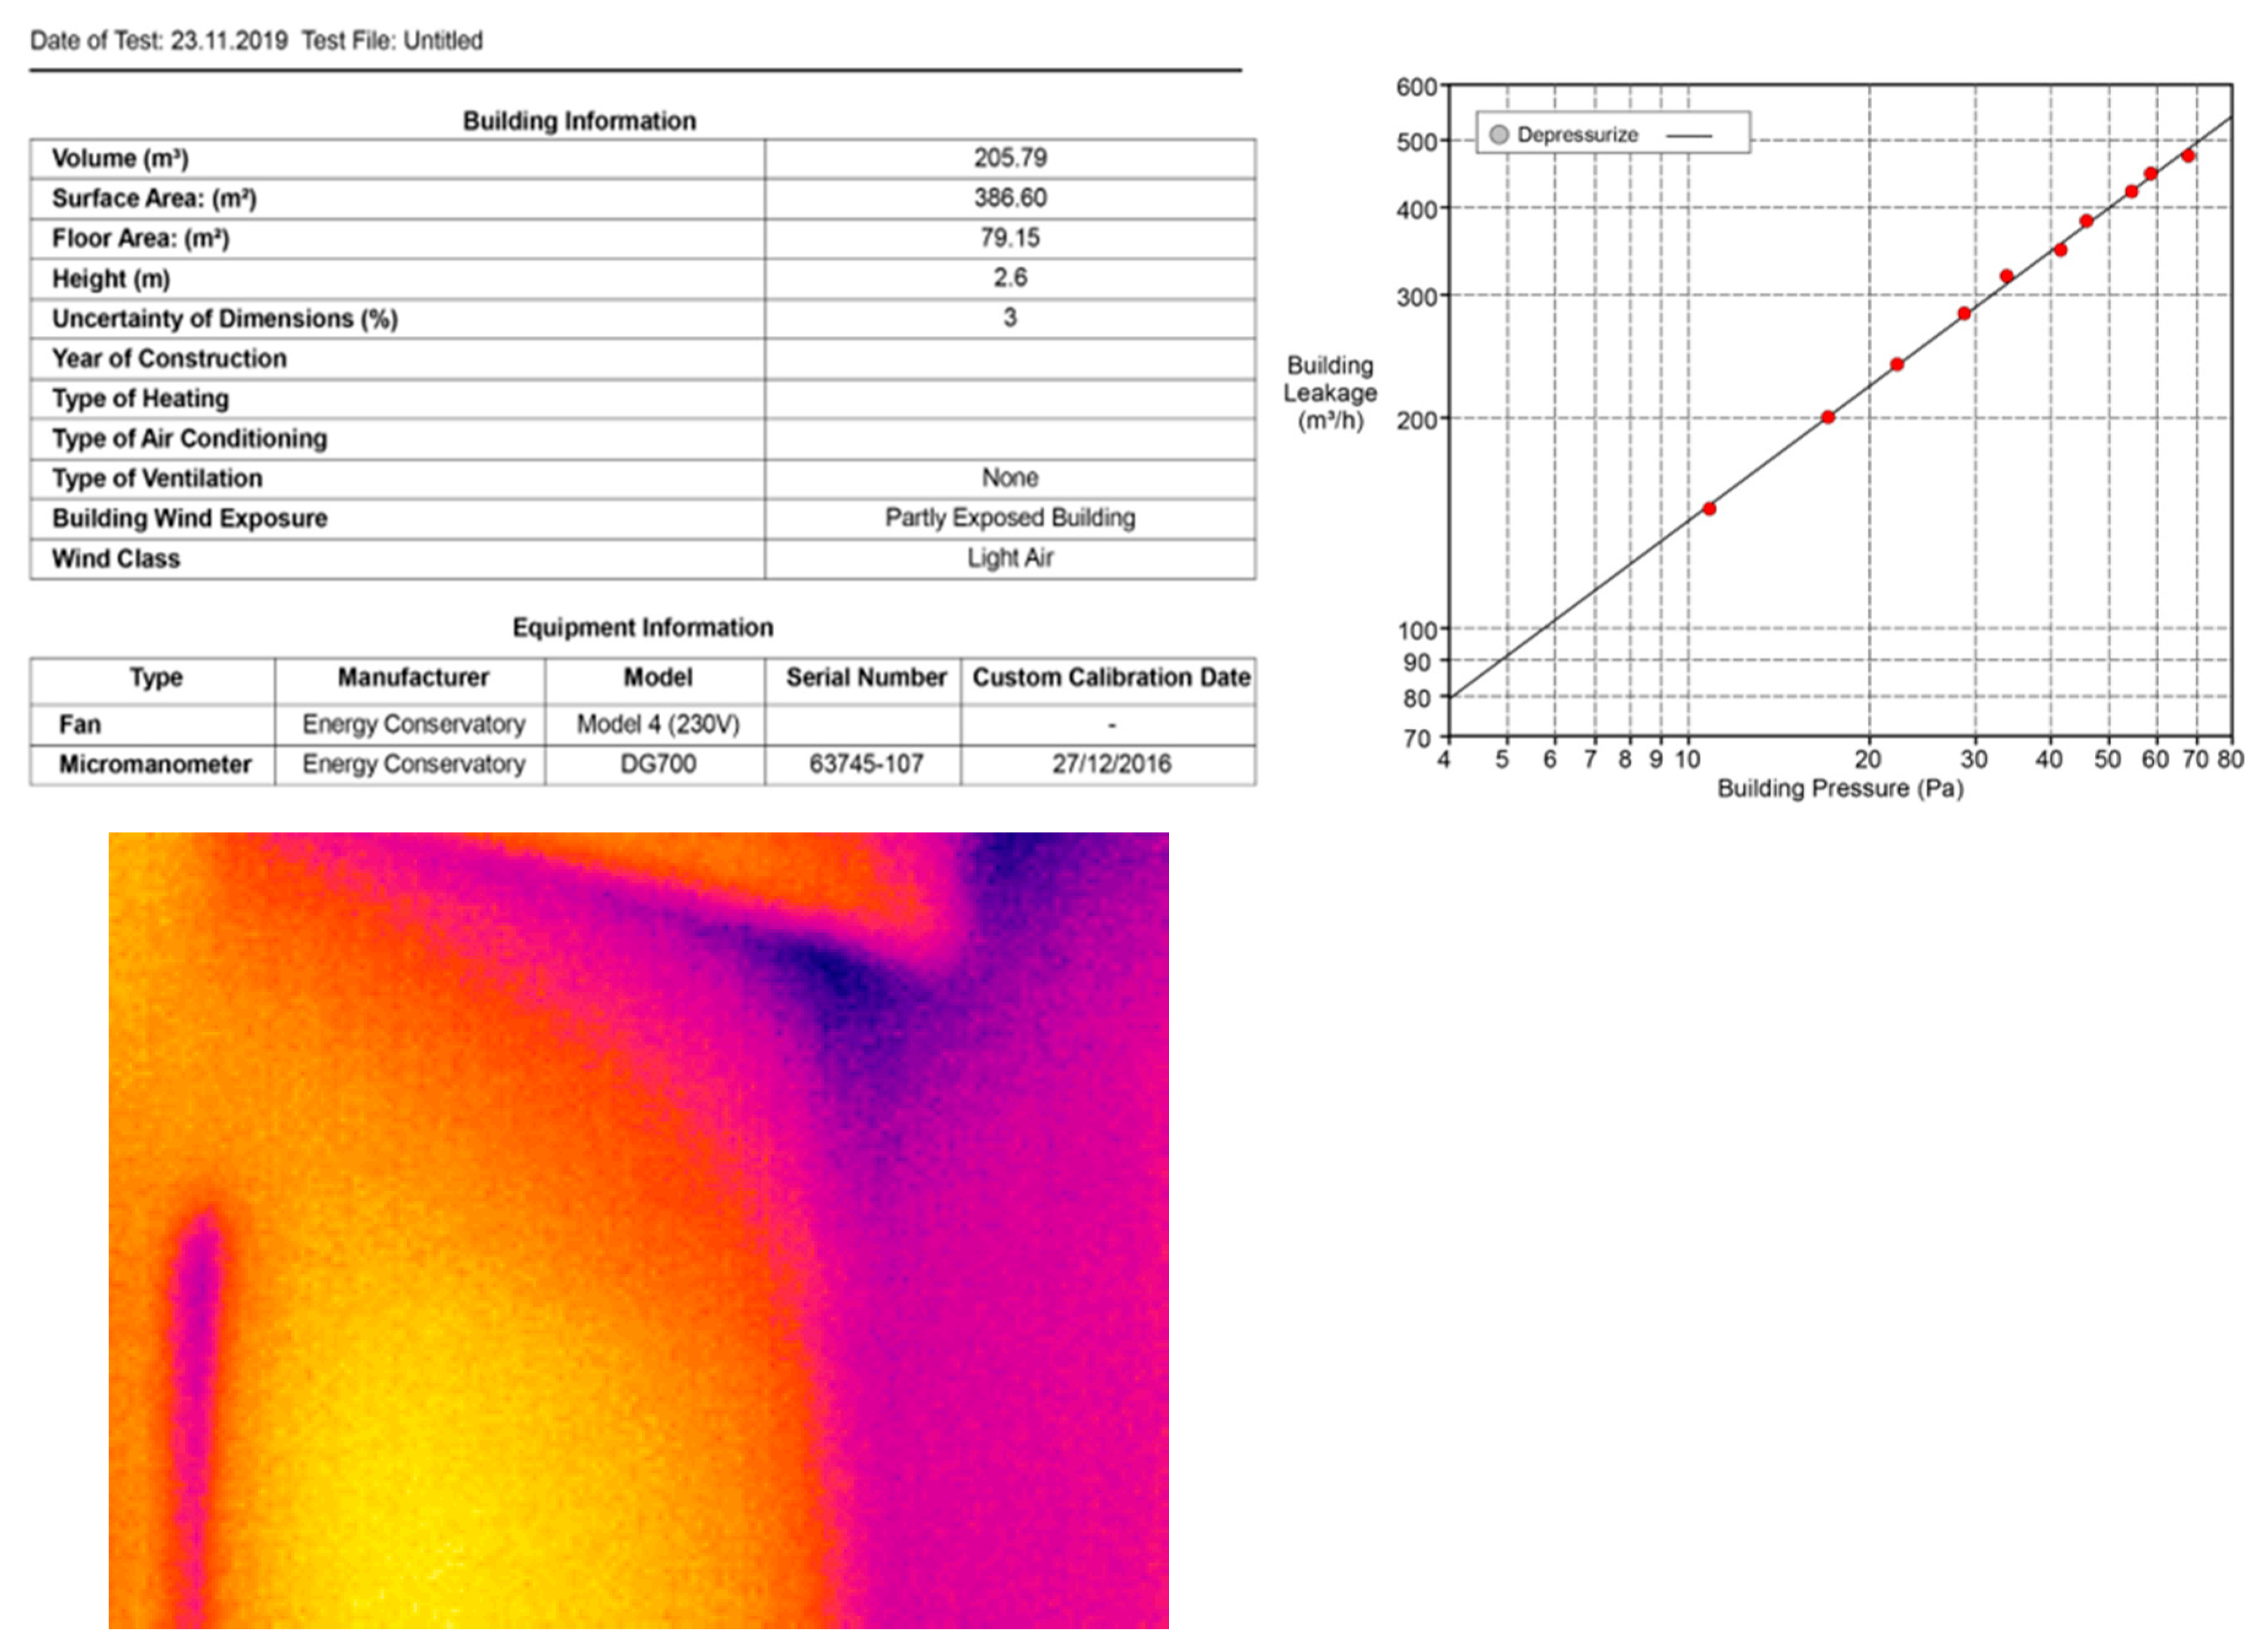
In addition, air leaks under certain pressures are recorded using The Energy Con-servatory (TEC) computer program [39]. Fan pressure testing (BDT) can be supplemented by the use of measuring instruments such as infrared imaging, tracer gas testing, and im-pact testing (Figure 6). Building envelope air permeability can be tested by taking measurements during the seasons when heating or cooling systems are used according to EN 13829:2000 standard. As known, all external openings, mechanical ventilation or air conditioning systems must be closed during the BDT process [40].
In the study, the necessity of obtaining permission from the users because the measurements were made inside the house and factors such as door openings with different geometries, insufficient frame widths, curved lines and excessive door heights are the constraints of the field study. Measurements were made by mounting the BDT unit to the outer door of the house (approximately 45-60 min.) and recording the fan pressurization test (15-20 min.) values. Different ventilation covers in the system are used in order to cre-ate the desired 50 Pascal pressure difference depending on the size of the residential area or volume in the measurements; in the field study, generally B type cover was used but depending on the size of the house type also C. As a result, with BlowerDoor measure-ments, air exchange rates under 50 Pascal pressure difference (n50) between indoor and outdoor environments in residences, (q50: m3/(m2.h)) per unit building envelope surface area and (w50:m3/(m2.h)) air exchange values per unit floor area were obtained.

2.4. Evaluation

The analysis of variance, which is a form of statistical hypothesis testing used to analyze group means and the operations related to them, was developed by the British statistician Ronald Fisher in the 1920s-1930s [41]. If the number of groups to be compared is more than two, analysis of variance (ANOVA) can be used to determine the difference between groups, and assumptions such as homogeneity, normality and summability are required for analysis of variance [42,43]. ANOVA is a parametric test statistic, and the significance of the difference between groups is being examined, and it is a quadratic form with its summability feature [42].
( i = 1 n j X i j X ˙ 2 , j = 1 k i = 1 n j ( X i j X ˙ ) )
Analysis of variance is a collection of methods that includes many statistical methods. The simplest form of this analysis method is one-way analysis of variance (One-Way ANOVA). Analysis of variance is used to determine whether there is a difference between groups. However, it does not investigate which groups the difference originates from. When there is a difference between the groups, Post-Hoc statistics determine which groups this difference originates from [44].
If the ANOVA test result is not significant, the procedure is terminated, and if it is found significant, it is necessary to calculate between which groups the differences are, using post-hoc techniques. There are many Post-Hoc techniques. Homogeneity of variances is the determining factor when deciding which technique to use [45]. In case the variances are equal, Post Hoc tests, which are "multiple comparison tests" and "multiple range tests", are used. While multiple range tests try to select different groups by creating homogeneous subsets of group means, multiple comparison tests compare each group one by one with the other groups in turn [44].
In case the variances are equal, LSD (Least Significant Difference), Sidak, Bonferronni, Tukey, Hochberg's GT2, Gabriel and Scheffe comparison tests can be used, while in cases where the variances are not equal, Games-Howell, Tamhane's T2, Tamhane's T3, Dunnet's C and Dunnets T3 can be used [44].
The ANOVA test method is mostly performed through the SPSS program, which was first used in 1968. SPSS computer program is used for statistical analysis especially in Social Sciences. Data management and documentation in SPSS program are important features of this software in addition to statistical analysis [46].
In this study, the effects of parameters on the air tightness were determined by the analysis of variance method through the SPSS package program such as the age of the houses, type of joinery, heat insulation status, size of the usage area, wall material types and number of facades.

3. Findings

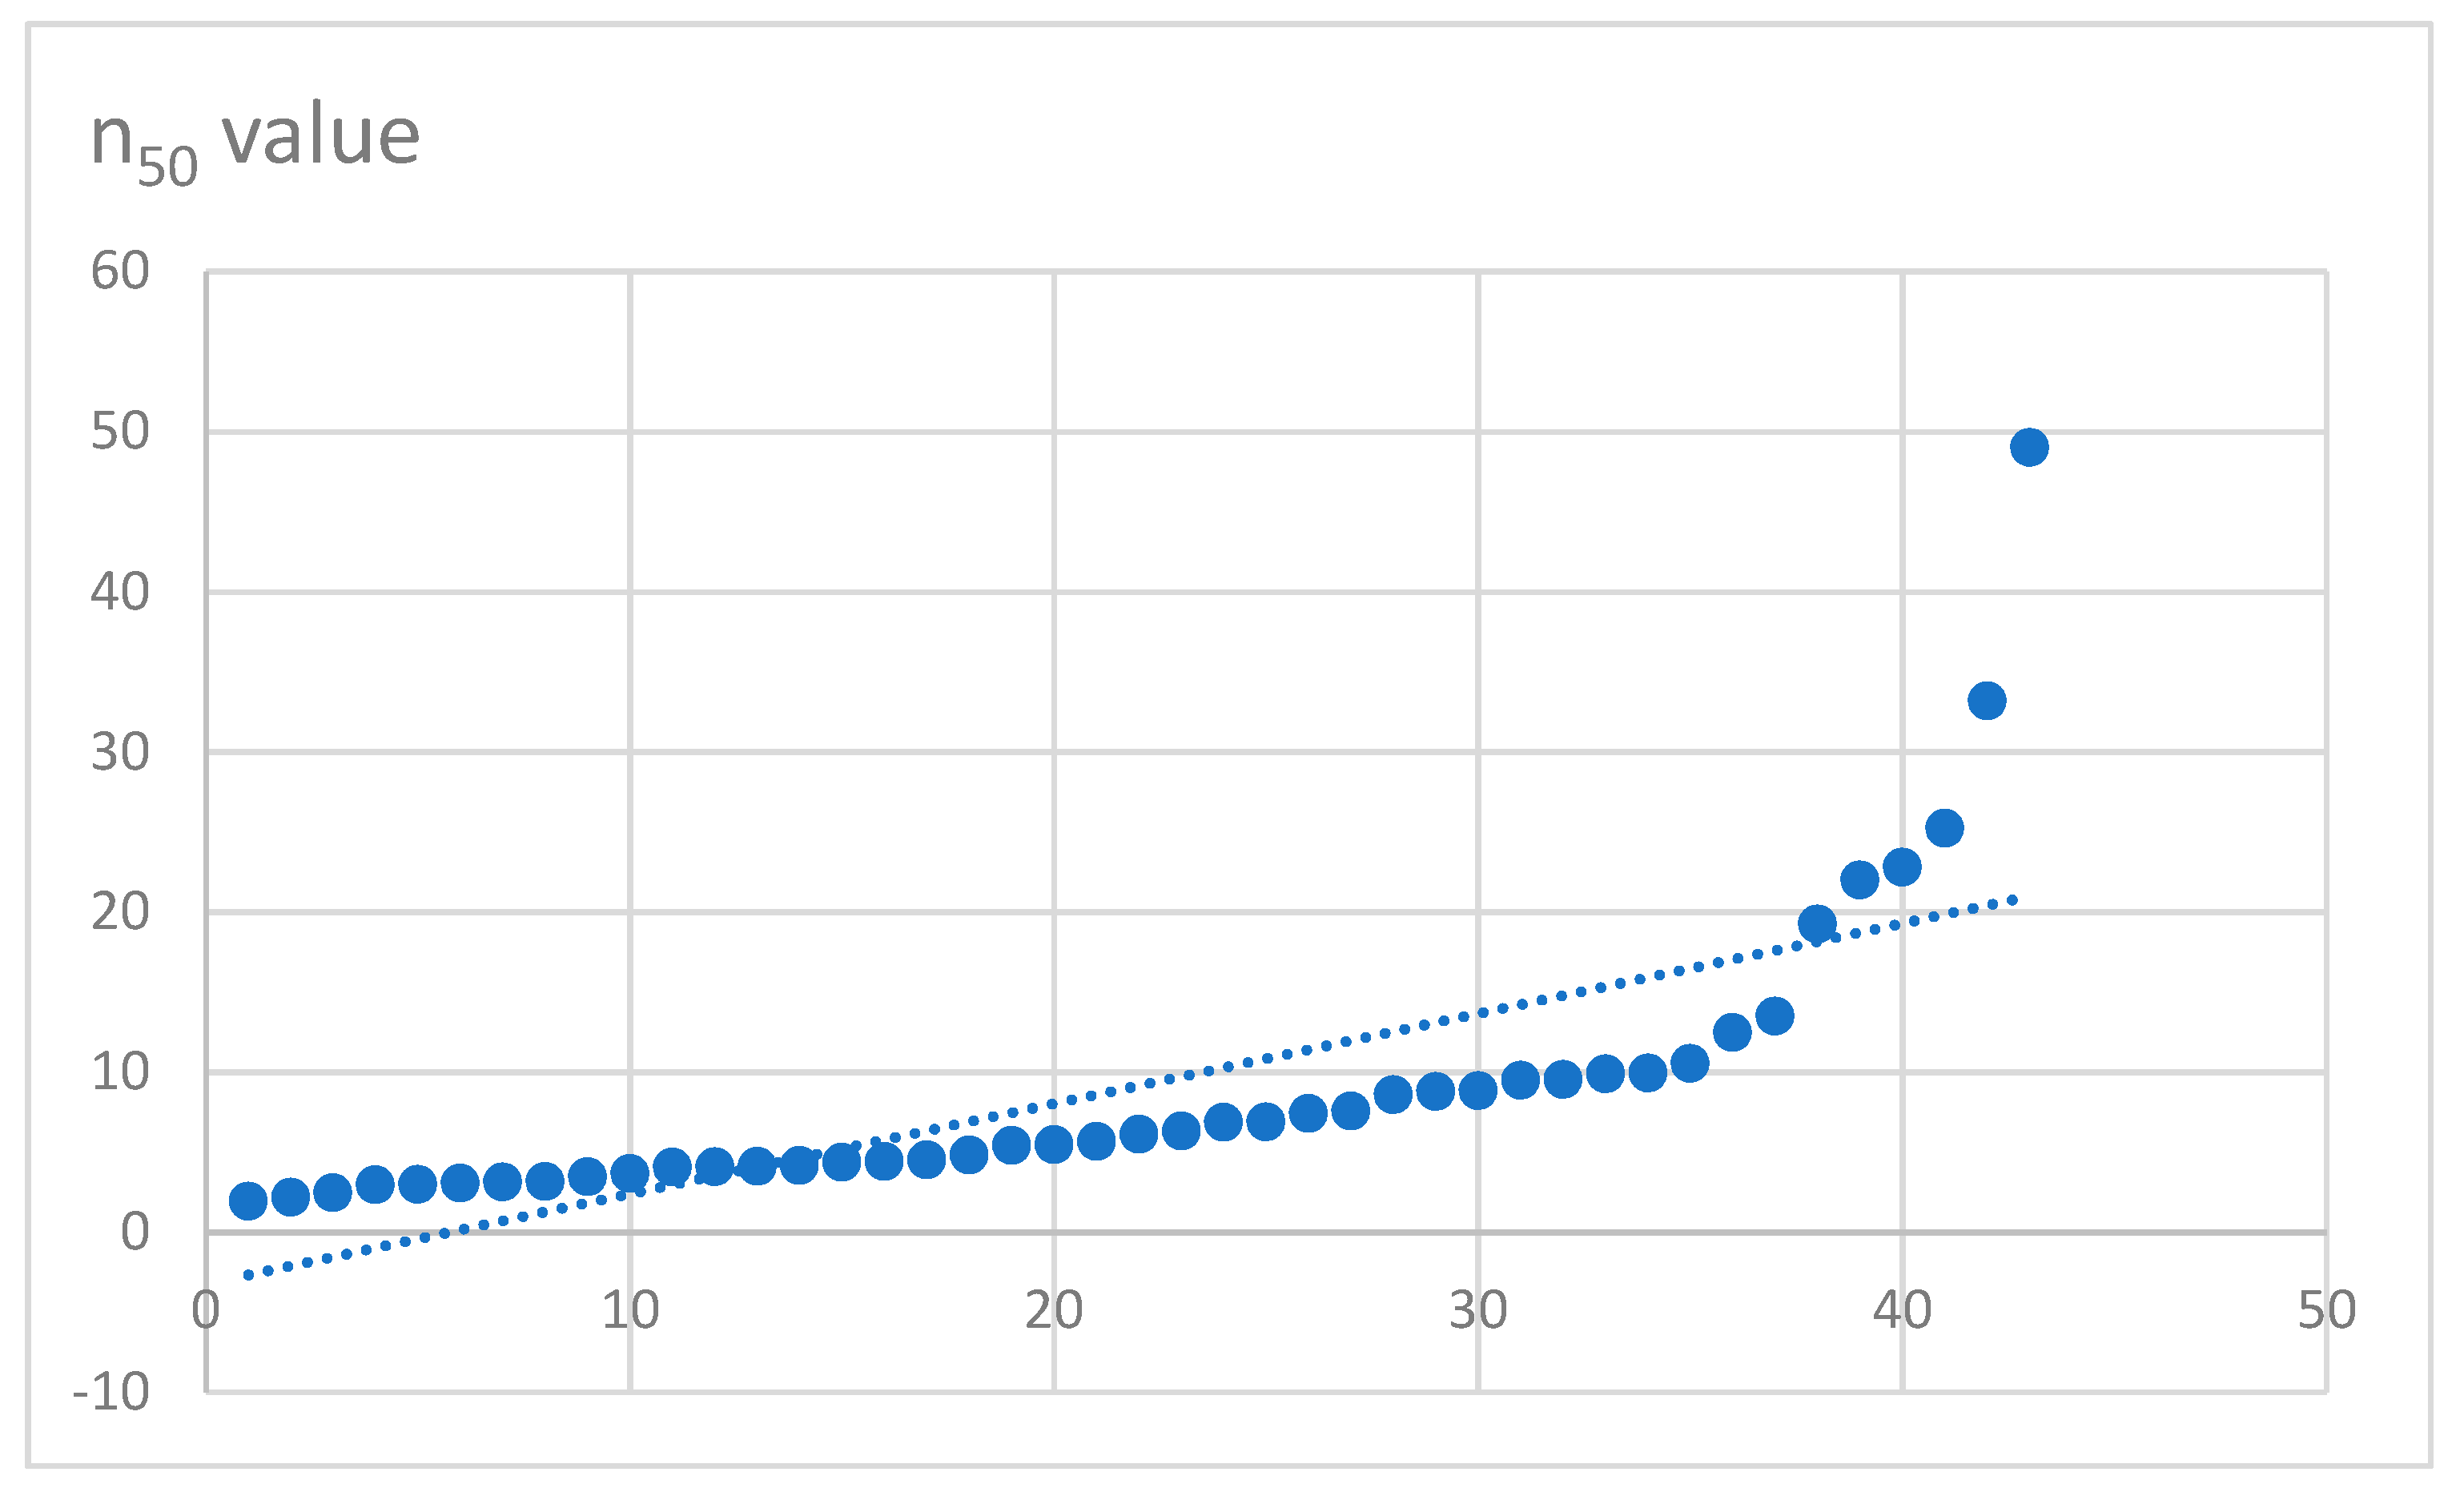
In the field study, depressurization tests with 6 Pa reductions were made with the BlowerDoor Tester in 43 residences and the obtained air tightness n50 values are shown in Table 4 and Figure 7. The effect of the environment cannot be ignored during this test, which is based on the EN 13829:2000 standard [39]. For this reason, all natural/mechanical ventilation openings were closed during the BlowerDoor Test.
Table 4. BDT measurement results.
House number Usage area
(m2)
Building
airtightness value n50 (1/h)
w50
(m3/(h.m2))
q50
(m3/(h.m2)
B 1 79,15 1,94 5,05 1,03
B 2 74,15 2,18 5,67 1,20
B 3 125,04 2,47 9,71 4,48
B 4 64,81 2,96 7,69 1,34
B 5 104.00 2,99 7,20 1,76
B 6 105.81 3,05 7,92 1,55
B 7 116.19 3,13 8,77 1,67
B 8 90.30 3,16 8,23 1,85
B 9 103.19 3,46 6,69 1,87
B 10 99.32 3,65 10,25 2,04
B 11 88.35 4,05 11,35 2,17
B 12 65.25 4,08 10,38 2,24
B 13 39.22 4,12 20,58 3,99
B 14 90.44 4,16 11,22 2,06
B 15 59.32 4,35 11,09 2,23
B 16 91.58 4,42 11,50 2,25
B 17 90.44 4,50 12,15 2,23
B 18 74.18 4,82 12,54 22,71
B 19 71.10 5,42 14,08 3,02
B 20 71.93 5,47 14,21 2,87
B 21 91.58 5,67 14,74 2,89
B 22 66.72 6,11 15,88 2,68
B 23 62.65 6,30 16,39 3,43
B 24 56.49 6,86 17,84 3,55
B 25 59.90 6,89 17,91 3,69
B 26 53.30 7,40 19,24 3,88
B 27 50.80 7,56 19,65 4,16
B 28 31.73 8,59 21,47 3,89
B 29 44,25 8,79 22,84 3,59
B 30 44,23 8,85 23,04 4,18
B 31 34,22 9,48 23,71 4,28
B 32 89,70 9,52 24,81 4,24
B 33 45,49 9,88 24,69 5,65
B 34 28,95 9,94 24,85 4,56
B 35 39,00 10,53 27,37 4,95
B 36 47,18 12,46 32,83 6,99
B 37 29,70 13,48 33,70 6,46
B 38 43,79 19,24 50,02 9,15
B 39 39,26 21,99 57,17 11,92
B 40 37,25 22,80 59,28 17,59
B 41 61,09 25,23 9,71 4,48
B 42 28,01 33,18 69,67 12,72
B 43 46,61 49,02 193,29 49,66
According to the results of the BlowerDoor Test conducted in 43 residences, the standard deviation of the air tightness n50 values measured is 9.21; the average was calculated as 9.16. Data with high airtightness n50 value were not considered as experimental errors, and it was concluded that air leaks are high in these dwellings and their airtightness performance is poor.
The averages and standard deviations of the n50, q50 and w50 values obtained as a result of the BlowerDoor Test are shown in Table 5. It was taken into account that the results obtained for the residences in the apartment were infiltrations inside and outside the building, and the results for the apartment type residences and detached houses were evaluated separately.
Table 5. The mean and standard deviation values of n50, q50 and w50.
Mean Standard Devision
n50 9,16 9,21
q50 23,93 30,22
w50 5,65 8,11
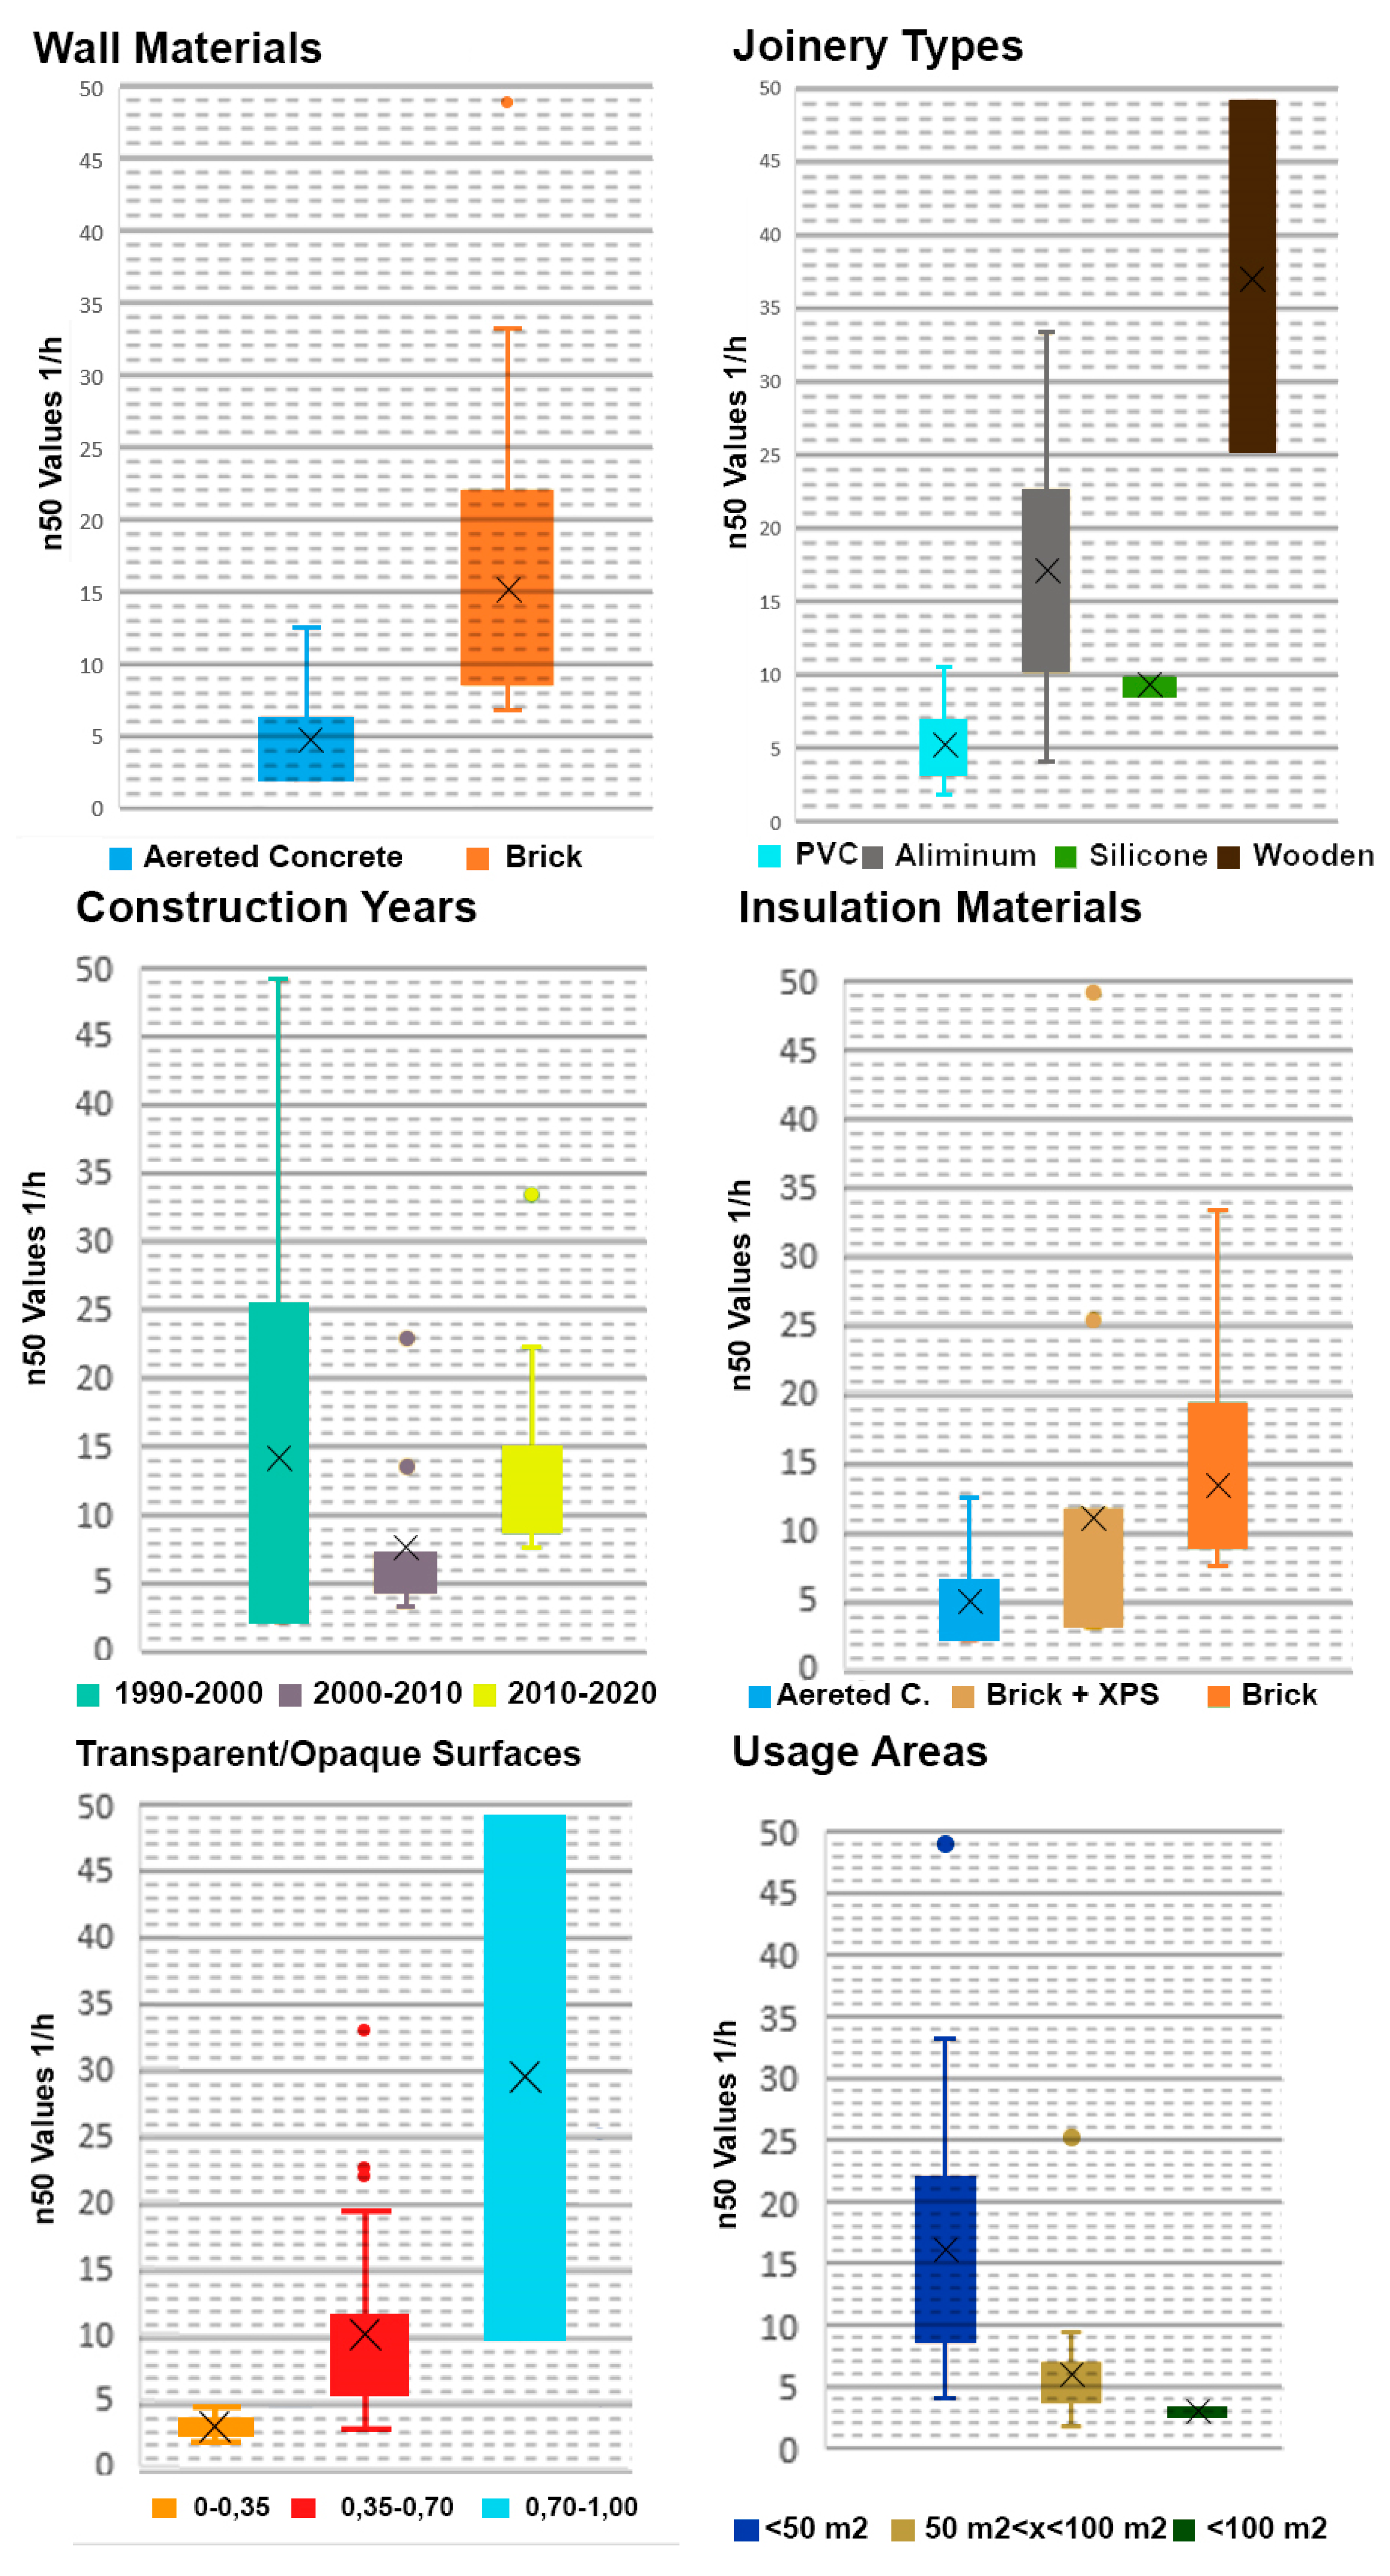
While the average airtightness n50 value in detached houses measured as 3.40 h-1, which obtained 10.09 h-1 in the apartment-type houses. It means the average building envelope sealing value in detached houses was lower than in apartment-type houses. In the literature mentioned that air leaks are concentrated at the window frames, pipe and duct paths and construction joints which detected via the Blower Door Test measurement [47]. In the cases examined, it was determined that the quality of workmanship was poor and that the construction joint applications were made carelessly. The relationships between the design parameters considered in the study and n50 values are shown in Figure 9 and Figure 10.

Evaluation of Measurement Results with Statistical Methods

The effectiveness of parameters such as construction year, type of joinery, wall material, the transparency ratio of facade, insulation status and size of building usage area, which are assumed to be important in building sealing, were analyzed by ANOVA method in SPSS program and test results are given in Table 6.
Table 6. ANOVA results.
Sum of Squares df Mean Square F p
Building age Between Groups 184,182 2 92,091 1,089 ,346
Within Groups 3381,965 40 84,549
Total 3566,147 42
Usage area Between Groups 1160,626 2 580,313 9,650 <,001
Within Groups 2405,521 40 60,138
Total 3566,147 42
Joinery type Between Groups 2540,126 4 635,031 23,519 <,001
Within Groups 1026,021 38 27,001
Total 3566,147 42
Insulation material Between Groups 21,233 1 21,233 0,246 ,623
Within Groups 3544,914 41 86,461
Total 3566,147 42
Transparency ratio of facade Between Groups 638,482 2 319,241 4,362 ,019
Within Groups 2927,664 40 73,192
Total 3566,147 42
Wall material Between Groups 157,561 1 157,561 1,895 ,176
Within Groups 3408,586 41 83,136
Total 5,860 42
In the ANOVA test analysis, whether there was a significant difference between the groups was determined according to the p value, and the p significance level was taken as 5% (p<0.05). In response to these findings, according to the ANOVA test results, significant findings were obtained between the age of the building, the size of the usage area, the transparency ratio of facade, the insulation types, joinery and wall materials, and impermeability. While the p value of the usage area size and joinery material parameters was determined as 0.001%, the p value of the facade ratio parameter was obtained as 0.019%.
The joinery type between the groups was 2540.126, the within-group difference was 1026.021, and the F value of the building age parameter was 23.519. It was observed that the p value of the building age was 0.001 and there was a significant difference between the groups.
In the usage area parameter, the difference between the groups was 1160.626, and the difference within the group was 2405.521. While the F value of the wall material parameter was 9.650 and the p value was 0.001, it was noteworthy that there was a significant difference between the groups.
While the difference of the transparency ratio of façade parameter between the groups was 638,482, the difference within the group was 2927,664. While the F value of the transparency ratio of façade parameter was 4.362, the p value was determined as 0.019.
As the difference of the wall material parameter between the groups was 157,561, the difference within the group was determined as 3408.586. While the F value of the joinery material parameter was 1.895, the p value was determined as 0.176.
While the difference of the insulation material parameter between the groups was 21,233, the within-group difference was 3544.914. While the F value of the usage area size parameter was 9,650, the p value was determined as 0,01.
In addition, Post Hoc test results for building age, usage area and facade ratio parameters are given in Table 7, Table 8 and Table 9. Post Hoc test results could not be obtained because there were no significant differences on other parameters. When the tables are examined, the usage area parameter is sig. Since its value is less than 0.001, it is the most influential parameter, followed by the transparency facade ratio with 0.272.

4. Conclusion

Airtightness is one of the important physical characteristics of energy efficient buildings. Aiming to determine the design parameters affecting airtightness in the Mediterranean climate, this study analyzed the relationship between the parameters which important for designers and practitioner in terms of energy efficiency and indoor comfort.
In this study, the air tightness performance of 43 residences located in the city center and rural areas of Balıkesir Province was investigated with the Minneapolis BlowerDoor Test method, and the air exchange rate values (n50) at 50 Pascal pressure were measured between 1.94 - 49.02 h-1.
By comparison with the TS 825 Standard 25 residences examined has a "low" level of airtightness, 12 of them are "moderate" leakproof, 7 residences were determined to be leak proof at a “high” level.
According to the European Passive House Standard where n50 given as <0.6, none of the examined houses in the study can provide limit value. On the other hand, n50 of H1, H2, H3, H4 houses with the 1.94 h-1, 2.18 h-1, 2.47 h-1 and 2.96 h-1 respectively, comply with to Austria Passive House Standard given as n50<3.
16 residences exhibited a “high” level of air tightness performance with the values of 1.94 – 4.42 according to the TNI 730330 Standard (n50<4.5), but none of the investigated house afforded the TNI 7303330 Standard condition (n50<1.50).
Joinery type was the most effective design parameter according to the ANOVA test and Post Hoc results.
Effectiveness of design parameters was determined as size of usage area, wall material types and insulation status respectively.
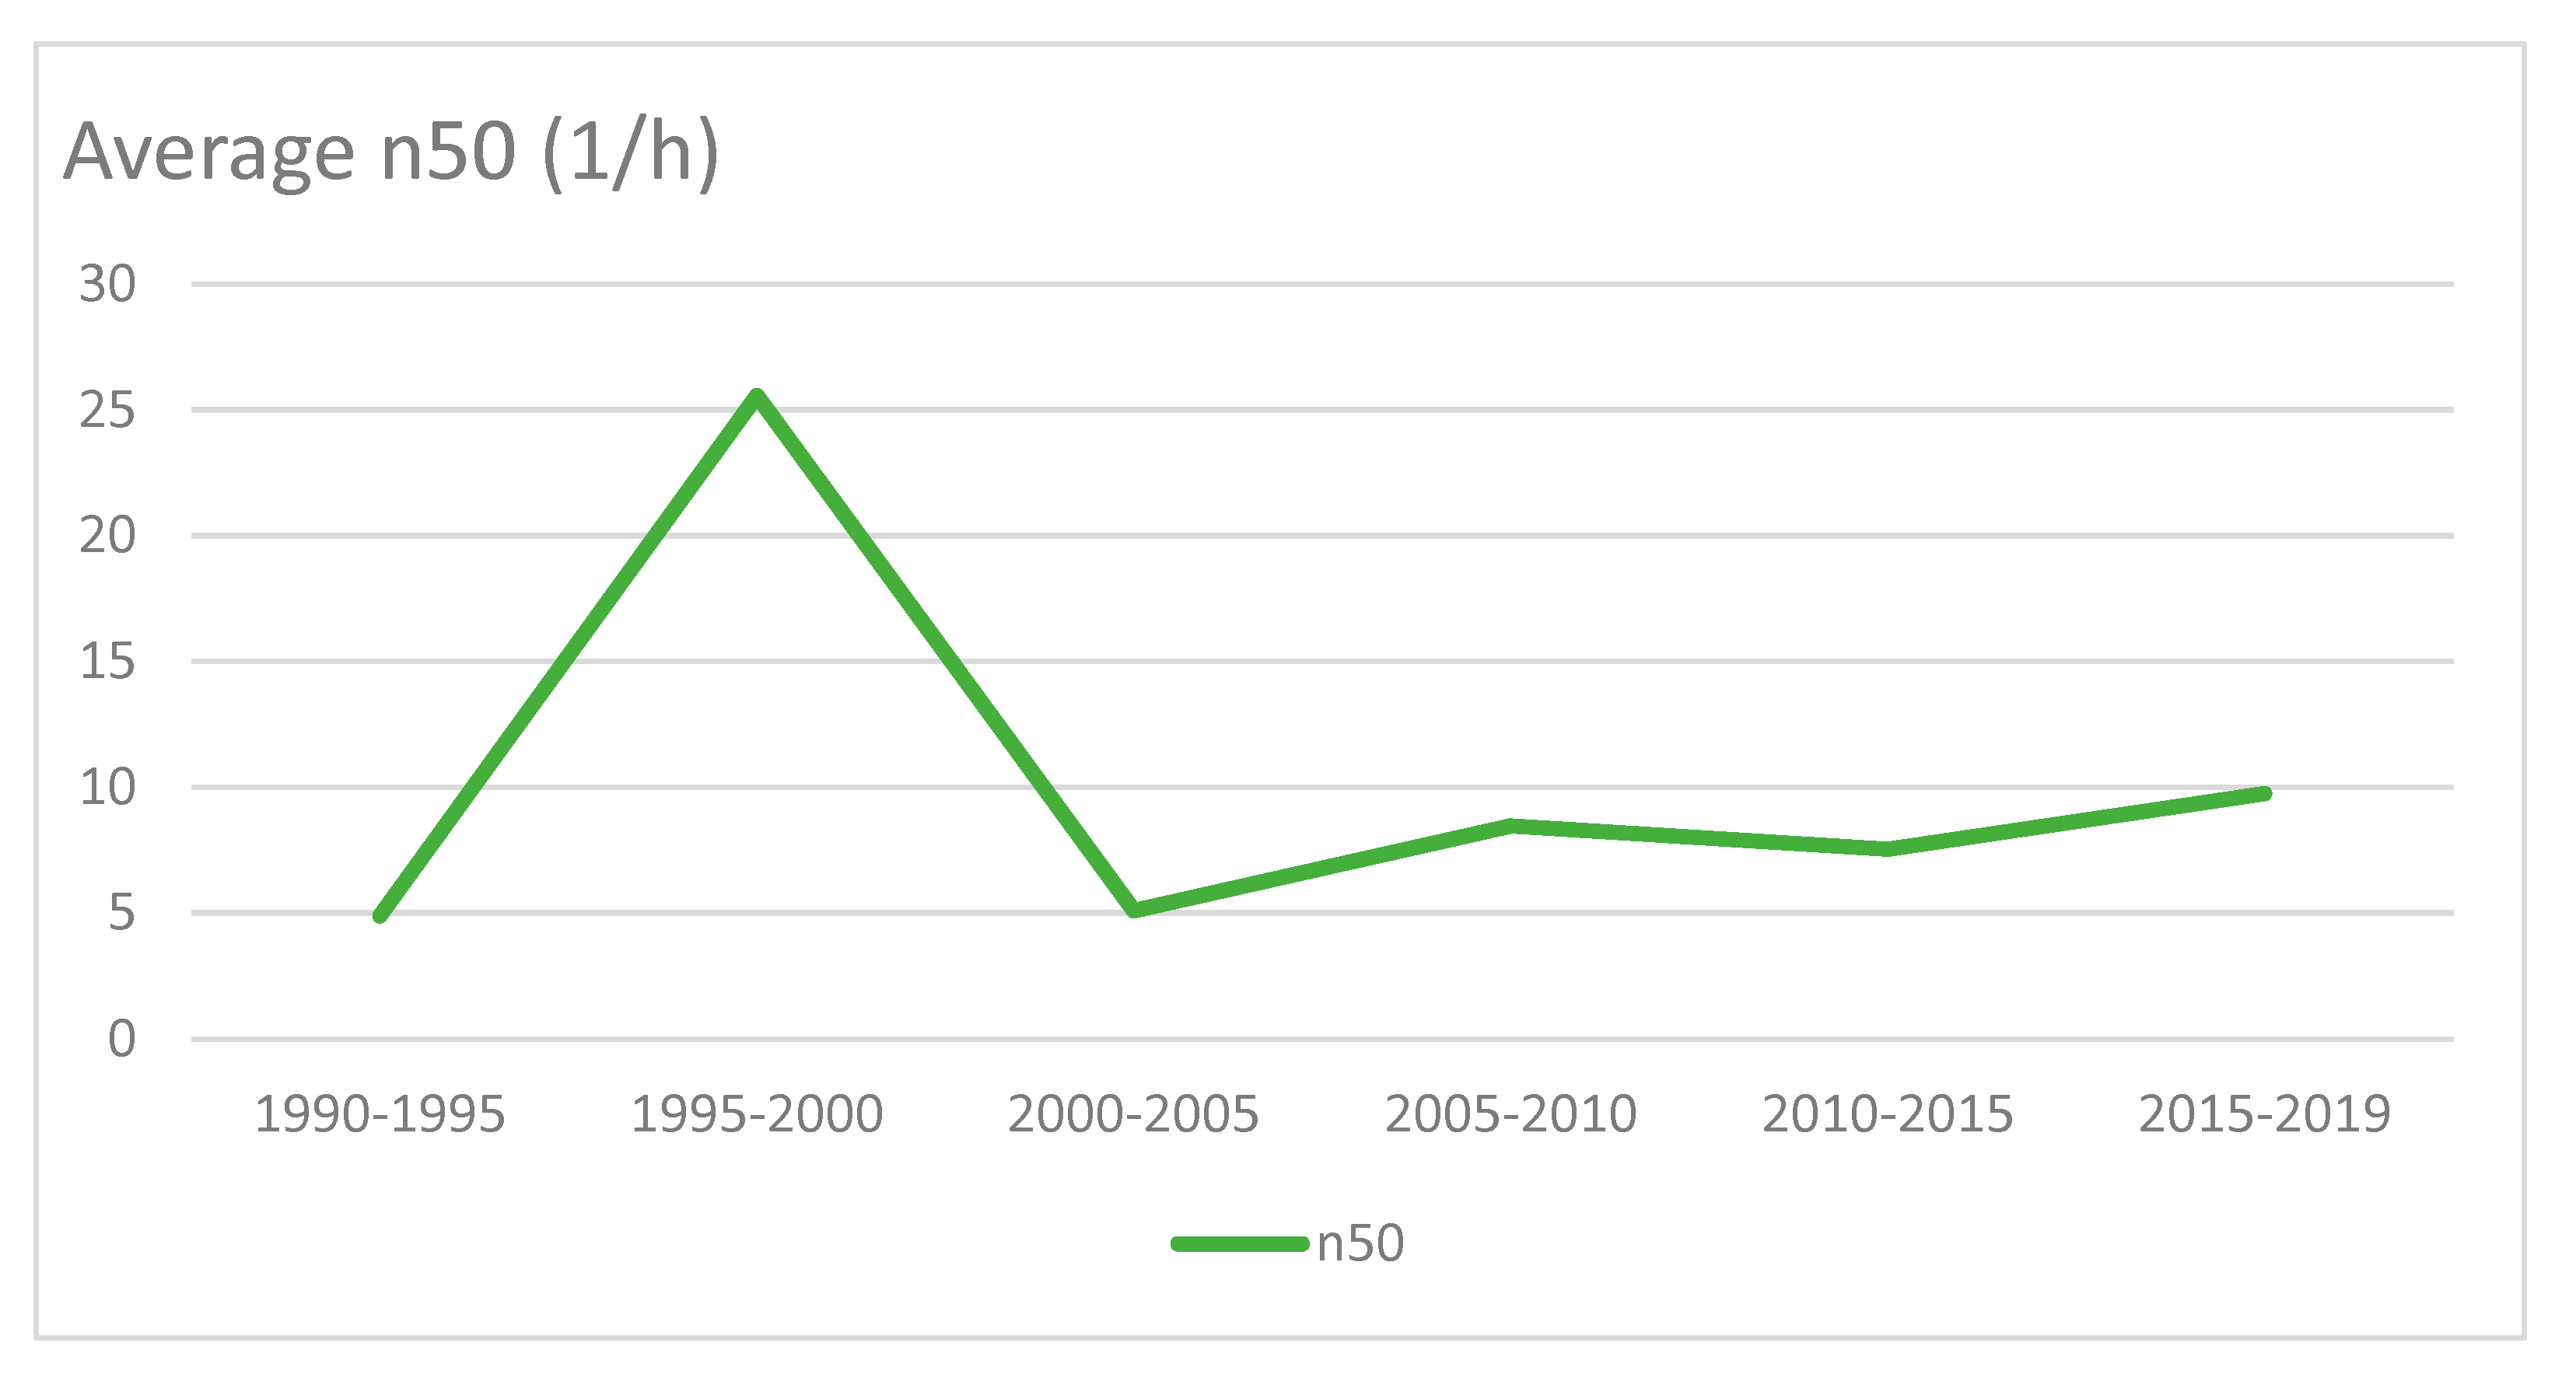
In the field study, the houses built from 1990 to the present were discussed, and the air exchange rate (n50) values of H18 and H32 built in 2018 measured as 4.82 and 9.54 h-1; but it was seen that in 1993 constructed houses H1, H2, H3 have more lower values as 1.94, 2.18 and 2.96 h-1, respectively.
According to the measurement results retained that the airtightness performance of the old structures is higher than the new structures and seen that results supporting the literature were obtained.
In addition, it is stated that like literature the design parameters as joinery type, wall material, insulation condition and usage area size and such building age affect the building envelope airtightness performance.

References

  1. Leprince, V.; Kapsalaki, M.; Carrié, F.R. Impact of Energy Policies on Building and Ductwork Airtightness, International Energy Agency, Energy Conservation in Buildings and Community Systems Programme, Ventilation Infor-mation Paper n° 37, September 2017, https://www.aivc.org erişim tarihi 27.03.2023.
  2. Kumar, D.; Alam, M.; Zou, P. X.; Sanjayan, J. G.; Memon, R. A. Comparative Analysis of Building Insulation Material Properties and Performance. Renewable and Sustainable Energy Reviews 2020, 131, 1100038. [Google Scholar] [CrossRef]
  3. Is Cooling The Future of Heating? Available online: https://www.iea.org/commentaries/is-cooling-the-future-of-heating (accessed on 11 March 2023).
  4. European Parliament, European Directive 2018/844 Amending Directive 2010/31/ EU on the Energy Performance of Buildings and Directive 2012/27, EU on energy efficiency, 2018.
  5. Kumar, D.; Alam, M.; Memon, R. A.; Bhayo, B. A. A Critical Review for Formulation and Conceptualization of an Ideal Building Envelope and Novel Sustainability Framework for Building Applications. Cleaner Engineering and Technology 2022, 11, 100555. [Google Scholar] [CrossRef]
  6. Munoz, J. F.; Pardal, C.; Echarri, V.; Agüera, J. F.; Larriva, R. A.; Calderín, M. M.; Poza-Casado, I.; Padilla-Marcos, M. A.; Meis, A. Energy Impact of the Air Infiltration in Residential Buildings in the Mediterranean Area of Spain and the Canary Islands. Energy and Buildings 2019, 188–189, 226–238. [Google Scholar] [CrossRef]
  7. Sadauskiene, J.; Paukstys, V.; Seduikyte, L.; Banionis, K. Impact of Airtightness on the Evaluation of Building Energy Performance in Lithuania, Energies 2014, Volume 7, pp 4972-4987.
  8. Leprince, V.; Carrié, F. R.; Kapsalaki, M. Building and Ductwork Airtightness Requirements in Europe – Comparison of 10 European Countries, 38th AIVC Conf. Vent, Heal. Low-Energy Build., Nottingham, UK, 2017, pp 192–201.
  9. Ministerio de Fomento del Gobierno de España, Código técnico de la Edificación (CTE). Documento básico HS 3: calidad del aire interior (in Spanish). Available online: http://www.codigotecnico.org/images/stories/pdf/salubridad/DBHS.pdf (accessed on 6 March 2023).
  10. TS 825 Thermal Insulation Standards in Buildings with Explanations and Examples (in Turkish), Izocam, January 2013, pp 27.
  11. Emmerich, S. J.; McDowell, T.; Anis, W. Investigation of the Impact of Commercial Building Envelope Airtightness on HVAC Energy Use, NIST Interagency/Internal Report (NISTIR) – 7238 2005, The USA.
  12. Sfakianaki, A.; Pavlou, K.; Santamouris, M.; Livada, I.; Assimakopoulos, M. N.; Mantas, P.; Christakopoulos, A. Airtightness Measurements of Residential Houses in Athens, Greece. Building and Environment 2008, 43, 398–405. [Google Scholar] [CrossRef]
  13. D’Ambrosio Alfano, F.R.; Dell’Isola, M.; Ficco, G.; Tassini, F. Experimental Analysis of Airtightness in Mediterranean Buildings Using The Fan Pressurization Method. Building and Environment 2012, 53, 16–25. [Google Scholar] [CrossRef]
  14. Zheng, X.; Mazzon, J.; Wallis, I.; Wood, C. J. Airtightness Measurement of an Outdoor Chamber Using The Pulse and Blower Door Methods Under Various Wind and Leakage Scenarios. Building and Environment 2020, 179. [Google Scholar] [CrossRef]
  15. Hsu, Y. S.; Zheng, X.; Cooper, E.; Gillott, M.; Wood, C. J. , Evaluation of The Indoor Pressure Distribution During Building Airtightness Tests Using The Pulse and Blower Door Methods. Building and Environment 2021, Volume 195, 107742. [Google Scholar] [CrossRef]
  16. Vinha, J.; Manelius, E.; Korpi, M.; Salminen, K.; Kurnitski, J.; Kiviste, M.; Laukkarinen, A. Airtightness of Residential Buildings in Finland. Building and Environment 2015, 93, 128–140. [Google Scholar] [CrossRef]
  17. Prignon, M.; Van Moeseke, G. Factors Influencing Airtightness and Airtightness Predictive Models: A Literature Review. Energy and Buildings 2017, 146, 87–97. [Google Scholar] [CrossRef]
  18. Hong, G.; Kim, D. D. Airtightness of Electrical, Mechanical and Architectural Components in South Korean Apartment Buildings Using The Fan Pressurization and Tracer Gas Method. Building and Environments 2018, 132, 21–29. [Google Scholar] [CrossRef]
  19. Almeida, R.M.S.F.; Ramos, N.M.M.; Pereira, P.F. A Contribution for The Quantification of The Influence of Windows on The Airtightness of Southern European Buildings. Energy and Buildings 2017, 139, 174–185. [Google Scholar] [CrossRef]
  20. Srba, J.; Böhm, M.; Berankov, J.; Trgala, K.; Oralkova, R. Estimation of Air Leakage Rate of Wood-Based Residential Buildings Constructed in The Czech Republic in The Years 2006-2014 Using Blower Door Test. Wood Research 2016, Volume 61, pp 599–605.
  21. Domhagen, F.; Wahlgren, P. Consequences of Varying Airtightness in Wooden Buildings. Energy Procedia 2017, 132, 873–878. [Google Scholar] [CrossRef]
  22. Geleziunas, V.; Banionis, K.; Paukstys, V.; Kumziene, J. Development of Airtightness Prediction Method of Masonry Walls. E3S Web of Conferences 2020, Volume 172. [CrossRef]
  23. Mortensen, L.H.; Bergsee, N.C. Air Tightness Measurements in Older Danish Single-Family Houses. Energy Procedia 2017, 132, 825–830. [Google Scholar] [CrossRef]
  24. Ashdown, M.; Crawley, J.; Biddulph, P.; Wingfield, J.; Lowe, R.; Elwell, C. Characterising the airtightness of dwellings: its improvement over time and relationship to construction techniques. International Journal of Building Pathology and Adaptation 2019. [Google Scholar] [CrossRef]
  25. Colijn, M.; Entrop, A.G.; Toxopeus, M.E. Evaluating The Effectiveness Of Improved Workmanship Quality On The Airtightness of Dutch detached Houses. Energy Procedia 2017, 132, 843–848. [Google Scholar] [CrossRef]
  26. Yang, Y.; Wang, Z.; Li, X.; Wang, H.; Ren, Y.; Zhao, D.; Xu, Z. Test and Simulation for The Airtightness of Backdraft Dampers in Residential Cooking Exhaust Shaft Systems. Journal of Building Engineering 2021, 44, 103007. [Google Scholar] [CrossRef]
  27. Hong, G.; Kim, C. Experimental Analysis of Airtightness Performance in High-Rise Residential Buildings for Improved Code-Compliant Simulations. Energy & Buildings 2022, 261, 111980. [Google Scholar] [CrossRef]
  28. Lee, D.S.; Jeong, J.W.; Jo, J.H. Experimental Study on Airtightness Test Methods in Large Buildings; Proposal of Averaging Pressure Difference Method. Building and Environment 2017, 122, 61–71. [Google Scholar] [CrossRef]
  29. Munoz, J. F.; Pardal, C.; Echarri, V.; Agüera, J. F.; Larriva, R. A.; Calderin, M. M.; Poza-Casado, I.; Padilla-Marcos, M. A.; Meiss, A. Energy Impact of The Air Infiltration in Residential Buildings in The Mediterranean Area of Spain and The Canary Islands. Energy and Buildings 2019, 188–189, 226–238. [Google Scholar] [CrossRef]
  30. Paukštys, V.; Cinelis, G.; Mockiene, J.; Daukšys, M. Airtightness and Heat Energy Loss of Mid-Size Terraced Houses Built of Different Construction Materials. Energies 2021, 14, 6367. [Google Scholar] [CrossRef]
  31. Kempton, L.; Daly, D.; Kokogiannakis, G.; Dewsbury, M. A Rapid Review of The Impact of Increasing Airtightness on Indoor Air Quality. Journal of Building Engineering 2022, 57, 104798. [Google Scholar] [CrossRef]
  32. Casado, I. P.; De Tio, P. R.; Temprano, M. F.; Marcos, M. A. P.; Meis, A. An Envelope Airtightness Predictive Model for Residential Buildings in Spain. Building and Environment 2022, 223, 109435. [Google Scholar] [CrossRef]
  33. Zheng, H.; Long, E.; Cheng, Z.; Yang, Z.; Jia, Y. Experimental Exploration on Airtightness Performance of Residential Buildings in The Hot Summer and Cold Winter Zone in China. Building and Environment 2022, 214, 108848. [Google Scholar] [CrossRef]
  34. Zheng, X.F.; Hsu, Y.S.; Pasos, A.V.; Smith, L.; Wood, C. J. A Progressive Comparison of The Novel Pulse and Conventional Steady State Methods of Measuring The Airtightness of Buildings. Energy and Buildings 2022, 261, 111983. [Google Scholar] [CrossRef]
  35. Banister, C.; Bartko, M.; Berquist, J.; Macdonald, I.; Vuotari, M.; Wills, A. Energy and Emissions Effects of Airtightness for Six Non-Residential Buildings in Canada With Comparison to Contemporary Limits and Assumptions. Journal of Building Engineering 2022, 58, 104977. [Google Scholar] [CrossRef]
  36. Climate of Balikesir Province. Available online: http://izmir.mgm.gov.tr/files/iklim/balikesir_iklim.pdf. (accessed on 15 January 2020).
  37. Balikesir Wheather Forecast. Available online: https://www.worldweatheronline.com/balikesir-weather/balikesir/tr.aspx. (accessed on 15 January 2020).
  38. Sherman, M, The Use of Blower-Door Data1. Indoor Air. 1995, pp 5. 215 - 224. [CrossRef]
  39. ISO 9972:2006. Available online: http://mosenergoconsult.ru/wp-content/uploads/2014/ISO-9972-2006-EN.pdf (accessed on 15 May 2020).
  40. AENOR, EN 13829:2000, Thermal performance of buildings. Determination of air permeability of buildings, Fan pressurization method. (ISO 9972:1996, modified), 2000.
  41. Analysis of variance. Available online: https://tr.wikipedia.org/wiki/Varyans_analizi. (accessed on 15 May 2020).
  42. G. A. Ferguson, Statistical analysis in psychology and education. New York: McGrawHill Book Company, 1981.
  43. B. J. Winer, Statistical principles in experimental design. New York: McGraw-Hill Book Company, 1971.
  44. Kayri, M. Araştırmalarda Gruplar Arası Farkın Belirlenmesine Yönelik Çoklu Karşılaştırma (Post-Hoc) Teknikleri, Fırat Üniversitesi Sosyal Bilimler Dergisi 2009.
  45. One-Way Analysis of Variance (ANOVA). Available online: https://mustafaotrar.net/istatistik/tek-yonlu-varyans-analizi-anova/. (accessed on 1 June 2020).
  46. SPSS. Available online: https://tr.wikipedia.org/wiki/SPSS. (accessed on 1 June 2020).
  47. Module 14 Structural Air Tightness, 25 Mayıs 2020, [Online], Erişim adresi: https://tippenergy.ie/wp-content/uploads/2011/09/Module-14-StructuralAirTightness.pdf.
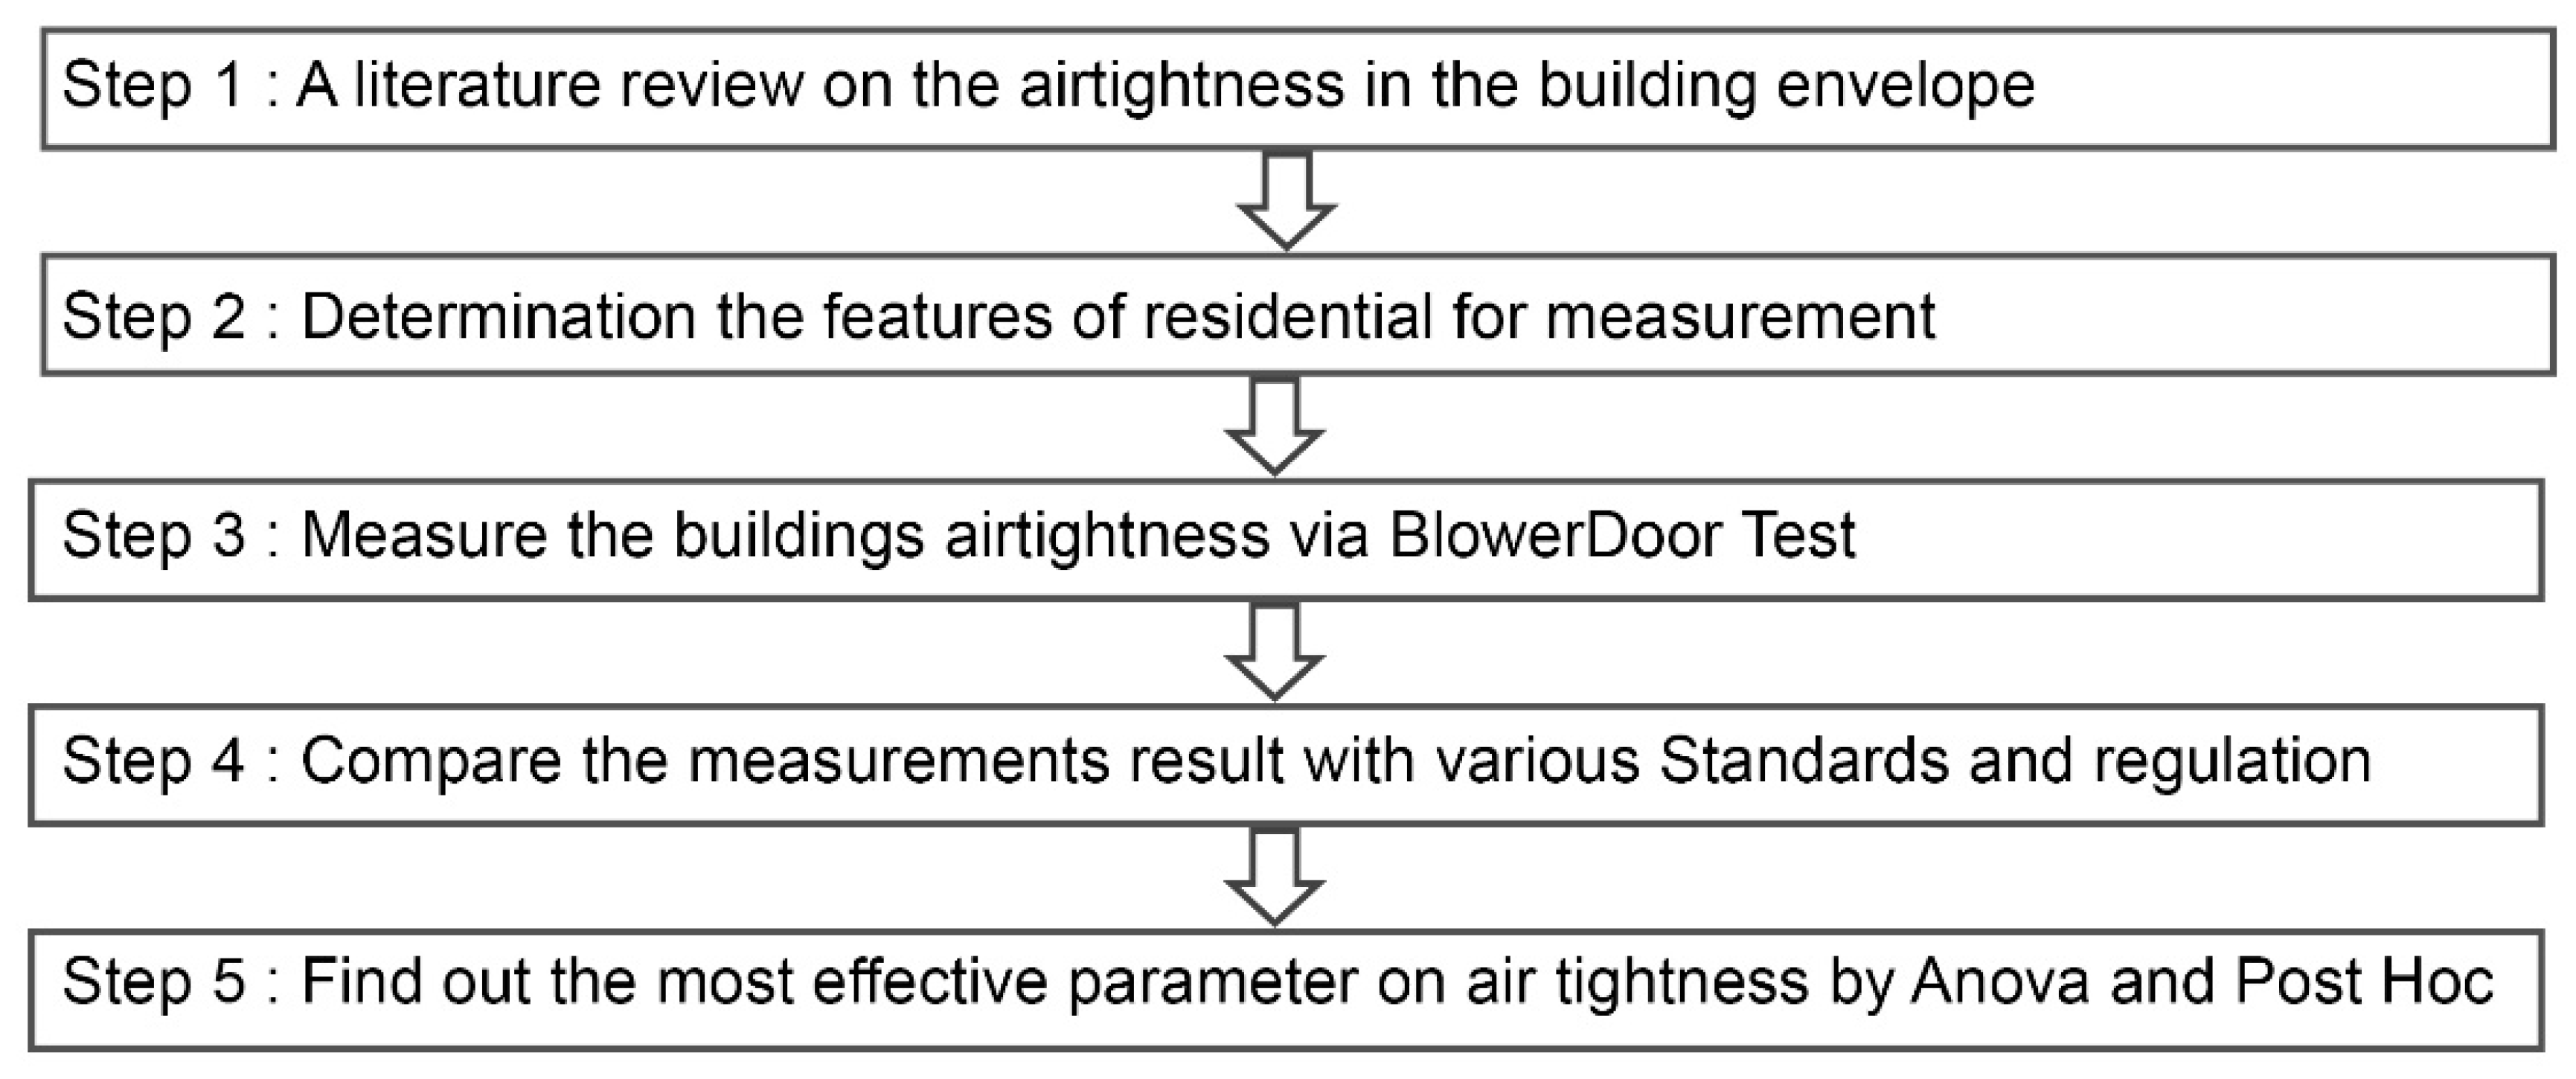
Figure 3. Main steps conducting this research.
Preprints 75398 g001
Figure 1. Location of Balıkesir in Turkey.
Preprints 75398 g002
Figure 2. Balikesir Province 2019 temperature and wind speed values [37].
Preprints 75398 g003
Figure 4. Evaluated houses in Balikesir Province.
Preprints 75398 g004
Figure 5. BlowerDoor Measurement.
Preprints 75398 g005
Figure 6. BDT result and thermal camera image of House 1.
Preprints 75398 g006
Figure 7. The n50 values of the evaluated houses.
Preprints 75398 g007
Figure 9. The effect of the investigated parameters on the n50 value.
Preprints 75398 g008
Figure 10. Average n50 values by years.
Preprints 75398 g009
Table 1. Limit values of air exchange rate (n50) at 50 Pa pressure difference according to TS 825 Standard [10].
Multi-flat buildings on the floor One-flat buildings on floor Sealing condition of the building envelope
n50 < 2 n50 < 4 High
2 ≤ n50 ≤ 5 4 ≤ n50 ≤ 10 Medium
5 < n50 10 < n50 Low
Table 2. Building envelope airtightness studies in the literature.
Researcher, Year Region&
Period
Aim Type and number of examined building Methodology and Tools Main Findings & Results
Sfakianaki et al., 2008 [12] Greece Determining airtightness in housing stock in Athens. Housing
20
Measurement BDT The airtightness performance of the examined houses was found to be low.
Alfano et al., 2012 [13] Italy Airtightness measurements in Mediterranean climate. Housing
20
Measurement BDT The average air exchange rate found quite high in buildings built before 1970.
Šadauskienė et al., 2012 [7] Lithuania Developing a methodology considering airtightness. Housing
27
Measurement BDT The average airtightness value of buildings was classified.
Vinha et al., 2015
[16]
Finland To determine the airtightness of 226 residences in Finland. Housing
226
Measurement BDT Insulation material in buildings were effective on the average values of ACH50.
Srba et al., 2016 [20] Czech Republic Analyzing airtightness performance of low-energy and passive houses. Housing
203
Measurement BDT Air leakage rate values in low-energy and passive buildings were defined.
Prignon et al. 2017 [17] - Literature review about building envelope airtightness. - Literature review Developing a new air tightness estimation tool for designers and contractors.
Lee et al. 2017 [28] - Investigating the most accurate tightness measurements of large buildings. - Literature review Obtain accurate △P values in measuring the airtightness of large buildings underlined.
Colijn et al., 2017 [25] Norway Investigation the effect of the workmanship quality on airtightness. Housing
44
Measurement BDT Attention was drawn to the effect of workmanships quality on air tightness.
Mortensen et al., 2017 [23] Denmark Examining the airtightness performance of houses (built 1880-2007). Housing
16
Measurement BDT Airtightness performance of the houses with old construction year is better than expected.
Hong et al., 2018 [18] South Korea Measuring airtightness in new apartment buildings. Housing
3
Measurement BDT ACH50 ranged from 0.7 to 1.0 h-1.
Munoz et al., 2019 [6] Spain To examine the effect of airtightness on energy consumption. Housing
225
Measurement BDT Air infiltration impact was found 2.43 to 16.44 kWh/m2·year on heating and 0.54 to 3.06 kWh/m2·year on cooling demand.
Munoz et al., 2019 [29] Spain Investigation of airtightness in Mediterranean climate region. Housing
129
Measurement BDT The average air permeability rate (q50) in single-family dwellings was found more than flats.
Ashdown et al., 2019 [24] UK Investigation the distribution of airtightness for residences built by the same contractor. Housing
901
Simulation ATTMA Stated that the improvement of airtightness between 2008 and 2011.
Zheng et al., 2020 [14] UK To compare the airtightness results of BDT and Pulse Test. Housing
1
Measurement BDT Air permeability at 4 Pa by both methods found a percentage difference of less than 16%.
Hsu et al., 2021 [15] China Comparing BlowerDoor and pulse test methods. Housing
1
Measurement BDT Both the pulse technique and the traditional BDT fan pressurization method are compatible with each other.
Yang et al., 2021 [26] China Measuring the airtightness of backdraft dampers and their effect on air quality. Housing
40
Measurement The airtightness of backdraft dampers varies greatly with air leakage ranging from 7 to 846 m3/(h⋅m2) at a static pressure difference of 250 Pa.
Paukštys et al., 2021 [30] Lithuania Determine heat losses of Buildings affecting airtightness. Housing
16
Measurement BDT Hollow clay unit masonry caused 7-11% less airtightness compared to sand-lime block masonry.
Kempton et al., 2022 [31] - Examining the effect of airtightness on indoor air quality. - Literature
review
A positive correlation was found between the air exchange rate and PM2.5 and NO2 concentrations.
Casado et al., 2022 [32] Spain Model for building envelope airtightness of residential. Housing
400
Measurement
Model BDT
A procedure presented for the airtightness prediction of residentials in Spain.
Zheng et al., 2022 [33] China Determining airtightness performance of residences. Housing
14
Measurement BDT Stricter regulations increase the building's airtightness performance.
Hsu et al., 2022 [15] Nottingham Airtightness under natural wind conditions in University. Housing
1
Measurement Pulse Test The maximum wind speed threshold is 5.0 m/s at 2.2 m above ground level.
Hong et al., 2022 [27] South Korea Performing experimental analysis of airtightness in residential. Housing
12
Measurement BDT Airtightness performance new buildings increased about 3-4 times compared to old buildings.
Zheng et al., 2022 [34] UK Compare BDT and Pulse Test results. Housing
2
Measurement BDT- Pulse Test Observed that it can cause a deviation of 42-60% between both test methods.
Banister et al., 2022 [35] Canada Building envelope sealing performance of office buildings. Office
6
Measurement BDT Air leakage rates found lower than the ASHRAE 90.1 standard limits values.
Table 7. Post Hoc test result by years.
Dependent Variable: Airtightness
Bonferroni
(I) Building_age (J) Building_age Mean Difference (I-J) Std. Error Sig. 95% Confidence Interval
Lower Bound Upper Bound
1990-2000 2000-2010 6,20597 4,44575 ,511 -4,9033 17,3153
2010-2020 5,15503 3,93197 ,592 -4,6704 14,9805
2000-2010 1990-2000 -6,20597 4,44575 ,511 -17,3153 4,9033
2010-2020 -1,05095 3,32690 1,000 -9,3644 7,2625
2010-2020 1990-2000 -5,15503 3,93197 ,592 -14,9805 4,6704
2000-2010 1,05095 3,32690 1,000 -7,2625 9,3644
Table 8. Post Hoc test result by usage area.
Dependent Variable: Airtightness
Bonferroni
(I) Usage_area (J) Usage_area Mean Difference (I-J) Std. Error Sig. 95% Confidence Interval
Lower Bound Upper Bound
<50 50-100 10,21232* 2,57369 <,001 3,7810 16,6436
100< 13,13667* 4,00460 ,006 3,1298 23,1436
50-100 <50 -10,21232* 2,57369 <,001 -16,6436 -3,7810
100< 2,92435 3,82653 1,000 -6,6376 12,4863
100< <50 -13,13667* 4,00460 ,006 -23,1436 -3,1298
50-100 -2,92435 3,82653 1,000 -12,4863 6,6376
*. The mean difference is significant at the 0.05 level.
Table 9.
Dependent Variable: Airtightness
Bonferroni
(I) Facade_ratio (J) Facade_ratio Mean Difference (I-J) Std. Error Sig. 95% Confidence Interval
Lower Bound Upper Bound
0-0,35 0,35-0,70 -5,96963 3,44380 ,272 -14,5752 2,6359
0,70-1,00 -12,62250* 4,27760 ,016 -23,3116 -1,9334
0,35-0,70 0-0,35 5,96963 3,44380 ,272 -2,6359 14,5752
0,70-1,00 -6,65287 3,44380 ,181 -15,2584 1,9527
0,70-1,00 0-0,35 12,62250* 4,27760 ,016 1,9334 23,3116
0,35-0,70 6,65287 3,44380 ,181 -1,9527 15,2584
*. The mean difference is significant at the 0.05 level.
Disclaimer/Publisher’s Note: The statements, opinions and data contained in all publications are solely those of the individual author(s) and contributor(s) and not of MDPI and/or the editor(s). MDPI and/or the editor(s) disclaim responsibility for any injury to people or property resulting from any ideas, methods, instructions or products referred to in the content.
Copyright: This open access article is published under a Creative Commons CC BY 4.0 license, which permit the free download, distribution, and reuse, provided that the author and preprint are cited in any reuse.
Prerpints.org logo

Preprints.org is a free preprint server supported by MDPI in Basel, Switzerland.

Subscribe

© 2024 MDPI (Basel, Switzerland) unless otherwise stated