1. Introduction:
Spinocerebellar ataxia type 1 (SCA1) is a lethal neurodegenerative disease with autosomal dominant inheritance. There is no effective therapy that would significantly delay the neurodegenerative process and the development of disability in SCA1 patients so far. SCA1 is caused by CAG repeat expansion (more than 40 CAG repeats) in the gene encoding ataxin-1 (ATXN1) protein [
1] playing a role in regulation of mitochondrial bioenergetics in the cerebellum [
2]. The mutation leads to the accumulation of a protein with the expanded polyglutamine tract, its misfolding, aggregation and formation of intranuclear inclusions that impair the function and viability of neurons [
1,
3]. ATXN1 is widely expressed throughout the brain [
1]. Therefore, subsequent pathogenetic chain leads to dysfunction and degeneration of the cerebellum, brainstem, and hippocampus [
4,
5,
6,
7].
Complex neuropathology includes slowly progressive degeneration of cerebellar Purkinje cells [
6] as well as reduction of dendritic arborization of hippocampal neurons [
4,
8]. Suppression of neurogenesis and neuroplasticity [
4,
9], changes in the brain vascular system [
10], and glial activation [
11,
12] participate in the neurodegenerative process. Furthermore, disruption of mitochondrial functions and increased production of reactive oxygen species (ROS) in the cerebellum have been found and might be not only a consequence of cell metabolism disorder but also a factor contributing to primary and/or secondary regressive changes and cell death [
2,
13,
14].
As a consequence of cerebellar degeneration, both SCA1 mice and SCA1 patients develop cerebellar ataxia [
15]. In patients with SCA1, oculomotor disorders, bulbar syndrome, respiratory disorders have also been reported [
16]. Nevertheless, SCA1 leads also to neuropsychiatric problems, including cognitive impairment, anxiety, apathy, and depression that can be seen in both humans and mouse models [
17,
18,
19,
20,
21,
22,
23,
24]. Also changes in functions associated with hippocampal plasticity have been described [
9,
25,
26]. Hippocampal plasticity depends crucially on the proper functioning of mitochondria [
27] (for review see [
28,
29]). Tichanek, F.;Salomova, M.;Jedlicka, J.;Kuncova, J.;Pitule, P.;Macanova, T.;Petrankova, Z.;Tuma, Z.;Cendelin, J. [
4] pointed to significantly impaired mitochondrial function specifically in the hippocampus of SCA1 mice and suggested that mitochondrial dysfunction may significantly contribute to the hippocampal neuropathology in SCA1. Therefore, drugs targeting mitochondrial dysfunction and its consequences (e.g. increased oxidative stress) could potentially have a therapeutic effect in SCA1.
One of the useful approaches in searching for therapeutic possibilities is drug repurposing which reduces timelines, risks, and costs compared to novel drug development (for review see [
30]). Neuroprotective substances having therapeutic effect in other neurological diseases have been often shown to help in some, but not all cerebellar diseases (for review see [
31,
32]). Studies in pre-clinical models can identify promising substances to be tested in human patients during clinical trials (for review see [
33]). For such drugs, their pharmacodynamics, side effects safety etc. are already known and thus, there is a chance for faster validation process before routine clinical use to treat cerebellar diseases. One of the potential drugs for this purpose could be edaravone (MCI-186).
In clinical practice, edaravone is used in acute ischemic stroke since it reduces neurological deficits in the patients [
34,
35,
36]. Later it has been approved for the treatment of amyotrophic lateral sclerosis (ALS) [
37]. Surprisingly, edaravone has not been studied in connection with spinocerebellar ataxias yet. There are reasons that make edaravone a potential agent for improving the condition of patients with SCA:
1) Edaravone has been shown effective in other neurological diseases – stroke and ALS [
35,
36,
37] - and thus it is a good candidate for drug repurposing studies. Particularly, ALS is a disease whose pathophysiology partially overlaps with SCA1 [
38,
39].
2) Edaravone is a mitochondrial-targeting drug that acts as a free radical scavenger (for review see [
40]). It protects neurons and various types of glia from oxidative stress-induced cell death [
41,
42,
43,
44].
3) Mitochondrial function is disturbed in SCA1 [
4,
45] and mitochondria-targeted antioxidant MitoQ ameliorated mitochondrial activity, reduced oxidative stress-induced DNA damage and Purkinje cell loss and improved motor coordination in SCA1 mice [
45].
4) Edaravone suppresses the inflammatory response [
46], which also accompanies SCA1 [
11].
Therefore, the study aimed to assess the therapeutic potential of chronic edaravone administration in heterozygous SCA1 mice with 154 CAG repeats (SCA1
154Q/2Q) and healthy wild type (WT) mice (SCA1
2Q/2Q). For this purpose, we established 4 experimental groups of mice: SCA1
154Q/2Q edaravone-treated (SCA1_E), SCA1
154Q/2Q saline-treated (SCA1_0), SCA1
2Q/2Q edaravone-treated (WT_E) and SCA1
2Q/2Q saline-treated (WT_0). Each group consisted of 2 cohorts. One cohort of was treated with edaravone or saline for 95 days after which the mice were subjected to a 2-week series of experiments during which the treatment still continued. After that, the mice were euthanized to collect brains for histological examination. The other cohort of mice was treated for 100 days. Then the mice were euthanized to take brains for mitochondrial function examination and biochemical analyses (
Figure 1).
3. Discussion
This study aimed to examine potential effects of mitochondria-targeting drug edaravone in a mouse model of SCA1. The study included also examinations of wild type mice of the same strain and colony as indicators of basal levels of measured parameters and to see possible negative or positive effects of edaravone in healthy individuals. Therefore, the experiment also permitted to compare saline-treated SCA1 and healthy mice to verify or precise earlier descriptions of pathological phenotype of this mouse model. We have confirmed most of the behavioral, cognitive and motor deficits described in SCA1 mice before [
4,
6].
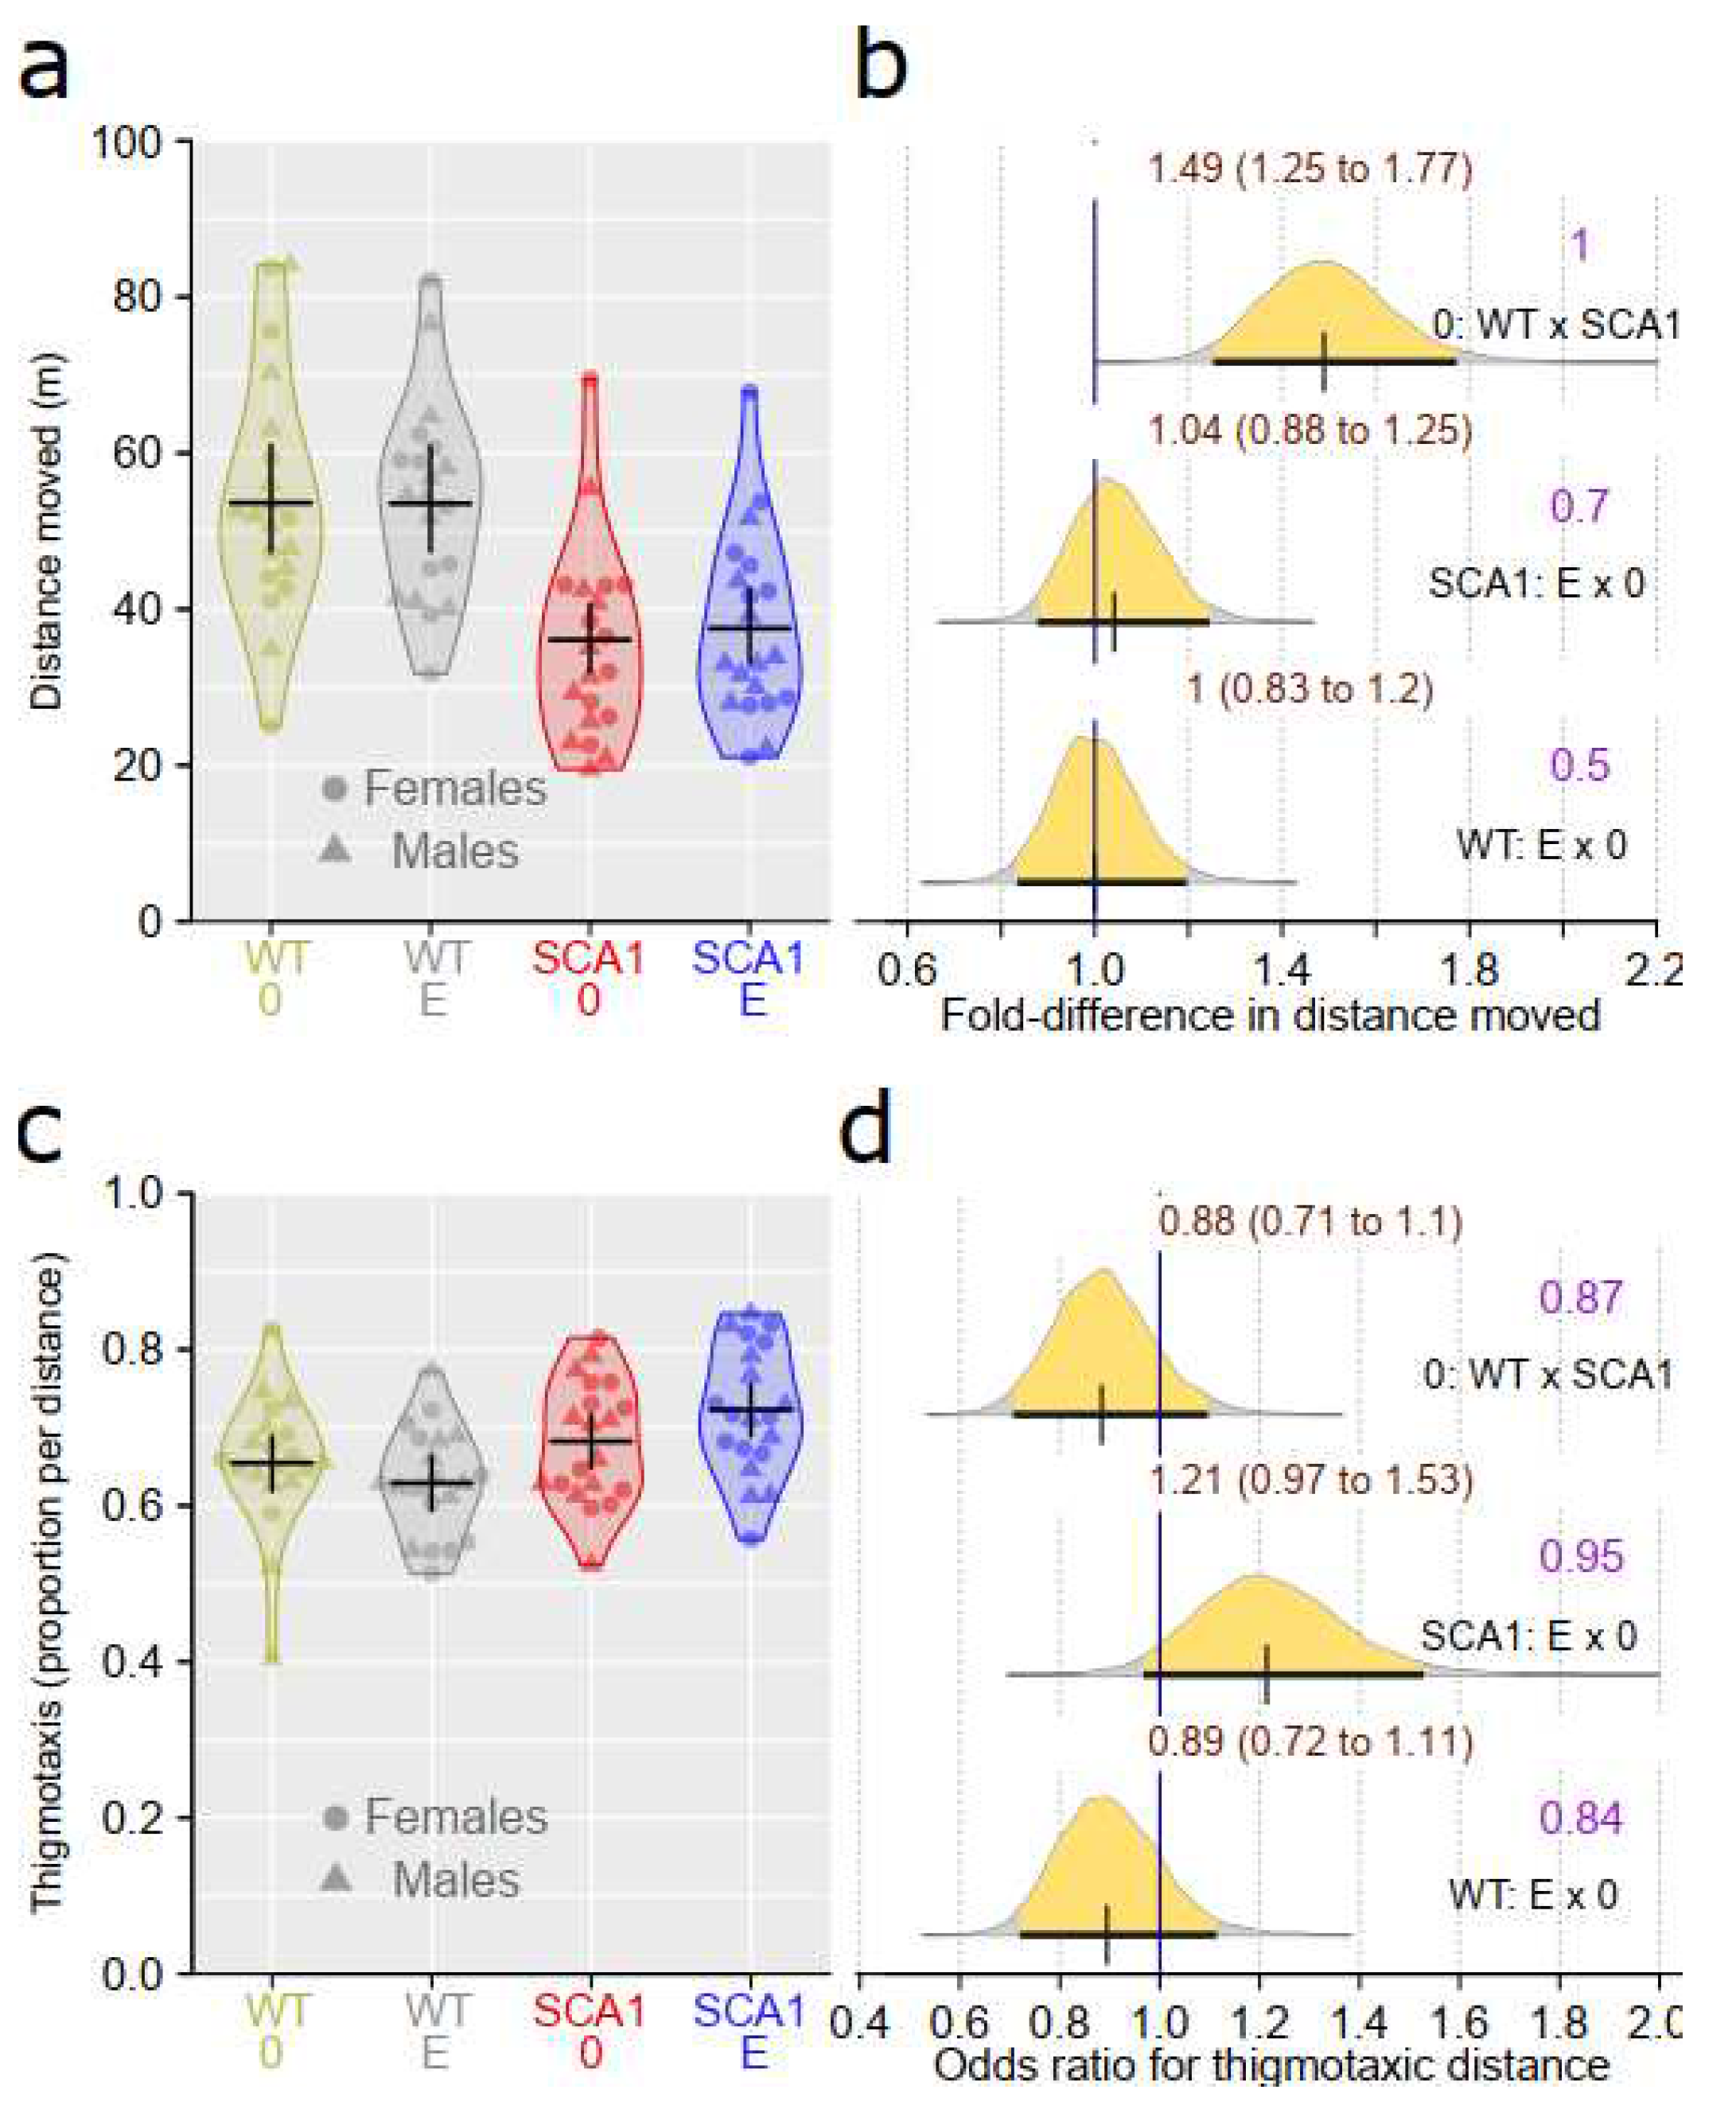
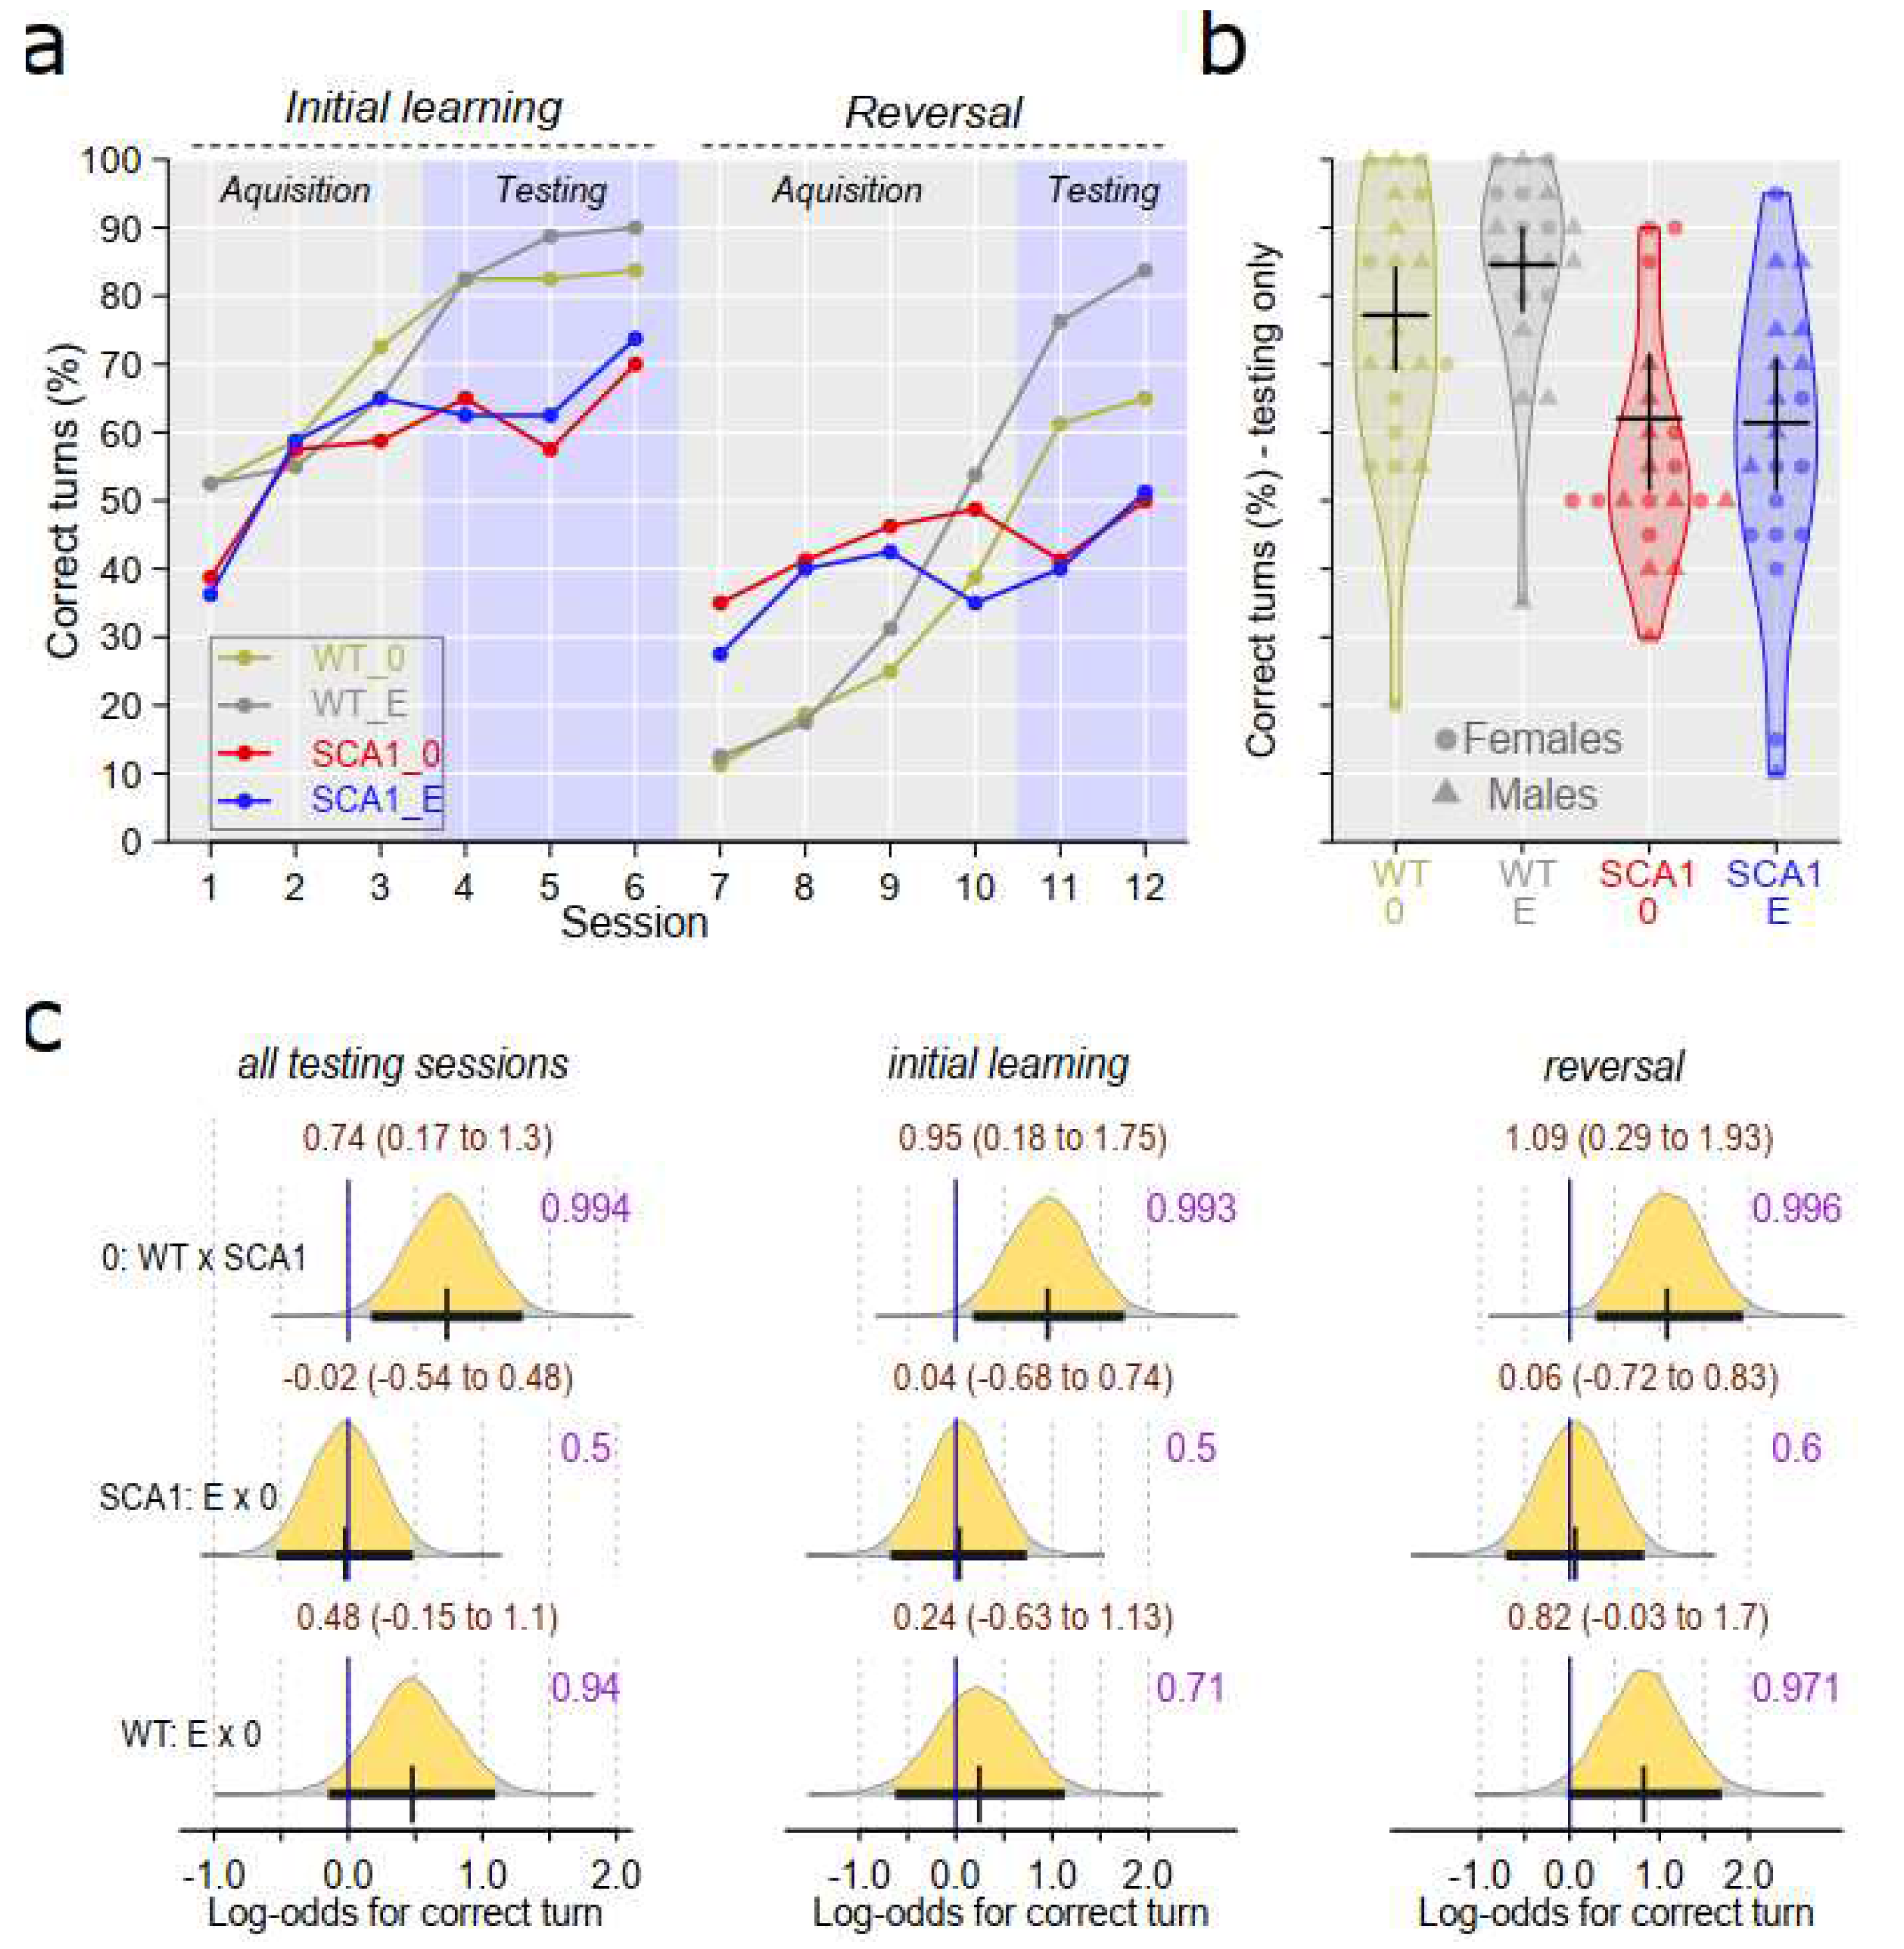
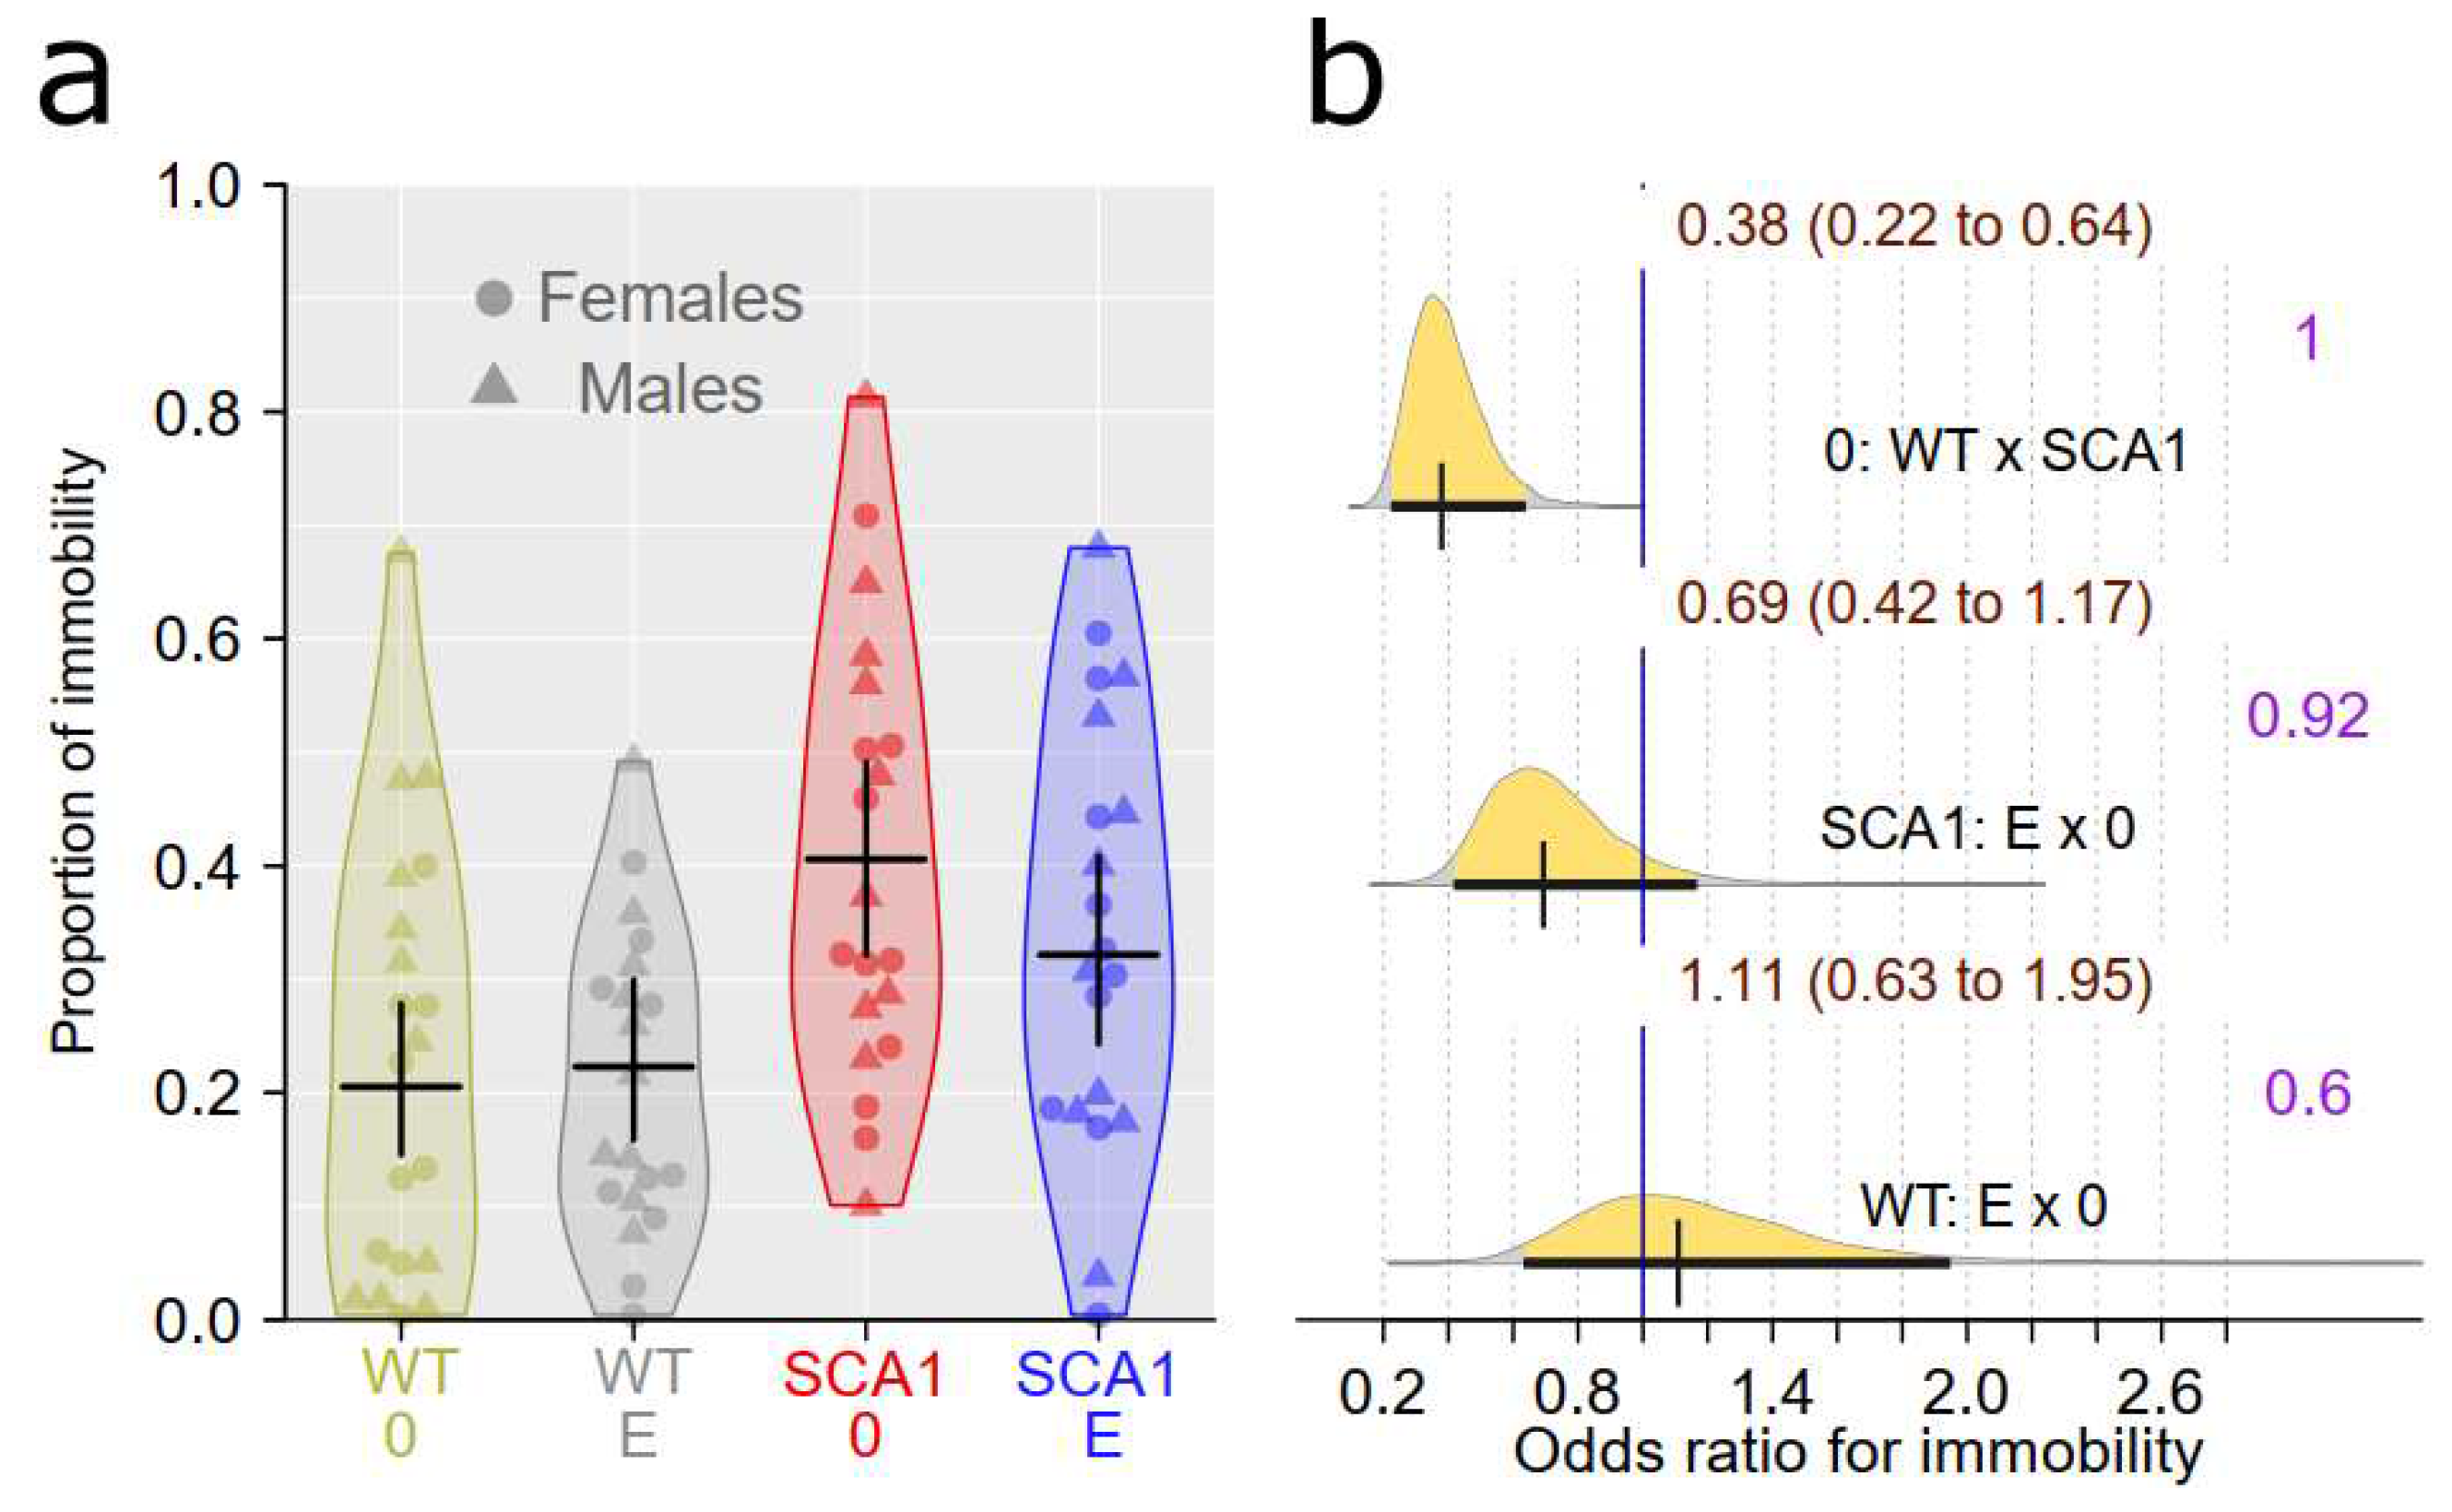
SCA1 mice showed reduced activity in the open field but not significantly increased preference of the arena periphery. Even when thigmotaxis was expressed as percentage of time spent in the peripheral zone (data not shown) instead of percentage of distance moved, the difference was not high. Increase in immobility responses in the forced swimming test as well as reduced learning ability and cognitive flexibility in the T-maze were observed as expected. Slightly higher percentage of correct responses in first sessions of the reversal task in the T-maze in SCA1 mice than in WT animals seen on
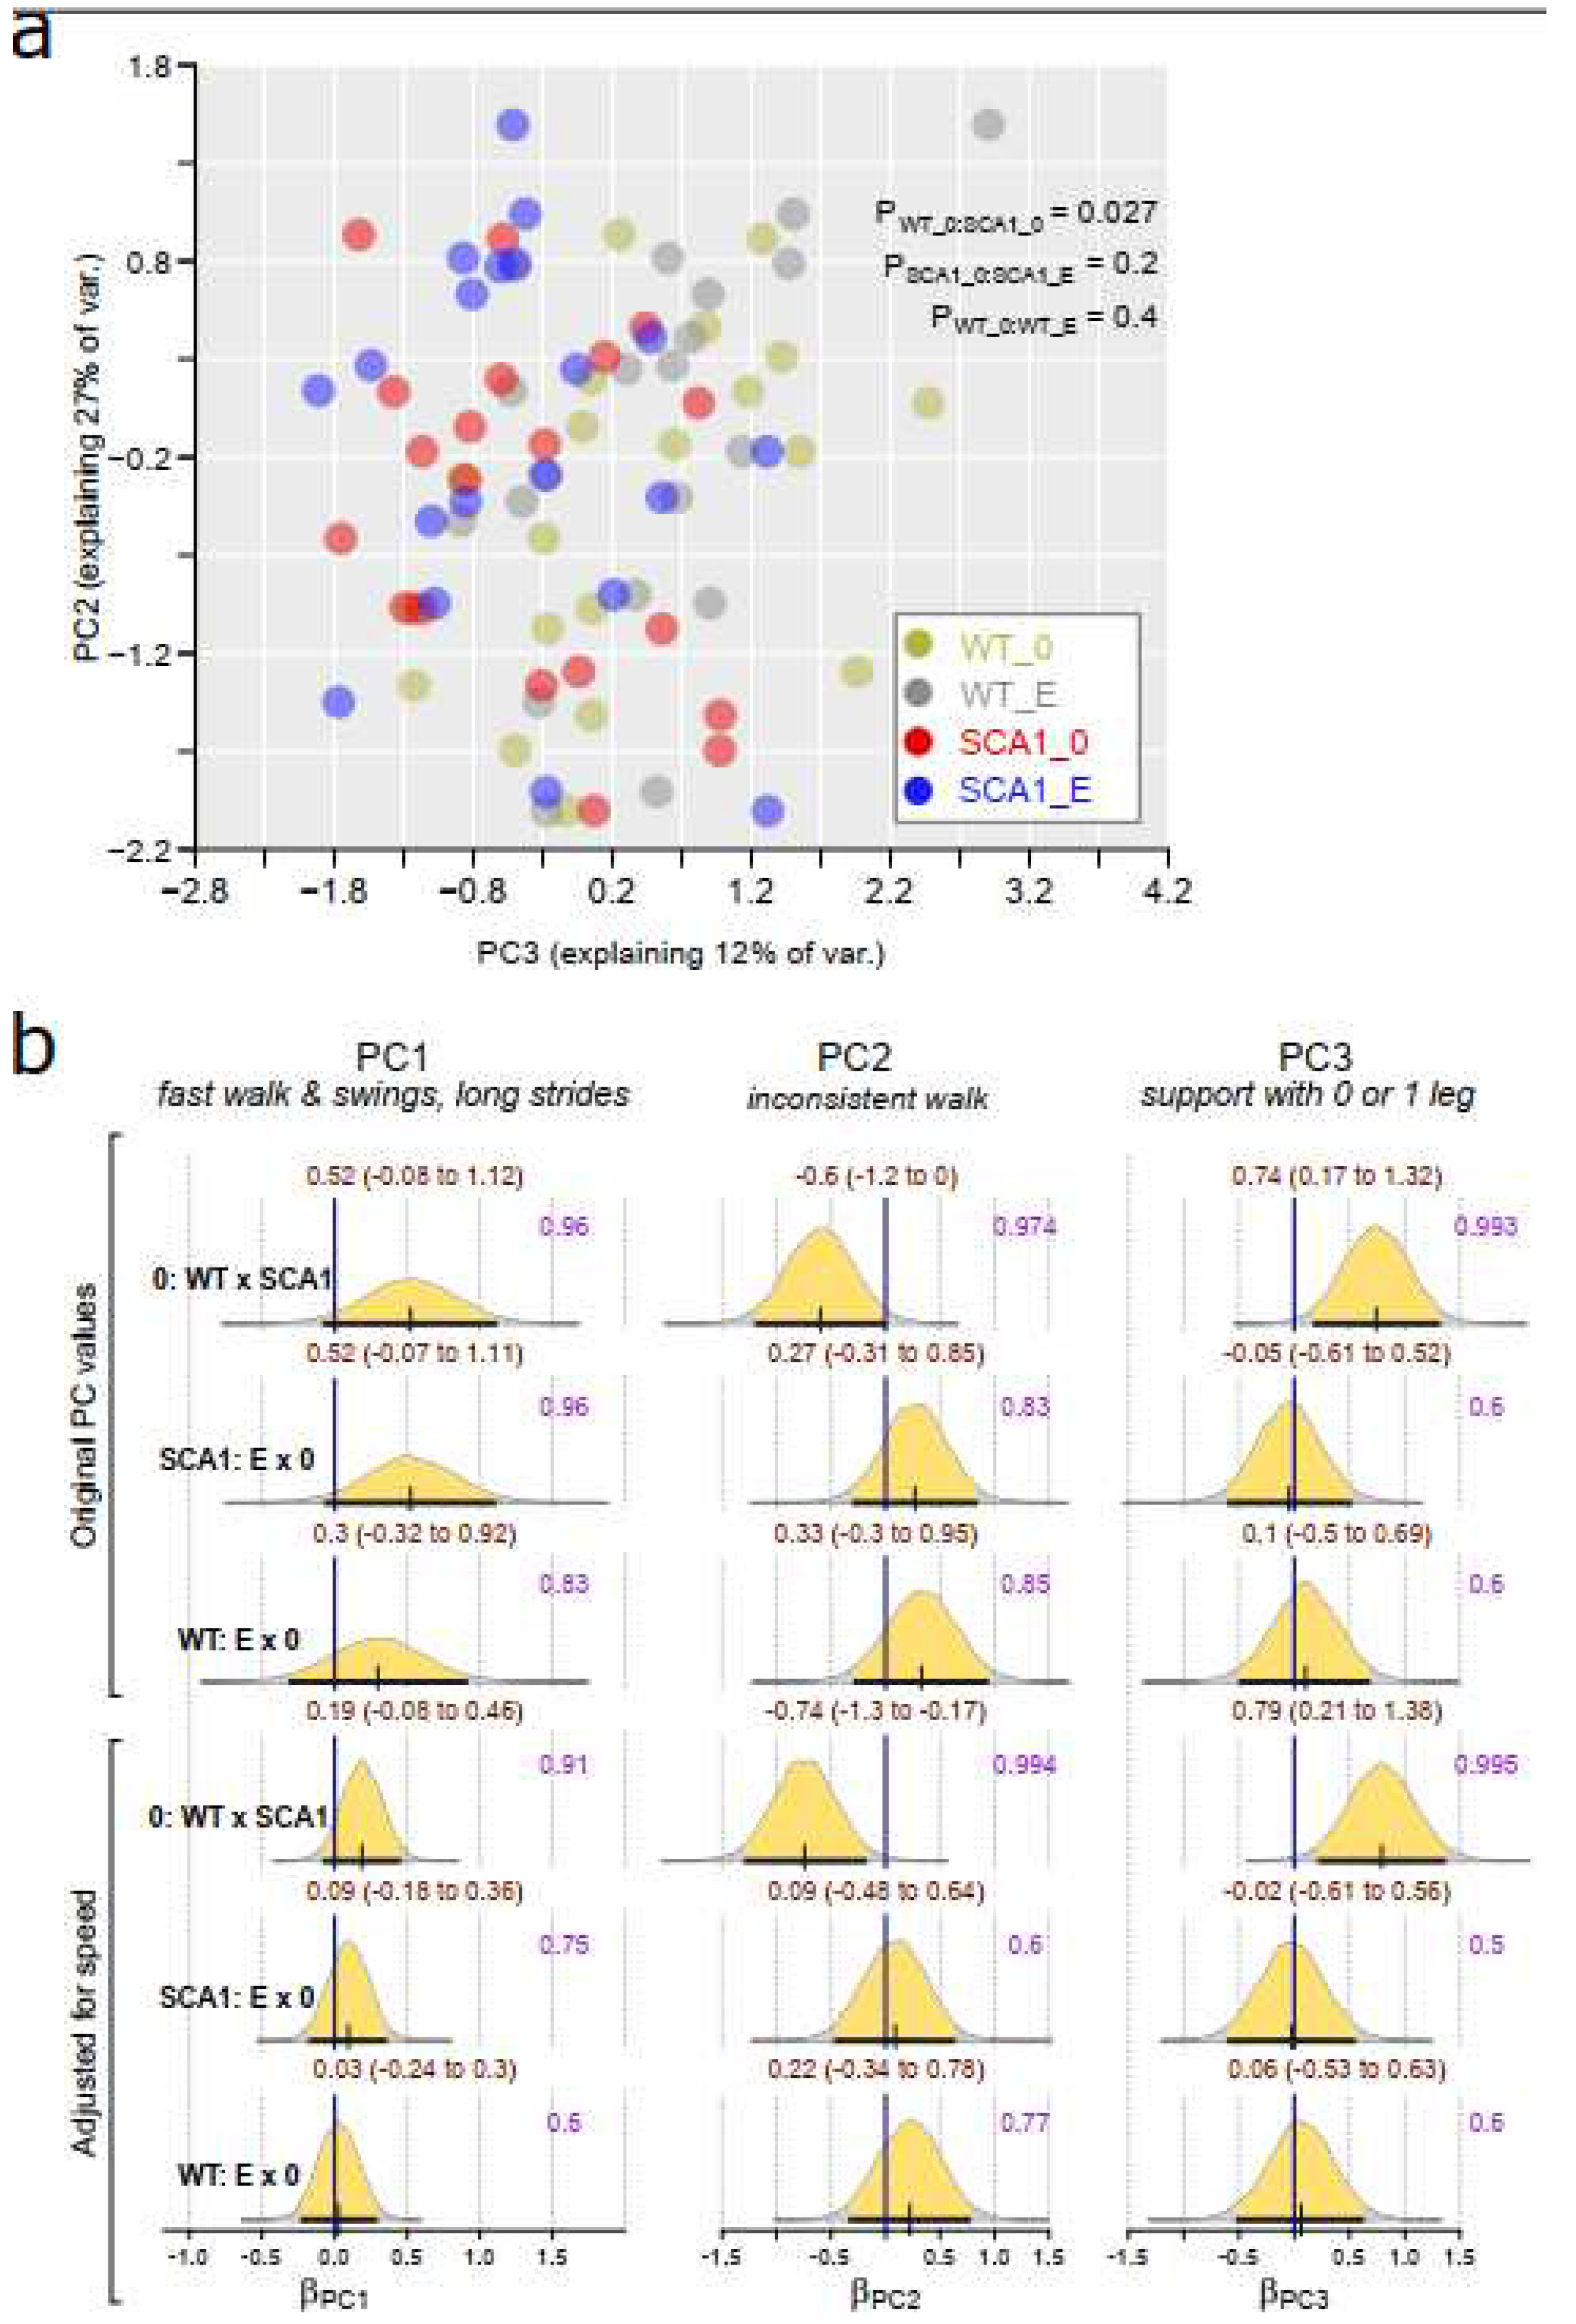
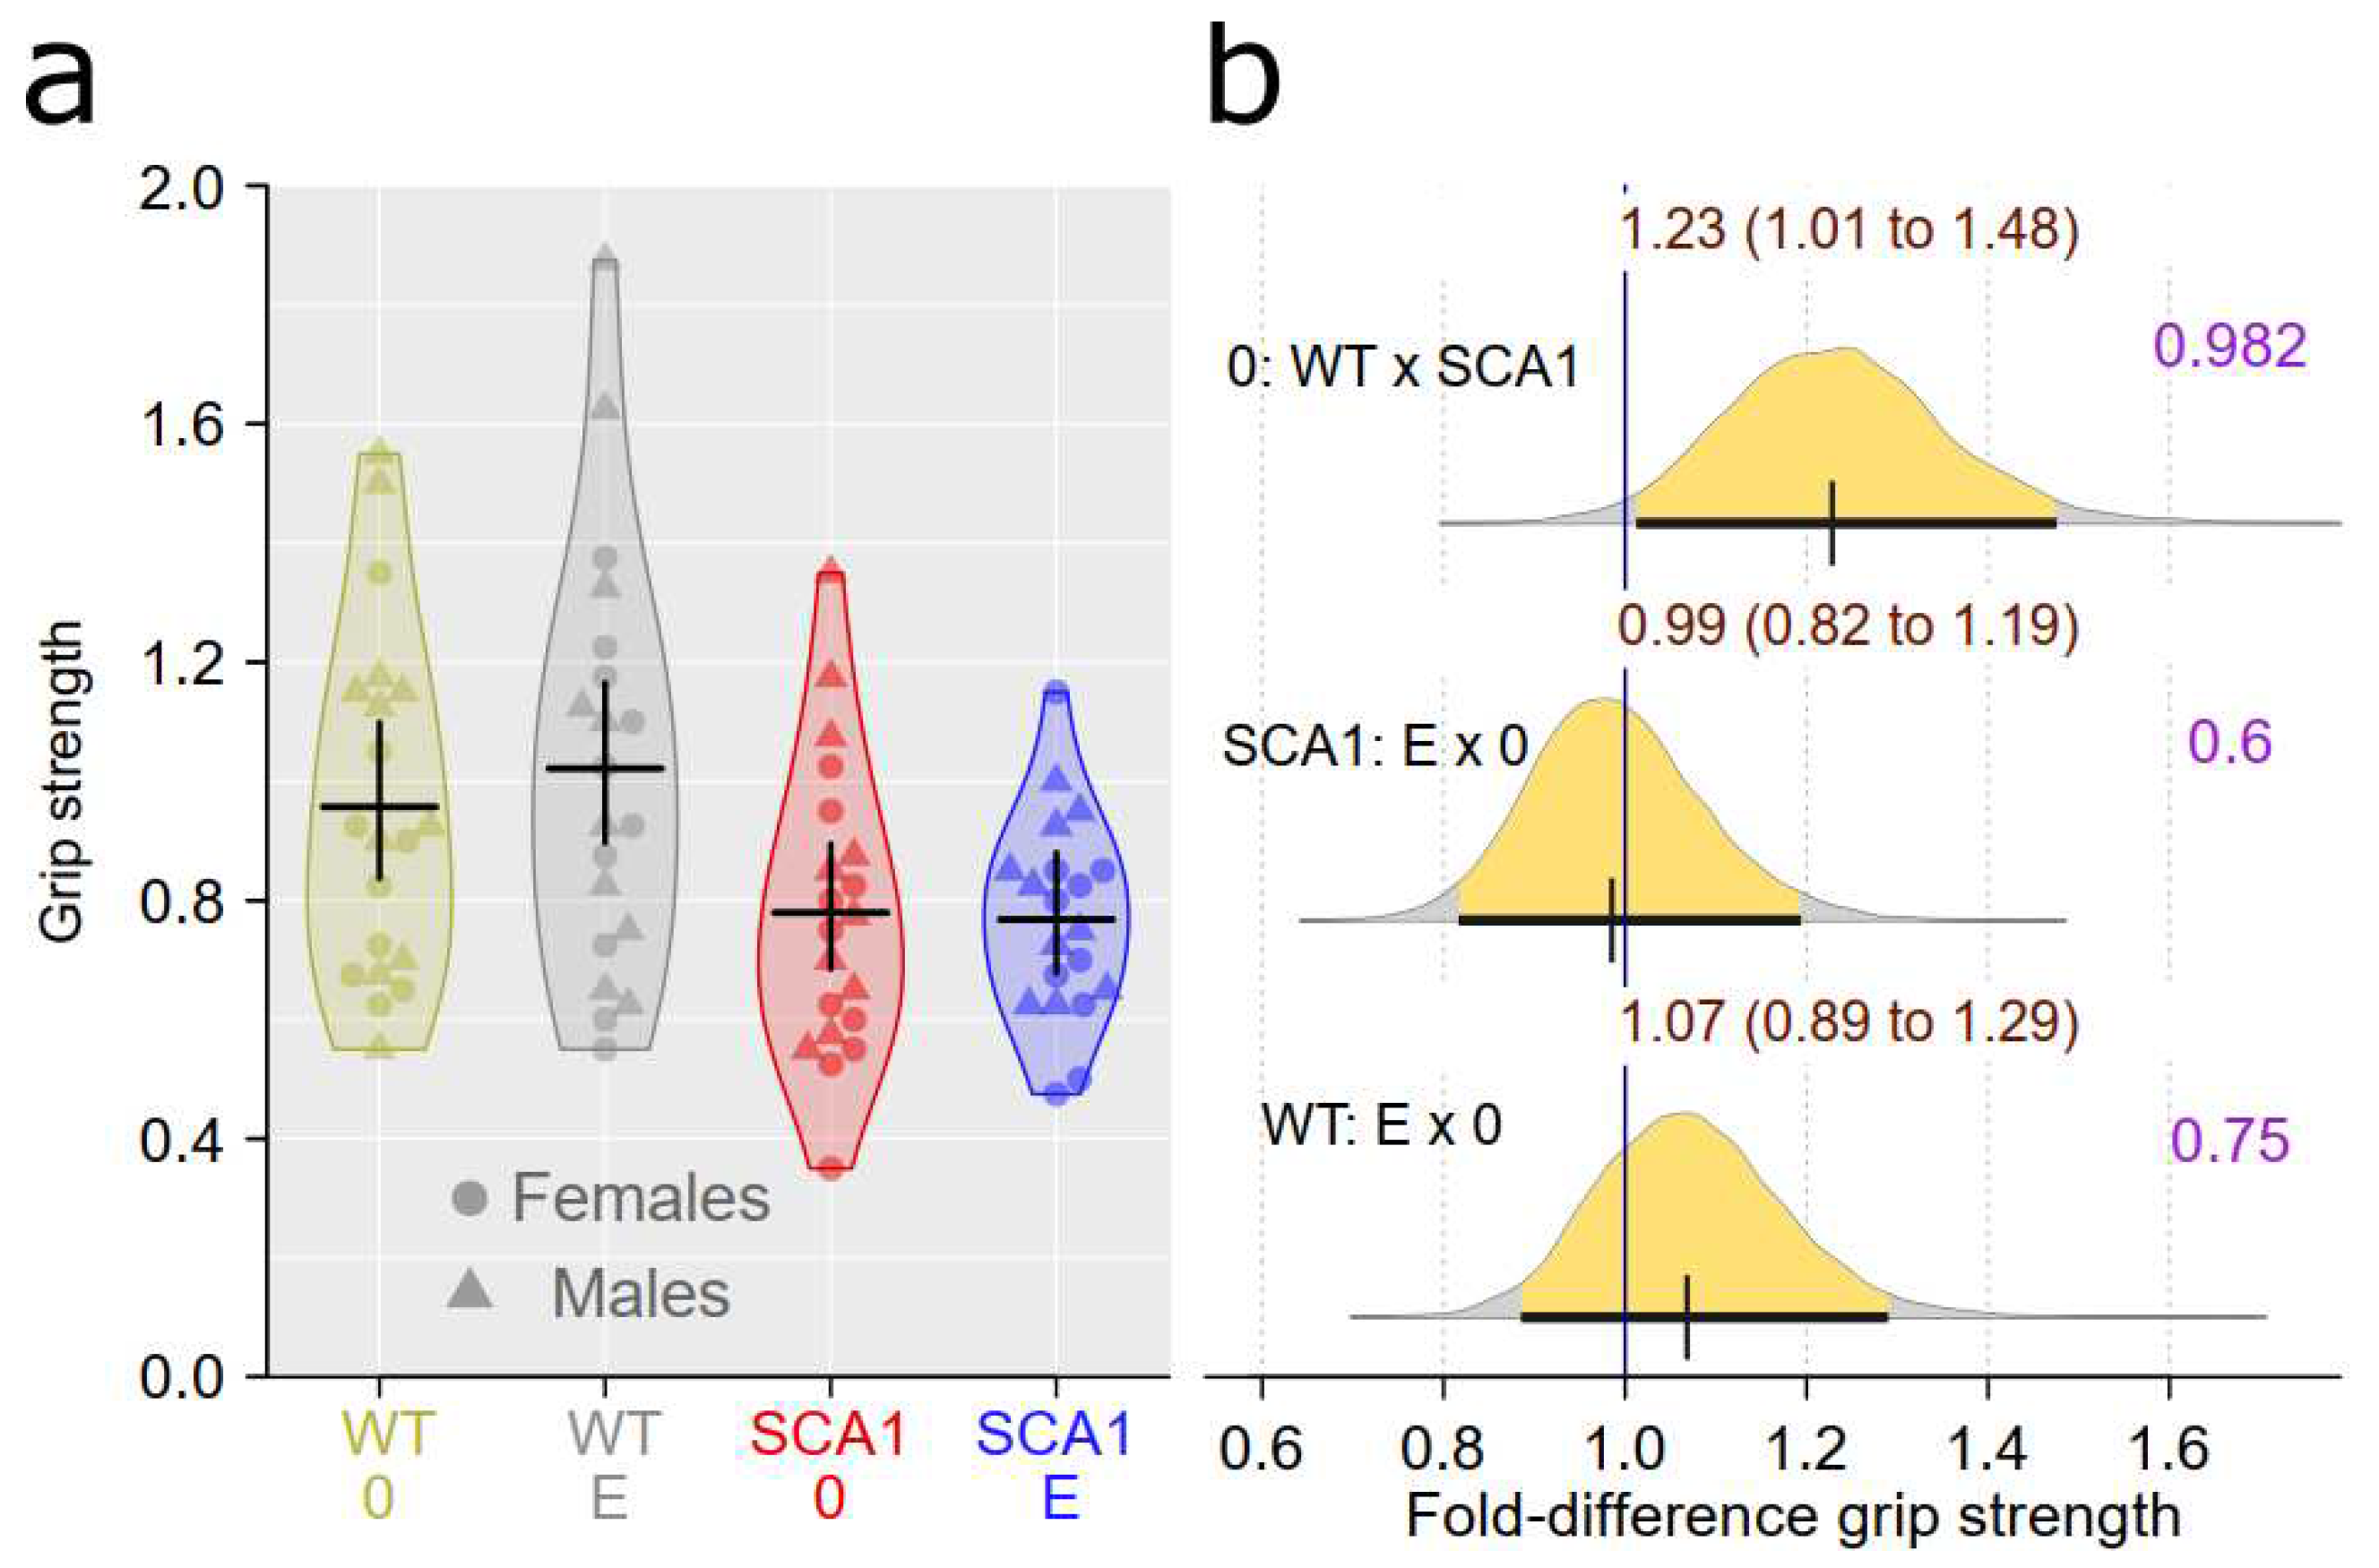
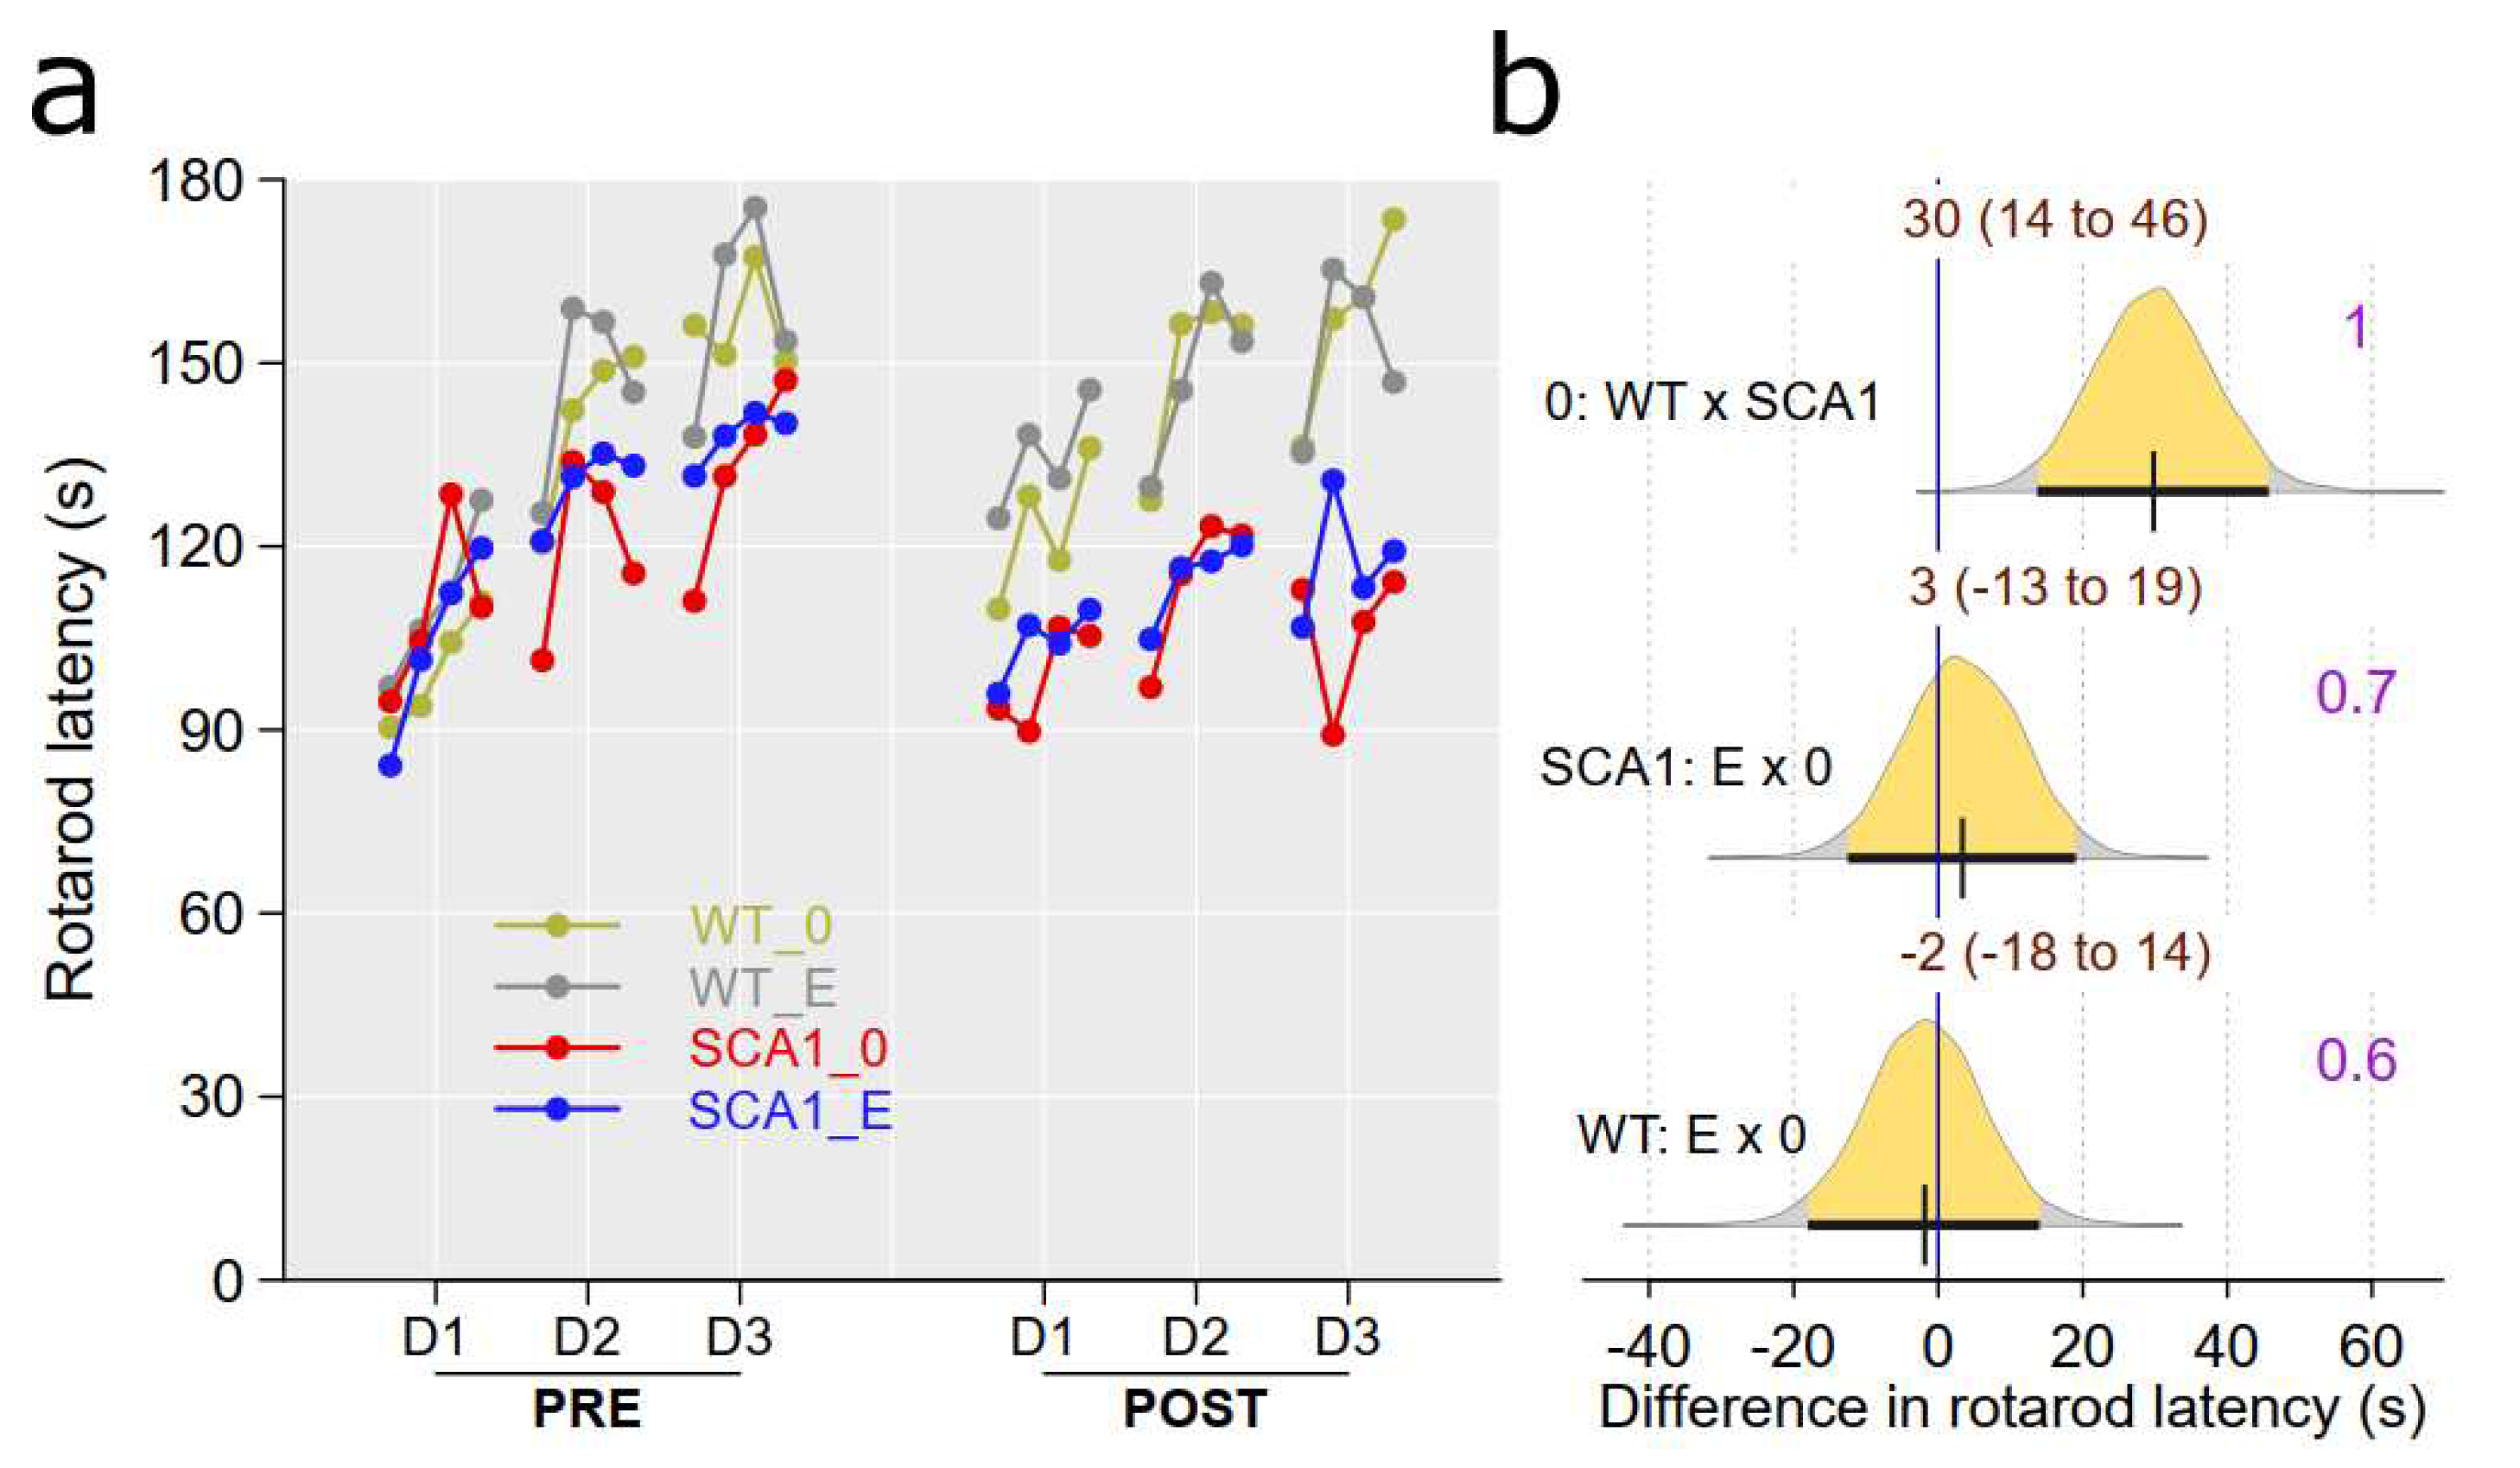
Figure 5 was probably just due to overall worse performance of SCA1 mice in the initial learning phase of the test. After changing platform position, incorrect choices became correct and thus increased score of the SCA1 mice. On the other hand, WT mice followed the former well-learned lateralization, which in the reversal task became incorrect and which reduced their score for few trials needed to learn a new state. Thus, this phenomenon seen after changing platform position, in fact, confirms cognitive deficit in SCA1 mice. Although 23-24 weeks old SCA1 mice are not apparently ataxic, motor tests showed deficits in muscle strength, balance and movement coordination (rotarod test) and overall gait structure (CatWalk).
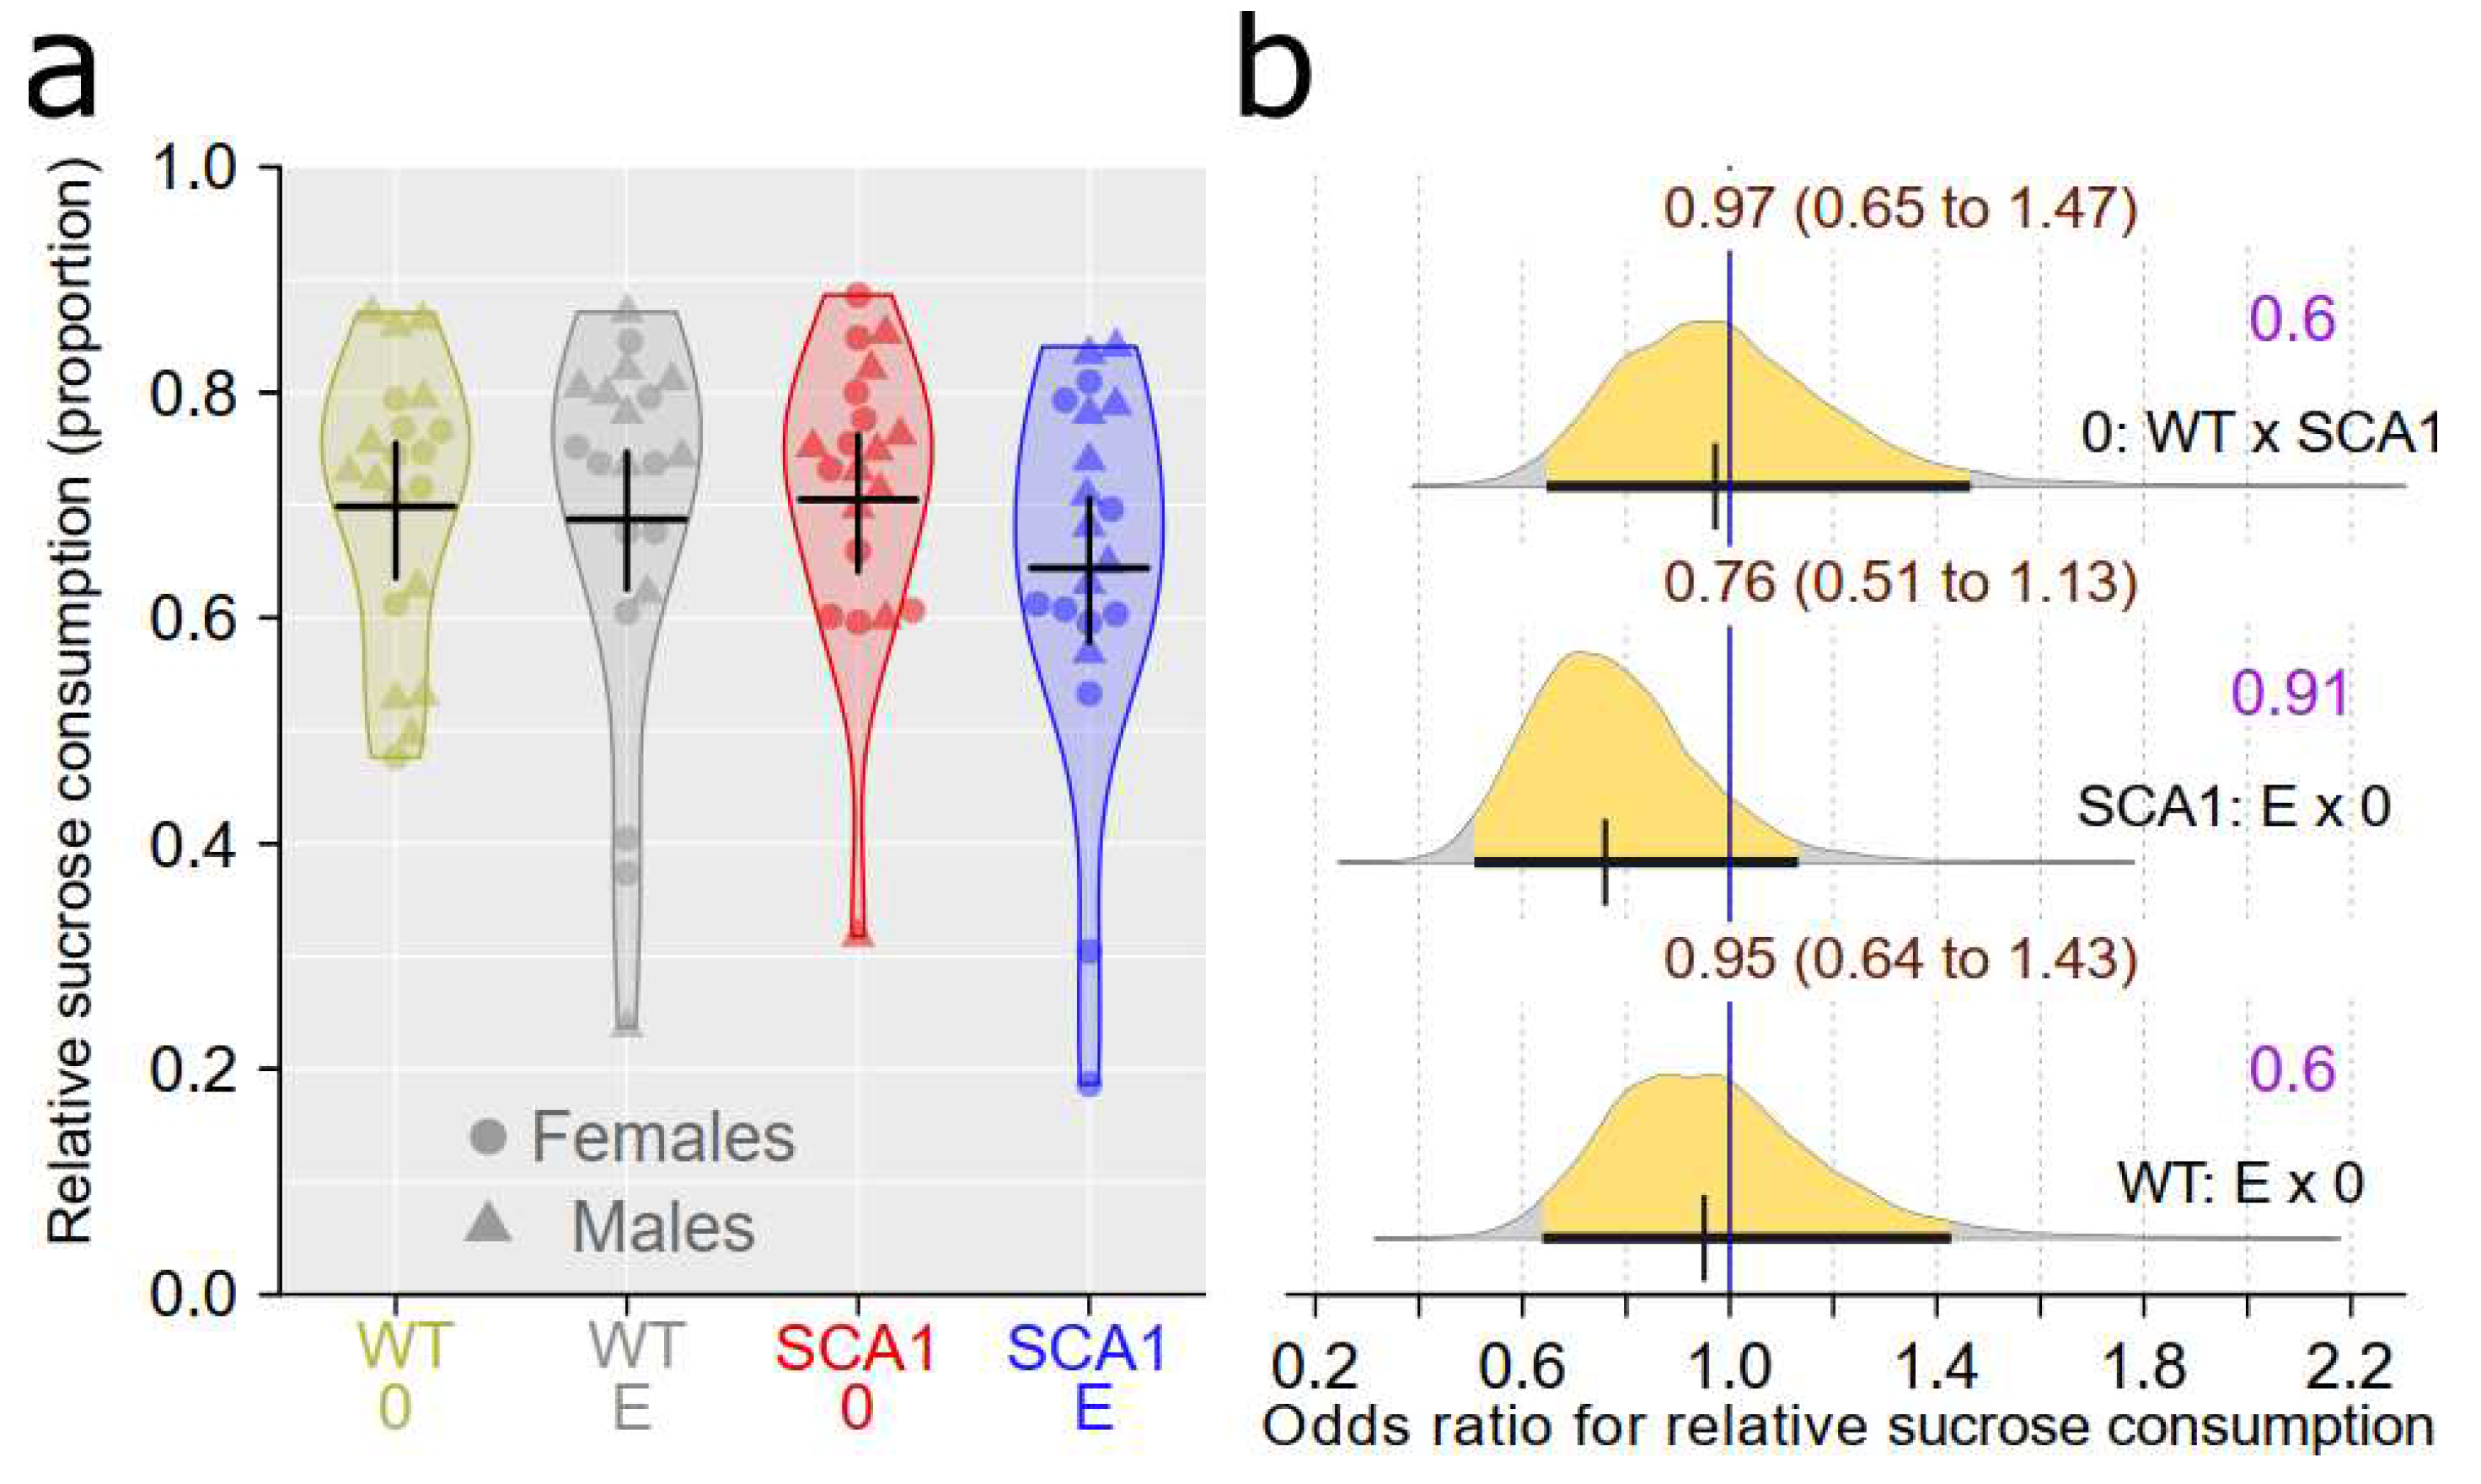
Among behavioral examinations, an exception was the sucrose preference test in which reduced sucrose consumption in 12-weeks-old SCA1 mice was found previously [
4] but not in the recent study, which used much older animals. Since hippocampal pathology precedes development of significant cerebellar dysfunction [
4] and as Tichanek [
7] pointed out cerebellar impairment can induce opposite changes in the behavior than hippocampal dysfunction, some behavioral abnormalities can be reduced with age and progress of the cerebellar component of the disease. Furthermore, results of this test are controversial in general since both reduced as well as increased sucrose preference in SCA1 mice have been reported before [
4,
23]. In cerebellar mutant mice, depressive- and anxiety-like behavior and anhedonia on one hand and reduced anxiety on the other hand can manifest. The first occurs in the case of significant extracerebellar neuropathology, the latter rather in mice with selective cerebellar damage [
4,
23,
48,
49,
50,
51,
52,
53,
54]. While depression and anhedonia would correspond with reduced sucrose preference, stereotypies, perseveration and disinhibited behavior might lead to abundant sucrose intake in some individuals. Furthermore, Asher et al. [
23] have suggested that metabolic changes of SCA1 mice can also modify their saccharide intake.
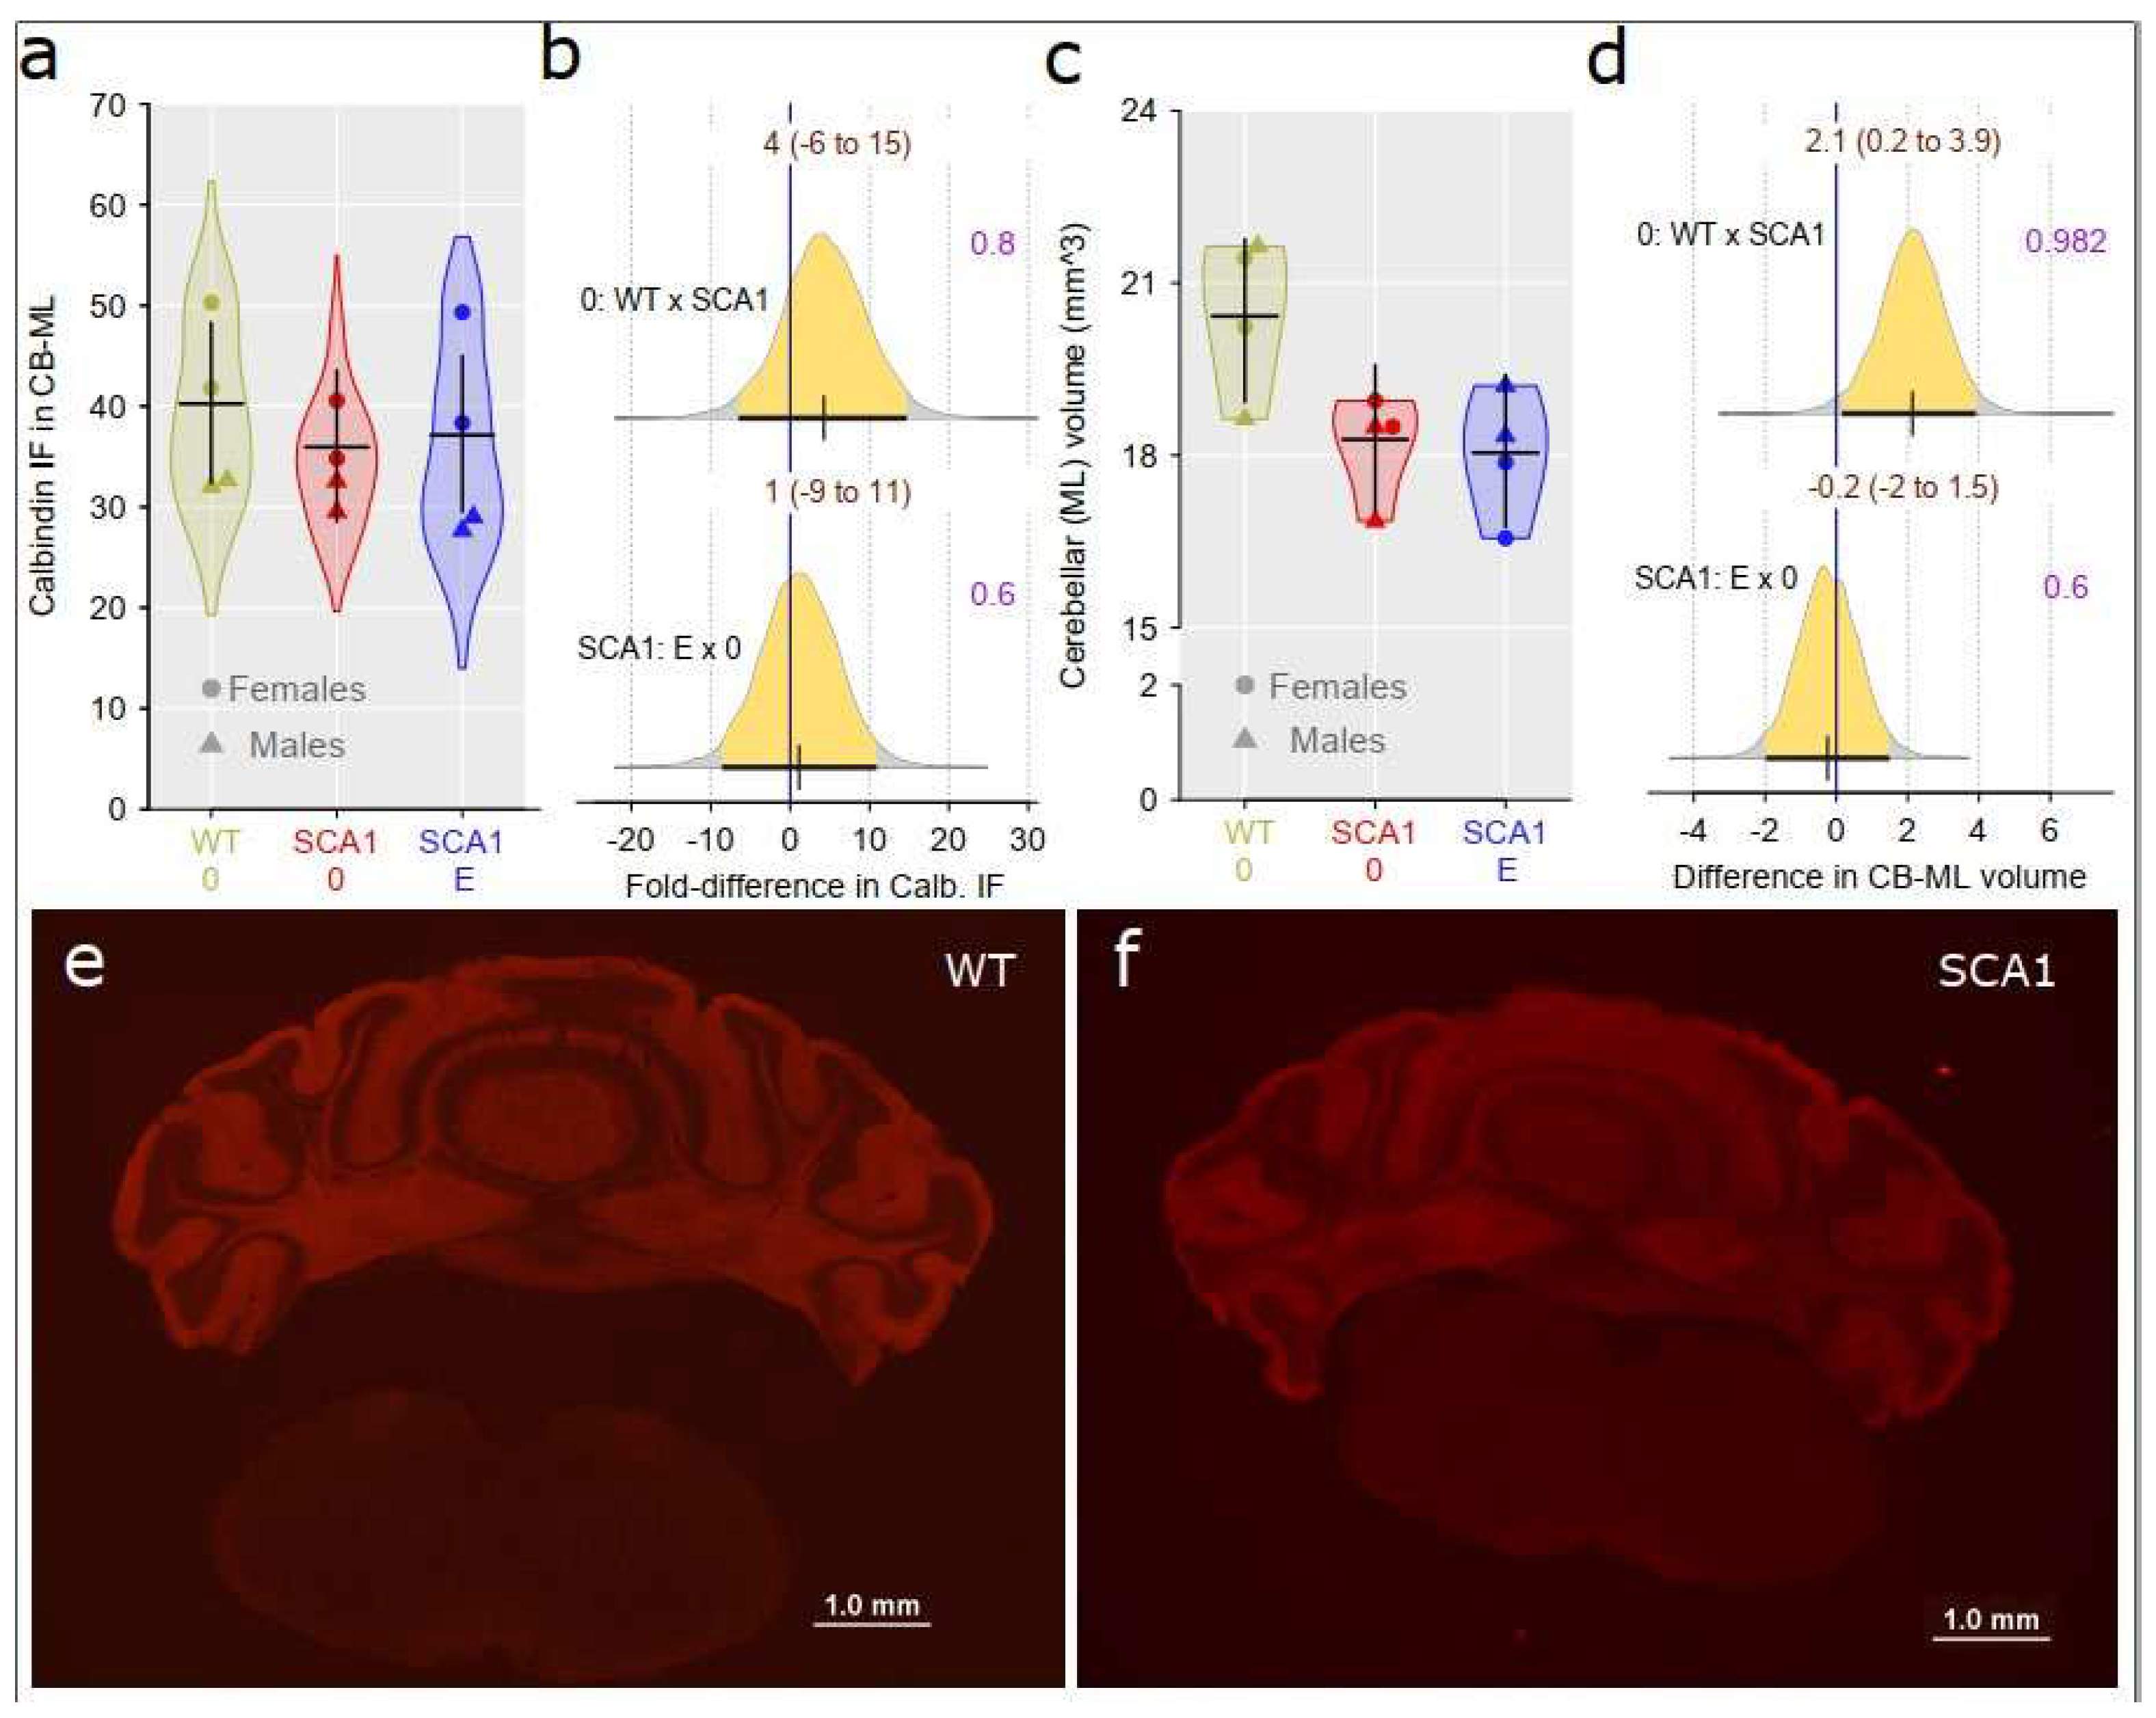
SCA1 mice had smaller volume of the cerebellar molecular layer probably in part due to reduction of Purkinje cell dendrites [
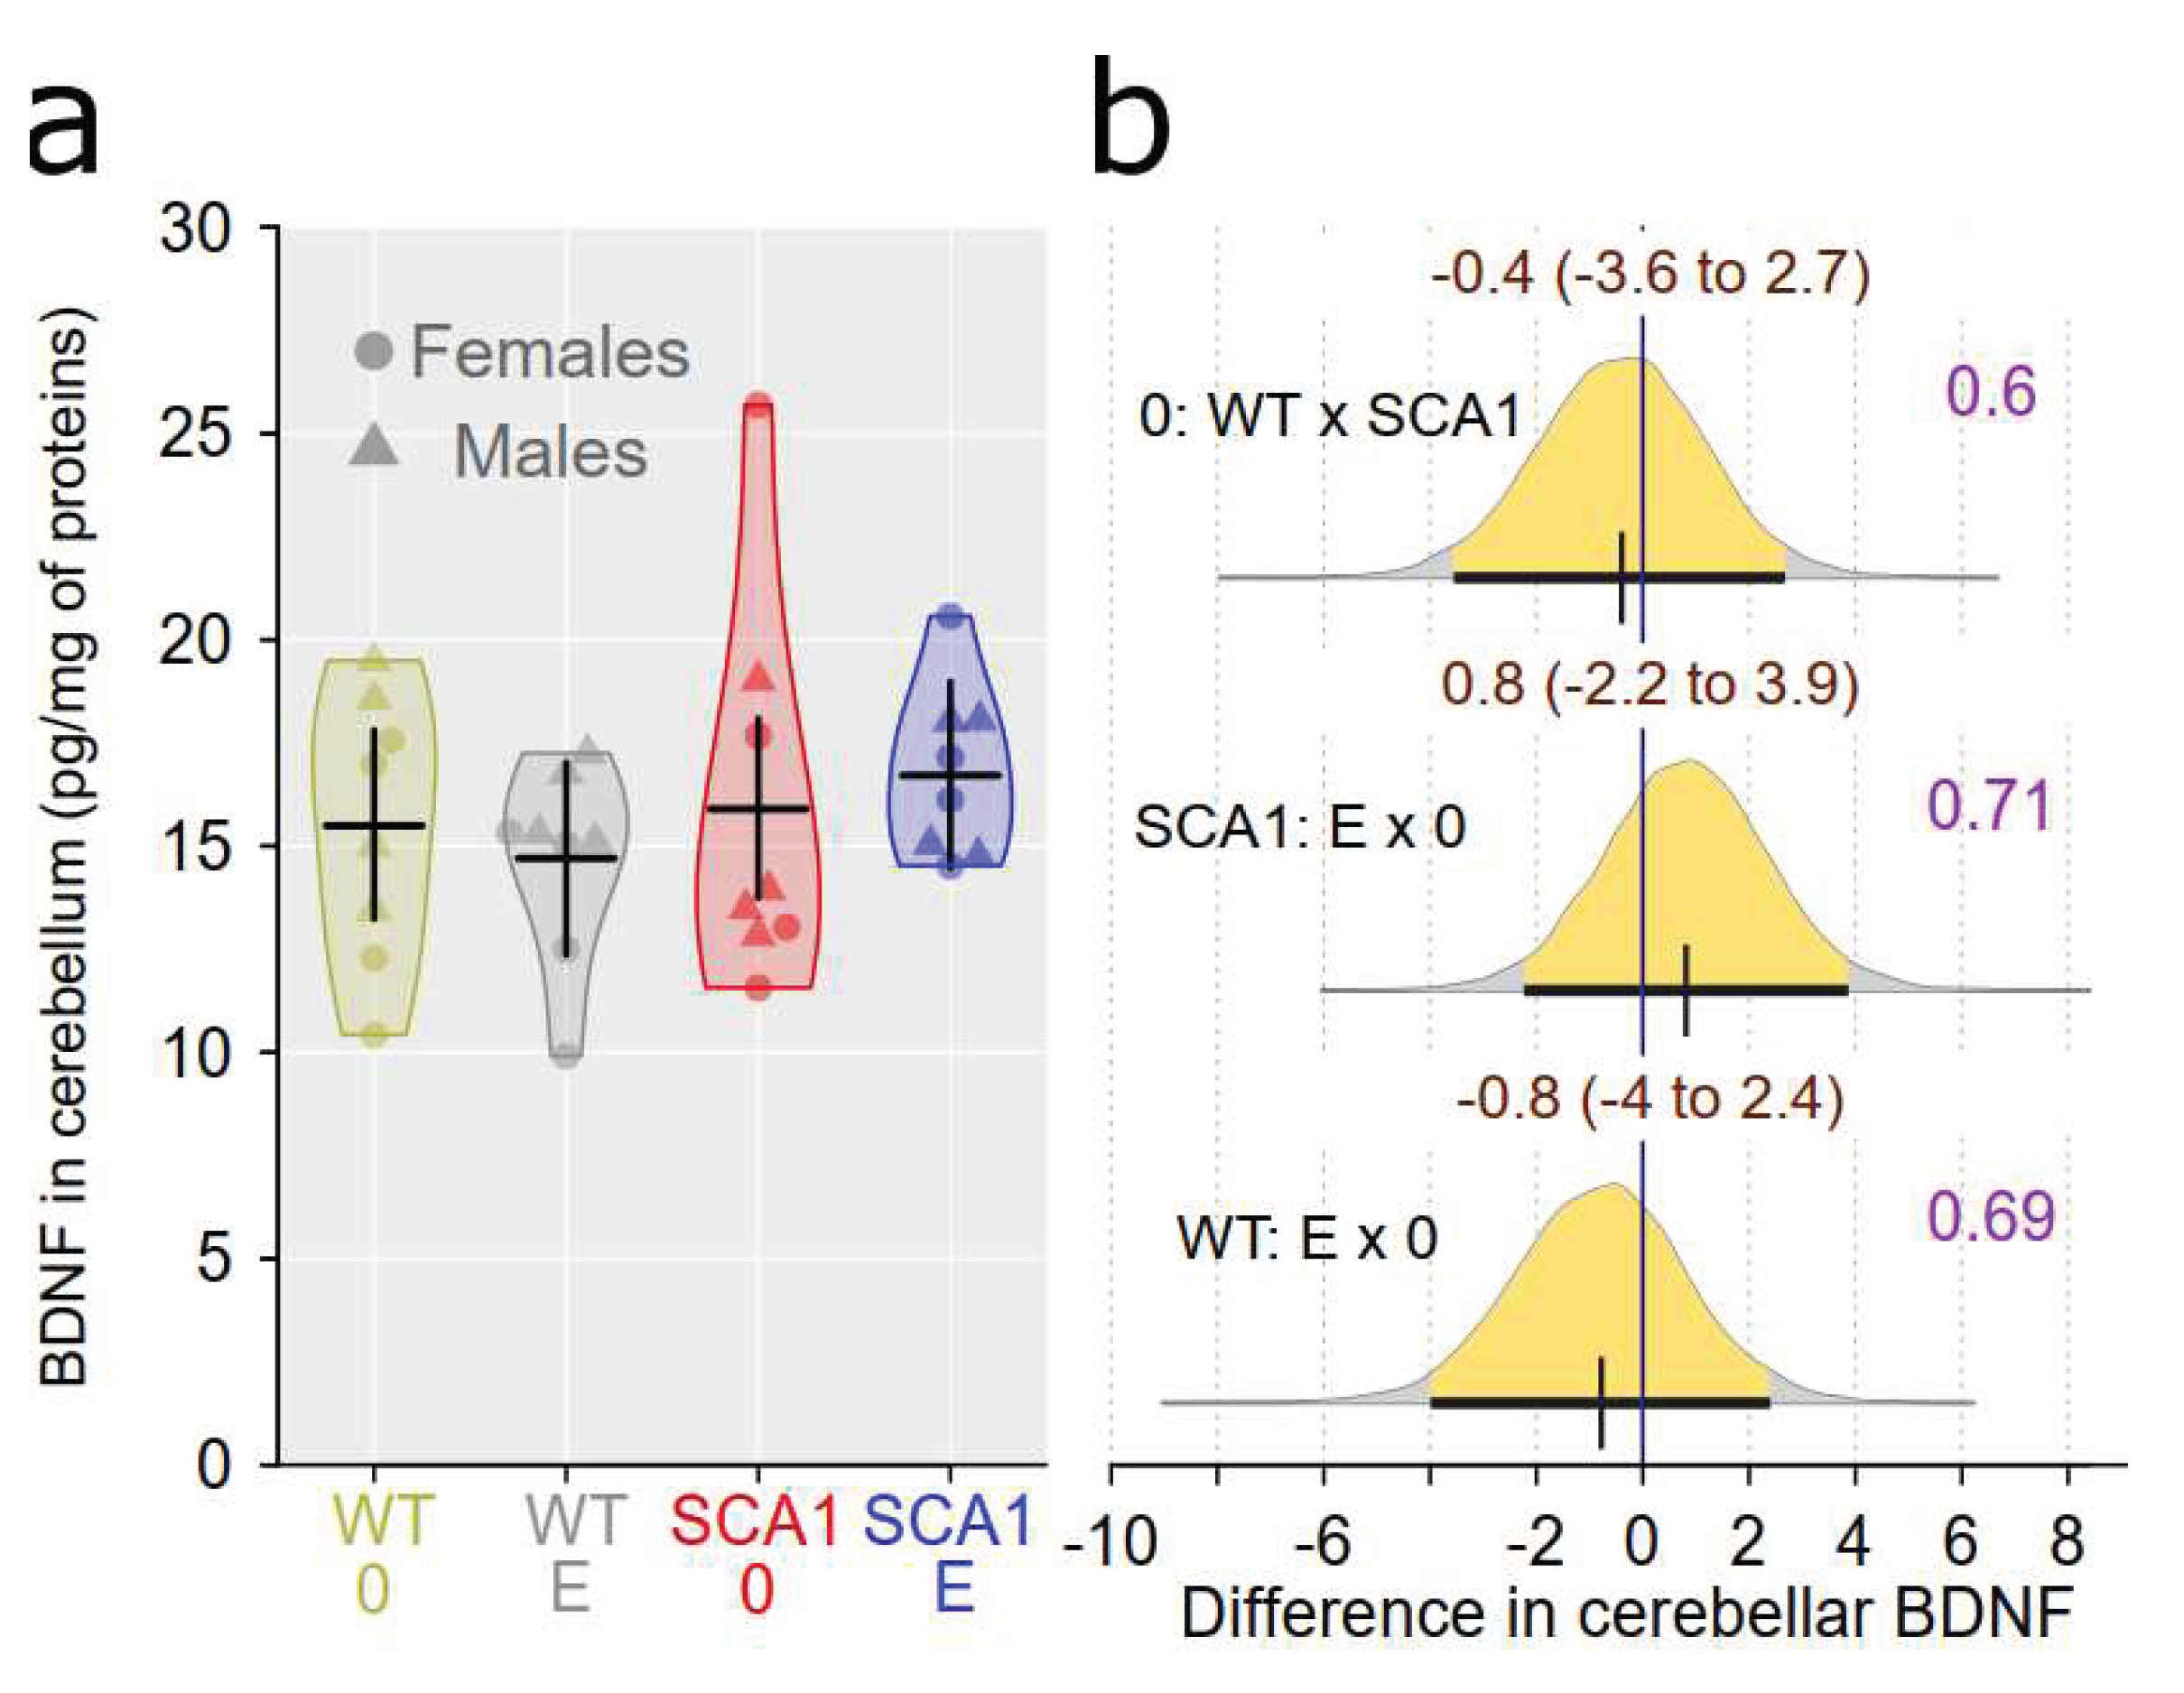
55]. Unexpectedly, only inconclusive decline of calbindin immunoreactivity in the molecular layer of the cerebellum was found. We can speculate that loss of calbindin expression and/or dendritic arborization might by nearly proportional to the volume loss at this stage of disease maintaining calbindin density close to the normal level. We have not found any abnormal BDNF levels in the cerebellum of SCA1 mice. Nevertheless, the changes in BDNF described by others were age-dependent and found in another SCA1 mouse strain [
56]. Contrary to our previous findings [
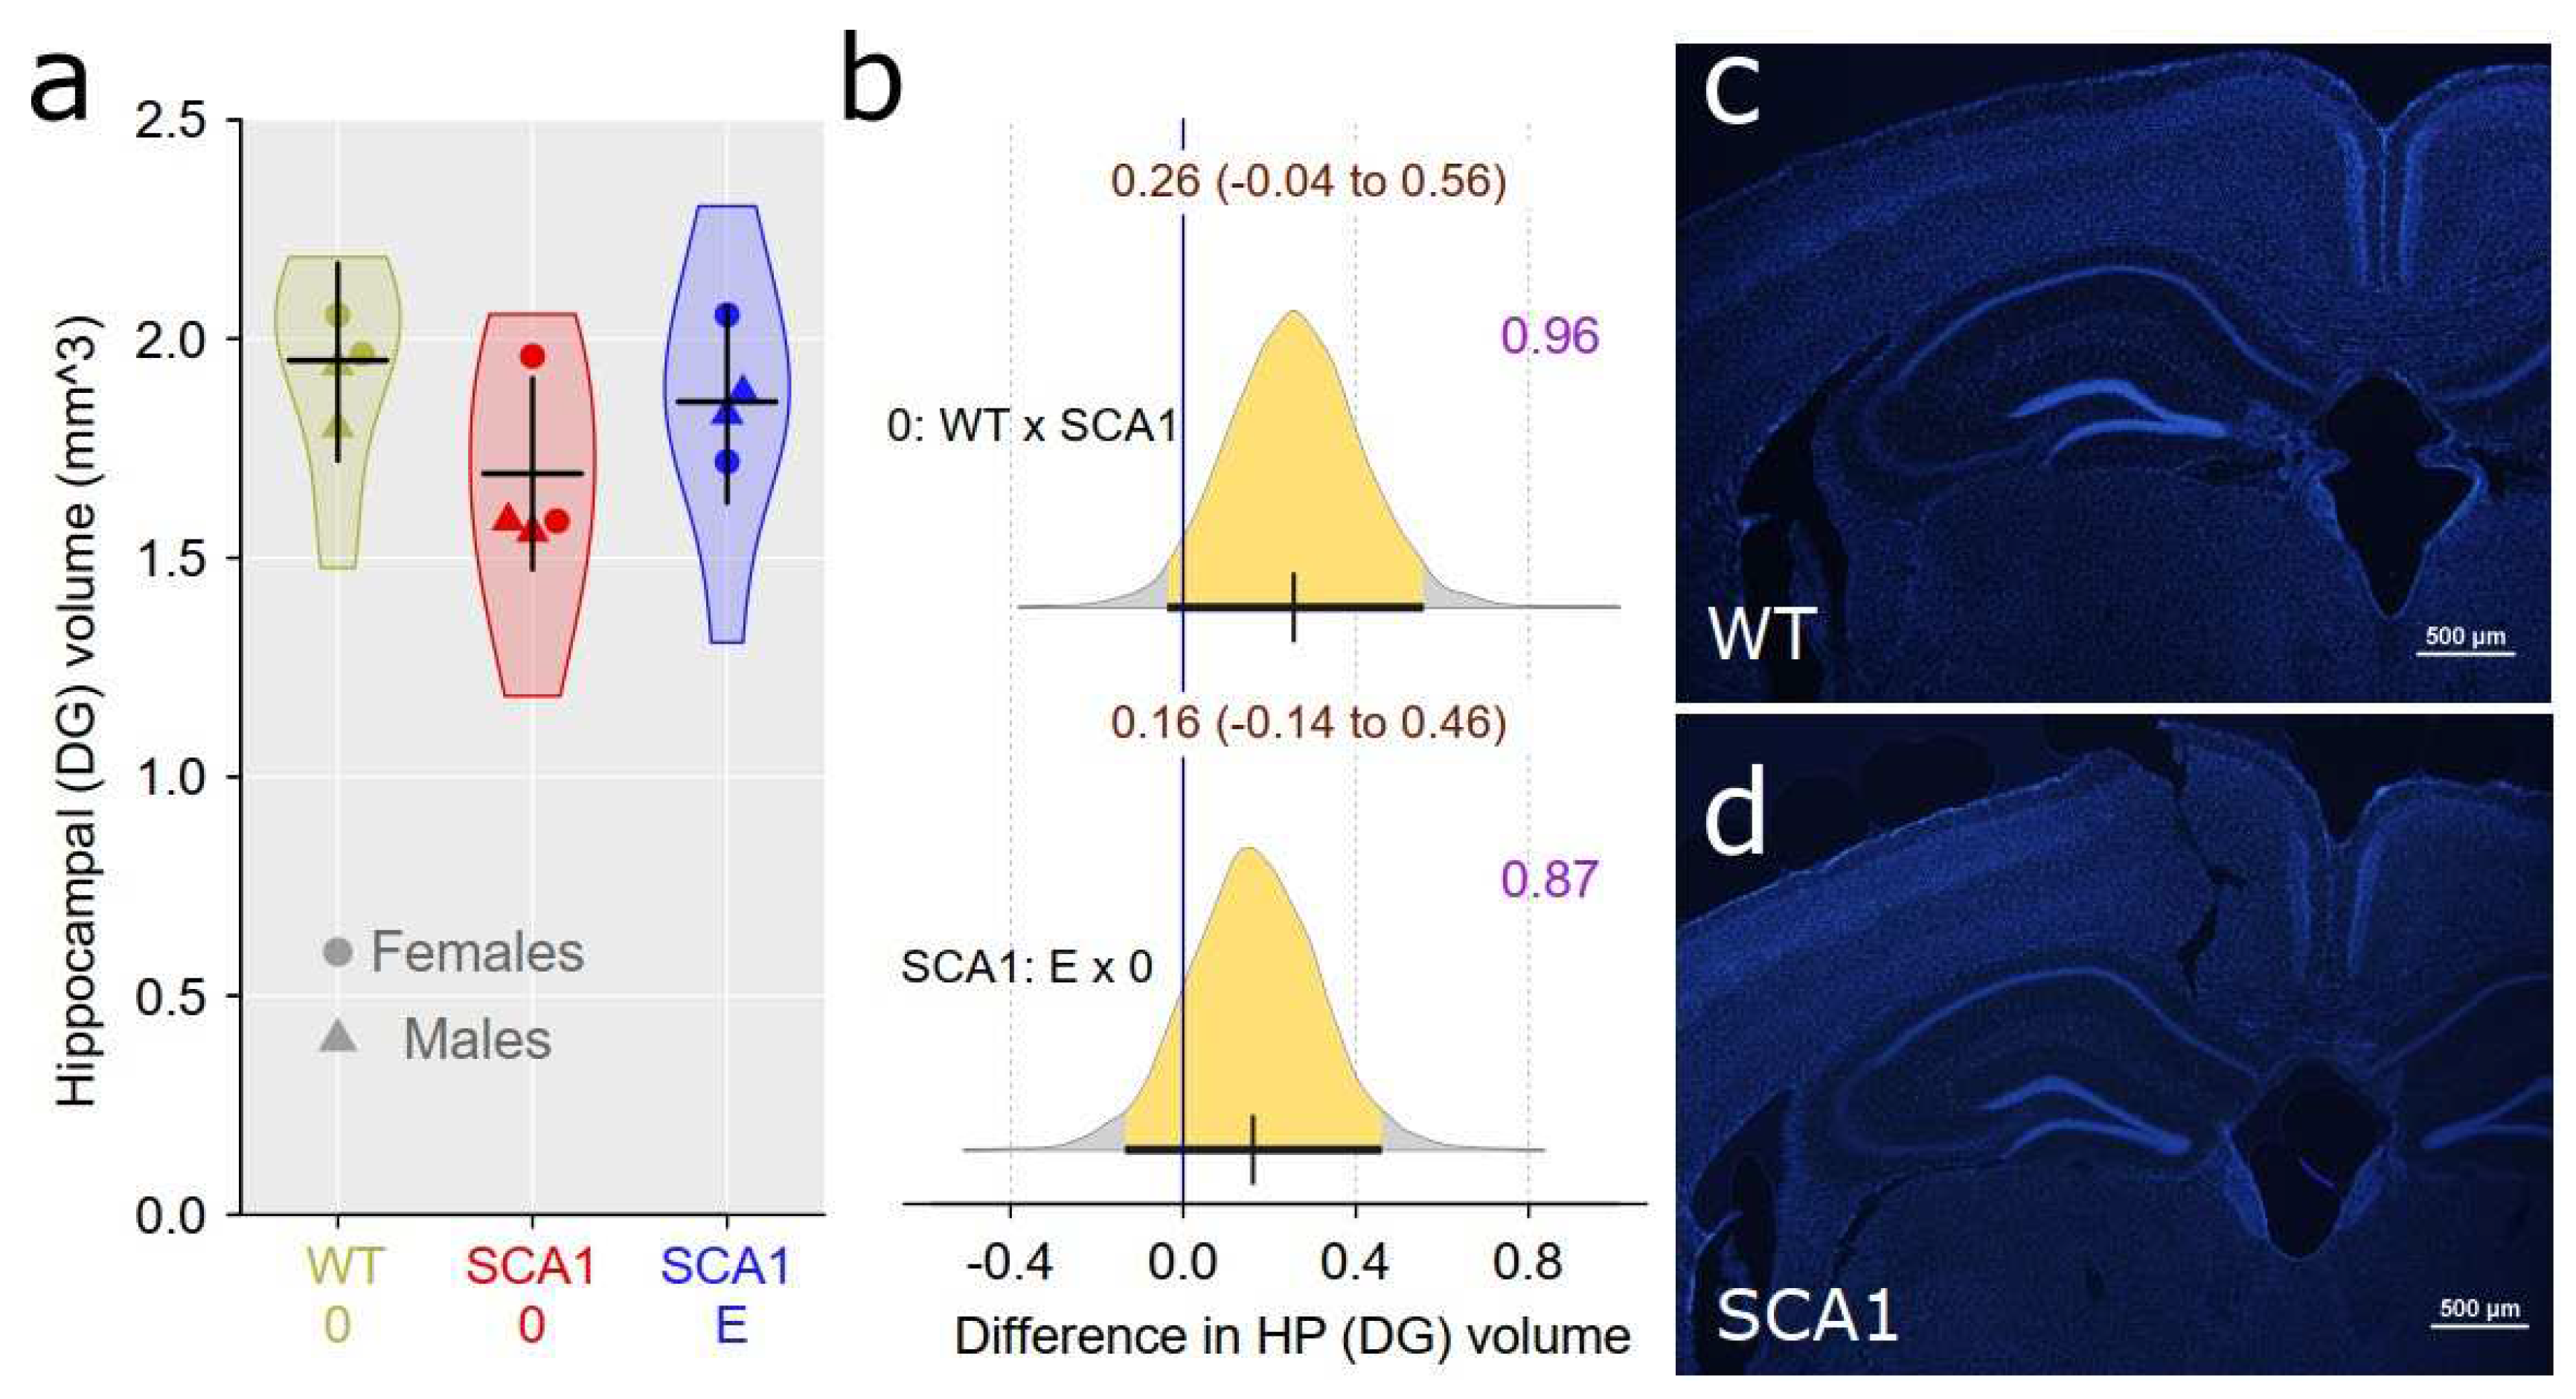
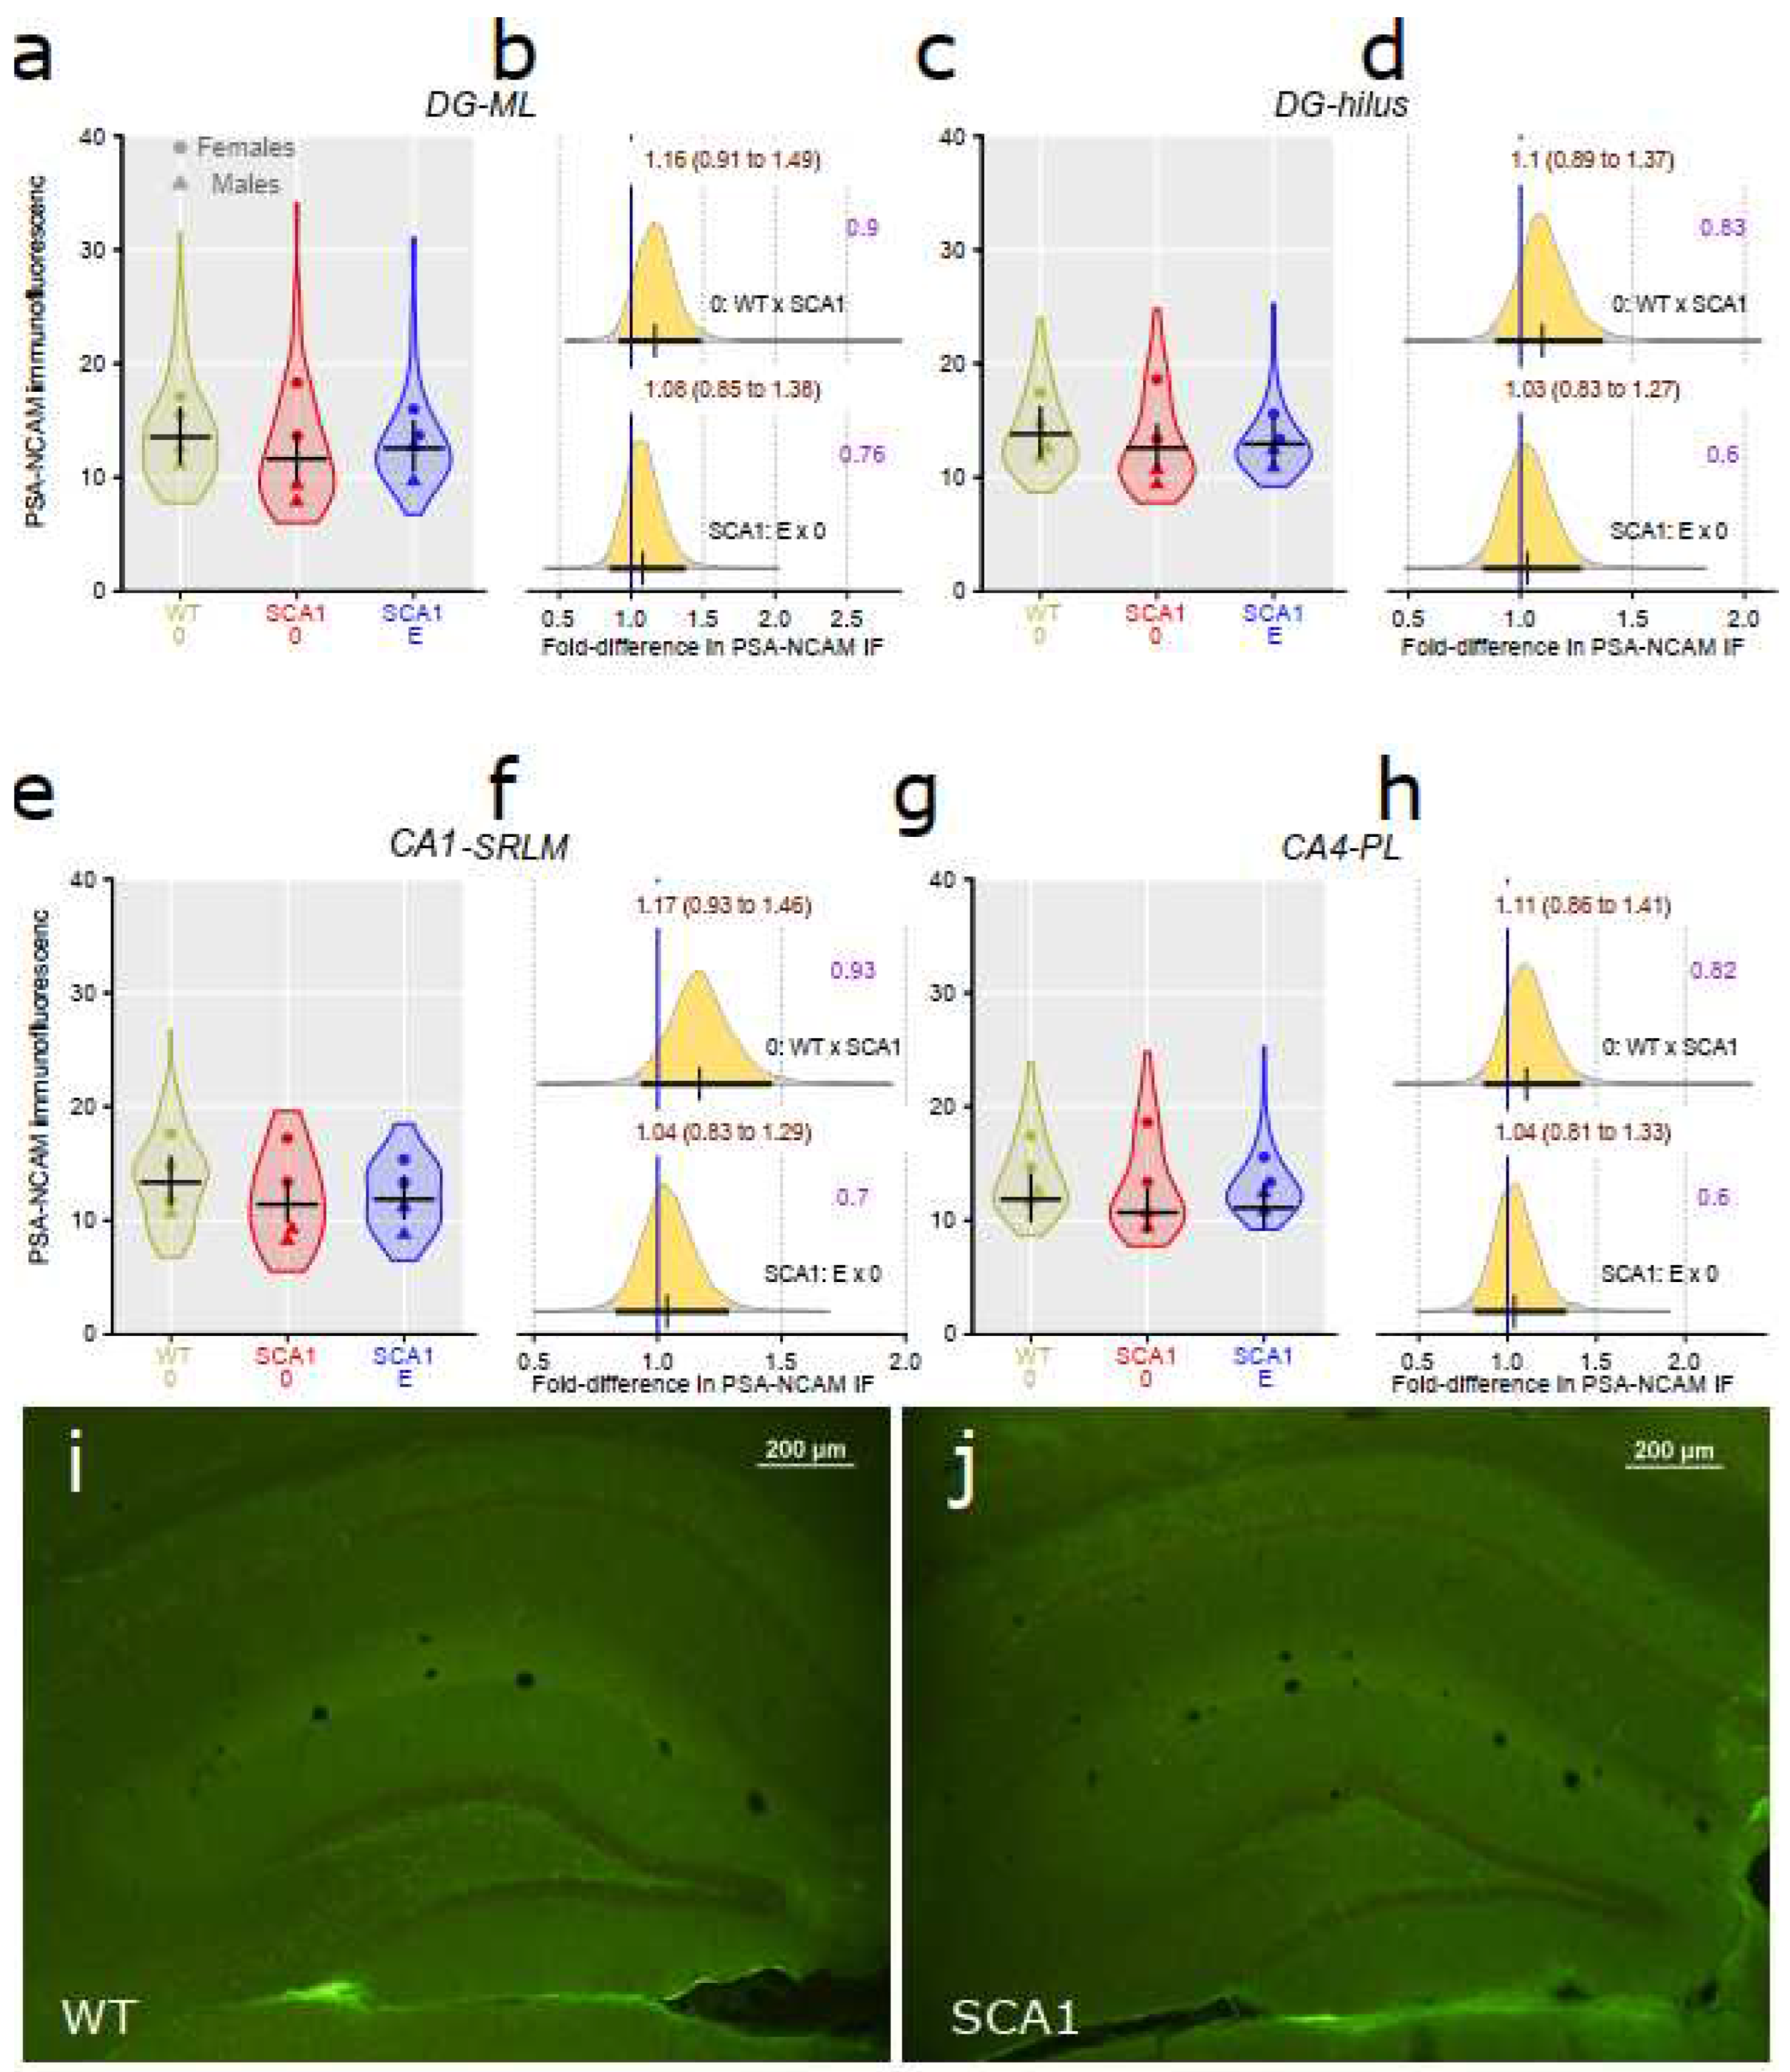
4], hippocampal dentate gyrus volume reduction and neuroplasticity marker PSA-NCAM density in SCA1 mice were rather inconclusive than significant, but cannot be negated completely by the recent study.
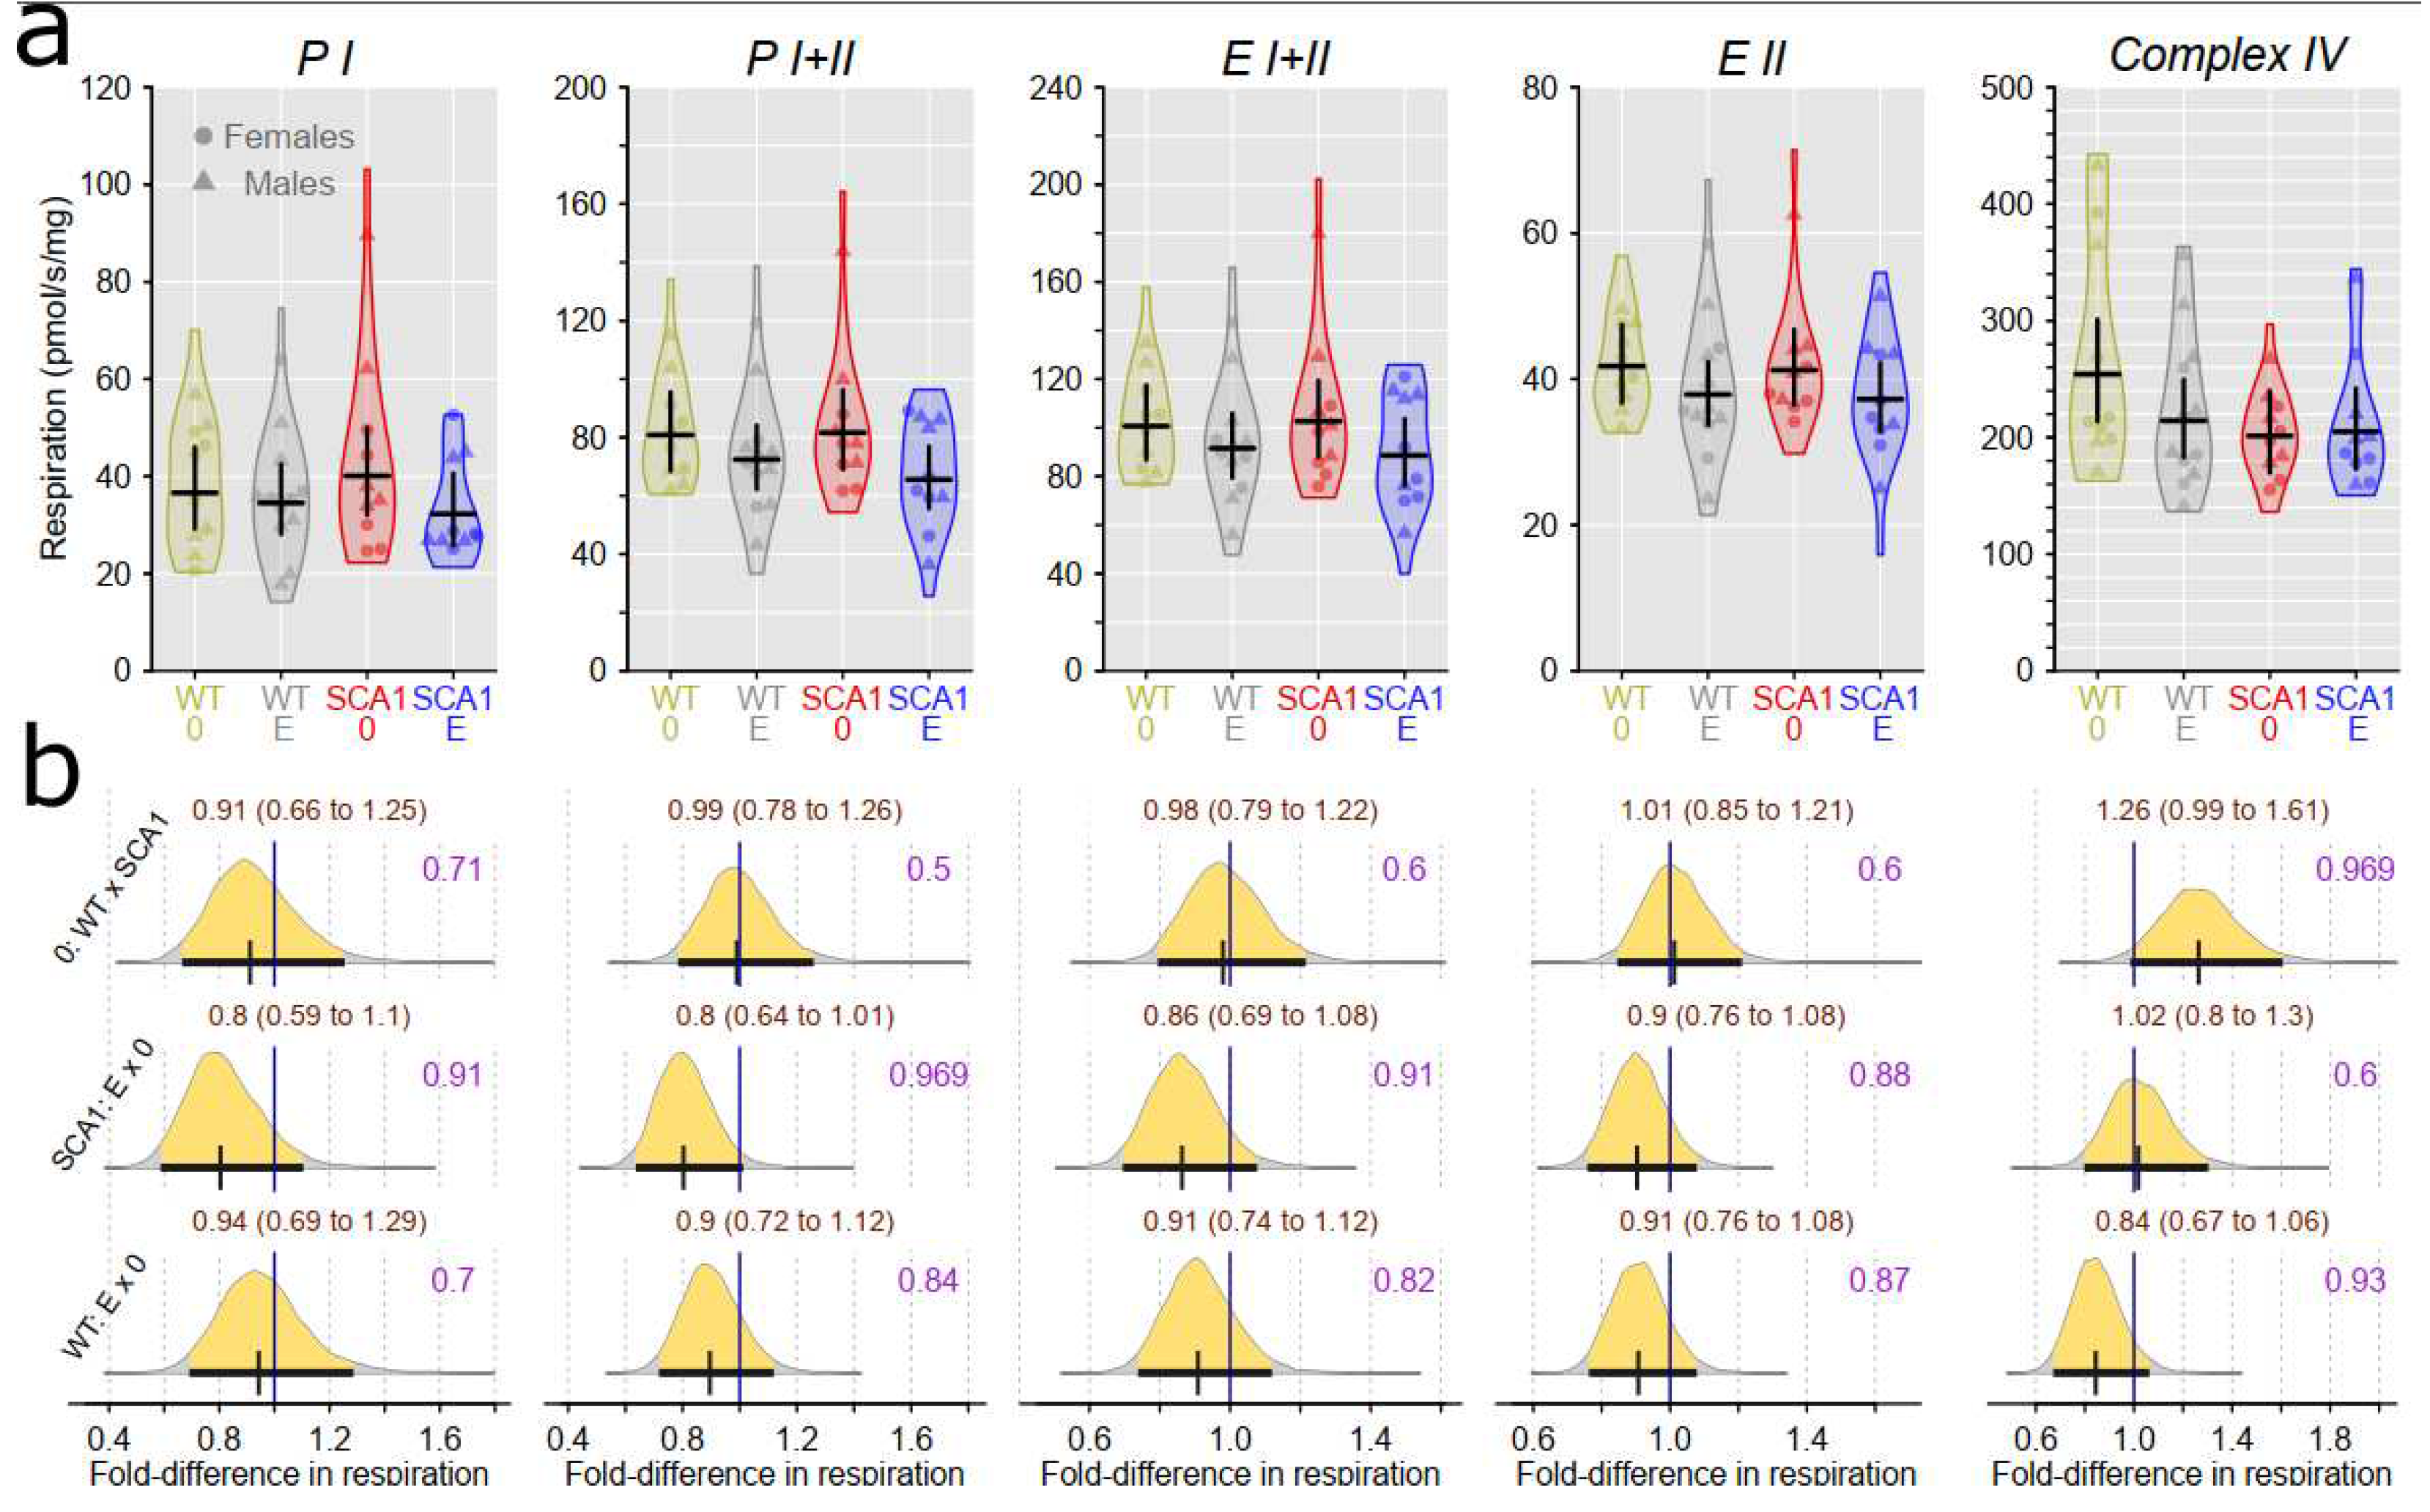
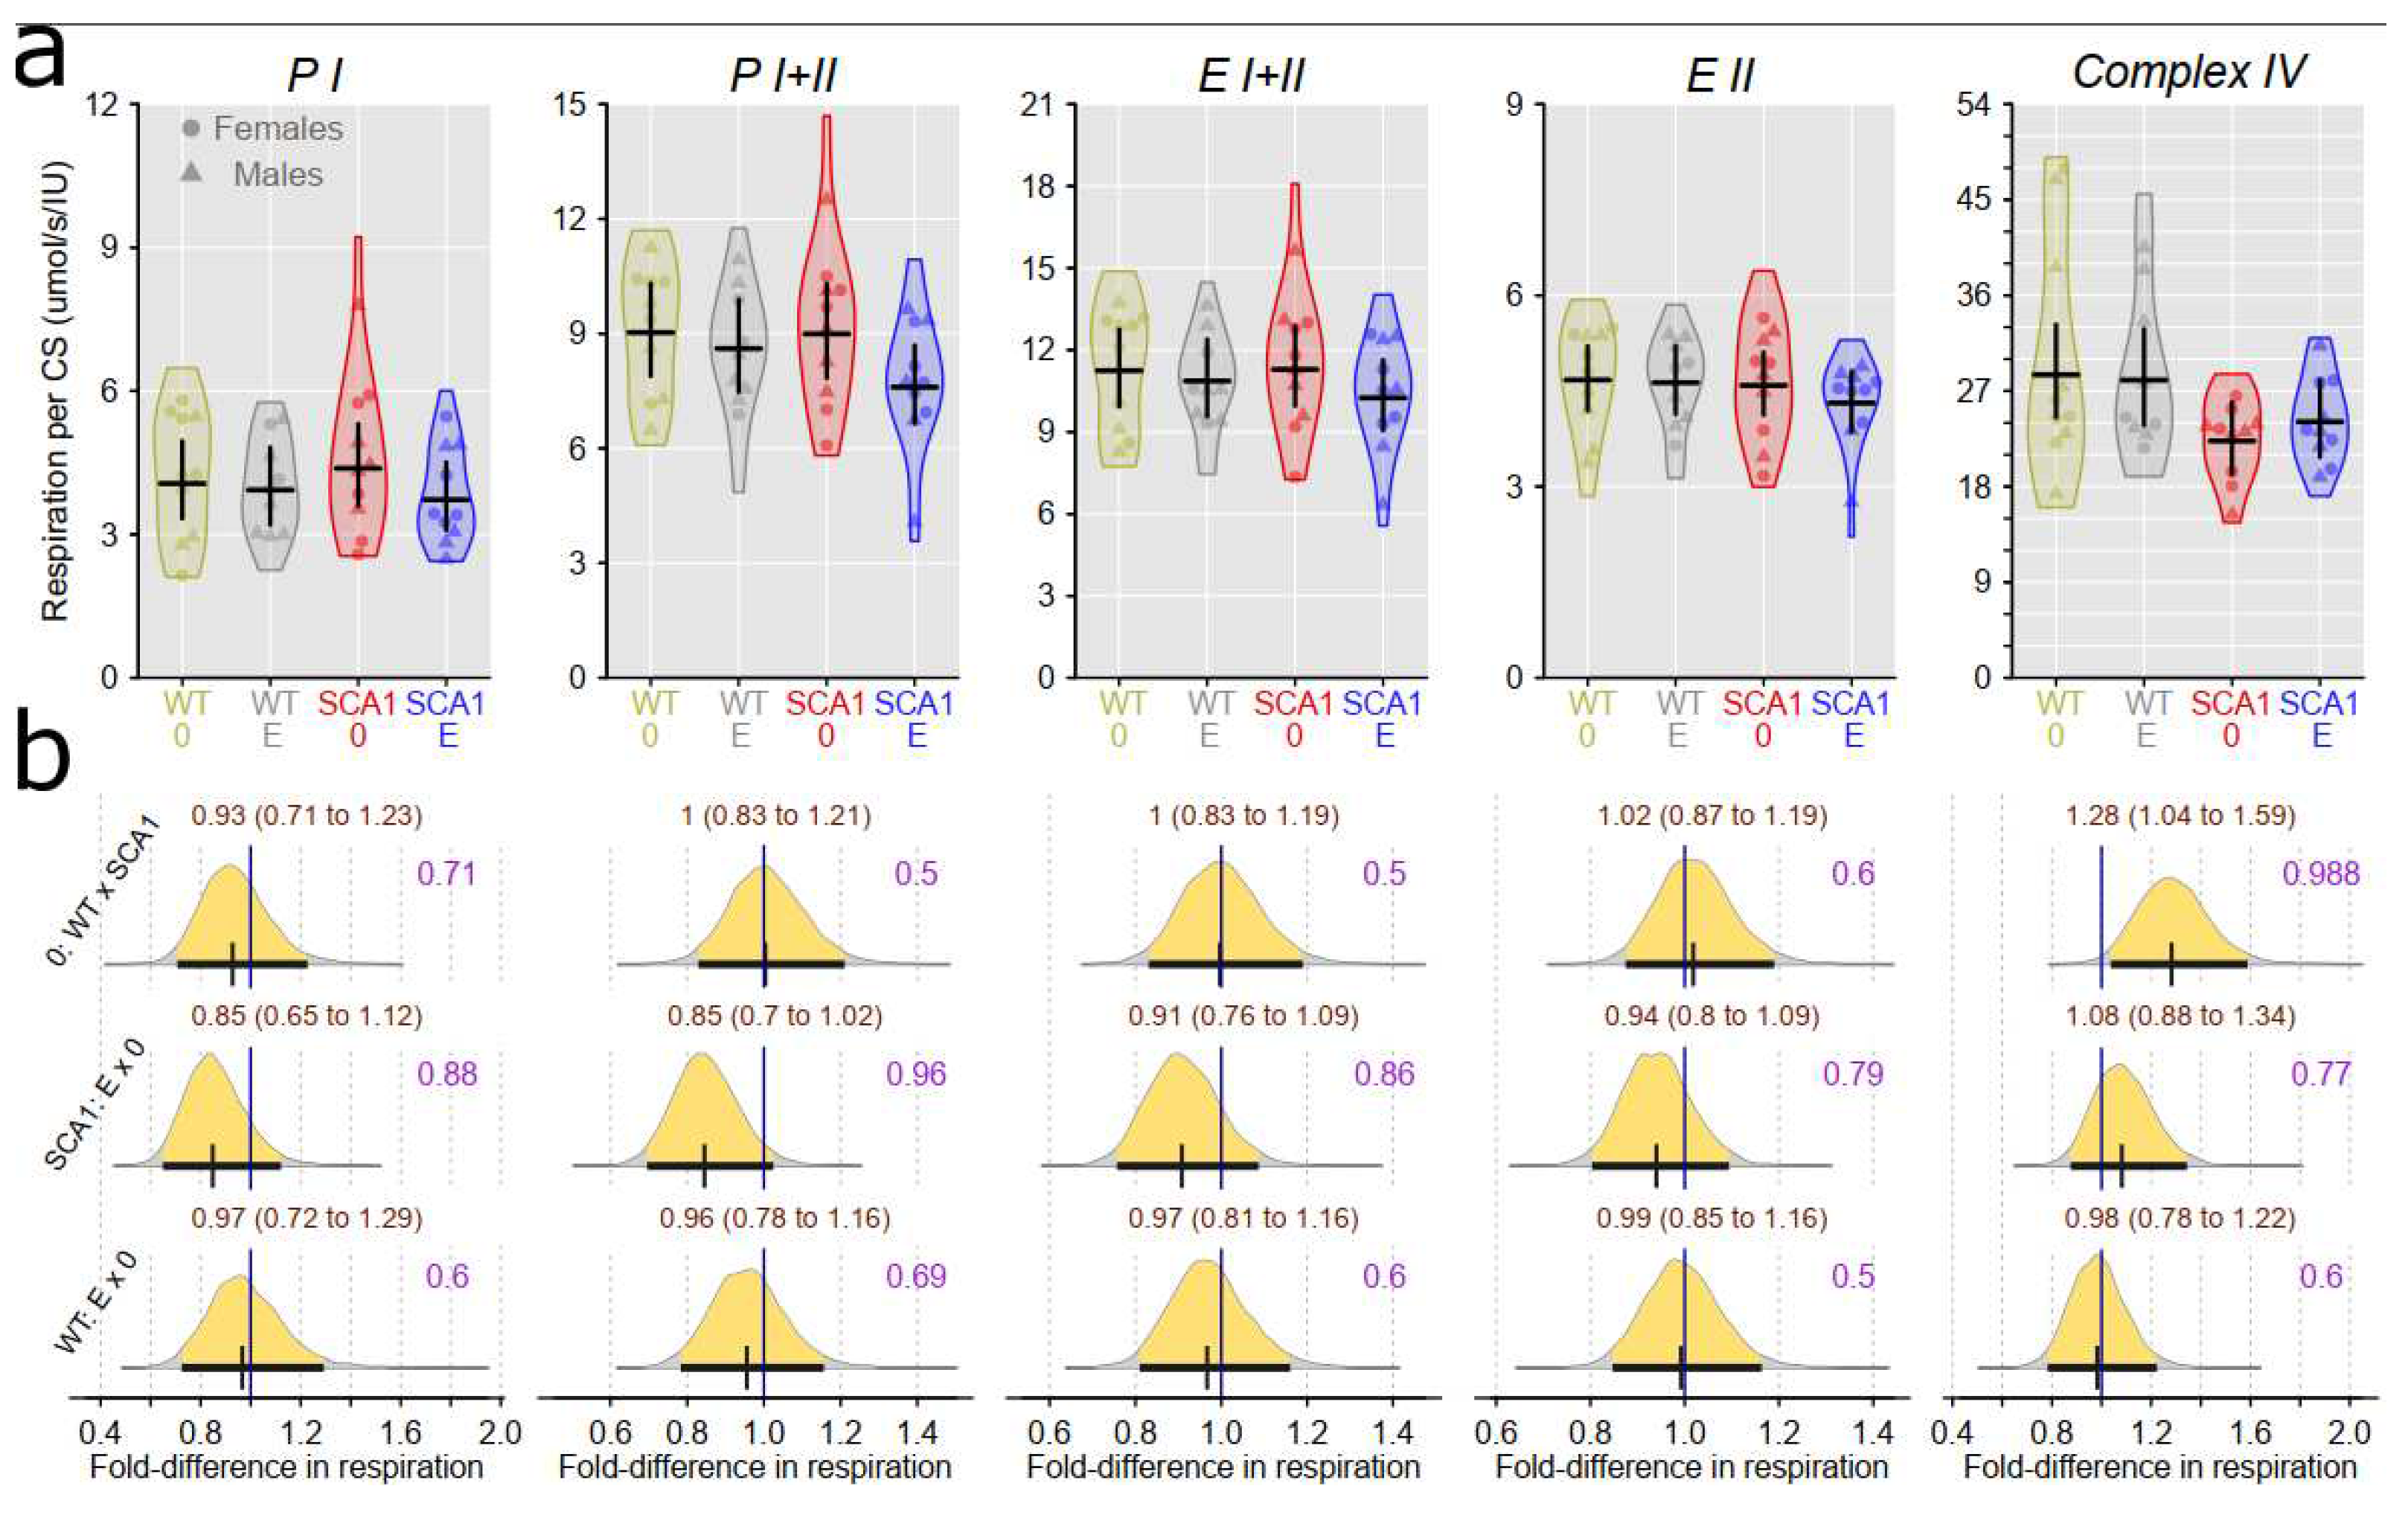
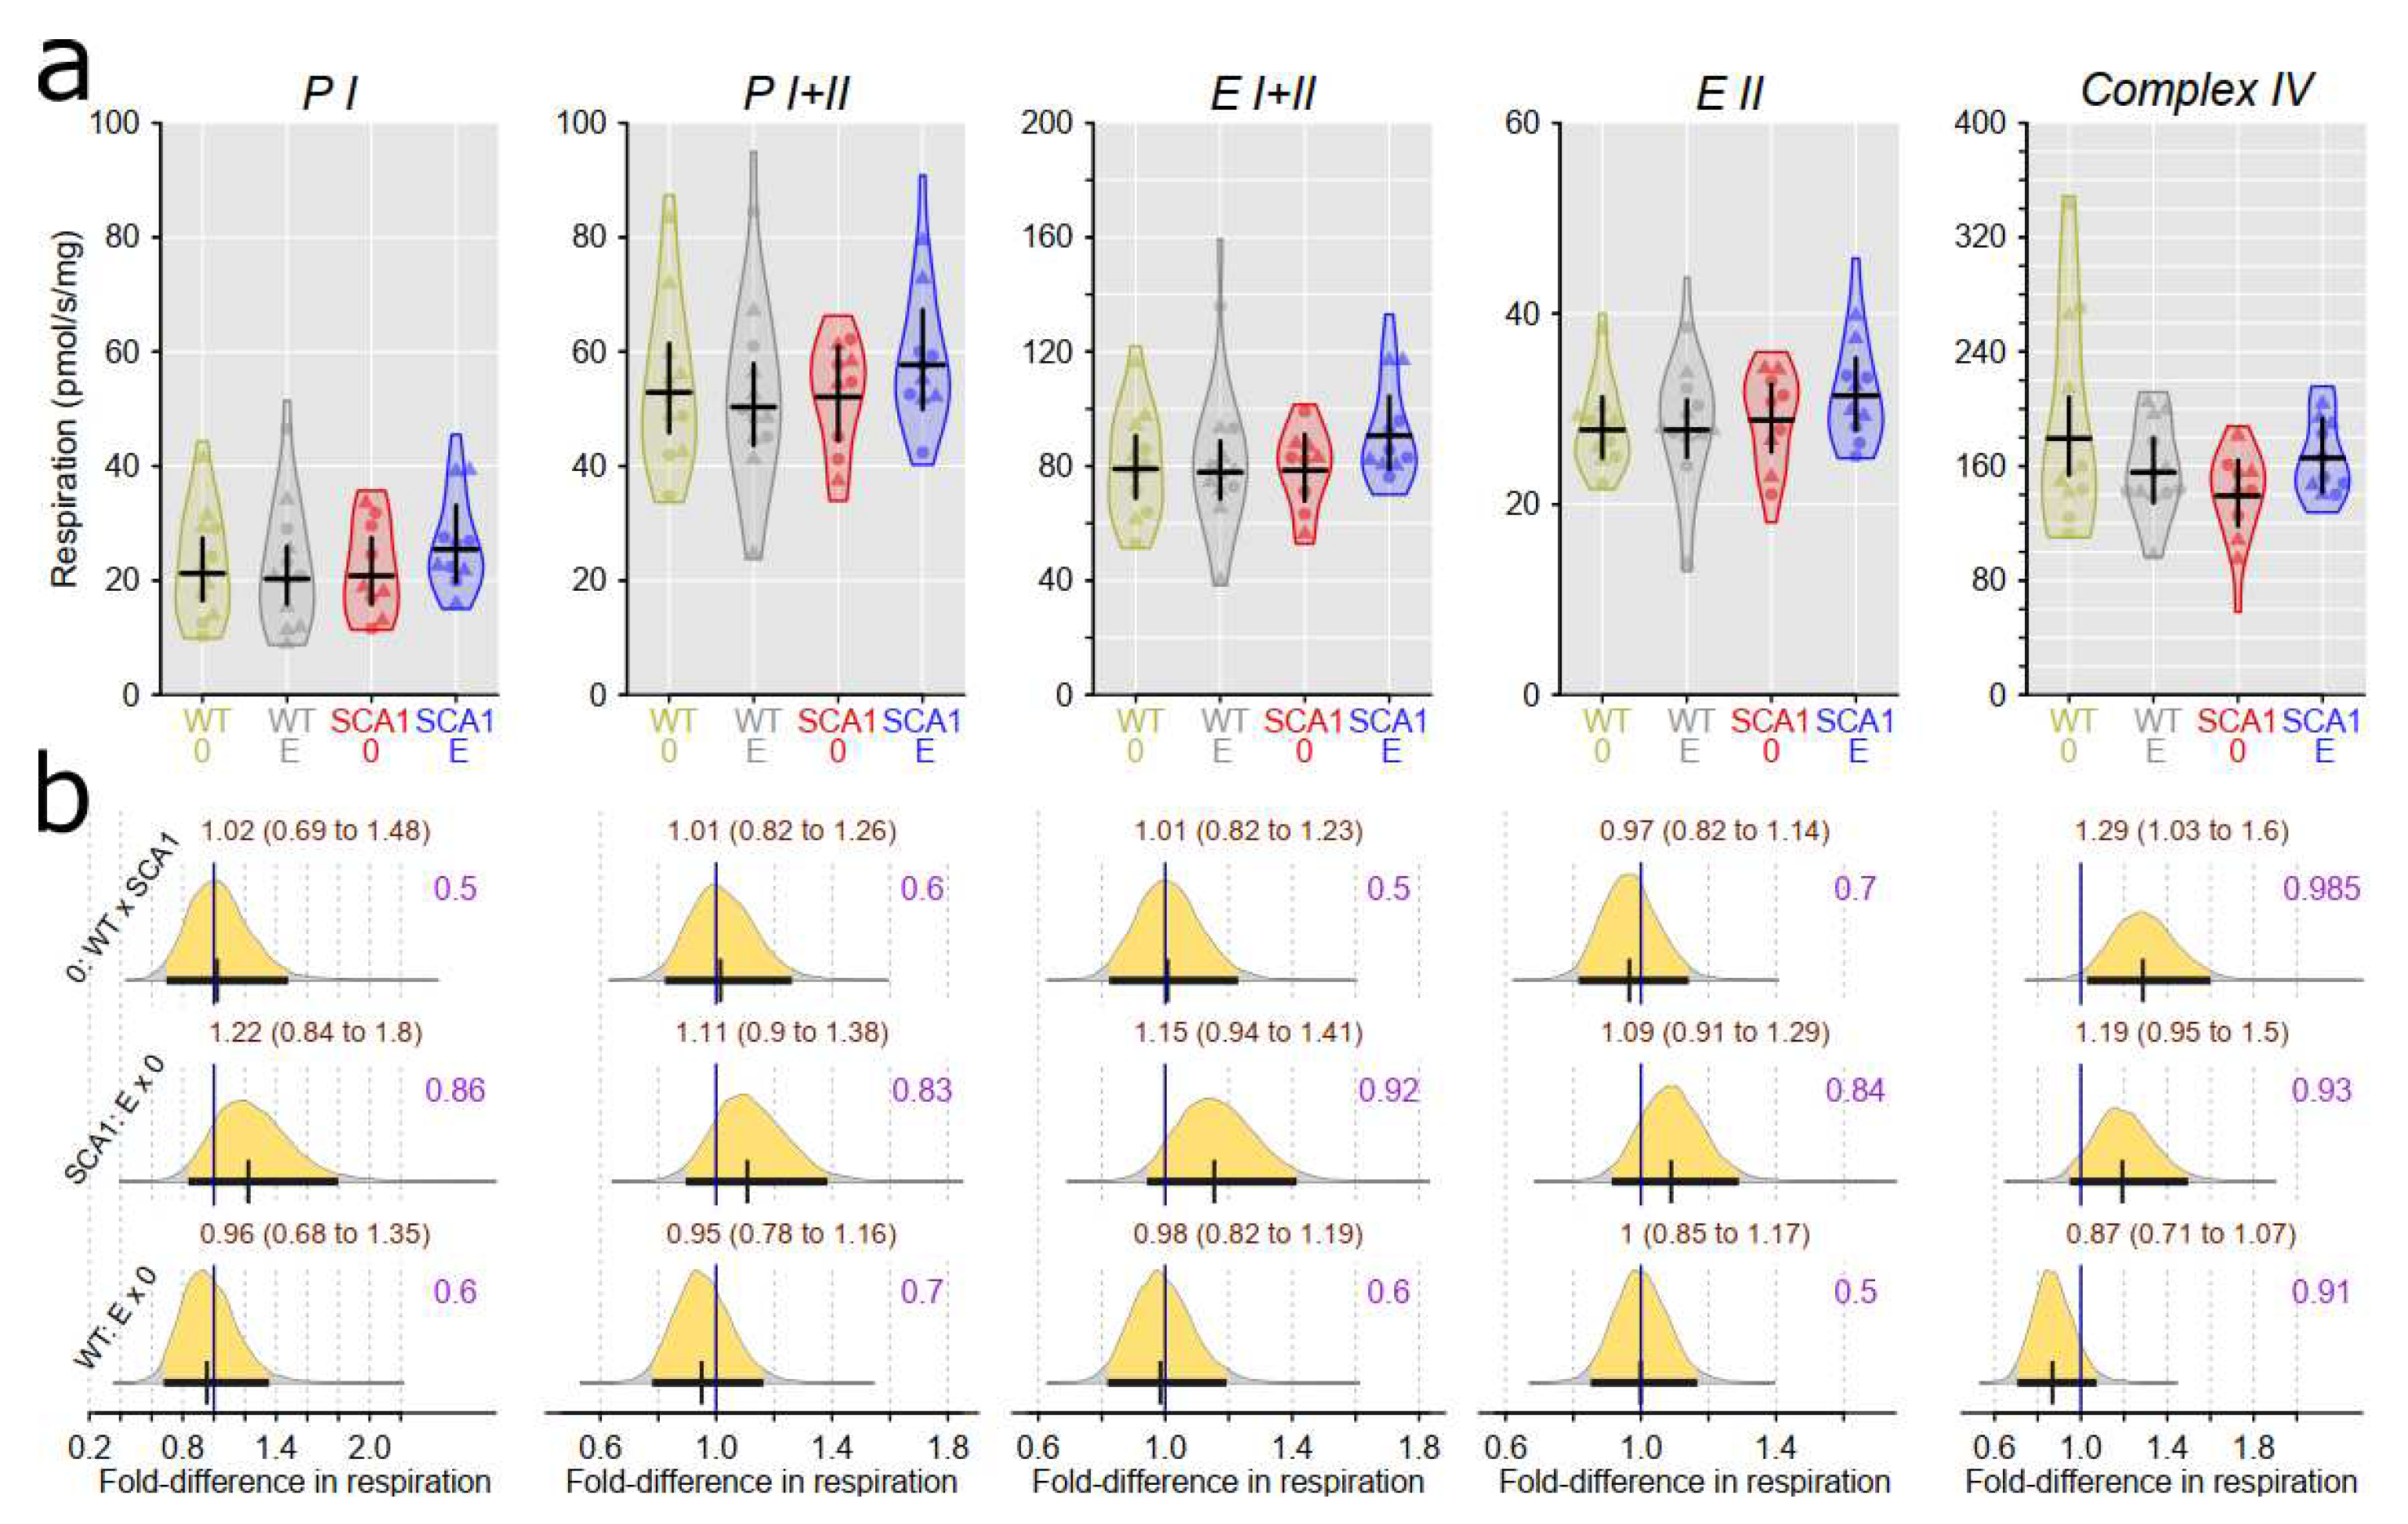
Our study confirmed mitochondrial dysfunction in the hippocampus of SCA1 mice at the age of 23 weeks, although its extent was somehow less expressed than at the age of 11 – 13 weeks being limited to the reduced activity of complex IV [
4]. In addition, complex IV activity was also decreased in the cerebellum of SCA1 mice, which was not yet apparent at the younger age category [
4]. This finding provides another evidence that hippocampal pathology precedes onset of cerebellar changes in SCA1
154Q/2Q mice. Complex IV, cytochrome c oxidase, is the terminal electron-transferring complex of the mitochondrial respiratory system that utilizes four protons to reduce dioxygen to water. Its dysfunction or dysregulation is considered a promising marker of various neurodegenerative diseases [
57], although its role in pathophysiology of cerebellar ataxia is not well understood yet. In a
Coq8a−/− constitutive knockout mouse model of autosomal recessive ataxia type 2 with progressive cerebellar ataxia, exercise intolerance, and memory impairment, mitochondria seem to belong to culprits of the whole pathological process: Purkinje neurons display altered expression of respiratory complexes, in particular complex IV, at presymptomatic stages of the disease [
58]. However, COQ8A gene is directly involved in the production of coenzyme Q10 playing essential role in oxidative phosphorylation, whereas the role of ataxin 1 in the mitochondrial bioenergetics seems to be more complex and bidirectional: In
Atxn1-KO knockout mice at the age of five weeks, spectrophotometric activities of individual respiratory complexes in the isolated cerebellar mitochondria displayed decreased (complex I), increased (complex II, complex III), and unchanged (complex IV) values compared to WT mice [
2]. In addition, the age of experimental animals could also have a substantial impact on the mitochondrial functional parameters since at younger ages, mitochondrial respiratory states PI and PI+II in the hippocampus tended to increase between the ages 4 and 11 weeks [
59]. At six months of age, expressions of mitochondria related genes (complex IV, creb-1, β-AMPK, and Tfam) in the brain of NMRI mice were reported to be significantly elevated compared to 3-month-old animals [
60]. Thus, it cannot be excluded that similar trend of mitochondrial changes from juvenile to young adult age was slowed down in our SCA
1154Q/2Q mice and the only significant mitochondrial respiratory dysfunction in the symptomatic stage of the disease is related to the complex IV dysfunction.
In general, we can conclude, SCA1154Q/2Q had significant pathological phenotype at the age of 23-24 weeks and there are many parameters on the motor, cognitive, behavioral, cellular, as well as biochemical levels to be ameliorated by efficient therapy in this preclinical model. However, we have not seen any clinically significant improvement in edaravone-treated SCA1 mice. In addition, edaravone had no adverse effects either in SCA1 or in heathy mice.
Edaravone is a neuroprotective drug acting as a free radical scavenger. In experimental or clinical studies, it has been shown to have positive effects in diverse neurological pathological conditions, e.g. ischemic cerebral stroke, ALS, traumatic spinal injury, Alzheimer’s disease [
35,
36,
61,
62,
63]. It helps also in diseases of other organ systems [
64,
65]. In clinical praxis, edaravone is approved and used for therapy of acute ischemic stroke and ALS [
37,
63]. Based on mechanisms of its effects and known therapeutic effects, edaravone appeared as a good candidate to be tested in hereditary neurodegenerative ataxias. In SCA1 and particularly in SCA1
154Q/2Q mice as a model of this disease, mitochondrial dysfunction participates in the disease pathogenesis [
4,
45]. Despite such predispositions, edaravone failed in treatment of SCA1 in the preclinical model. There are many potential explanations of absence of significant therapeutic effect of edaravone in this study.
First, we should consider the possibility edaravone does not target pathogenetic mechanism essential for SCA1 progress. We can, for instance, speculate that oxidative stress and mitochondrial dysfunction are not the underlying mechanisms of cell dysfunction and degeneration in SCA1. If this assumption is true, edaravone as a scavenger would not cure SCA1 but could only reduce additional minor impacts of oxidative stress occurring just as a secondary or collateral phenomenon accompanying primary neuropathology. Nevertheless, oxidative stress is considered to be an important pathogenic mechanism in SCA1 [
45,
66].
There is also the question of edaravone dosage. In small animals, like mice, dosage per 1 kg of the body weight must often be higher than in humans because of relatively more intensive metabolism. We have, however, used a daily dose of 40 mg/kg, which is much higher than that used in humans [
67,
68]. Furthermore, our dose was comparable or even slightly higher then oral dosage shown effective in a rat model of cerebral artery occlusion [
69] or in a mouse model of the Alzheimer’s disease [
61]. Administration of edaravone suspension directly to the mouth of the mice allowed relatively good control over the drug intake. On the other hand, biological availability of any orally administered drug is always uncertain because the resorption depends on many factors that cannot be simply controlled. However, the same problem exists in any per
oral drug administration in human patients as well. In humans, bioavailability of edaravone administered
per os is about 60 % [
67]. In mice, bioavailability of orally delivered edaravone was estimated as 38% of the intravenous administration [
61].
SCA1 is a progressive neurodegeneration. To rescue the neurons and maintain substantial cerebellar reserve, therapy should start before substantial neuronal loss had developed [
70,
71]. In our study, therapy started at the age of 8 weeks, i.e. in the early disease stage with just mild and partial symptoms and minimum neuropathology [
4,
23]. Irreversible processes starting before clinical manifestation and limiting effect of further therapy cannot be excluded, indeed. However, a study by Zu et al. [
72] provided evidence that if expression of mutant ataxin 1 was stopped in early disease stages manifestation of SCA1 was fully reversible in conditional mutants while after halting the expression in more advanced stage only partial recovery was achieved. Similar reversibility of symptoms has been reported in a mouse model of SCA3 [
73]. The sooner the therapy starts, the better. But mice in our study were treated in the age in which highly efficient therapy should still be manifested at least by delay of disease progress and thereby by better performance in treated mice as compared with control group.
If the effect of therapy would be only in terms of mild slowing down the degenerative process, it may not be seen after a long period sufficient for complete degeneration even in treated individuals. However, this is not the case of SCA1, which does not achieve any stable state but continues in progress to premature death in SCA1
154Q/2Q mice [
6]. In our study, none of the mice showed substantial deterioration of overall health state before the end of the experiment, i.e. the mice were examined at the stage of continuing disease progress and further survival for several months with consecutive worsening disease symptoms would be expected if not euthanized for sample collection at the age of 23-24 weeks [
4].
Edaravone has an effect on microvasculature. It may enhance endothelial barrier [
74]. On the other hand, it has been shown to suppress VEGF expression in astrocytes exposed to hypoxia [
75]. However, VEGF ameliorated manifestation of SCA1 in mice [
10]. Thus, such effect of edaravone could be rather negative and interfere with its potential positive effects in SCA1.
Our study was a classical drug repurposing approach. Drug repurposing is based on expectation that a medicament effective in treatment of certain disease or diseases could have therapeutic effect also in other diseases having similar etiology and/or pathogenesis. In many neurological diseases, neuroprotective, antioxidant, and plasticity supporting substances can have a non-specific therapeutic effect. In drug repurposing approach, animal model-based and other preclinical studies are one of the first steps to verify whether the proposed drug modifies respective disease course and symptoms and to investigate mechanisms employed in therapeutic effects in a particular disease before realizing more practically and ethically problematic clinical trials.
Unfortunately, not always, the studies in animals and human patients provide the same results and not always, the suggested drug is effective in the newly proposed indication. For example, riluzole had no acute effect in SCA1 mice [
76] and long-lasting therapy even promoted neuropathology in SCA3 mice [
77]. In human patients with hereditary ataxias, riluzole has been suggested effective but offered only moderate reduction of Scale for the Assessment and Rating of Ataxia (SARA) score [
78]. Similarly, lithium has not fulfilled the expectations. In SCA1 mice lithium therapy improved neural functions [
8] but failed in SCA3 mouse model and patients [
79,
80]. These findings also suggest that the effects can be disease specific even in the frame of the group of spinocerebellar ataxias.
Several studies on preclinical models showed potential therapies for SCA1, for instance, block of ataxin 1 expression in double mutants [
72], use of antisense oligonucleotides [
81,
82], enzymatic cleavage of CAG repeat RNA [
83], or neurotransplantation [
84]. However, for SCA1, these approaches are rather in the stage of experimental research, relatively invasive and safety for human patients needs to be assessed. Simple pharmacotherapy with approved efficiency, acceptable safety and capable of halting the degenerative process is still missing for SCA1.
4. Materials and Methods
4.1. Animals
Heterozygous knock-in mice with 154 CAG repeats within exon 8 of the ATXN1 gene (SCA1
154Q/2Q) of the B6.129S-Atxn1
tm1Hzo/J strain (Jackson Laboratory) [
6] were used for this study. In these mice both cerebellar as well as hippocampal neuropathology develops and they show motor, cognitive and behavioral abnormalities well characterizing SCA1 phenotype [
4,
6]. Healthy mice with a normal number of CAG repeats (SCA1
2Q/2Q) from the same colony (i.e. wild type, WT, littermates) were used as controls. The mice were kept under standard laboratory conditions with a temperature of 22 – 24 °C and relative humidity of 30 – 60 % with a 12:12 h light/dark cycle (light period from 6 a.m. to 6 p.m.). The experiments were performed during the light period. Commercial pellet diet and water were available
ad libitum. Mice were housed individually in plastic boxes with metal lids to eliminate non-standardizable stress from diverse social interaction and potential aggressivity between animals if housed in one cage.
4.2. Design of the Experiment
The treatment with edaravone or saline started at the age of 8 weeks, i.e. before ataxia is detectable [
4,
23]. Four experimental groups of mice were established: SCA1
154Q/2Q edaravone-treated (SCA1_E), SCA1
154Q/2Q saline-treated (SCA1_0), SCA1
2Q/2Q edaravone-treated (WT_E) and SCA1
2Q/2Q saline-treated (WT_0). Each experimental group consisted from two cohorts of mice handled using different protocols (
Figure 1).
Mice of cohort a (SCA1_E: 10 males, 10 females; SCA1_0: 10 males, 10 females; WT_E: 10 males, 10 females; WT_0: 11 males, 9 females) were treated for 95 days and then subjected to a series of motor, cognitive and behavioral tests performed during next two weeks. Treatment with edaravone or saline continued during these two weeks until the day of the last functional test. The next day after completing the series of functional tests the mice were euthanized to take brain samples for histological examination (2 males and 2 females per group from both SCA1 groups and from the group WT_0 used as an indicator of normal state). Mice of the
cohort b (SCA1_E: 5 males, 5 females; SCA1_0: 5 males, 5 females; WT_E: 7 males, 5 females; WT_0: 5 males, 5 females) were euthanized after 100 days of edaravone or saline treatment without any further experimental manipulations. Their brains of all mice of the cohort b were used for examination of mitochondrial functions and the brains of 4 males and 4 females per experimental group also for biochemical examination of IL 6 and BDNF using ELISA method (see part 4.5 for details on brain structures preparation).
4.3. Treatment
Edaravone (3-methyl-1-phenyl-2-pyrazoline-5-one, M70800, Sigma-Aldrich) in a dose of 40 mg per kg of the body weight in saline (dilution of 50 mg per ml) was administered perorally (injected with a pipette into the mouth of the mouse while checking for possible liquid leakage) daily from the 8th week of age for 108 days (cohort a, for last 13 days simultaneously with functional tests) or for 100 days (cohort b), respectively. An adequate volume of saline was administered to the control mice (SCA1_0, WT_0).
4.4. Motor, Cognitive, and Behavioral Tests
4.4.1. Sucrose preference test
The degree of depression or anhedonia was examined by the sucrose preference test. Two bottles were placed in the mouse cage - one with tap water, the other containing 3% sucrose solution. Positions of the bottles were switched daily to minimize a potential effect of place preference. Intake of tap water and sucrose solution was measured daily for 4 days. Consumption was summed over 4 days of the test. Sucrose preference was expressed as relative sucrose consumption over the total fluid intake.
4.4.2. Open field test
Spontaneous activity (novel environment exploration) was monitored in the open field. A white plastic arena sized 50 cm x 50 cm x 50 cm and was illuminated by diffuse light (250 – 300 lux) was used. The mouse was placed into the center of the arena and left undisturbed for 10 minutes to explore freely. Its movement was recorded by the EthoVision XT14 tracking system (Noldus Information Technology, The Netherlands). Total distance moved and thigmotaxis (the portion of the length of trajectory realized in a peripheral zone along the arena walls of width of 6 cm) were analyzed.
4.4.3. Gait analysis
The gait was examined using the CatWalk XT10.6 system (Noldus Information Technology, The Netherlands) [
85] that has been shown to display gait disturbances in ataxic mice [
86]. Five runs were analyzed from each mouse and parameter values were averaged. A total of 53 parameters, which included mean values and their standard deviations, were monitored. Such a large number of parameters were viewed as a complex (see statistical methods) and the parameters were divided into three groups according to their correlations. For a complete overview of the evaluated parameters, see Supplementary material 1.
4.4.4. Water T-maze
Memory and cognitive flexibility were examined in the water T-maze. The arms of T-shaped arena were 7 cm wide and two of them were 30 cm long, one (the starting arm) was 38 cm long. The maze was filled with opaque water (with non-toxic white food coloring) of temperature of 21 – 23 °C. The mice learned to navigate to the platform, which was hidden 0.5 cm under the water surface. The location of the hidden platform in one of the two arms varied during the three-day (D1-D3) testing scheme with 4 sessions (S1-S4) per day and 4 trials per session. The trials in one session followed immediately after each other while between the sessions, the mice had at least 5-minute resting periods spent in their home cages. In each trial, the mouse had a maximum of 60 s to find the platform otherwise it has been guided by the experimenter there. After each trial, the mouse was left on the platform for 20 s. On all sessions of D1 and S1, S2 of D2, the platform was located in the left arm (initial learning). Then the position of the platform was changed to the right for S3 and S4 of D2 and all sessions of D3 (reversal task). Performance in the test was evaluated by scoring. If the mouse turned well and swam to the platform for the first attempt, it gained 1 point. If its first turn was to the wrong arm (i.e. without the platform) or did not achieve the platform within 60 s, it gained no points. Points from all trials in the session were summed and expressed in percent. Four points represented 100% success. If the mice demonstrated immobile behavior, they were motivated to move via noise or the gentle touching of the tail, if necessary.
4.4.5. Forced swimming test
Depressive-like behavior or learned helplessness behavior were examined using the forced swimming test [
47]. The mouse was left in the glass cylindrical vessel (16 cm in diameter) filled up to 10 cm below the rim (the mouse did not touch the bottom of the vessel) with water of 26-28 °C for 8 minutes. Its movement was registered by EthoVision XT14 (Noldus Information Technology, The Netherlands). Time spent in the immobile state was measured and the results were expressed as relative values to the total duration of the test.
4.4.6. Muscle strength measurement
Muscle strength was measured using the Grip Strength test (Bioseb) on the first day of rotarod testing before the first rotarod trial (see part 4.4.7). The mouse was allowed to grasp a metal grid with its forepaws. When the tail was pulled, the force at which the mouse released the grids was measured. The measurement was repeated four times and the values were averaged.
4.4.7. Rotarod
Motor coordination was examined using the accelerating rotarod (RotaRod Advanced, TSE Systems GmbH, Germany). The examination took place during the 3 days before the start of treatment (PRE) and the last 3 days of treatment (POST). A rod was 4 cm in diameter and 8 cm long. The rotation speed was gradually increased from 0 to 60 rotations per minute (RPM) over a period of 6 minutes. Fall latency was measured. Four trials were performed daily. The time between the starts of the trials was 16 minutes. The mean fall latencies were calculated. The rotarod test was repeated for 3 consecutive days.
4.5. Sample Collection
The mice of cohort a were euthanized by an overdose of Thiopental and transcardially perfused with Ringer´s solution and phosphate buffered (pH 7.4) 4% paraformaldehyde (PFA) in saline. The brains were removed and left in PFA for 2 hours for post-fixation and then in 30% sucrose for cryoprotection overnight. Finally, they were frozen and stored at -80 °C until further histological processing (see part 2.6).
The mice of cohort b were euthanized via cervical dislocation on the next day after completing 100 days of treatment and the brains were removed. One half of the cerebellum and one hippocampus were dissected and immediately used to examine mitochondrial functions (see part 2.7). The second half of the cerebellum and the second hippocampus were stored at -80 °C until further processing for measuring BDNF and IL6 levels using ELISA (see part 2.8).
4.6. Histological Examination
The brains were cryo-sectioned into 40 µm frontal slices. Free floating sections containing the cerebellum (sampling: every 5th section) and the hippocampus (sampling: every 6th section) were processed for immunofluorescent detection of calbindin and PSA-NCAM, respectively. The slices were washed with 0.01 M PBS four times for 5 minutes, blocked with 10% normal goat serum for 1 hour and then were incubated with primary antibodies (Anti-calbindin, 1:1500, PA5-85669, Invitrogen; Anti-PSA-NCAM, 1:500, 14-9118-82, Invitrogen) overnight at room temperature. Then, the slices were rinsed in 0.01 M PBS for 5, 10 and 30 minutes and incubated with the secondary antibodies (Alexa Fluor 488-goat anti-mouse IgG preadsorbed, 1:400, ab150117, Abcam; Alexa Fluor 594-goat anti-rabbit IgG preadsorbed, 1:400, ab150084, Abcam) for 2 hours in the dark at room temperature. Finally, the sections were rinsed in 0.01 M PBS for 5, 10 and 30 minutes and mounted using Fluoroshield with DAPI (Sigma-Aldrich, Saint Louis, USA).
The specimens were visualized using a fluorescent Olympus BX51 microscope (Olympus Corporation, Japan). Photodocumentation was done using a DP70 digital camera microscope (Olympus Corporation, Japan) under standardized exposure time, sensitivity, and excitation intensity. The images were analyzed using Fiji software (ImageJ).
The volume of cerebellar molecular layer and the hippocampal dentate gyrus have been estimated using the point grid method and Cavalieri principle [
87,
88]. Images showing DAPI staining (cell nuclei labelling) were used for hippocampal dentate gyrus estimation. Cerebellar molecular layer volume was estimated using images showing anti-calbindin immunofluorescence indicating precisely Purkinje cell layer as a borderline.
The density of calbindin in the cerebellar molecular layer was analyzed by measuring the color intensity in the molecular layer. Intensity was measured in each slice in 2 randomly-spaced samples in the vermis and 4 randomly-spaced samples in the cerebellar hemispheres (2 samples in each hemisphere). The density of PSA-NCAM was analyzed by measuring the immunofluorescence signal intensity in hippocampal regions of molecular layer of the dentate gyrus, polymorphic layer of the dentate gyrus hilar region, pyramidal layer of an area that is labelled as the CA4 subfield by some authors [
89], and stratum lacunosum-moleculare of the CA1 (for further information, see [
4]).
4.7. Examination of Mitochondrial Functions
The mitochondrial functions were examined by mitochondrial high-resolution respirometry in the tissue of the cerebellum and the hippocampus of cohort
b. All measurements were performed in quadruplicates (4 x per mouse and brain structure). Dissected tissue was gently dried on a filter paper, weighed and subsequently homogenized on ice in MiR05 [
90] respiration medium using a PBI-Shredder O2k-Set (Oroboros Instruments, Innsbruck, Austria). Oxygraphy was performed as described elsewhere [
4]. Briefly, homogenized tissue samples were inserted into 4 precalibrated oxygraphs (Oroboros, Innsbruck, Austria), each containing 2 separate chambers. After the O
2 signal was stabilized, chambers were closed and standard Substrate-Uncoupler-Inhibitor Titration protocol (SUIT) was applied [
91]. NADH-linked substrates, malate (5 mmol/L), glutamate (10 mmol/L), and pyruvate (5 mmol/L) were added to reach the LEAK (L) state, then ADP (5 mmol/L) was injected to convert the respiration into OXPHOS (ATP-producing) state. Addition of cytochrome c (10 µmol/L) served to test the integrity of the inner mitochondrial membrane (PI). Then, succinate (50 mmol/L), a complex II substrate was added to initiate phosphorylating PI+II state. Stepwise titration of FCCP (0.5 µmol/L titrations) was used to uncouple respiration and phosphorylation and gain maximal electron transport system capacity (state EI+II). Titration of rotenone (0.5 µmol/L), a complex I inhibitor helped to evaluate uncoupled complex II capacity (EII) and antimycin A (complex III inhibitor; 2.5 μg/mL) was used to obtain residual oxygen consumption (ROX). Complex IV activity was measured by adding ascorbate (2 mmol/L) and TMPD (0.5 mmol/L; artificial substrate of complex IV) followed by sodium azide (100 mmol/L) – a complex IV inhibitor (to get background autooxidation for data correction). All data were corrected for ROX. All samples were kept in -80°C for later measurement of citrate synthase activity. Oxygen consumption in the individual respiratory states was expressed in pmol O
2/s/mg tissue wet weight.
The citrate synthase activity was measured to estimate mitochondrial content in the samples from each oxygraph chamber. The assay medium (900 µL; 0.1 mmol/L 5,5-dithio-bis- (2-nitrobenzoic) acid, 0.25% triton-X, 0.5 mmol/L oxaloacetate, 0.31 mmol/L acetyl coenzyme A, 5 µmol/L EDTA, 5 mmol/L triethanolamine hydrochloride, and 0.1 mol/L tris-HCl, pH 8.1) was mixed with 100 µL of the mixed and homogenized chamber content. The rate of absorbance change was measured spectrophotometrically at 412 nm and 30 °C over 200 s. Citrate synthase activity was expressed in IU/g tissue wet weight.
4.8. Determination of the Level of BDNF and the Inflammatory Marker IL6
The levels of BDNF in the cerebellum and IL6 in the cerebellum and hippocampus were determined by ELISA. Human BDNF SimpleStep ELISA kit (with mouse reactivity; ab212166, Abcam, Cambridge, UK) and Mouse IL6 SimpleStep ELISA kit (ab222503, Abcam, Cambridge, UK) were used according to the manufacturer´s instructions. The absorbance was measured using Tecan Infinite M200 Pro microplate reader. Data was normalized to the protein level measured using the Bicinchoninic Acid Kit for Protein Determination (BCA1, Sigma-Aldrich, Saint Louis, USA) according to the manufacturer’s instructions. All specimens were processed in duplicates and values were averaged.
4.9. Statistics
Data analysis was done using R [
92] in R-studio [
93]. Statistical models were fitted in Bayesian framework via ‘brms’ [
94,
95] R package, employing ‘Stan’ as backhand software for No-U-Turn Sampler (NUTS) probabilistic sampling [
96,
97]. Two chains, each consisting of 8,000 iterations (2,000 warm-ups), were used to sample from probability space. Described R code and data will be available on the day of publication at
https://github.com/filip-tichanek/edaravonSCA1.
Continuous data of proportions (values from 0 to 1) were analyzed via beta regression with logit link. The proportions of successes/failures (from T-maze) were modelled with beta-binomial model with logit-link. Non-negative right-skewed data were modelled via Gamma regression with log-link. Data with approximately Gaussian residuals were fitted with Gaussian models or student t distribution when there were outliers. All models were checked via posterior predictive check (PPC) [
98]. If preliminary visual inspection indicated that sex may affect the result noticeably, we also fitted an alternative model that included sex as a covariate and compared them with each other via leave-one-out cross-validation (LOO) [
99]. Longitudinal and otherwise correlated data were analyzed in the same way, but the models included random effect(s) accounting for the dependency.
For the analysis of CatWalk, we originally evaluated 53 gait parameters. As 4 parameters showed many-zero values, these were omitted from the analysis. Gait parameters of consistency (standard deviations [SD] of gait parameters) were log-transformed whereas parameters in percentages were transformed to raw proportions (0-1) and logit-transformed. Given such a high number of parameters, the gait was analyzed as a conglomerate of outcomes with multivariate statistical approaches. At first, we Z-standardized all gait parameters, extracted principal components (PC) and used the first 3 of them (explaining together 69% of the variability in the gait parameters) as outcomes in a multivariate Bayesian regression model. As the walking speed may strongly affect numerous parameters, the analysis was repeated but with adjustment for walk speed. As an additional method, we also used permutational analysis of variance (PERMANOVA) with Euclidian distances via ‘vegan’ R package [
100].
We used the Gaussian Bayesian mixed-effect model with rotarod latency as an outcome (no averaging) and with the following predictors: day, session, group, day: session, day: group, rot_lat_PRE (mean rotarod latency before the start of treatment from the days 2 and 3).
We used a Bayesian generalized linear model with beta-binomial distribution to model success in T-maze.
1] analysis of overall success from all testing sessions (sessions 4-6 and 11-12).
2] analysis of initial learning: sessions 4-6
3] analysis of flexibility: sessions 11-12. As the performance may be paradoxically increased in non-learners, the performance in session 7 was included as a covariate to the model. Such a model showed better predictive accuracy as indicated by leave-one-out cross-validation.
PSA-NCAM immunofluorescence (PSA-NCAM IF) in the hippocampus was analyzed via a Bayesian hierarchical generalized additive model with Gamma distribution and random-intercept effect, represented by mouse ID. As the PSA-NCAM IF showed an apparent sex-related difference, further confirmed with leave-one-out cross-validation, the sex factor was included in the final model. As the PSA-NCAM IF varied across slices from the frontal to caudal regions, the order of slices was included as a factor with a non-linear effect, fitted with thin-plate splines limited to 3 knots.
Calbindin immunofluorescence intensity was evaluated with Bayesian hierarchical regression, with two levels of random intercept: mouse ID and slice ID (nested in mouse). The model was adjusted for subregion (vermis vs. hemisphere) and immunofluorescence intensity in the neighboring granular layer.
Hippocampal volumes (volumes of each of the two hippocampi constituted a separate data input) were modelled with a robust regression (student t-distribution) with mouse ID as a random-intercept factor.
For Bayesian models, we used Gaussian priors for all fixed-effect parameters (including the intercept) and default priors otherwise. For the effect of edaravone, we used prior with zero mean and sigma of 1.2 (or 1.2*SD of SCA1 data in case of models with Gaussian or student-t distribution). For the genotype effect, we used weakly informative prior, utilizing the information from our previous publication (Tichanek et al., 2020) when methodologies were comparable. See
https://github.com/filip-tichanek/edaravonSCA1 for more details.
Effect sizes are shown in absolute effect (Gaussian models), odds ratio (OR; for beta distribution), log(OR) (log-odds, used for T-maze due to long tails of the posterior distribution), and fold-difference/change [FD] (for Gamma models) indicating how many times larger the measure is in one group compared to the other. For all the effects of interest, we show the whole posterior probability distribution. FD and OR have zero effect in 1, absolute effect and log(OR) have zero effect at zero. We used 95% credible intervals to report uncertainty about the estimated effects and calculated also probability of direction which may be interpreted as an index (0.5 to 1) representing the certainty that the effect goes in a particular direction (Makowski et al., 2019). For PERMANOVA, as non-Bayesian analysis, p-value is reported. Generally, the probability of direction >0.975 and p-value <0.05 were considered as indication of the plausible effect.
Figure 1.
Scheme the experiment for cohorts a and b. Day 1 represents the first day of treatment with edaravone or saline at the age of 8 weeks. Functional tests included the sucrose preference test (SUC), the open field test (OF), the gait analysis by CatWalk system (CW), the water T-maze (WTM), the forced swimming test (FST), the rotarod (RR), and the muscle strength measurement (MS). † Brain sampling for histological examination, †† Brain sampling for mitochondrial function examination and IL6 and BDNF level measurement.
Figure 2.
Sucrose preference test of anhedonia-like behavior. (a) The relative sucrose consumption in individual experimental groups (WT = wild type mice, SCA1 = SCA1 mice, 0 = saline, E = edaravone), where lines represent group-specific prediction from the Bayesian model and its 95% credible intervals. (b) The posterior probability distribution for odds ratios (OR) between relative sucrose consumption in compared groups. Curves represent the posterior probability distribution and lines below the curve show the 95% credible interval for the OR. The exact values for the estimated OR and its credible interval are shown in brown colors (top), and the probability of direction is shown in purple colors (right).
Figure 3.
Open field test. (a) Spontaneous activity (distance moved) and (b) Thigmotaxis (portion of distance moved in the peripheral 6 cm wide zone) in individual experimental groups (WT = wild type mice, SCA1 = SCA1 mice, 0 = saline, E = edaravone), where lines represent group-specific prediction from the Bayesian model and its 95% credible intervals. (c, d) The posterior probability distribution for fold differences (FD) between compared groups in distance moved and thigmotaxis, respectively. Curves represent the posterior probability distribution and lines below the curve show the 95% credible interval for the FD. The exact values for the estimated FD and its credible interval are shown in brown colors (top), and the probability of direction is shown in purple colors (right).
Figure 4.
Gait analysis (CatWalk). (a) Relation between principal component 2 (PC2) and principal component 3 (PC3) values in individual mice from all experimental groups (WT = wild type mice, SCA1 = SCA1 mice, 0 = saline, E = edaravone). (b) The posterior probability distribution for fold differences (FD) in PC1, PC2 and PC3 in compared groups without (original PC values) or with adjusting for walking speed. Curves represent the posterior probability distribution and lines below the curve show the 95% credible interval for the FD. The exact values for the estimated FD and its credible interval are shown in brown colors (top), and the probability of direction is shown in purple colors (right).
Figure 5.
T-maze test. (a) Mean percentage of correct maze arm choices in individual initial learning and reversal task sessions in individual experimental groups (WT = wild type mice, SCA1 = SCA1 mice, 0 = saline, E = edaravone). (b) Overall percentage of correct maze arm choices in testing sessions only (both initial learning and reversal task together) in individual experimental groups where lines represent group-specific prediction from the Bayesian model and its 95% credible intervals. (c) The posterior probability distribution for fold differences (FD) between correct choice percentages in compared groups (in testing sessions only, acquisition sessions are not involved). Curves represent the posterior probability distribution and lines below the curve show the 95% credible interval for the FD. The exact values for the estimated FD and its credible interval are shown in brown colors (top), and the probability of direction is shown in purple colors (right).
Figure 6.
Forced swimming test. (a) The proportion of immobility in individual experimental groups (WT = wild type mice, SCA1 = SCA1 mice, 0 = saline, E = edaravone), where lines represent group-specific prediction from the Bayesian model and its 95% credible intervals. (b) The posterior probability distribution for odds ratios (OR) between immobility in compared groups. Curves represent the posterior probability distribution and lines below the curve show the 95% credible interval for the OR. The exact values for the estimated OR and its credible interval are shown in brown colors (top), and the probability of direction is shown in purple colors (right).
Figure 7.
Muscle strength. (a) Grip strength in individual experimental groups (WT = wild type mice, SCA1 = SCA1 mice, 0 = saline, E = edaravone), where lines represent group-specific prediction from the Bayesian model and its 95% credible intervals. (b) The posterior probability distribution for fold differences (FD) between grip strength in compared groups. Curves represent the posterior probability distribution and lines below the curve show the 95% credible interval for the FD. The exact values for the estimated FD and its credible interval are shown in brown colors (top), and the probability of direction is shown in purple colors (right).
Figure 8.
Rotarod. (a) Mean fall latencies in individual experimental groups (WT = wild type mice, SCA1 = SCA1 mice, 0 = saline, E = edaravone) in individual day sessions (D1-D3) of the pre-treatment (PRE) and post-treatment (POST) tests. PRE sessions are used just as covariate for analysis of POST sessions that are of our primary interest. (b) The posterior probability distribution for fold differences (FD) between fall latencies in POST sessions in compared groups. Curves represent the posterior probability distribution and lines below the curve show the 95% credible interval for the FD. The exact values for the estimated FD and its credible interval are shown in brown colors (top), and the probability of direction is shown in purple colors (right).
Figure 9.
(a) Anti-calbindin immunofluorescence signal density in the cerebellar molecular layer and (c) cerebellar molecular layer volume in individual experimental groups (WT = wild type mice, SCA1 = SCA1 mice, 0 = saline, E = edaravone), where lines represent group-specific prediction from the Bayesian model and its 95% credible intervals. (b, d) The posterior probability distribution for fold differences (FD) between compared groups in anti-calbindin immunofluorescence signal density and molecular layer volume, respectively. Curves represent the posterior probability distribution and lines below the curve show the 95% credible interval for the FD. The exact values for the estimated FD and its credible interval are shown in brown colors (top), and the probability of direction is shown in purple colors (right). (e, f) Example of anti-calbindin immunofluorescence in the cerebellum of a WT and SCA1 mouse, respectively.
Figure 10.
(a) Hippocampal dentate gyrus volume in individual experimental groups (WT = wild type mice, SCA1 = SCA1 mice, 0 = saline, E = edaravone), where lines represent group-specific prediction from the Bayesian model and its 95% credible intervals. (b) The posterior probability distribution for fold differences (FD) between dentate gyrus volume in compared groups. Curves represent the posterior probability distribution and lines below the curve show the 95% credible interval for the FD. The exact values for the estimated FD and its credible interval are shown in brown colors (top), and the probability of direction is shown in purple colors (right). (c, d) Example of the hippocampus with nuclei visualized using DAPI in a WT and a SCA1 mouse, respectively.
Figure 11.
Anti-PSA-NCAM immunofluorescence signal density in the hippocampal regions: (a) dentate gyrus molecular layer (DG-ML), (c) hilus of the dentate gyrus DG-hilus), (e), CA1 stratum lacunosum-moleculare (CA1-SRLM) and (g) CA4 pyramidal layer (CA4-PL) in individual experimental groups (WT = wild type mice, SCA1 = SCA1 mice, 0 = saline, E = edaravone). (b, d, f, h) The posterior probability distribution for fold differences (FD) between compared groups in PSA-NCAM density in the DG-ML, DG-hilus, CA1-SRLM, and CA4-PL respectively. Curves represent the posterior probability distribution and lines below the curve show the 95% credible interval for the FD. The exact values for the estimated FD and its credible interval are shown in brown colors (top), and the probability of direction is shown in purple colors (right). (i, j) Example of anti-PSA-NCAM immunofluorescence in the hippocampus of a WT and a SCA1 mouse, respectively.
Figure 12.
Mitochondrial respiratory states expressed per mg tissue wet weight in the cerebellum. (a) Respiratory phosphorylating (PI, PI + II) and electron-transporting (E I + II, EII) capacities, and complex IV activity in individual experimental groups (WT = wild type mice, SCA1 = SCA1 mice, 0 = saline, E = edaravone), where lines represent group-specific prediction from the Bayesian model and its 95% credible intervals. (b) The posterior probability distribution for odds ratios (OR) between mitochondrial respiration in compared groups. Curves represent the posterior probability distribution and lines below the curve show the 95% credible interval for the OR. The exact values for the estimated OR and its credible interval are shown in brown colors (top), and the probability of direction is shown in purple colors (right).
Figure 13.
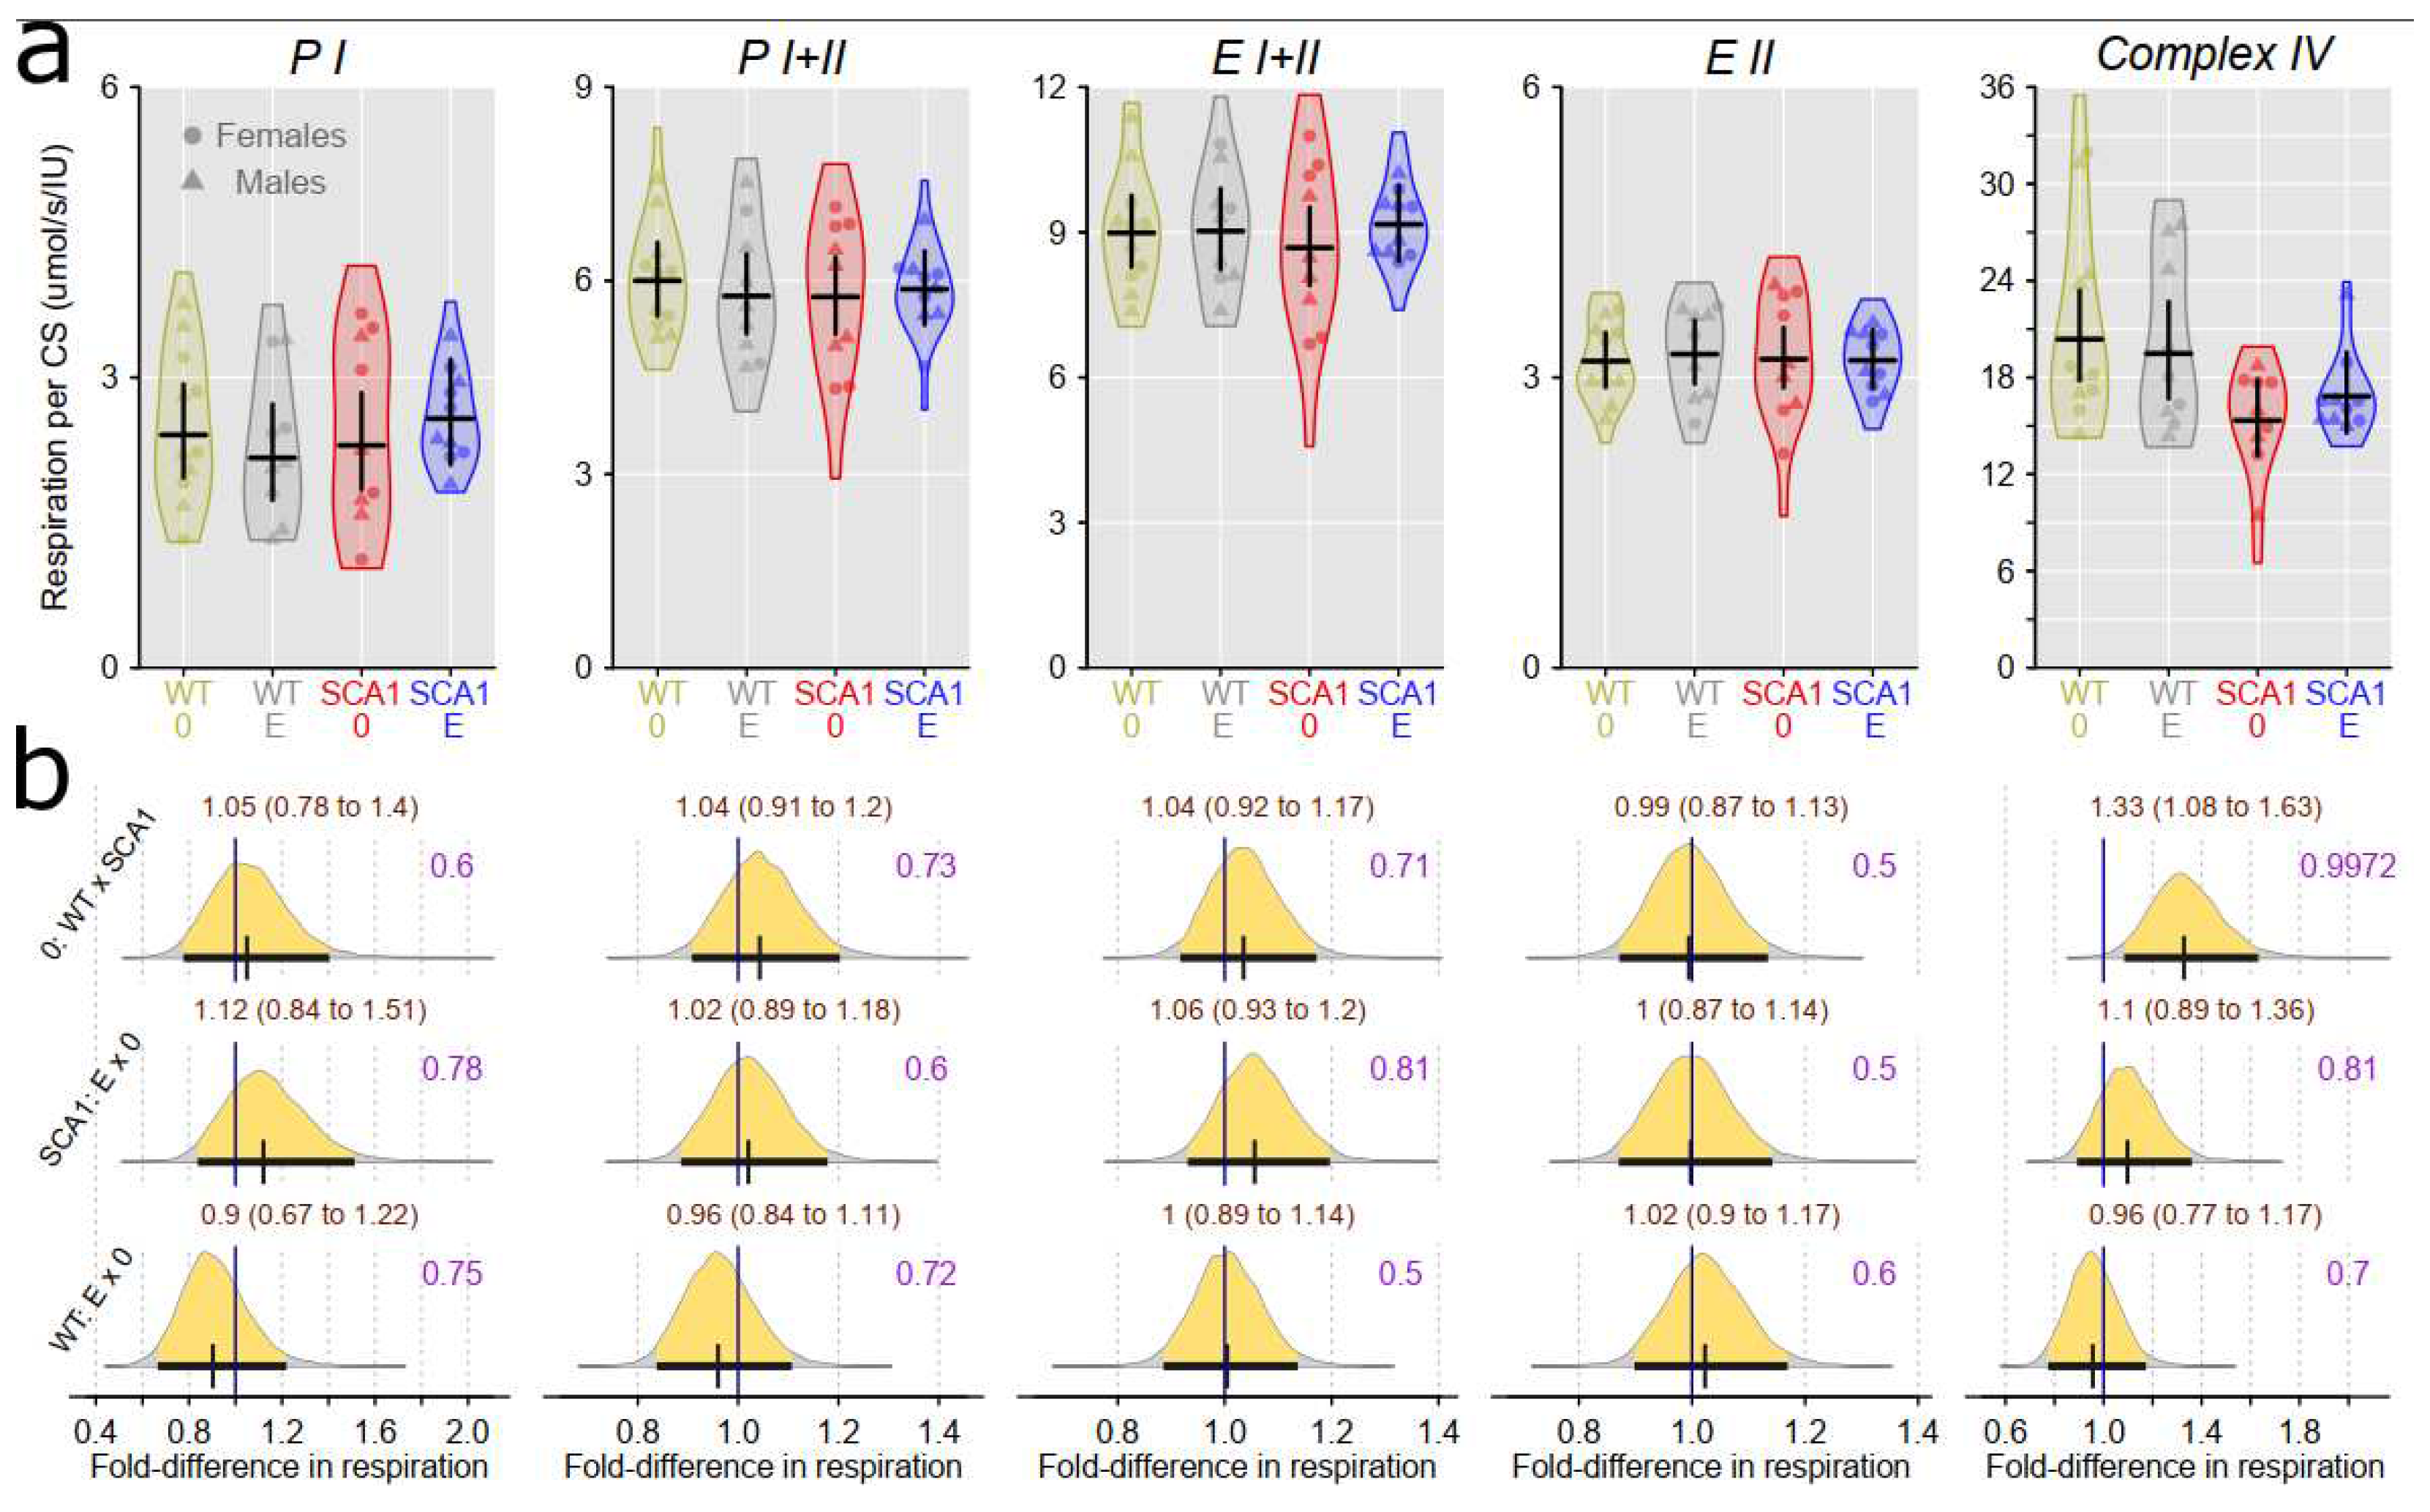
Mitochondrial respiratory states expressed per IU citrate synthase activity in the cerebellum. (a) Respiratory phosphorylating (PI, PI + II) and electron-transporting (E I + II, EII) capacities, and complex IV activity in individual experimental groups (WT = wild type mice, SCA1 = SCA1 mice, 0 = saline, E = edaravone), where lines represent group-specific prediction from the Bayesian model and its 95% credible intervals. (b) The posterior probability distribution for odds ratios (OR) between mitochondrial respiration in compared groups. Curves represent the posterior probability distribution and lines below the curve show the 95% credible interval for the OR. The exact values for the estimated OR and its credible interval are shown in brown colors (top), and the probability of direction is shown in purple colors (right).
Figure 14.
Mitochondrial respiratory states expressed per mg tissue wet weight in the hippocampus. (a) Respiratory phosphorylating (PI, PI + II) and electron-transporting (E I + II, EII) capacities, and complex IV activity in individual experimental groups (WT = wild type mice, SCA1 = SCA1 mice, 0 = saline, E = edaravone), where lines represent group-specific prediction from the Bayesian model and its 95% credible intervals. (b) The posterior probability distribution for odds ratios (OR) between mitochondrial respiration in compared groups. Curves represent the posterior probability distribution and lines below the curve show the 95% credible interval for the OR. The exact values for the estimated OR and its credible interval are shown in brown colors (top), and the probability of direction is shown in purple colors (right).
Figure 15.
Mitochondrial respiratory states expressed per IU citrate synthase activity in the hippocampus. (a) Respiratory phosphorylating (PI, PI + II) and electron-transporting (E I + II, EII) capacities, and complex IV activity in individual experimental groups (WT = wild type mice, SCA1 = SCA1 mice, 0 = saline, E = edaravone), where lines represent group-specific prediction from the Bayesian model and its 95% credible intervals. (b) The posterior probability distribution for odds ratios (OR) between mitochondrial respiration in compared groups. Curves represent the posterior probability distribution and lines below the curve show the 95% credible interval for the OR. The exact values for the estimated OR and its credible interval are shown in brown colors (top), and the probability of direction is shown in purple colors (right).
Figure 16.
IL6 level in (a) the cerebellum and (c) the hippocampus in individual experimental groups (WT = wild type mice, SCA1 = SCA1 mice, 0 = saline, E = edaravone), where lines represent group-specific prediction from the Bayesian model and its 95% credible intervals. (b, d) The posterior probability distribution for fold differences (FD) between compared groups in cerebellar and hippocampal IL6 levels, respectively. Curves represent the posterior probability distribution and lines below the curve show the 95% credible interval for the FD. The exact values for the estimated FD and its credible interval are shown in brown colors (top), and the probability of direction is shown in purple colors (right).
Figure 17.
(a) Cerebellar BDNF level in individual experimental groups (WT = wild type mice, SCA1 = SCA1 mice, 0 = saline, E = edaravone), where lines represent group-specific prediction from the Bayesian model and its 95% credible intervals. (b) The posterior probability distribution for odds ratios (OR) between BDNF levels in compared groups. Curves represent the posterior probability distribution and lines below the curve show the 95% credible interval for the OR. The exact values for the estimated OR and its credible interval are shown in brown colors (top), and the probability of direction is shown in purple colors (right).

