1. Introduction
Post-harvest discoloration of fruits and vegetables, which seriously affect flavour and economic value, is a common problem in the food production industry and a major contributor to food wastage. Many factors such as bruising, wounding, herbivory and diseases can contribute to discoloration [
1]. Discoloured foods are frequently discarded because of poor customer acceptance of such defects. The disruption of intracellular compartmentation caused by mechanical damage during harvesting, processing or transport causes release of the plastid-localized enzyme polyphenol oxidase (PPO), which can then interact with vacuolar substrates to produce o-quinones, which in turn polymerize to ultimately produce high molecular weight black and brown pigments that are generically called melanin [
2,
3,
4]. Melanins are toxic and provide resistance to insects and pests as well as give some additional mechanical strength to tissues such as seed shells [
4]. Enzymatic browning is a common cause of the discolouration seen in root vegetables [
5].
The hardness of vegetables such as carrots is determined by cell walls. Destruction of the internal structure of the cell wall is usually the major reason for softening. The expression of genes regulating the dissociation of the intercellular cell wall layer in fruits, together with the degradation of pectin, and the disintegration of fibrous materials lead to successive disintegration and destruction of cell organelles. Pectin is a main component of primary cell walls and plays an important role in plant development and defence [
6]. The pectin backbone is mainly comprised of galacturonic acid, and the two most common pectic polysaccharides are homogalacturonan (HG) and rhamnogalacturonan-I (RG-I; 7]/ Microbial pathogens release cell wall degrading enzymes that loosen the structure of the wall [
8]. Plants also produce these enzymes, which are essential for modifying pectin during plant growth and development [
9,
10]. Pectin is degraded by a variety of enzymes, including polygalacturonases, pectin methylesterases, pectin lyases and pectate lyases Lyases are enzymes that cleave glycosidic bonds specifically in homogalacturonan and rhamnogalacturonan regions [
9]. These pectin degrading enzymes become increasingly active after harvest, when the fruits ripen [
11]. Pectin degradation produces signals that trigger plant defence responses [
12]. Cell wall rigidity is enhanced by lignin. This complex phenolic polymer is associated with all cell walls. Lignin synthesis starts in the cell corners and middle lamella, and thereafter continues through primary cell wall and then proceeds into the secondary cell wall. The concentration of lignin is highest in the middle lamella and primary cell wall, forming an important barrier to pests and pathogens as well as increasing the mechanical strength of the wall [
13] Increased lignification is part of the plant defence response to abiotic and biotic stresses [
14,
15,
16]
Carrots are one of the most important vegetable crops globally. Carrot tap roots are regularly stored underground in the growing fields throughout the United Kingdom for up to 12 months, with each field harvested, as required. Once harvested, carrots can be processed into batons, which are cut roughly into ~7 cm long sections and packaged. Over the last 10 years, a previously unknown and financially crippling blackening phenomenon has been observed in cut carrots that are harvested towards the end of the storage year. The highest level of blackening occurs either on the day of processing (day 0) or the following day (day 1) but the likelihood of blackening is not predictable, often occurring only on supermarket shelves. Little is known about the carrot blackening process and its causes are unknown. While loss of membrane integrity may be a factor in blackening, this is not a rapid process in cut carrots because the black regions can appear throughout the 72h following processing. This latency period in the formation of black regions may be linked to an activation of secondary metabolism and PPO activity following mechanical wounding during processing. Wounding leads to an increase in the accumulation of reactive oxygen species (ROS) and changes in low molecular weight antioxidants and antioxidant enzymes. An enhanced breakdown of the major low molecular weight antioxidant, vitamin C (ascorbate), which produces metabolites such as threonic acid, as a result of wounding could contribute to non-enzymatic blackening in carrots as it does in apples [
17]. The following studies were therefore undertaken in order to determine the molecular and metabolic processes that underpin the blackening phenomenon. This information is essential to understand the blackening process and how it is regulated, so that methods of delaying or preventing the blackening can be devised and so reduce unnecessary wastage of food and resources.
2. Materials and Methods
2.1. Plant Materials
Carrots (Daucus carota variety ‘Nairobi’) were harvested from commercial fields and processed in the factories of Kettle Produce Ltd, who provided samples of cut carrot batons over a three-year period. Black and orange samples were harvested from batons from the same batches, together with samples from the border regions between the black and orange tissues. In all cases, samples were harvested and compared from the carrots originating from the same field, grower and date of harvest.
2.2. Cell Wall Analyses
Sample Preparation. Orange and black carrot samples were cut into 1 cm2 sections and fixed in a PEM buffer (50 mM Pipes, 5 mM EGTA, 5 mM MgSO4, pH 6.9) containing 4% paraformaldehyde for 1 h. Fixed samples were washed twice in 1x PBS for 10 min each time and then dehydrated using increasing concentrations of ethanol (30%, 50%, 70%, 90% and 100%) for 30 min each at 4oC. Samples were warmed to 37oC and incubated overnight at 37oC in 1:1 Steedman’s wax and 100% ethanol, followed by two changes of 100% wax for 1 h at 37oC. The samples were positioned in moulds, and wax poured into the moulds until a convex surface was visible, which then set overnight at room temperature. The moulds were chilled for 10 min before samples were cut into 12 µm sections (Microm HM-325 microtome) and placed onto polysine-coated glass slides (VWR International, Leuven, Belgium). The sections were dewaxed and rehydrated using decreasing concentrations of ethanol (3x 97%, 90%, 50%, water) for 10 min each, followed by 1.5 h in water. Microscope sections were then dried.
2.3. Immunolabeling and Fluorescence Imaging and Processing
In this study, the following rat monoclonal antibodies (MAbs) were used: LM25 which binds to xyloglucan [
18], LM5 which binds to pectic galactan [
19], LM6 to pectic arabinan [
20], LM19 to unesterified pectic HG [
21], JIM7 to partially methyl-esterified pectic HG [
21] and LM20 to highly methyl-esterified pectic HG [
21].
Microscope slides containing sections of orange and black carrot tissue were incubated in 5% (w/v) milk protein/PBS for 30 min and rinsed with 1x PBS. Monoclonal primary antibodies (1 in 5 dilution) in 5% (w/v) milk protein/PBS were applied and incubated for 90 min. Sections were washed with 1x PBS three times for 5 min. Secondary antibodies (rabbit anti-rat IgG-fluorescein isothiocyanate (FITC) (Sigma, UK)) were added (1 in 100 dilution) in 5% (w/v) milk protein/PBS and incubated for 60 min in the dark. Sections were washed with 1x PBS three times for 5 min. To prevent interference of background autofluorescence, sections were stained with 0.1% Toluidine Blue O (pH 5.5 in 0.2 M sodium phosphate buffer) for 5 min and excess dye washed off. Sections were mounted in Citifluor AF1 to decrease photobleaching. Slides were viewed with an Olympus fluorescence microscope (Olympus BX61, Canada) and images captured using a Hamamatsu ORCA285 camera (Hamamatsu City, Japan) and Volocity software (Perkin Elmer, UK).
Extracting and Measuring Lignin
Sample Preparation. Orange and black regions in carrot taproots were separated, dried at 60°C and stored in darkness until analyzed. Tissue samples were ground to a fine powder using a Retch ball mill (Retsch MM400, Hann, Germany; 50 ml grinding jars with one metal ball, frequency 30 s-1). The tissue was ground in 30 second intervals 4 times to prevent heating. The extractive-free alcohol-insoluble residue (AIR) was prepared by extracting the sample 8 times with 70% (v/v) ethanol and 3 times with 100% acetone in a 25°C sonicating water bath (30 min incubation time for each extraction with regular mixing). The ratio was 140 mg plant tissue: 14 ml solvent (70% ethanol, acetone). Samples were centrifuged (4000 rpm, 10 mins) before each solvent change and the pellet mixed to the solvent by vortexing. The AIR was dried in a vacuum oven overnight at 60°C.
Lignin was quantified using an acetyl bromide (AcBr) assay [
22], as modified by Kärkönen et al., [
23]. Five mg of AIR and 5 ml of AcBr reagent (20% AcBr (v/v) in glacial acetic acid) were mixed and incubated at 50°C in a heat block for 3 h with mixing by vortex every 15 mins. AcBr reagent (5 ml) was added to an empty tube as a blank. Samples were cooled in an ice bath for 5 min, then 1.0 ml of the sample mixture was transferred to a 10-ml volumetric flask containing 2.4 ml of glacial acetic acid and 1 ml of 2 M NaOH. After gentle inversion, 0.1 ml of 7.5 M hydroxylamine-HCl was added and then the solution brought to 10 ml using glacial acetic acid. A Shimadzu UV-2401 spectrophotometer (Shimadzu Corp., Kyoto, Japan) was used to measure the absorbance of the sample at 280 nm against a blank that was treated similarly as the samples. Lignin content was calculated using following equation: Lignin% = 100(As – Ab)V/aW [As, absorbance of sample; Ab, absorbance of blank; V, volume of solution; a, absorptivity of a lignin standard (Klason lignin from spruce xylem, average from two samples 23.087 l g
–1 cm
–1); W, weight of sample]. Five measurements were done from the orange and four from the blackened samples.
2.4. Non-cellulosic Carbohydrate Content
Non-cellulosic carbohydrate analysis was carried out according to Sundberg et al. (1996) using acid methanolysis/gas chromatography (GC)/flame ionization detector (FID). AIR was prepared as described above. Calibration solution contained 0.1 mg/mL of arabinose (Ara), glucose (Glc), glucuronic acid (GlcA), galactose (Gal), galacturonic acid (GalA), 4-O-methyl glucuronic acid (4-O-Me-GlcA), mannose (Man), rhamnose (Rha) and xylose (Xyl) in methanol. AIR (4 mg) prepared from ground carrots was placed in a pear-shaped, pressure resistant flask. One ml calibration solution was dried by evaporation and treated the same way as the carrot samples. Two ml of 2 M solution of HCl in anhydrous MeOH was added and incubated for 5 h at 105°C. Once at room temperature, the solution was neutralized with 80 µl pyridine and shaken well. . An internal standard (4.0 ml) containing 0.1 mg/ml resorcinol in methanol was added and the flask shaken again. A 1-ml aliquot of the solution was evaporated using N2 gas. A solution containing 70 µl trimethylsilyl chloride (TMCS), 150 µl hexamethyl disilazane (HMDS) and 120 µl pyridine was used to silylate the dried sample at room temperature overnight. Samples were analysed using GC/FID (Shimadzu GC-2010, Kyoto, Japan) with a HP-1 Column (25 m x 0.2 mm I.d., film thickness 0.11 µm). The temperature profile was as follows: 100oC -> 175oC, 4oC/min, 175oC -> 290oC, 12oC/min. The temperature of the injector was 260oC and the temperature of the detector was 290oC. Correction factors were used to calculate the non-cellulosic carbohydrate content; Man, Glc and Gal 0.9, Ara and Xyl 0.88, Rha 0.89, GlcA, GalA and 4-O-Me-GlcA 0.91. Two replicates were used in all analyses.
2.5. Metabolite profiling
Gas chromatography/mass spectrometry (GC/MS) and high-performance liquid chromatography (HPLC) were performed on samples extracted from the orange regions, black regions and the ‘border’ regions that were immediately adjacent to the black regions. In addition, HPLC analysis was used to identify and quantify carotenoids. In total, seventeen independent biological replicates were identified using the GC/MS approach. Eight independent biological replicates were analysed using the HPLC/MS and HPLC approaches. The major peaks present on the chromatograms obtained by MS were identified on the basis of parent and fragment ion masses present in the mass spectrum of each metabolite. Metabolite profiles were compared by a one-way ANOVA using carrot blackening as the single factor. A total of 64 metabolites were found to be significantly different.
2.6. RNA sequencing (RNA-seq)
RNA was extracted from the orange regions (CT), black regions (B), and the ‘border’ regions (M) (immediately adjacent to the black regions) using a CTAB method [
24] combined with a RNA Clean & Concentrator
TM kit (Zymo Research, USA) as described by the manufacturer. Three biological replicates per region were used. The quality and quantity of RNA were determined using NanoDrop ND-1000 (Thermo Fisher Scientific) and gel electrophoresis. Illumina-compatible sequencing libraries were prepared using the Illumina TruSeq Stranded Total RNA-with Ribo-Zero Plant kit. The libraries were checked for adaptor dimers and the insert size on a Tapestation (Agilent) and quantified using the Qubit system, before creating an equimolar pool of libraries. Libraries were sequenced in SE75 (single end mode, 75 bp) using NextSeq 500 (Illumina; San Diego, CA, USA) next-generation sequencing platform.
2.7. RNA-seq Data Analysis
Sequence data were quality-checked using FastQC software followed by quality and adapters trimming in Cutadapt software. Reads trimmed to fewer than 30 nucleotides were discarded. Reads were aligned to a
Daucus carota subsp.
sativus reference genome ASM162521v1 ([
26]; Genebank: GCF_001625215.1) using a STAR aligner [
26]. The resulting alignments were checked for quality using QualiMap software [
27] and Picard tools. Picard was also used to mark PCR/Optical duplicate alignments. Bioconductor R package RSubread [
28] was used to extract raw counts per transcript. Differential expression analysis (DEA) was conducted in DeSeq2 [
29] R package. The
p-value was adjusted using the Benjamini-Hotchberg method. Differentially expressed transcripts were identified as those with an adjusted
p-value of less than 0.05 (Supplemental
Table S1). Analysis of Gene Ontology terms were made in Cytoscape with ClueGO v.2.5.7 [
30] plug-in based on the functional annotation of all carrot genes provided by Machaj and Grzebelus [
31]. Significant (
padj<0.1) terms were visualized in R ggplot2 package [
33]. Original data can be fould in the
repository Sequence Read Archive (SRA) of the National Center for Biotechnology Information (NCBI) under the project number PRJNA966197 and submission number SUB13217137.
4. Discussion
Post-harvest deterioration of crops is a major contributor to food waste and an important threat to food security. Enzymatic browning is a common cause of the discolouration seen in root vegetables [
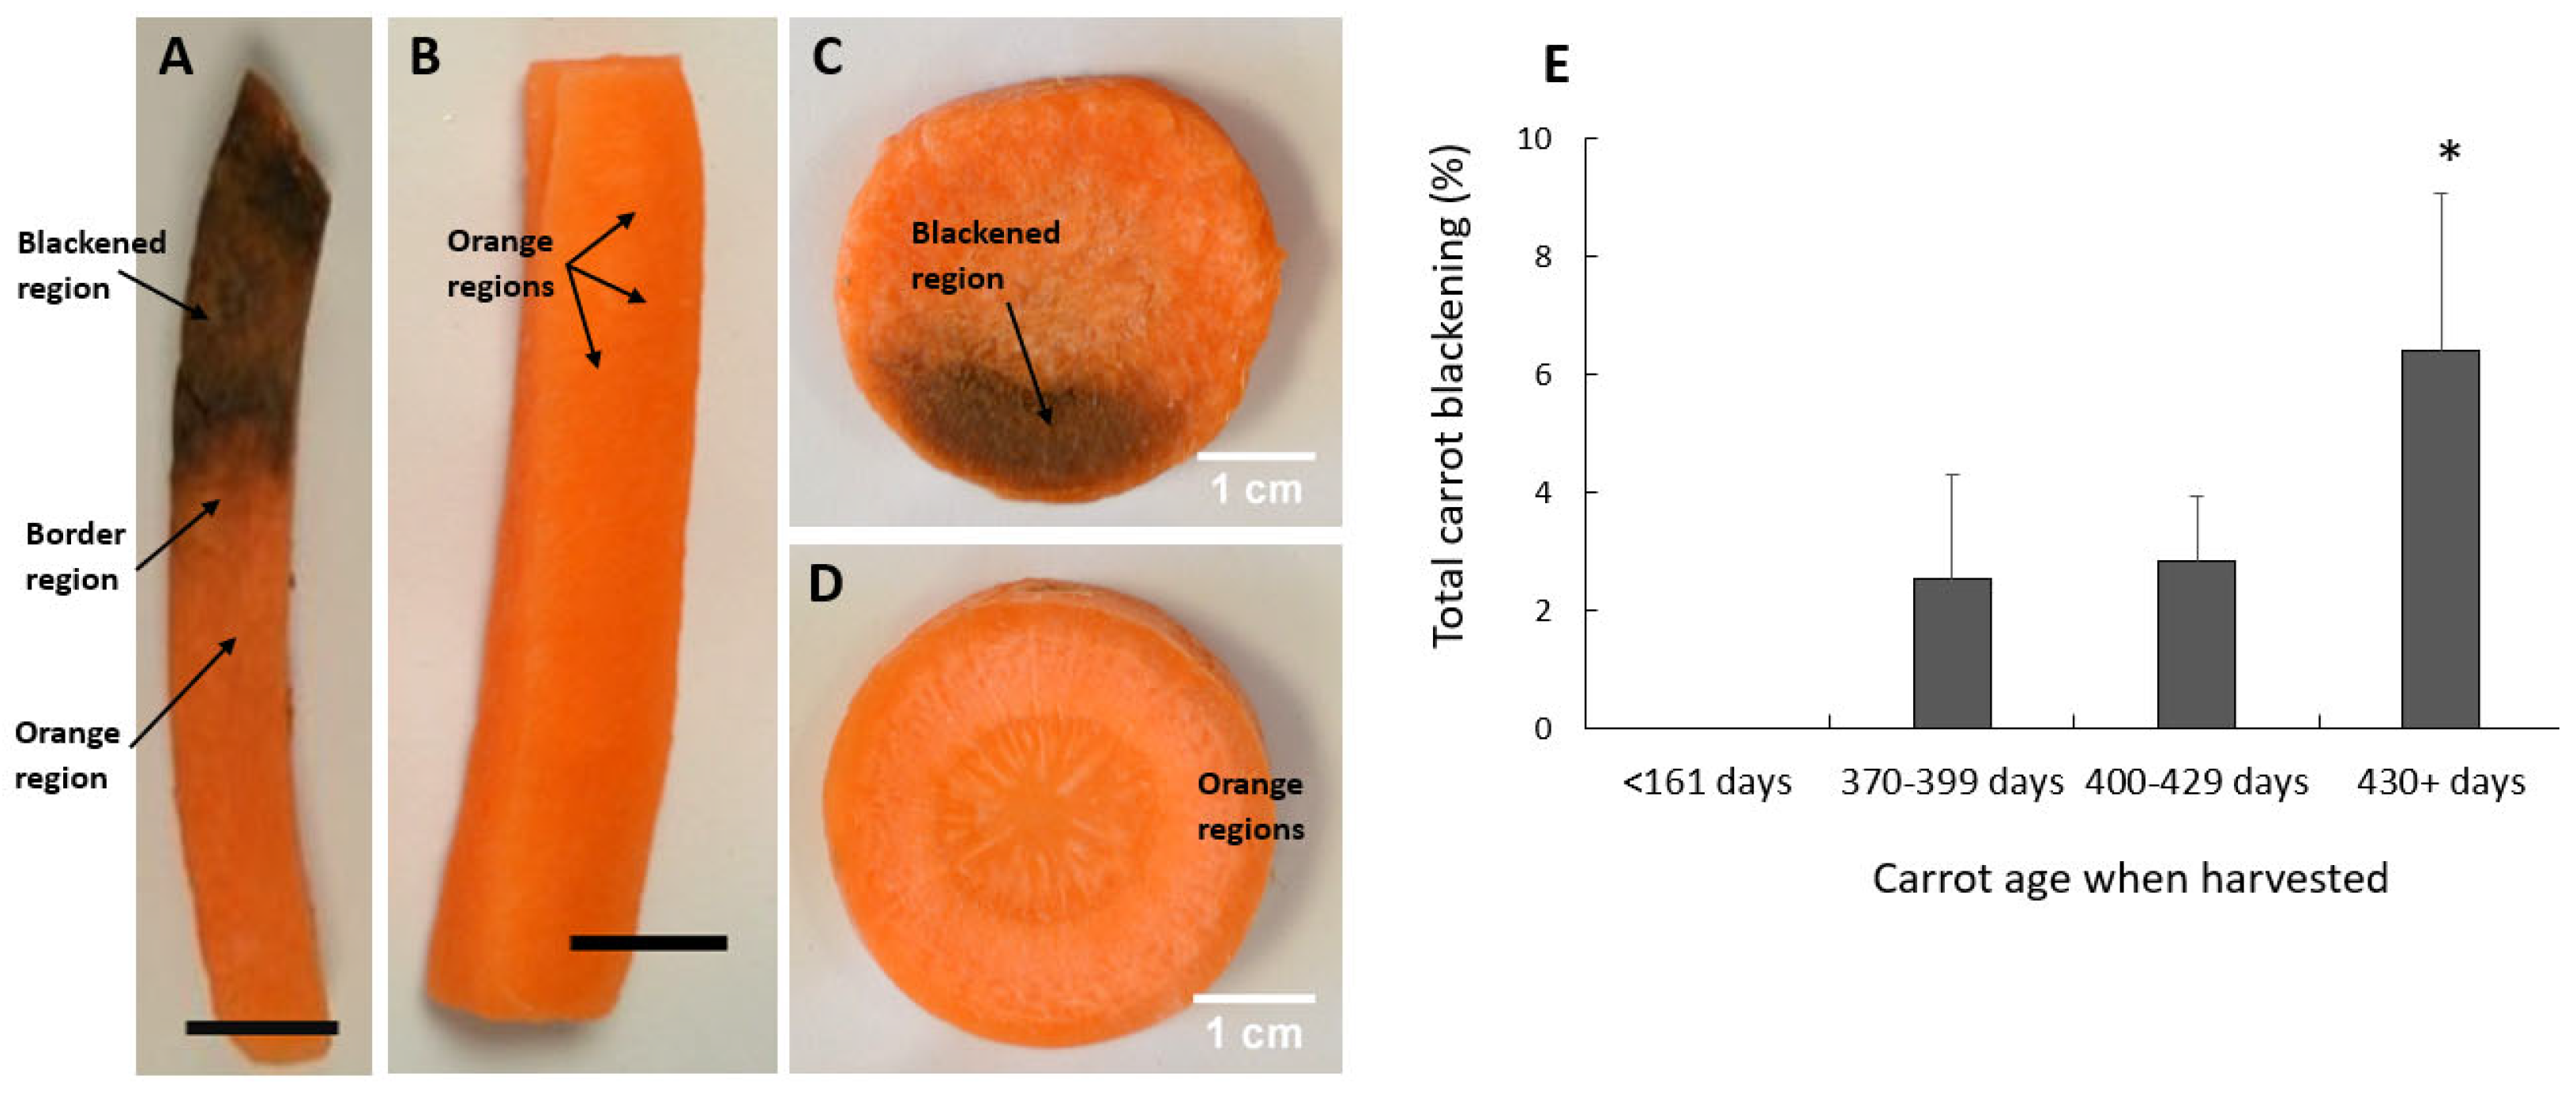
5]. The data presented here reveals the complexity of transcriptome and metabolome reprogramming that occurs when cut carrots produce black deposits, a process that is slowly induced by wounding only in aged carrots that have been stored for a long period underground. This phenomenon was only observed in mature carrots that are over 1 year old at the point of harvest. The carrots that are 430 days old have a high propensity to show blackening at values twice as high in carrots in younger age ranges. This finding strongly suggests that carrot age or the length of storage underground to prevent sprouting is the major factor that causes susceptibility to blacken. The appearance of black regions in processed carrots followed a similar timescale in carrots harvested from all field sites, the highest level of blackening occurring either on the day of processing or the following day (Schulz, 2021). It is possible that senescence begins in the carrot taproots that have been stored underground for long periods. This process is likely to incorporate cell wall fragmentation and pectin degradation. While the pectic oligosaccharides thus produced might then act as signals there is no evidence in the transcriptome profile of pathogen-like responses upon subsequent wounding.
The data presented here suggest that processing-induced wounding alone does not cause the blackening. Hence, the activation of the wounding response is age-dependent. The blackening process involves substantial reprogramming of gene expression and the
activation of secondary metabolism, leading to an accumulation of phenolic compounds and lignin. The accumulation in the black regions of chlorogenic acid (
Figure 11), which is widely recognised as a browning substrate in both fruits and vegetables, can be a cause for formation of black deposits.
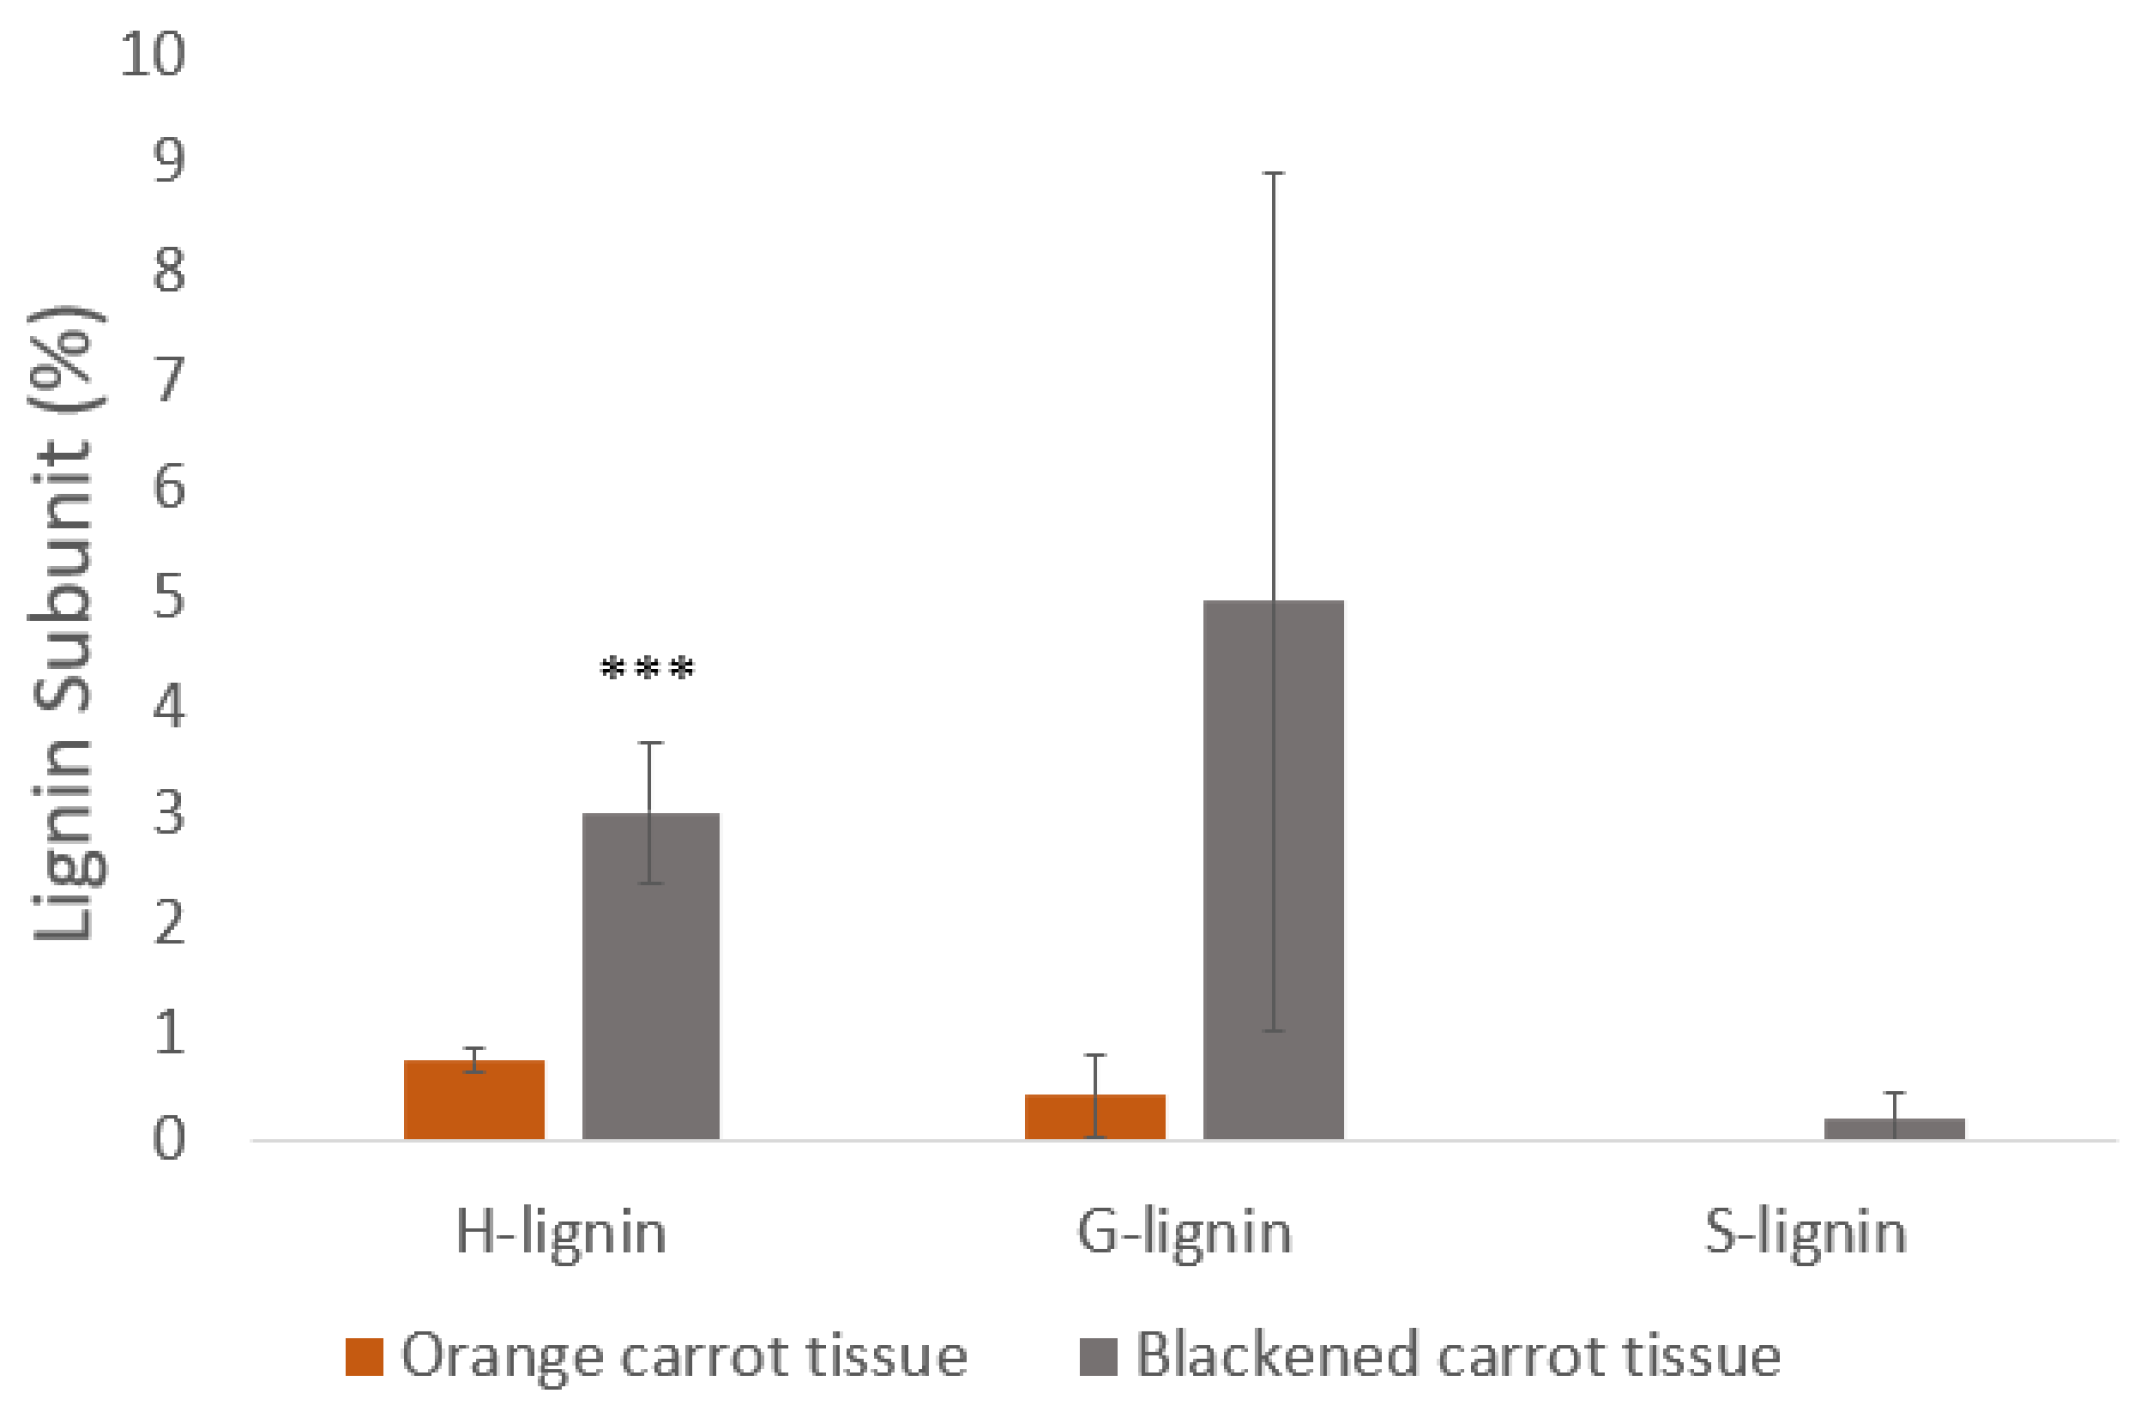
Differences in the lignin composition of the cells was observed between the black and border regions. Syringol (S) lignin was present only in the black regions in addition to more abundant guaiacol (G) and p-coumarin (
H unit) type lignin units. The sinapyl alcohol content was previously found to increase during late-stage lignification in carrots, leading to S-lignin accumulation [
33]. However, the levels of transcripts involved in processes associated with phenylpropanoid pathway and enzymatic browning were decreased in the black regions, including transcripts encoding enzymes involved in phenylalanine metabolism, glutathione metabolism and the fatty acid degradation pathways. Sine the black cells still appear to be alive and viable, these findings are somewhat surprising given that phenolic compounds closely associated with PPO, including chlorogenic acid, caffeic acid, and 5-caffeoylquinic acid, were enriched in the black regions. The transcriptome data clearly indicate that the expression of genes involved in secondary metabolism is constrained following the accumulation of secondary metabolites. The rationale for this regulation is uncertain because there has already been extensive accumulation of certain secondary metabolites, e.g. chlorogenic acid, and also lignin. It may serve to prevent a starvation response because of the depletion of primary metabolites in the black carrot regions.
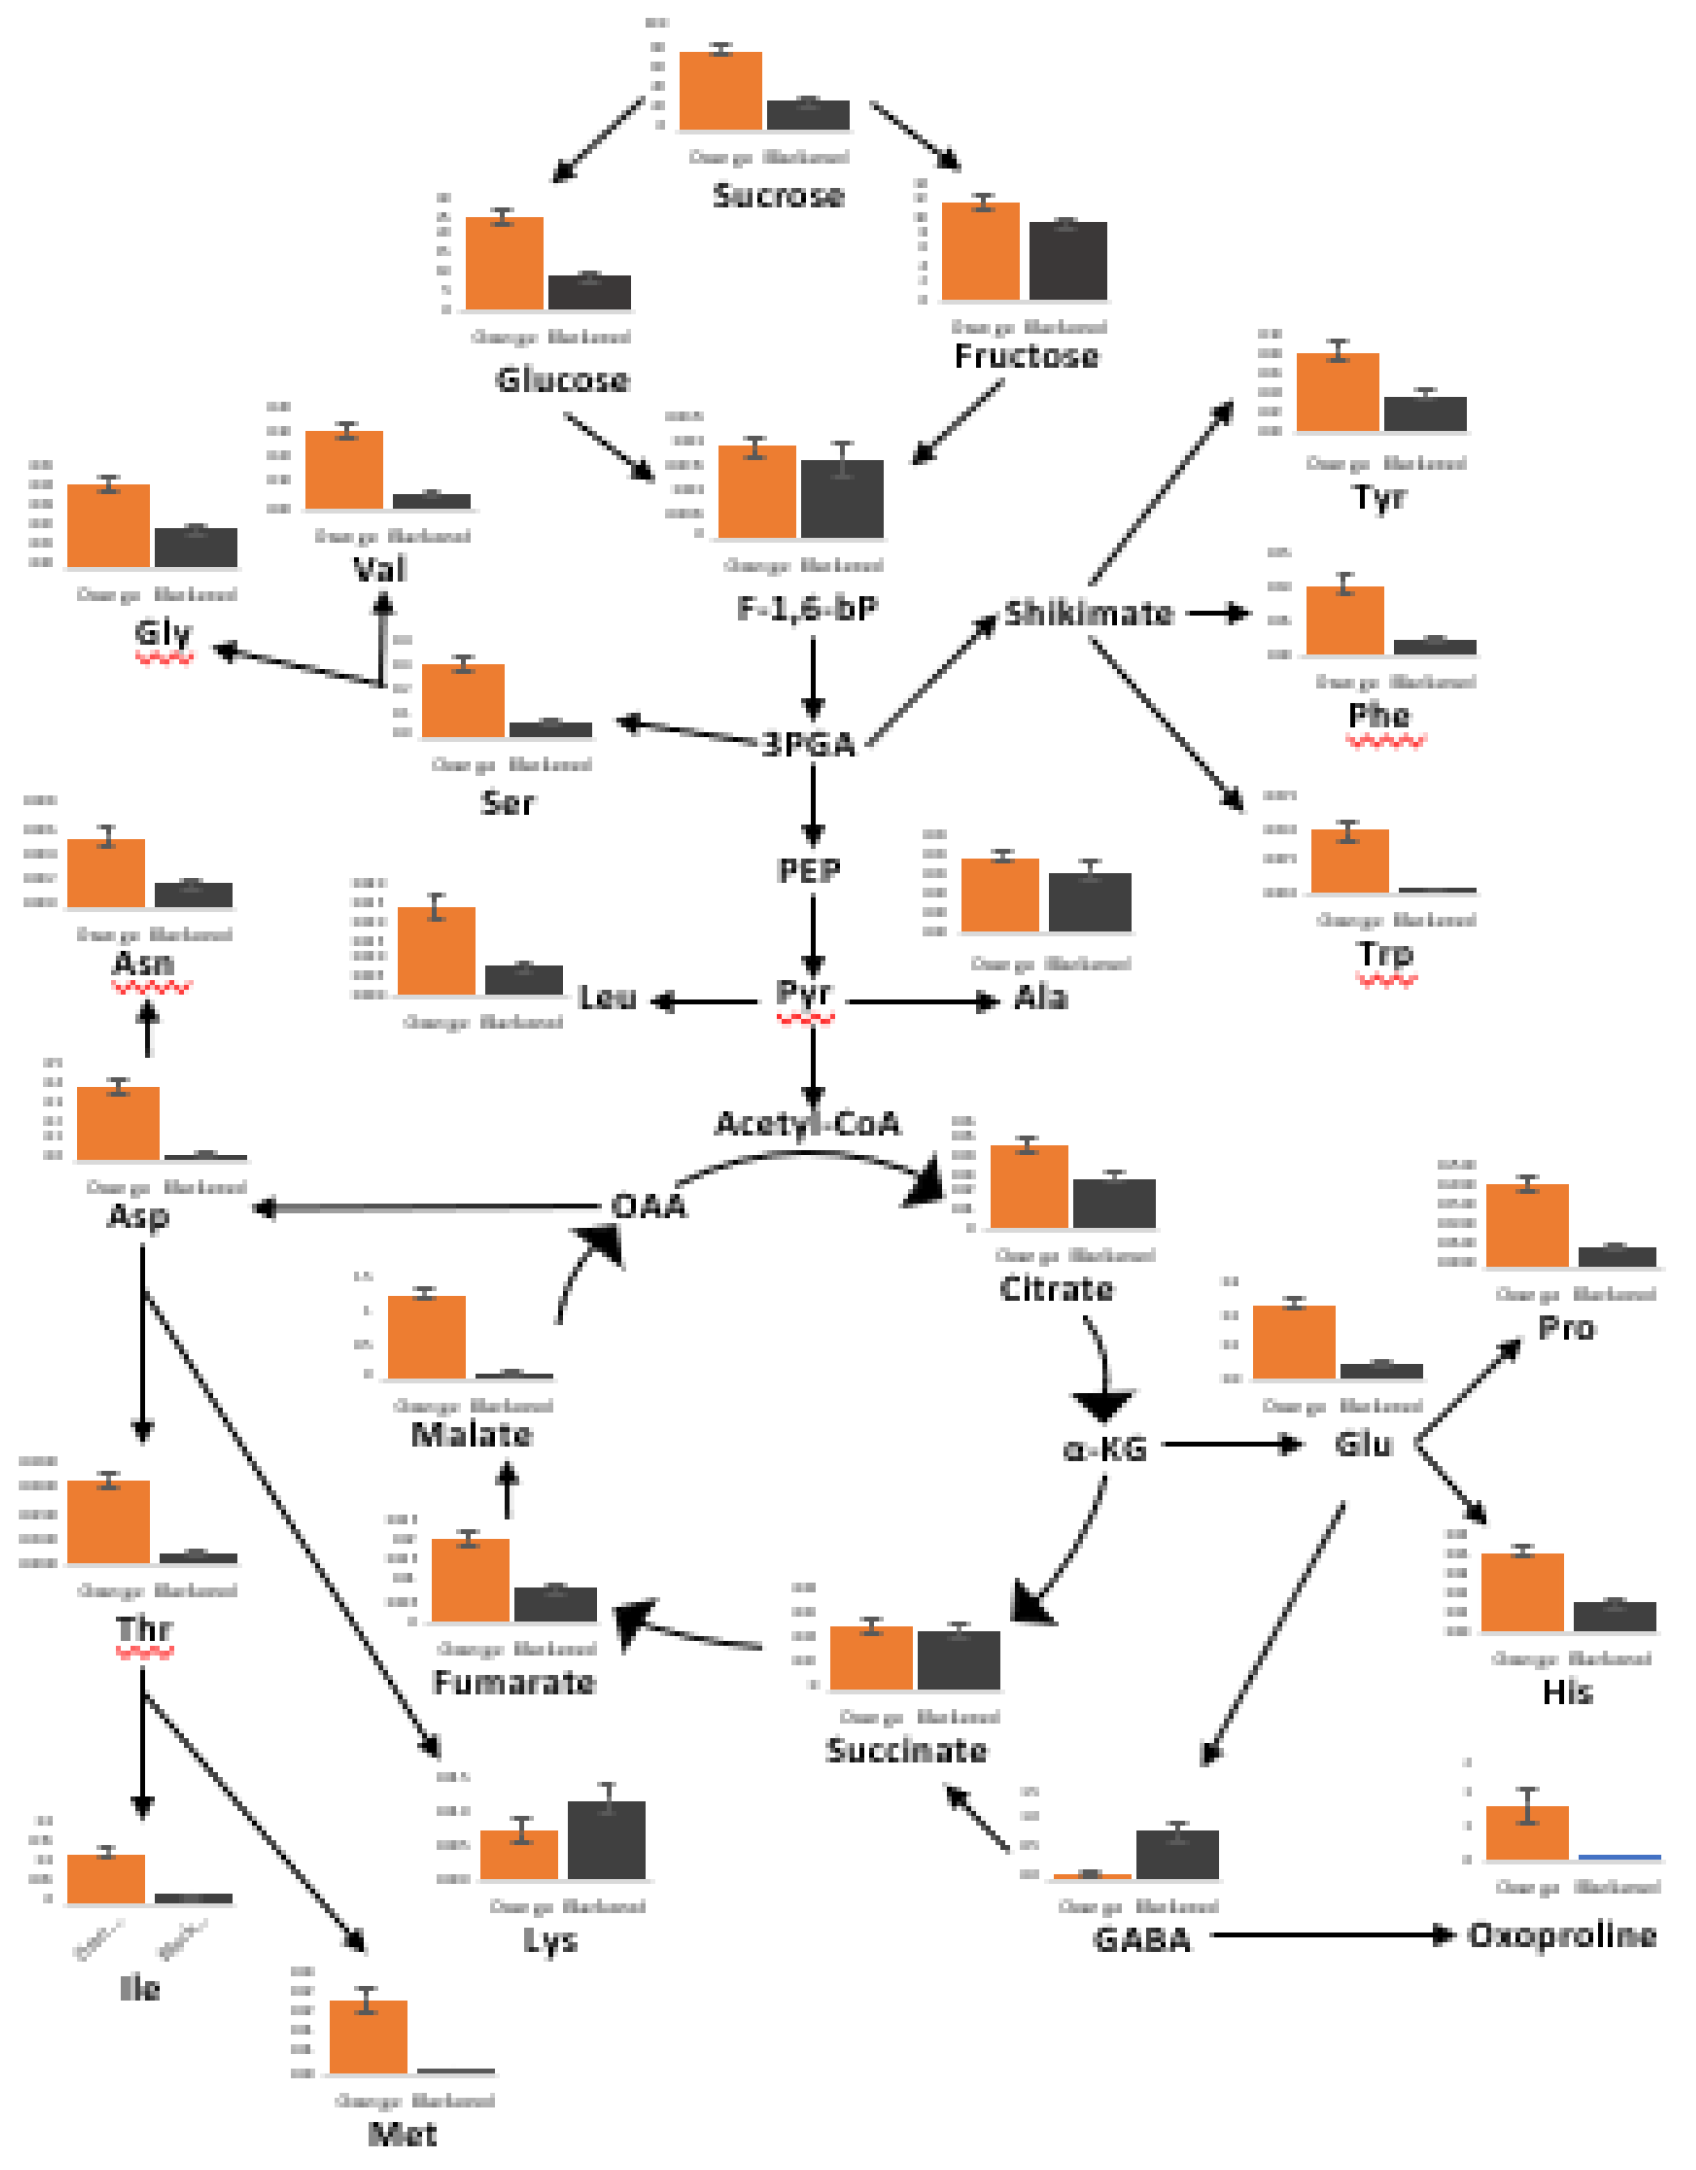
The black carrot regions show a general decrease in primary metabolites particularly amino acids, soluble sugars (glucose, fructose, sucrose) and organic acids. This may be related to the increases in respiration associated with senescence and wounding, together with a diversion of metabolites to phenolic compounds, fatty acids, and other carbohydrates (galactose, mannose, glycerol, and mannitol). The levels of most of the organic acids involved in the TCA cycle were decreased in black carrot regions, indicating a depletion of respiratory substrates. The low levels of glucose, fructose and sucrose also suggest that the black regions were running out of vital carbohydrate reserves. Observed decreases in the aromatic amino acids further support the conclusion that the blackening process involves a switch from primary to secondary metabolism. The dramatic ~8-fold increase in GABA in the black regions is indicative of an abiotic stress response. Increases in other stress-induced signalling metabolites, including allantoin and putrescine, were also observed. A strong correlation between succinic acid and GABA was observed in carbon starvation-induced GABA production in Arabidopsis leaves {34]. Jasmonate (JA) synthesis was increased in wounded lettuce leaves, together with amplified wound signalling through the oxylipin pathway associated with leaf browning [
35]. However, the levels of only one transcript associated with JA signalling was increased and there was no evidence of changes in JA synthesis in the black regions.
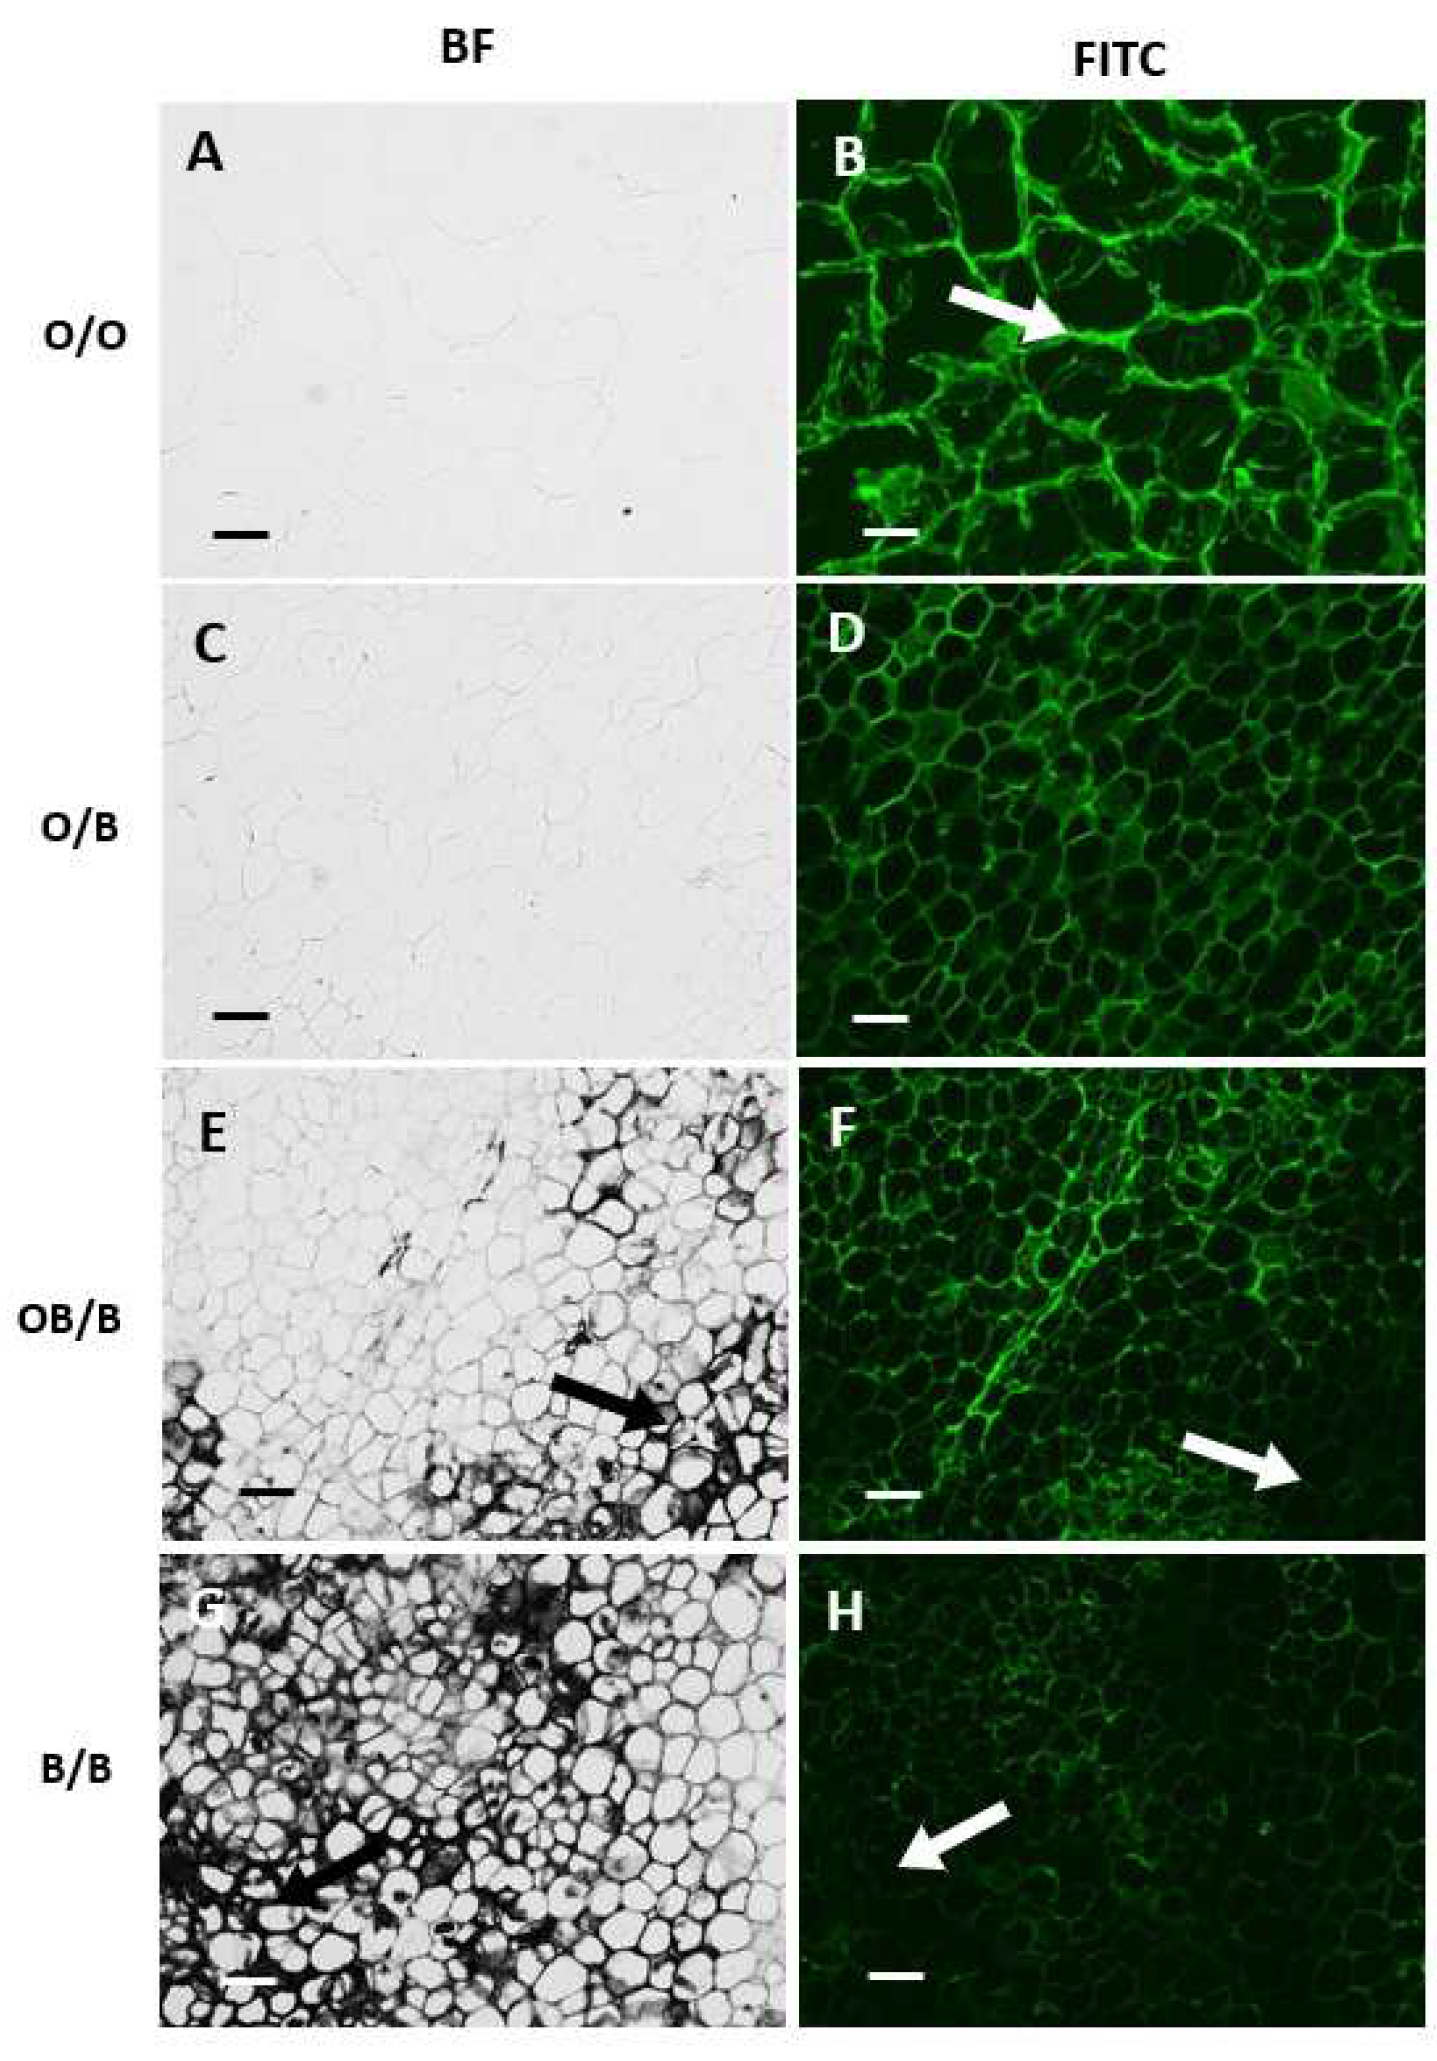
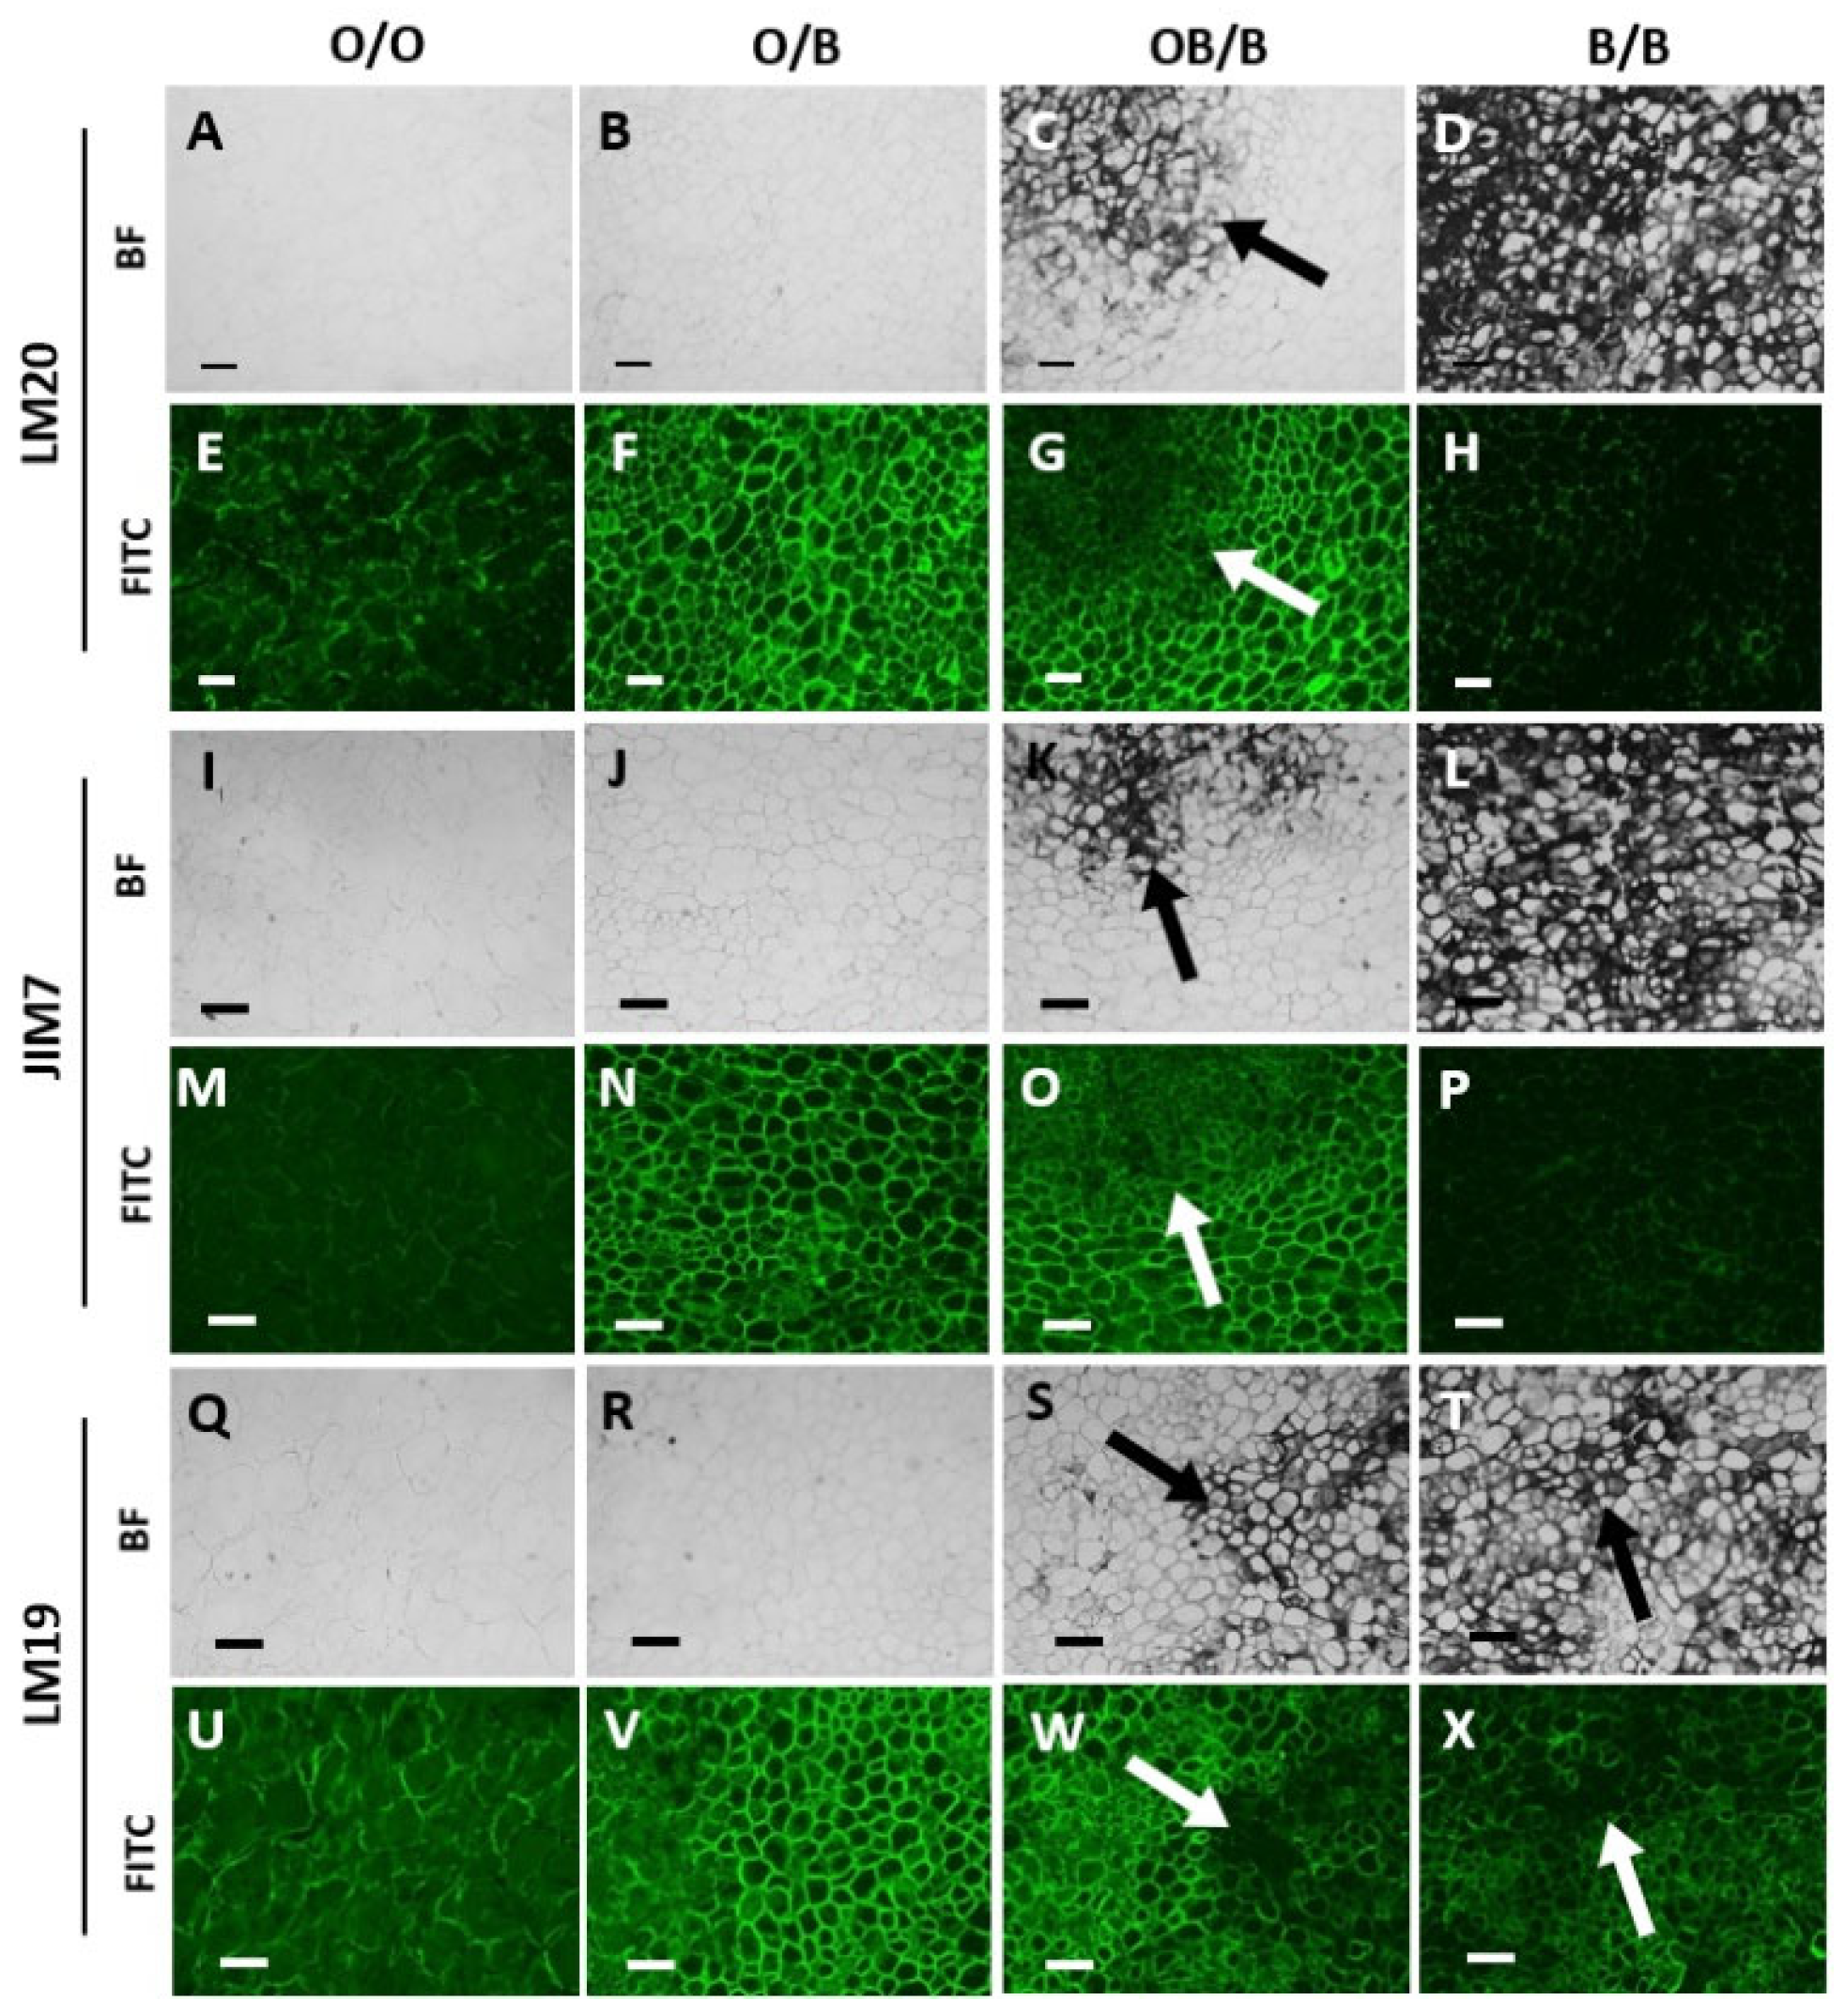
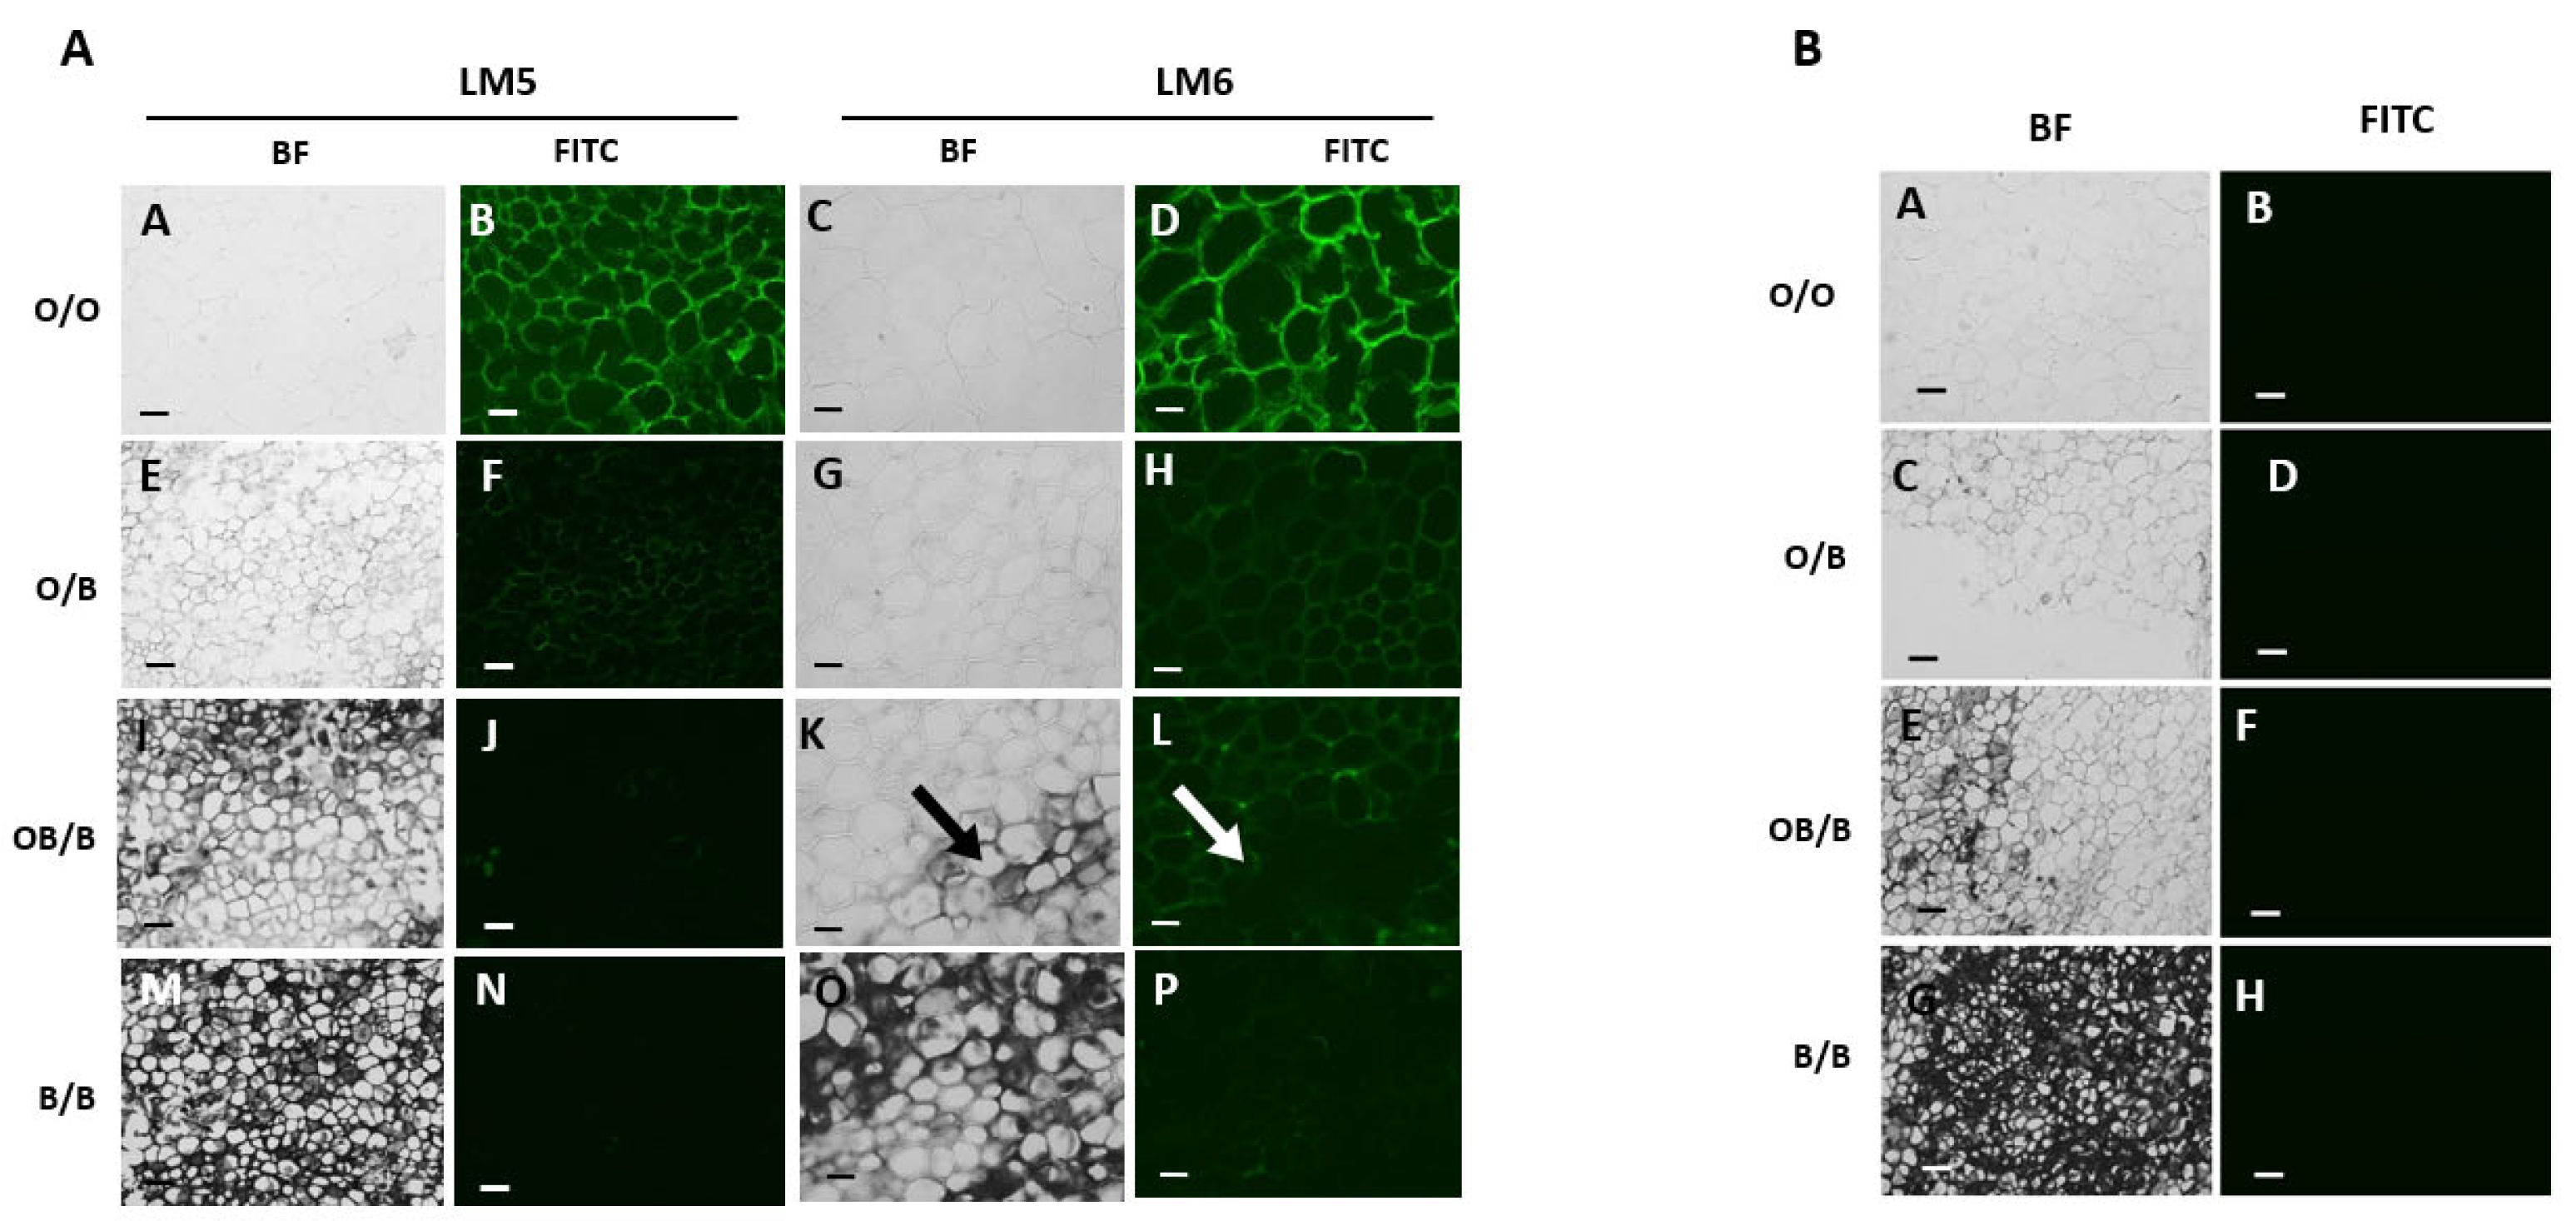
The cell walls in the black regions were markedly changed with increased lignification accompanied by decreases in the detection of xyloglucan, HG pectin and RG-I pectin. This finding suggests that cell wall degradation was enhanced in the black regions. Aspects of the observed cell wall modulations between the orange, border and black carrot regions may also relate to changes to cell wall structure that in turn influence the access of the antibody probes. For example, the observed autofluorescence of cell walls of black regions, likely reflecting extensive cross-linking of phenolic compounds, may prevent polysaccharide detection. In short, the cell wall immunohistochemistry clearly reports substantial changes to cell walls across the carrot regions. The levels of galacturonic acid, which is the main component of pectin, were lower in the black tissues. The cell walls in the orange tissue are rich with HG pectin with low, medium and high levels of esterification. The cell walls of the orange carrots were also rich in the RG-I pectin sidechains (1-4)-β-D-galactan and (1-5)-α-L-arabinan, with much lower levels detected in the border regions and little to no detection in the black regions. These findings may suggest that pectin is one of the first compounds to be altered or removed when the blackening process is triggered. Pectin-degrading enzymes are commonly secreted by fungal or bacterial plant pathogens to weaken cell walls [
8,
36] but they are also produced by plants, for example in fruit ripening after harvesting [
11].
The transcriptome profiling analysis showed increases in transcripts involved in phytohormone signal transduction, particularly auxin signalling, as well as ethylene-responsive transcription factors are more abundant in the black regions compared to the orange regions. The black and border regions also showed decreased levels of transcripts involved in ABA-signalling. DEGs encoding key enzymes involved in SA synthesis, such as chorismate synthase aminodeoxychorismate synthase and several chorismate mutases were low in the black and border regions. Other DEGs encoding proteins associated with PCD such as the lesion simulating disease (LSD)-like proteins and accelerated cell death 6-like proteins were also decreased in abundance. However, two LSD-like and three accelerated cell death proteins, which are negative regulators of PCD were more abundant.
Transcripts involved in the turnover and signalling of phytohormones, particularly auxin were enriched in the black and border regions compared to the orange carrot segments. Like other phytohormones auxin plays a key role in the development and dormancy of the carrot taproot. The endogenous levels of auxin, ethylene, cytokinin, ABA and gibberellic acid (GA3) increase in the taproot up to harvest time and subsequently decrease upon harvest (Halloran et al., 2005). The changes in hormone levels facilitate a short dormancy period after harvest due to preharvest hormonal accumulation. The levels of cytokinin and auxin increase when the dormancy period ends while ABA, ethylene and GA3 levels decrease. The transcriptome profile suggests that auxin levels are high in the black and border regions compared to the cut carrots, implicating auxin in the susceptibility to blackening following processing.
Phytohormones such as JA play a key role in the
lignification process because they are involved in the control of secondary metabolism, and the synthesis of phenylpropanoids [
37]. The expression of
JA-regulated genes, JA-precursors and MYB-type transcription factors is enhanced by auxin [
38]. However, there was no evidence of changes in JA synthesis or signalling in the black carrot regions. Auxin signalling is linked to lignification through the induction of ethylene biosynthesis [
39]. A lignin deposition phenotype was reported in mutants defective in 2 leucine-rich-repeat receptor-like kinases, which seemingly link cell wall biosynthesis with ethylene production in Arabidopsis. Auxin has also been implicated in the control of senescence but
its mode of action and point of interference with senescence control mechanisms remains poorly defined. For example, ARF2, which is a repressor of auxin signalling that positively regulates leaf senescence, functions in the auxin-mediated control of leaf longevity in Arabidopsis [
40].
Author Contributions
Concept, CHF; Methodology, KS, PK, GM, RDH, SRV, RK, PS, AK, BK, CHF; Formal analysis KS; Investigation KS, GM; Resources CHF; Data curation KS BK; Writing -original draft preparation KS, CHF; Writing-reviewing and editing PK, RDH, AK; Supervision: CHF, PK, RDH, AK; Project administration CHF; Funding acquisition CHF.
Figure 1.
Orange and blackened carrots. Carrot batons (A and B) and transverse slices (C and D). Labelled carrot regions showing orange regions from non-blackened carrots (B and D), orange regions from blackened samples, blackened regions and border regions (A and C). (E) Carrot age at harvesting time. Significant differences were calculated by student t-test. * shows p ≤ 0.05 and error bars represent SE± . bar = 1 cm.
Figure 2.
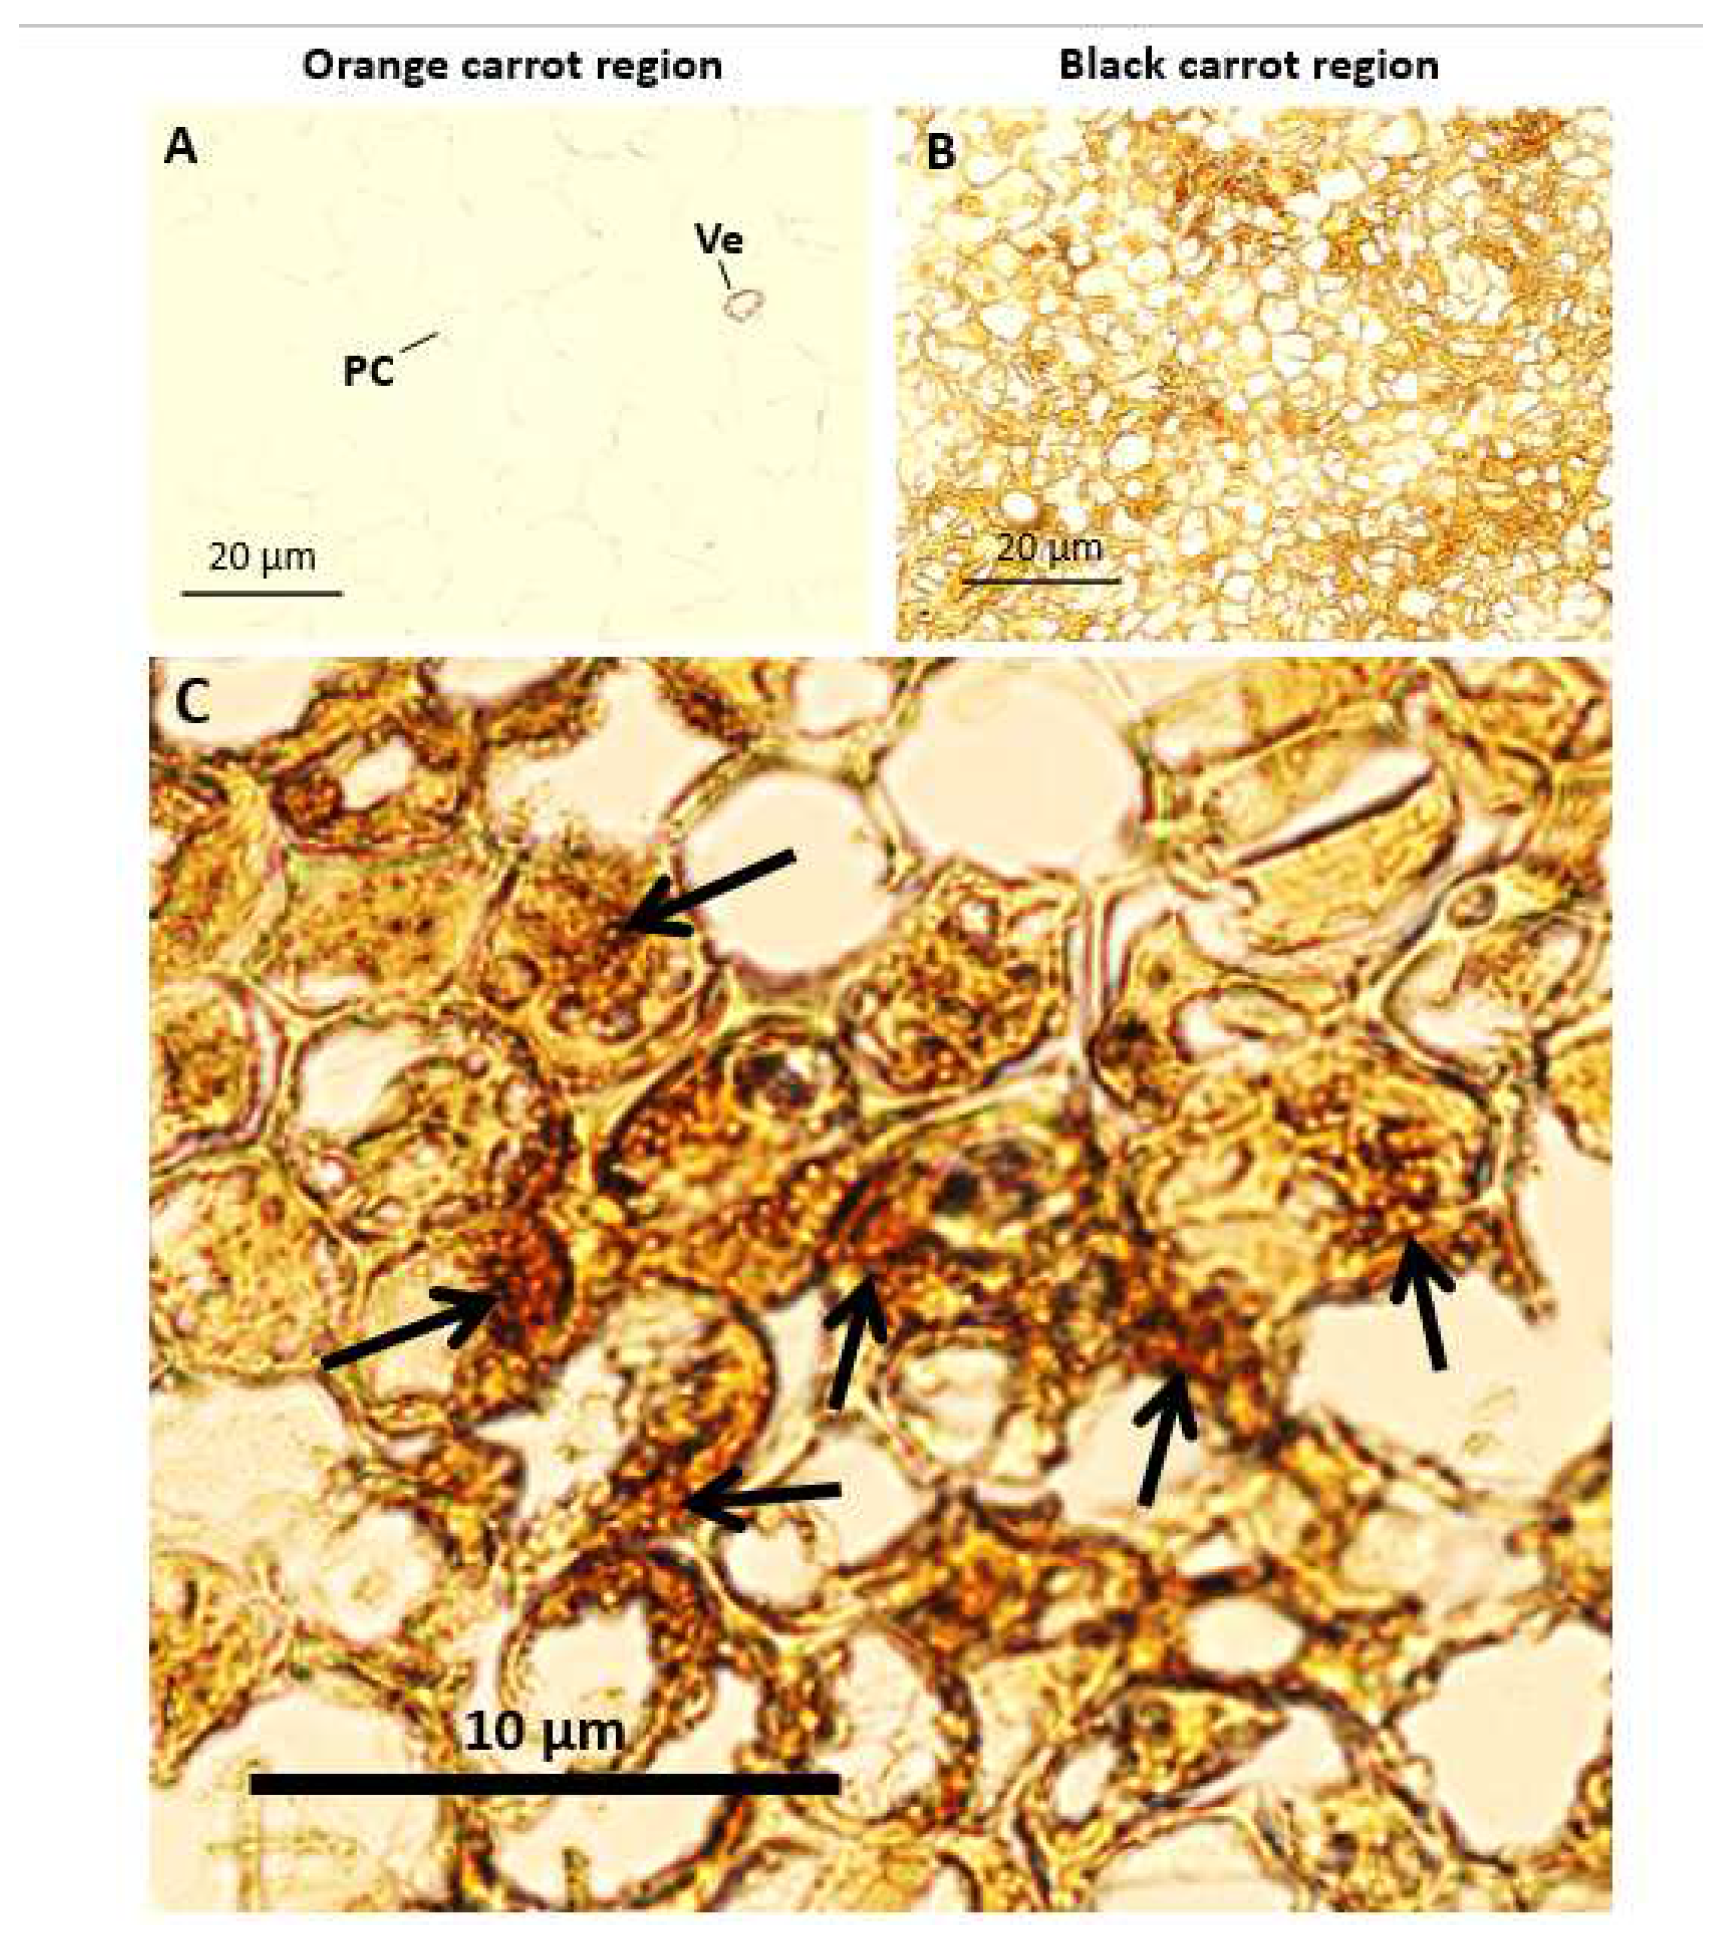
Representative images of orange and black carrot regions. Images were taken of 12 μm carrot sections under the same microscope settings; orange carrot region (A) and black carrot regions (B, C). Arrows indicate areas of carrot blackening. Scale bars = 10 μm and 20 μm.
Figure 2.
Representative images of orange and black carrot regions. Images were taken of 12 μm carrot sections under the same microscope settings; orange carrot region (A) and black carrot regions (B, C). Arrows indicate areas of carrot blackening. Scale bars = 10 μm and 20 μm.
Figure 3.
Indirect immunofluorescence detection of the xyloglucan in transverse sections of carrot batons after pectate lyase treatment to remove pectic homogalacturonan. Images showing different carrot sections: orange carrot baton O/O (A, B), orange region on a blackened baton O/B (C, D) tissue directly bordering the black region OB/B (E, F) and the black region B/B (G, H). BF and FITC mean bright field and fluorescence channel, respectively.Corresponding immunofluorescence images for LM25 xyloglucan. Scale bar = 10 μm. 10x magnification. Exposure times: BF = 0.045 s, FITC = 0.15 s. Arrows indicating clear areas of carrot blackening.
Figure 4.
Indirect immunofluorescence detection of pectic HG in transverse sections of orange and blackened carrot batons. Images showing tissue of an orange carrot baton O/O (A, E, I, M, Q, U), orange region on a blackened baton O/B (B, F, J, N, R, V), tissue directly bordering the black region OB/B (C, G, O, S, W), and the black region B/B (D, H, L, P, T, X). BF and FITC mean bright field and fluorescence channel, respectively. Corresponding immunofluorescence images taken in the FITC channel generated with monoclonal antibodies binding to de-esterified pectin (LM19), methyl-esterified pectin (JIM7) and highly esterified pectin (LM20). Scale bar = 10 μm. 10x magnification. LM20 and JIM7 exposure times: BF = 0.011 s, FITC = 0.15 s. LM19 exposure times: BF = 0.011 s, FITC = 0.2 s. Arrows indicating areas of carrot blackening.
Figure 5.
Indirect immunofluorescence detection of pectic RG-I in transverse sections of orange and blackened carrot batons. Images showing tissue of an orange carrot baton O/O; 5A (A, B, C, D) and 5B (A, B), orange region on a blackened baton O/B: 5A (E, F, G, H) and 5B (C, D) tissue directly bordering the black region OB/B 5A (I, J, K, L) and 5B (E, F) and the black region B/B; 5A (M, N, O, P) and 5B (G, H). BF and FITC mean bright field and fluorescence channel, respectively. Corresponding immunofluorescence images taken in the FITC channel generated with monoclonal antibodies binding to (1-4)-β-galactan (LM5) and (1-5)-α-L-arabinan (LM6). Scale bar = 10 μm. LM5 images are at 10x magnification. Exposure times: BF = 0.045 s, FITC = 0.3 s. LM6 images are at 20x magnification. Exposure times: BF = 0.1 s, FITC = 0.8 s. Arrows indicating clear areas of carrot blackening.
Figure 6.
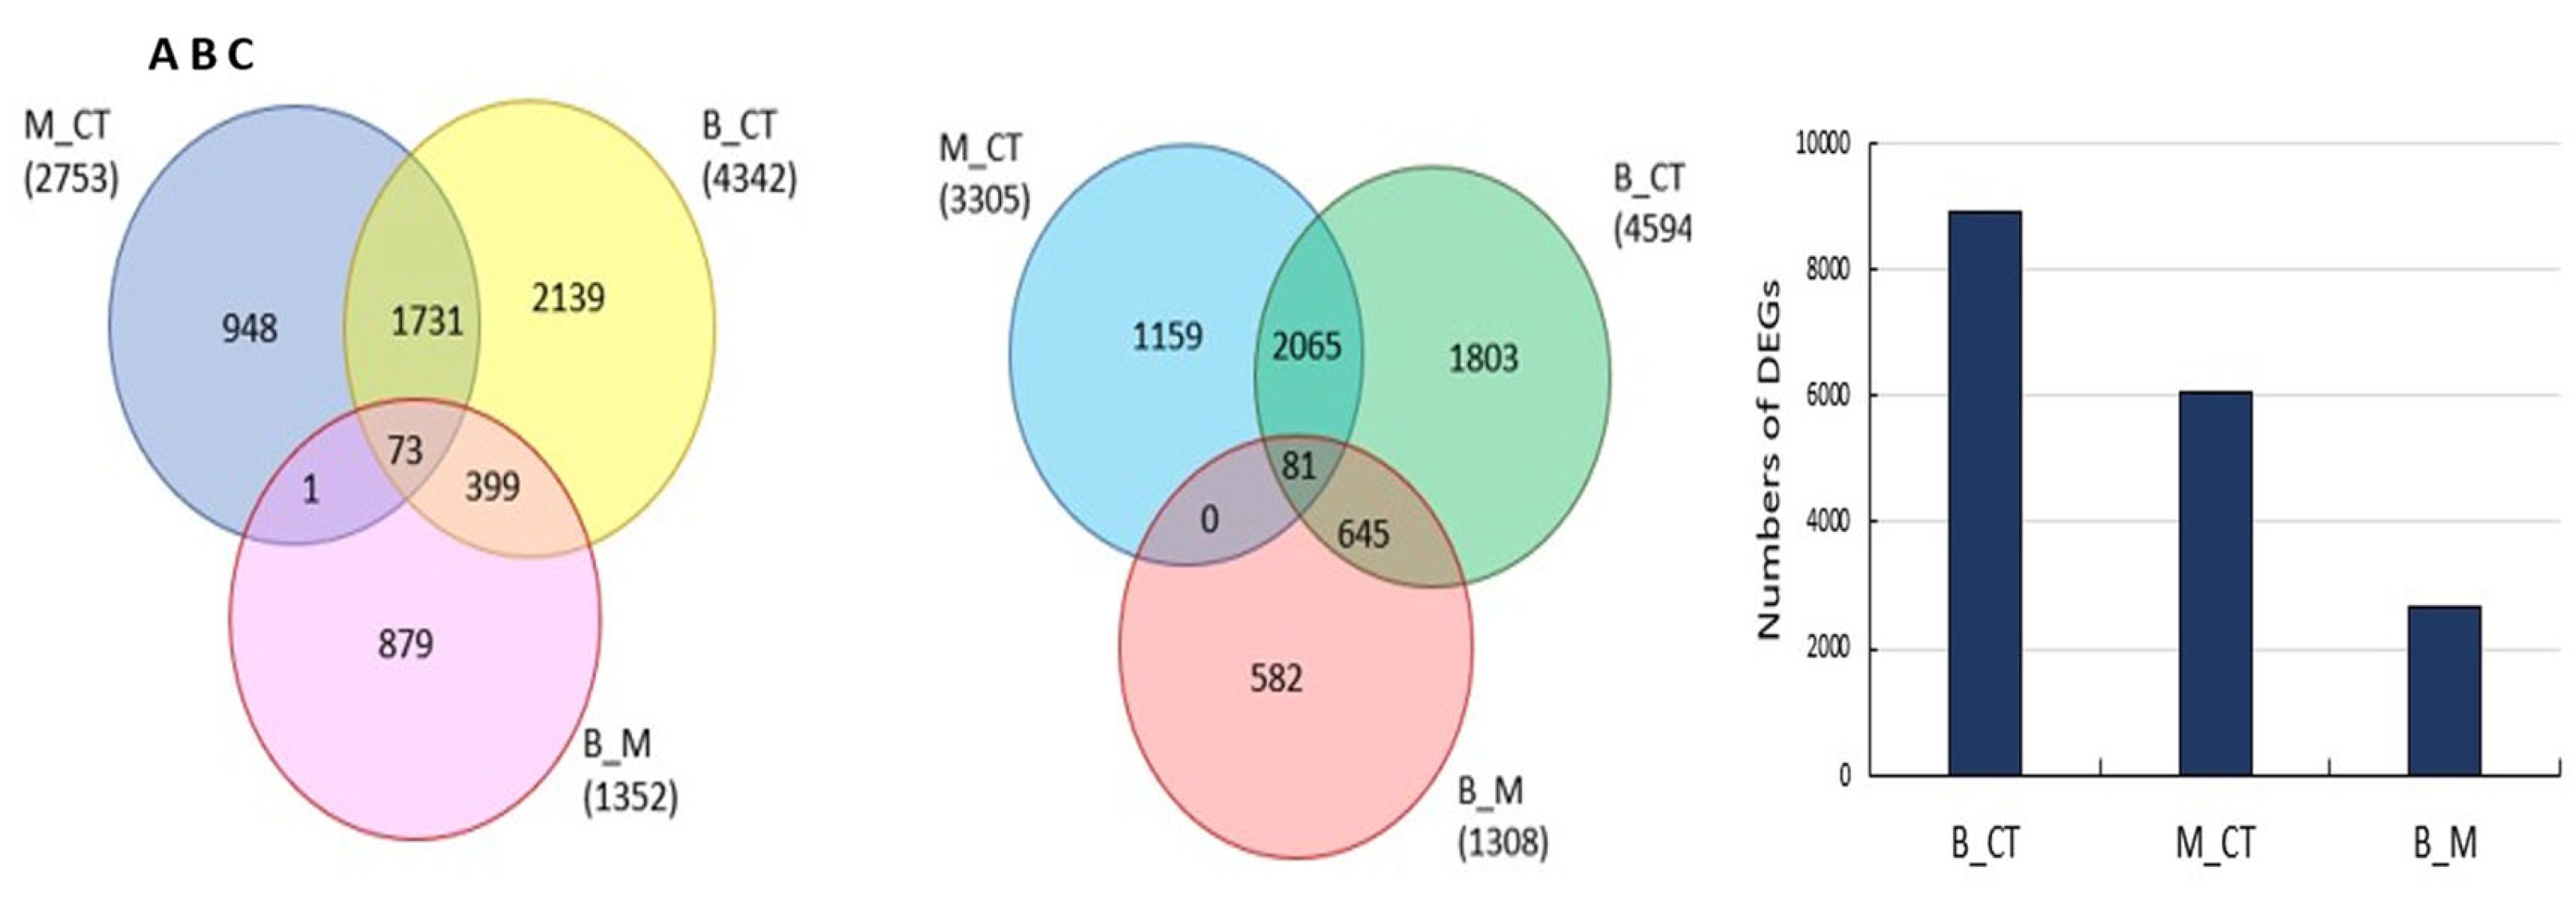
Comparisons of the numbers of differentially expressed genes (Venn diagrams, A, B) and total numbers in the black and border regions compared to the orange regions of the cut carrots (A) Up-regulated DEGs (log2(FC) ≥ 1), (B) down-regulated DEGs, (log2(FC) ≤ -1) and (C) number of total DEGs. DESeq2 was used to determine differentially expressed sequences and the p-values were corrected for multiple testing using the Benjamini and Hochberg method (padj. ≤ 0.05). B_CT blackened vs control, M_CT border carrot region vs control, and B_M blackened vs border regions.
Figure 7.
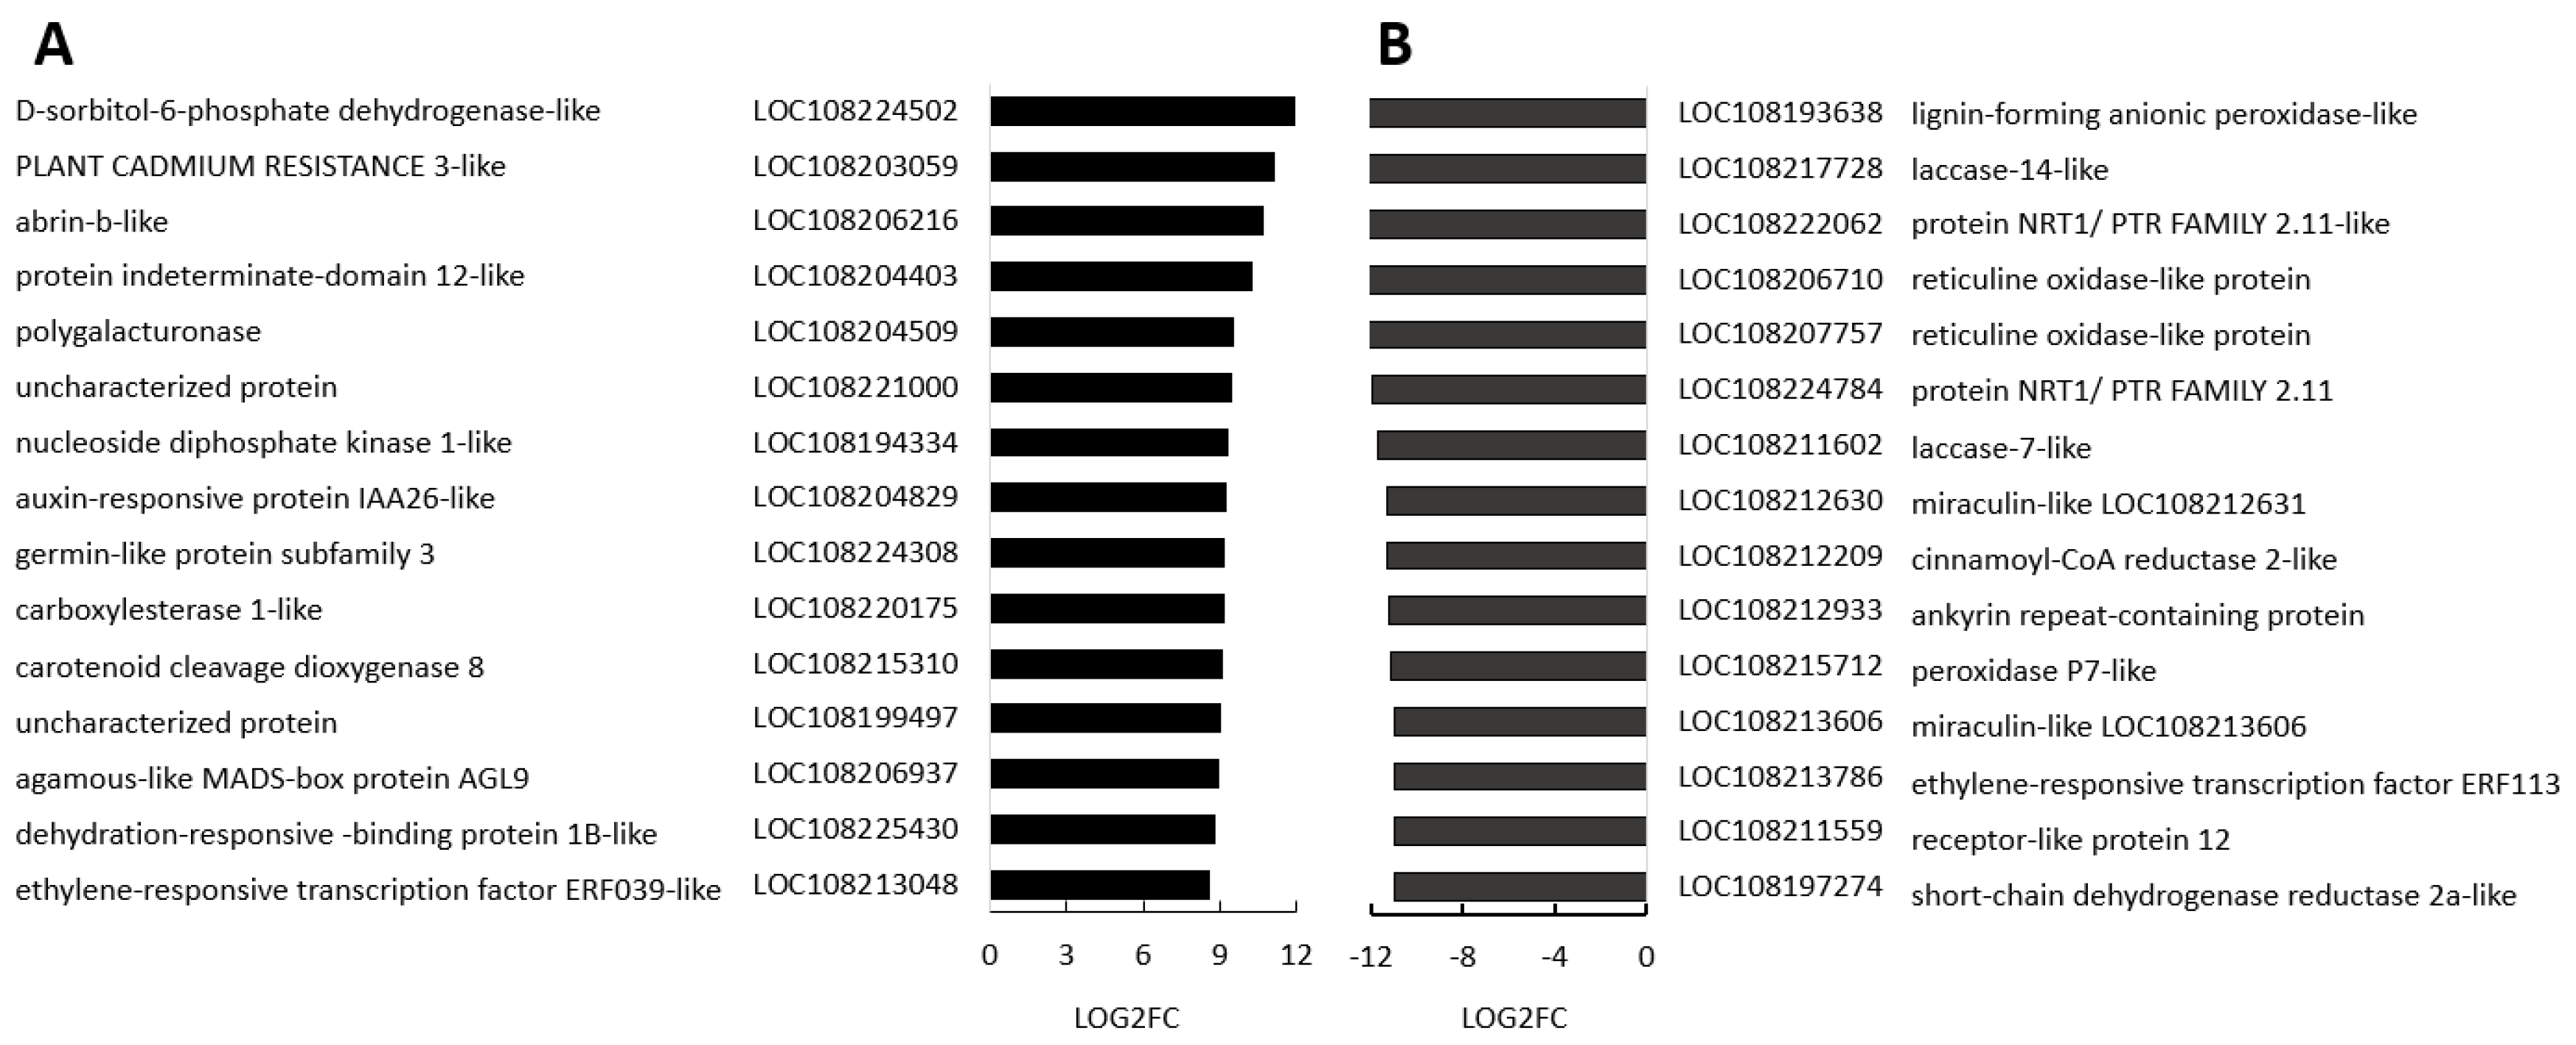
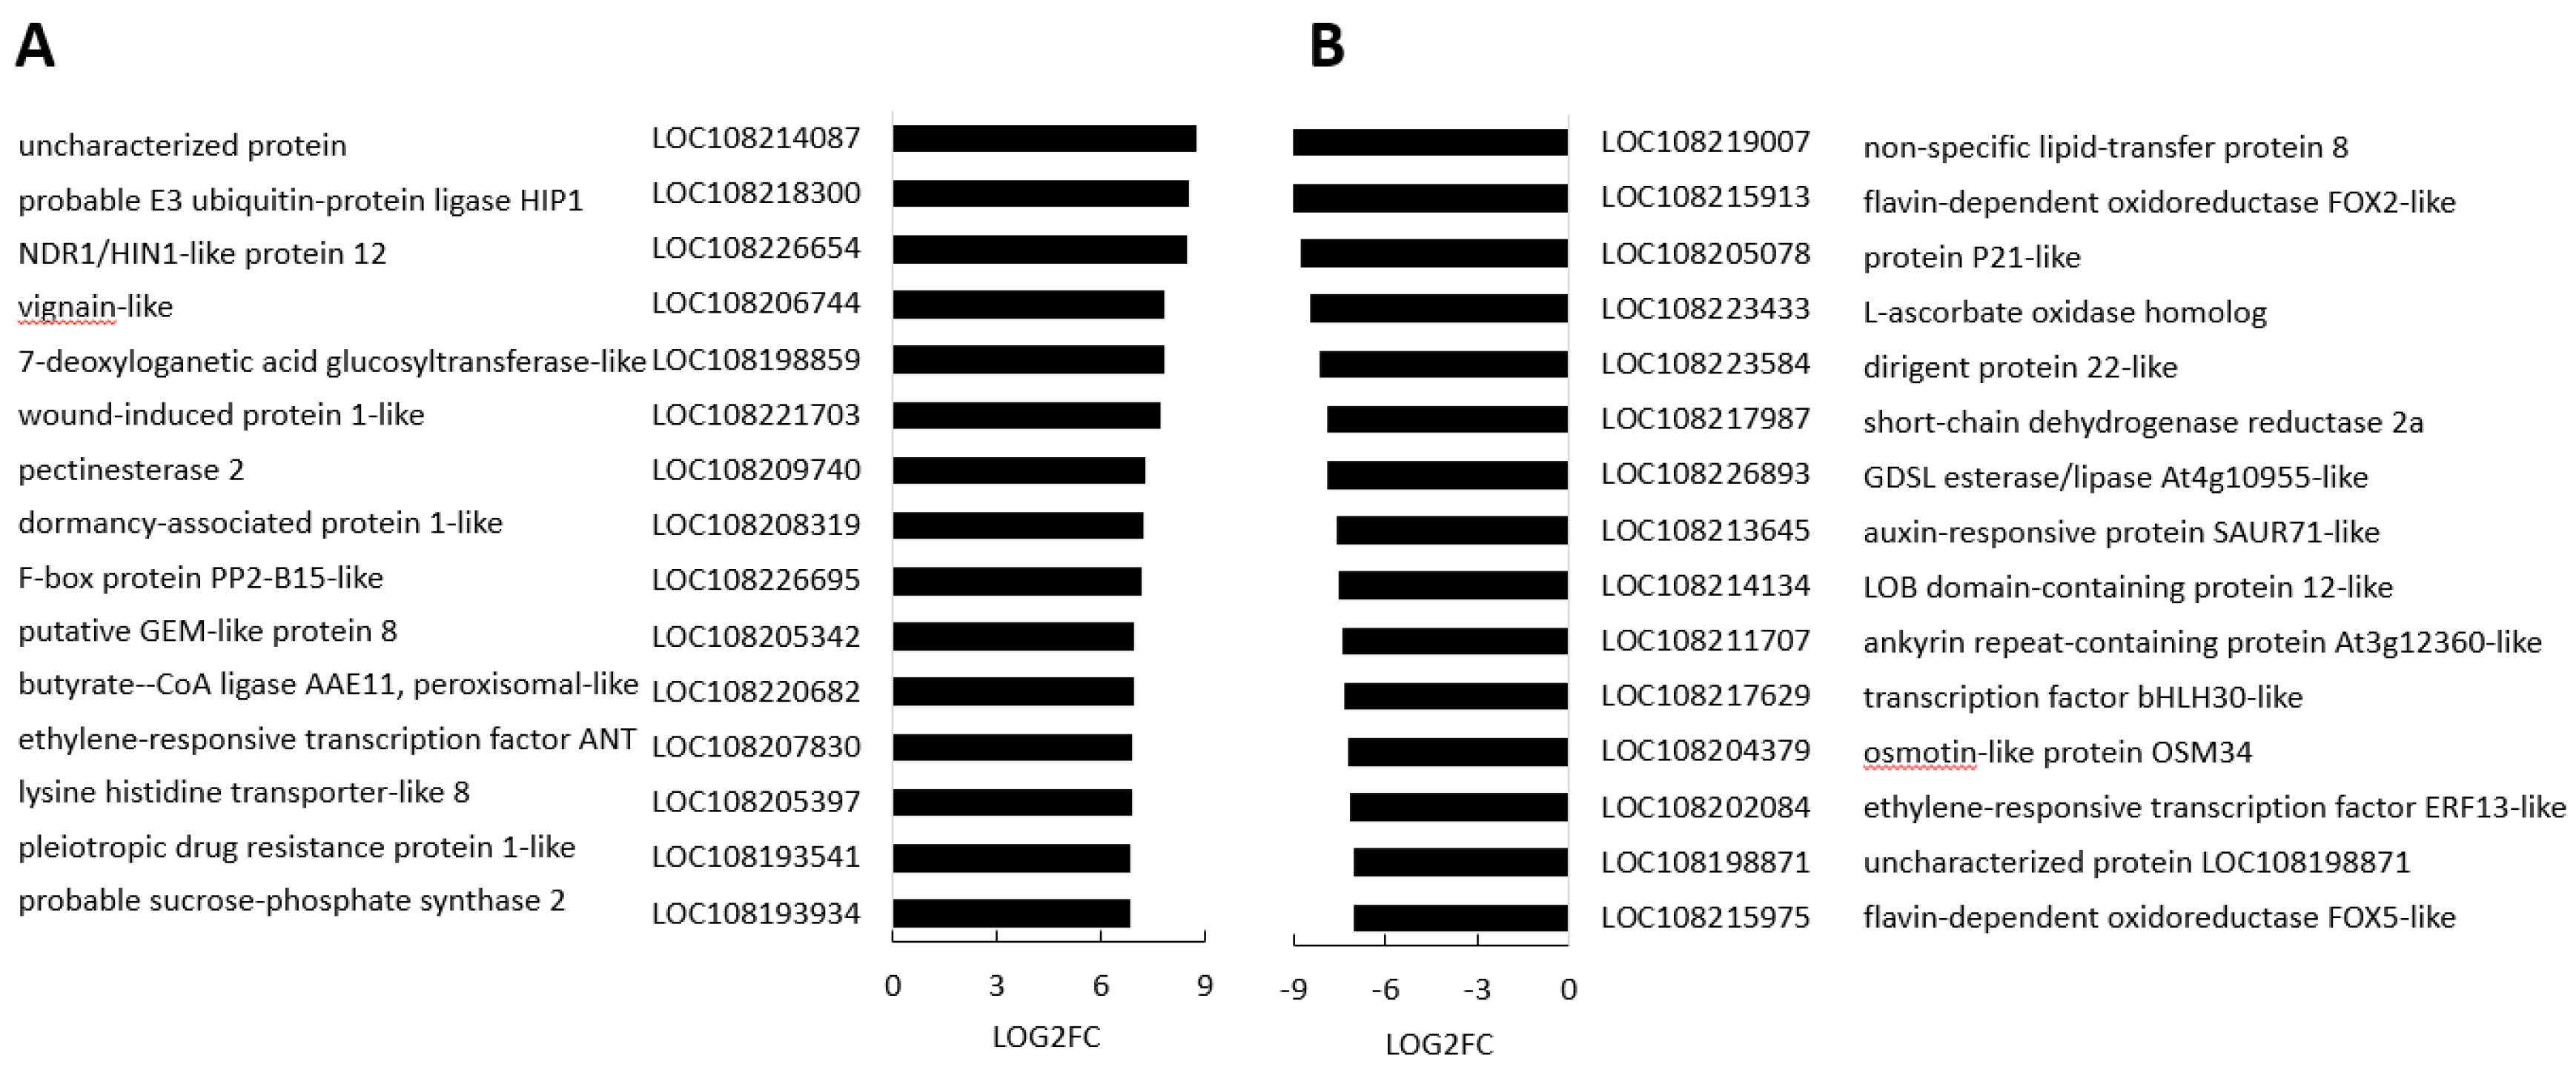
The 15 most increased (A) and decreased (B) transcripts in
blackenregions compared to orange regions. Three biological replicates.
P-values were calculated using Deseq2 tool and later adjusted using
Benjamin-Hochberg correction (p<0.05; fold change ≥1).
Figure 7.
The 15 most increased (A) and decreased (B) transcripts in
blackenregions compared to orange regions. Three biological replicates.
P-values were calculated using Deseq2 tool and later adjusted using
Benjamin-Hochberg correction (p<0.05; fold change ≥1).
Figure 8.
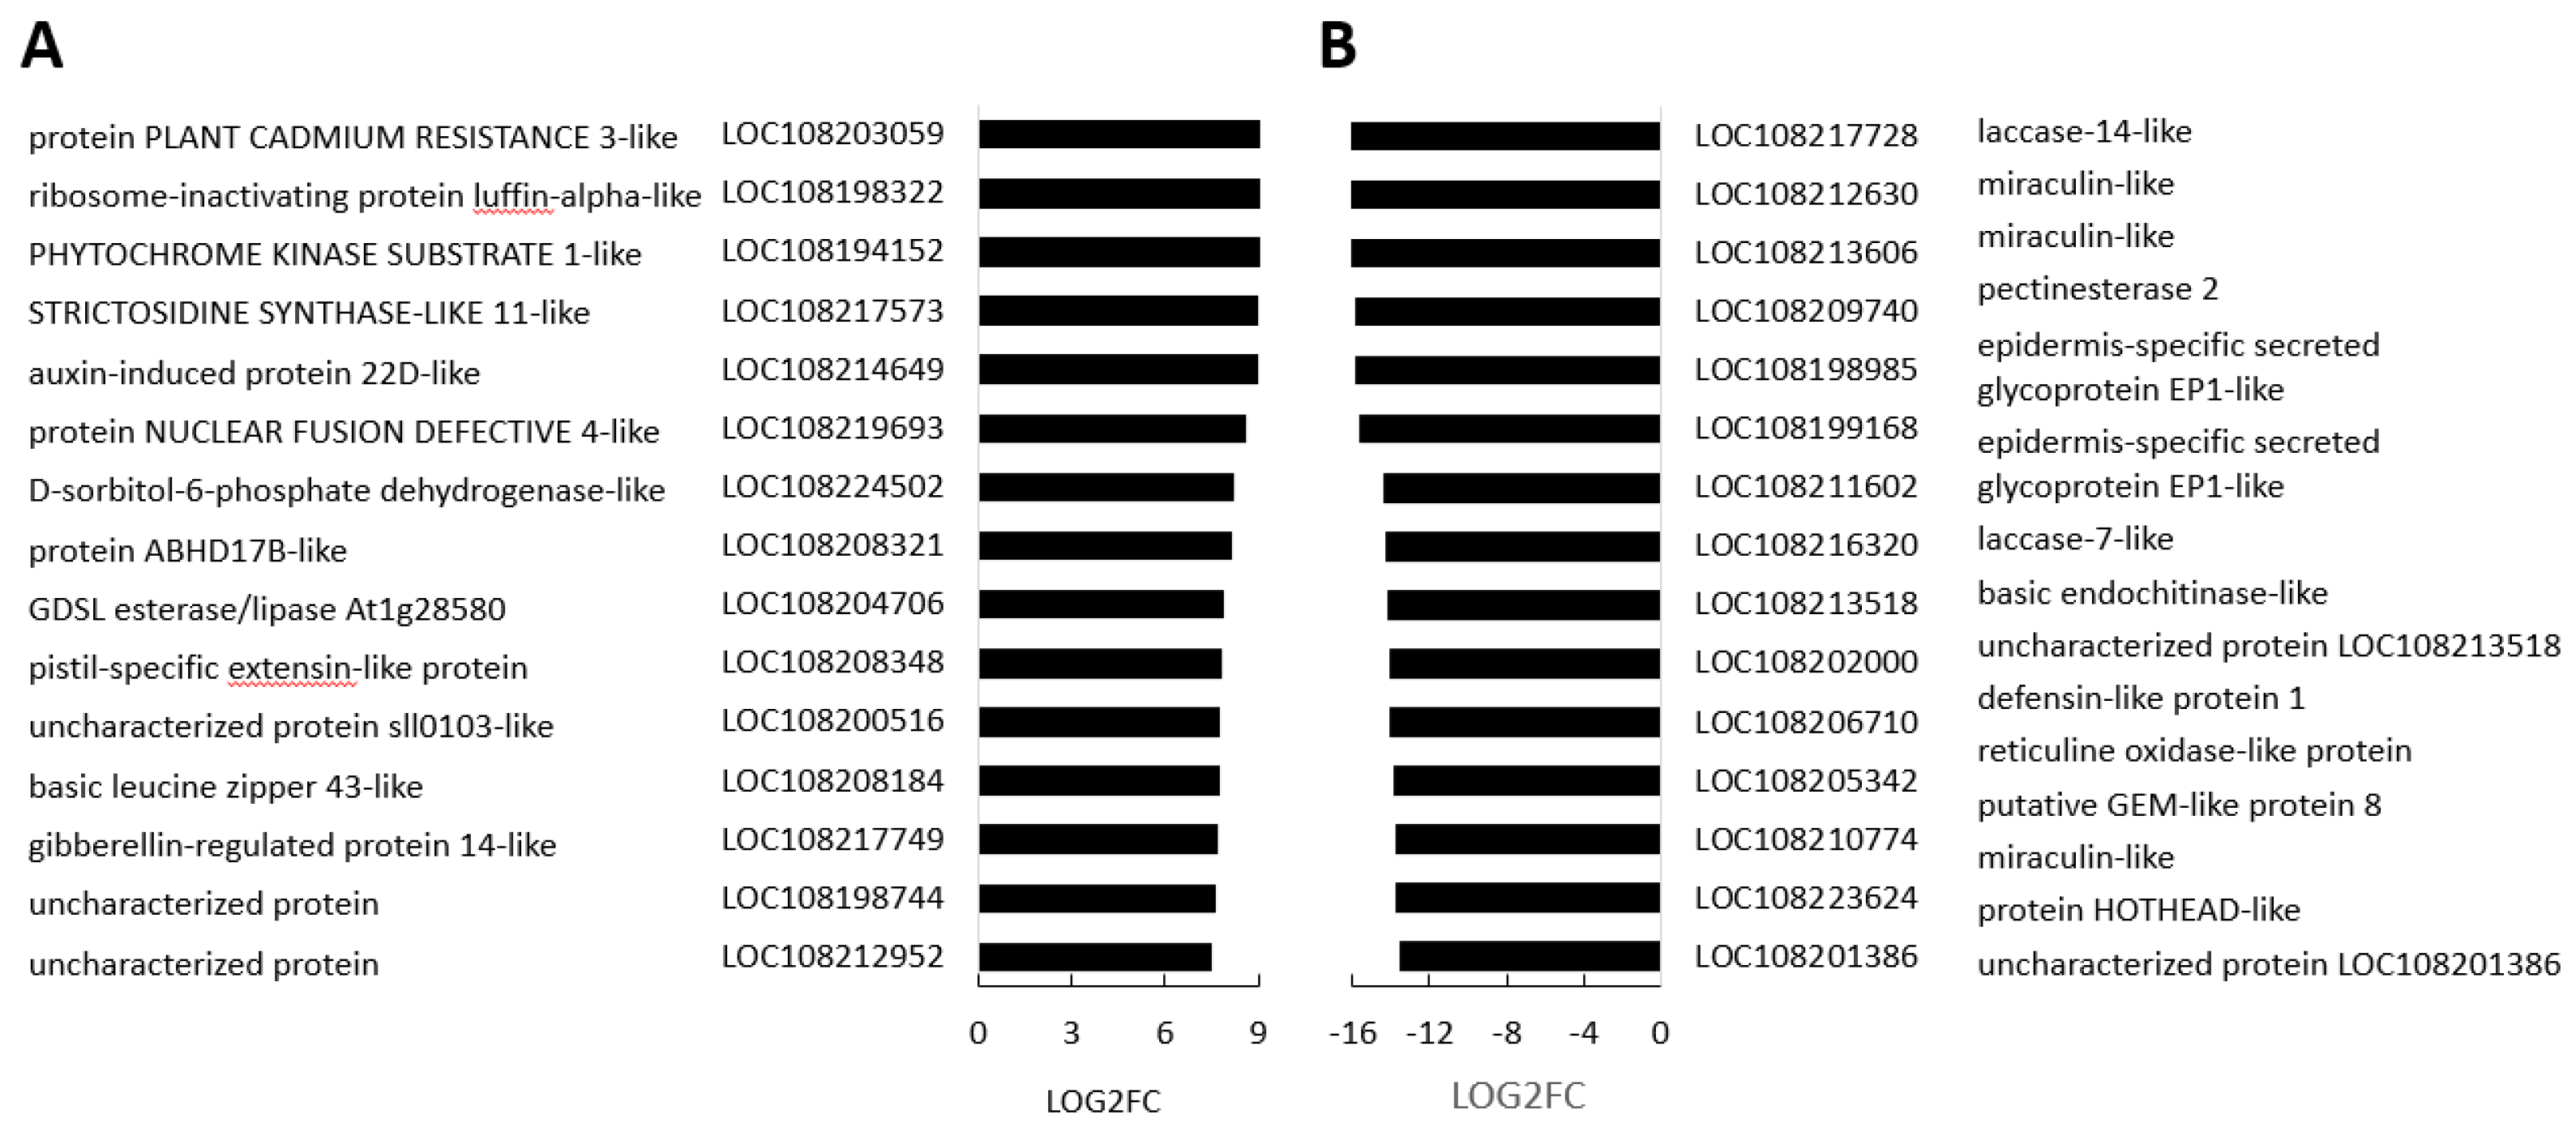
The top 15 most increased (A) and decreased (B) transcripts in border regions compared to orange regions (M/CT). Three biological replicates. Three biological replicates. P-values were calculated using Deseq2 tool and later adjusted using Benjamin-Hochberg correction (p<0.05; fold change ≥1).
Figure 9.
Top 15 most increased (A) and decreased (B) transcripts in black carrot regions compared to border regions (B/M). Three biological replicates. Three biological replicates. P-values were calculated using Deseq2 tool and later adjusted using Benjamin-Hochberg correction (p<0.05; fold change ≥1).
Figure 10.
The relative levels of metabolites in the sugar, amino acid and tricarboxylic acid (TCA) pathways in the orange (orange bars) and black (black bars) regions of the carrot batons.
Figure 10.
The relative levels of metabolites in the sugar, amino acid and tricarboxylic acid (TCA) pathways in the orange (orange bars) and black (black bars) regions of the carrot batons.
Figure 11.
A comparison of the lignin subunit contents of orange and blackened regions of carrot batons (%). The lignin subunits are also known as p-hydroxyphenyl (H-lignin), guaiacyl (G-lignin) and syringyl (S-lignin). Data are the mean values ± SD (n = 4). Significant differences between orange and black samples were calculated with a T-test, ***p<0.001. P = 0.0004. .
