1. Introduction
The downward slicing and filling method was introduced to China in 1960s [
1,
2]. Under the background of high-efficiency and green mining, it develops rapidly and is widely used in metal mines [
3]. There are often weak structural planes such as bedding, joints, weak interlayer and fracture zone in underground engineering rock mass. The existence of weak plane not only weakens the overall strength of rock mass, but also is a potential risk factor for overall engineering instability.
The most common panel mining method in downward layered cemented fill mining is roadway mining. Ore bodies in the layered area are usually divided according to a certain width of the roadway and then filled by interval or continuous mining. However, no matter which mining method is adopted, due to the different filling sequence, there must be weak filling surface between adjacent mining paths. When the lower stratified orebody is mined, the filling weak surface is arranged in the filling roof parallel to the gravity direction. In the actual mining process of ore body, production technicians usually reinforce the support under the weak filling surface.
The occurrence of filling weak surface in exposed roof is different with the layout of upper and lower Stratified Mining approach. When the upper and lower stratified mining approach are arranged vertically and staggeringly, the angle between the filling weak surface and the direction of the mining approach is 90˚ location relationship; When the upper and lower stratified mining approach are arranged parallel, the angle between the filling weak surface and the direction of mining approach is 180˚ location relationship. The research shows that [
4,
5,
6,
7,
8] in the field of geotechnical engineering, the occurrence of weak surfaces in the engineering structure body is different, and the deterioration degree of the stability of the engineering structure body is also different. Even though existing research [
9,
10,
11,
12,
13,
14] has used numerical simulation to simulate and optimize the layout of upper and lower layers for mining access, the distributions of the stress and plastic zone in the two different mining and filling sequences were obtained through numerical simulations by Jiang N et al [
9], the reasonable mining face width is determined combined with numerical simulation [
10], and field investigation and numerical simulation were combined to study the mechanism of roof collapse by Zhong M et al [
11] Research on the intrinsic mechanism of the layout of upper and lower layers is still lacking, which puts engineering scheme practice far ahead of scientific theory. Cao ZQ et al [
15] studied the relationship between rectangular section size and stope stability using FLAC
3D based on practical engineering, and analyzed the distribution of stresses, displacement and plastic zone.
For the direct shear tests on cemented paste backfill, Gao T et al [
16] prepared a two-layered cemented paste backfill (CPB) with layering angles of 5°, 10°, 15°, 20° and 25° and complete CPB to conduct direct shear experiments. Koupouli et al [
17] performed the direct shear tests on CPB-CPB interfaces in order to assess the frictional shear strength parameters. The action of compression–shear, 30°, 45° and 60° variable angle shear tests (VAST) were conducted by Chen T et al [
18] to investigate the mechanical properties. Researchers have studied the strength, deformation, and failure of the direct shear tests on CPB [
19,
20,
21,
22,
23,
24].
Under this engineering background, combined with the direct shear test of weak surface of filling body in the chamber, the stability of filling roof under different layered mining approaches is numerically simulated and analyzed by means of medium interface unit in FLAC3D, the finite difference numerical simulation software. Finally, the optimal layered layout scheme of upper and lower layers is determined, which provides theoretical basis for mines adopting the downward horizontal layered cemented filling method.
2. Materials and Methods
2.1. Laboratory test on mechanical parameters of filling weak surface
2.1.1. Sample preparation of layered paste filler
The test sample is layered full tailings paste filler. The aggregate is taken from the whole tailings of a copper mine in Jiangxi Province. The tailings are placed in dry and ventilated places to dry and then fully compacted to no obvious coarse particles. The chemical mineral composition and proportion are shown in
Table 1. P.O32.5 mineral Portland cement is used as cementing agent to prepare filling slurry with a lime-sand ratio of 1:4 and a mass concentration of 74% according to the actual filling ratio of the mine.
In actual stope, the filling weak surface is arranged parallel to the direction of gravity, so the filling weak surface is designed to be distributed horizontally in the layered paste filling body. Sample pouring dimension 150mm × 150mm × 150 mm, the sample pouring process is divided into two steps, the first step is to pour half-height filler in the filling mould, and the second step is to pour the other half of the filler in the filling mould after 24 hours of rest until the filler has the basic strength. When there is certain bond strength between weak surfaces of layered paste filler, the sample is demoulded to obtain layered paste filler with horizontal weak surface. According to the production environment of mining access and different layering time, the specimens are kept in a constant temperature and humidity curing box for 28 days, with the curing temperature of 20 ℃ and the air humidity of 41%.
2.1.2. Direct shear test of layered paste filling
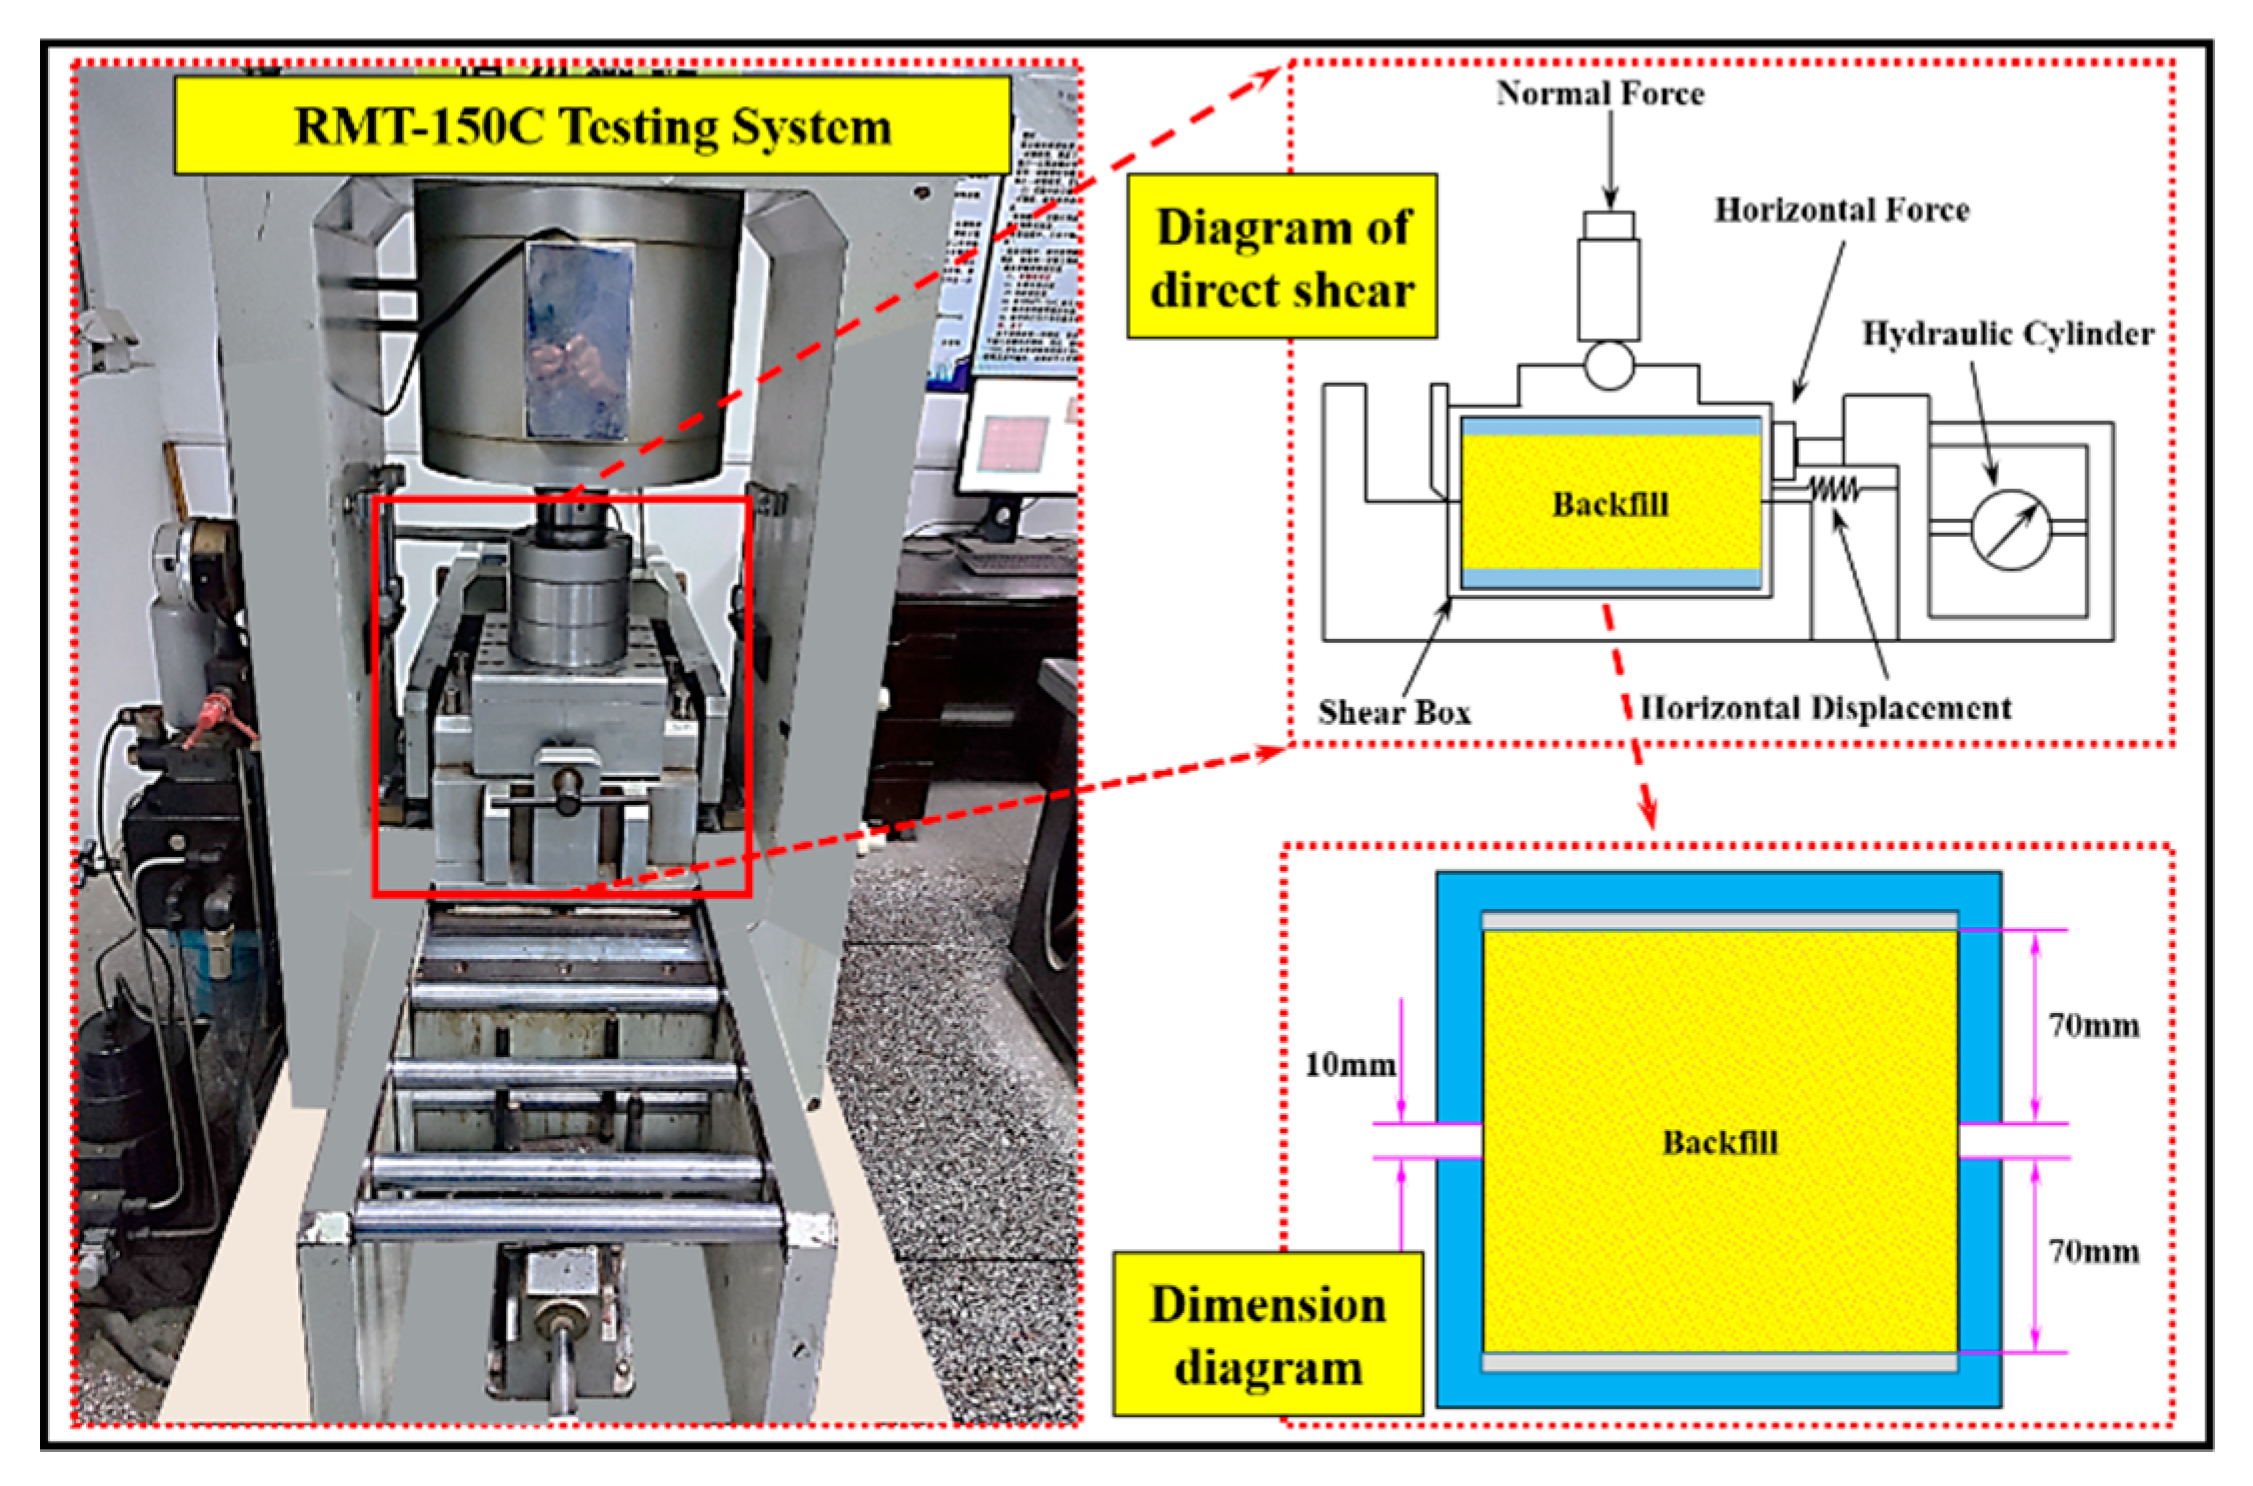
The direct shear test is conducted with RMT-150C rock mechanics experimental system as shown in
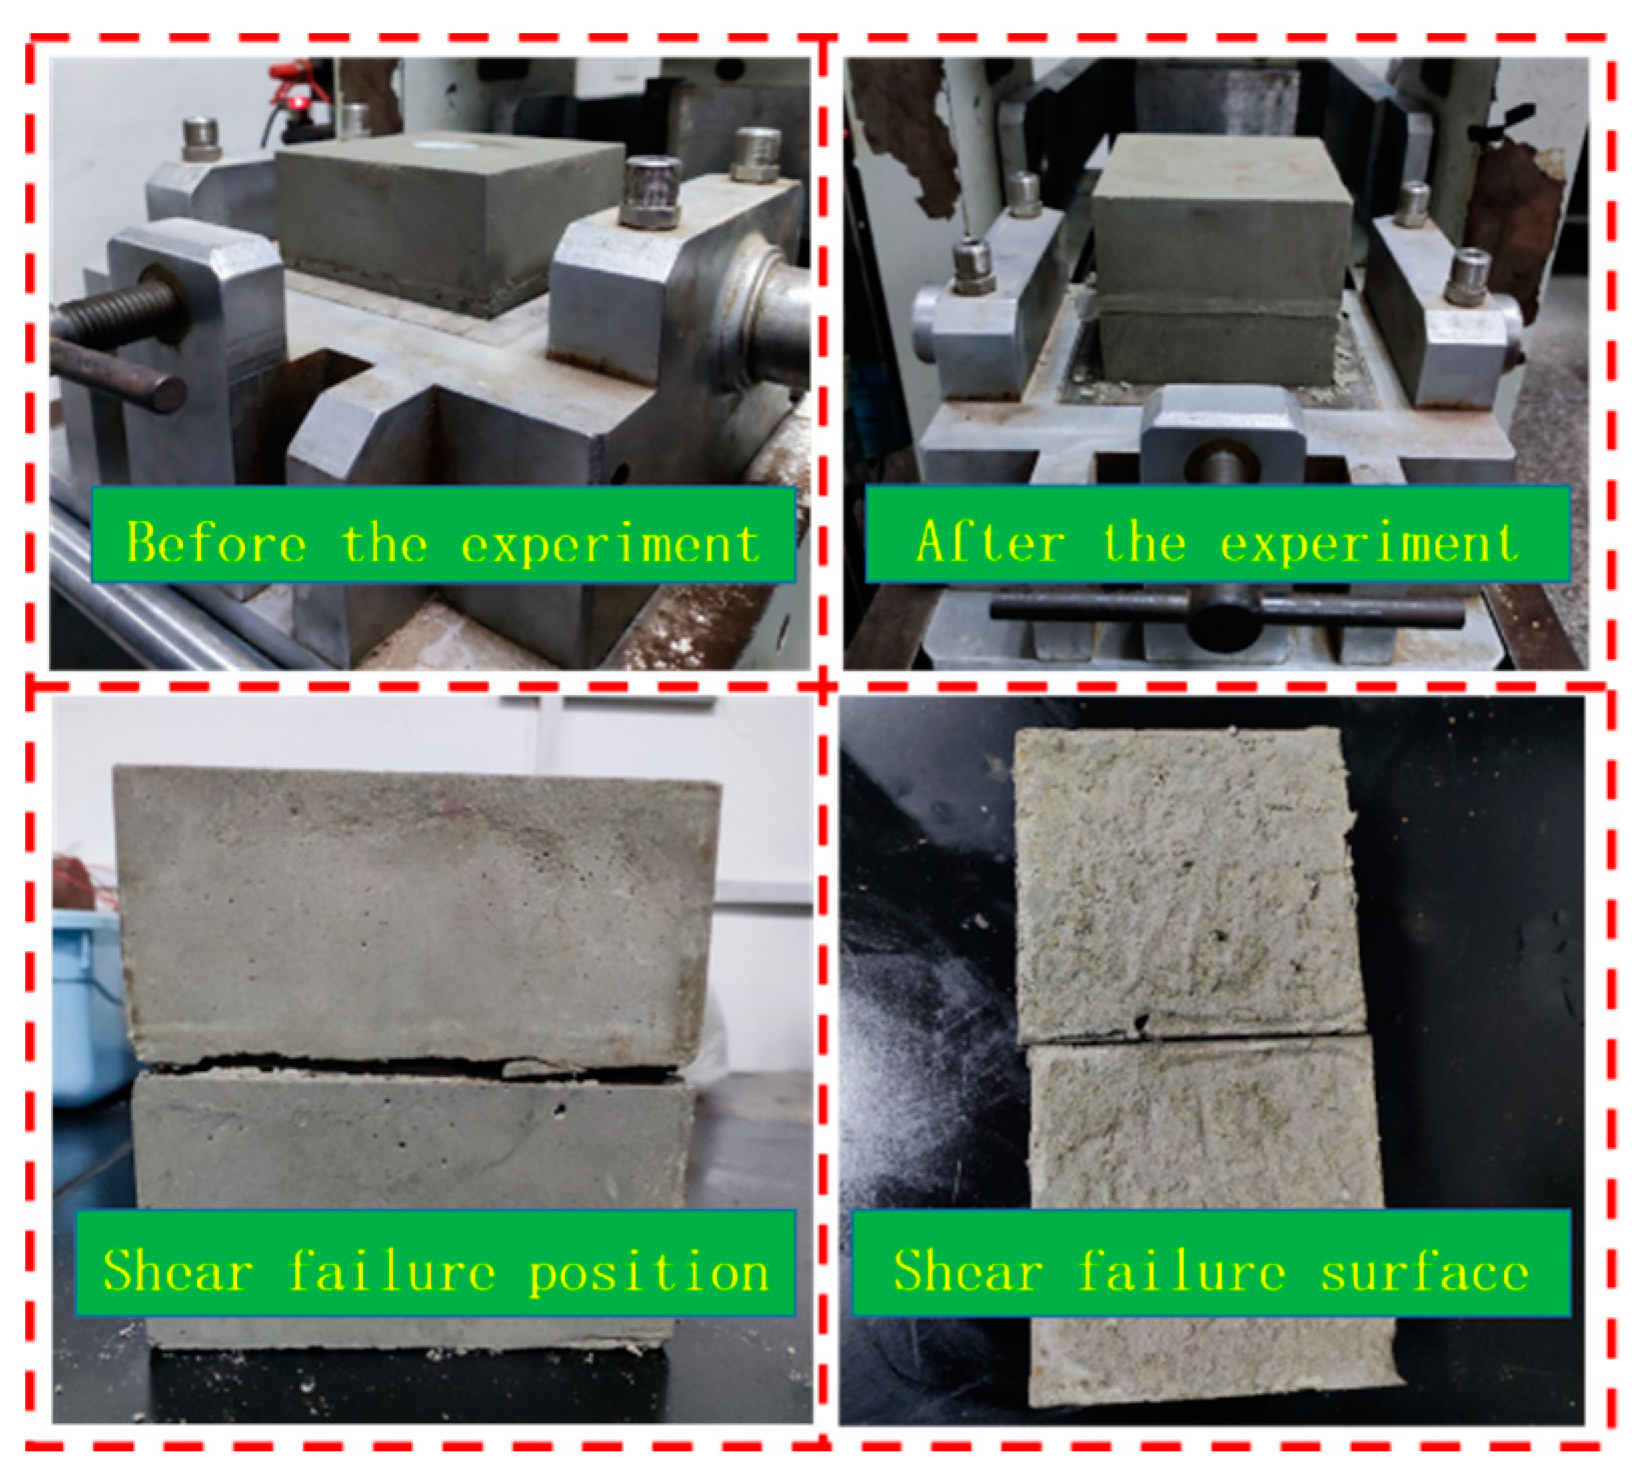
Figure 1, and the inner wall size of the direct shear test box is 150mm × 150mm × 150 mm, the direct shear specimen is placed in the shear box, and a height of 10 mm is reserved between the upper and lower shear boxes for shearing, as shown in
Figure 2. The direct shear test adopts the force (large) displacement control method of the test system. The axial force is controlled by force stroke, and the loading rate is 500N/s; Shear force is controlled by displacement, and the loading rate is 5e-5m/s, a total of four groups of direct shear tests of filling weak surface under normal stress (0.5MPa, 1.0MPa, 1.5MPa, 2.0MPa) are conducted. The test loading process is: vertical preload → horizontal preload → vertical load → horizontal load → specimen failure.
In the direct shear test, the position of the shear failure surface and the filling weak surface basically coincide, and the shear failure surface is neat and regular, and the shear failure surface is smooth and flat. It can be concluded that when the layered paste filler is subjected to large shear load as a whole, shear slip is most likely to occur at the weak filling surface. Layered paste filler has fewer other failure types near the weak surface during shear-slip process, which fully indicates that the mechanical strength of the weak surface is much lower than that of surrounding filler.
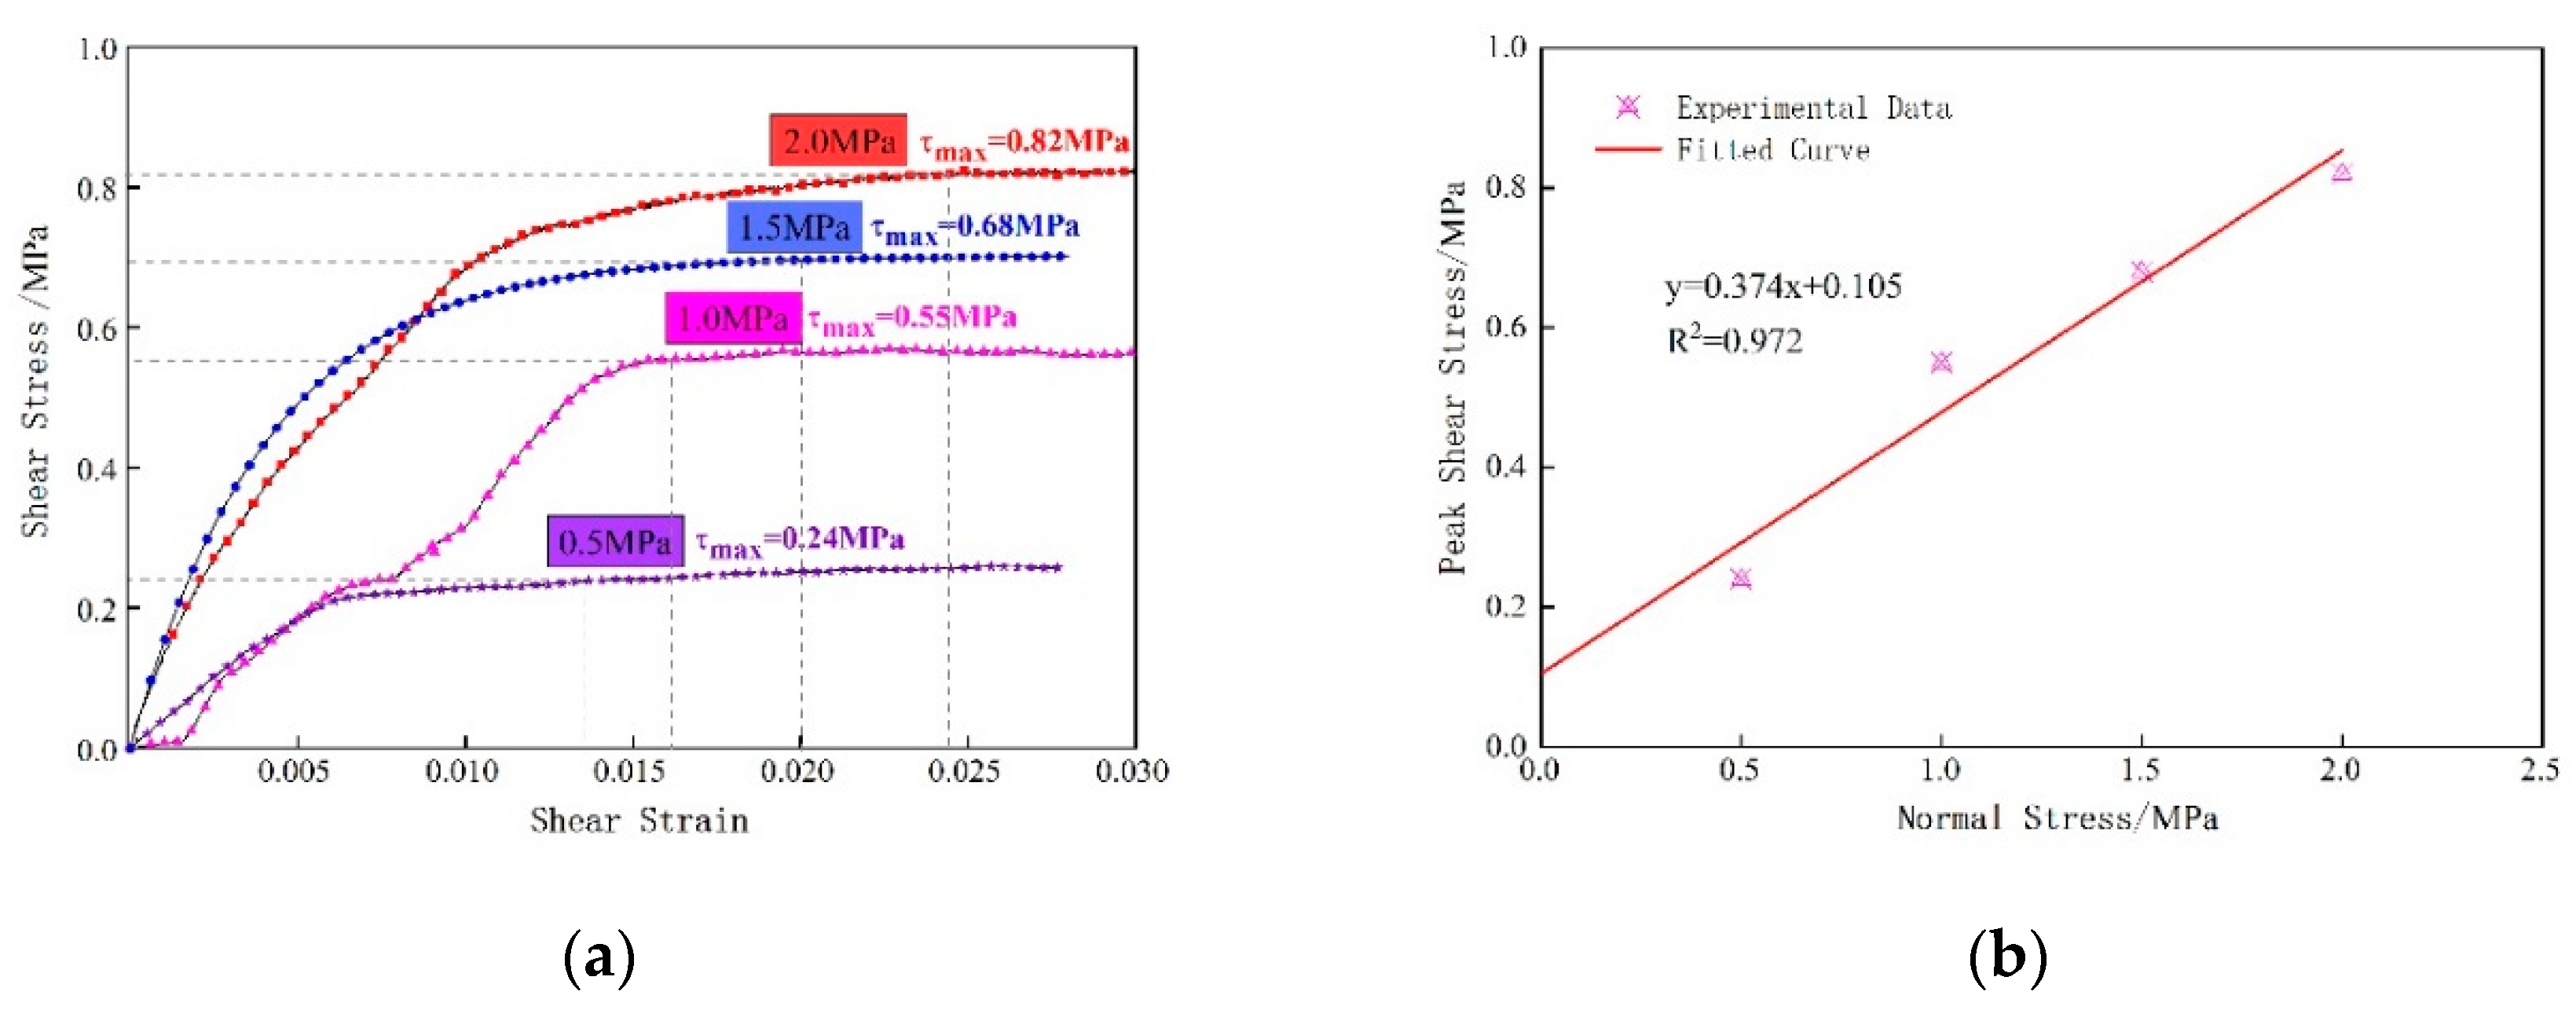
The shear stress-strain curve divides the shear failure process of filling weak surface into two stages: strain softening stage and strain hardening stage, as shown in
Figure 3a. The peak shear stress of filling weak surface increases with the increase of normal load and the strain reaching the peak shear stress migrates backwards. Based on Moore-Coulomb strength criterion as shown in
Figure 3b, the parameters of shear strength of filling weak surface are obtained by linear fitting with least squares method, with cohesion of 0.105MPa and internal friction angle of 20.49°.
2.2. Research on Numerical Simulation of Direct Shear Test
2.2.1. Establishment of numerical model
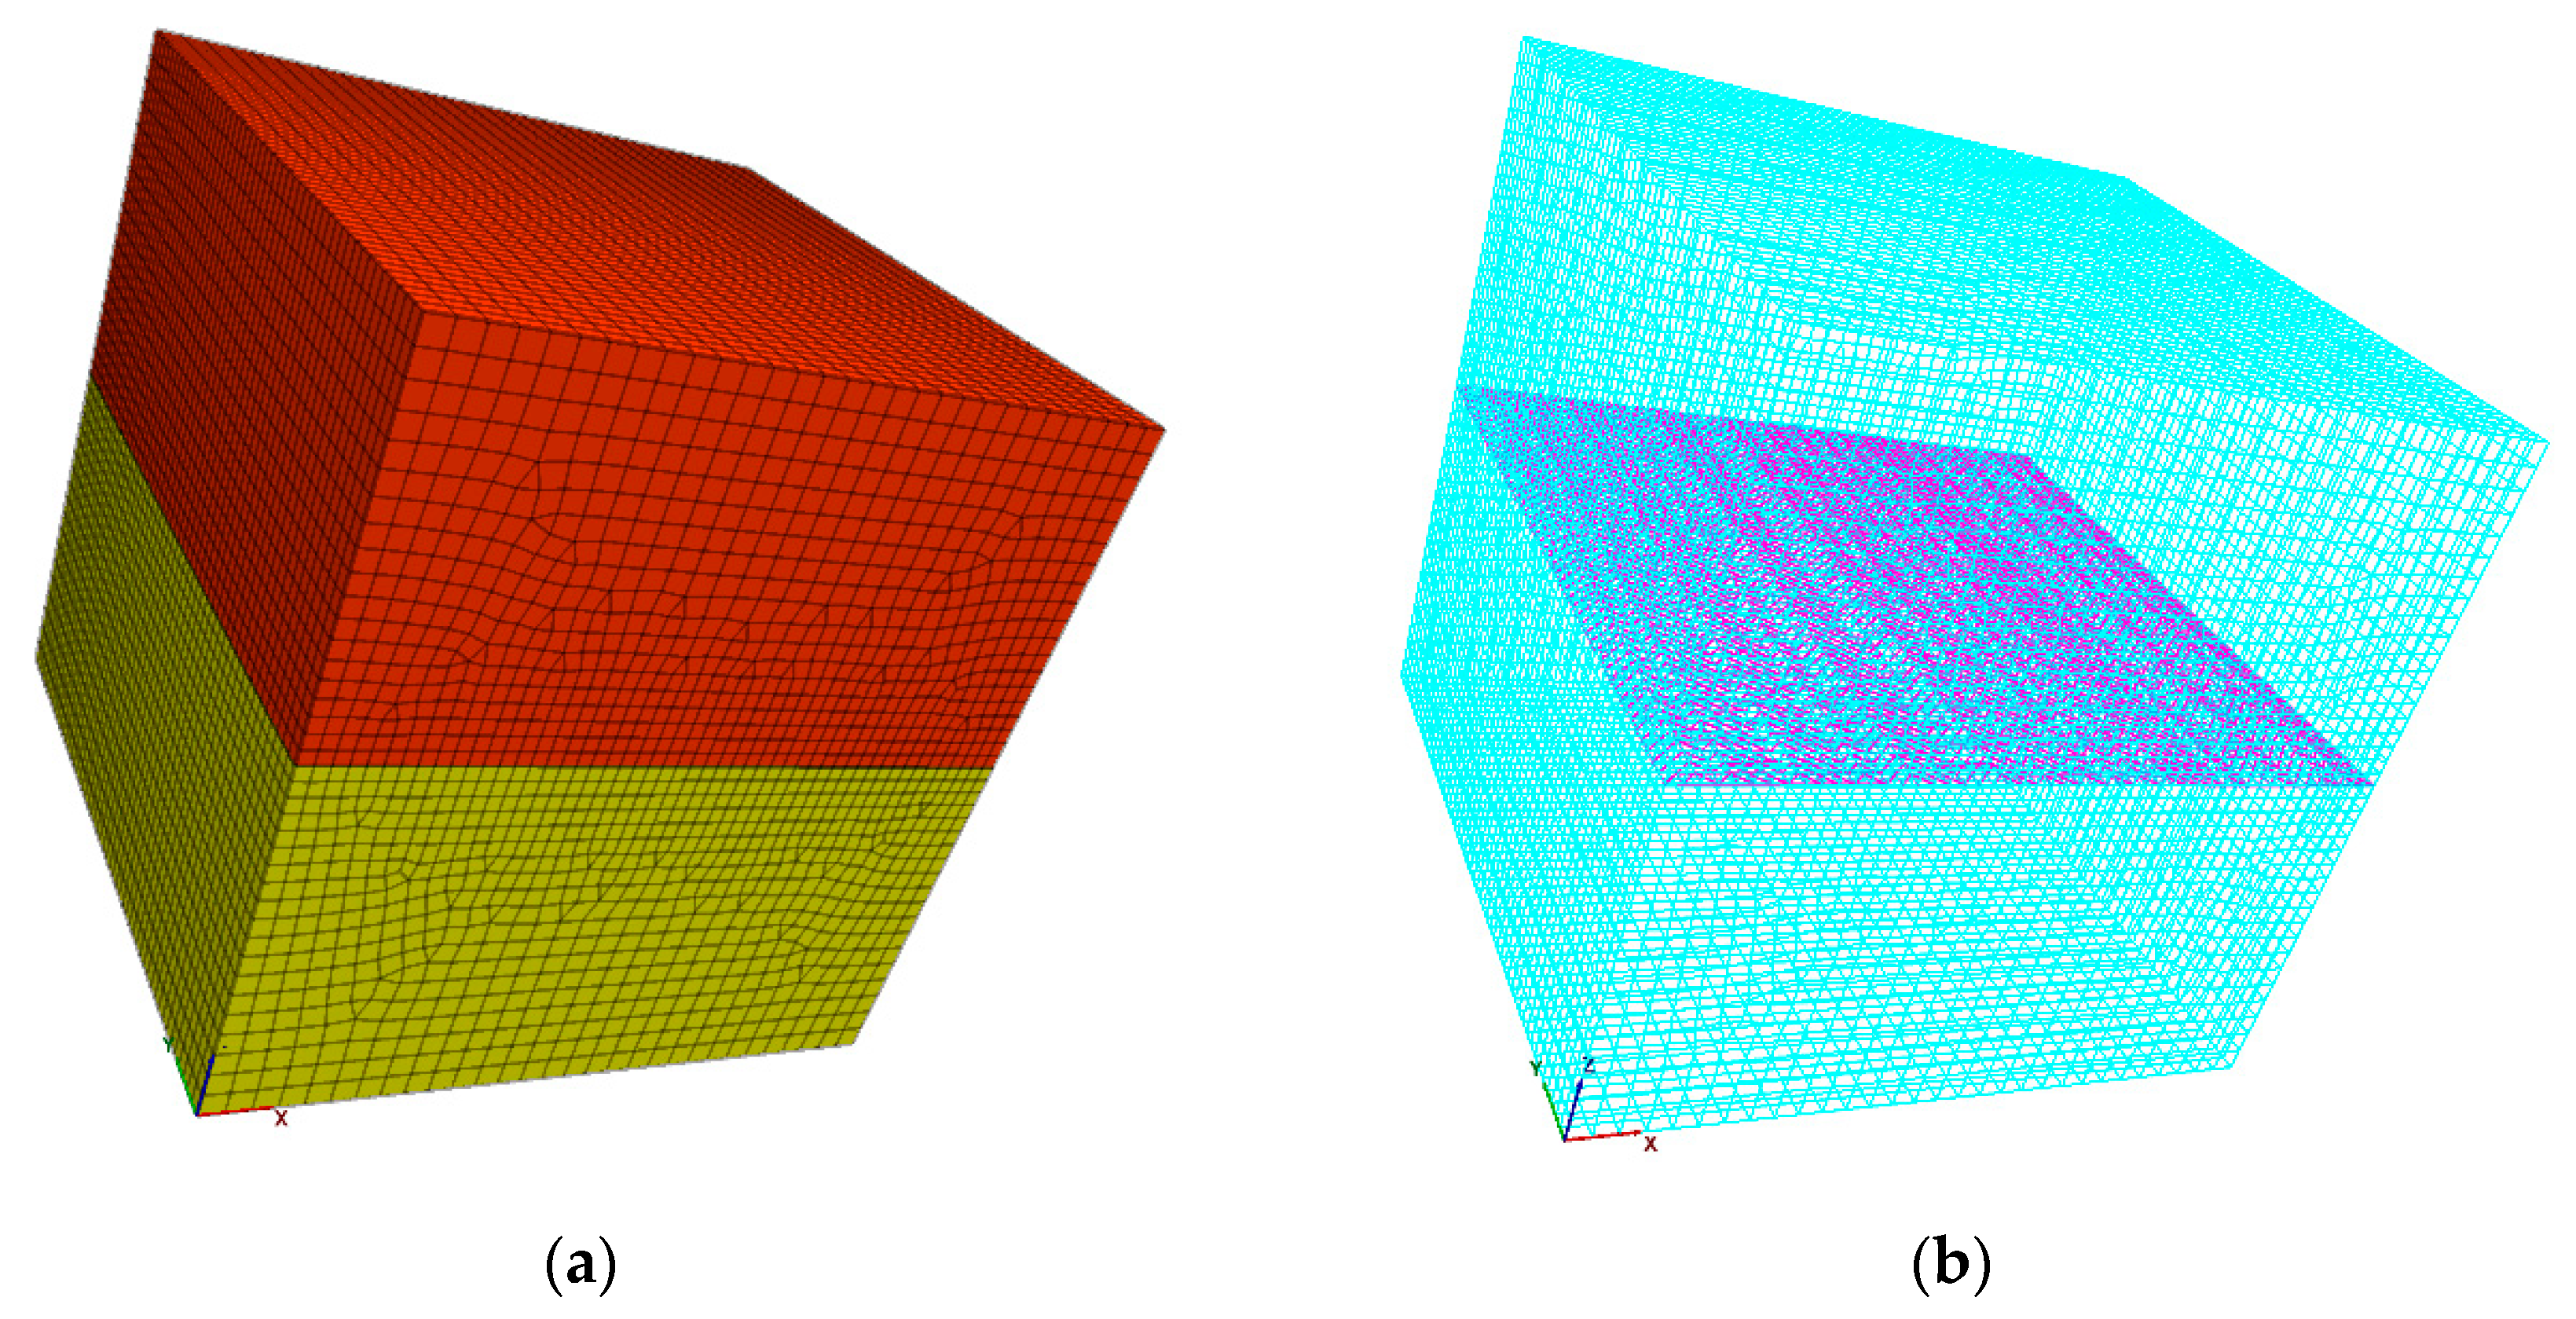
The numerical model for direct shear test is cubic. The size of the model is set at 100 times the size of the test specimen in the laboratory. The dimension length is 15m × 15m × 15m; A interface unit is added to half the height of the numerical model to simulate the filling of weak surface by filling sample. The model is divided into 76245 grid units and 78693 nodes. Among them, the dimension of line segments on the interface boundary is 0.3m. Other line segments are dimensioned by 0.3~0.5 linear gradient according to the distance from the interface.
Figure 4 of numerical model is shown.
A displacement constraint is added to the normal direction of each surface of the material group below the interface and a uniform load is applied to the top surface of the material group above the interface. At the same time, the shear rate of 5e-3m/s is used to control the sliding of material groups above the interface towards the x-axis in the positive half direction.
2.2.2. Calibration of interface meso-parameters
The material units with the strongest mechanical properties on both sides of the interface are selected to calculate the equivalent stiffness of the interface. The calculation formulas are as follows:
K is the volume modulus of filling material. G is the shear modulus of filling material and ∆
Zmin is the smallest grid size in the normal direction of both sides of interfacial which equals 0.3m. The calculation of two modulus parameters K and G are as follows:
It can be calculated by combining the above formulas. Initial Normal Stiffness kn0 and Initial tangential stiffness ks0 are equal to 2.14e10Pa/m.
2.2.3. Calibration of meso parameters
In order to determine reasonable stiffness parameters, the numerical simulation results are closest to the laboratory test results. Initial normal stiffness and shear stiffness of 0.001, 0.01 and 0.1 times are respectively set to simulate the shear behavior of interface changing with stiffness parameters under four normal stresses(0.5MPa、1.0MPa、1.5MPa、2.0MPa).
The shear stress-shear strain curves during interfacial shear are similar to those of direct shear tests in laboratory. They can be divided into two stages: strain softening and strain hardening without changing the stiffness parameters and normal stresses; Under the same normal stress, the peak shear stress and peak shear strain at the interface show a non-linear upward trend with the decrease of stiffness parameters; At the same stiffness parameter, the peak shear stress and peak shear strain at the interface also show a non-linear upward trend with the increase of normal stress applied to the model. It is shown that the interfacial micro-stiffness parameter will affect the overall strength of the interfacial in the model, but will not change the development trend of the interfacial shear stress-shear strain curve. The fitting curves of peak shear stress and normal stress under different stiffness parameters are shown in
Figure 5.
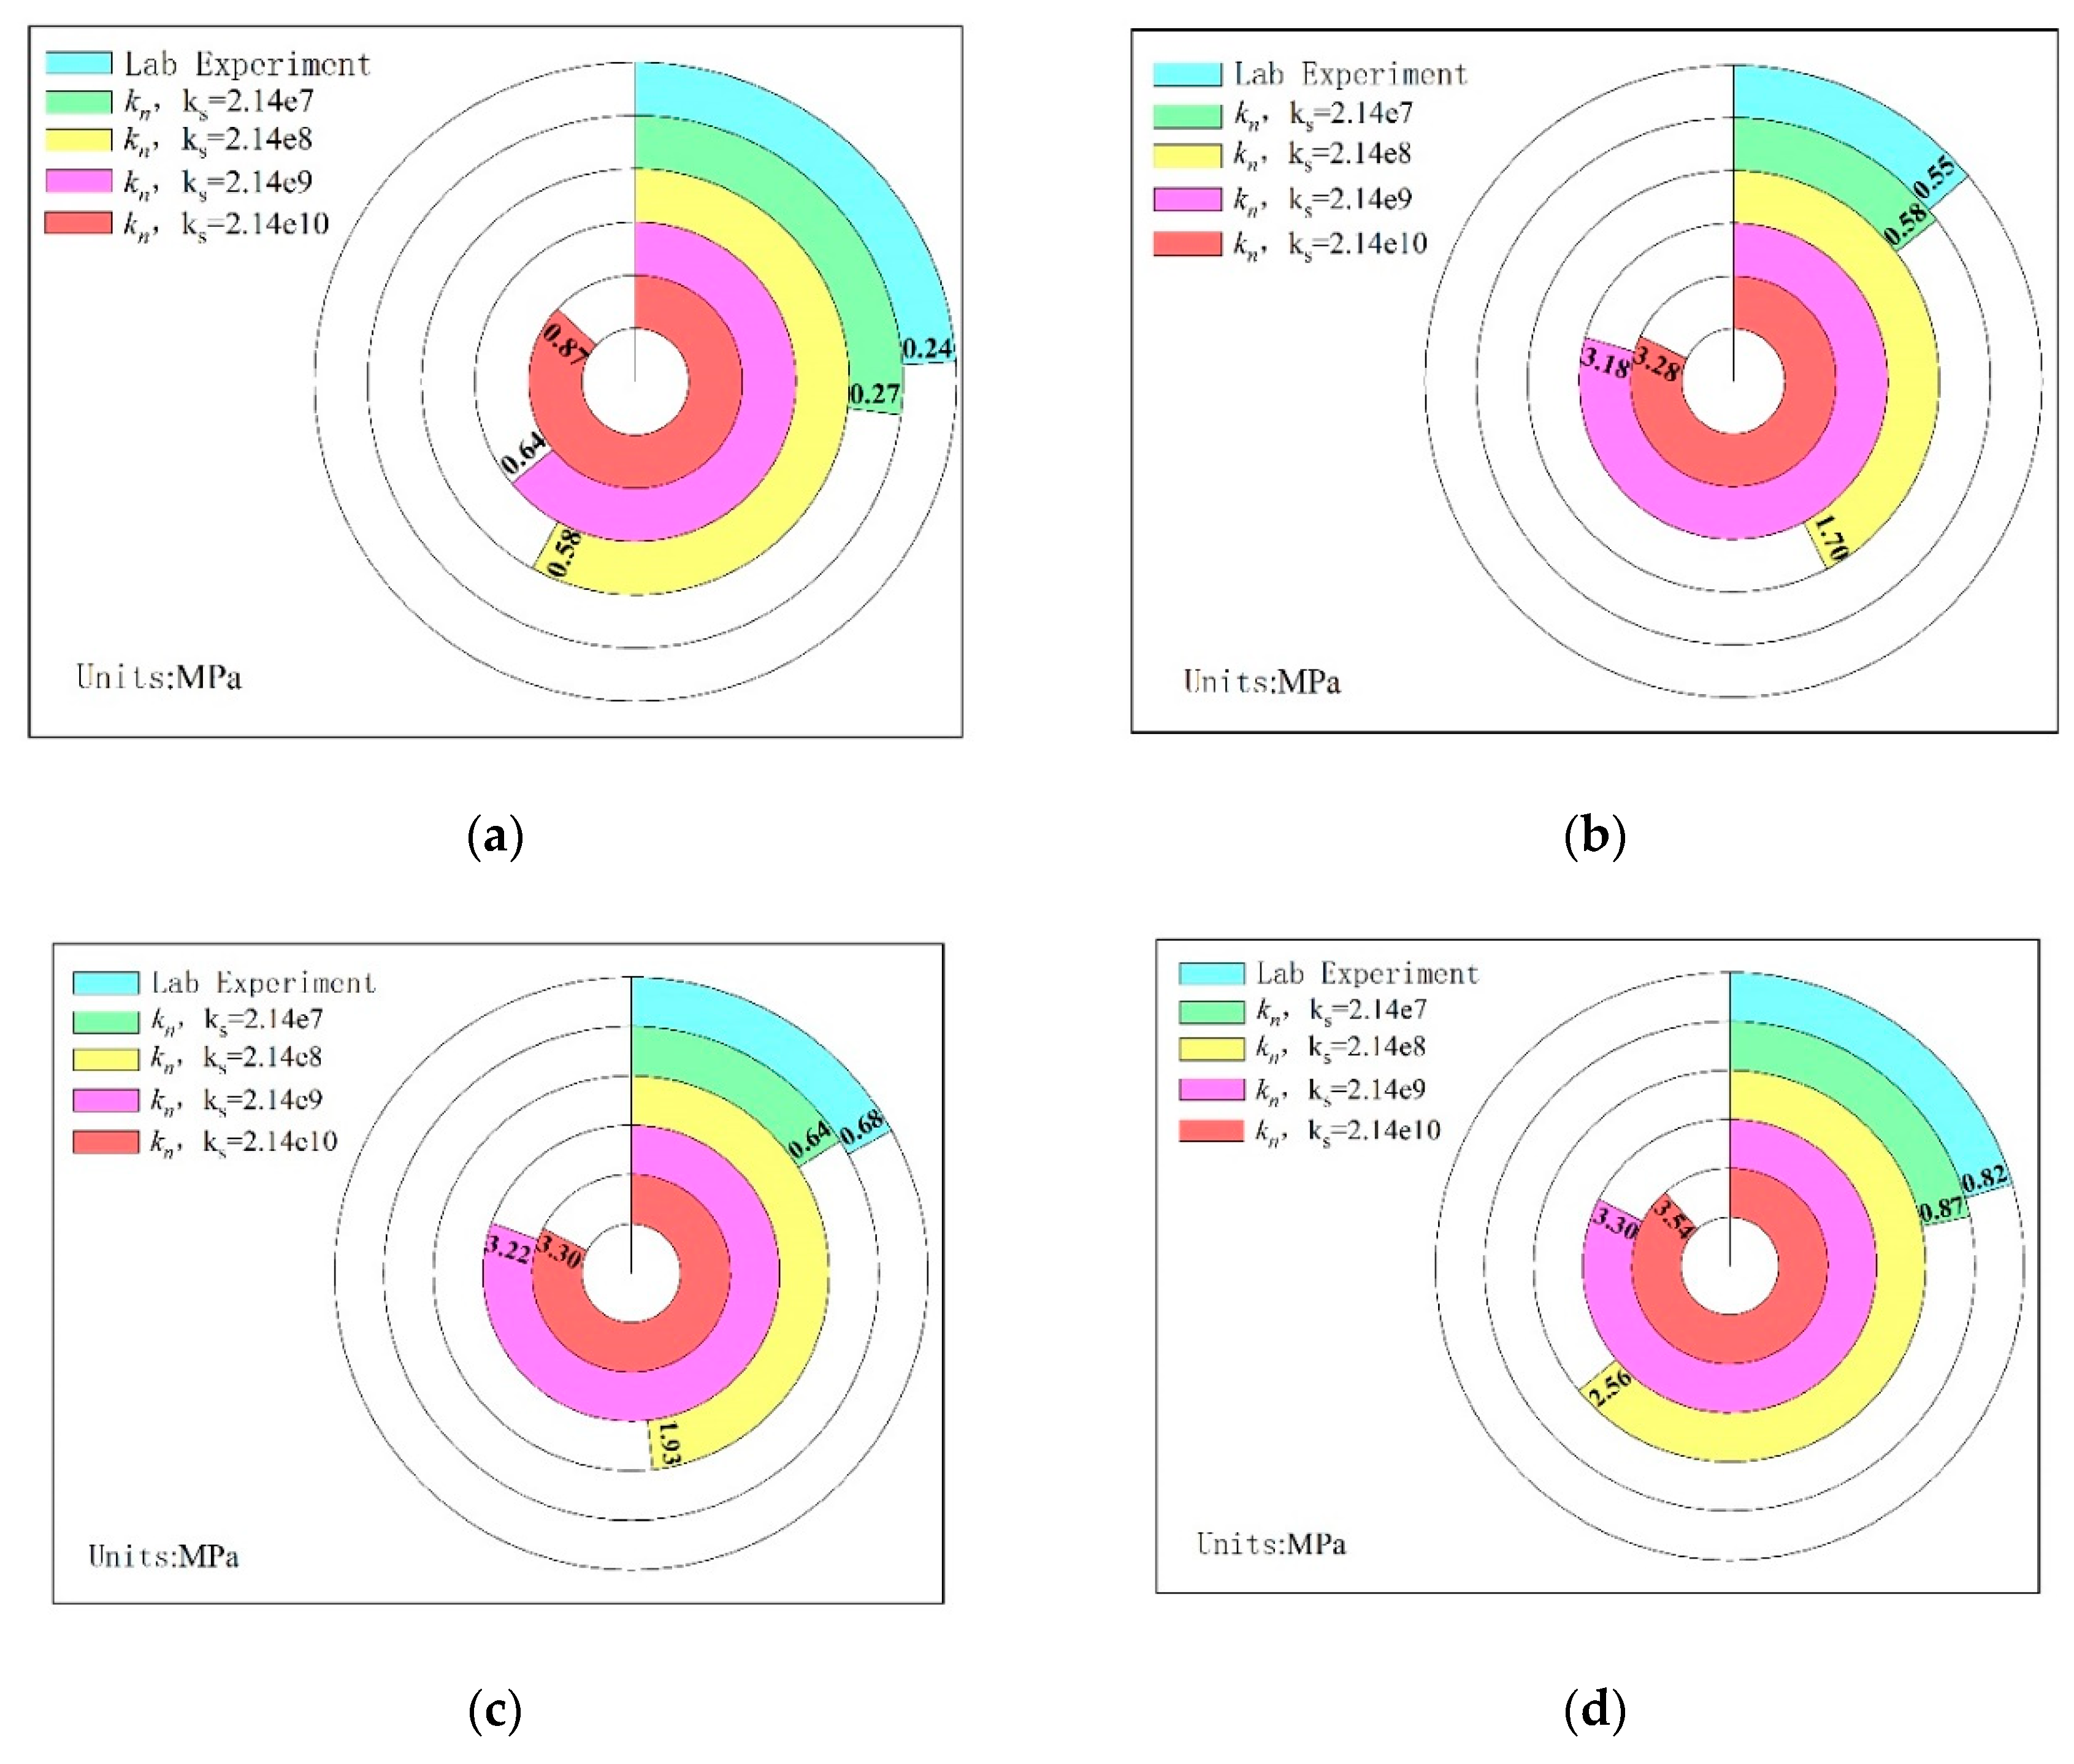
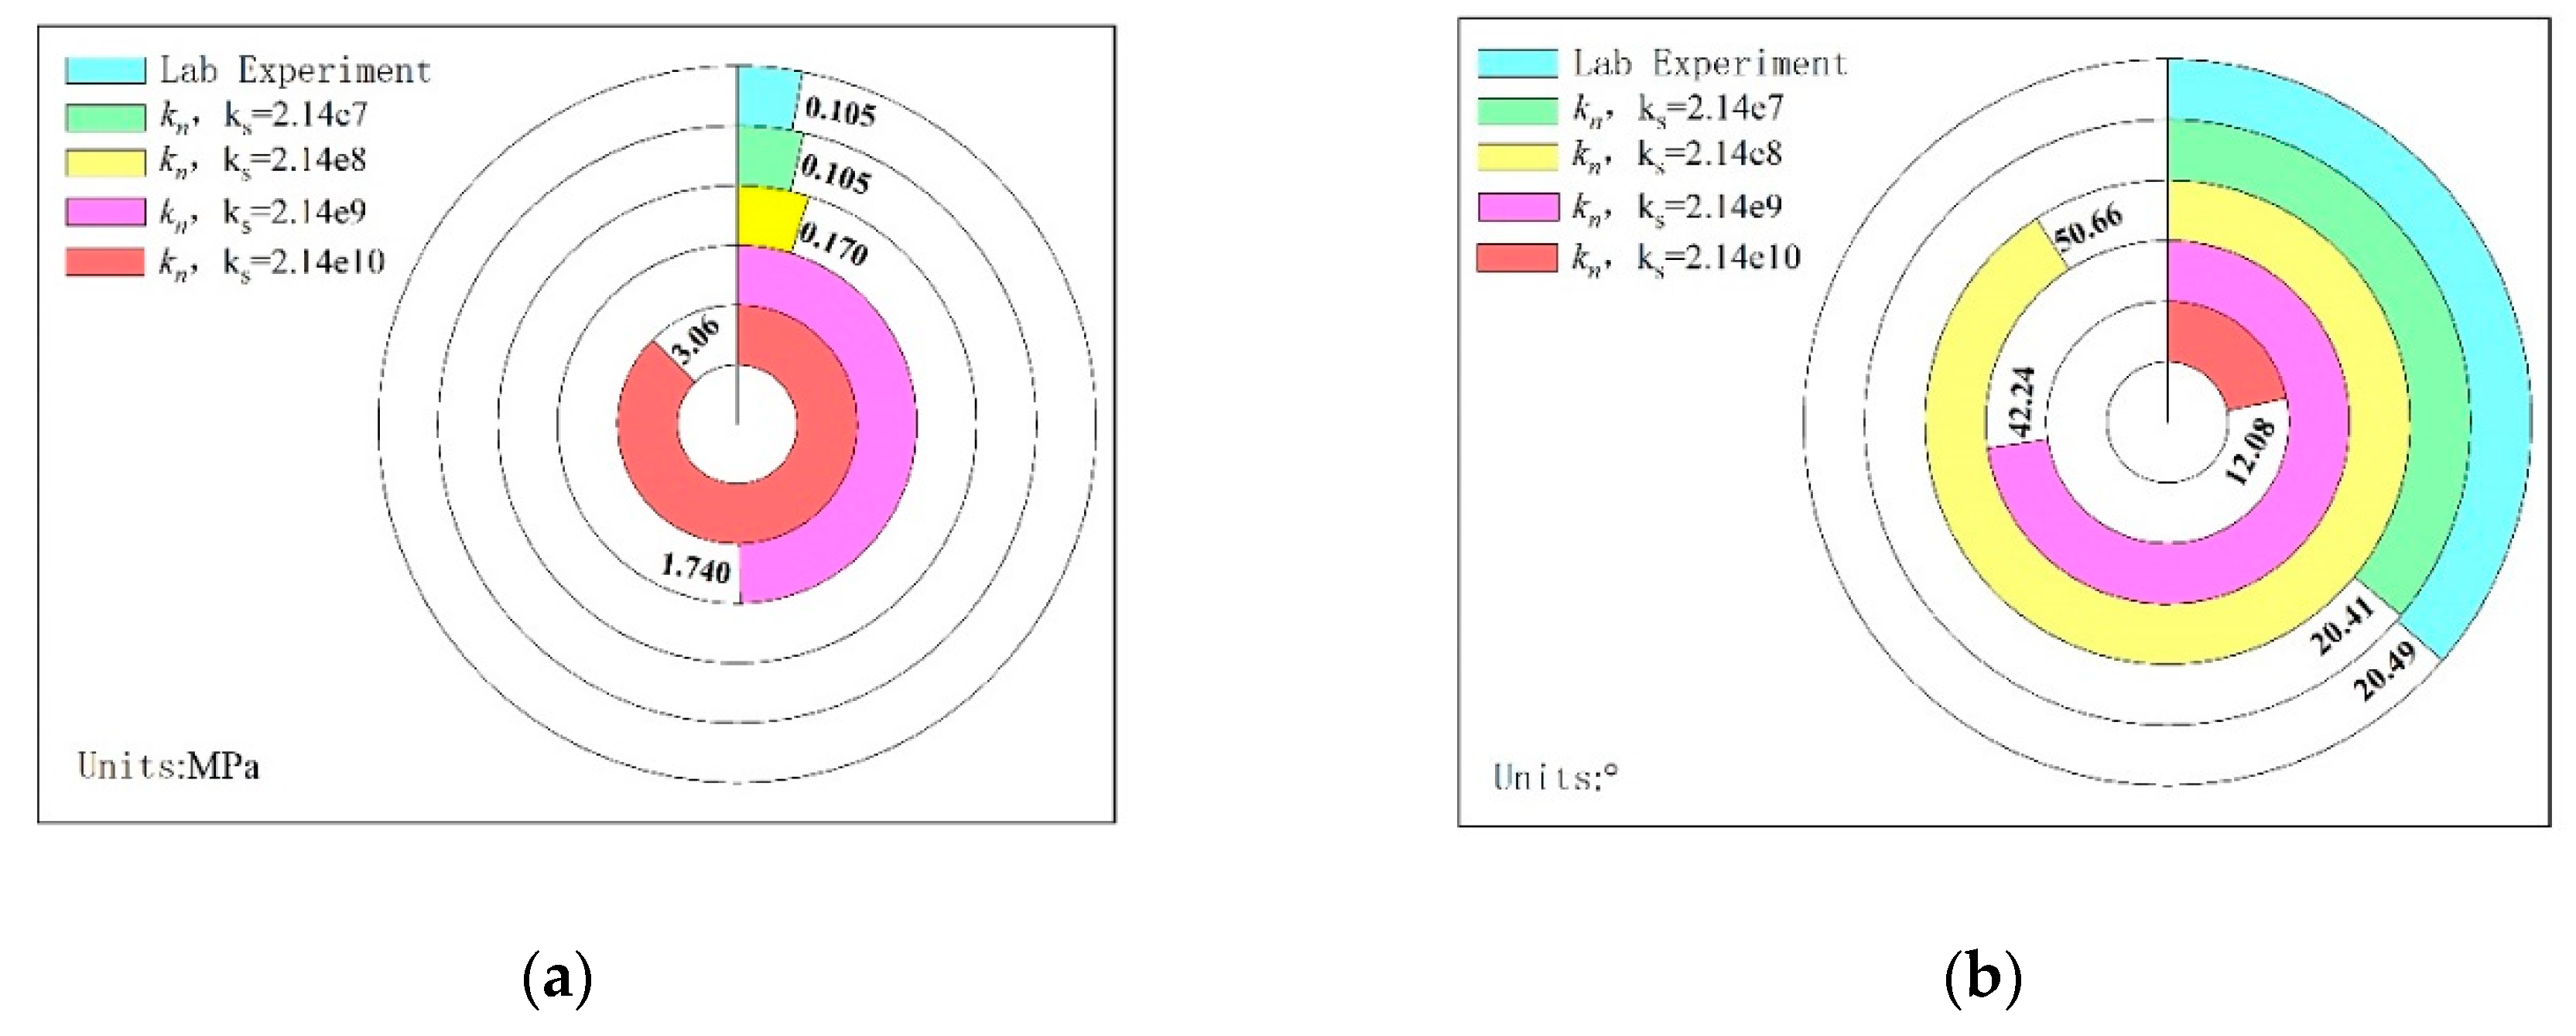
In order to comprehensively compare and analyze the numerical simulation test results under different stiffness parameters with the laboratory test results, the peak shear stress, cohesion and internal friction angle of the test results are extracted and plotted as a pie-column diagram for comparison. As shown in
Figure 6 and
Figure 7.
When the interfacial cohesion is 0.105MPa and the internal friction angle is 20.49°, the results of numerical simulation direct shear test are closest to those of laboratory test, which can effectively simulate the mechanical characteristics of filling weak surface.
2.3. Optimum Simulation of Layout Scheme of Mining Approach
The different layout schemes of mining approach are mainly different from the occurrence and exposed area of weak surface of upper stratified filling relative to lower stratified filling approach. The stability of filling roof is different under different layout schemes of mining approach.
2.3.1. Establishment of numerical models for different mining routes
Wang XJ et al [
25] fully considered the engineering practice such as the load of the mining rock, the dip angle of the ore body, the staggered arrangement of the adjacent layered roadway, and the contact between the backfill and the surrounding rock then used FLAC
3D to simulate the orthogonal calculation of roof stability under the influence of multiple factors.
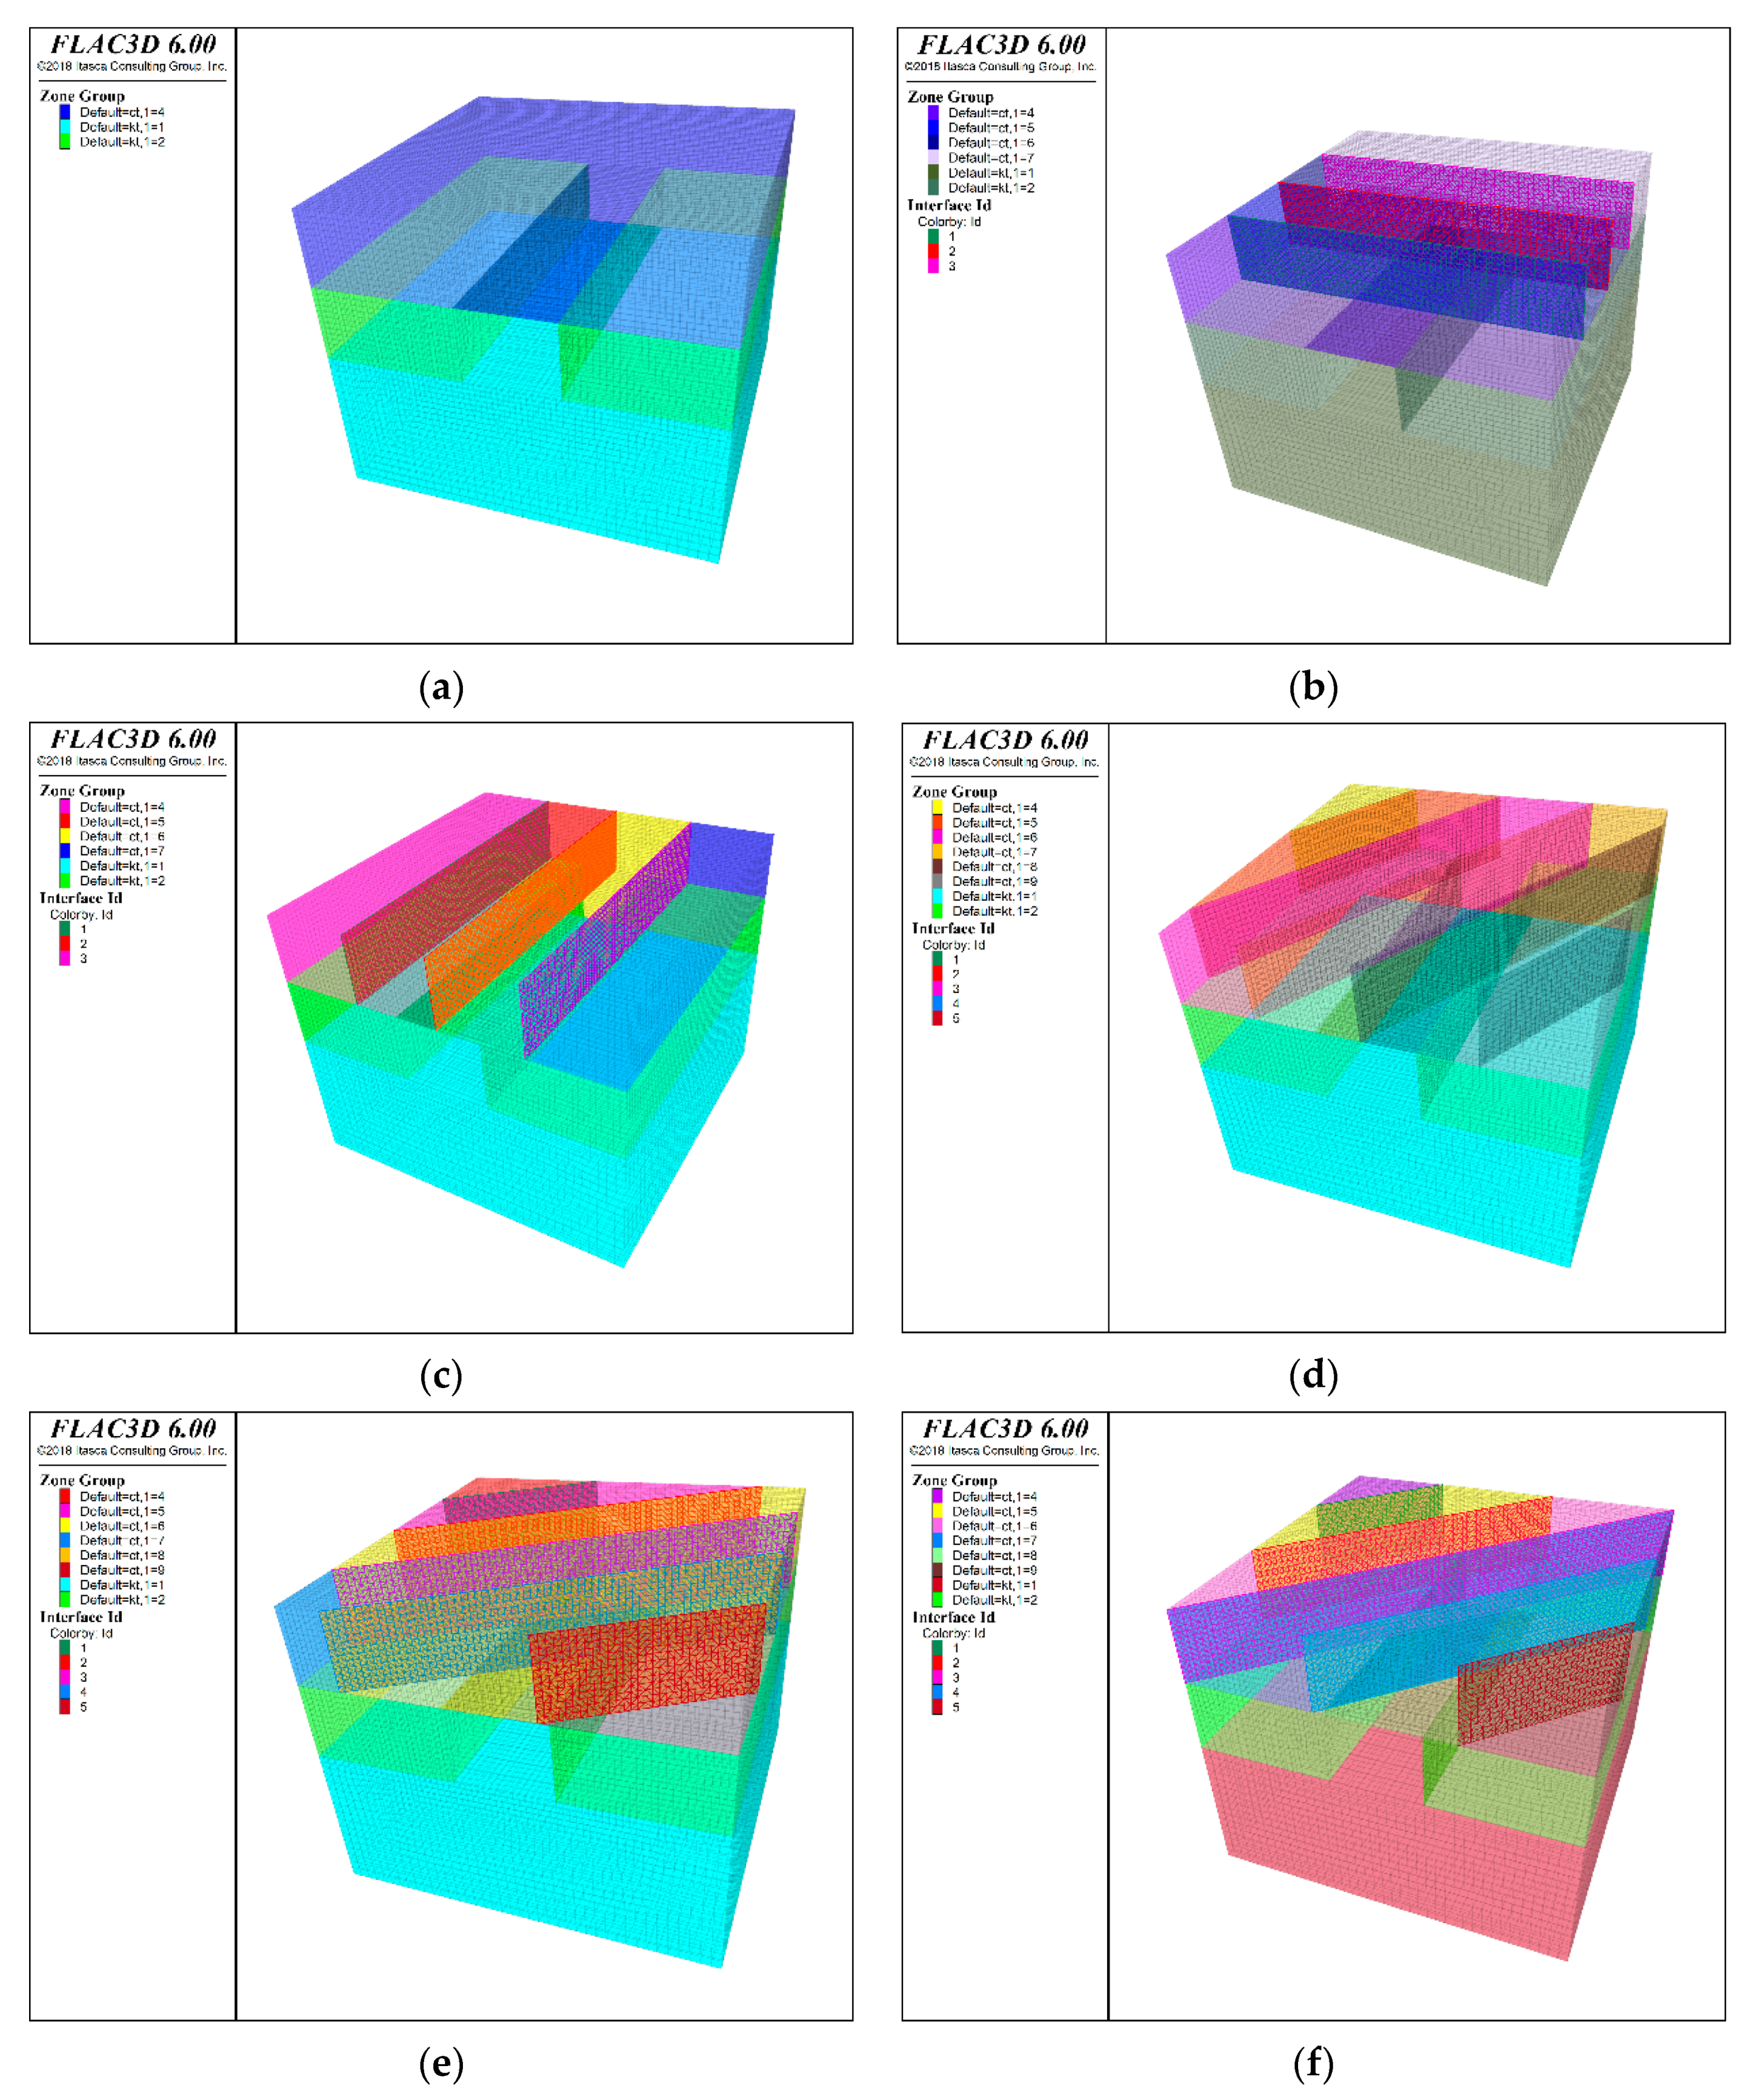
In order to comprehensively analyze the stability of filling roof under different layered mining approach arrangement schemes, the excavation schemes of the mining approach without considering the filling weak surface and six layouts of the mining approach with 30°, 45°, 60°, 90° and 180° between the filling weak surface and the central axis of the approach direction are designed. The model grid unit is generated by mixing tetrahedron and trihedron units. In the vicinity of excavated tunnels and the filling roof of tunnels, the mesh size is controlled to 0.3m, while in other locations, the mesh size is controlled to 0.5m. The excavation models under different schemes are shown in
Figure 8.
The filling weak surface in the model obeys the linear Coulomb shear strength criterion and other materials obey the Mohr Coulomb strength criterion. The mechanical parameters of the model material are shown in
Table 2.
3. Results
By reason of the weak filling surface is distributed in the filling roof at multiple angles, the mechanical state of the filling roof is studied by interception section, which is located in the X-Y plane of the model coordinate axis and at the lower surface of the filling roof in Z direction of the model height, when processing and analyzing the calculation model results.
3.1. Stress Field and Plastic Zone Distribution
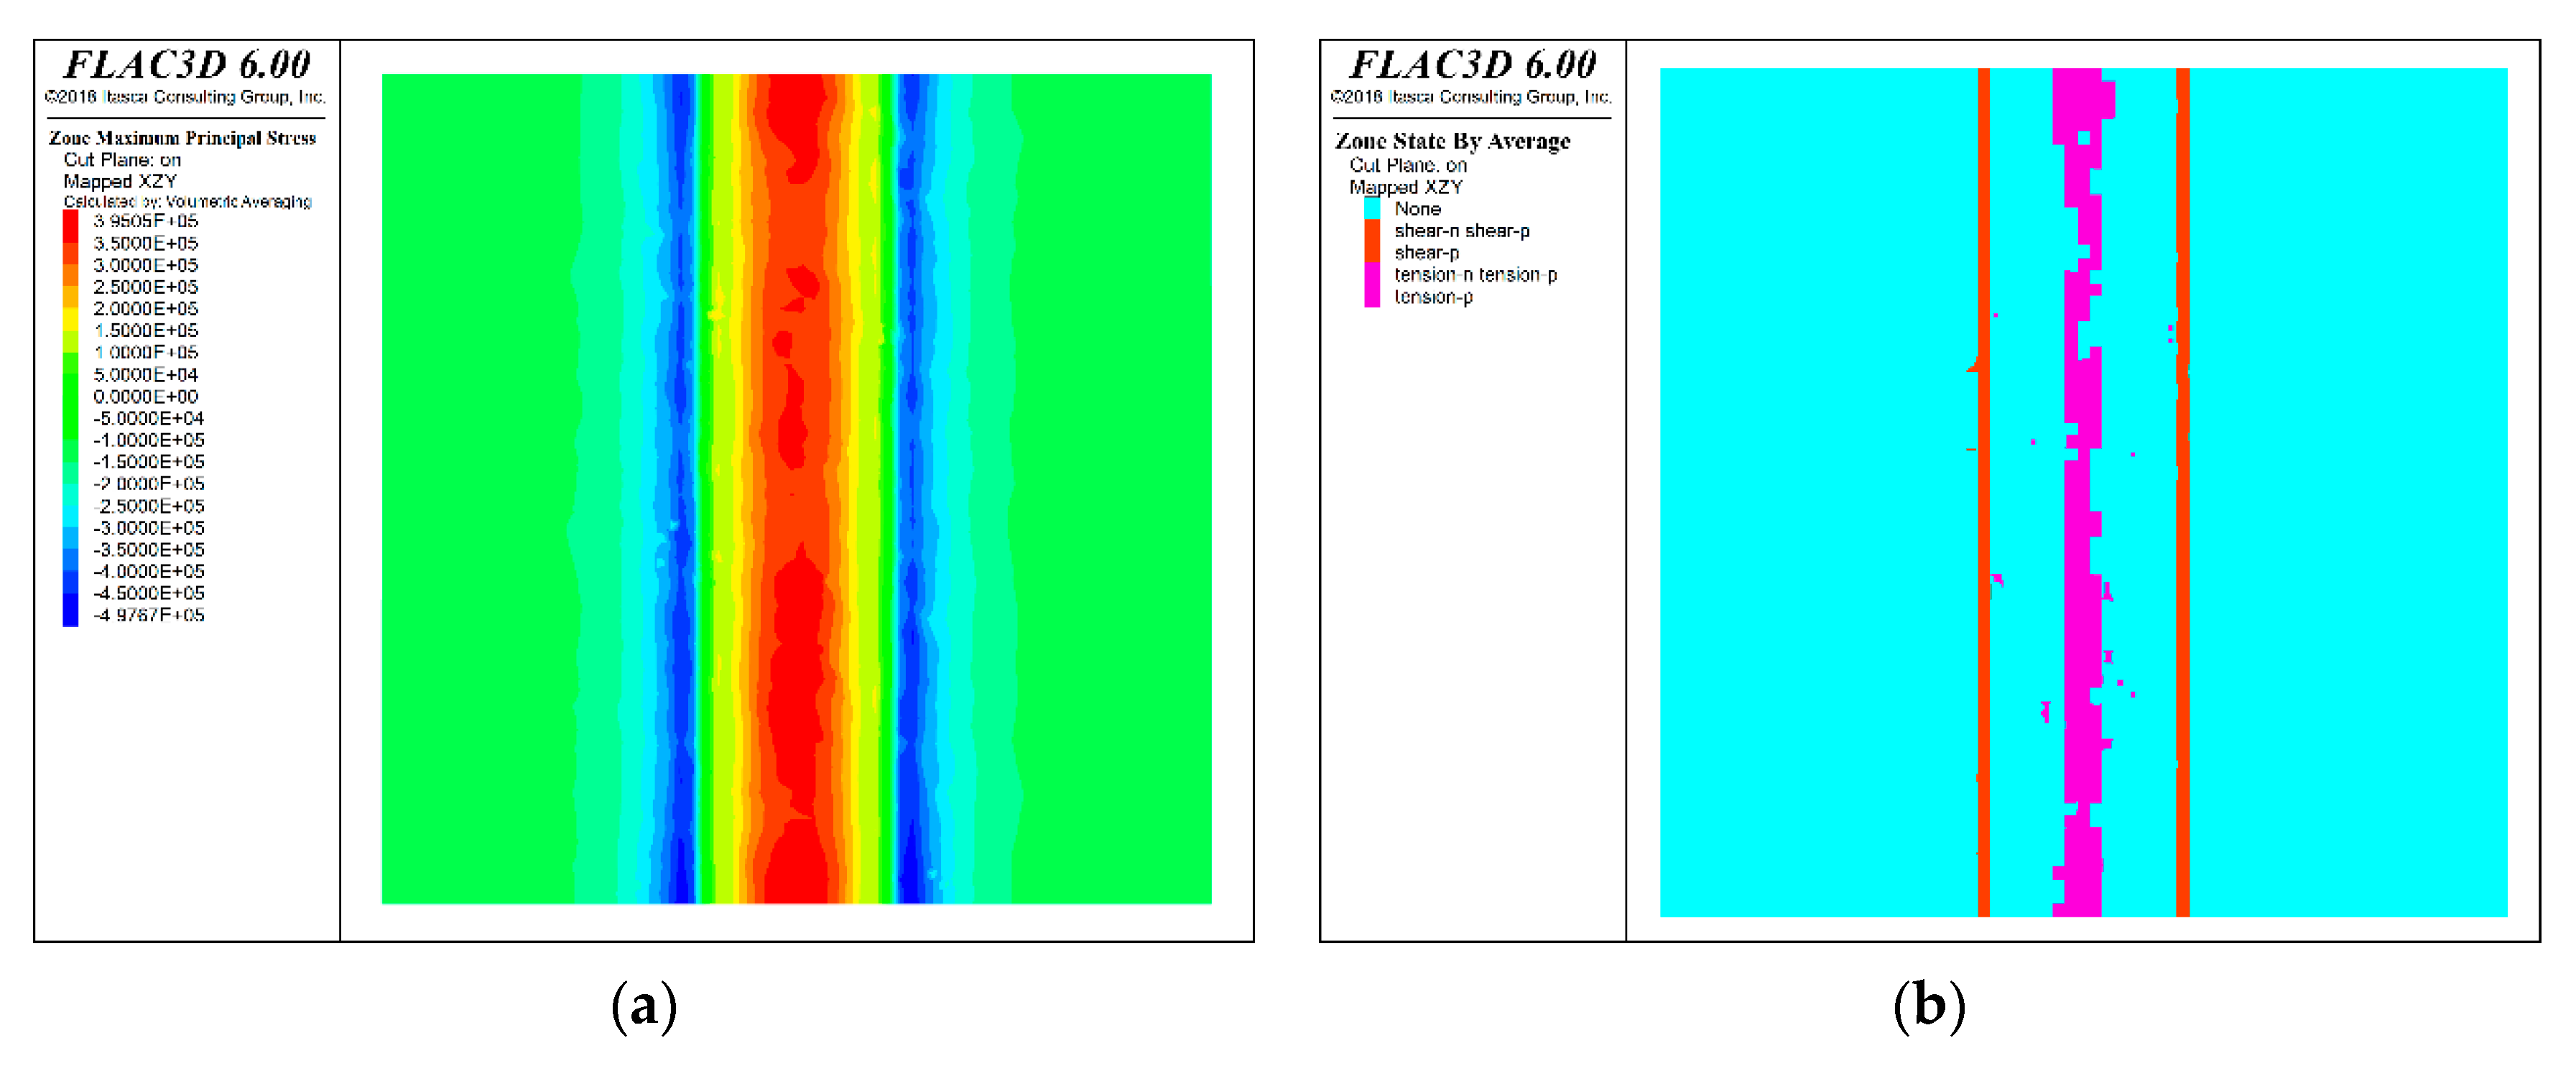
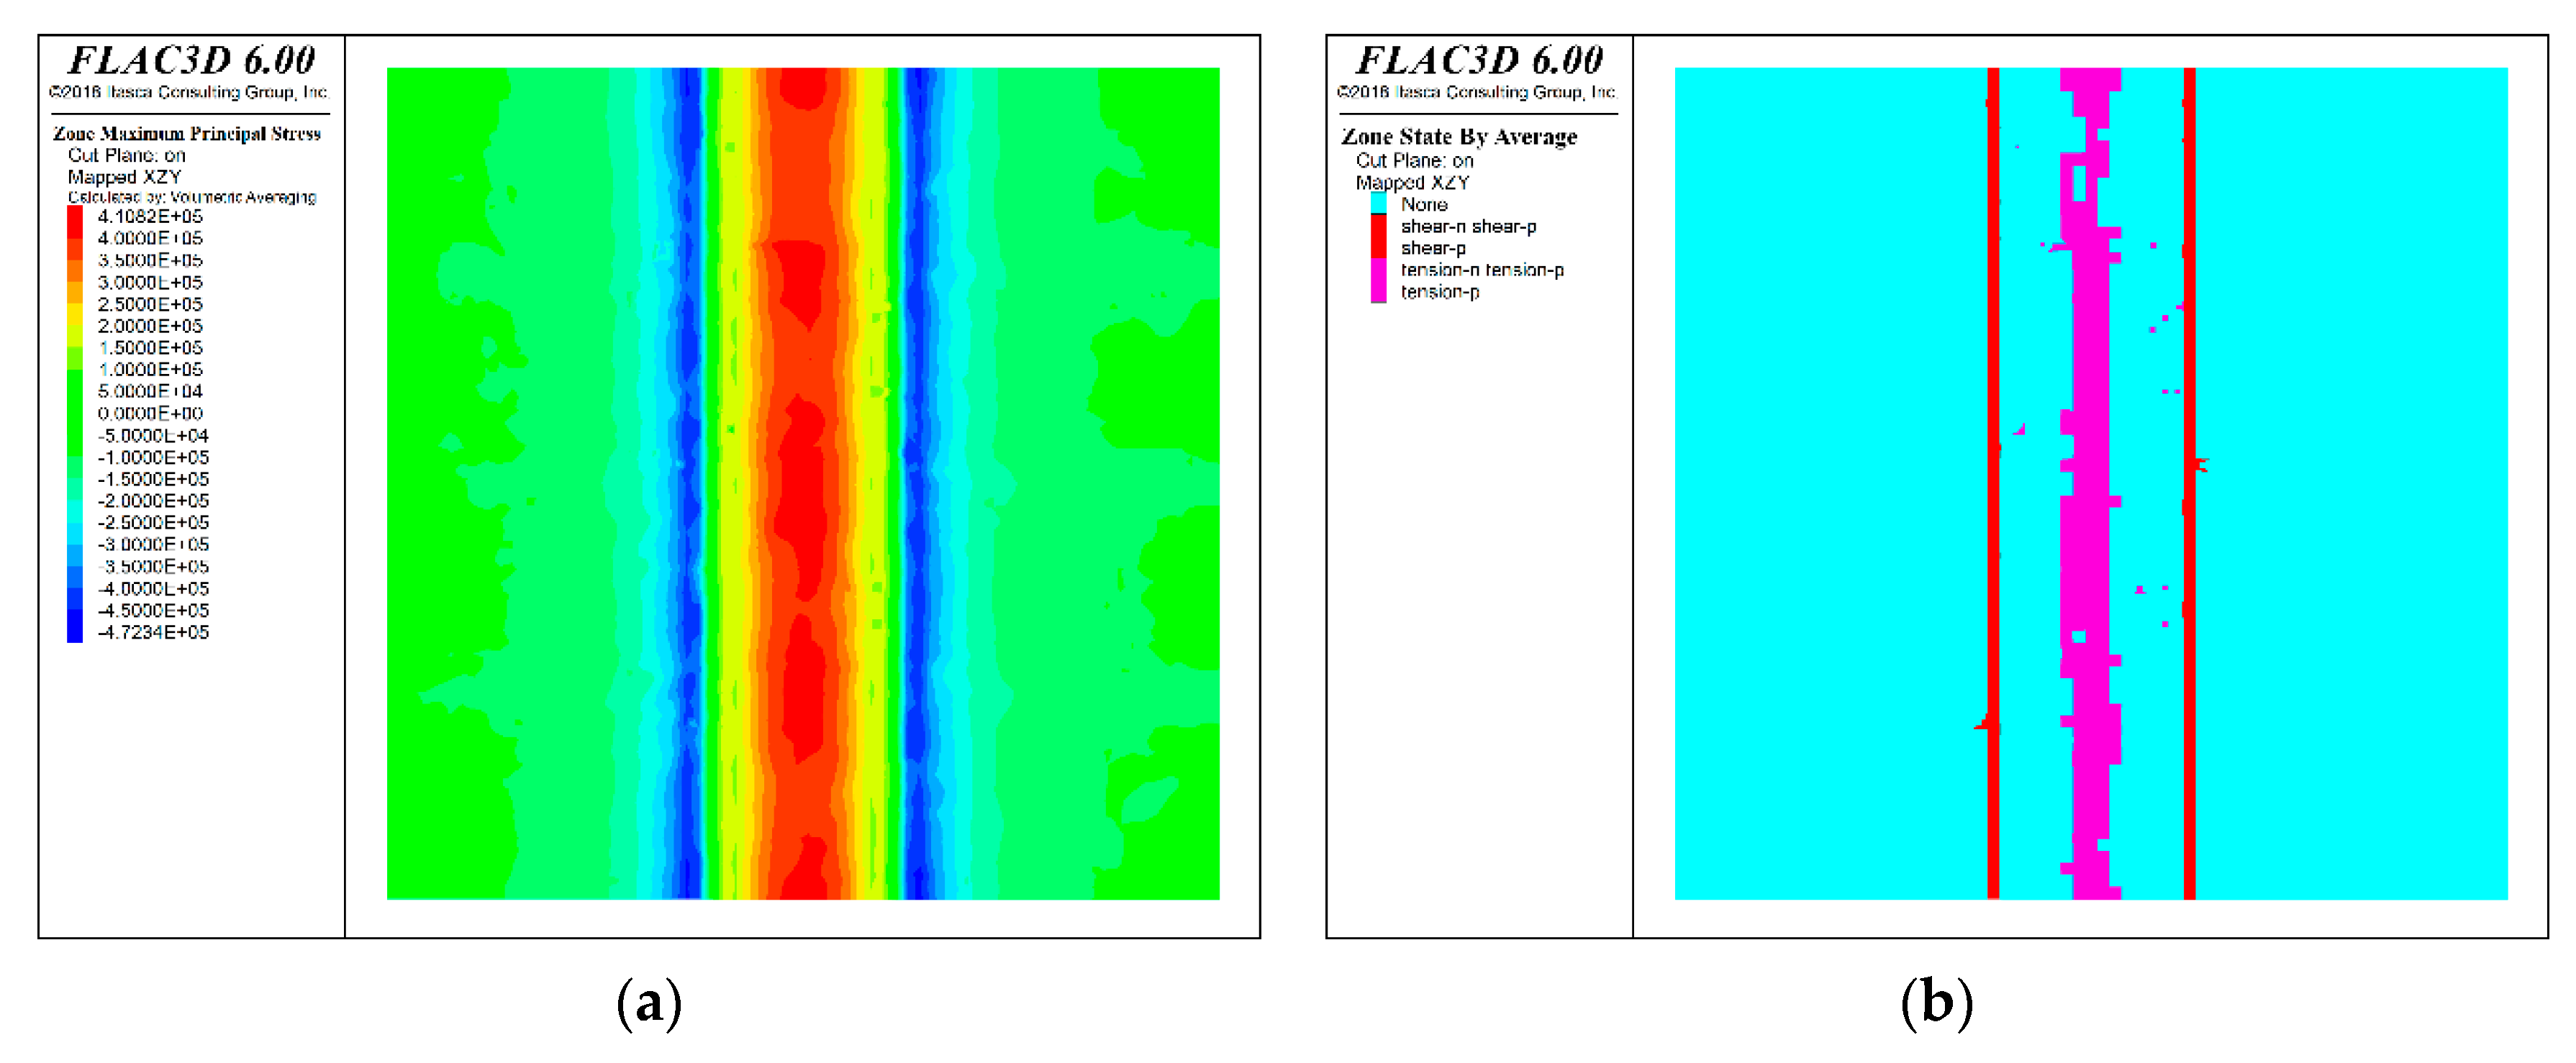
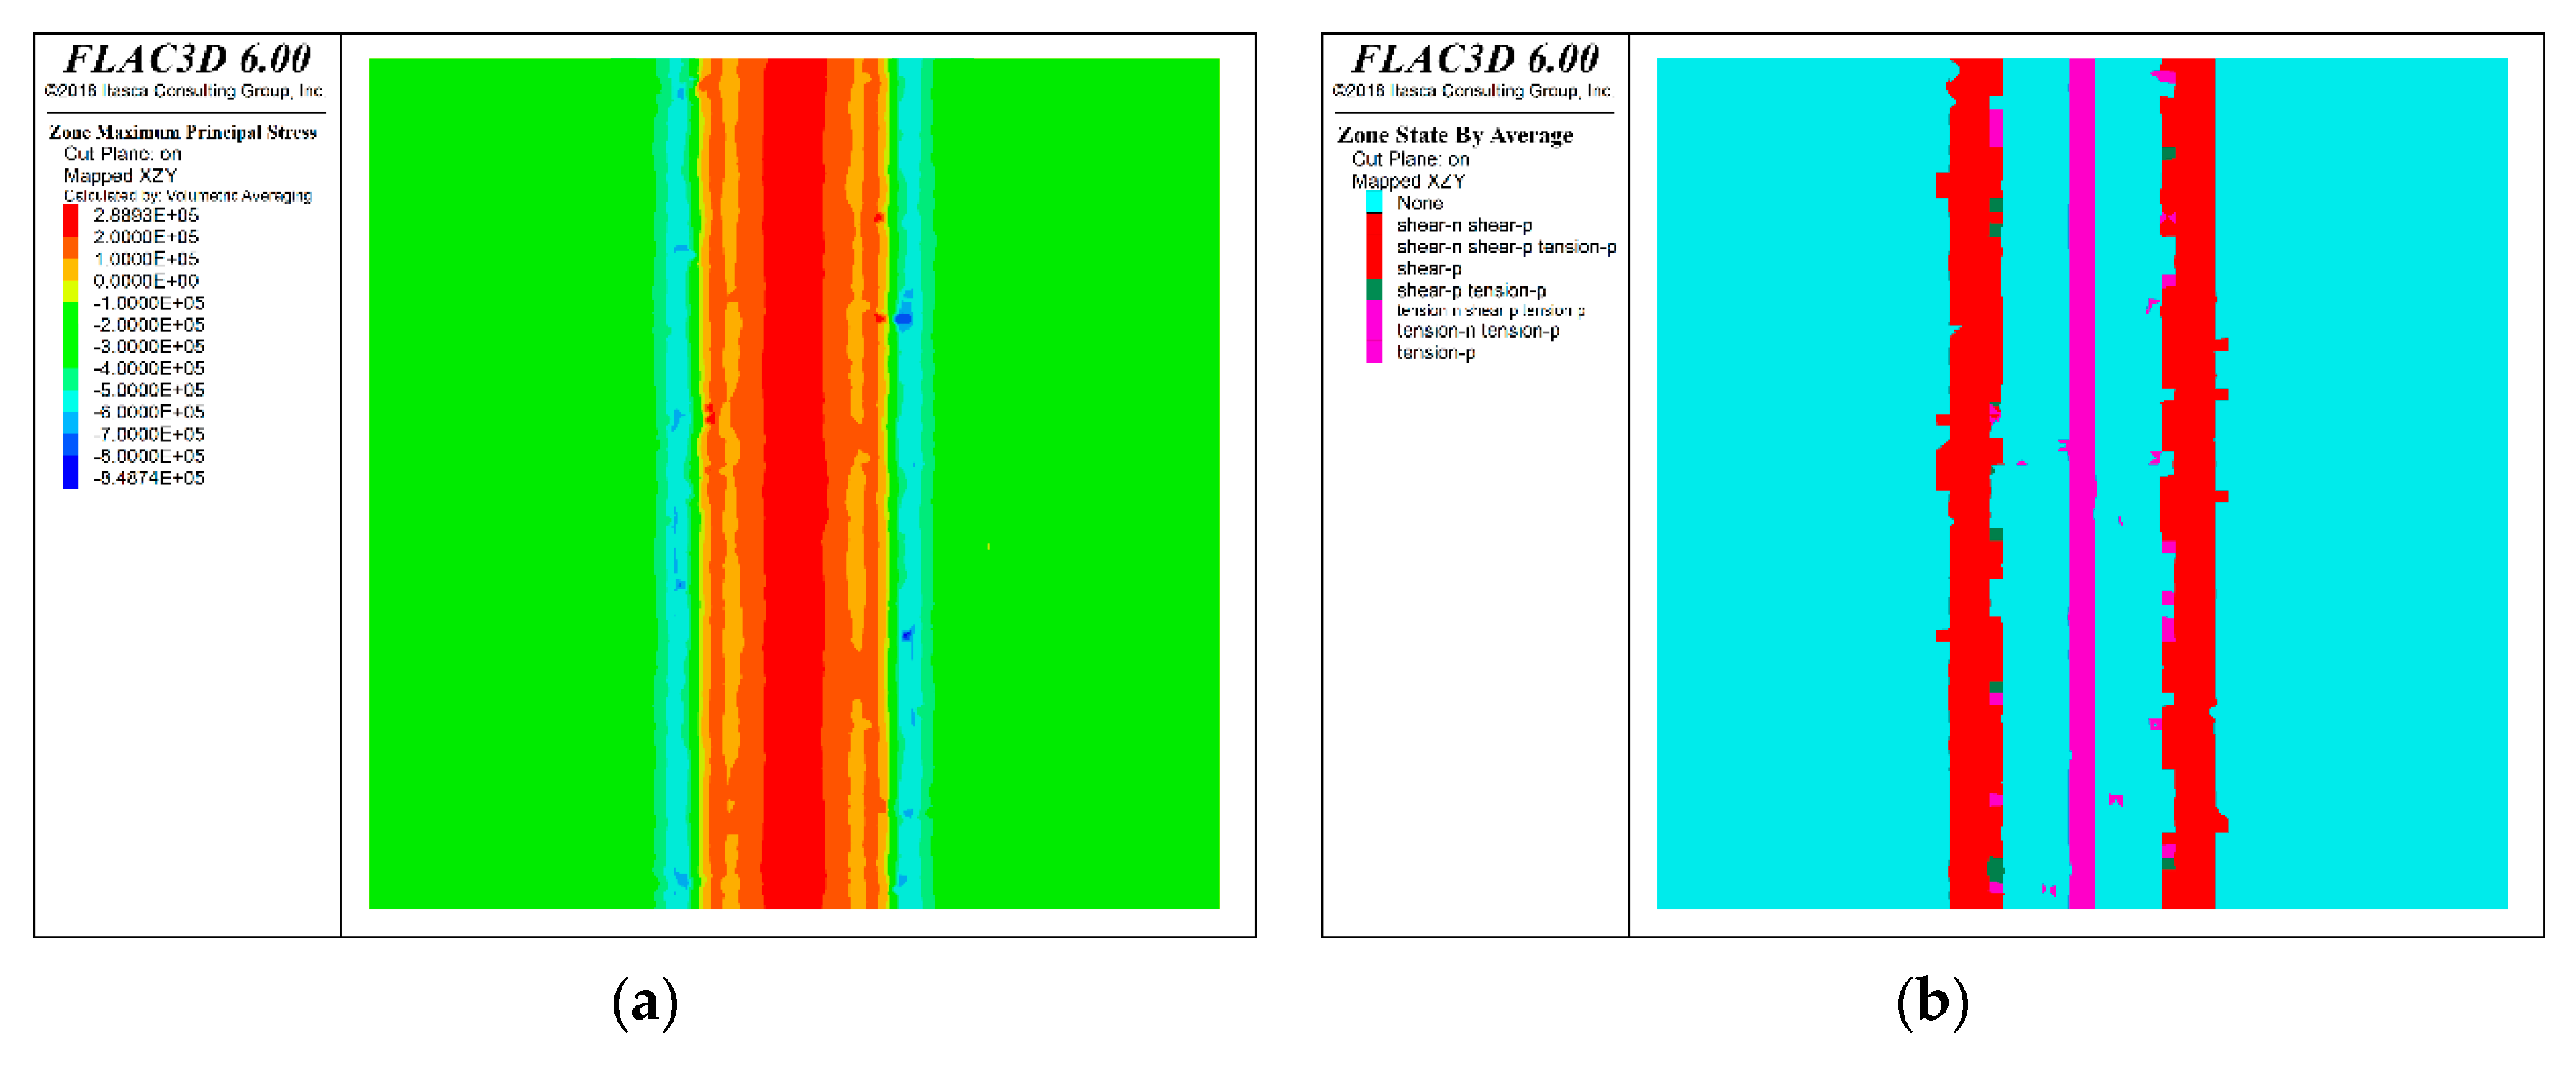
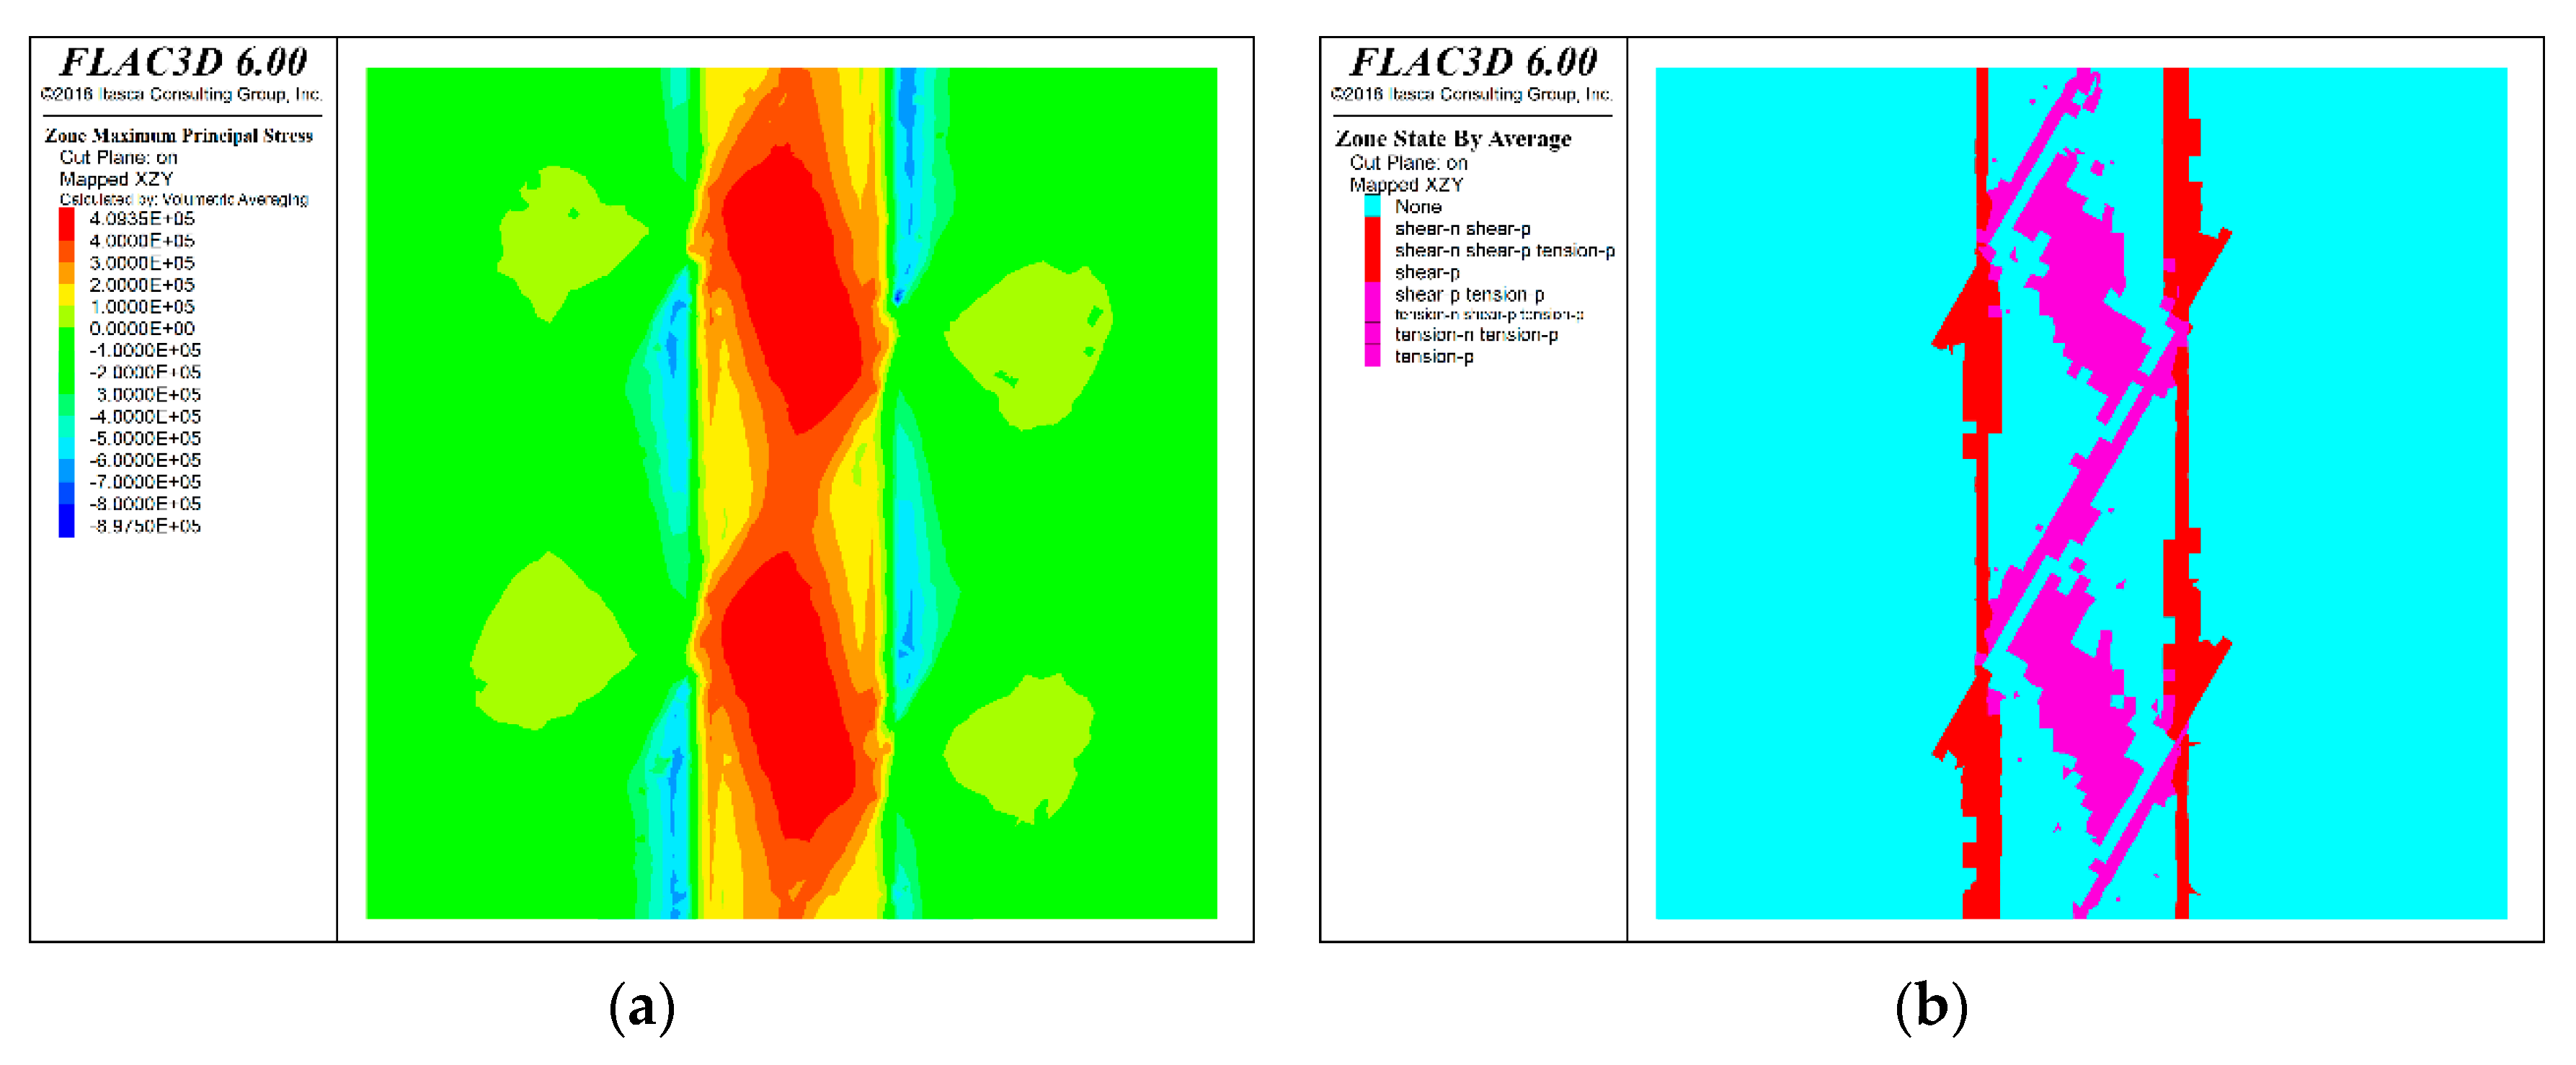
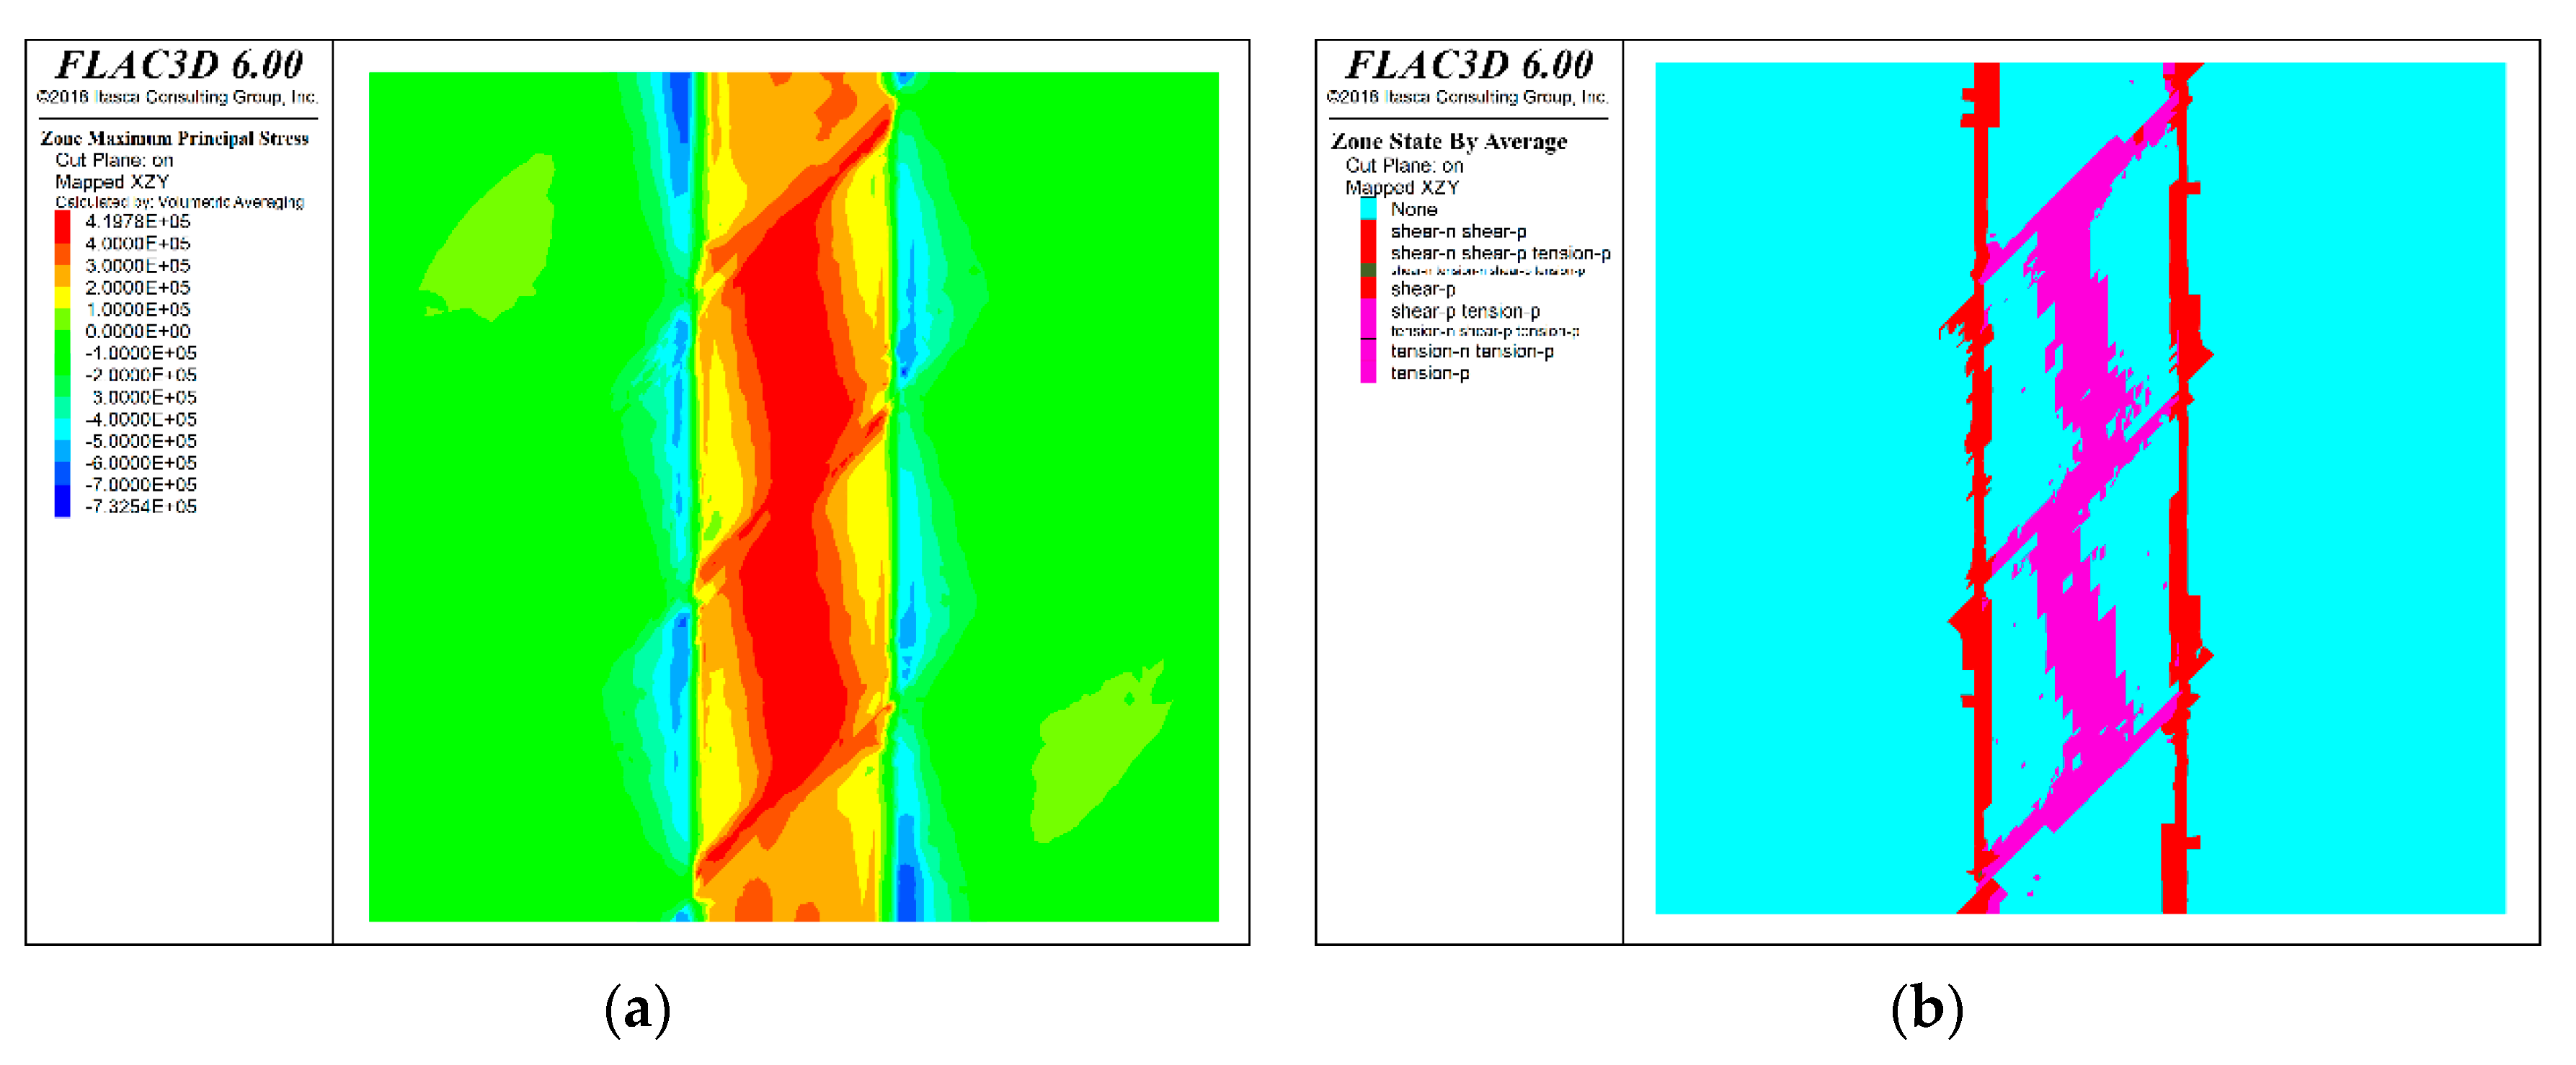
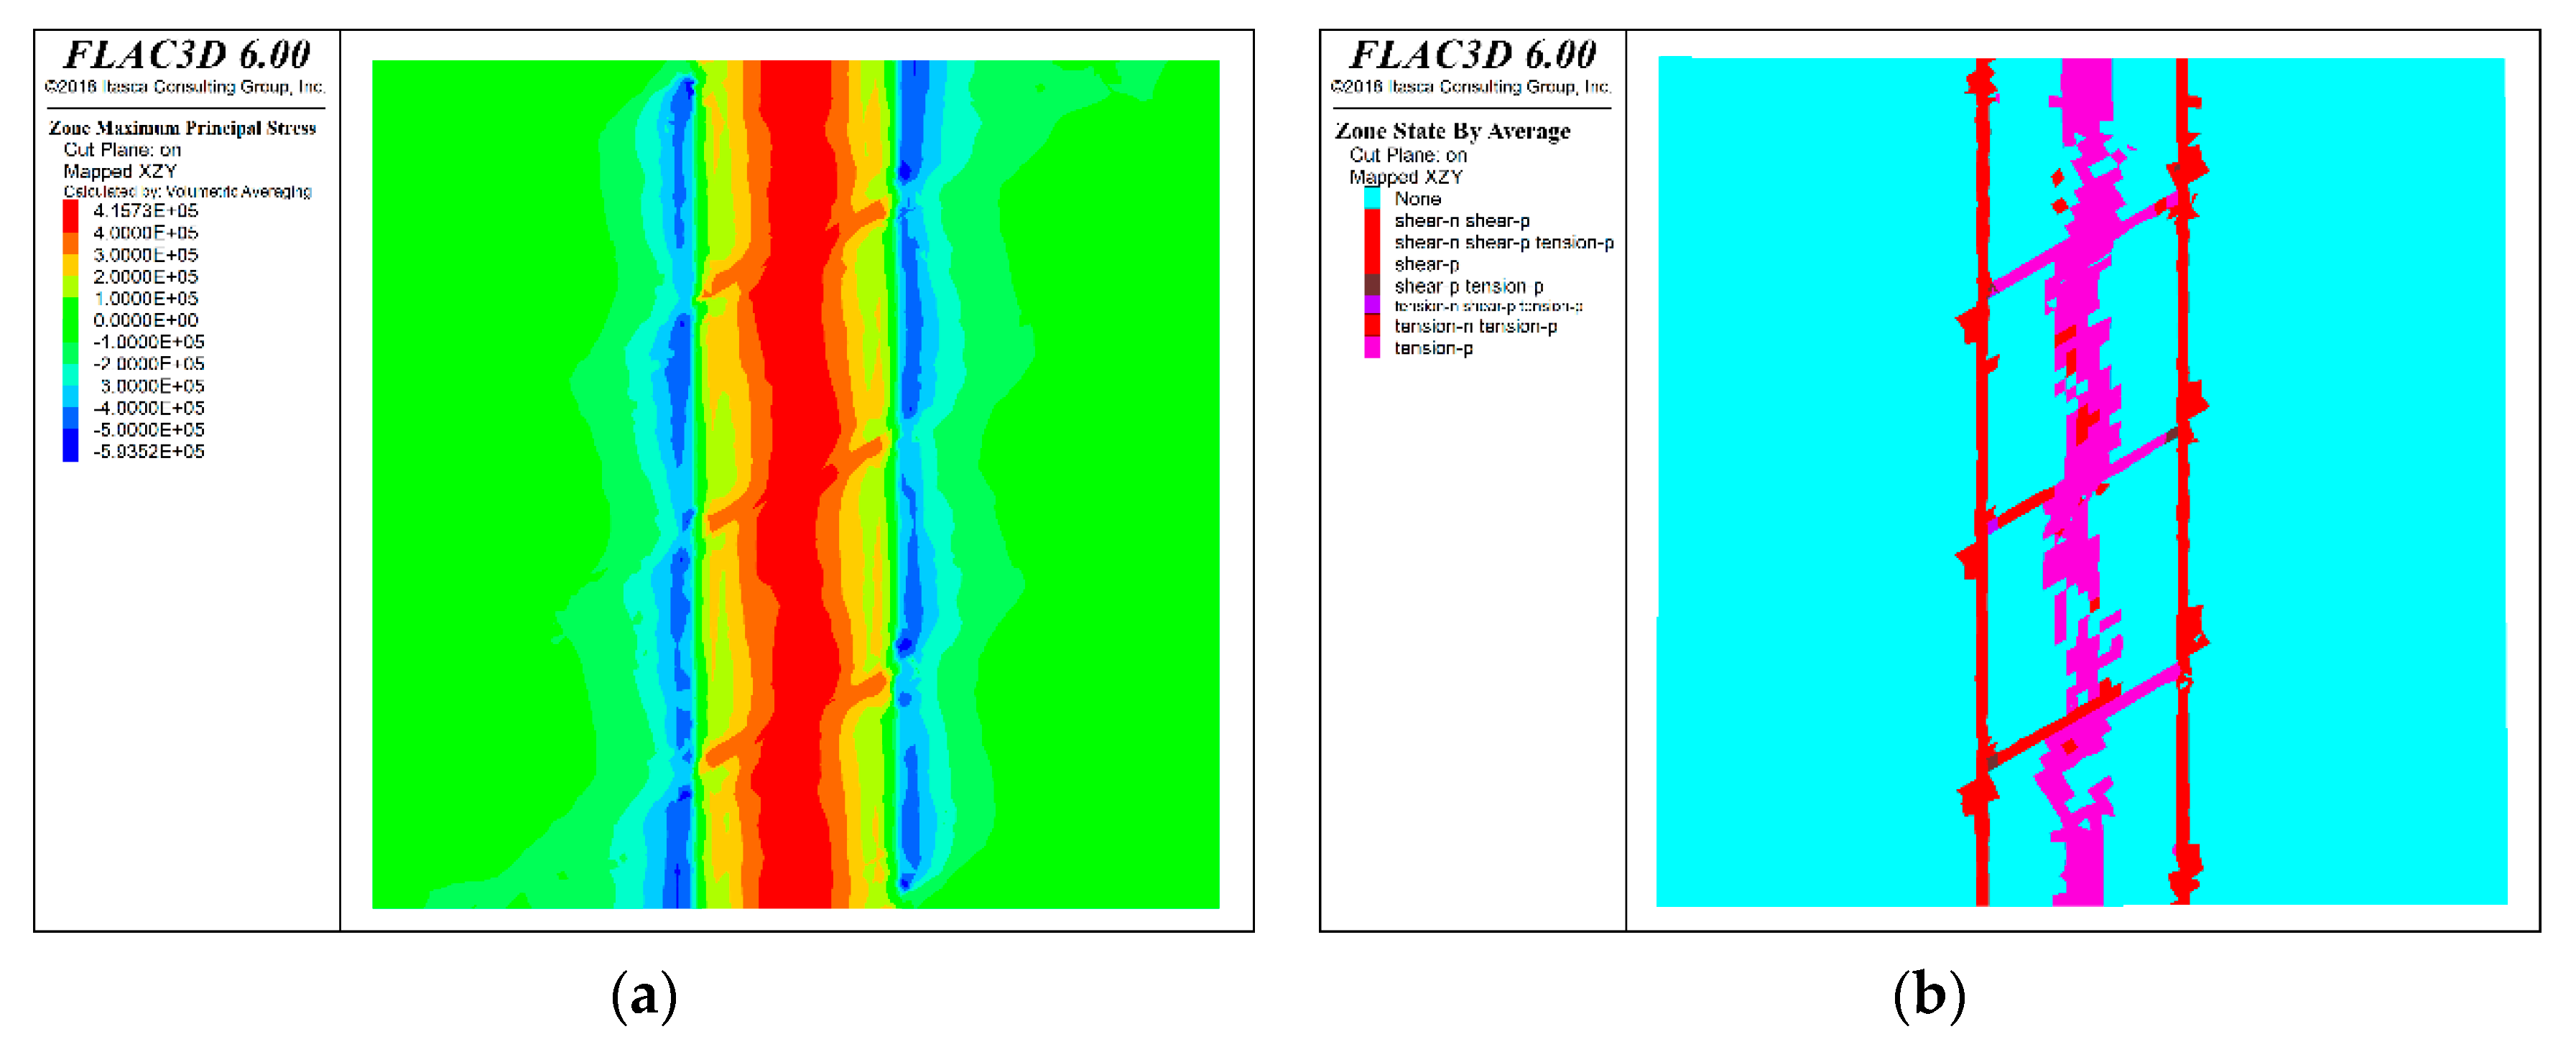
After the numerical model calculation is completed, the stress state nephogram and plastic zone distribution of the profile under the six mining route layout schemes are shown in the
Figure 9,
Figure 10,
Figure 11,
Figure 12,
Figure 13 and
Figure 14. Where the purple area in the plastic zone distribution represents the tensile plastic zone and the red area represents the shear plastic zone.
4. Discussion
By comparing and analyzing the stress state and plastic zone distribution of the filling roof after excavation of the mining approach, the optimum mechanical state of the filling roof after excavation of the mining approach is selected except scheme 1 (without weak filling surface).
According to the calculation results of the model, the mechanical behavior characteristics of the backfill roof after excavation of the mining approach under different schemes are consistent, which is mainly reflected in the tensile stress concentration and tension plastic zone of the roof directly above the mining approach, and the compressive stress concentration and shear plastic zone of the two sides of the mining approach. The existence of weak filling surface increases the distribution area and breadth of tension stress concentration area of filling roof to a certain extent. When the angle between upper and lower layered mining approaches is arranged at sharp angles, the tension stress concentration area of filling roof mostly appears near the weak filling surface, which has a certain partition effect on the tension stress concentration of filling roof. When the upper and lower layered mining approach is arranged vertically, the distribution characteristics of stress field of filling weak face have the least influence on the filling roof, and the distribution characteristics of stress field are closest to those of the plan without filling weak face. The distribution of the plastic zone of the filling weak face has the least influence on the filling body roof, and the distribution of the plastic zone is the closest to that of the plan without filling weak face.
By comparing and analyzing the stress field and plastic area distribution of the filling body roof of the six schemes, it can be seen that the mechanical state of the filling body roof is closest to that of the non-filling weak surface scheme after excavation of the upper and lower layered mining approach, and the mechanical state of the filling body roof is least affected by the filling weak surface. This arrangement scheme is the best one considering the filling weak surface arrangement scheme.
5. Conclusions
Due to the production process characteristics of the downward slicing and filling method, there are many vertical distribution weak filling surfaces in the roof of the filling body in the mining approach. Indoor test and numerical simulation are adopted, and numerical simulation comparison and analysis are carried out on different upper and lower layered mining approach layouts considering filling weak surface. The following conclusions are drawn.
- 1)
The mechanical strength of filling weak surface is much lower than that of surrounding filling body.
- 2)
The shear failure process of filling weak surface can be divided into two stages: strain softening stage and strain hardening stage. With an increase in normal load, the peak shear stress of a filled weak surface rises, and the strain migrates back to the peak shear stress.
- 3)
Comparing the numerical simulation results of various schemes, it can be seen that the upper and lower layered mining method is the best one when the arrangement is vertical. Thus, it is advised that the real engineering mining route arrangement be as similar to the vertical layout as possible. After mining approach excavation, the mechanical condition of the roof is most similar to the design without covering the weak surface.
This research has combined with the direct shear test of weak surface of filling body in the chamber, the stability of filling roof under different layered mining approaches is numerically simulated and analyzed by means of medium interface unit in FLAC3D. The optimal layered layout scheme of up-per and lower layers is determined, which can provide theoretical basis for mines adopting the downward horizontal layered cemented filling method.
Author Contributions
Conceptualization, K.Z. and N.L.; methodology, P.Z.; software, W.W. and N.L.; validation, N.L. and P.Z.; formal analysis, P.Z.; investigation, P.Z.; resources, K.Z.; data curation, W.W.; writing—original draft preparation, N.L.; writing—review and editing, N.L.; visualization, P.Z.; supervision, K.Z.; project administration, K.Z.; funding acquisition, K.Z. All authors have read and agreed to the published version of the manuscript.
Funding
This research was funded by Primary Research and Development Plan of Jiangxi Province, grant number 20212BBG71009. This research was funded by Jiangxi Postdoctoral scientific research project, grant number 2020KY39. This research was funded by Scientific and Technological Research Projects of Education Department of Jiangxi Province, grant number GJJ2200824.
Institutional Review Board Statement
Not applicable.
Informed Consent Statement
Not applicable.
Data Availability Statement
Not applicable.
Acknowledgments
The authors would like to acknowledge the Jiangxi University of Science and Technology.
Conflicts of Interest
The authors declare no conflict of interest.
References
- Feng, Y. The application and development of the mining method of downward slice and consolidated fill in the rock gold mining of underground mine. Gold 2000, 21, 19–22. [Google Scholar]
- Guo, L.; Liu, G.; Qinghai, M.; Chen, X. Research Progress on Mining with Backfill Technology of Underground Metalliferous Mine. Meitan Xuebao/J. China Coal Soc 2022, 2022, 1–22. [Google Scholar]
- Cao, H.; Gao, Q.; Zhang, X.; Guo, B. Research progress and development direction of filling cementing materials for filling mining in iron mines of China. Gels 2022, 8, 192. [Google Scholar] [CrossRef]
- Chen, X.; Li, D.; Wang, L. Experimental study on effect of spacing and inclination angle of joints on strength and deformation properties of rock masses under uniaxial compression. Chin. J. Geotech. Eng. 2014, 36, 2236–2245. [Google Scholar]
- Kong, X.X.; Liu, Q.S.; Zhao, Y.F.; Pan, Y.; Liu, J.P. Numerical simulation on the effect of joint orientation on rock fragmentation by TBM disc cutters. J. China Coal Soc. 2015, 40, 1257–1262. [Google Scholar]
- Zhou, Y.; Han, G.; Wu, S.C.; Hu, N.L. Meso failure mechanism of rock mass and slope with intermittent joints. Chin. J. Rock Mech. Eng. 2016, 35, 3878–3889. [Google Scholar]
- Liu, C.; Yuzong, L.I. Research progress in bolting mechanism and theories of fully grouted bolts in jointed rock masses. Chin. J. Rock Mech. Eng. 2018. [Google Scholar]
- Chang, Q.; Sun, X.; Dong, X.; Shao, S. Stability analysis of cemented paste backfill false roof in highwall mining: A case study. Desalin. Water Treat 2021, 219, 96–102. [Google Scholar] [CrossRef]
- Jiang, N.; Wang, C.; Pan, H.; Yin, D.; Ma, J. Modeling study on the influence of the strip filling mining sequence on mining-induced failure. Energy Sci. Eng. 2020, 8, 2239–2255. [Google Scholar] [CrossRef]
- Fu, Z.Y.; Gong, X.F.; Zhang, P.F.; Wang, C.W. Research on Optimization of a Solid Filling Mining Face Layout Based on a Combined Clamped Beam Model. Adv. Civ. Eng. 2021, 2021, 1–10. [Google Scholar]
- Zhong, M.; Yang, P.; Hu, Y.P. Study of Instability Mechanism and Roof Caving Mode of Cementing Filling Stope: The Case Study of a Nonferrous Metal Mine in China. Adv. Civ. Eng. 2022, 2022. [Google Scholar] [CrossRef]
- Sun, Q.; Zhang, J.; Zhou, N. Study and discussion of short-strip coal pillar recovery with cemented paste backfill. Int. J. Rock Mech. Min. Sci. 2018, 104, 147–155. [Google Scholar] [CrossRef]
- Qin, X.S.; Cao, H.; Wang, Z.X.; Zheng, Z.J. Analysis on safe thickness of the horizontal separation pillar in the upward horizontal slicing and filling method. IOP Conf. Ser. Earth Environ. Sci. 2021, 861, 052051. [Google Scholar] [CrossRef]
- Mitchell, R.J.; Olsen, R.S.; Smith, J.D. Model studies on cemented tailings used in mine backfill. Can. Geotech. J. 1982, 19, 14–28. [Google Scholar] [CrossRef]
- Cao, Z.Q.; Shao, H.; Gao, W.H.; Zhao, K. Parameters of cemented underhand heading stope based on FLAC3D analysis. Nonferrous Met. Sci. Eng. 2011, 2, 74–78. [Google Scholar]
- Gao, T.; Sun, W.; Li, Z.; Fan, K.; Jiang, M.; Cheng, H. Study on shear characteristics and failure mechanism of inclined layered backfill in mining solid waste utilization. Minerals 2022, 12, 1540. [Google Scholar] [CrossRef]
- Koupouli, N.J.; Belem, T.; Rivard, P.; Effenguet, H. Direct shear tests on cemented paste backfill–rock wall and cemented paste backfill–backfill interfaces. J. Rock Mech. Geotech. Eng. 2016, 8, 472–479. [Google Scholar] [CrossRef]
- Chen, T.; Zhao, K.; Yan, Y.; Zhou, Y.; He, Z.; Guo, L. Mechanical properties and acoustic emission response of cemented tailings backfill under variable angle shear. Constr. Build. Mater. 2022, 343, 128114. [Google Scholar] [CrossRef]
- Weilv, W.; Xu, W.; Jianpin, Z. Effect of inclined interface angle on shear strength and deformation response of cemented paste backfill-rock under triaxial compression. Constr. Build. Mater. 2021, 279, 122478. [Google Scholar] [CrossRef]
- Fang, K.; Fall, M. Effects of curing temperature on shear behavior of cemented paste backfill-rock interface. Int. J. Rock Mech. Min. Sci. 2018, 112, 184–192. [Google Scholar] [CrossRef]
- Fall, M.; Nasir, O. Mechanical behavior of the interface between cemented tailings backfill and retaining structures under shear loads. Geotech. Geol. Eng. 2010, 28, 779–790. [Google Scholar] [CrossRef]
- Xiu, Z.; Wang, S.; Ji, Y.; Wang, F.; Ren, F. Experimental study on the triaxial mechanical behaviors of the Cemented Paste Backfill: Effect of curing time, drainage conditions and curing temperature. J. Environ. Manag. 2022, 301, 113828. [Google Scholar] [CrossRef]
- Jafari, M.; Shahsavari, M.; Grabinsky, M. Drained triaxial compressive shear response of cemented paste backfill (CPB). Rock Mech. Rock Eng. 2021, 54, 3309–3325. [Google Scholar] [CrossRef]
- Xiu, Z.; Wang, S.; Ji, Y.; Wang, F.; Ren, F.; Nguyen, V.T. The effects of dry and wet rock surfaces on shear behavior of the interface between rock and cemented paste backfill. Powder Technol. 2021, 381, 324–337. [Google Scholar] [CrossRef]
- Wang, X.J.; Guo, P.; Huang, W.S.; Chen, Z.H.; Chen, Q.L.; Zhao, K. Stability calculation of backfill roof in downward roadway under multifactor influence. Rock Soil Mech. 2022, 43, 3453–3462. [Google Scholar]
- Peng, G.; Gaoyi, D.; Jingsong, C.; Zhou, C.; Manqing, L.; Weizhong, Z.; Yang, S. Study on Optimization of Stope Structural Parameters and Filling Scheme of Wawu Phosphate Mine in Yichang City, China. Front. Earth Sci. 2022, 10, 614. [Google Scholar] [CrossRef]
|
Disclaimer/Publisher’s Note: The statements, opinions and data contained in all publications are solely those of the individual author(s) and contributor(s) and not of MDPI and/or the editor(s). MDPI and/or the editor(s) disclaim responsibility for any injury to people or property resulting from any ideas, methods, instructions or products referred to in the content. |
© 2023 by the authors. Licensee MDPI, Basel, Switzerland. This article is an open access article distributed under the terms and conditions of the Creative Commons Attribution (CC BY) license (http://creativecommons.org/licenses/by/4.0/).
