1. Introduction
Infrared detection has the advantages of all-weather, high stealth, and strong anti-interference [
1,
2,
3,
4]. It can realize infrared dim small target detection under poor lighting. Therefore, infrared dim small target detection has important application significance in infrared surveillance systems, precise guidance systems, and aerospace. The Society of Photo-Optical Instrumentation Engineers (SPIE) defines small targets as targets that account for less than 0.15% of the image [
5]. The challenges and difficulties of infrared vehicle dim small target detection can be summarized in three aspects: First, due to the low pixel resolution and long imaging distance of the infrared image used in this article, the size of vehicle targets in the image is small, and the details of features such as edges and textures are blurred, making it difficult to extract target features. Second, infrared images have the problem of low signal-to-noise ratio under complex background conditions, making it difficult to distinguish targets from the background. Therefore, the accuracy of target detection is easily affected by environmental factors. Finally, compared to visible light images, the intra-class feature changes of infrared vehicle targets are significant (due to grayscale flipping and scale changes), while the inter-class feature differences are small.
Infrared dim small target detection algorithms can be divided into two categories [
6]: traditional detection algorithms based on the separation of target object and background, and deep learning detection algorithm based on feature extraction. In terms of traditional methods, Chen et al. [
7] used local contrast difference to detect small targets, but the algorithm is not suitable for detecting dim targets, and it takes a long time to calculate the contrast. Moreover, Hou et al. [
8] used a method based on the human visual system to analyze the logarithmic spectrum of the dataset to extract the spectral residual of the image in the spectral domain, but the algorithm could not suppress the background clutter well. Traditional detection algorithms rely on manual feature extraction, these methods have defects in generalization ability in different scenarios.
The algorithms based on deep learning can be divided into two categories: two-stage [
9,
10,
11,
12] and one-stage [
13,
14,
15,
16]. In terms of two-stage algorithm, Fast RCNN [
10] trains the entire network in a multi-task way, and Faster RCNN [
11] optimizes the generation method of candidate boxes to improve the detection speed. The accuracy of two-stage algorithm performs well, but there are some shortcomings in the detection speed, and it is difficult to achieve real-time computing on the platform with weak computing power. In respect of one-stage algorithm, YOLO Series [
13,
17,
18,
19,
20,
21,
22] can realize the regression of candidate boxes and classification of categories. The use of the attention mechanism in deep learning has improved the detection results. Besides, Dai et al. [
23] proposed to add an improved attention mechanism SE module to YOLOv5 to improve the feature extraction ability and detection efficiency of the algorithm. SSD [
24] adopts multi-scale feature extraction to adapt to the detection of multi-size targets. The one-stage method has advantage in detection speed while obtaining high accuracy.
When the target detection algorithm based on depth learning is applied to infrared dim small target detection, appropriate adjustments and improvements should be made. For this demand, this paper proposed a real-time detection algorithm for infrared dim small target detection based on YOLOv5, which can improve the average detection accuracy while maintaining the detection speed and model parameters.
The main contributions in this paper is constructed as follows:
Section 2 provides an introduction to the original model of YOLOv5, as well as a detailed description of the multiscale YOLOv5-AFAM network constructed in this paper to address difficulties encountered in the dim and small target detection process. In
Section 3, to demonstrate the effectiveness of our model, the impact of each improvement on the detection effect is verified from multiple perspectives by conducting rigorous ablation experiments on the target detection dataset constructed in this paper for infrared dim vehicles, combined with evaluation metrics.
Section 4 concludes this study and provides outlooks.
Therefore, the main contributions of this study lie in four aspects:
In this paper, a target detection dataset for infrared dim and small vehicles is constructed in the empirical analysis, which covers 9976 infrared images from 39 scenes with different city, terrain, and shooting angle conditions, and the average size of the target is 0.041% of the background.
To address the problems of the low signal-to-noise ratio of weak infrared targets and susceptibility to background interference, this study proposes the Adaptive Fusion Attention Module (AFAM), which makes the neural network feature extraction focus on the target region, as can be seen from the results in
Section 2, compared with the original YOLOv5 model, mAP@0.5, mAP@0.5:0.95 and recall are improved compared with the original YOLOv5 model.
To solve the problems of the low contrast of weak targets and the large scale variance of targets, this study optimizes the multiscale fusion structure, which enables the network to adapt to the detection of small targets with diverse scales and accurately extract the features of each class of targets.
Given the low resolution and blurred contours of infrared images, this study improves the downsampling method by incorporating Maxpool in convolutional downsampling, which reduces the computational effort while preserving texture information.
2. Methods
2.1. Overview of YOLOv5
YOLOv5 proposes four network structures of different sizes [
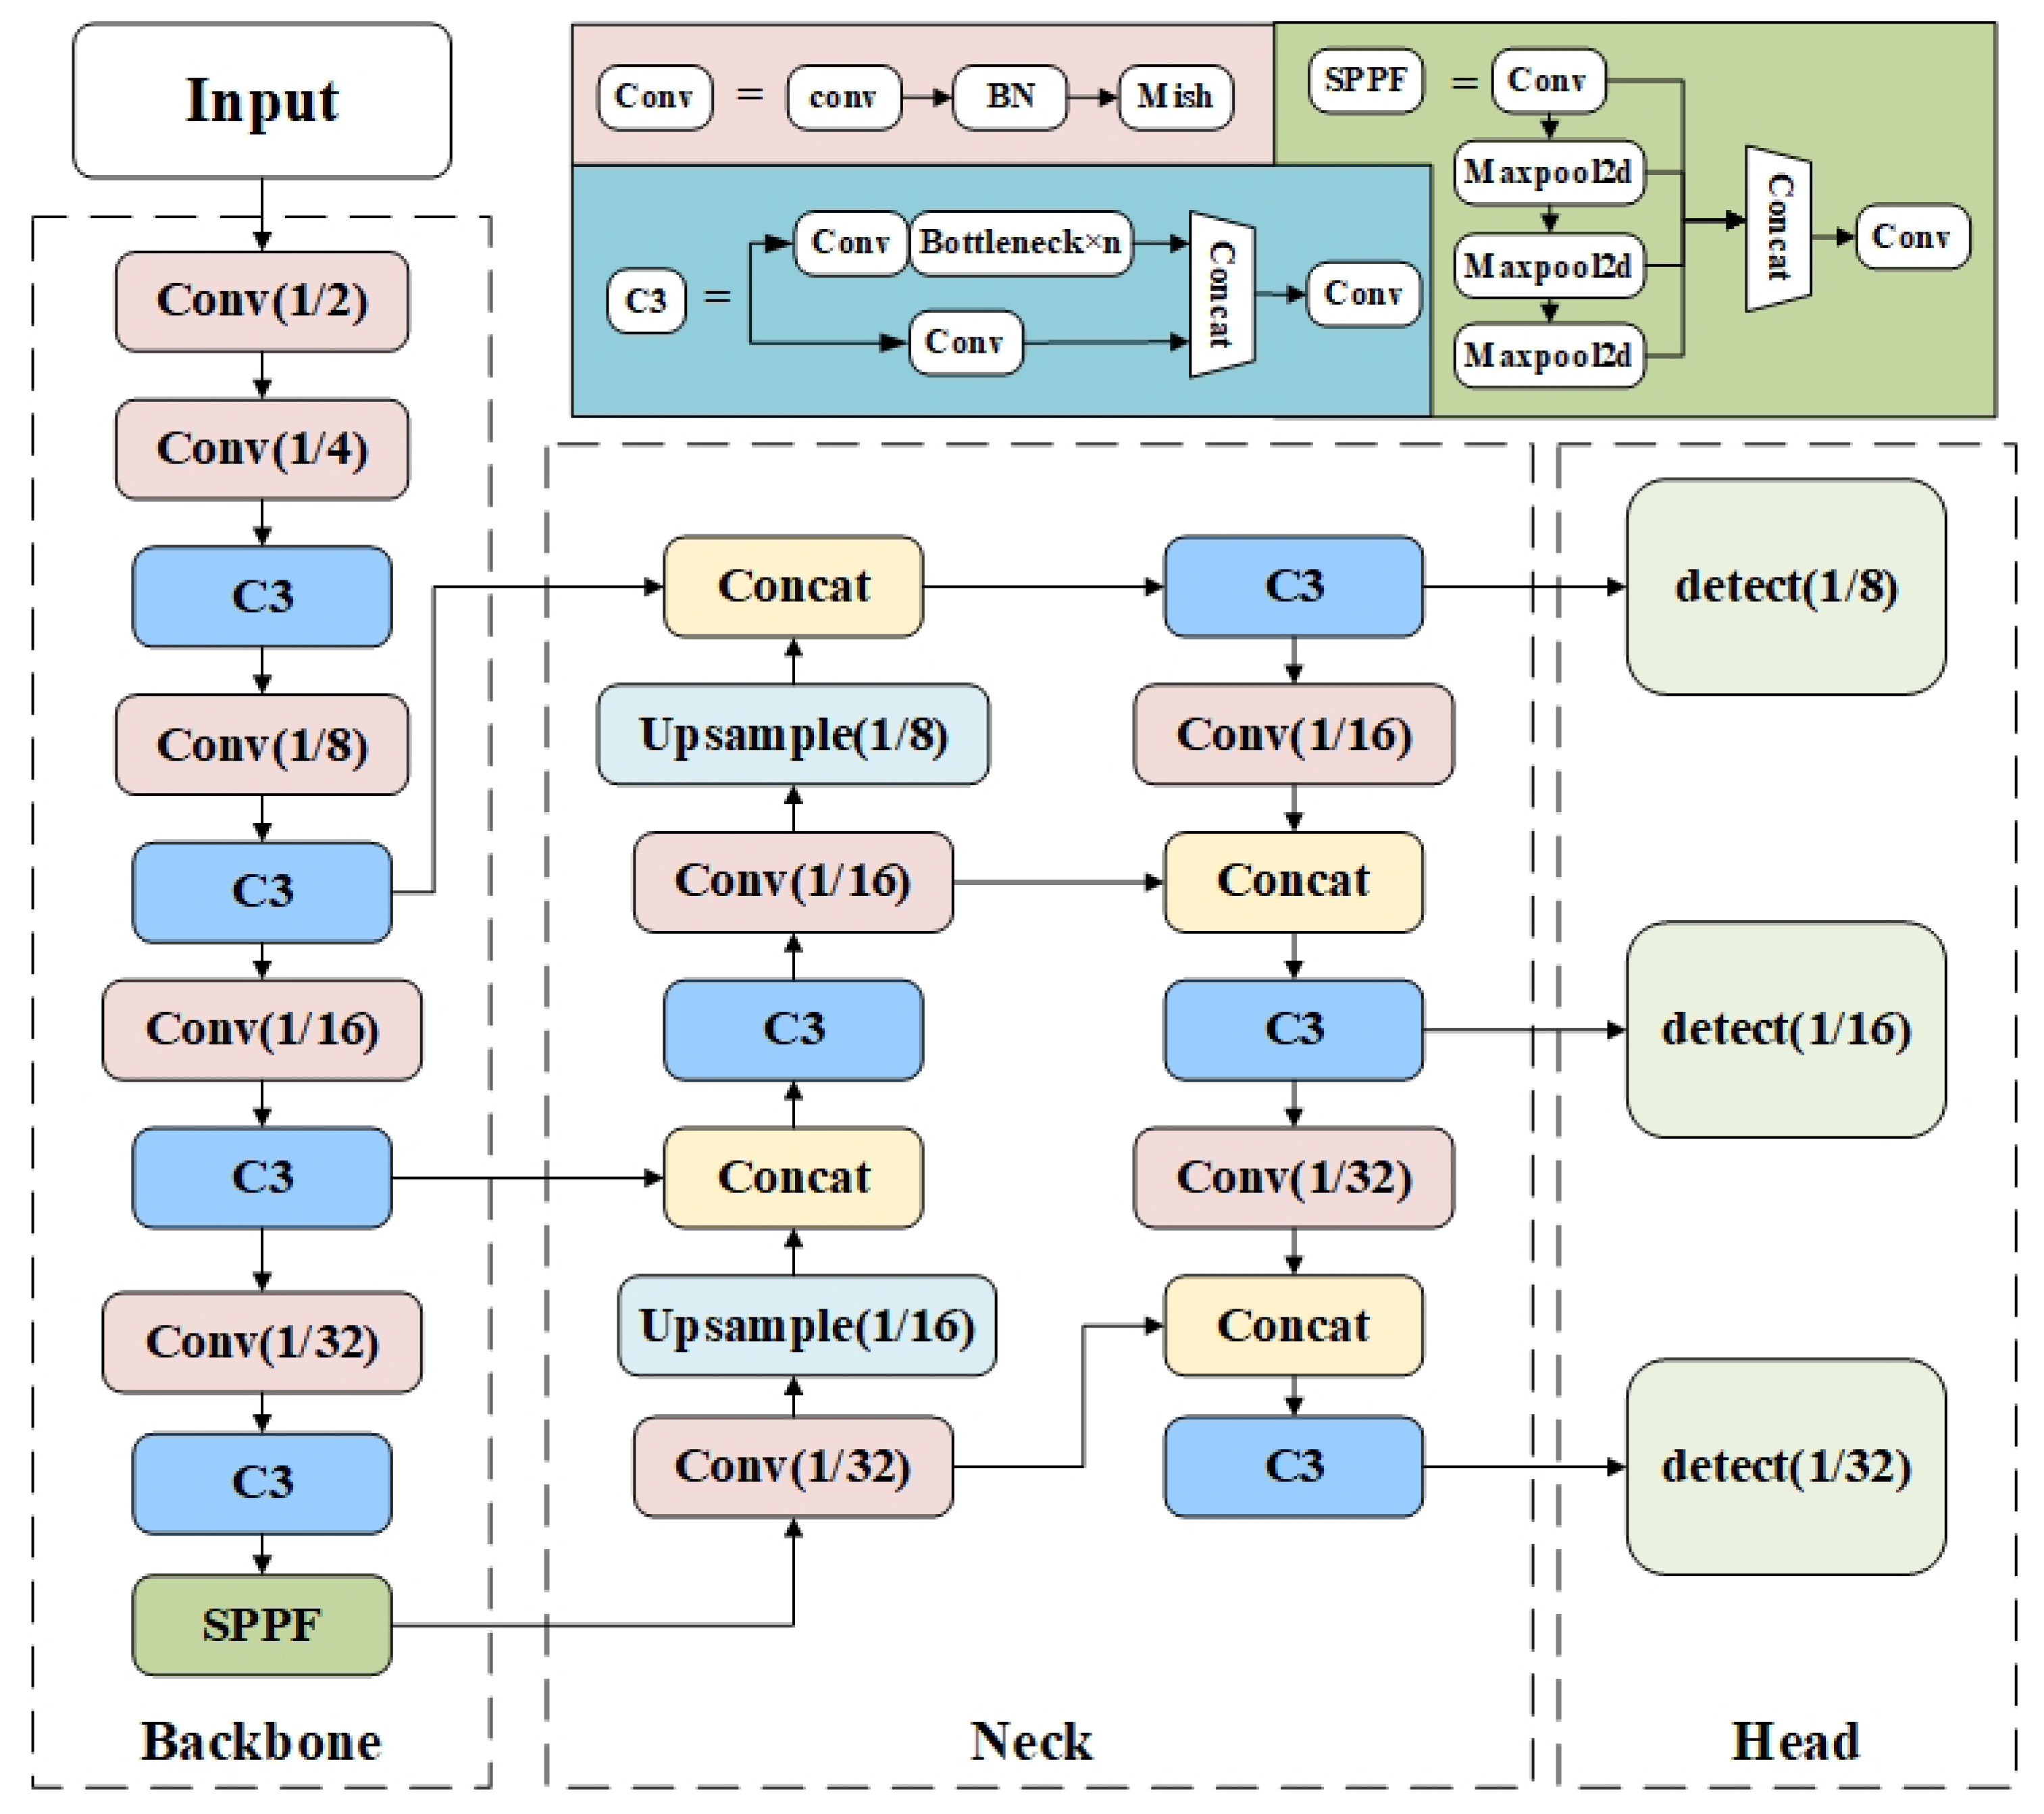
25], including YOLOv5s, YOLOv5m, YOLOv5l, and YOLOv5x. They have the same overall structure, but the depth and width of the CSPNet differ from each other. The YOLOv5 network consists of the backbone network, neck network, and head network. As shown in
Figure 1, the backbone network mainly consists of the Conv module, the C3 module, and the SPPF module. The neck network adopts a feature pyramid network [
26] structure to achieve multiscale target detection in a top-to-bottom manner. The Head network consists of three target detectors. It uses a grid-based anchor to perform target detection on feature maps of different scales. As the feature map becomes larger, it will contain more contour and geometric information, facilitating the detection of small targets.
In this paper, we follow YOLOv5 to tackle target detection task for infrared dim and small vehicle targets. Since the target is weak in brightness, small in size, inconspicuous in texture information and susceptible to noise interference [
28], the network needs to increase the contextual information of the target and increase the receptive field to improve the performance of detection. Based on this analysis, we propose multiscale YOLOv5-AFAM with three improvements based on YOLOv5. (1) Propose the AFAM attention mechanism. (2) Improve the feature fusion scale. (3) Optimize the downsampling strategy.
2.2. Multiscale YOLOv5-AFAM
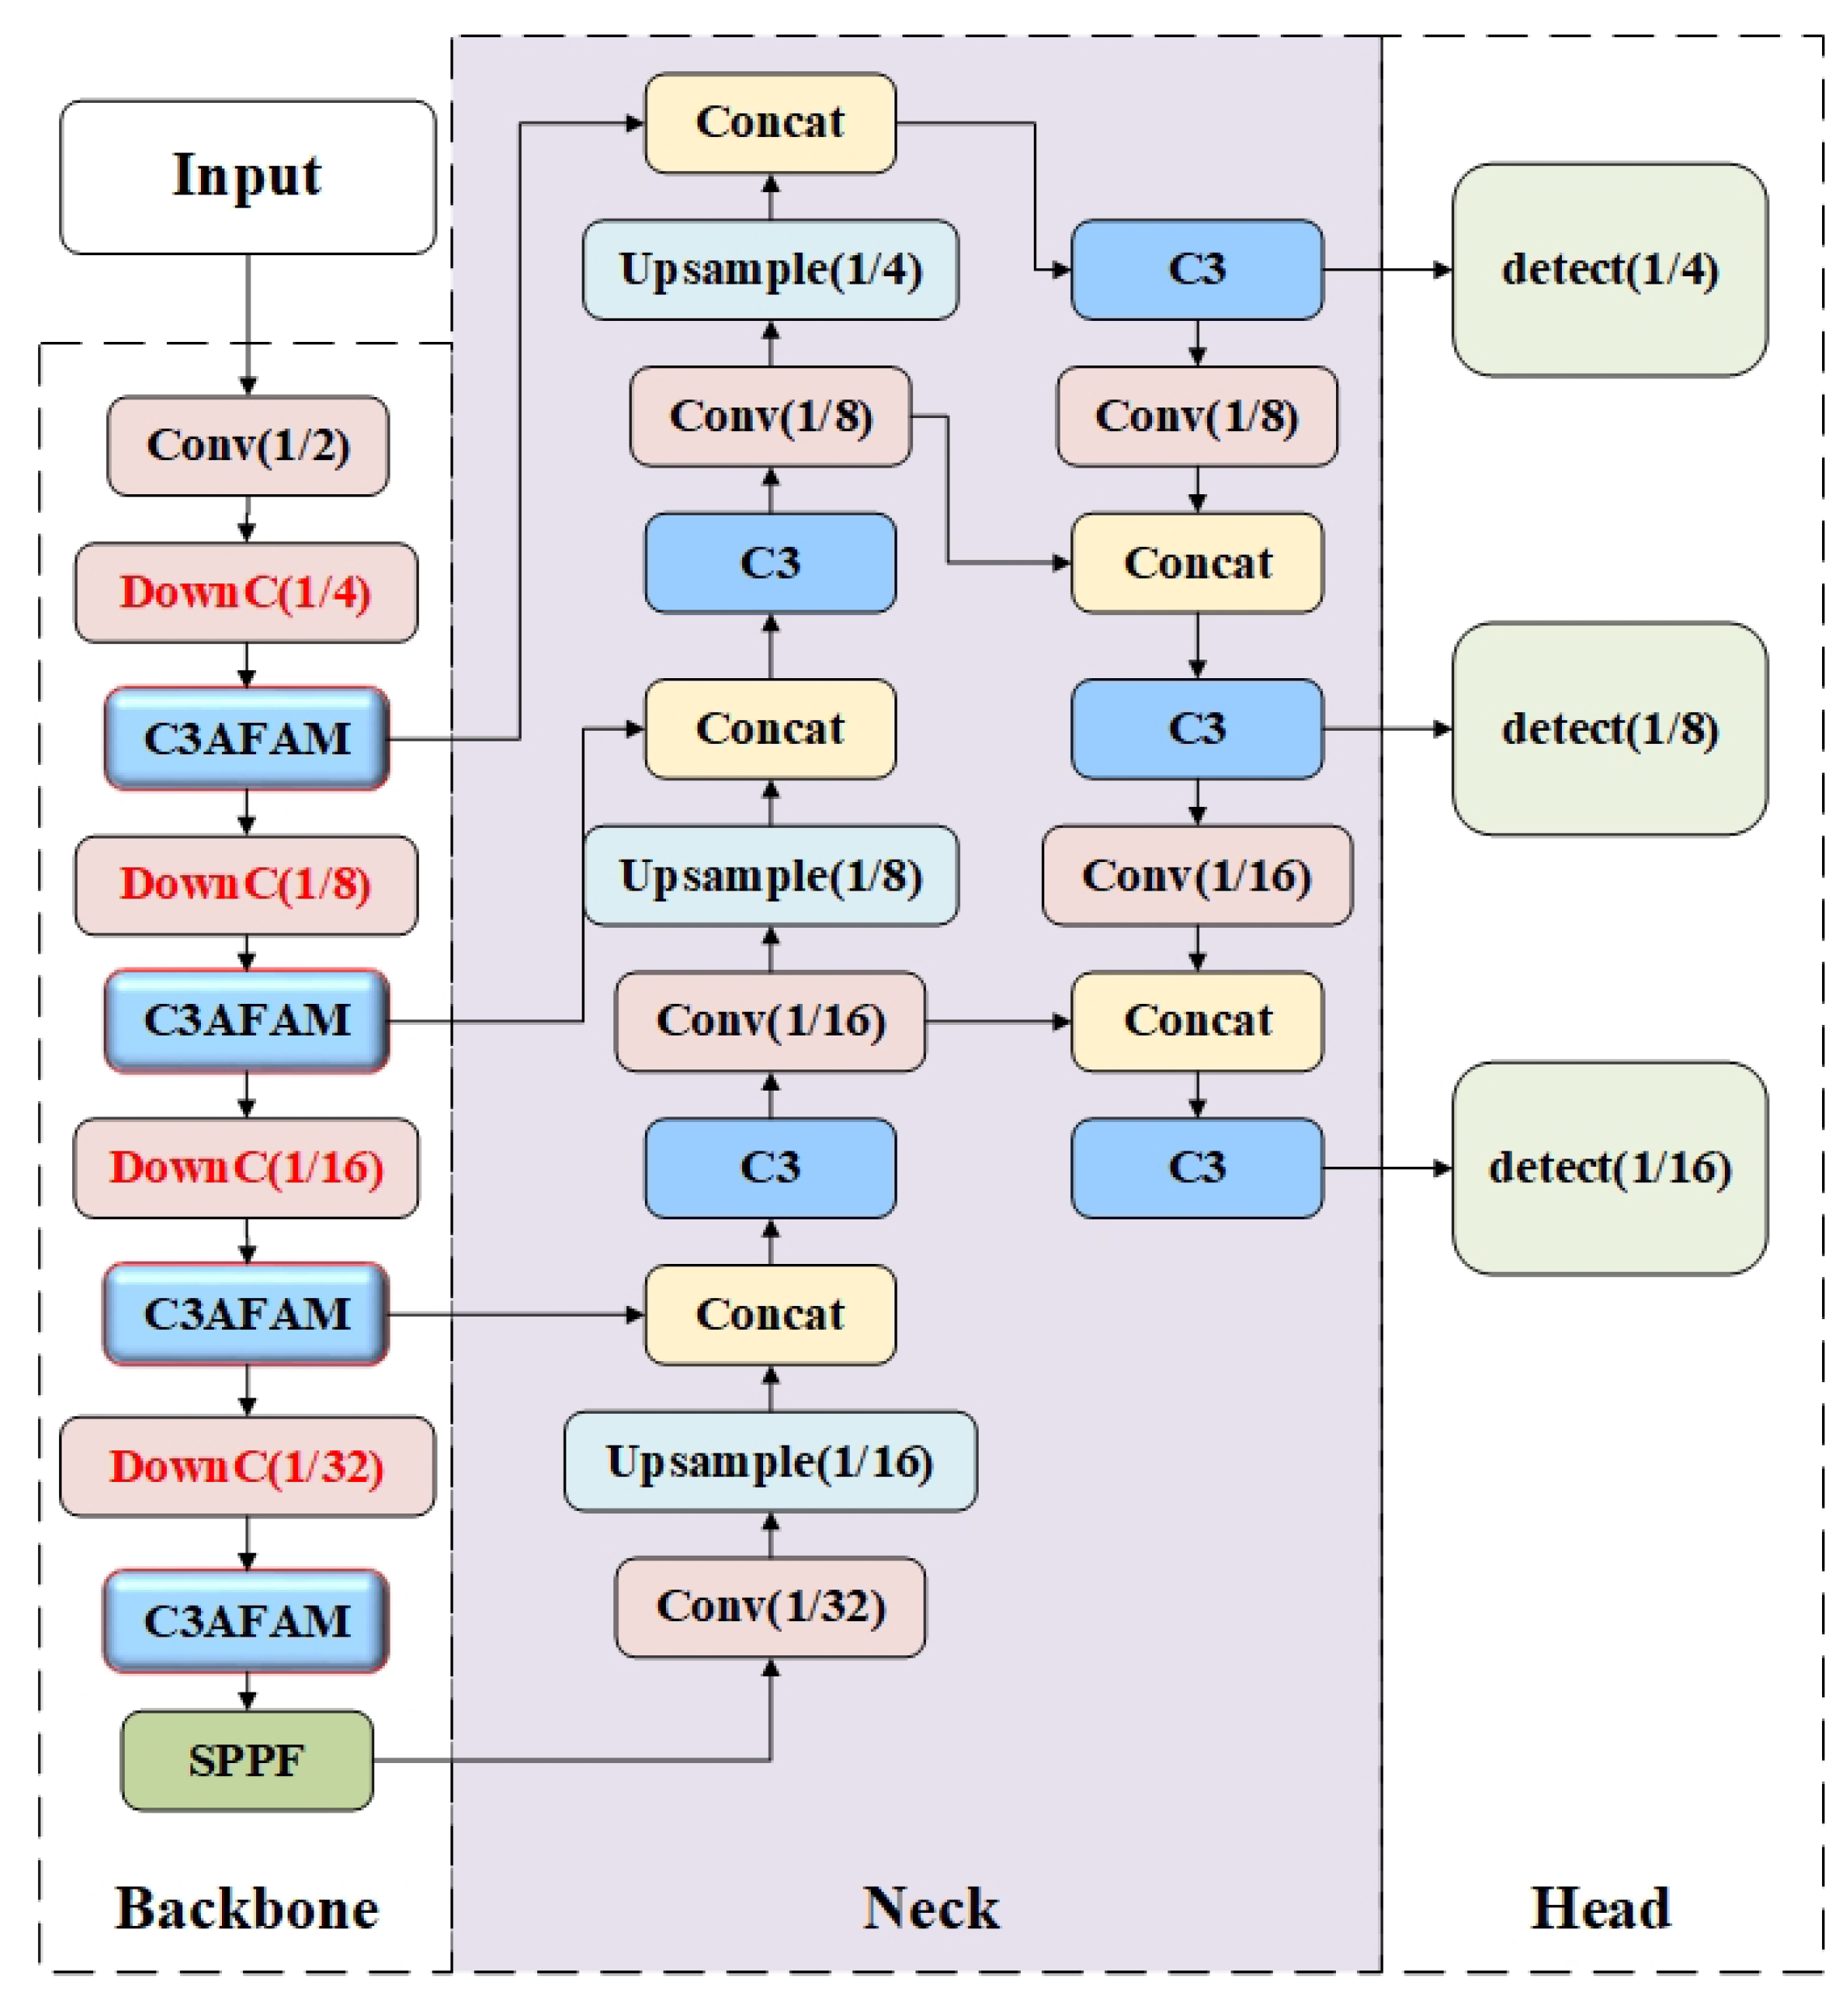
As shown in
Figure 2, we first add the AFAM attention mechanism to the C3 modules of the backbone network. Then, we change the original down-sampling convolution modules of the backbone network into DownC downsampling module. Finally, the 4x, 8x, and 16x downsampling features are used for fusion and sent to the detection head for prediction.
2.2.1. Adaptive Fusion Attention Module
To address the challenges of low signal-to-noise ratio and susceptibility to background interference for infrared vehicle targets, we propose AFAM, which can be flexibly plugged in YOLOv5 network. Specifically, AFAM utilizes the adaptive receptive field to enhance the fusion of context information. It achieves performance improvement while reducing computational complexity, making the network suitable for detecting small and weak targets with blurred contours and complex backgrounds, and reducing false positives and missed detection.
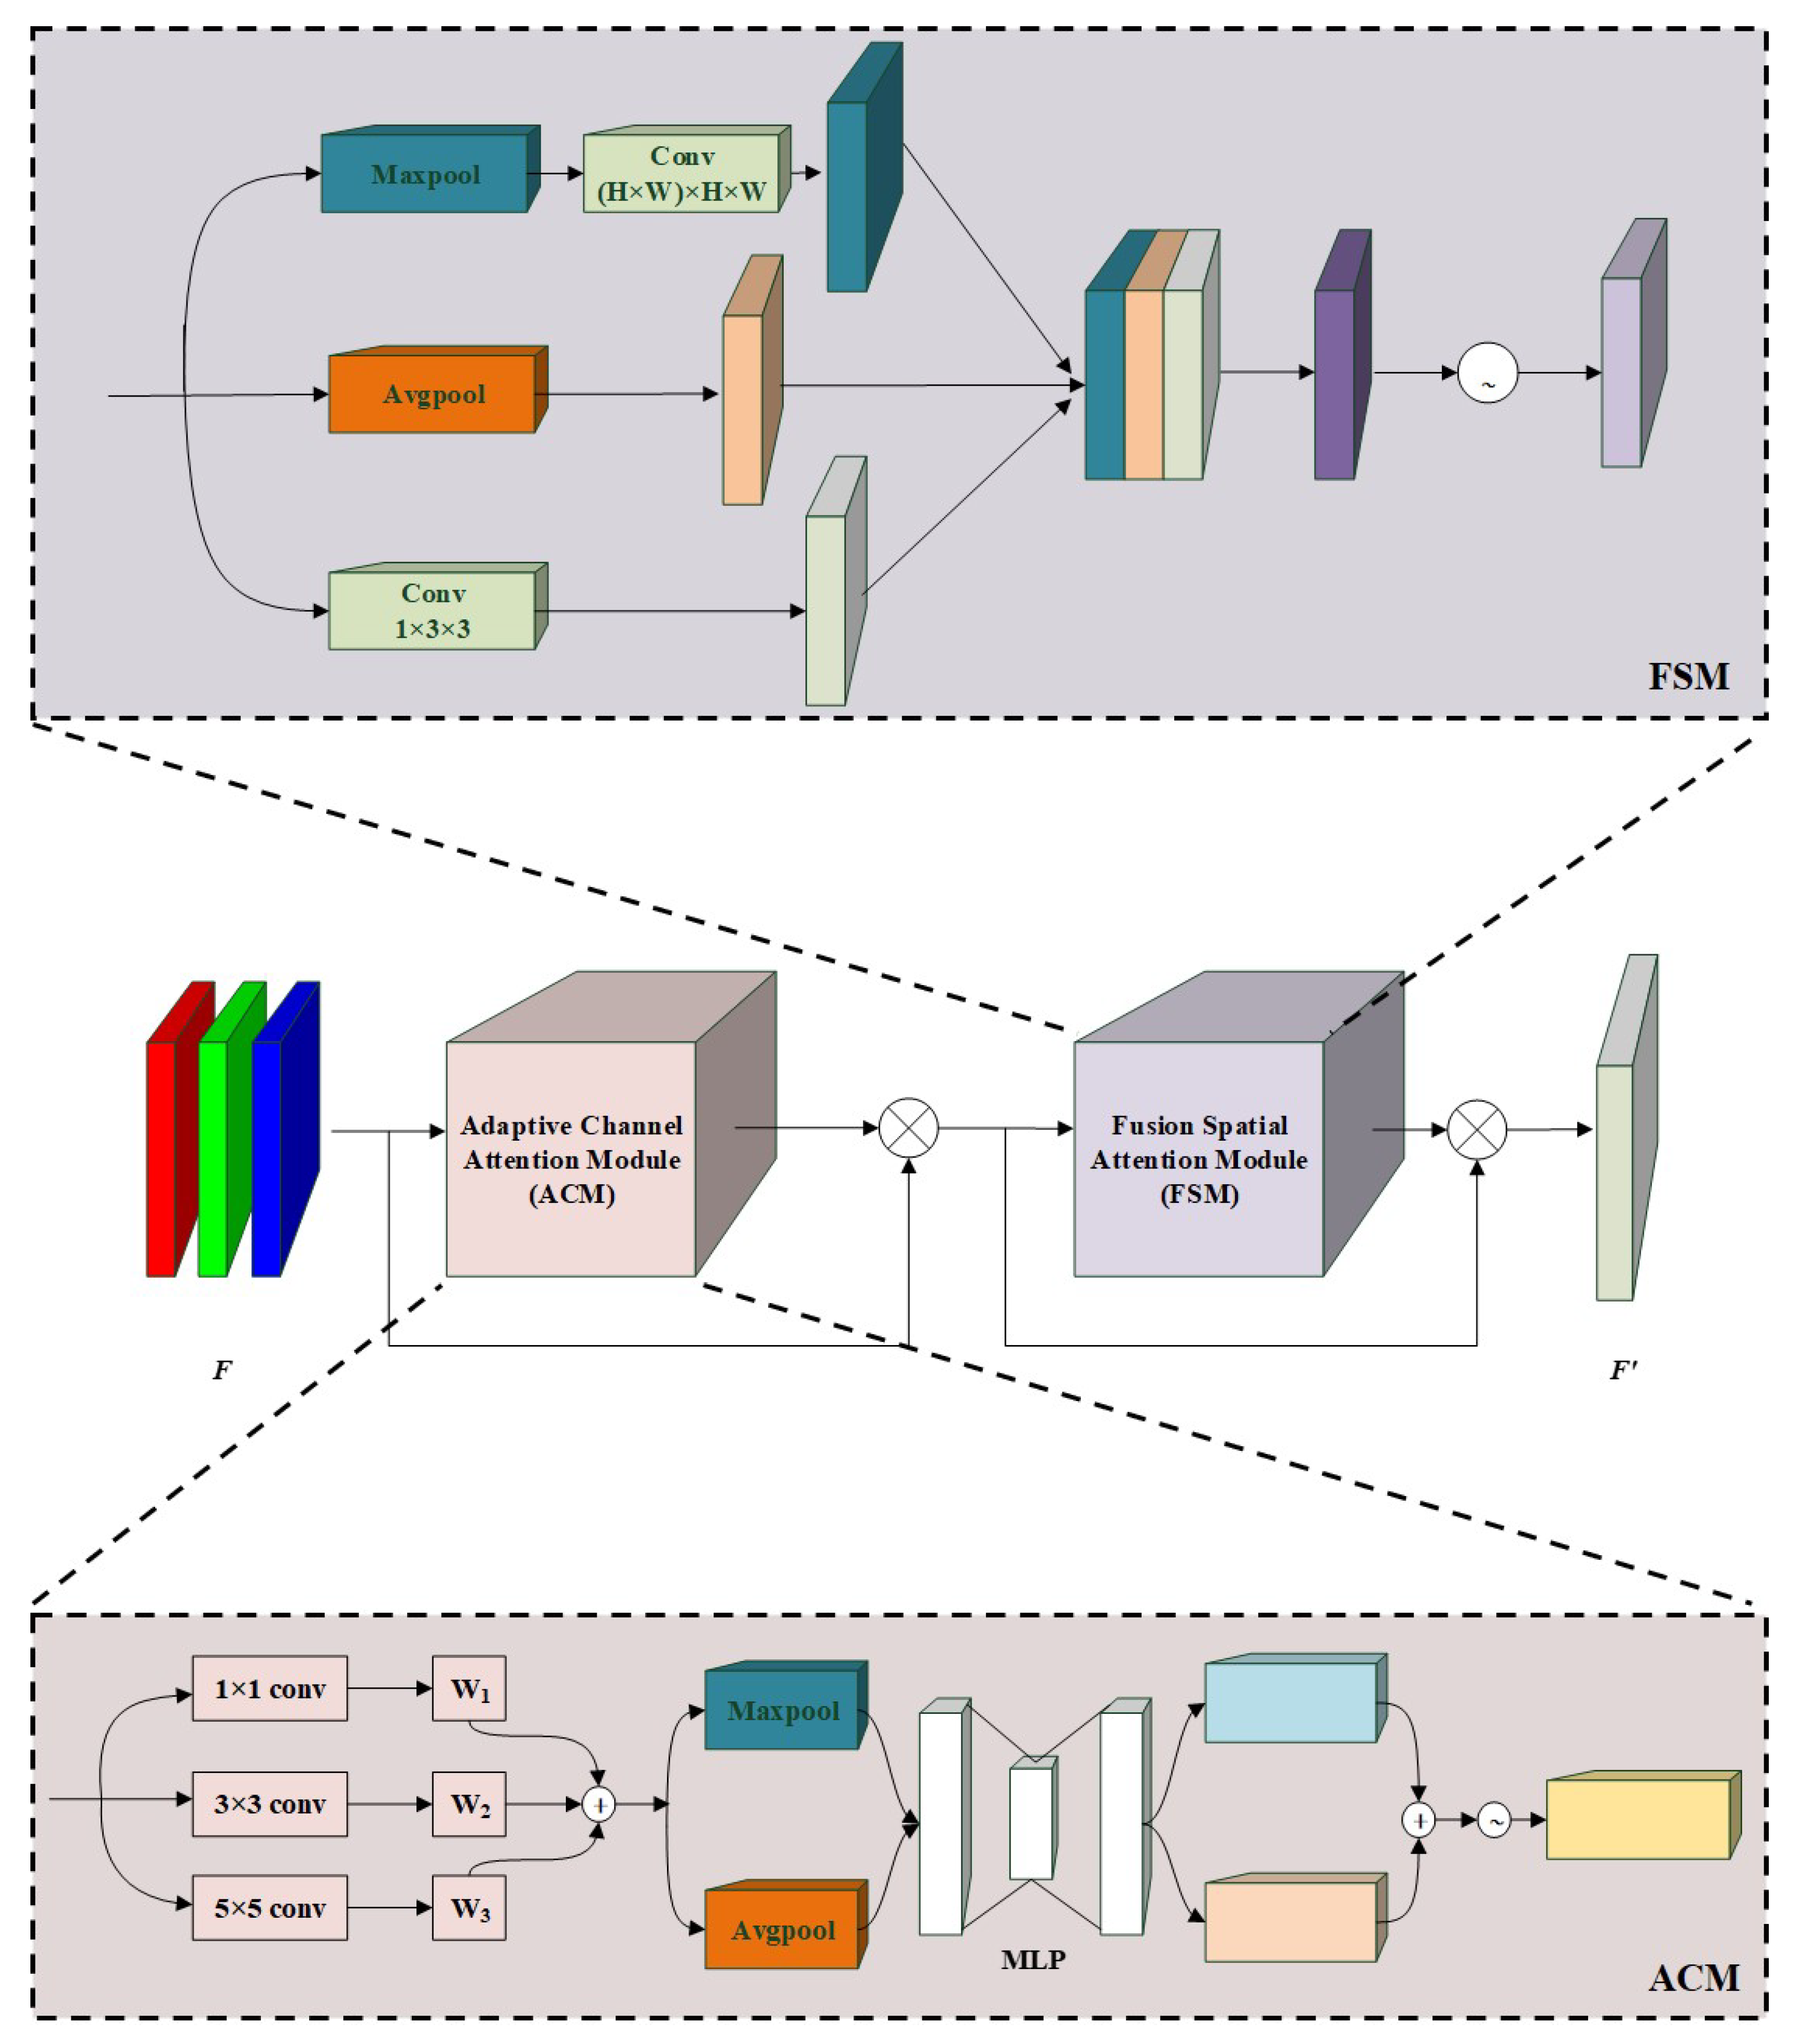
The AFAM module consists of the Adaptive Receptive Field Channel Attention Module (ACM) and the Fusion Spatial Attention Module (FSM). The former focuses on the region of interest in the input data and aggregates the features of each channel to increase the context information around the target to further expand the receptive field. The latter focuses on determining the location of the target, compressing the spatial dimension while fusing the context information around the target. In this paper, they are added to the C3 module of the YOLOv5 backbone network. As shown in
Figure 3, a feature map
is first served as input of the network. Then input features are then sequentially fed into ACM and FSM to involve channel-wise and spatial-wise attention information. The mathematical formulation is shown in Equation (
1).
where
and
respectively indicates the ACM and FSM Module. ⊗ denotes the element-wise multiplication operation.
Adaptive Receptive Field Channel Attention Module. As shown in
Figure 3, ACM first performs a parallel convolution operation with three convolution kernels of size
,
and
respectively. Then, output features perform weighted summation operation to generate fused feature (
). This fusion process ensures that the network can expand and adjust the receptive field in an adaptive manner. Equation (
2) shows the above process. Next, the fused feature respectively passes through Avgpool and Maxpool operations to generate the corresponding contextual descriptors. Finally, MLP (multilayer perceptron) is employed for generating the final adaptive receptive field channel attention feature. Equation (
3) shows the above process.
where
denotes the convolution operation with three types of kernel size.
is the
weight factor corresponding to each convolution operation.
denotes
operation.
and
denote the average-pooling and max-pooling operation respectively.
Fusion Spatial Attention Module. In AFAM, we first design ACM to involve channel-wise attention information into feature. Then, we further design FSM to explore spatial-wise attention information. As shown in
Figure 3, Feature map (
) generated by the ACM first passes through three branches in parallel to extract features with different information (formulated in Equation (
4)). Second, three output features are concatenated together and refined by the Conv module (
). Third, output feature map is normalized utilizing the Sigmoid function to obtain the FSM features
. Equation (
5) expresses the second and third process.
where
denotes the convolution operation with a kernel size of
.
,
and
correspond to the features after
,
and the
convolutional layer respectively.
2.2.2. Improved Downsampling Module
Due to the low resolution of infrared images and the blurring of targets, it becomes difficult to extract features such as edges and textures of targets. Our proposed downsampling module (DownC) in YOLOv5 can effectively expand the receptive field, reduce the number of parameters to be learned, and prevent overfitting during training.
To preserve more information while extracting the feature map, we design DownC to improve the downsampling method. Our designing follows two principles. (1) Maxpool Layer can reduce computational burden and preserve the texture features better. (2) A learnable convolution layer with a corresponding step size can retain more information.
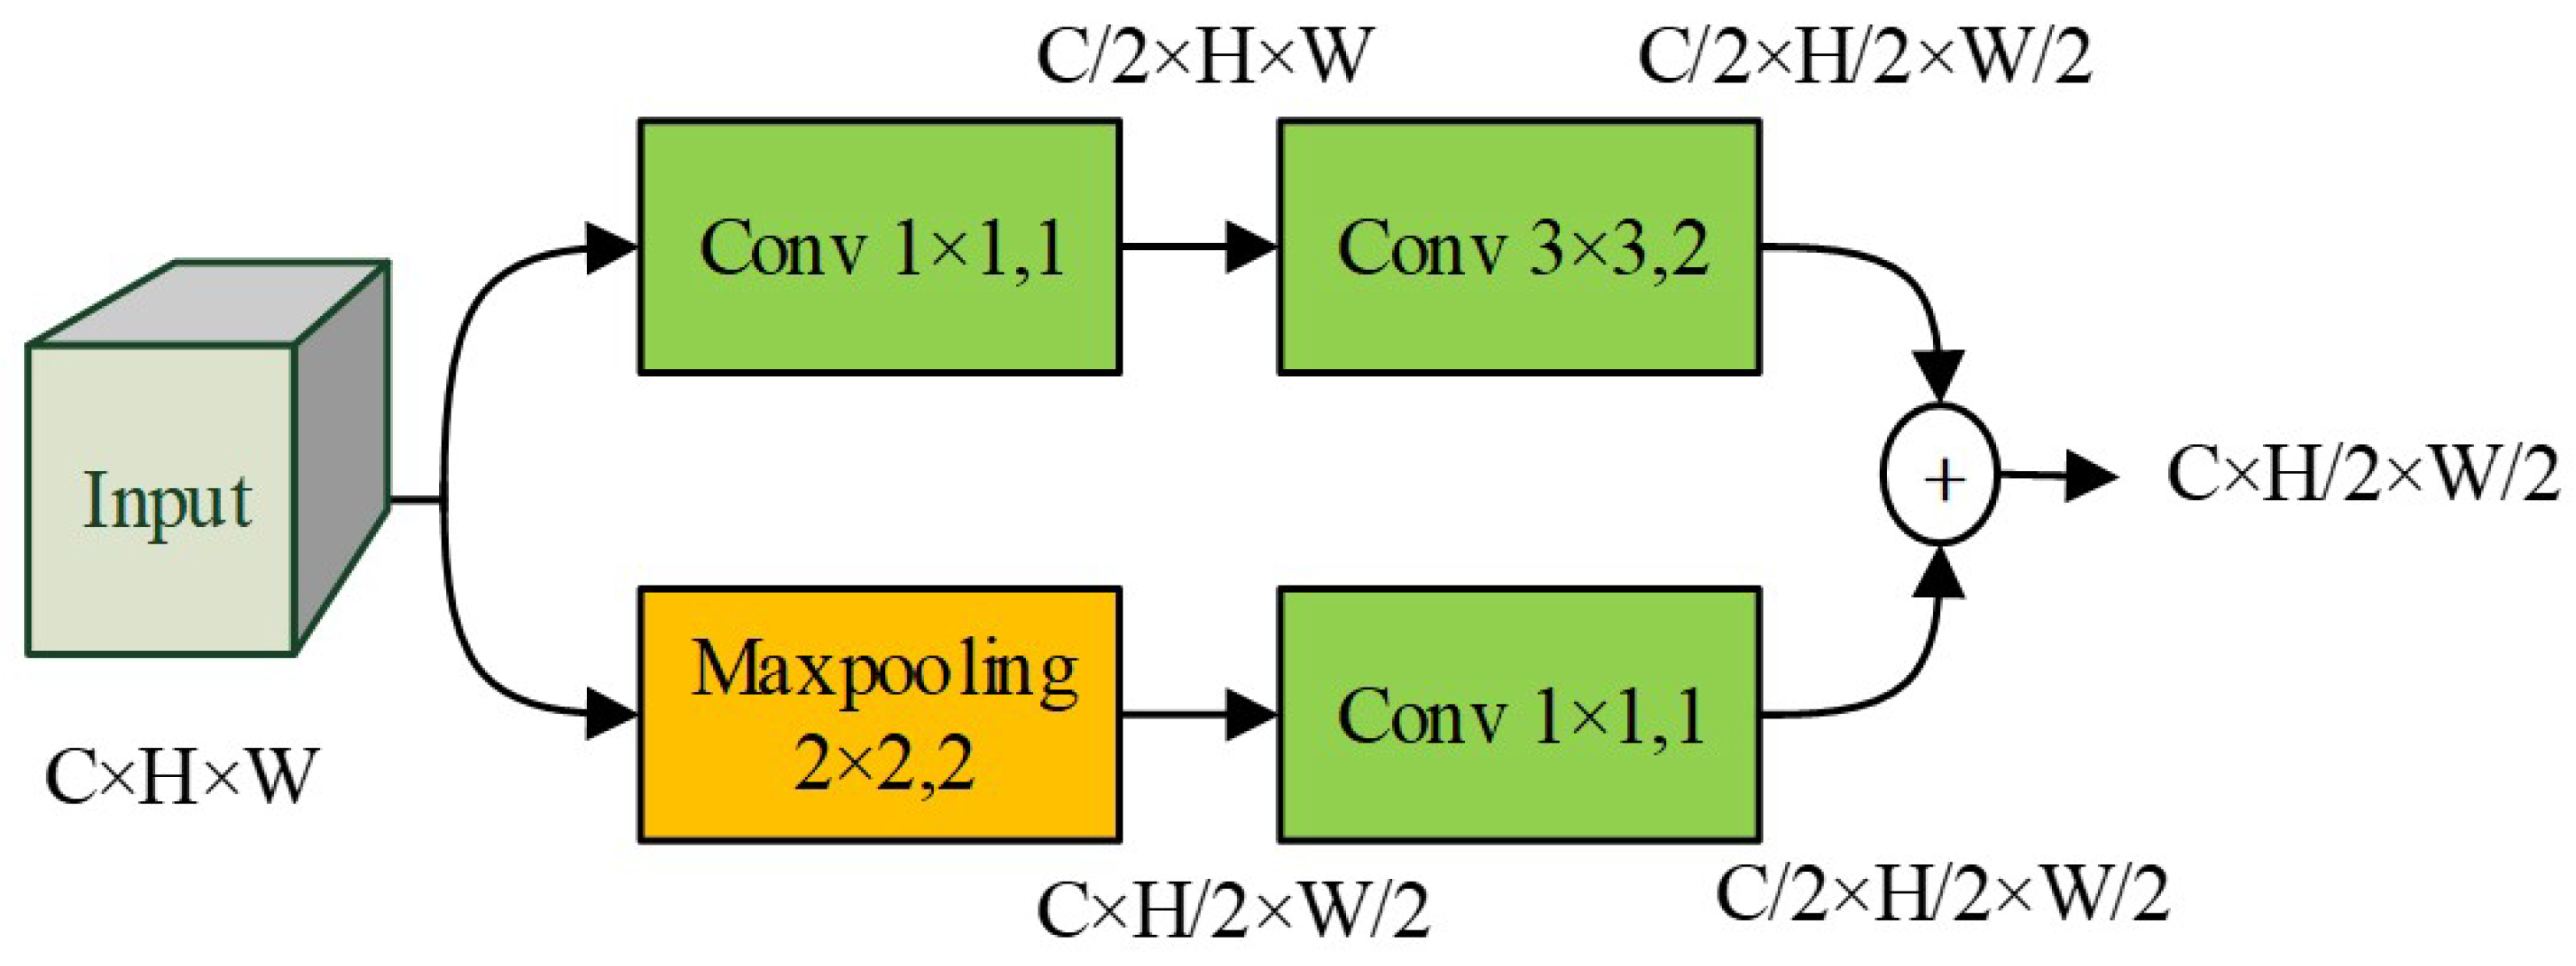
As shown in
Figure 4, DownC consists of two branches for downsampling operation. The first branch is a “All-Conv” branch while the second branch is a “MaxPool-Conv” branch. To concatenate features of two branch and keep the number of channels unchanged, the channel of each branch is halved. Specifically, “All-Conv” branch contains two Conv modules. The stride of first Conv module is set as 1, so that the number of channels is halved. “MaxPool-Conv” branch first uses a MaxPool operation and then applies a
Conv module. Similar to “All-Conv” branch, the Conv module set stride as 1 to halve the channel number. Compared to the YOLOv5’s Conv module with step size 2, DownC has less computation and retains the maximum pooled texture feature information.
2.2.3. Improved Multiscale Fusion Structure
The contrast ratio of vehicle targets in infrared images is relatively low, and there are scale and grayscale differences among intra-class targets in the dataset. There is feature similarity between different categories of targets, all of which increase the difficulty of detection. In response to the above issues, we add shallow feature maps to feature aggregation to improve the detection performance of infrared dim and small vehicles.
With the deepening of the neural network and the increase of down sampling times, the semantic information obtained by this feature layer is more abundant, but the texture information of the image will be reduced. In this paper, the infrared dim small target in this study occupies approximately
pixels in the
infrared image. Therefore, it is not conducive to the detection of dim and small targets. In response to the above issues, we involve feature maps in shallow layers improve the detection performance of dim and small targets. As shown in
Figure 5, we propose three improved multiscale fusion structures, which are “Four-scale feature fusion”, “Four-scale shallow feature fusion”, and “Three-scale shallow feature fusion”.
In order to enhance the contour information and geometric information of the target, we propose a “Four-scale feature fusion” structure, which incorporates 4 times downsampling features on the basis of the original feature extraction network. This design can make the network facilitate the detection of infrared dim small targets, and the improved structure is shown in
Figure 5 (a). To further analyze the effect of scale variation on the detection effect, we add a new 2 times downsampling features in “Four-scale shallow feature fusion” structure. In this structure,
times downsampling features are fused together to keep the texture feature of dim small targets. The structure is shown in
Figure 5 (b). For performance comparison and analysis, we propose “Three-scale shallow feature fusion” structure. Compared to “Four-scale shallow feature fusion” structure, it removes 2 times downsampling and leaves
times downsampling features for fusion.
In this paper, feature fusion methods are selected according to the size differences of the detected targets. As 4 times downsampling features are more suitable for detecting small targets, they are incorporated into the feature fusion for all three structures. Based on the improvement in network detection accuracy, an attempt is made to incorporate 2 times downsampling feature. However, involving 2 times downsampling feature will boost the computation and memory cost. Therefore, we remove this feature after making a trade-off between performance improvement and cost. Whereas, when using 32 times downsampling features, the target is easily missed with a very small percentage of the feature map, so this scale was removed. Based on the above-mentioned analysis, we select
times downsampling features (
Figure 5 (c)) to solve the problem of infrared dim small target detection, which can achieve the best detection effect under acceptable cost.
3. Experiments
3.1. Dataset
3.1.1. Establishment
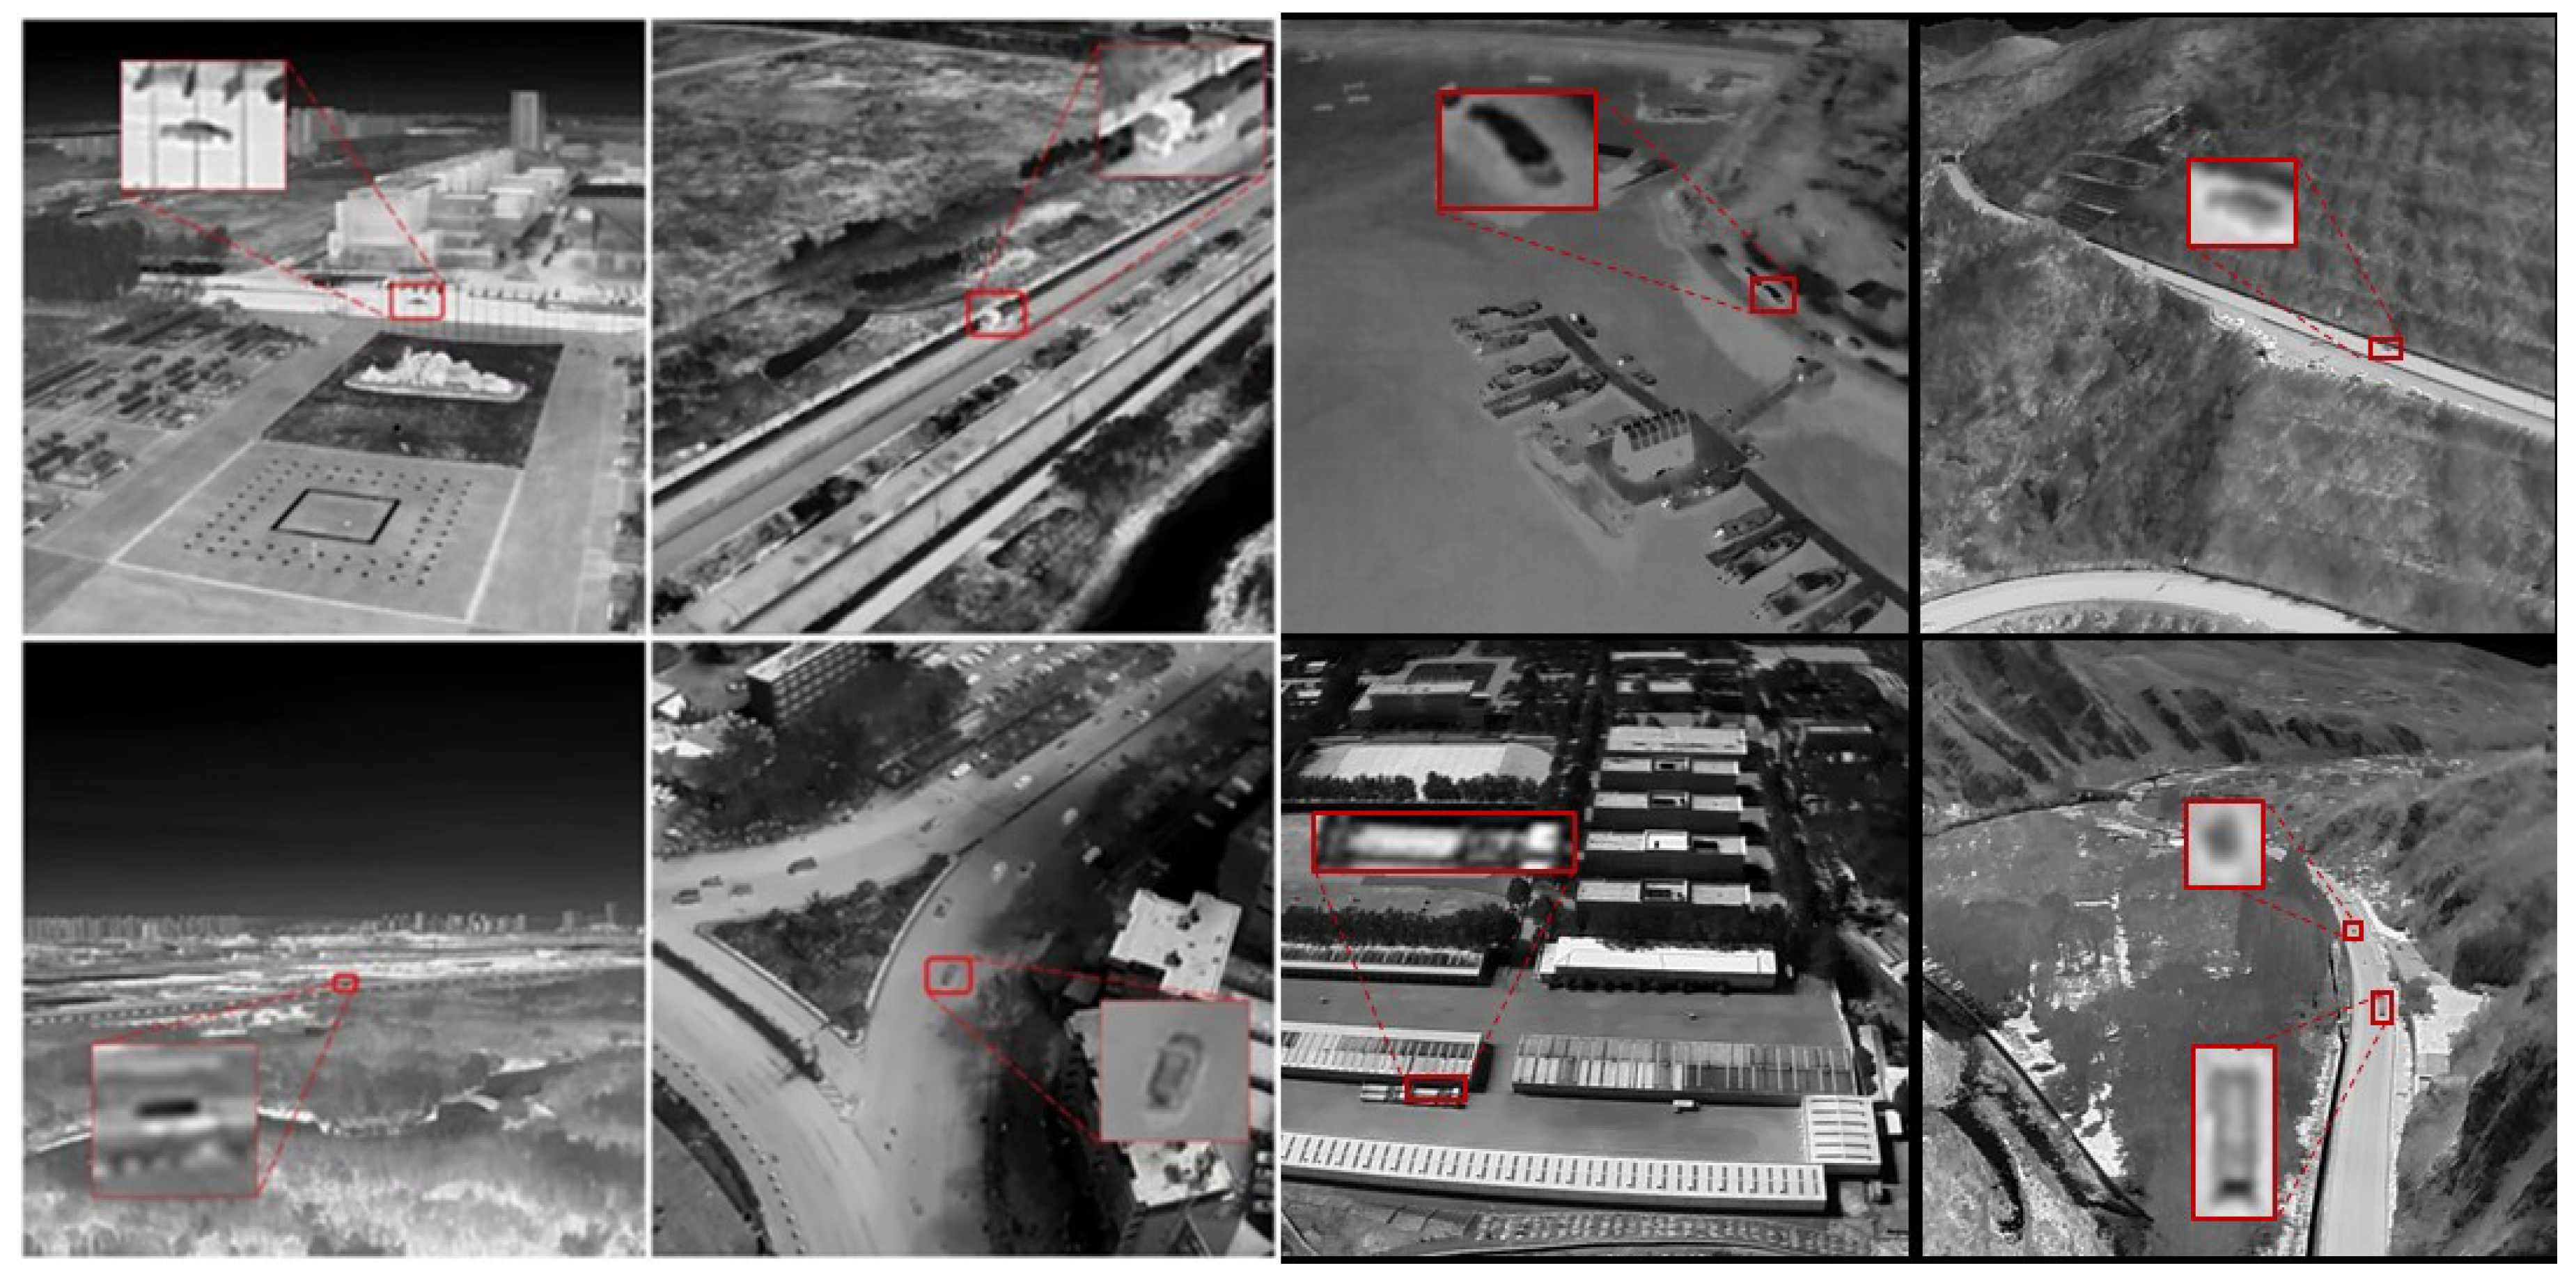
Due to the rapid advancement of unmanned aerial vehicle (UAV) technology, UAVs have gained widespread adoption in aerial imaging tasks. However, the lack of specialized thermal infrared vehicle detection datasets focusing on small objects represents a significant gap in the field. In order to complete the task of infrared weak vehicle target detection, we first propose the Infrared Small Vehicle Dataset (ISVD), which comprises infrared images collected by UAVs. All images were taken using infrared imaging drones in scenes, which include cities, farmlands, Gobi, deserts and ports. In addition to being small in size, the vehicles included in the dataset also exhibit different variations, such as multidirectional, lighting/shadow changes, specular reflections, or occlusion. Our dataset includes 9976 images of 102 sequences. To provide a visual representation,
Figure 6 showcases a selection of representative images from the ISVD.
The dataset in this paper is labeled by 13 experts in the field of infrared target detection and machine vision by rectangular box annotation. Due to the small target and low contrast in the images of the dataset in this paper, in order to ensure the labeling quality of infrared images, each infrared image needs to be cooperated by three experts and set up a responsible expert for a specific scene (such as different categories of scenes including cities, grasslands, Gobi, etc.). Among them, after being marked by one expert, it is confirmed by another expert, and then the responsible expert is asked for final confirmation.
3.1.2. Data Analysis
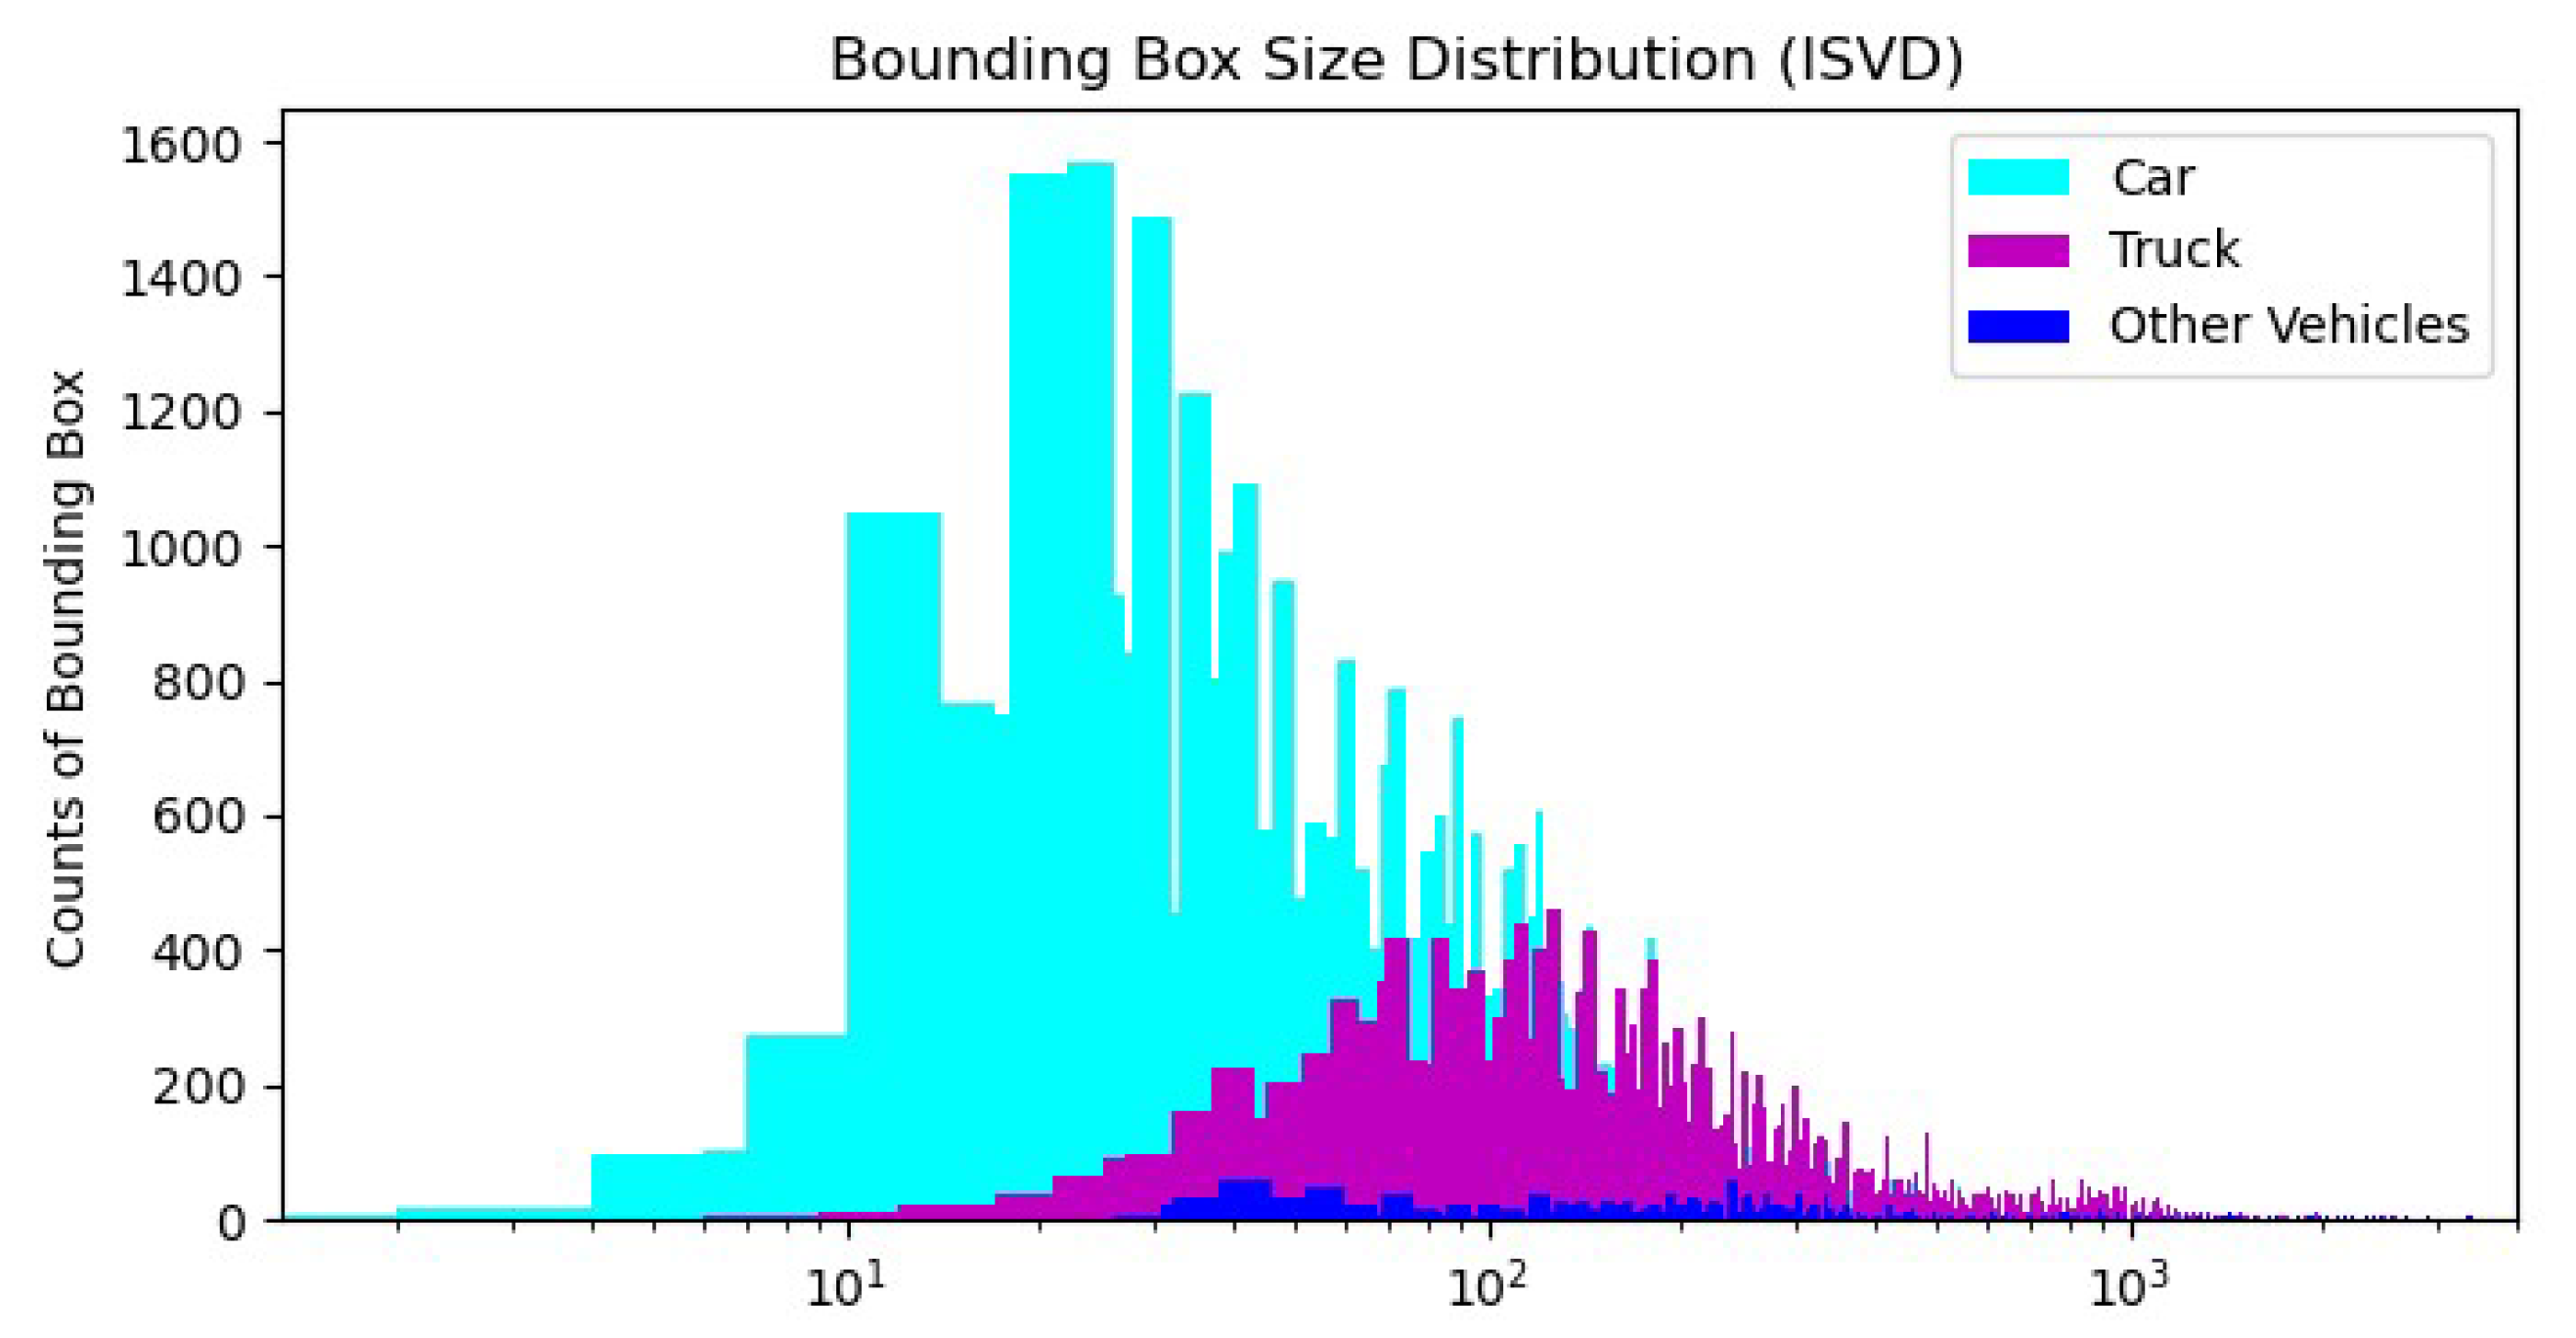
Before training, the dataset was pre-processed and the target types were divided into three categories: "car", "truck" and "other vehicles". In order to ensure accurate evaluation, we divided the dataset into training, validation, and test sets using an 8:1:1 ratio. Furthermore, we analyzed the distribution of targets and determined the average dimensions of the anchor boxes for each class, as presented in
Table 1.
Concretely, The ISVD encompasses a total of 9976 infrared images, with 36705 instances of the "car" class, 25621 instances of the "truck" class, and 2100 instances of "other vehicles." On average, each image in the dataset contains approximately 7.56 bounding boxes, indicating the presence of multiple targets in a single image. This characteristic of the dataset allows for the evaluation of detection models in scenarios where small targets are mixed with larger ones.
Figure 7 presents a comprehensive visualization of the distribution of bounding box sizes across different classes. It provides a clear depiction of the size variations within each class, emphasizing the crucial importance of accurate detection and localization of small objects in infrared images. The x-axis represents the size range of the anchor boxes, while the y-axis indicates the frequency of occurrence of bounding boxes within each size range. This valuable information will facilitate the development and evaluation of robust algorithms for small object detection in thermal infrared vehicle detection tasks.
Table 2 shows the comparison between the ISVD image dataset and the previous infrared image datasets. Through comparison, we analyze in the following areas. 1) The previous infrared data sets were taken at a closer distance, and the target occupies a large pixel scale in the figure; 2) In the currently disclosed infrared image dataset with UAV shooting perspective, vehicle targets mainly include car and truck, which have less coverage for other types of vehicle targets, and it is difficult to meet the infrared target detection needs of different vehicle types; 3) At present, the infrared image dataset is basically based on urban and rural scenes, and the coverage of farmland, mountains, ports and Gobi scenes is obviously insufficient to meet the needs of target detection under different background conditions.
3.2. Implementation Details
The configuration of the experimental platform and setting of experimental parameters are shown in
Table 3 and
Table 4. In this paper, the performance of the model is measured from several perspectives and the evaluation metrics include precision (P), recall(R), average precision metrics (mAP@0.5, mAP@0.5:0.95), and trainable parameters. The evaluation metrics in this paper not only reflect the comprehensive performance of the model but also improve the detection requirements of complex datasets. On our proposed ISVD, this evaluation metrics are also effective in assessing the detection results.
3.3. Experiments and Analysis
3.3.1. Comparison Experiments on ISVD
In this paper, four algorithms, including YOLOv5s, YOLOv5m, YOLOv7 [
29], and Multiscale YOLOv5s-AFAM, are compared and analyzed on the ISVD, and the results are shown in
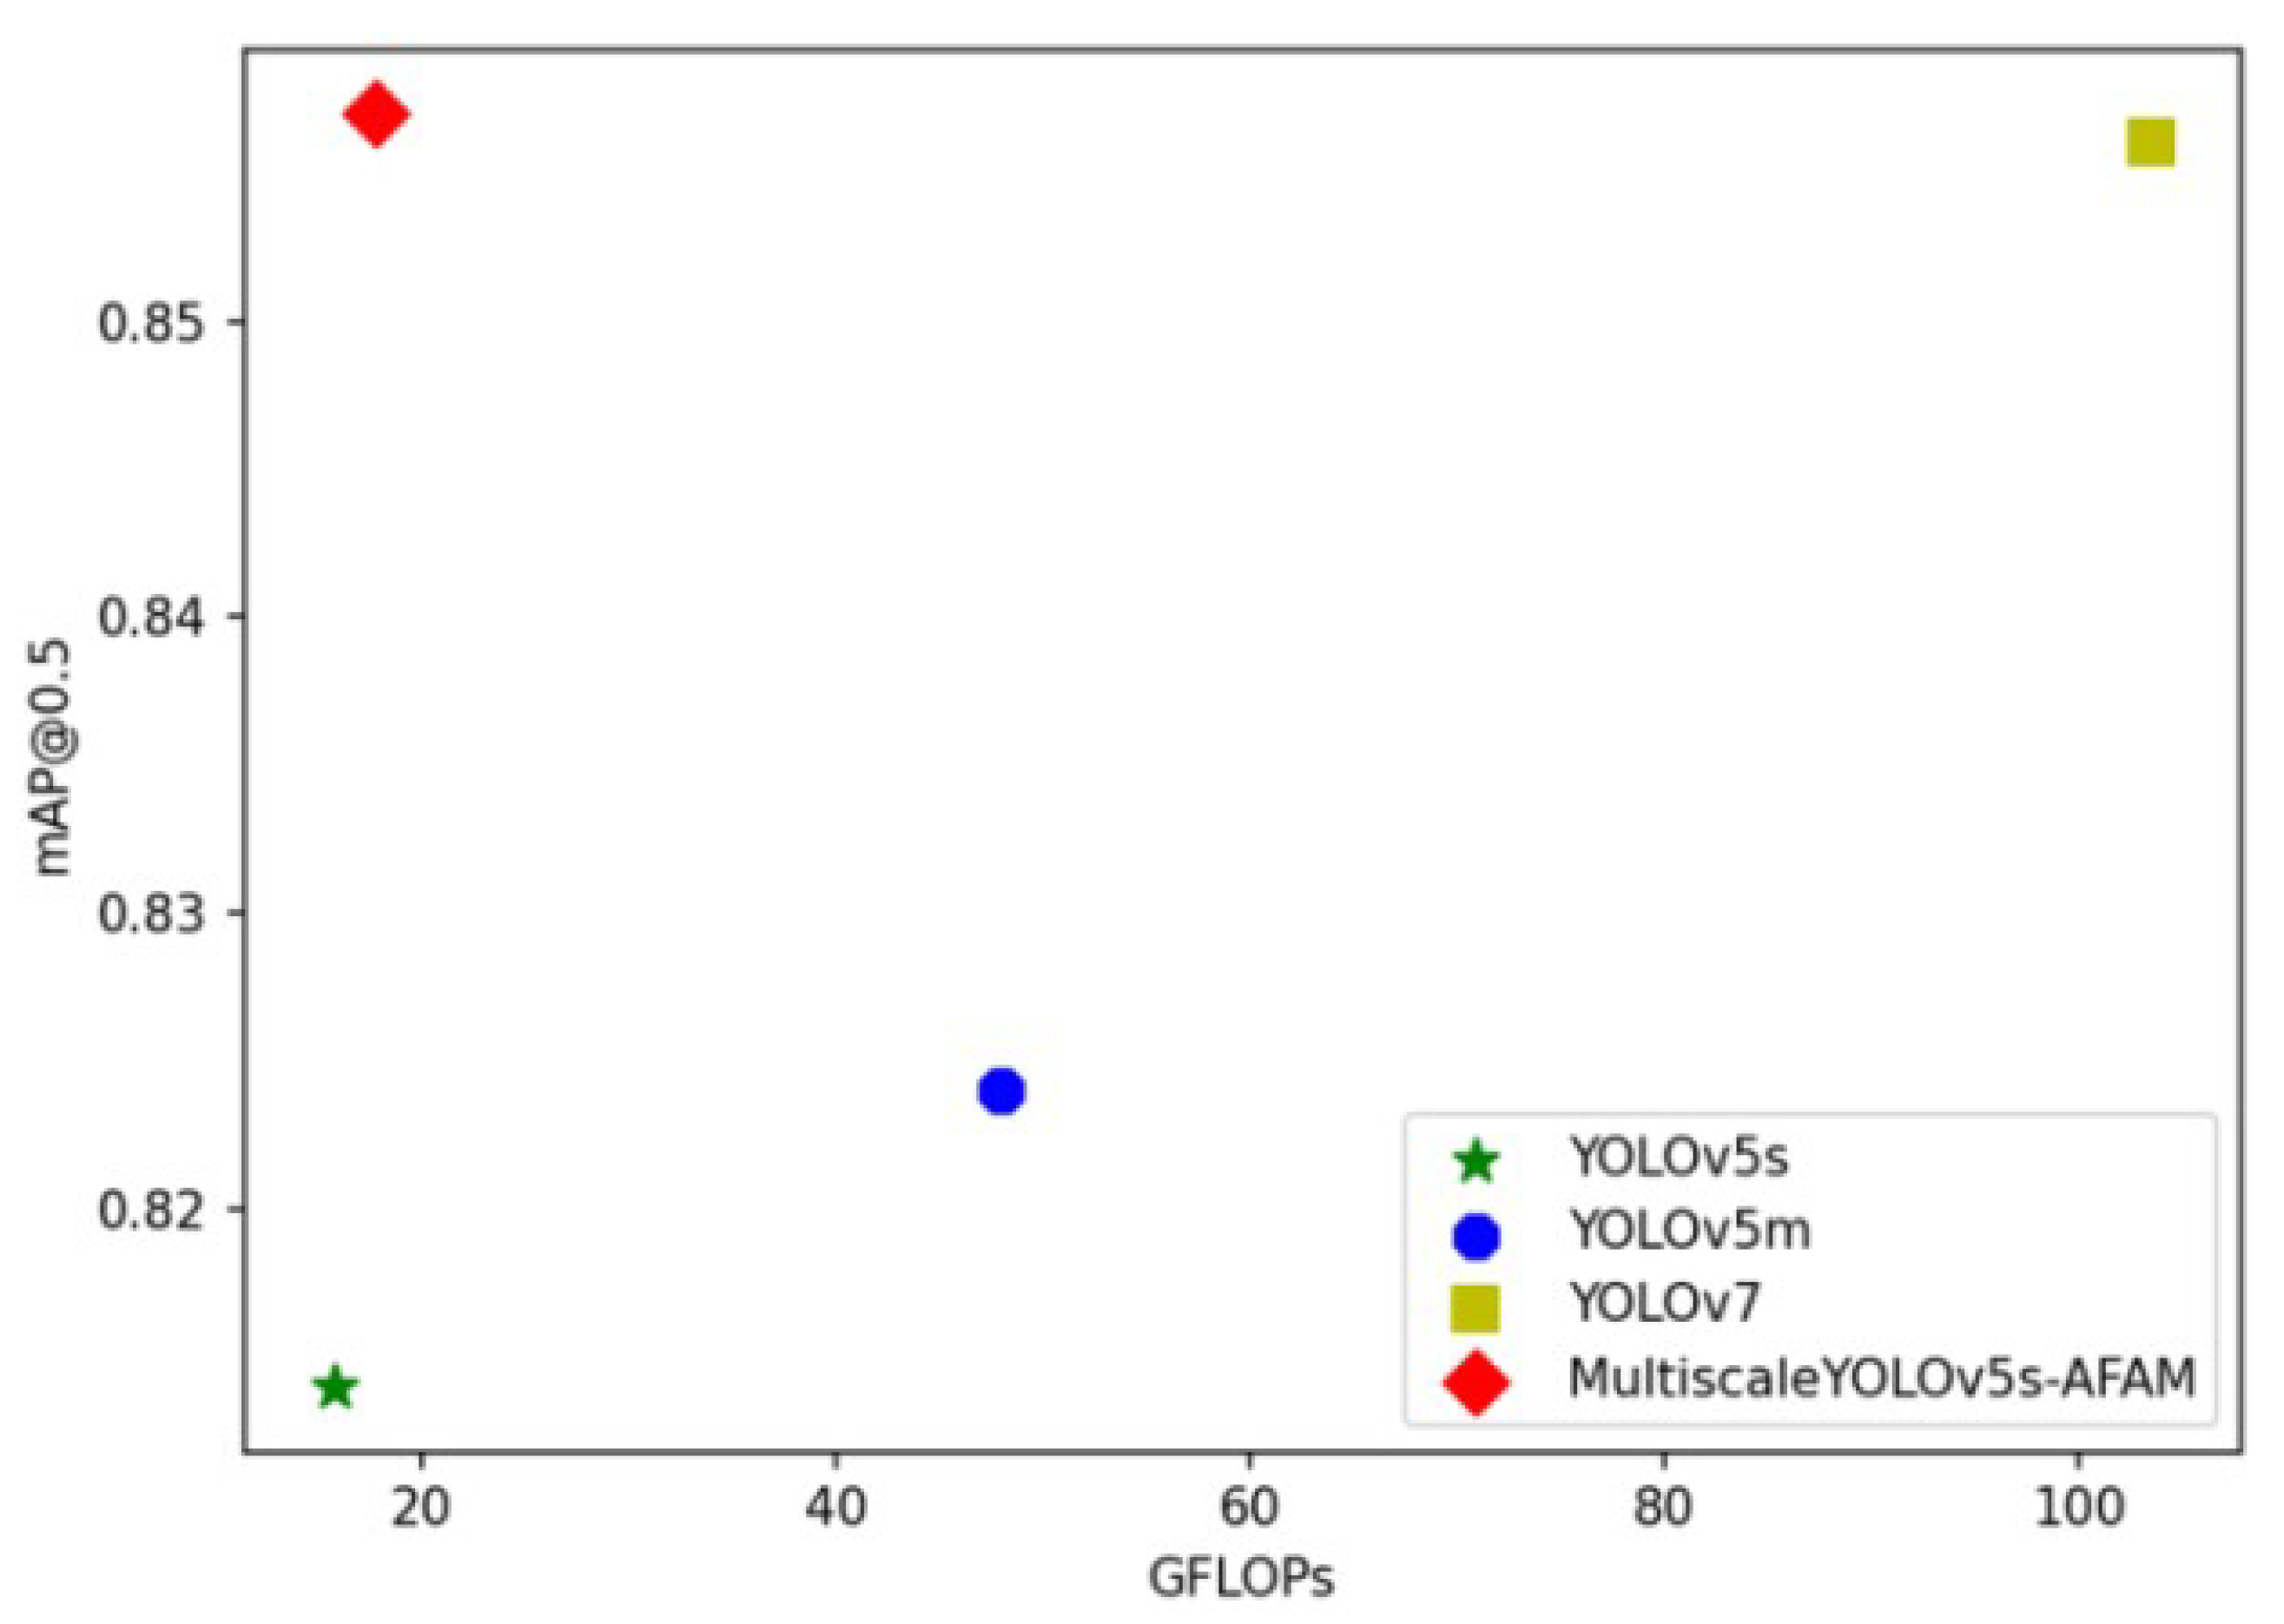
Table 5. The Multiscale YOLOv5-AFAM has a small increase in parameters and GFLOPs, but in return, a significant improvement in mAP@0.5 and mAP@0.5:0.95, rising to 85.7% and 39.6%. The improved network of mAP@0.5 and mAP@0.5:0.95 exceeds YOLOv7 with only 19.25% of model parameters. The intuitive comparison of the mAP@0.5-GFLOPs on the ISVD is shown in
Figure 6. The improved network greatly improves the detection accuracy of infrared dim small targets while reducing parameters.
3.3.2. Ablation Study
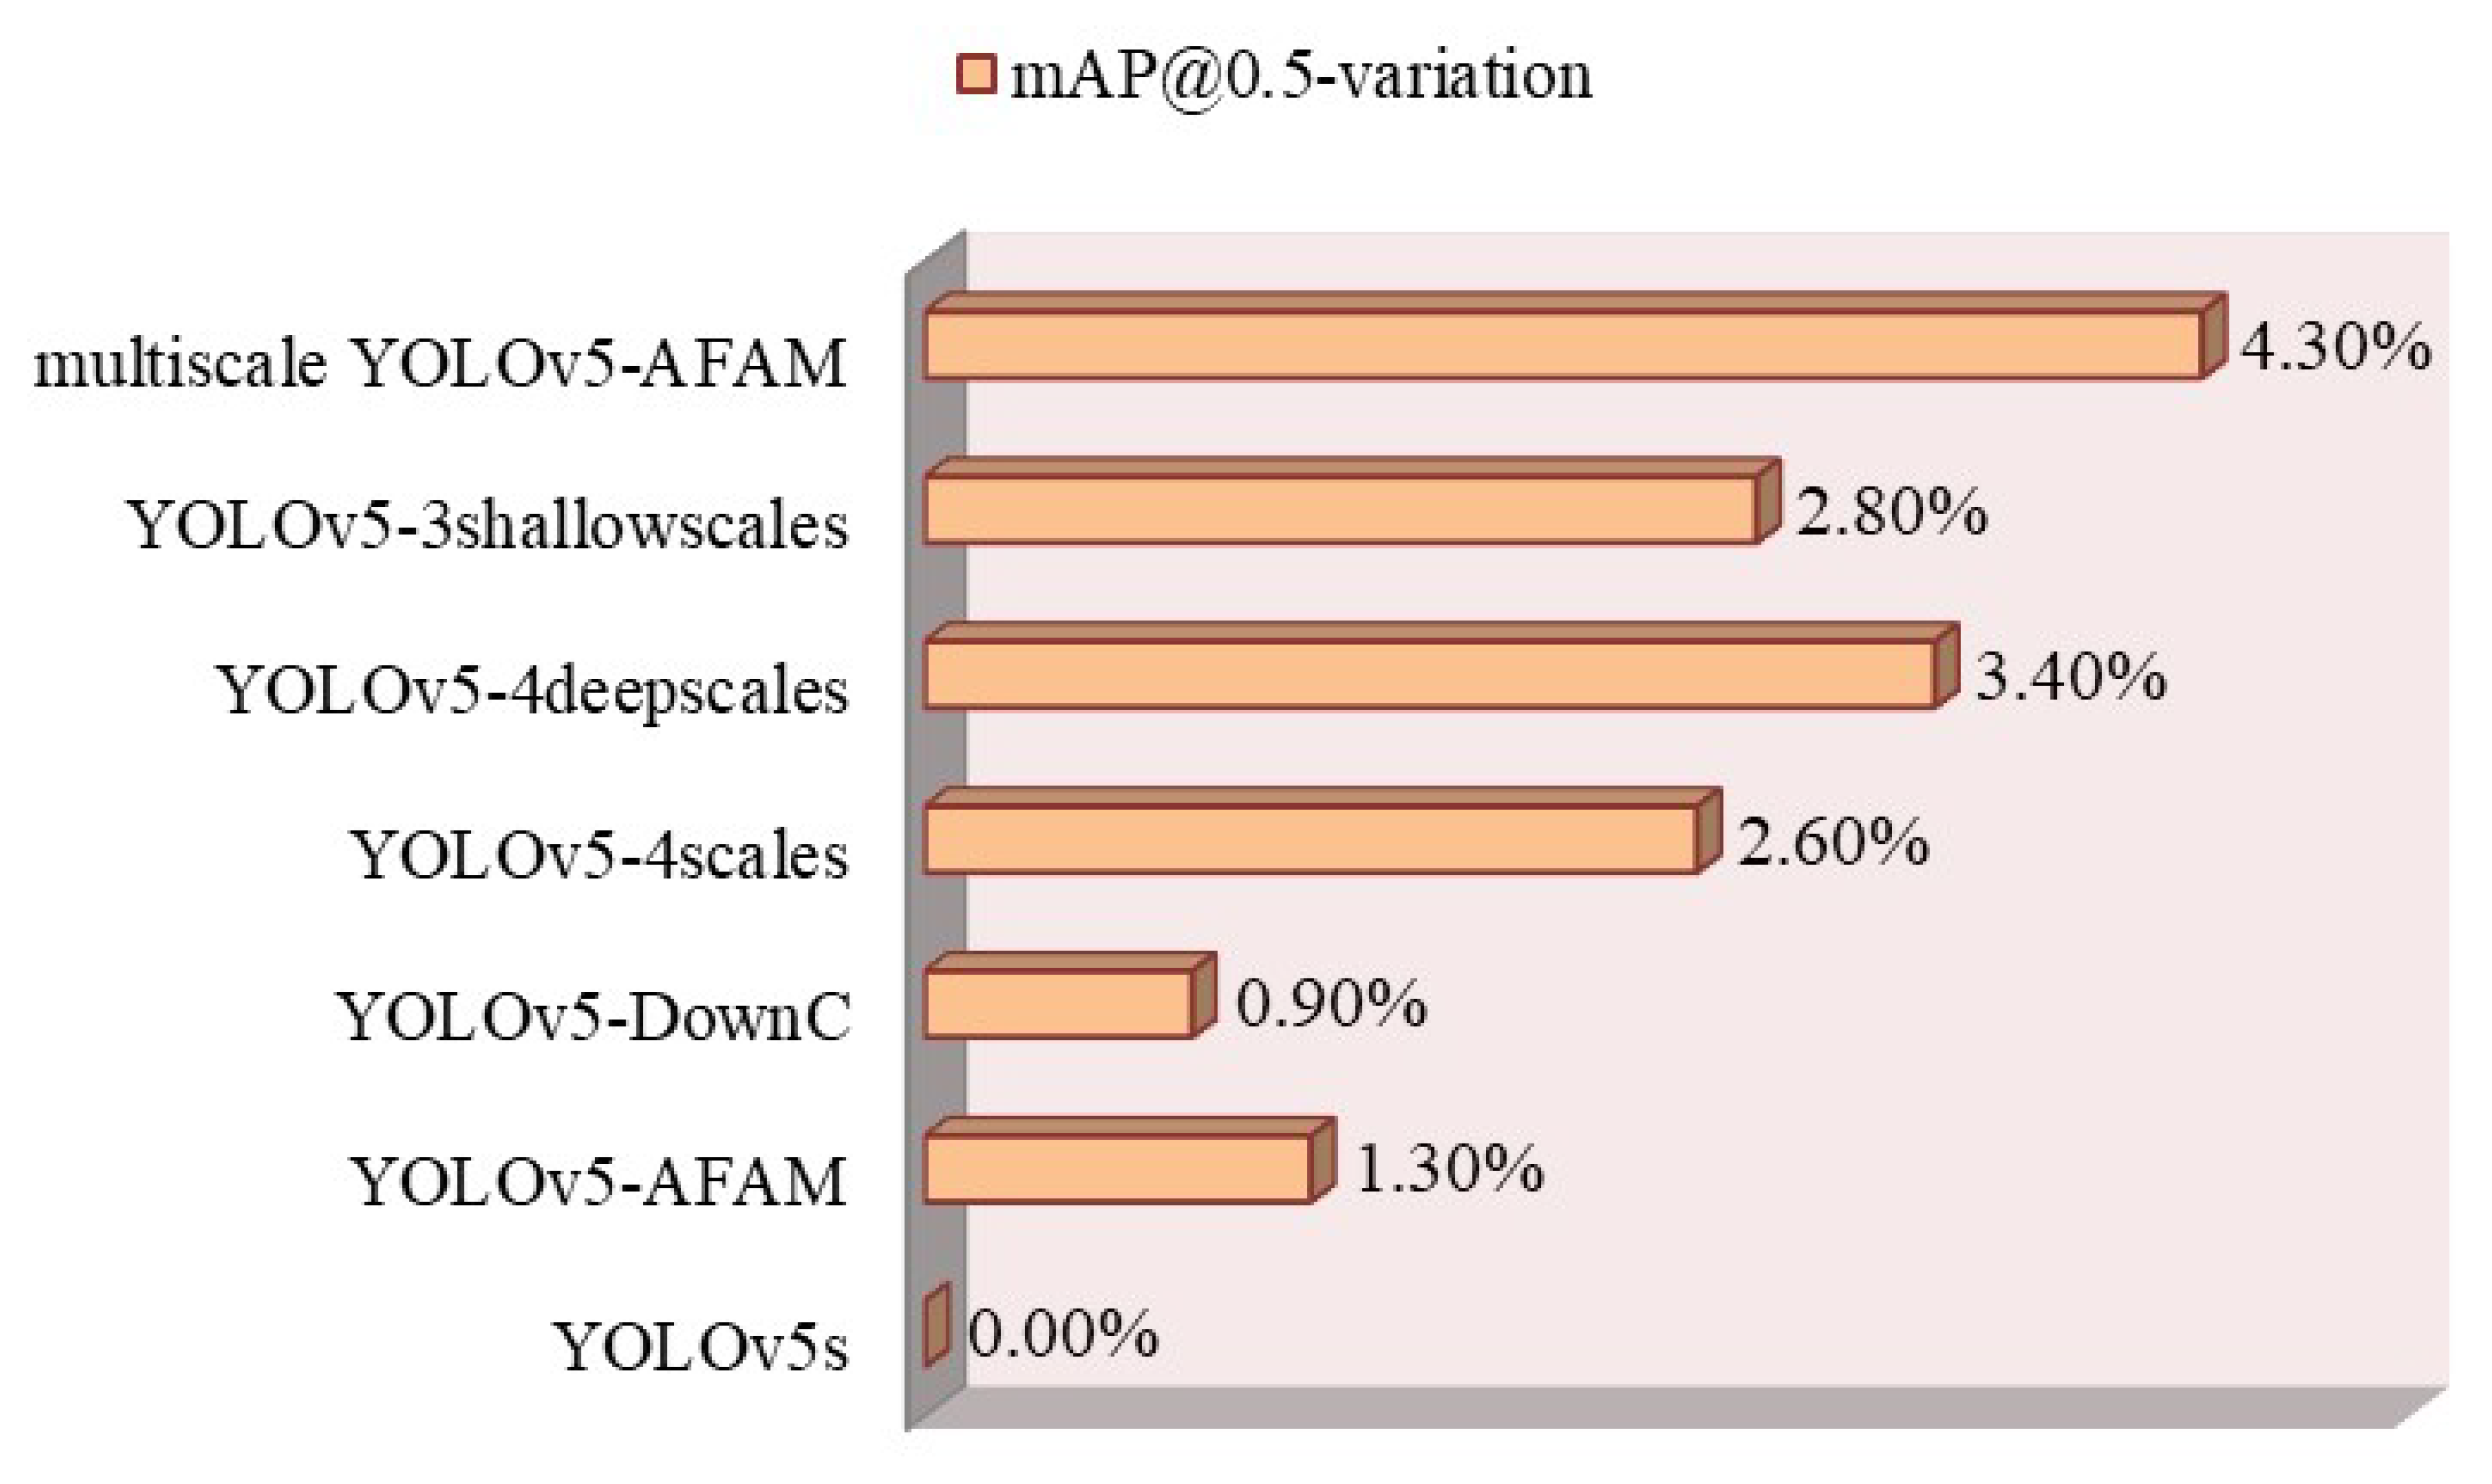
To verify the performance of each proposed module in a separated manner. We conduct ablation study based on YOLOv5s (baseline model). Here, we first compare the effectiveness of single module. The results are shown in
Figure 9.
We then analyze the effectiveness of different combinations of modules in detail. The results are shown in
Table 6. Here, we will analyze in the following points. (1) By joining the AFAM module into the backbone network, the feature extraction capability and detection accuracy of the network increases significantly. E.g., mAP@0.5 rises to 82.7% (increase by 1.3%) and the GFLOPs drops to 14.7. Experimental results demonstrate a significant improvement in detection capability. (2) The feature extraction capability is significantly enhanced after applying DownC. The values of mAP@ 0.5, mAP@0.5:0.95, P and R evaluation metrics are 82.3%, 37.8%, 82.6%, and 79.7% respectively. The accuracy rate P is the highest value among all the improved models. This result proves the feasibility of switching to the DownC downsampling method. (3) When applying “Four-scale feature fusion”, “Four-scale shallow feature fusion”, and “Three-scale shallow feature fusion” on baseline model, results also get obviously improved. (4) Our proposed multiscale YOLOv5-AFAM achieves the best results. When combining “AFAM”, “DownC” and “Three-scale shallow feature fusion”, the mAP@0.5 and mAP@0.5:0.95 improve by 4.3% and 2% respectively with slighlt decrease on parameters.
As a whole, the ablation study demonstrates that the multiscale YOLOv5-AFAM improves the detection accuracy of the infrared dim small target, even in some scenarios where the environment is complex and the target object is blurred.
3.3.3. Visualization and Analysis
To further analyze the improvement of our multiscale YOLOv5-AFAM compared to the YOLOv5 model, we conduct a series visualization experiments.
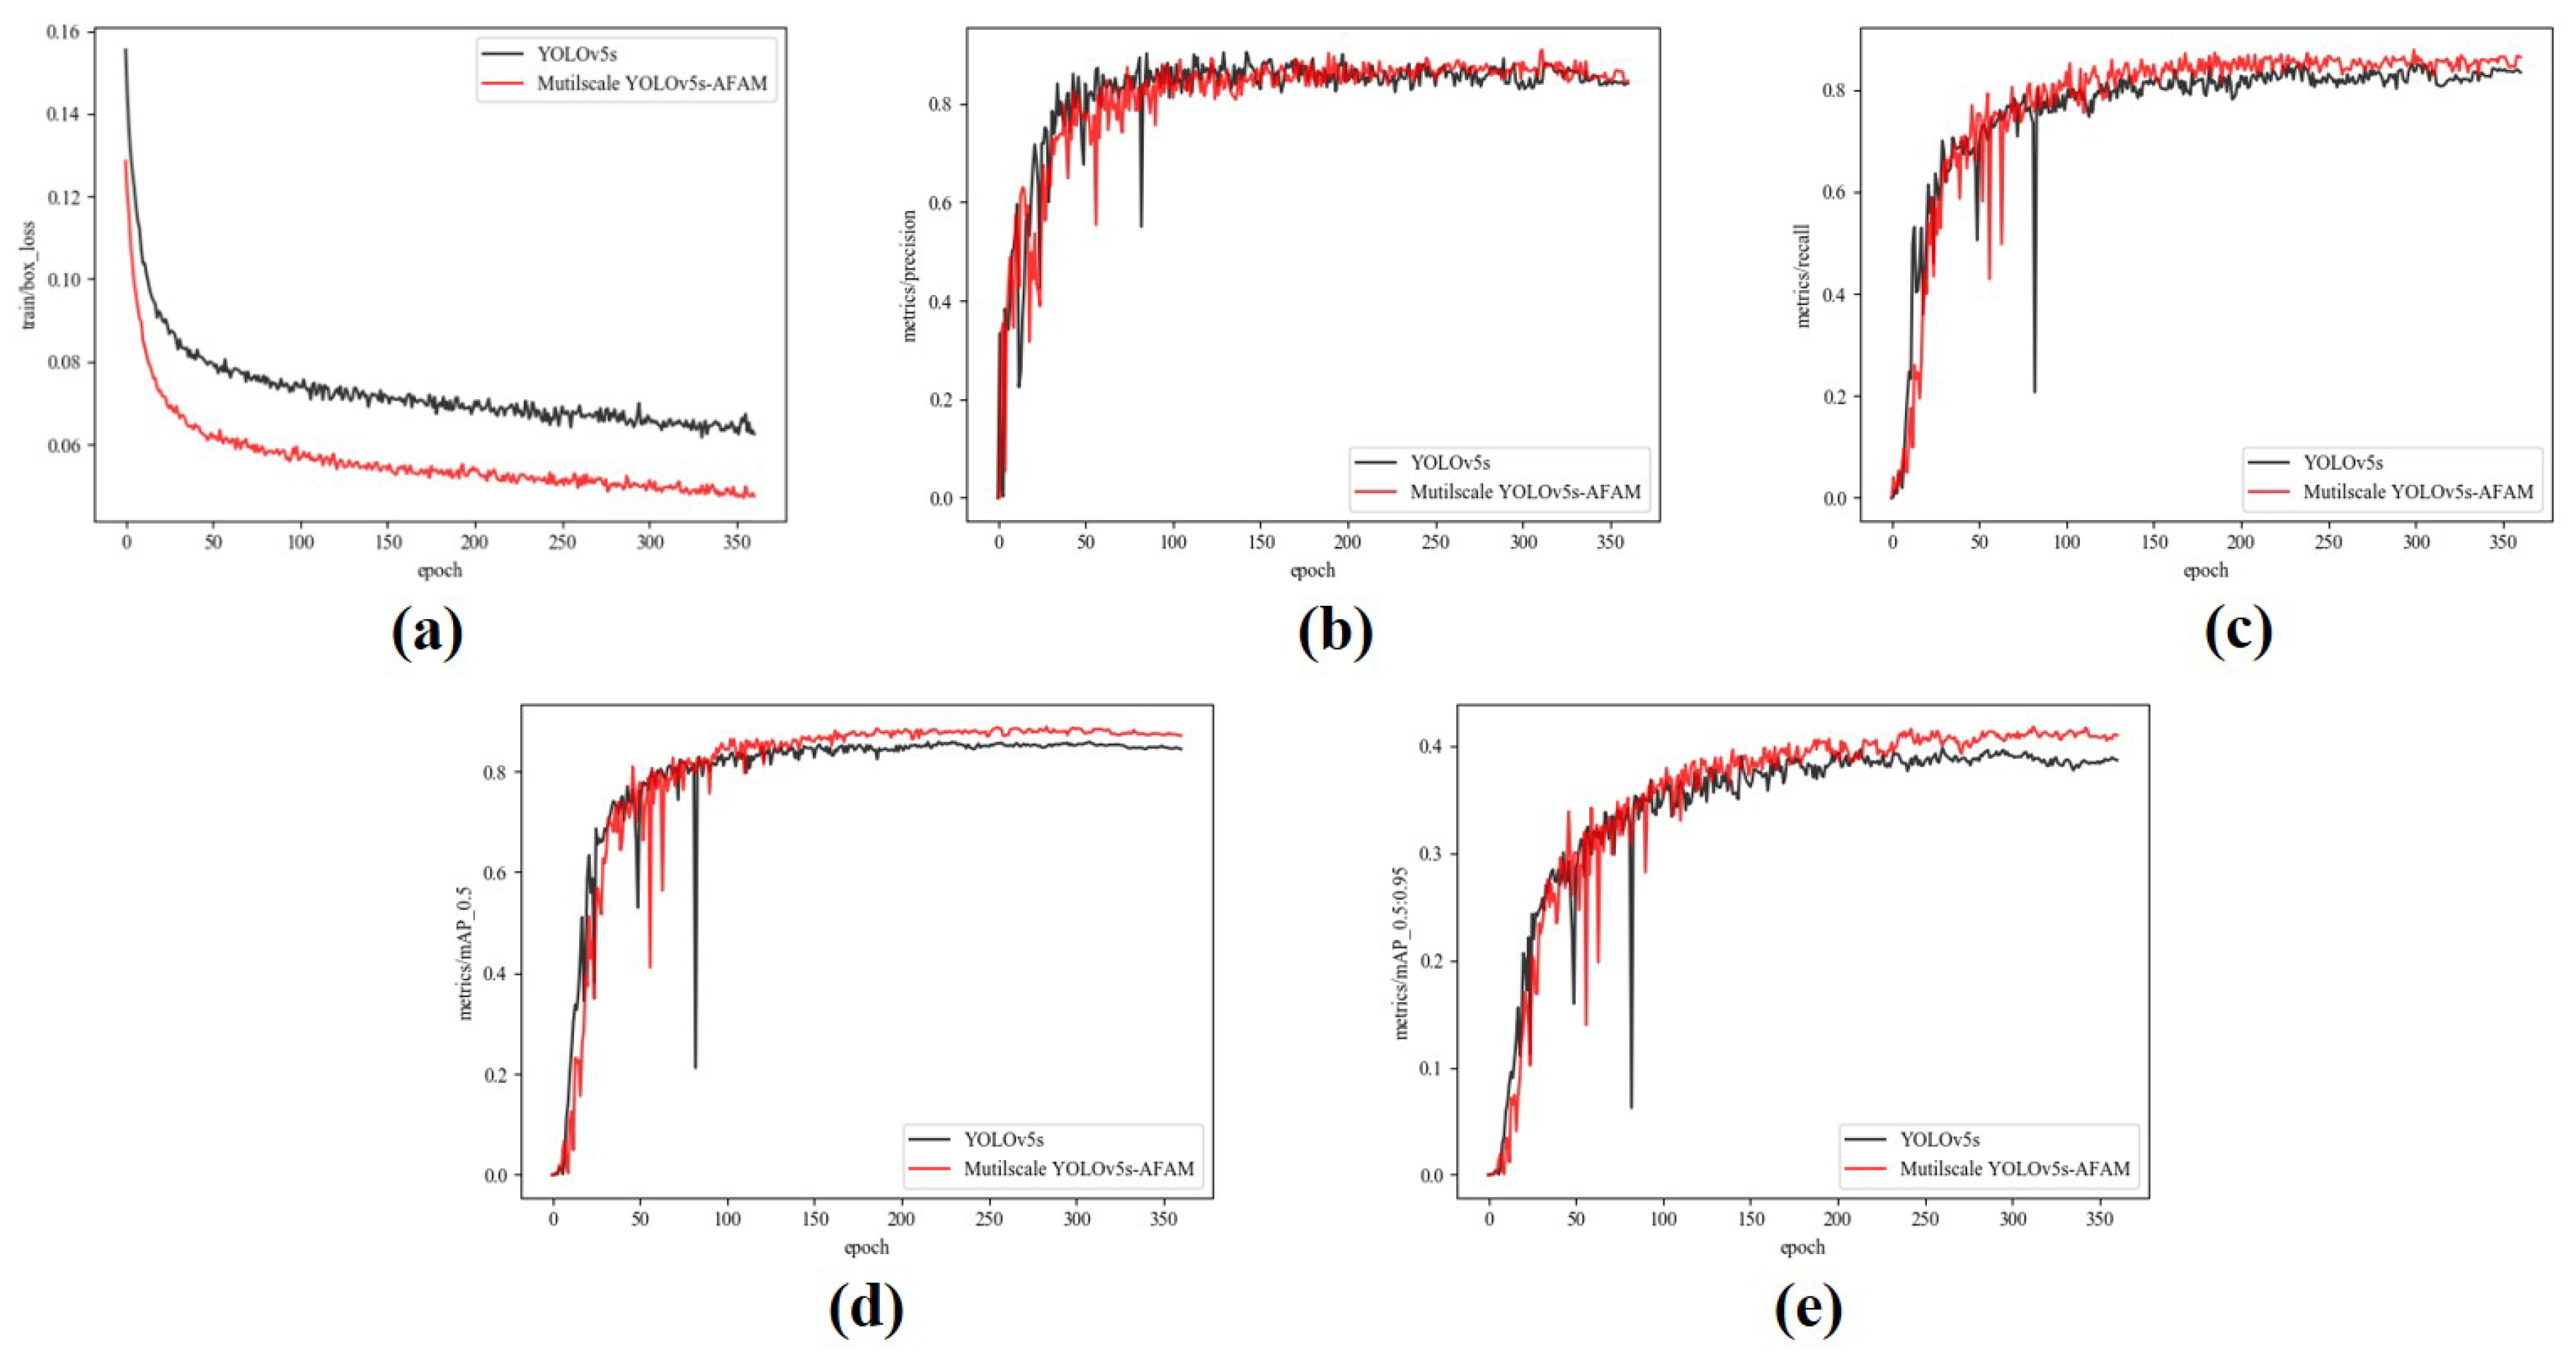
We visualize the curves of losses, precisions, recalls, mAP@0.5 and mAP@0.5:0.95 of the two models in the training stage, as shown in
Figure 10.
During training, the Multiscale YOLOV5-AFAM model has several following performance improvements compared to the YOLOv5s model. As shown in
Figure 10(a), the training loss had a significantly faster convergence speed and it reached a lower value at the end of the training. Overall, the stability of each indicator during training had increased and jitter had decreased. As can be seen in
Figure 10(b) and
Figure 10(c), there are improvements in precision and recall during training, which means the Multiscale YOLOV5-AFAM had a higher mAP@0.5. From
Figure 10(d) and
Figure 10(e), we can conclude that the mAP@0.5 and mAP@.5:.95 of the Multiscale YOLOV5-AFAM had improved, especially mAP@.5:.95 rose by 1.8%, indicating that our algorithm was more accurate in the infrared dim and small vehicle recognition and localization.
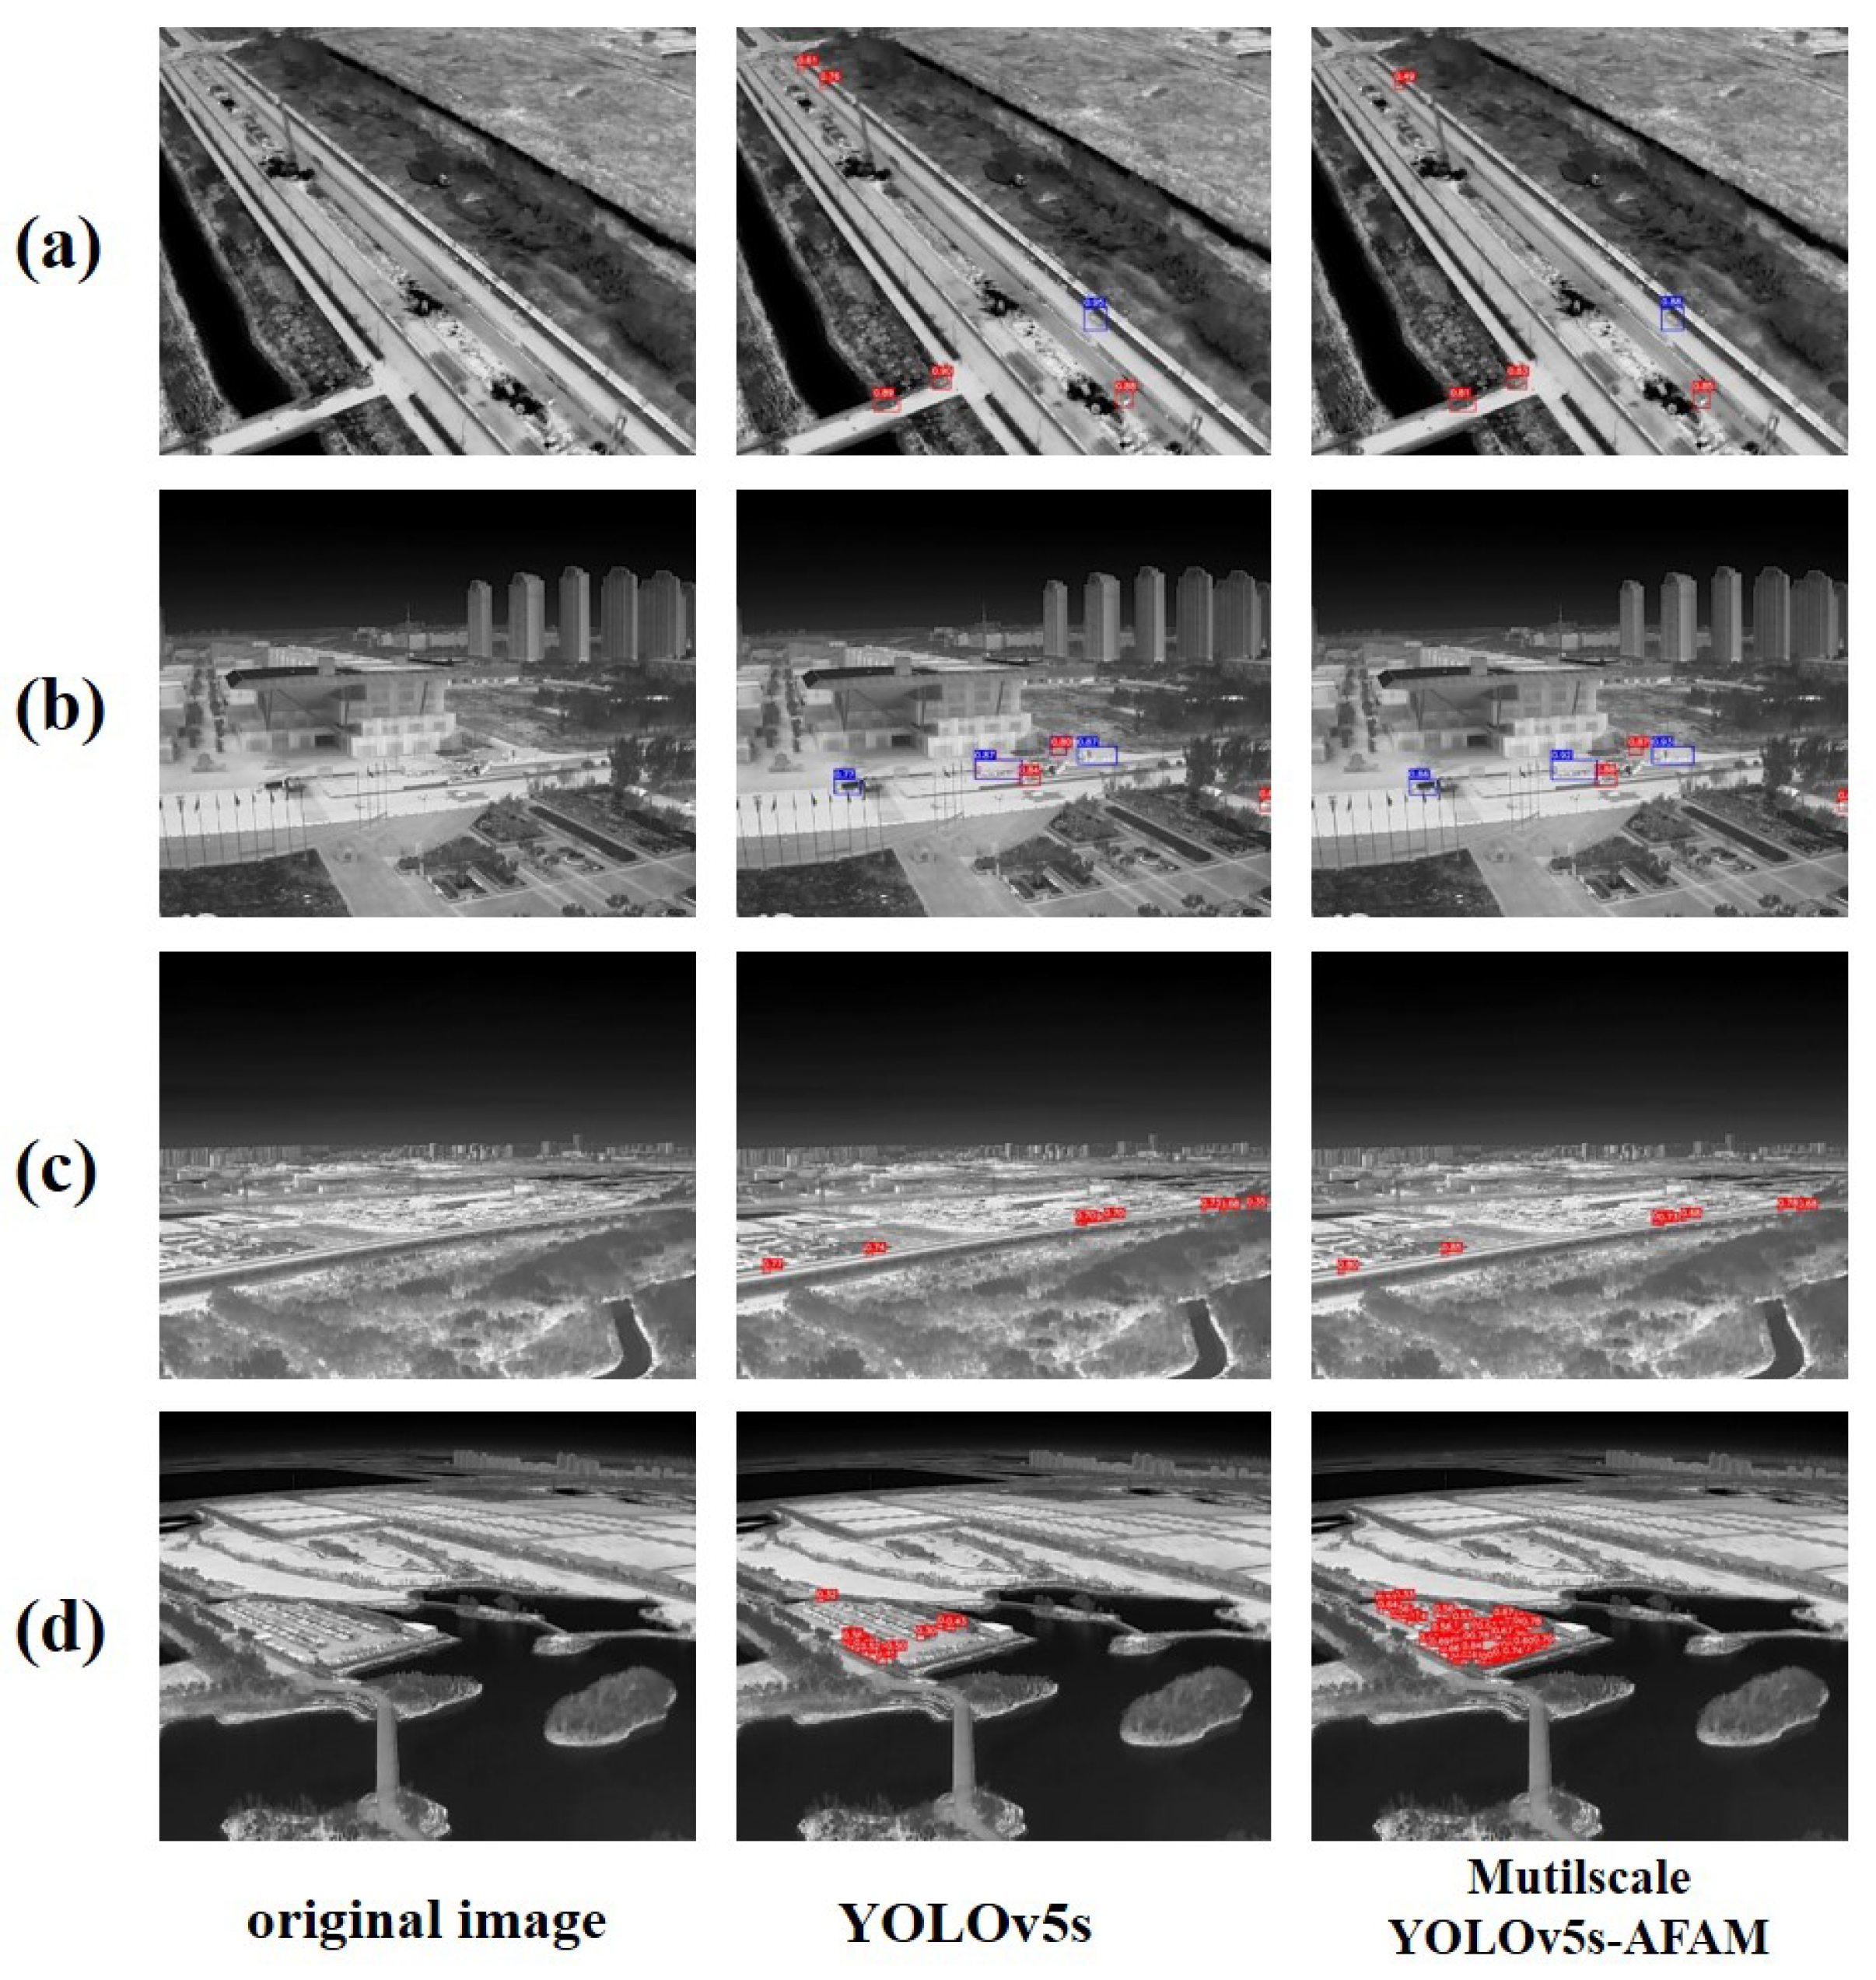
We compare the Mutilscale YOLOv5s-AFAM model and the YOLOv5s model on the validation set, with a confidence threshold of 0.25 and NMS IoU threshold of 0.45. The
Figure 11 shows four cases which can prove the superiority of our model.
We can see that the improved model performs significantly better with a higher confidence score. In addition, there are fewer cases of missing or false positives in the detection results and the improved model has a better performance in dense and occluded scenes.
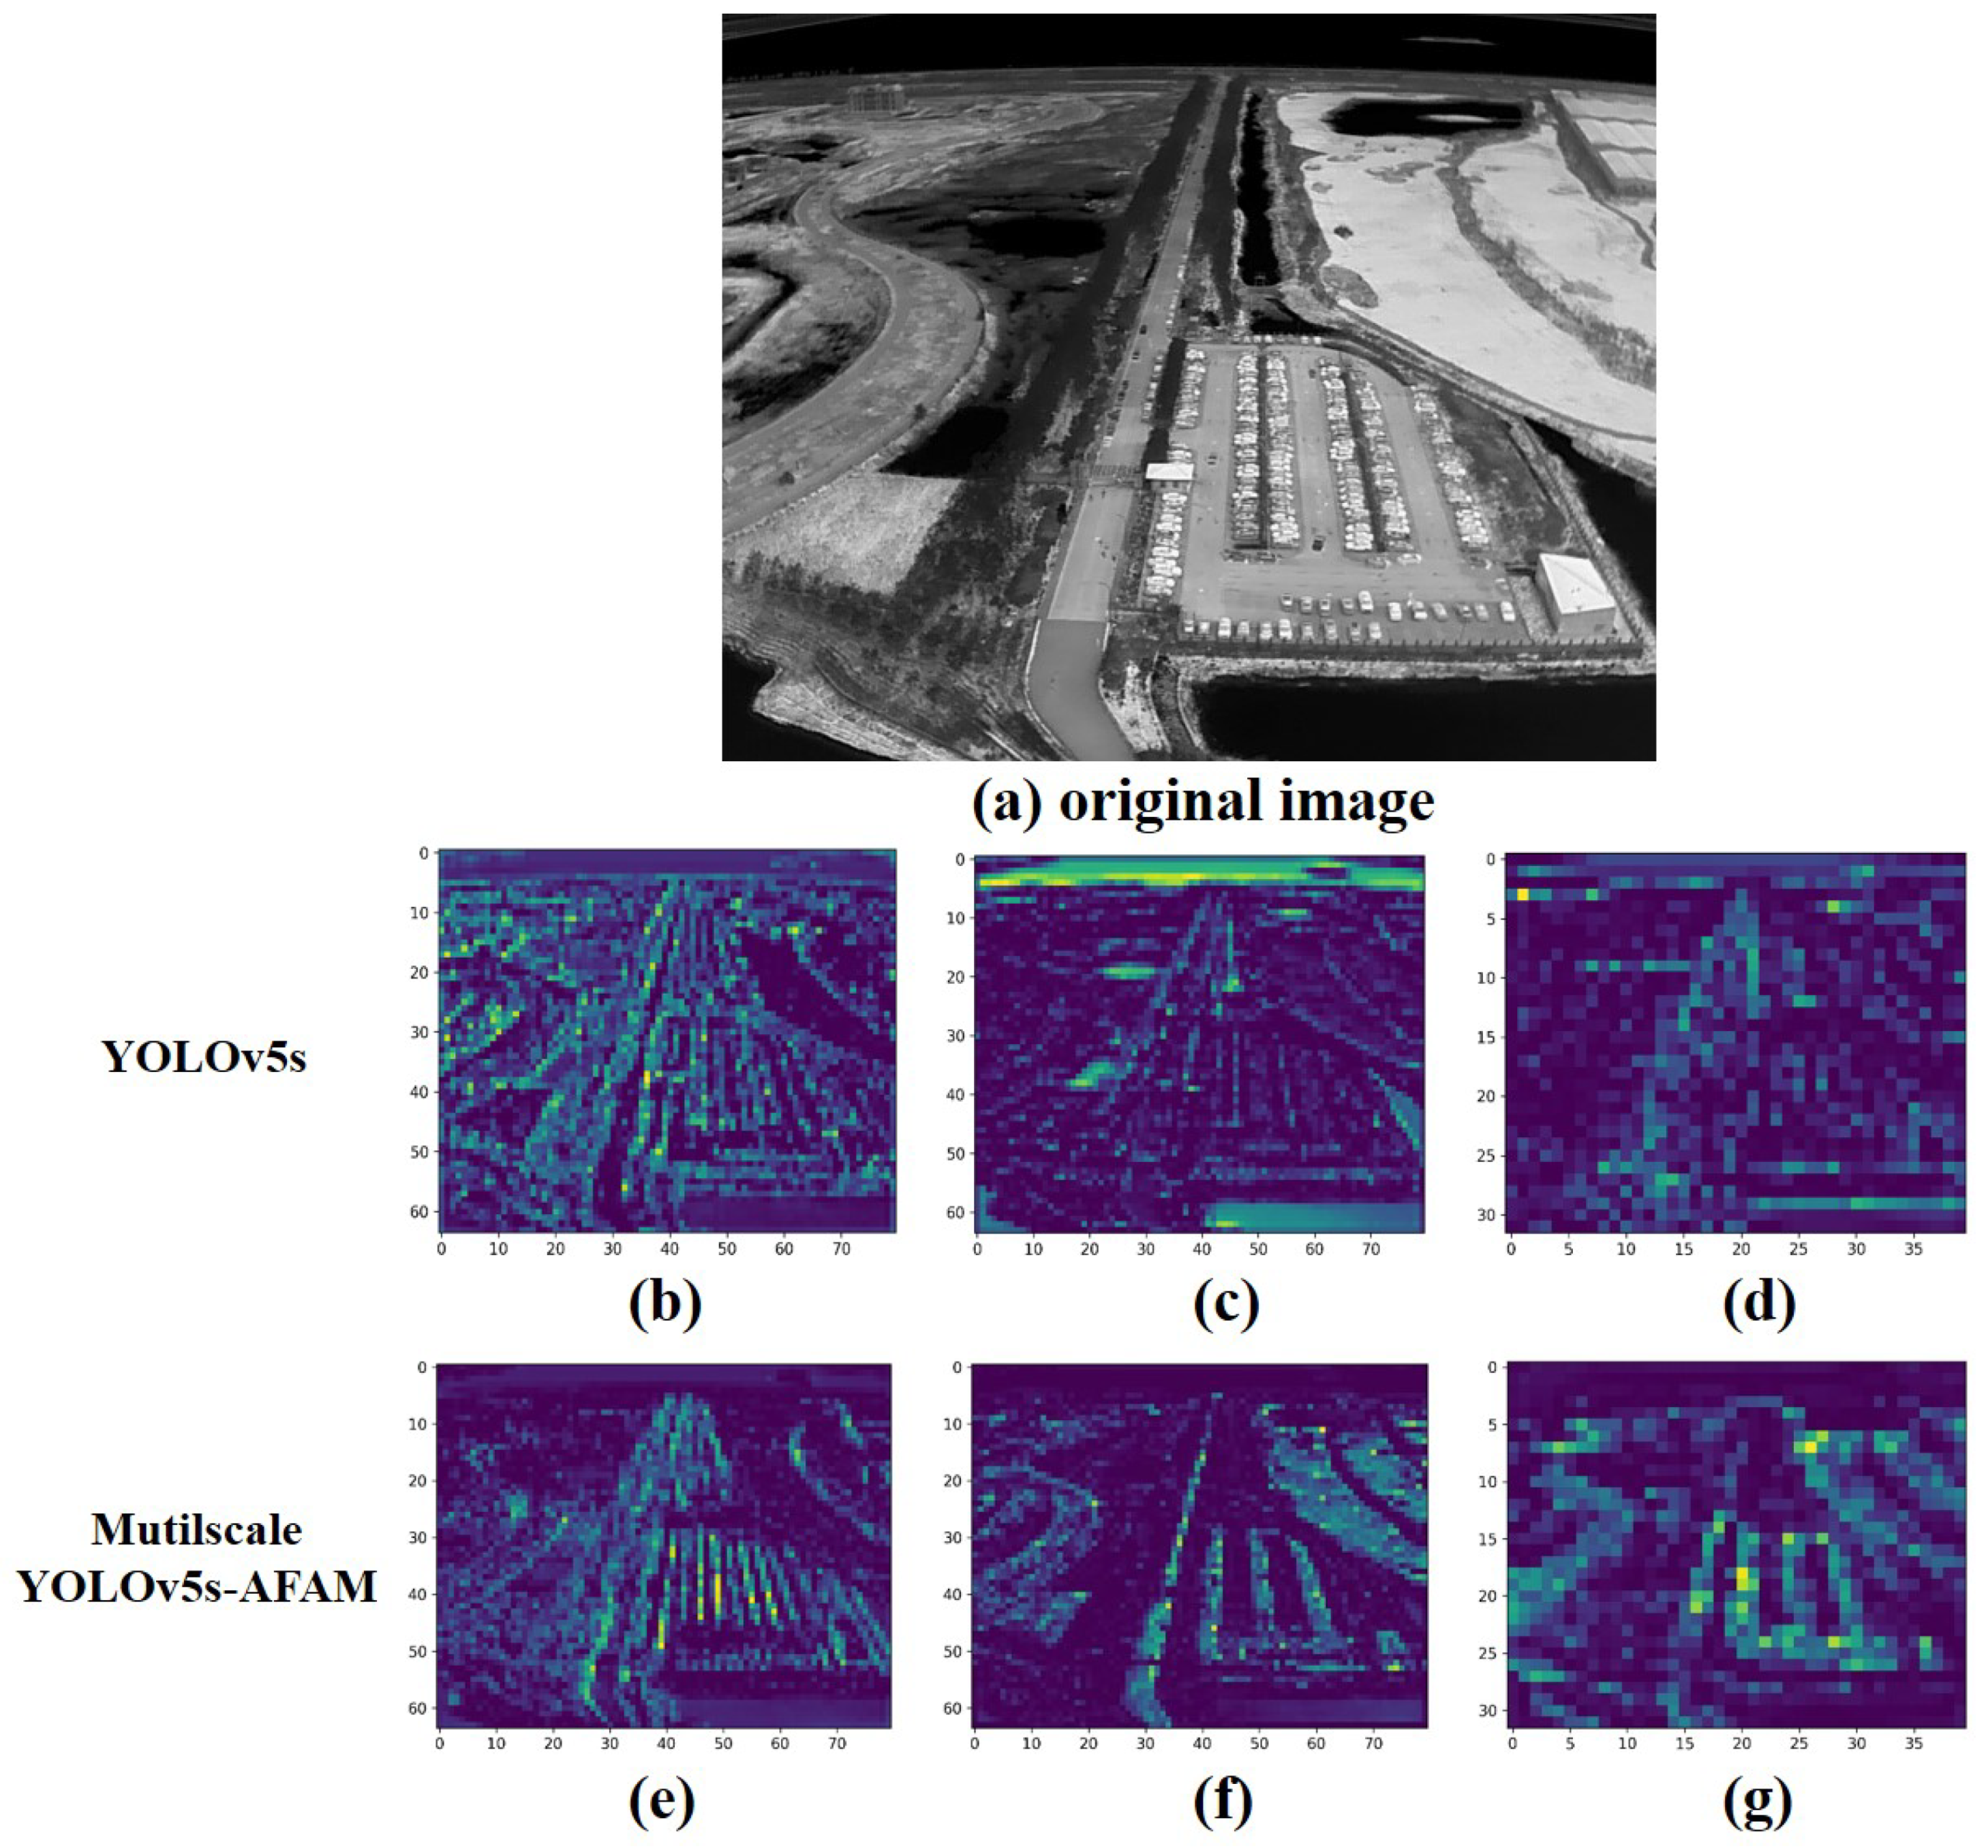
Heat map is a visualization tool that can demonstrate target detection results and visualize the target activation score as a colour image to observe the correctness and accuracy of the target detection results.
Figure 12 shows heat maps derived from a input image. The heat map can show information such as the density, distribution, or intensity of the data by the shade of colour. In addition, the heat map is used to visualize the activation level of the prediction corresponding to each position of the network on the image. Specifically, the image is divided into a number of small cells. Each grid corresponds to a confidence score, and these scores are then represented as shades of colour, with darker colours indicating a higher confidence level for the region on the image. The heat map provides a more visual indication of how well the algorithm detects different regions of the image and the confidence distribution of the results.
While in traditional detection networks, feature maps are usually treated with equal weights, the AFAM attention mechanism introduced by the improved algorithm proposes a dynamic weight assignment method that allows the network to focus adaptively on features in different regions. Through AFAM attention, the network is able to capture the features associated with the target more accurately.
The original image and its heat map detected by the improved algorithm are shown in
Figure 12.
(b) to (g) in
Figure 12 show the three stages of feature extraction by the network from light to dark. The green and yellow areas in the images indicate a higher probability of appearing targets, while the blue areas indicate a lower probability of appearing targets. It can be observed that the areas where targets appear in the algorithm’s heat map are usually dense areas such as roads and car parks in the scene, which are more capable of recognizing the active areas of the targets to be detected. As shown in (d) and (g) in the figure below, the central region and the coloured region in the lower right corner of the heat map of the algorithm proposed in this thesis are denser, corresponding to a greater possibility of the target being detected appearing in these regions, and the number and density of targets in the heat map are more consistent with the original scene, indicating that it locates the target object more accurately. Thus, it is demonstrated that the inclusion of the AFAM attention mechanism has a more significant improvement in the target detection performance of the algorithm, which can detect targets more accurately.
4. Conclusions
To tackle the characteristics of low signal-to-noise ratio, blurred background, and low proportion of infrared dim and small vehicles in images, we constructs an infrared dim and small vehicle target detection dataset, ISVD. Then we proposes a Multiscale YOLOv5-AFAM algorithm, which can improve the average accuracy while reducing parameters. The AFAM attention mechanism proposed in this paper is joined to the feature extraction backbone network to obtain more context information by increasing the receptive field and spatial feature fusion. In addition, the multiscale fusion structure is adapted for small target detection. Finally, the Conv module in the backbone network is replaced with a DownC fusion module which is combined with Maxpool and Convolutional downsampling to reduce the computational complexity while retaining more texture information. The experimental results show that mAP@0.5 of the improved algorithm, reaching 85.7% on the ISVD dataset, gets a 4.3% and 0.1% improvement compared to the YOLOv5s and the YOLOv7 respectively. At the same time, the parameters of the improved algorithm are 6.6% less than the YOLOv5s and only 17.98% of the YOLOv7. On the VEDAI dataset, the improved algorithm compared to the YOLOv5s algorithm gets a 5.3% improvement in mAP@0.5. In the future, the detection field will be broadened to further improve the model generalization capability, so that the model can better serve the analysis and processing of infrared dim small targets.
Author Contributions
Conceptualization, Y.W. and Y.M.; methodology, Y.W. and Y.M.; validation, Y.W. and Y.M.; formal analysis, Y.W. and Y.M.; writing—original draft preparation, Y.W. and Y.M.; writing—review and editing, L.Z., Y.S. and J.T.; visualization, Y.S. and J.T.; supervision, L.Z. and J.T. All authors have read and agreed to the published version of the manuscript.
Data Availability Statement
The dataset of this paper is openly available in [ISVD] at [
Baidu Drive (pw:cw1u)].
Conflicts of Interest
The authors declare no conflict of interest.
References
- Zhang, W.; Cong, M.; Wang, L. Algorithms for optical weak small targets detection and tracking: review. In Proceedings of the International Conference on Neural Networks and Signal Processing; 2003; Vol. 1, pp. 643–647. [Google Scholar] [CrossRef]
- Hu, Y.; Xu, S.; Cheng, X.; Zhou, C.; Xiong, M. AFSFusion: An Adjacent Feature Shuffle Combination Network for Infrared and Visible Image Fusion. Applied Sciences 2023, 13. [Google Scholar] [CrossRef]
- Ai, Y.; Liu, X.; Zhai, H.; Li, J.; Liu, S.; An, H.; Zhang, W. Multi-Scale Feature Fusion with Attention Mechanism Based on CGAN Network for Infrared Image Colorization. Applied Sciences 2023, 13. [Google Scholar] [CrossRef]
- Li, J.; Ye, J. Edge-YOLO: Lightweight Infrared Object Detection Method Deployed on Edge Devices. Applied Sciences 2023, 13. [Google Scholar] [CrossRef]
- Du, J.; Lu, H.; Zhang, L.; et al. A Spatial-Temporal Feature-Based Detection Framework for Infrared Dim Small Target. IEEE Trans. Geosci. Remote. Sens. 2022, 60, 1–12. [Google Scholar] [CrossRef]
- Jiang, X.; Cai, W.; Yang, Z.; et al. Infrared dim and small target detection based on YOLO-IDSTD algorithm. Infrared and Laser Engineering 2022, 51, 502–511. [Google Scholar] [CrossRef]
- Chen, C.L.P.; Li, H.; Wei, Y.; et al. A Local Contrast Method for Small Infrared Target Detection. IEEE Trans. Geosci. Remote. Sens. 2014, 52, 574–581. [Google Scholar] [CrossRef]
- Hou, X.; Zhang, L. Saliency Detection: A Spectral Residual Approach. In Proceedings of the IEEE Conference on Computer Vision and Pattern Recognition; 2007. [Google Scholar] [CrossRef]
- Girshick, R.; Donahue, J.; Darrell, T.; Malik, J. Rich feature hierarchies for accurate object detection and semantic segmentation. In Proceedings of the Proceedings of the IEEE conference on computer vision and pattern recognition; 2014; pp. 580–587. [Google Scholar]
- Girshick, R.B. Fast R-CNN. In Proceedings of the IEEE International Conference on Computer Vision; 2015; pp. 1440–1448. [Google Scholar] [CrossRef]
- Ren, S.; He, K.; Girshick, R.B.; et al. Faster R-CNN: Towards Real-Time Object Detection with Region Proposal Networks. In Proceedings of the Advances in Neural Information Processing Systems; 2015; pp. 91–99. [Google Scholar]
- Cai, Z.; Vasconcelos, N. Cascade r-cnn: Delving into high quality object detection. In Proceedings of the Proceedings of the IEEE conference on computer vision and pattern recognition, 2018, pp.; pp. 6154–6162.
- Jocher, G.; Stoken, A.; Borovec, J.; Chaurasia, A.; Changyu, L.; Laughing, A.; Hogan, A.; Hajek, J.; Diaconu, L.; Marc, Y.; et al. ultralytics/yolov5: V5. 0-YOLOv5-P6 1280 models AWS Supervise. ly and YouTube integrations. Zenodo 2021, 11. [Google Scholar]
- Ge, Z.; Liu, S.; Wang, F.; Li, Z.; Sun, J. Yolox: Exceeding yolo series in 2021. arXiv 2021, arXiv:2107.08430 2021. [Google Scholar]
- Chen, Q.; Wang, Y.; Yang, T.; Zhang, X.; Cheng, J.; Sun, J. You only look one-level feature. In Proceedings of the Proceedings of the IEEE/CVF conference on computer vision and pattern recognition; 2021; pp. 13039–13048. [Google Scholar]
- Wang, C.; Feng, W.; Liu, B.; Ling, X.; Yang, Y. Exploiting the Potential of Overlapping Cropping for Real-World Pedestrian and Vehicle Detection with Gigapixel-Level Images. Applied Sciences 2023, 13. [Google Scholar] [CrossRef]
- Redmon, J.; Divvala, S.K.; Girshick, R.B.; et al. You Only Look Once: Unified, Real-Time Object Detection. In Proceedings of the IEEE Conference on Computer Vision and Pattern Recognition; 2016; pp. 779–788. [Google Scholar] [CrossRef]
- Redmon, J.; Farhadi, A. YOLO9000: Better, faster, stronger. In Proceedings of the Proceedings of the IEEE conference on computer vision and pattern recognition, 2017, pp.; pp. 7263–7271.
- Redmon, J.; Farhadi, A. Yolov3: An incremental improvement. arXiv 2018, arXiv:1804.02767 2018. [Google Scholar]
- Bochkovskiy, A.; Wang, C.Y.; Liao, H.Y.M. Yolov4: Optimal speed and accuracy of object detection. arXiv 2020, arXiv:2004.10934 2020. [Google Scholar]
- Zhu, X.; Lyu, S.; Wang, X.; Zhao, Q. TPH-YOLOv5: Improved YOLOv5 based on transformer prediction head for object detection on drone-captured scenarios. In Proceedings of the Proceedings of the IEEE/CVF International Conference on Computer Vision; 2021; pp. 2778–2788. [Google Scholar]
- Zhao, Q.; Liu, B.; Lyu, S.; Wang, C.; Zhang, H. TPH-YOLOv5++: Boosting Object Detection on Drone-Captured Scenarios with Cross-Layer Asymmetric Transformer. Remote Sensing 2023, 15. [Google Scholar] [CrossRef]
- Dai, J.; Xu, Z.; Li, L.; et al. Improved YOLOv5-based Infrared Dim-small Target Detection under Complex Background. Infrared Technology 2022, 44, 504–512. (in Chinese). [Google Scholar]
- Liu, W.; Anguelov, D.; Erhan, D.; et al. SSD: Single Shot MultiBox Detector. In Proceedings of the European Conference Computer Vision, Vol. 9905; 2016; pp. 21–37. [Google Scholar] [CrossRef]
- Jocher, G.; Stoken, A.; Borovec, J.; et al. ultralytics/yolov5, 2021.
- Lin, T.; Dollár, P.; Girshick, R.B.; et al. Feature Pyramid Networks for Object Detection. In Proceedings of the IEEE Conference on Computer Vision and Pattern Recognition; 2017; pp. 936–944. [Google Scholar]
- He, K.; Zhang, X.; Ren, S.; Sun, J. Deep residual learning for image recognition. In Proceedings of the IEEE Conference on Computer Vision and Pattern Recognition; 2016; pp. 770–778. [Google Scholar]
- Bai, X.; Bi, Y. Derivative Entropy-Based Contrast Measure for Infrared Small-Target Detection. IEEE Trans. Geosci. Remote. Sens. 2018, 56, 2452–2466. [Google Scholar] [CrossRef]
- Wang, C.; Bochkovskiy, A.; Liao, H.M. YOLOv7: Trainable bag-of-freebies sets new state-of-the-art for real-time object detectors. CoRR 2022, abs/2207.02696. 2207.
Figure 1.
The architecture of YOLOv5. Specifically, Conv module (“Conv-BN-ReLU”) is the basic component of many important modules. C3 module includes the Conv Module and Bottleneck [
27] module. SPPF module consists of the Conv module, Maxpool Layer and Concat Layer.
Figure 1.
The architecture of YOLOv5. Specifically, Conv module (“Conv-BN-ReLU”) is the basic component of many important modules. C3 module includes the Conv Module and Bottleneck [
27] module. SPPF module consists of the Conv module, Maxpool Layer and Concat Layer.
Figure 2.
The architecture of multiscale YOLOv5-AFAM.
Figure 2.
The architecture of multiscale YOLOv5-AFAM.
Figure 3.
The network structure of AFAM.
Figure 3.
The network structure of AFAM.
Figure 4.
The structure of DownC module.
Figure 4.
The structure of DownC module.
Figure 5.
Improved multiscale fusion network (a) Four-scale feature fusion; (b) Four-scale shallow feature fusion; (c) Three-scale shallow feature fusion.
Figure 5.
Improved multiscale fusion network (a) Four-scale feature fusion; (b) Four-scale shallow feature fusion; (c) Three-scale shallow feature fusion.
Figure 6.
Samples of ISVD.
Figure 6.
Samples of ISVD.
Figure 7.
Distribution of Bounding Box size of ISVD. The x-axis represents the area of the Bounding boxes, and the y-axis represents the count of Bounding boxes.
Figure 7.
Distribution of Bounding Box size of ISVD. The x-axis represents the area of the Bounding boxes, and the y-axis represents the count of Bounding boxes.
Figure 8.
Comparison of mAP-GFLOPs on ISVD
Figure 8.
Comparison of mAP-GFLOPs on ISVD
Figure 9.
Improvement of single module. YOLOv5s is selected as baseline model.
Figure 9.
Improvement of single module. YOLOv5s is selected as baseline model.
Figure 10.
The changes in each indicator of the YOLOv5 model and the Multiscale YOLOv5-AFAM model during the training process. (a) box loss, (b) precision, (c) recall, (d) mAP@0.5, (e) mAP@0.5:0.95.
Figure 10.
The changes in each indicator of the YOLOv5 model and the Multiscale YOLOv5-AFAM model during the training process. (a) box loss, (b) precision, (c) recall, (d) mAP@0.5, (e) mAP@0.5:0.95.
Figure 11.
Four cases of comparison between two models. (a) False Negative, (b) False Positive in category, (c) False Positive from the background, (d) Under the dense and occluded scene.
Figure 11.
Four cases of comparison between two models. (a) False Negative, (b) False Positive in category, (c) False Positive from the background, (d) Under the dense and occluded scene.
Figure 12.
The thermodynamic diagrams of YOLOv5 and Multiscale YOLOv5-AFAM.
Figure 12.
The thermodynamic diagrams of YOLOv5 and Multiscale YOLOv5-AFAM.
Table 1.
Target parameter statistics for ISVD.
Table 1.
Target parameter statistics for ISVD.
| Dataset |
Number |
Frame |
Box size (mean) |
| car |
truck |
other vehicles |
car |
truck |
other vehicles |
| train |
7981 |
30284 |
20248 |
1683 |
(11.5,8.8) |
(21.0,13.1) |
(26.2,19.2) |
| test |
997 |
2929 |
2801 |
233 |
(10.0,8.2) |
(19.8,12.5) |
(20.8,15.7) |
| val |
998 |
3492 |
2572 |
184 |
(12.7,9.1) |
(21.3,13.4) |
(20.2,14.6) |
| all |
9976 |
36705 |
25621 |
2100 |
(11.5,8.8) |
(20.9,13.0) |
(25.1,18.4) |
Table 2.
The comparison between the ISVD image dataset and the previous infrared image datasets.
Table 2.
The comparison between the ISVD image dataset and the previous infrared image datasets.
| Object detection datasets |
Scenario |
Modality |
Target background |
Object size |
#Images |
Categories |
| VEDAI |
aerial |
R+NIR |
urban,
rural |
(20.11,19.76) |
1.2k |
9 |
| FLIR |
car |
R+I |
urban |
(37.69, 43.68) |
10228 |
5 |
| Drone Vehicle |
drone |
R+I |
urban |
(51.47,48.47) |
56,878 |
5 |
| ISVD |
drone |
I |
urban,
rural,
farmland,
mountains,
…… |
(15.73, 10.84) |
9976 |
3 |
Table 3.
Setting of the experimental platform.
Table 3.
Setting of the experimental platform.
| Name |
Related Configuration |
| GPU |
GeForce RTX 2080 Ti 11G |
| CPU |
Intel Xeon Platinum 8280 |
| Operating systems |
ubuntu18.04 |
| CUDA |
10.2 |
| cuDNN |
7.5 |
| PyTorch |
pytorch1.8.1+cu102 |
Table 4.
Setting of experimental parameters.
Table 4.
Setting of experimental parameters.
| Parameter |
Related Configuration |
| Epoch |
400 |
| Class number |
3 |
| Batch size |
32 |
| Image size |
640×640 |
| Batch size(test) |
1 |
Table 5.
Comparison experimental results on ISVD.
Table 5.
Comparison experimental results on ISVD.
| Models |
Params |
GFLOPs |
mAP@0.5 |
mAP@0.5:0.95 |
P |
R |
| YOLOv5s |
7.03M |
15.8 |
0.814 |
0.376 |
0.795 |
0.817 |
| YOLOv5m |
20.87M |
48 |
0.824 |
0.38 |
0.825 |
0.818 |
| YOLOv7 |
36.49M |
103.5 |
0.847 |
0.385 |
0.811 |
0.833 |
| ours |
6.56M |
17.8 |
0.857 |
0.396 |
0.803 |
0.857 |
Table 6.
Ablation comparison on different combinations of modules. Here, “4s”, “4ds” and “3ss” respectively indicate “4scales”, “4deepscales” and “3shallowscales”.
Table 6.
Ablation comparison on different combinations of modules. Here, “4s”, “4ds” and “3ss” respectively indicate “4scales”, “4deepscales” and “3shallowscales”.
| AFAM |
DownC |
4s |
4ds |
3ss |
Params |
GFLOPs |
mAP@0.5 |
mAP@0.5:0.95 |
P |
R |
| ✘ |
✘ |
✘ |
✘ |
✘ |
7.02M |
15.8 |
0.814 |
0.376 |
0.795 |
0.821 |
| √ |
✘ |
✘ |
✘ |
✘ |
6.66M |
14.7 |
0.827 |
0.379 |
0.785 |
0.844 |
| ✘ |
√ |
✘ |
✘ |
✘ |
6.42M |
15 |
0.823 |
0.378 |
0.826 |
0.797 |
| ✘ |
✘ |
√ |
✘ |
✘ |
7.17M |
18.6 |
0.840 |
0.377 |
0.799 |
0.852 |
| ✘ |
✘ |
✘ |
√ |
✘ |
7.19M |
22.5 |
0.848 |
0.392 |
0.797 |
0.854 |
| ✘ |
✘ |
✘ |
✘ |
√ |
7.15M |
18.6 |
0.842 |
0.386 |
0.805 |
0.831 |
| √ |
√ |
✘ |
✘ |
✘ |
6.05M |
13.8 |
0.825 |
0.382 |
0.817 |
0.795 |
| √ |
✘ |
√ |
✘ |
✘ |
6.80M |
17.5 |
0.840 |
0.383 |
0.789 |
0.864 |
| √ |
✘ |
✘ |
√ |
✘ |
6.83M |
21.4 |
0.832 |
0.383 |
0.78 |
0.868 |
| √ |
✘ |
✘ |
✘ |
√ |
6.79M |
17.4 |
0.843 |
0.387 |
0.826 |
0.846 |
| ✘ |
√ |
√ |
✘ |
✘ |
6.56M |
17.8 |
0.851 |
0.389 |
0.802 |
0.85 |
| ✘ |
√ |
✘ |
√ |
✘ |
6.59M |
21.7 |
0.852 |
0.383 |
0.806 |
0.852 |
| ✘ |
√ |
✘ |
✘ |
√ |
6.54M |
17.8 |
0.851 |
0.396 |
0.825 |
0.832 |
| √ |
√ |
√ |
✘ |
✘ |
6.19M |
16.6 |
0.844 |
0.39 |
0.823 |
0.829 |
| √ |
√ |
✘ |
√ |
✘ |
6.22M |
20.5 |
0.842 |
0.386 |
0.797 |
0.854 |
| √ |
√ |
✘ |
✘ |
√ |
6.56M |
17.8 |
0.857 |
0.396 |
0.803 |
0.857 |
|
Disclaimer/Publisher’s Note: The statements, opinions and data contained in all publications are solely those of the individual author(s) and contributor(s) and not of MDPI and/or the editor(s). MDPI and/or the editor(s) disclaim responsibility for any injury to people or property resulting from any ideas, methods, instructions or products referred to in the content. |
© 2023 by the authors. Licensee MDPI, Basel, Switzerland. This article is an open access article distributed under the terms and conditions of the Creative Commons Attribution (CC BY) license (http://creativecommons.org/licenses/by/4.0/).
