
Submitted:
04 June 2023
Posted:
05 June 2023
You are already at the latest version
Abstract
This study assessed the relationship between body posture displacements and cardiopulmonary function test (CPET) and skill related physical fitness tests. One hundred male (60%) and female collegiate athletes (22.2 ± 4yrs) with a normal body mass index (BMI up to 24.9) were assessed via the PostureScreen Mobile app to quantify postural displacements as head, thorax and pelvis rotations and translations. CPET and physical performance tests including the agility T-test, the vertical jump test, the stork static balance test (SSBT) and the dynamic Y-balance test (YBT) were performed. Spearman correlation (r) and p-values are reported. Postural parameters were found to have moderate-to-high associations with CPET and the agility test, moderate correlations with the vertical jump test and the SSBT (head and pelvic postures only), and weak correlations with the YBT. As postural parameters were more asymmetric, both CPET and performance skills scores were worse. For examples: 1) a medium positive correlation was found between cranio-vertebral angle (CVA) and vertical jump test (r = 0.54; p-value < 0.001) and SSBT (r = 0.57; p-value < 0.001), while a strong negative correlation was found between CVA and agility test (r = -0.86; p-value < 0.001). 2) A strong positive correlation was found between CVA and oxygen uptake efficiency slope, load watts VO2 at VT, VO2 / kg, load watts at respiratory compensation point (RCP), (r = 0.65 and r = 0.71; p < 0.001). Conversely, a significant negative correlation was found between CVA and VE / VO2 at VT (r = -0.61; p < 0.001). Postural rotations and translations of the head, thorax and pelvis were statistically correlated with physical performance skills and CPET in young collegiate athletes. There were moderate-to-high associations with cardiopulmonary functions and agility tests, moderate correlations with the vertical jump test, and weak correlations with the YBT. Postural alignment may be important for optimal physical performance and optimal cardiopulmonary function. Further research is necessary to elucidate reasons for these correlations as found in our sample of young and healthy athletes.
Keywords:
Posture
; Athletic performance
; Athletes
; Cardiopulmonary performance
1. Introduction
Athletic performance is influenced by various factors such as strength, endurance, and skill [1,2,3]. However, postural alignment is often overlooked despite being a critical component in optimal performance [4,5]. Proper posture is essential for athletes to perform at their best and minimize the risk of injuries. Unfortunately, many athletes develop postural aberrations due to various reasons, including repetitive movements and overuse of certain muscle groups. While many studies have suggested an association between postural abnormalities and exposure to athletic training across various age groups and different sports, the data available in this area is mostly limited to the sagittal profile [6,7,8]. For instance, several studies have shown an association between increased thoracic kyphosis and lumbar lordosis angles and exposure to athletic training [5,9].
Postural aberrations can have a negative impact on both respiratory function and physical fitness components, which in turn can lead to decreased athletic performance and an increased risk of injury [10,11,12]. Few studies have examined the relationship between posture and pulmonary function or physical fitness.[12,13] A recent study by Moustafa et al.[13] determined that college athletes with forward head posture exhibited less efficient physical fitness and altered sensorimotor processing and integration compared to athletes with normal sagittal head posture alignment [13]. Another study has shown a correlation between sagittal pelvic balance and the incidence of acute and micro-traumatic injuries of the pelvic-femoral complex [14]. There are also studies that have shown that sagittal spinal subluxations can lead to decreased pulmonary function, suggesting a direct relationship between spinal subluxation and pulmonary function through a somatovisceral reflex pathway via the sympathetic nervous system [15,16].
Importantly, most previous studies have only focused on sagittal plane alignment and have not considered translational and rotational posture aberrations [17,18,19]. To the best of our knowledge, there are currently no studies that have investigated this relationship within the context of translational and rotational posture aberrations specifically among collegiate athletes. Biomechanically, as the movements of the spine are intricate and involve complex coupling patterns that are influenced by the biomechanical characteristics between two segments [20,21]. Translation or rotation of the spine in one geometric plane can lead to simultaneous movements in other planes [22,23,24]. This emphasizes the importance of conducting a global posture assessment that considers translational and rotational displacements, as suggested by Harrison [19]. As postural aberrations can occur in all planes, not just the sagittal plane, there is a need for a more comprehensive understanding of the relationship between 3D posture parameters and pulmonary function to enhance athlete development and training.
Recent technological advancements have made it possible to accurately measure posture parameters, including translational and rotational changes [25,26]. These advancements present a unique opportunity to identify potential areas of postural abnormalities for interventions that can improve pulmonary function and athletic performance. Thus, the aim of this study is to provide a more comprehensive understanding of the relationship between 3D posture parameters, pulmonary function and athletic performance that may be essential to improve athlete development and training.
2. Materials and Methods
One-hundred healthy male and female collegiate athletes were recruited in this study. The inclusion criteria were: (i) ages between 17 to 26 and (ii) normal body mass index (BMI) of up to 24.9. Ethical approval was obtained from the Ethics Committee of the University (REC-22-11-26-S), and informed consent was obtained from all participants prior to data collection in accordance with relevant guidelines and regulations. All participants were screened for the following exclusion criteria: (i) inflammatory joint disease or other systemic pathologies; (ii) prior history of overt injury and surgery relating to the musculoskeletal system, or disorder related to the spine and extremities; and (iii) musculoskeletal pain in the previous three months.
2.1. Outcome measures
2.1.1. Posture measurement
Postural examination was carried out with a photographic method using the PostureScreen® Mobile app (PSM). The PSM application has been shown to be a reliable and valid method for evaluating static posture [25,26]. PSM is a mobile application designed to measure posture parameters in individuals. The app captures images of the participant from various angles, including anterior and posterior (coronal plane) and left and right (sagittal plane). The app calculates posture variables by digitally marking an individual's anatomical points, which may vary depending on the number of variables of interest. The process of digitally marking points consists of identifying and demarcating anatomical reference points, such as pelvic iliac spines, greater trochanter, femoral condyle, and tragus, directly on the mobile device screen. The app then calculates body angles and distances based on these marked points. The output file provided by the app includes values of posture variables and images that illustrate the marked points and their locations in relation to a neutral posture. These output files can be used to compare and analyze posture variables among participants.
2.1.2. Cardiopulmonary function test (CPET)
Cardiopulmonary function test (CPET) performance analyses was conducted within the recommendations of the American Heart Association (AHA) [27,28]. All CPETs were carried out in a single laboratory, where participants underwent an intensity-graded, maximal effort exercise test with continuous gas exchange in the absence of chest pain and ECG abnormalities (Figure 1). The device used was calibrated before each test. A treadmill was the method used in the tests, taking into consideration the population of the study and correlating the results with possible involvement of spinal malalignment [29,30,31]. The treadmill and surrounding equipment were thoroughly disinfected after every test (including but not limited to handlebars, hand holds, and rails). All participants were instructed to use the emergency stop buttons located on both sides of the treadmill ergometer in the event they were unable to finish the test for any given reason. In the event of termination of the exercise test, assessment of dyspnoea and leg effort was recorded using the modified Borg scale and the cause of termination of the test was recorded [32]. All performance data, including blood pressure were recorded continuously during the tests. For the ventilatory parameters, we considered VE / VCO2 slope, VO2 (ml / min) at VT, VO2 / kg and VE I / min (VE / VO2 at VT) [33]. All ventilatory parameters were recorded through a respiratory valve and mouthpiece incorporating a gas analyzer.
Maximal CPET protocol was carried out on the treadmill (800 series, BTL Cardiopoint, United Kingdom) with sport-specific incremental protocols. We started the protocol with a single minute sitting / resting phase, followed by 2 min flat walk at 6 km / h as a warm-up setting. This was proceeded by continuous 8 and up to 10 km / h inclined running with an increasing slope of 1.0% at every minute until participant exhaustion is recorded. After termination of running (VT), measurements were continuously taken for 1-minute at a 4 km / h walk, followed by 4-minutes rest [32,34,35].
2.1.3. Athletic performances
Agility and speed, leg power, static balance, and dynamic balance were evaluated as indicators of athletic performance.
2.1.3.1. Agility: T-test
The agility T-test, a test of four-directional running speed that demands quick changes in direction while maintaining speed and balance, was used to assess agility. The validity of the T-test in comparison to the 40-yard dash and the hexagon test is well-established [36]. The statistical analysis was performed on the quickest of three trials. Trial times were tracked to the nearest tenth of a second. (See Figure 2).
2.1.3.2. Leg power: Non-countermovement vertical jump test
The non-countermovement vertical jump test, often referred to as a squat jump or static jump test, was used to assess leg power [37]. Participants were positioned in a shoulder-width apart stance. They were requested to squat for a brief second with their knees flexed to 70°, then leap as high as they could. By placing one hand on the wall, participants marked the height of their jump. The vertical jump height was determined to be the mean of three trials. (Shown in Figure 3).
2.1.3.3. Static balance: Stork static balance test
Static balance was evaluated using the stork static balance test [38]. With both hands on their hips and their opposite foot resting against their standing knee, participants stood on their stronger leg, and lifted the heel of the standing leg off the ground at the "go" signal. Participants were asked to maintain this position for as long as possible. The best result out of 3 trials was used. The test was terminated when the raised heel landed on the ground or when the opposing foot moved away from the knee. There is evidence that test-retest reliability is in the clinically desirable range [38].
2.1.3.4. Dynamic balance: Y-balance test or YBT
The participant's dominant leg was evaluated for dynamic balance using the lower quarter Y-balance test (YBT) [38]. Participants' leg lengths were first measured while lying supine, measuring from the anterior superior iliac spine to the most distal aspect of the medial malleolus. Participants were instructed to stand on the dominant leg with the great toe placed at the center of an installed floor marking tapes aligned in 3 directions (anterior, postero-medial, and postero-lateral). The two posterior lines extended at an angle of 135° from the anterior line. Participants were asked to go in three directions while maintaining a single-limb stance (shown in Figure 4). Trials were repeated if (a) the reaching foot did not touch the required line while maintaining single-limb stance, (b) the stance foot was lifted from the center, (c) the balance was lost at any point, (d) participants did not maintain start and return positions for one full second, and / or (e) they touched the reaching foot to gain support. The maximal reach was measured in each direction. The composite score (CS) was calculated as: CS = ([maximum anterior reach distance + maximum postero-medial reach distance + maximum postero-lateral reach distance] / [leg length × 3] × 100). Three trials were conducted in each direction with a rest interval for 2-minutes and the best out of 3 trials was used. Test-retest reliability (ICC’s) for the different reach directions range between 0.90 and 0.95 [38].
2.2. Data analysis
2.2.1. Sample size determination
Statistical analysis was then performed using SPSS statistical software version 25. A Fisher Z transformation was utilized for sample size estimation with the power set at .80, the beta set at .20 and the alpha set at .05. The estimated needed sample size for correlation was at least 74. A larger sample size of 100 was used to ensure external validity and to strengthen the study.
2.2.2. Statistical analysis
Descriptive data are presented as mean ± standard deviation. To determine the normality of the collected numerical variables, the Shapiro-Wilk test was used; however, none of the numerical variables satisfied the parametric assumptions, so they are described using the median and interquartile range (IQR). Next, spearman correlation was performed, and the correlation coefficient (r) and p-values are reported to demonstrate the relationship between posture parameters and physical performance skills, as well as the posture parameters and cardiopulmonary functions. The correlation coefficient can be any number between -1 and 1, where a negative sign indicates a negative correlation, and a positive sign indicates a positive correlation. The level of significance was set at 0.05, and the correlation was considered statistically significant when the p-value is less than 0.05.
3. Results
3.1. Participant demographics and characteristics
Participant characteristics are shown in Table 1. The Shapiro-Wilk test was used to test for the normality of the numerical variables, all the numerical variables were not following the parametric assumptions, so, they are described by using median and interquartile range (Table 2, Table 3 and Table 4).
3.2. Correlations between variables
3.2.1. Correlations between posture and performance skills
Several correlations were identified between posture parameters and physical performance skills (Table 5 and Table 6). A medium positive correlation was found between cervical vertebral angle (CVA) and vertical jump test (r = 0.54; p-value < 0.001), while a strong negative correlation was found between CVA and agility test (r = -0.86; p-value < 0.001). A medium positive correlation was also identified also between CVA and Stork balance test (r= 0.57, p-value = < 0.001). A negative medium correlation was found between stork balance test and lateral head translation as well as anterior head translation (AHT) (r= -0.46, -0.51, respectively, p-value= <0.001, <0.001 respectively). There was however, a very weak correlation between stork balance test and lateral angulation head, and a weak correlation with thoracic kyphosis (r= -0.19, r= -0.27 respectively, p-value= 0.13, 0.002 respectively).
There was also a negative medium correlation between lateral translation head sagittal and y balance test anterior left, y balance test posterolateral left and right ( r = -0.35, -0.42, -0.40, respectively, p-value = 0.004, < 0.001, < 0.001 respectively), and a strong positive correlation between lateral translation head sagittal and agility test ( r = 0.786; p-value < 0.001). A negative medium correlation was found between anterior head translation (AHT) coronal and y balance test anterior left, y balance test posterolateral left and right, y balance posteromedial left and right (r = -0.44, -0.48, -0.46, -0.47, and -0.39 respectively, p-value < 0.001), and a strong positive correlation was found between AHT coronal and agility test ( r = 0.81; p-value < 0.001). Additionally, a strong positive correlation was found between lateral angulation head and agility test (r = 0.74; p-value < 0.001), thoracic kyphosis and agility test (r = 0.695; p-value < 0.001), and rib anterior translation coronal and agility test (r = 0.75; p-value < 0.001).
Furthermore, a medium negative correlation was found between pelvic tilt and vertical jump test (r = -0.54; p-value < 0.001), while a significant positive strong correlation was found between pelvic tilt and agility test (r = 0.79; p-value < 0.001). There was however a weak negative correlation between pelvic tilt and stork balance test (r = -0.35, p-value = 0.02). A negative medium correlation was found between hip pelvis lateral angulation and vertical jump test as well as with stork balance test ( r = -0.48, -0.44 respectively; p-value < 0.001), and a positive strong correlation was found between hip pelvis lateral angulation and agility test (r = 0.79; p-value < 0.001). Similarly, there was a medium negative correlation between hip pelvis anterior translation coronal and vertical jump test as well as stork balance test(r = -0.65, -0.47 respectively; p-value < 0.001), and a positive strong correlation was found between hip pelvis anterior translation coronal and agility test (r = 0.78; p-value < 0.001). Lastly, there was a medium negative correlation between hip pelvis lateral translation and vertical jump test (r = -0.56; p-value < 0.001), while a significant positive strong correlation was found between hip pelvis lateral translation and agility test (r = 0.73; p-value < 0.001).
3.2.2. Correlations cardiopulmonary measures and performance skills
There were also significant correlations between posture parameters and cardiopulmonary functional parameters identified (Table 7 and Table 8). A strong positive correlation was found between CVA and oxygen uptake efficiency slope, load watts VO2 at VT, VO2 / kg, load watts at respiratory compensation point (RCP), (r = 0.65 and r = 0.71; p < 0.001). Conversely, a significant negative correlation was found between CVA and VE / VO2 at VT (r = -0.61; p < 0.001). Furthermore, there was also a strong negative correlation between lateral translation head sagittal and oxygen uptake efficiency slope, load watts VO2 at VT and VO2 / kg, load watts at RCP; (r = -0.62 and r = -0.72, p < 0.001, respectively) and a strong positive correlation between lateral head translation and VE / VO2 at VT (r = 0.65; p < 0.001).
4. Discussion
We aimed to assess the association between postural displacements - as described in translations and rotations of the head, thorax and pelvis - in relation to both cardiopulmonary function as well as physical performance skills. In our young collegiate athlete populations, we identified many statistically significant correlations between posture displacements and the cardiopulmonary and athletic skills including moderate-to-high associations with cardiopulmonary function measures and agility testing, moderate correlations with the vertical jump test and Stork balance test, and weak correlations with the YBT. Differences in both cardiopulmonary and physical performance skills based on postural parameters in this young and healthy population adds to a growing body of literature showing the importance of posture; that is, poor postural alignment being associated with negative effects in asymptomatic populations [12,13].
A recent study assessing sensorimotor integration and somatosensory processing variables between asymptomatic individuals with and without forward head posture found that the CVA significantly correlated with all measured neurophysiological variables indicating that as forward head posture increased, sensorimotor integration and somatosensory evoked potential (SEP) processing became less efficient [39]. Regarding sport performance, two recent investigations have identified that postural profiles in the sagittal plane are associated with athletic skills and functional performance measures [12,13]. For instance, Moustafa and colleagues [13] found that college athletes having increased forward head posture exhibited both altered sensorimotor processing and integration measures and also less efficient skill-related physical skills versus athletes without forward head posture. The previous investigation assessing sensorimotor integration and SEP’s [39] provides a neurophysiological explanation of our results herein and suggests posture is an important determinant of peak physical performance.
4.1. Posture and athletic skill measures
How could asymmetry in posture, in terms of rotations and translations, contribute to decrements in physical performance skills? First, any asymmetric posture automatically changes the three-dimensional length-tension relationships of the muscle and tendons [40], and because peak athletic performance translates into differences of fractions of seconds and / or millimeters, poor postures could translate into small but significant decrements in athletic skill performance. Studies have shown that postural alignment affects muscle force production as measured by electromyography (EMG). Kumar and Naraya [41], for example, determined that having a pre-rotated thoracic posture resulted in reduced torque generation. Further, Roy et al. [40] determined that an initial trunk flexion position determined normalized L3 EMG activity and trunk extension torque indicative of the neuromuscular efficiency; that is, trunk muscle synergism is modulated by posture.
Many studies have found differences between athletes and non-athletes in body posture [42,43] and also differences in postures between athletes competing in different sports [44,45,46]. It may be that habitual postures adopted during athletic performance leads to sport-specific permanent changes in postural alterations as Kruusamäe et al. [45] suggest. This may be due to the postural muscle strengthening resulting from repeated intensive exercise [46]. An important consideration may be that regardless of being an athlete, poor asymmetric body postures may be common, and that these asymmetric postures adversely affect body dynamics. Grabara [42], for example, found that postural alterations were found in both athletes and controls. Certainly, the structure of the posture determines its dynamics [47], and the results from the current study support the notion of quite clear relationships between physical performance measures and body postures; that is, better postures are associated with better performance. Thus, poor postural alignment creates non-ergonomic disequilibrium about the gravity line [48] that in turn, changes muscle length-tension relationships and results in changes in physical performance.
4.2. Posture and cardiopulmonary function measures
The cardiopulmonary function measures including greater VO2 at VT, greater VO2 / kg and smaller VE L / Min all demonstrated poorer values and were statistically significantly correlated to asymmetric postures for all the posture parameters assessed. In other words, the larger the postural displacements, the worse the cardiopulmonary measures; these were of moderate-to-high relationships, most being r = 0.6-0.7, p <0.001. Posture as assessed as translations and rotations of the head, thorax and pelvis have not, to our knowledge, been correlated with cardiopulmonary functional measures previously, and it is not known how posture and cardiopulmonary measures are related. We speculate, however, that one of the mechanisms responsible for some of the main effects has to do with how posture alterations of the head and cervical spine influence respiratory mechanics [49,50]. For examples, in a pilot project using spirometry, Kapreli and colleagues [49] identified a strong correlation between forward head posture (FHP) and reduced respiratory muscle strength in chronic neck pain patients. Changing the position of the head causes disturbances in the three-dimensional (3-D) shape of the chest and its respiratory movements. Szczygiel et al. [50], using a 3-D photogrammetric system, found that FHP caused limited movement of the lower ribcage during respiration in all 3 planes: sagittal, frontal and transverse; while lateral tilt of the head caused participants to have a reduced lower chest expansion and increased amplitude of respiratory movements of the upper chest.[50] Still, future research is needed to determine the specific reasons for the changes in cardiopulmonary measures identified in the current investigation and the implications of the complex relationship between altered posture and cardiopulmonary findings.
4.3. Limitations
There are several limitations of this current investigation all pointing to possible future works. First, because we chose a young adult population comprised of asymptomatic collegiate athletes, it is not possible to extrapolate our results to different decade of life populations and / or musculoskeletal pain populations. Second, this study did not address the causal relationship between abnormal postures and cardiopulmonary function and skill related physical fitness. Future investigations are needed to determine the causal relationship and refute or confirm our study’s proposed limitations and their possible relevancies. Furthermore, it is unknown if rehabilitation programs guided by both altered postural alignment and functional disturbances would theoretically benefit and perhaps have greater success in the treatment of spinal disorders and decreased athletic and cardiopulmonary performance measures.
4.4. Conclusions
Posture parameters, in terms of rotations and translations of the head, thorax and pelvis, were statistically correlated with physical performance skills and cardiopulmonary function. There were moderate-to-high associations with cardiopulmonary functions and agility tests, moderate correlations with the vertical jump test, and weak correlations with the YBT. Postural alignment may be important for optimal physical performance and optimal cardiopulmonary function. Further research is necessary to elucidate reasons for these correlations as found in our sample of young and healthy athletes.
Author Contributions
T.M., I.M.M., G.K.A. and D.E.H. conceived the research idea and participated in its design. T.M., I.M.M., G.K.A. and D.E.H. contributed to the statistical analysis. T.M., I.M.M. and G.K.A. participated in data collection and study supervision. I.M.M., P.A.O. and D.E.H. contributed to the interpretation of the results and wrote the drafts. All authors have read and agreed to the published version of the manuscript.
Funding
CBP Nonprofit (Eagle, ID, USA) approved possible funding of this manuscript for publication fees in the JCM. Deed Harrison’s role as a senior author and conflicts of interest are outlined below.
Institutional Review Board Statement
The research was conducted in accordance with the senior citizen’s services department and approved by the Research Institute of Medical & Health Sciences of the University of Sharjah (reference number: REC-22-11-26-S).
Informed Consent Statement
All participant’s pictures in the study were included after written informed consent was signed and obtained.
Data Availability Statement
The datasets analyzed in the current study are available from the corresponding author upon reasonable request.
Conflicts of Interest
PAO is a paid consultant for CBP NonProfit, Inc. DEH teaches rehabilitation methods and is the CEO of a company that distributes products to physicians in the U.S.A. used for the rehabilitation of postural abnormalities. All the other authors declare that they have no competing interests.
References
- Barley, O.R.; Chapman, D.W.; Guppy, S.N.; Abbiss, C.R. Considerations when assessing endurance in combat sport athletes. Front. Physiol. 2019, 10, 205. [Google Scholar] [CrossRef]
- Suchomel, T.J.; Nimphius, S.; Stone, M.H. The importance of muscular strength in athletic performance. Sport. Med. 2016, 46, 1419–1449. [Google Scholar] [CrossRef] [PubMed]
- Pichardo, A.W.; Oliver, J.L.; Harrison, C.B.; Maulder, P.S.; Lloyd, R.S.; Kandoi, R. The influence of maturity offset, strength, and movement competency on motor skill performance in adolescent males. Sports (Basel). 2019, 7, 168. [Google Scholar] [CrossRef]
- Zemková, E.; Zapletalová, L. The role of neuromuscular control of postural and core stability in functional movement and athlete performance. Front. Physiol. 2022, 13, 56. [Google Scholar] [CrossRef]
- Andreeva, A.; Melnikov, A.; Skvortsov, D.; Akhmerova, K.; Vavaev, A.; Golov, A.; Draugelite, V.; Nikolaev, R.; Chechelnickaia, S.; Zhuk, D.; et al. Postural stability in athletes: The role of sport direction. Gait Posture 2021, 89, 120–125. [Google Scholar] [CrossRef]
- Barczyk-Pawelec, K.; Rubajczyk, K.; Stefańska, M.; Pawik, Ł.; Dziubek, W. Characteristics of body posture in the sagittal plane in 8–13-year-old male athletes practicing soccer. Symmetry 2022, 14, 210. [Google Scholar] [CrossRef]
- Ginés-Díaz, A.; Martínez-Romero, M.T.; Cejudo, A.; Aparicio-Sarmiento, A.; de Baranda, P.S. Sagittal spinal morphotype assessment in dressage and show jumping riders. J. Sport Rehabil. 2019, 29, 533–540. [Google Scholar] [CrossRef] [PubMed]
- Cejudo, A.; Centenera-Centenera, J.M.; Santonja-Medina, F. The potential role of hamstring extensibility on sagittal pelvic tilt, sagittal spinal curves and recurrent low back pain in team sports players: A gender perspective analysis. Int. J. Environ. Res. Public Heal. 2021, 18, 8654. [Google Scholar] [CrossRef]
- Jackson, L.R.; Purvis, J.; Brown, T. The effects of postural and anatomical alignment on speed, power, and athletic performance in male collegiate athletes: A randomized controlled trial. Int. J. Sports Phys. Ther. 2019, 14, 623–636. [Google Scholar] [CrossRef]
- Kim, M.S.; Cha, Y.J.; Choi, J.D. Correlation between forward head posture, respiratory functions, and respiratory accessory muscles in young adults. J. Back Musculoskelet. Rehabil. 2017, 30, 711–715. [Google Scholar] [CrossRef]
- Koseki, T.; Kakizaki, F.; Hayashi, S.; Nishida, N.; Itoh, M. Effect of forward head posture on thoracic shape and respiratory. J. Phys. Ther. Sci. 2019, 31, 63–68. [Google Scholar] [CrossRef]
- Koźlenia, D.; Kochan-Jacheć, K.; Domaradzki, J. The role of spine curvatures in the sagittal plane in physical performance among team sports players. J. Sports Med. Phys. Fitness. 2023, May 9. Epub ahead of print. 9 May. [CrossRef] [PubMed]
- Moustafa, I.; Kim, M.; Harrison, D.E. Comparison of sensorimotor integration and skill-related physical fitness components between college athletes with and without forward head posture. J. Sport Rehabil. 2022, 32, 53–62. [Google Scholar] [CrossRef]
- Ferenczi, A.; Moraux, A.; Le Gall, F.; Andr´, A.; Thevenon, A.; Erie Wieczorek, V. Relationship between spinal-pelvic sagittal balance and pelvic-femoral injuries in professional soccer players. Orthop. J. Sports Med. 2020, 8, 2325967119894962.
- Dreimann, M.; Hoffmann, M.; Kossow, K.; Hitzl, W.; Meier, O.; Koller, H. Scoliosis and chest cage deformity measures predicting impairments in pulmonary function: A cross-sectional study of 492 patients with scoliosis to improve the early identification of patients at risk. Spine 2014, 39, 2024–2033. [Google Scholar] [CrossRef] [PubMed]
- Barassi, G.; Bellomo, R.G.; Di Giulio, C.; Giannuzzo, G.; Irace, G.; Barbato, C.; Saggini, R. Effects of manual somatic stimulation on the autonomic nervous system and posture. Adv. Exp. Med. Biol. 2018, 1070, 97–109. [Google Scholar] [PubMed]
- Harrison, D.D. Abnormal postural permutations calculated as rotations and translations from an ideal normal upright static posture. In: Sweere JJ, Chiropractic Family Practice. Gaithersburg: Aspen Publishers, 1992, chap 6–1, pp 1–22.
- Harrison, D.D.; Janik, T.J.; Harrison, G.R.; Troyanovich, S.; Harrison, D.E.; Harrison, S.O. Chiropractic biophysics technique: a linear algebra approach to posture in chiropractic. J. Manipulative Physiol. Ther. 1996, 19, 525–535. [Google Scholar] [PubMed]
- Harrison, D.E.; Oakley, P.A. An introduction to Chiropractic BioPhysics® (CBP®) technique: A full spine rehabilitation approach to reducing spine deformities. Complement. Ther. 2022. [Google Scholar] [CrossRef]
- Widmer, J.; Cornaz, F.; Scheibler, G.; Spirig, J.M.; Snedeker, J.G.; Farshad, M. Biomechanical contribution of spinal structures to stability of the lumbar spine—novel biomechanical insights. Spine J. 2020, 20, 1705–1716. [Google Scholar] [CrossRef] [PubMed]
- Liebsch, C.; Wilke, H.J. How does the rib cage affect the biomechanical properties of the thoracic spine? A systematic literature review. Front. Bioeng. Biotechnol. 2022, 10, 904539. [Google Scholar] [CrossRef]
- Striplin, M.R.; Beach, D.J. The prevalence and severity of lumbar spine motion impairment in normal subjects. J. Spinal Disord. Tech. 2012, 25, E115–E116. [Google Scholar] [CrossRef]
- Nachemson, A.L.; Schultz, A.B.; Berkson, M.H. Mechanical properties of human lumbar spine motion segments. Influence of age, sex, disc level, and degeneration. Spine, 1979, 4, 1–8. [Google Scholar] [CrossRef] [PubMed]
- Lowery, W.D. Jr.; Horn, T.J.; Boden, S.D.; Wiesel, S.W. Impairment evaluation based on spinal range of motion in normal subjects. J. Spinal Disord. 1992, 5, 398–402. [Google Scholar] [CrossRef]
- Szucs, K.A.; Brown, E.V.D. Rater reliability and construct validity of a mobile application for posture analysis. J. Phys. Ther. Sci. 2018, 30, 31–36. [Google Scholar] [CrossRef] [PubMed]
- Boland, D.M.; Neufeld, E. V; Ruddell, J.; Dolezal, B.A.; Cooper, C.B. Inter- and intra-rater agreement of static posture analysis using a mobile application. J. Phys. Ther. Sci. 2016, 28, 3398–3402. [Google Scholar] [CrossRef] [PubMed]
- Raghuveer, G.; Hartz, J.; Lubans, D.R.; Takken, T.; Wiltz, J.L.; Mietus-Snyder, M.; Perak, A.M.; Baker-Smith, C.; Pietris, N.; Edwards, N.M. Cardiorespiratory fitness in youth: An important marker of health: A scientific statement from the American Heart Association. Circulation 2020, 142, E101–E118. [Google Scholar] [CrossRef]
- Mazaheri, R.; Schmied, C.; Niederseer, D.; Guazzi, M. Cardiopulmonary exercise test parameters in athletic population: A review. J. Clin. Med. 2021, 10, 5073. [Google Scholar] [CrossRef] [PubMed]
- Price, S.; Wiecha, S.; Cieśliński, I.; Śliż, D.; Kasiak, P.S.; Lach, J.; Gruba, G.; Kowalski, T.; Mamcarz, A. Differences between treadmill and cycle ergometer cardiopulmonary exercise testing results in triathletes and their association with body composition and body mass index. Int. J. Environ. Res. Public Health 2022, 19, 3557. [Google Scholar] [CrossRef]
- Decato, T.W.; Bradley, S.M.; Wilson, E.L.; Hegewald, M.J. Repeatability and meaningful change of CPET parameters in healthy subjects. Med. Sci. Sports Exerc. 2018, 50, 589–595. [Google Scholar] [CrossRef]
- Takken, T.; Mylius, C.F.; Paap, D.; Broeders, W.; Hulzebos, H.J.; Van Brussel, M.; Bongers, B.C. Reference values for cardiopulmonary exercise testing in healthy subjects – an updated systematic review. Expert Rev. Cardiovasc. Ther. 2019, 17, 413–426. [Google Scholar] [CrossRef]
- Glaab, T.; Taube, C. Practical guide to cardiopulmonary exercise testing in adults. Respir. Res. 2022, 23, 1–12. [Google Scholar] [CrossRef]
- Paap, D.; Takken, T. Reference values for cardiopulmonary exercise testing in healthy adults: A systematic review. Expert Rev. Cardiovasc. Ther. 2014, 12, 1439–1453. [Google Scholar] [CrossRef] [PubMed]
- Gibbons, R.J.; Balady, G.J.; Beasley, J.W.; Bricker, J.T.; Duvernoy, W.F.C.; Froelicher, V.F.; Mark, D.B.; Marwick, T.H.; McCallister, B.D.; Thompson, P.D.; et al. Conference. J. Am. Coll. Cardiol. 1997, 30, 260–315. [Google Scholar] [PubMed]
- Pritchard, A.; Burns, P.; Correia, J.; Jamieson, P.; Moxon, P.; Purvis, J.; Thomas, M.; Tighe, H.; Sylvester, K.P. ARTP statement on cardiopulmonary exercise testing 2021. BMJ Open Respir. Res. 2021, 8, e001121. [Google Scholar] [CrossRef] [PubMed]
- Pauole, K.; Madole, K.; Garhammer, J.; Lacourse, M.; Rozenek, R. Reliability and validity of the T-test as a measure of agility, leg power, and leg speed in college-aged men and women. J. Strength Cond. Res. 2000, 14, 443–450. [Google Scholar]
- Van Hooren, B.; Zolotarjova, J. The difference between countermovement and squat jump performances: A review of underlying mechanisms with practical applications. J. Strength Cond. Res. 2017, 31, 2011–2020. [Google Scholar] [CrossRef]
- Negra, Y.; Chaabene, H.; Sammoud, S.; Bouguezzi, R.; Abbes, M.A.; Hachana, Y.; Granacher, U. Effects of plyometric training on physical fitness in prepuberal soccer athletes. Int. J. Sports Med. 2017, 38, 370–377. [Google Scholar] [CrossRef]
- Moustafa, I.M.; Diab, A.A.M.; Harrison, D.E. Does forward head posture influence somatosensory evoked potentials and somatosensory processing in asymptomatic young adults? J. Clin. Med. 2023, 12, 3217. [Google Scholar] [CrossRef]
- Roy, A.L.; Keller, T.S.; Colloca, C.J. Posture-dependent trunk extensor EMG activity during maximum isometrics exertions in normal male and female subjects. J. Electromyogr. Kinesiol. 2003, 13, 469–476. [Google Scholar] [CrossRef]
- Kumar, S.; Narayan, Y. Torque and EMG in rotation extension of the torso from pre-rotated and flexed postures. Clin. Biomech. 2006, 21, 920–931. [Google Scholar] [CrossRef] [PubMed]
- Grabara, M. Comparison of posture among adolescent male volleyball players and non-athletes. Biol. Sport. 2015, 32, 79–85. [Google Scholar] [CrossRef] [PubMed]
- Grabara, M. A comparison of the posture between young female handball players and non-training peers. J. Back Musculoskelet. Rehabil. 2014, 27, 85–92. [Google Scholar] [CrossRef]
- Domaradzki, J.; Kochan-Jacheć, K.; Trojanowska, I.; Koźlenia, D. Kickboxers and crossfitters vertebral column curvatures in sagittal plane: Crossfit practice influence in kickboxers body posture. J. Bodyw. Mov. Ther. 2021, 25, 193–198. [Google Scholar] [CrossRef]
- Kruusamäe, H.; Maasalu, K.; Wyon, M.; Jürimäe, T.; Mäestu, J.; Mooses, M.; Jürimäe, J. Spinal posture in different dance sport dance styles compared with track and field athletes. Medicina 2015, 51, 307–311. [Google Scholar] [CrossRef]
- Grabara, M. Anteroposterior curvatures of the spine in adolescent athletes. J. Back Musculoskelet. Rehabil. 2014, 27, 513–519. [Google Scholar] [CrossRef] [PubMed]
- Lewis, C.L.; Sahrmann, S.A. Effect of posture on hip angles and moments during gait. Man. Ther. 2015, 20, 176–182. [Google Scholar] [CrossRef] [PubMed]
- Le Huec, J.C.; Saddiki, R.; Franke, J.; Rigal, J.; Aunoble, S. Equilibrium of the human body and the gravity line: the basics. Eur. Spine J. 2011, 20 (Suppl 5), 558–563. [Google Scholar] [CrossRef] [PubMed]
- Kapreli, E.; Vourazanis, E.; Billis, E.; Oldham, J.A.; Strimpakos, N. Respiratory dysfunction in chronic neck pain patients. A pilot study. Cephalalgia. 2009, 29, 701–710. [Google Scholar] [CrossRef]
- Szczygieł, E.; Węglarz, K.; Piotrowski, K.; Mazur, T.; Mętel, S.; Golec, J. Biomechanical influences on head posture and the respiratory movements of the chest. Acta Bioeng. Biomech. 2015, 17, 143–148. [Google Scholar] [PubMed]
Figure 1.
Cardiopulmonary function test setting.
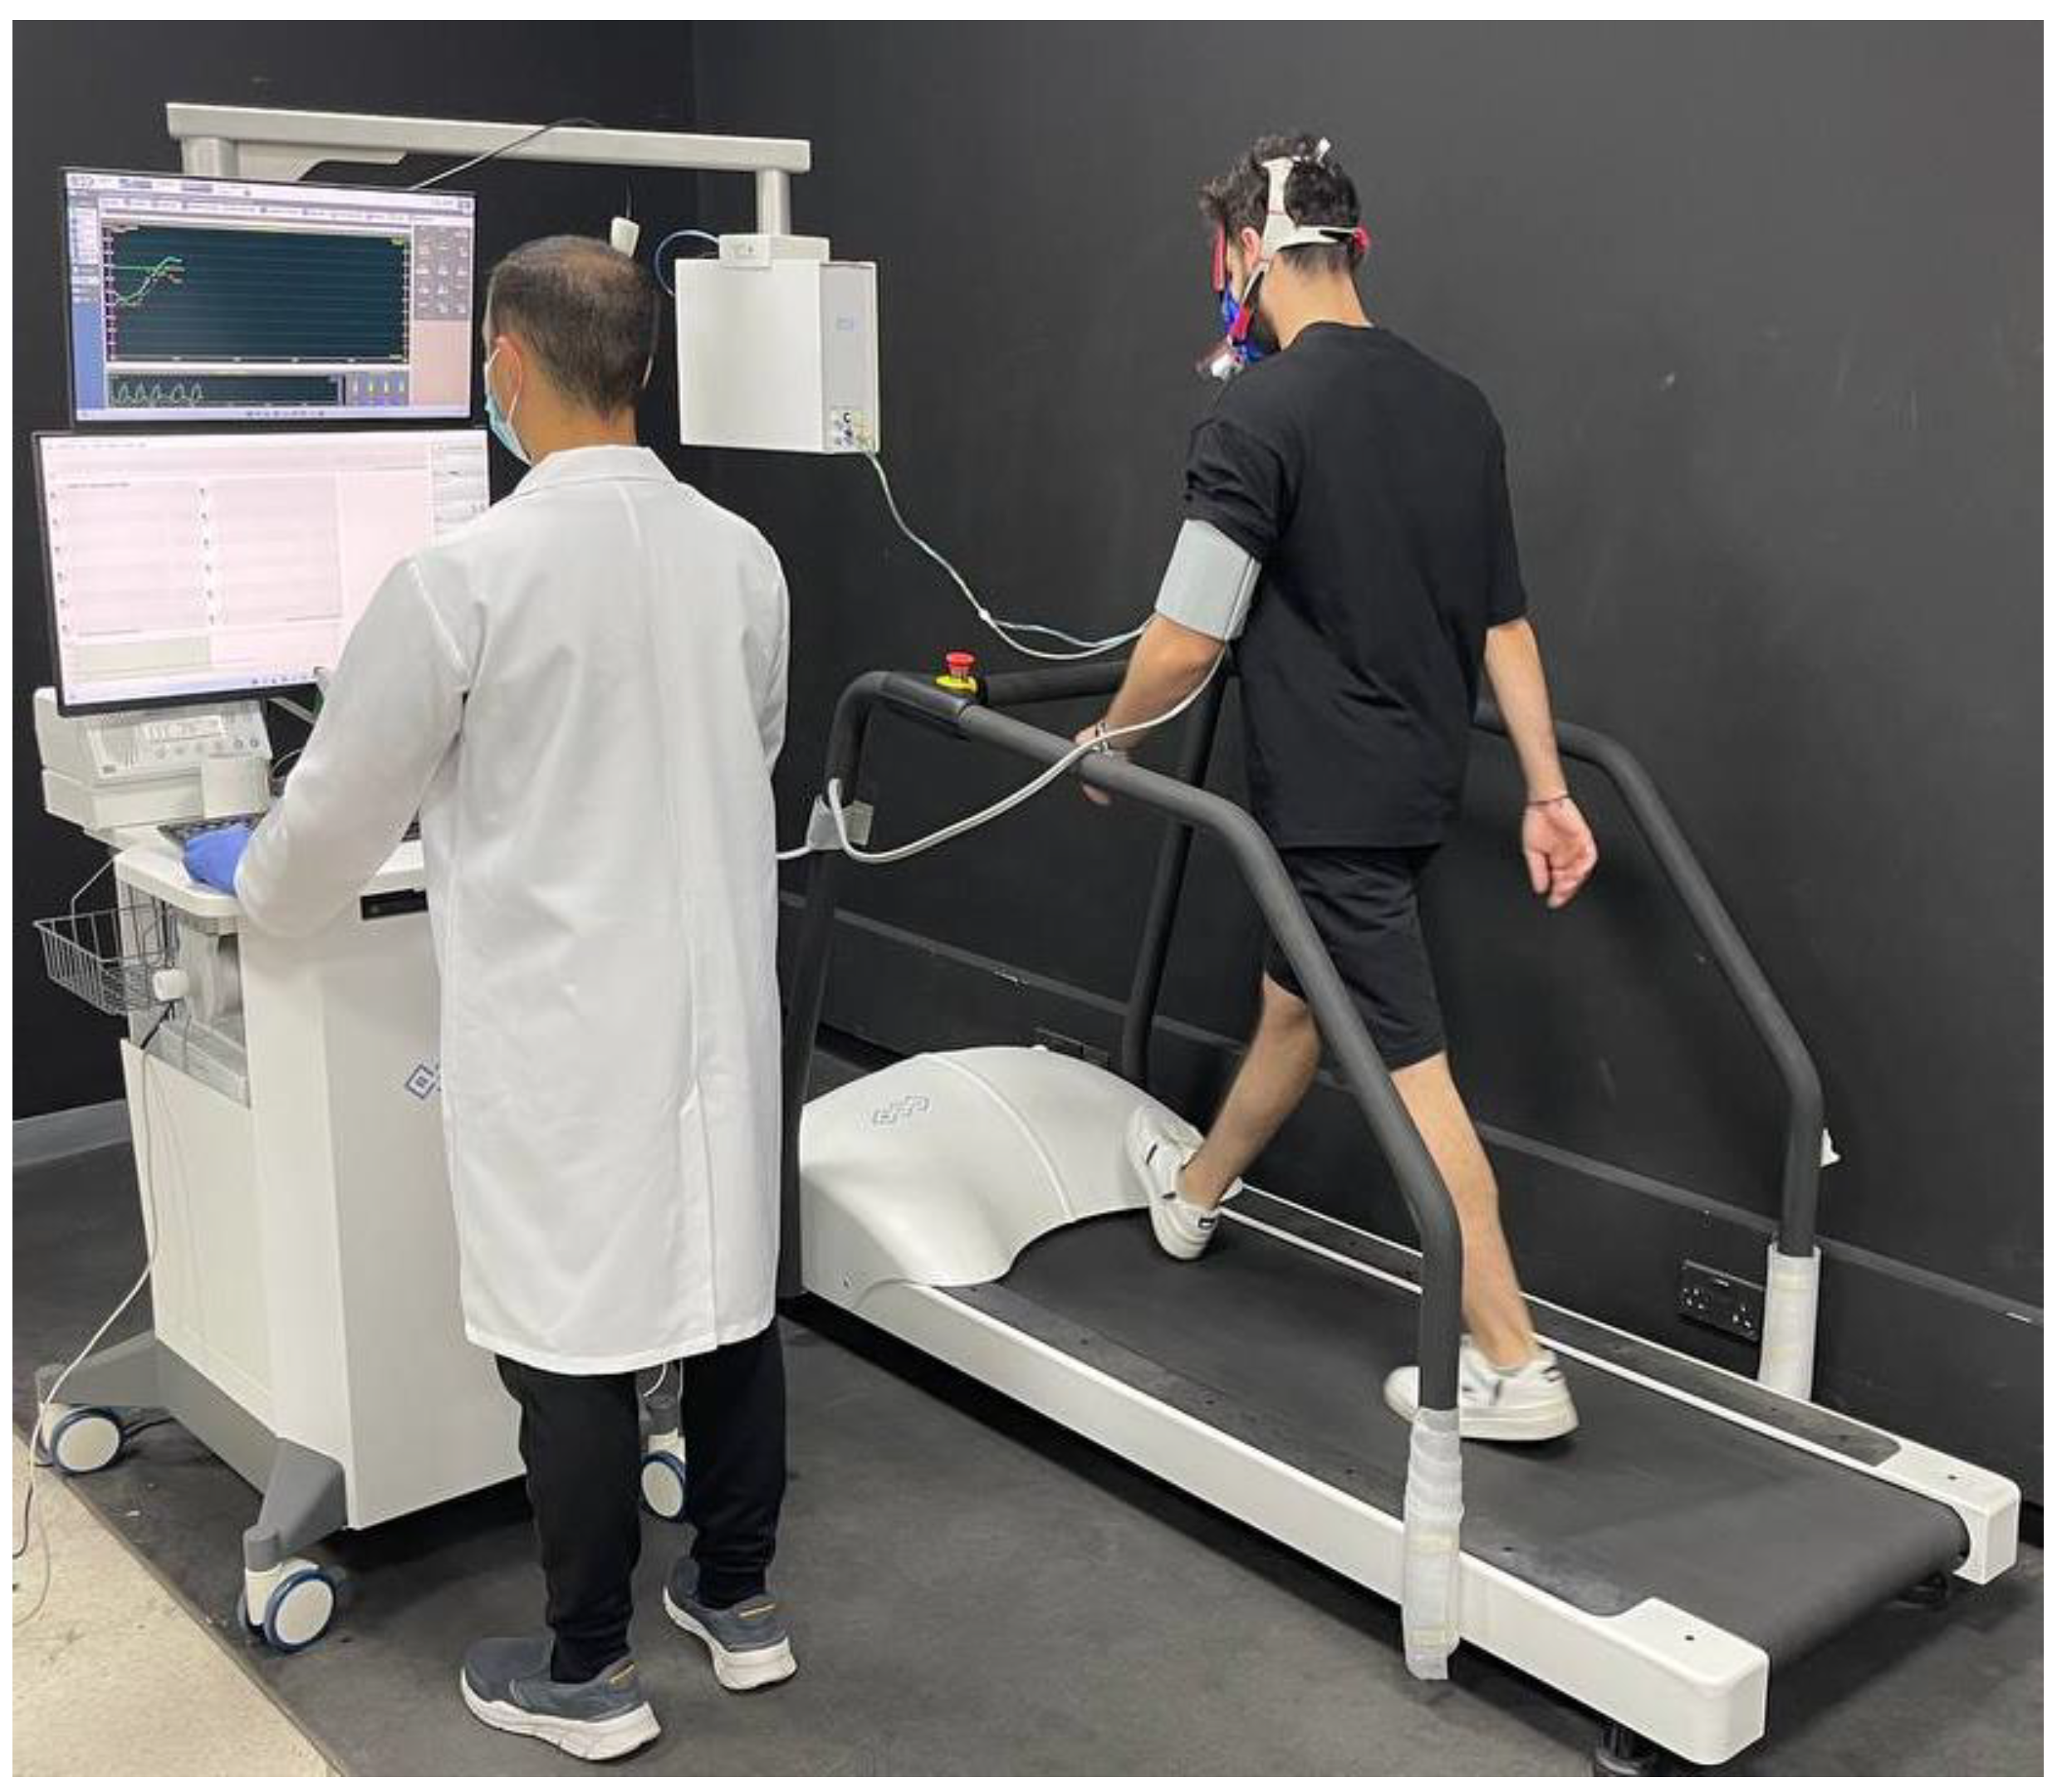
Figure 2.
Agility T-test.
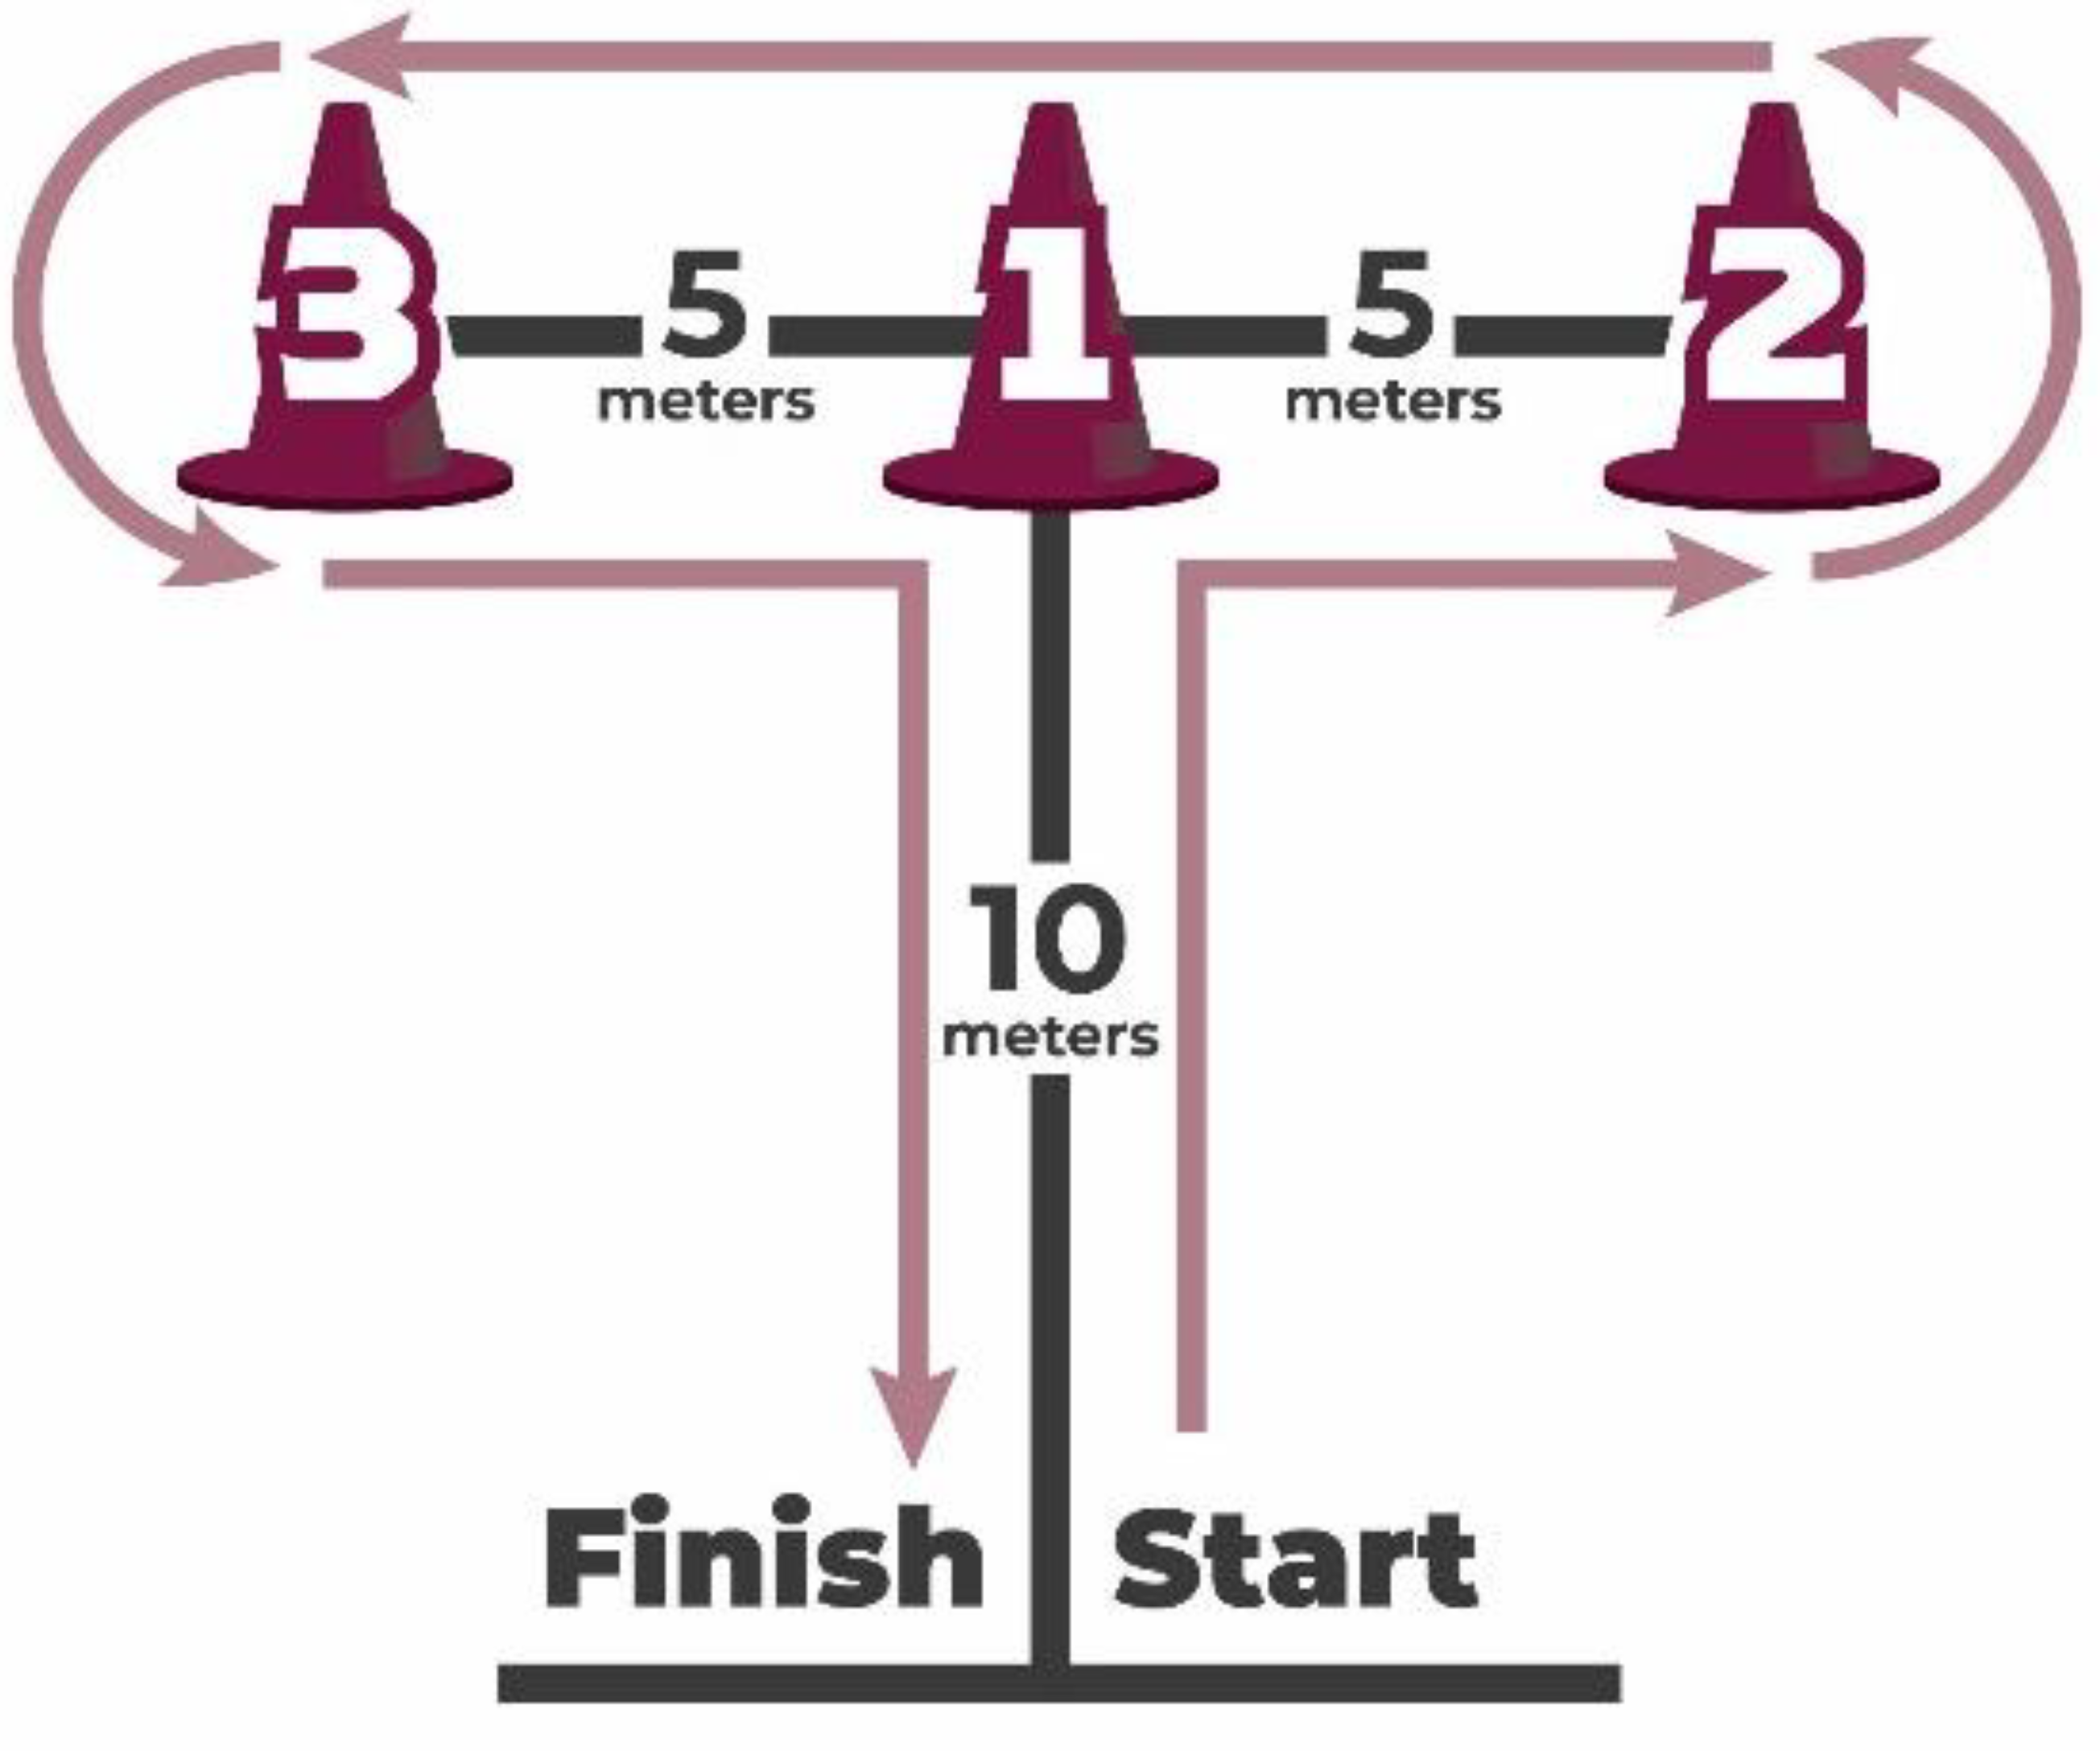
Figure 3.
Leg power: Non-countermovement vertical jump test.
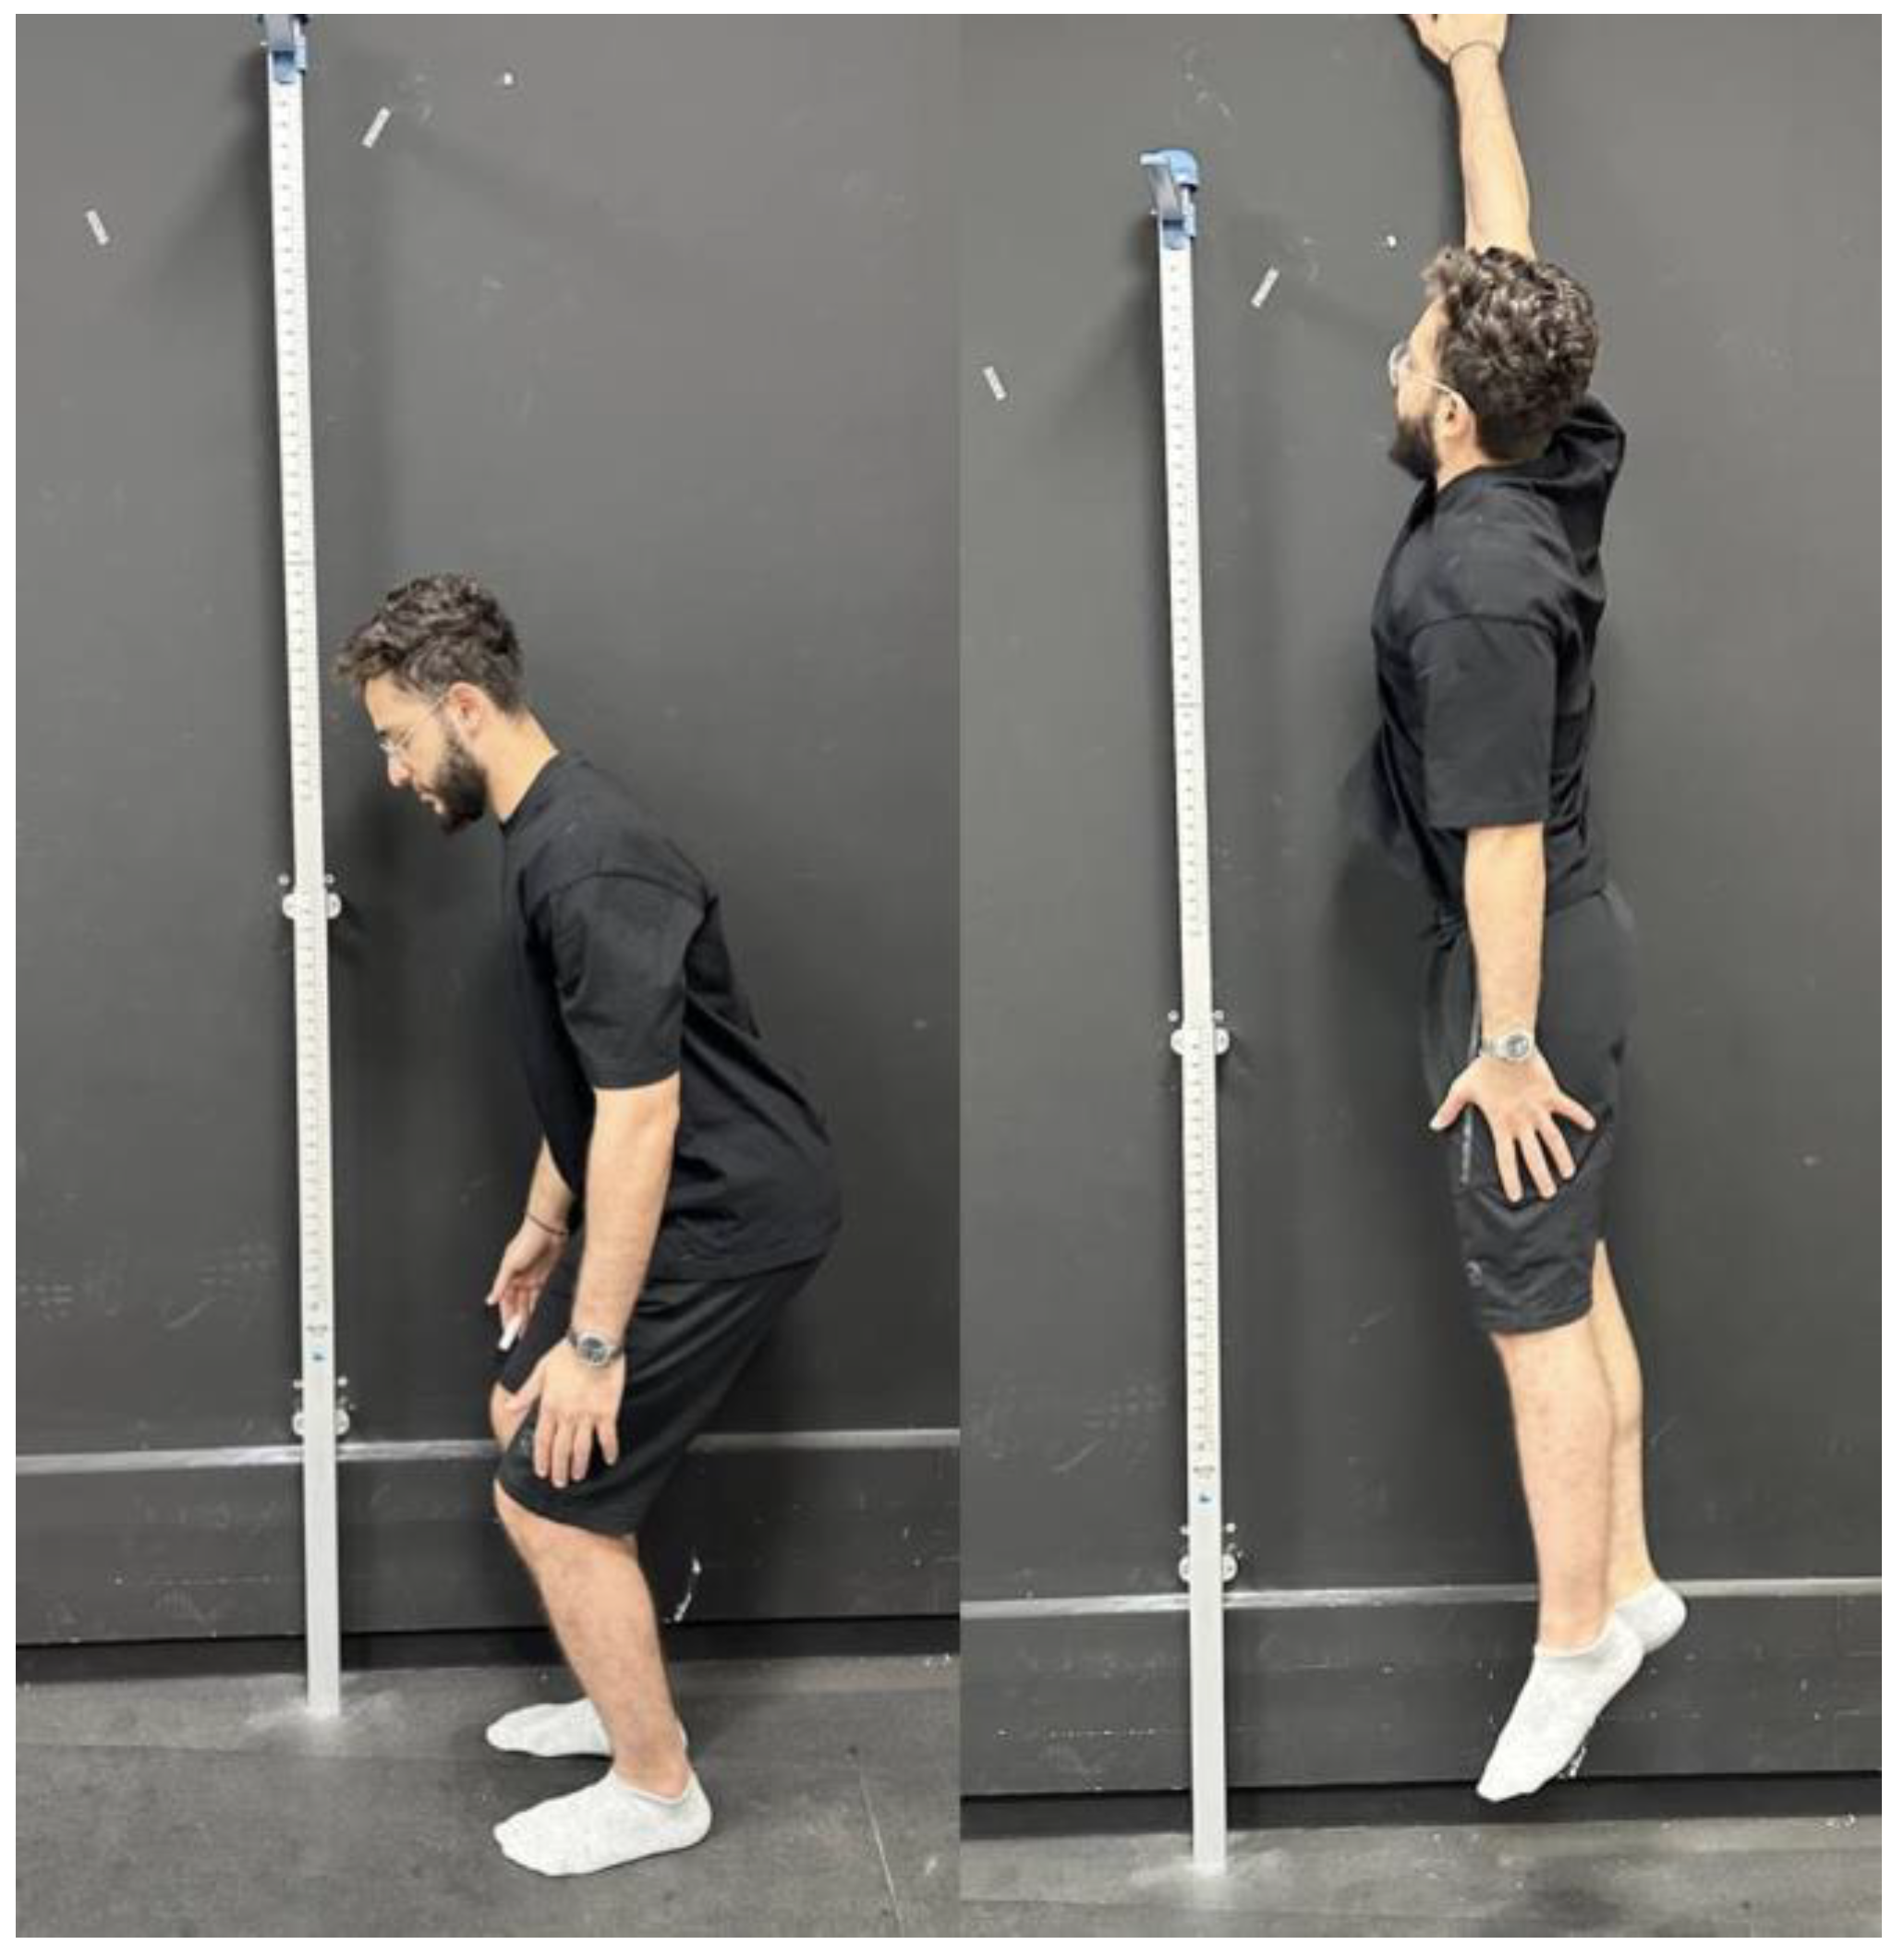
Figure 4.
Y balance test.
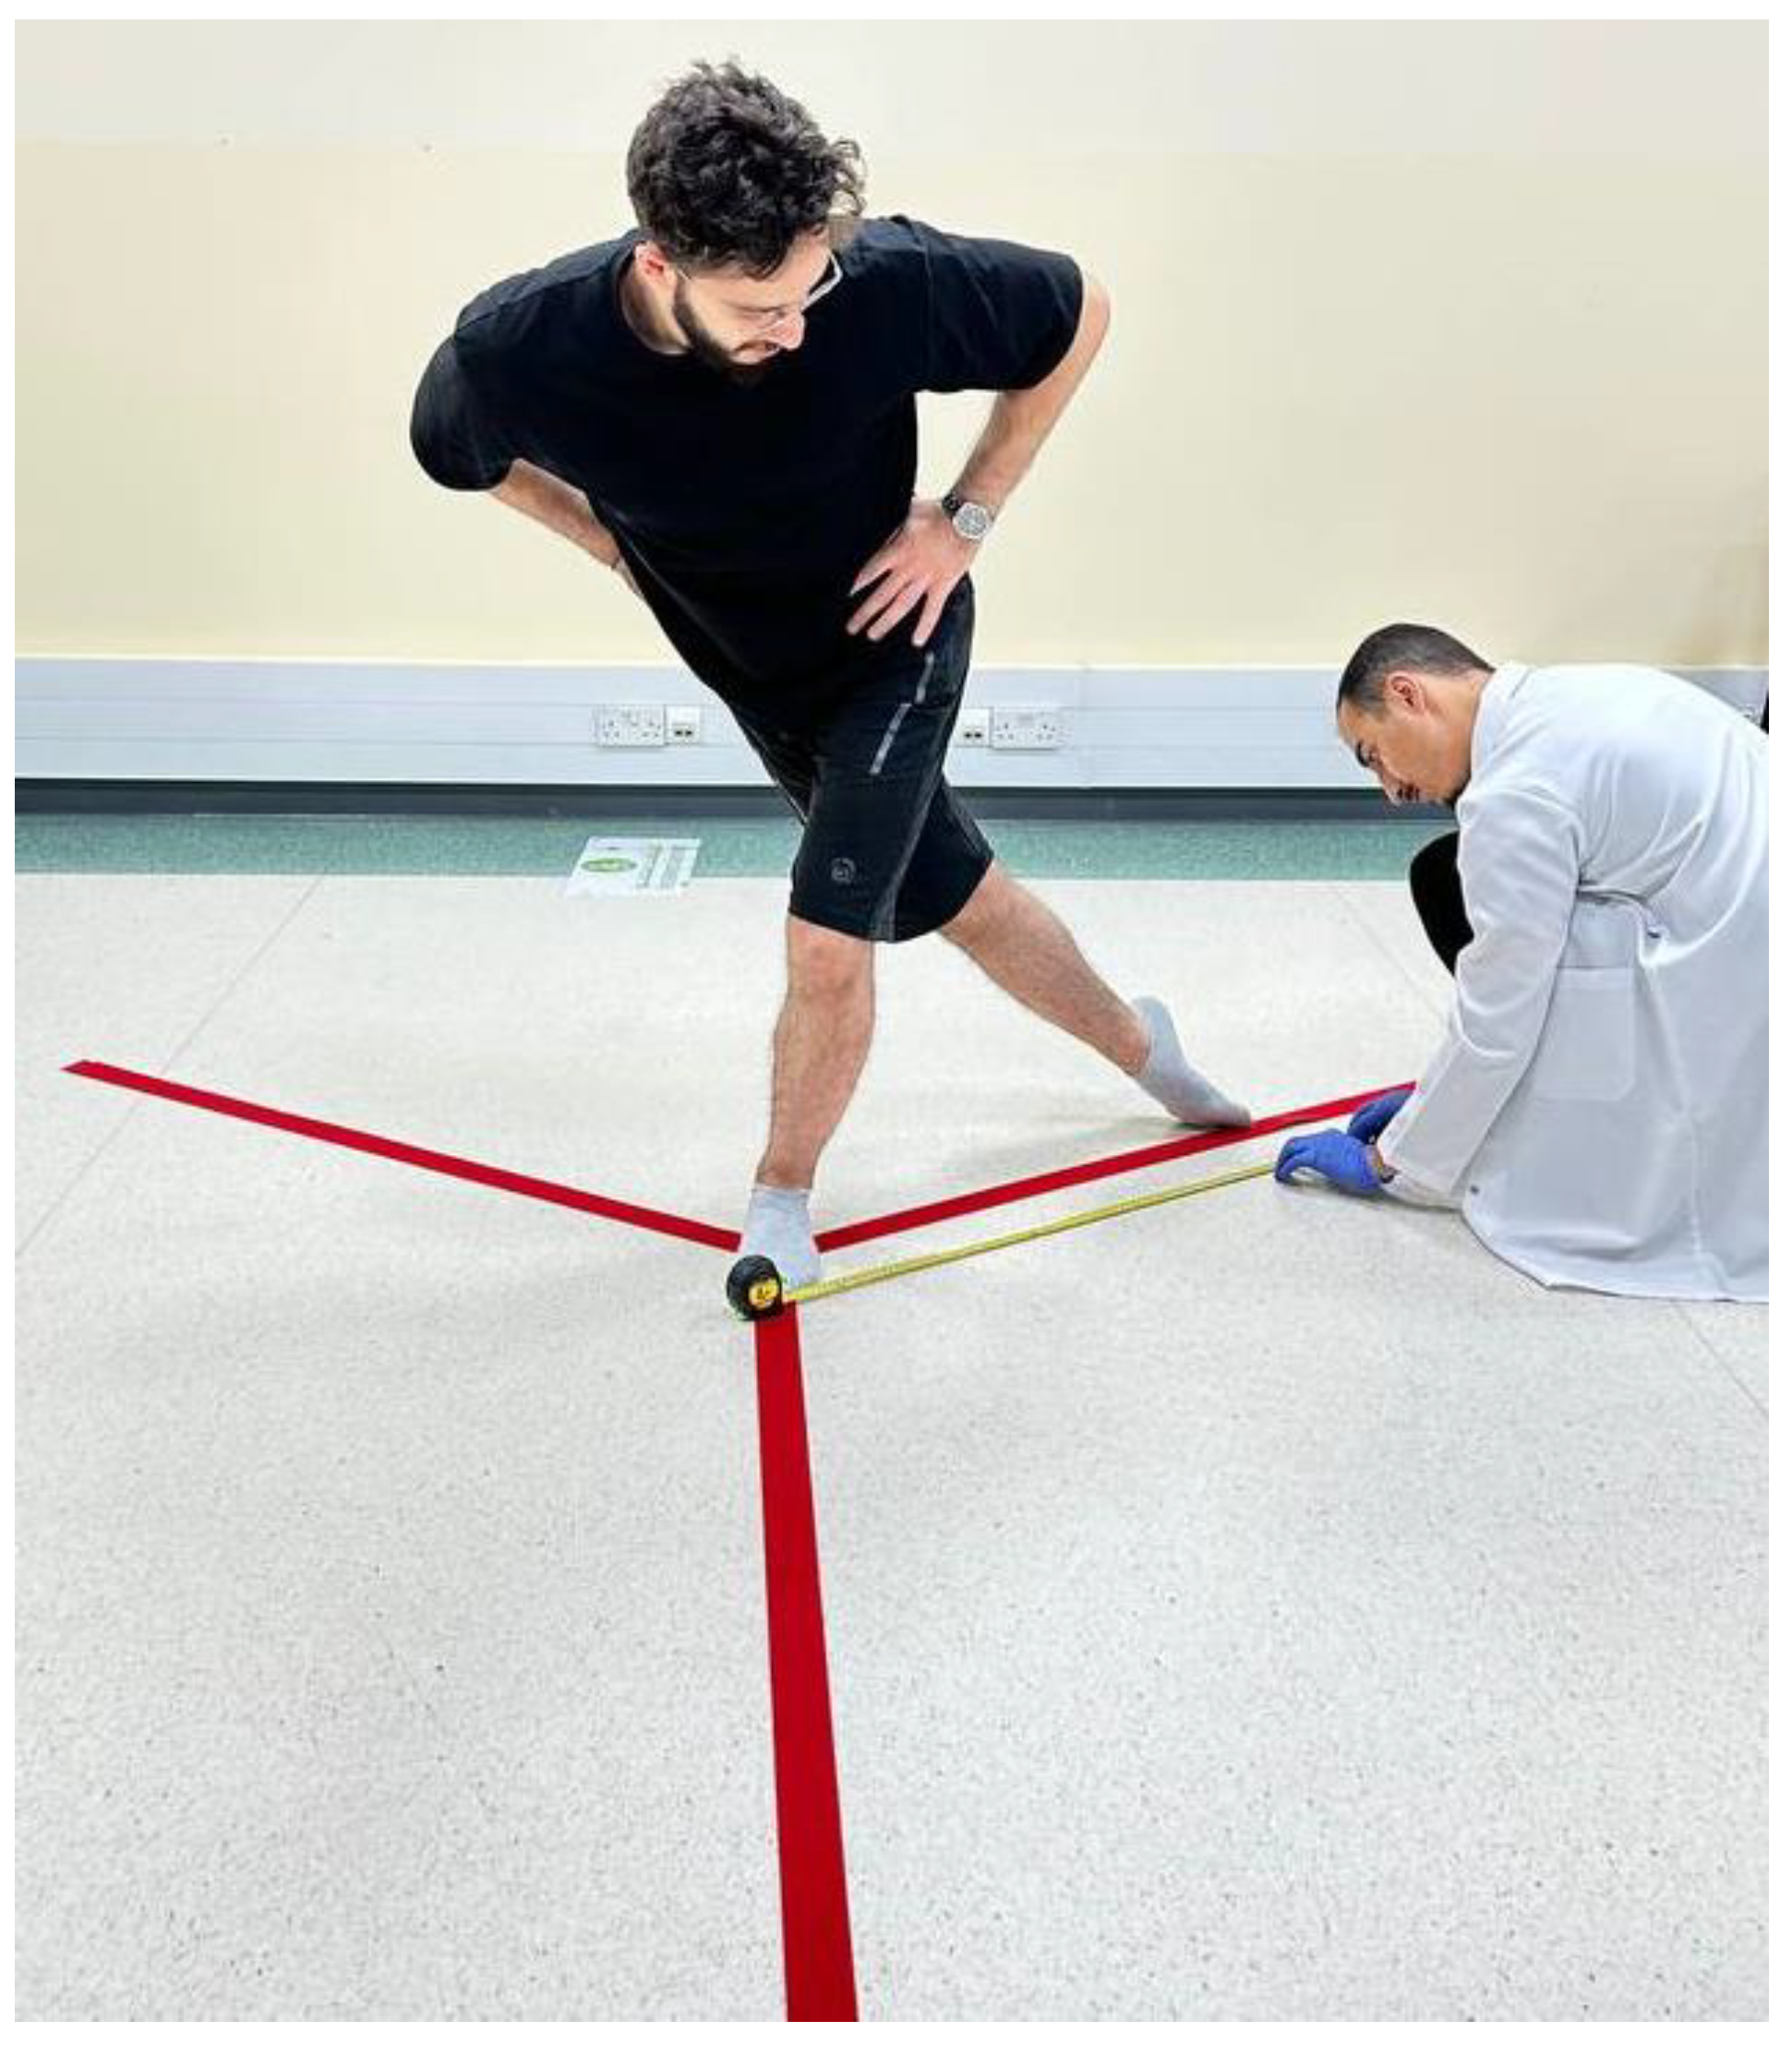

Table 1.
Descriptive data for the demographic variables are presented. The values are presented as mean and standard deviation (SD) for age, weight. BMI = body mass index. a The athletic activity in which the participant was involved.
Table 1.
Descriptive data for the demographic variables are presented. The values are presented as mean and standard deviation (SD) for age, weight. BMI = body mass index. a The athletic activity in which the participant was involved.
| Variable | FHP (n=50) |
|---|---|
| Age (years) | 22.2 ± 4 |
| Weight (kg) | 62.5 ± 3 |
| BMI | 18.2 ± 1.5 |
| Gender (%) | |
| Male | 60 |
| Female | 40 |
| Sport,a Number in percent (%) | |
| Handball | 20 |
| Volleyball | 15 |
| Basketball | 25 |
| Football | 30 |
| Other | 10 |
| Smoking | |
| Non smoker | 70 |
| Smoker | 30 |
| Race/ethnicity | |
| Asian | 64 |
| African | 36 |
Table 2.
Descriptive statistics of posture parameters as the median and interquartile range (IQR). CVA = craniovertebral angle.
Table 2.
Descriptive statistics of posture parameters as the median and interquartile range (IQR). CVA = craniovertebral angle.
| Posture parameters | N = 100 Median (IQR) |
|---|---|
| CVA (°) | 52.0 (49.0 , 56.5) |
| Lateral translation head sagittal (cm) | 2.00 (1.00 , 3.80) |
| AHT coronal (cm) | 0.90 (0.25 , 1.07) |
| Lateral angulation head (°) | 11.6 (10.0 , 15.8) |
| Thoracic kyphosis (°) | 22.0 (20.0 , 30.0) |
| Rib anterior translation coronal (cm) | 0.50 (0.00 , 0.70) |
| Pelvic tilt (°) | 9.80 (7.20, 12.00) |
| Pelvis lateral angulation (°) | 2.90 (1.50, 4.90) |
| Pelvis anterior translation coronal (cm) | 0.40 (0.10 , 0.70) |
| Hip pelvis lateral translation (cm) | 2.10 (1.00 , 2.50) |
Table 3.
Descriptive statistics of physical performance skills reported as the median and interquartile range (IQR).
Table 3.
Descriptive statistics of physical performance skills reported as the median and interquartile range (IQR).
| Physical performance skills | N = 100 Median (IQR) |
|---|---|
| Static stork test results | 55 (45 , 64) |
| Y-balance test (cm) anterior for the left side | 94 (75 , 109) |
| Y-balance test (cm) anterior for the right side | 98 (74 , 107) |
| Y-balance test (cm) posterolateral for the left side | 100 (86 , 112) |
| Y-balance test (cm) posterolateral for the right side | 98 (89 , 111) |
| Y-balance test (cm) posteromedial for the Left side | 95 (86 , 109) |
| Y-balance test (cm) posteromedial for the Right side | 99 (82 , 110) |
| Vertical jump test (cm) | 48 (39 , 55) |
| Agility test (s) | (9.60 , 11.70) |
Table 4.
Descriptive statistics of cardiopulmonary functions reported as the median and interquartile range (IQR).
Table 4.
Descriptive statistics of cardiopulmonary functions reported as the median and interquartile range (IQR).
| Cardiopulmonary functions | N = 100 Median (IQR) |
|---|---|
| VE / VCO2 slope | 34.2 (31.4 , 39.0) |
| VO2 (m l / min) at VT | 2,809 (1,788 , 3,112) |
| VO2 / kg | 34 (30 , 44) |
| VE I / min (VE / VO2 at VT) | 91 (87 , 113) |
Table 5.
Spearman correlation coefficient (r) and p-values (p) between CVA, lateral translation head sagittal, AHT coronal, lateral angulation head, and thoracic kyphosis (first row), and each of the physical performance skills (first column).
Table 5.
Spearman correlation coefficient (r) and p-values (p) between CVA, lateral translation head sagittal, AHT coronal, lateral angulation head, and thoracic kyphosis (first row), and each of the physical performance skills (first column).
| Physical performance skills | CVA | Lateral translation head sagittal |
AHT coronal |
Lateral angulation head | Thoracic Kyphosis |
|||||
|---|---|---|---|---|---|---|---|---|---|---|
| r | p | r | p | r | p | r | p | r | p | |
| Stork balance test (s) | 0.57 | < 0.001 | -0.46 | < 0.001 | -0.51 | < 0.001 | -0.19 | 0.13 | -0.27 | 0.02 |
| Y balance test (cm) anterior for the left side | 0.33 | < 0.001 | -0.35 | 0.004 | -0.44 | < 0.001 | -0.22 | 0.075 | -0.28 | 0.025 |
| Y balance test (cm) anterior for the right side | -0.09 | 0.418 | 0.17 | 0.166 | 0.02 | 0.854 | 0.21 | 0.085 | 0.12 | 0.348 |
| Y balance test (cm) posterolateral for the left side | 0.39 | 0.001 | -0.42 | < 0.001 | -0.48 | < 0.001 | -0.31 | 0.013 | -0.28 | 0.024 |
| Y balance test (cm) posterolateral for the right side | 0.36 | 0.003 | -0.403 | < 0.001 | -0.46 | < 0.001 | -0.32 | 0.01 | -0.27 | 0.027 |
| Y balance test (cm) posteromedial for the left side | 0.33 | 0.007 | -0.39 | 0.001 | -0.47 | < 0.001 | -0.27 | 0.028 | -0.23 | 0.064 |
| Y balance test (cm) posteromedial for the right side | 0.29 | 0.016 | -0.29 | 0.015 | -0.39 | 0.001 | -0.19 | 0.13 | -0.19 | 0.12 |
| Vertical jump test (cm) | 0.54 | < 0.001 | -0.51 | < 0.001 | -0.62 | < 0.001 | -0.33 | 0.007 | -0.32 | 0.008 |
| Agility test (s) | -0.86 | < 0.001 | 0.786 | < 0.001 | 0.81 | < 0.001 | 0.74 | < 0.001 | 0.695 | < 0.001 |
Table 6.
Spearman correlation coefficient (r) and p-values (p) between rib anterior translation coronal, pelvic tilt, hip pelvis lateral angulation, hip pelvis anterior translation coronal, and hip pelvis lateral translation (first row), and each of the physical performance skills (first column).
Table 6.
Spearman correlation coefficient (r) and p-values (p) between rib anterior translation coronal, pelvic tilt, hip pelvis lateral angulation, hip pelvis anterior translation coronal, and hip pelvis lateral translation (first row), and each of the physical performance skills (first column).
| Physical performance skills | Rib anterior translation coronal | Pelvic tilt |
Hip pelvis lateral angulation | Hip pelvis anterior translation coronal | Hip pelvis lateral translation | |||||
|---|---|---|---|---|---|---|---|---|---|---|
| r | p | r | p | r | p | r | p | r | p | |
| Stork balance test (s) | -0.41 | < 0.001 | -0.35 | 0.02 | -0.44 | < 0.001 | -0.47 | < 0.001 | -0.5 | < 0.001 |
| Y balance test (cm) anterior for the left side | -0.32 | 0.008 | -0.36 | 0.025 | -0.31 | 0.013 | -0.45 | < 0.001 | -0.46 | < 0.001 |
| Y balance test (cm) anterior for the right side | 0.24 | 0.052 | 0.14 | 0.268 | 0.15 | 0.239 | -0.062 | 0.623 | 0.03 | 0.796 |
| Y balance test (cm) posterolateral for the left side | -0.36 | 0.003 | -0.43 | < 0.001 | -0.39 | 0.001 | -0.53 | < 0.001 | -0.41 | < 0.001 |
| Y balance test (cm) posterolateral for the right side | -0.33 | 0.006 | -0.42 | < 0.001 | -0.39 | 0.001 | -0.46 | < 0.001 | -0.43 | < 0.001 |
| Y balance test (cm) posteromedial for the left side | -0.33 | 0.008 | -0.42 | < 0.001 | -0.36 | 0.002 | -0.51 | < 0.001 | -0.47 | < 0.001 |
| Y balance test (cm) posteromedial for the right side | -0.27 | 0.03 | -0.32 | 0.009 | -0.28 | 0.022 | -0.42 | < 0.001 | -0.39 | 0.001 |
| Vertical jump test (cm) | -0.52 | < 0.001 | -0.54 | < 0.001 | -0.48 | < 0.001 | -0.65 | < 0.001 | -0.56 | < 0.001 |
| Agility test (s) | 0.75 | < 0.001 | 0.79 | < 0.001 | 0.79 | < 0.001 | 0.78 | < 0.001 | 0.73 | < 0.001 |
Table 7.
Spearman correlation coefficient (r) and p-values (p) between CVA, lateral translation head sagittal, AHT coronal, lateral angulation head, and thoracic kyphosis (first row), and each of the cardiopulmonary functions (first column).
Table 7.
Spearman correlation coefficient (r) and p-values (p) between CVA, lateral translation head sagittal, AHT coronal, lateral angulation head, and thoracic kyphosis (first row), and each of the cardiopulmonary functions (first column).
| Cardiopulmonary functions | CVA | Lateral translation head sagittal |
AHT coronal |
Lateral angulation head |
Thoracic Kyphosis |
|||||
|---|---|---|---|---|---|---|---|---|---|---|
| r | p | r | p | r | p | r | p | r | p | |
| VE / VCO2 slope | -0.09 | 0.458 | 0.16 | 0.196 | 0.14 | 0.264 | 0.16 | 0.21 | 0.19 | 0.14 |
| VO2 (ml / min) at VT | 0.65 | < 0.001 | -0.62 | < 0.001 | -0.69 | < 0.001 | -0.48 | < 0.001 | -0.39 | < 0.001 |
| VO2 / kg | 0.71 | < 0.001 | -0.72 | < 0.001 | -0.73 | < 0.001 | -0.63 | < 0.001 | -0.52 | < 0.001 |
| VE I/min (VE / VO2 at VT) | -0.61 | < 0.001 | 0.65 | < 0.001 | 0.64 | < 0.001 | 0.591 | < 0.001 | 0.66 | < 0.001 |
Table 8.
Spearman correlation coefficient (r) and p-values (p) between rib anterior translation coronal, pelvic tilt, hip pelvis lateral angulation, hip pelvis anterior translation coronal, and hip pelvis lateral translation (first row), and each of the cardiopulmonary functions (first column).
Table 8.
Spearman correlation coefficient (r) and p-values (p) between rib anterior translation coronal, pelvic tilt, hip pelvis lateral angulation, hip pelvis anterior translation coronal, and hip pelvis lateral translation (first row), and each of the cardiopulmonary functions (first column).
| Cardiopulmonary functions | Rib anterior translation coronal |
Pelvic tilt |
Hip-pelvis lateral angulation |
Hip pelvis anterior translation coronal | Hip pelvis lateral translation |
|||||
|---|---|---|---|---|---|---|---|---|---|---|
| r | p | r | p | r | p | r | p | r | p | |
| VE / VCO2 slope | 0.13 | 0.298 | 0.2 | 0.11 | 0.173 | 0.168 | 0.18 | 0.151 | 0.13 | 0.294 |
| VO2 (ml / min) at VT | -0.52 | < 0.001 | -0.62 | < 0.001 | -0.58 | < 0.001 | -0.63 | < 0.001 | -0.6 | < 0.001 |
| VO2 / kg | -0.59 | < 0.001 | -0.69 | < 0.001 | -0.69 | < 0.001 | -0.7 | < 0.001 | -0.61 | < 0.001 |
| VE I / min (VE / VO2 at VT) | 0.65 | < 0.001 | 0.66 | < 0.001 | 0.66 | < 0.001 | 0.59 | < 0.001 | 0.59 | < 0.001 |
Disclaimer/Publisher’s Note: The statements, opinions and data contained in all publications are solely those of the individual author(s) and contributor(s) and not of MDPI and/or the editor(s). MDPI and/or the editor(s) disclaim responsibility for any injury to people or property resulting from any ideas, methods, instructions or products referred to in the content. |
© 2023 by the authors. Licensee MDPI, Basel, Switzerland. This article is an open access article distributed under the terms and conditions of the Creative Commons Attribution (CC BY) license (http://creativecommons.org/licenses/by/4.0/).
Copyright: This open access article is published under a Creative Commons CC BY 4.0 license, which permit the free download, distribution, and reuse, provided that the author and preprint are cited in any reuse.


