Preprint
Article

Circulating miRNA As Prognostic Biomarker During Estrus of Buffalo

Altmetrics

Downloads

188

Views

160

Comments

0

Submitted:

05 June 2023

Posted:

06 June 2023

You are already at the latest version

Alerts
Abstract
Buffalo are silent breeders, therefore detecting estrus is a serious challenge. There is a rising need for sensitive and precise biomarkers in this scenario. Recent research on miRNA has demon-strated the importance of these molecules as biomarkers. Though there have been miRNA studies in saliva during the estrous cycle, there have been few miRNA research in blood samples. The current study was designed to look at blood miRNAs during the oestrous cycle in heifers (n=5) to address the issue of silent estrus. On the day of estrus and diestrus, blood samples from 60 heifers were obtained and pooled into (n=5) separate samples. Ultrasonography and progesterone assay was performed to confirm estrus. Then, employing particular miRNA adapters, small RNA se-quencing of miRNA was performed using the Illumina Miseq 2500. The UEA sRNA bioinfor-matics workbench identified 94 substantially differently expressed miRNAs (p>0.05) from these data. In estrus, 63 miRNA were upregulated and 31 miRNA were downregulated. When fold change was increased to (log2foldchange >1; q value less than 0.05), 25 miRNAs were elevated during estrus. miR-497, miR-582, miR-10174, miR-23, miR-223, miR-1296 were upregulated, whereas miR-10167, 671, 1246,122 were downregulated. miR-497 is unusually elevated (log2 foldchange>5) when compared to another miRNA (log2 foldchange >5) miRNet 2.0, Cytoscape, and MIENTURNET network software found that miR-497 has more degree centrality, above 60; it is associated with more than 60 nodes, followed by miR-93
Keywords: 
Subject: Biology and Life Sciences  -   Biochemistry and Molecular Biology

1. Introduction

Estrus detection is the intentional act of observing and recording the onset of estrus. The single most critical thing on a dairy farm is detecting estrus and successfully impregnating a buffalo. Because of the uneven exhibition of estrus indicators at different seasons and the high incidence of silent heat, estrus detection is a serious problem in buffalo husbandry. Around half of all estrus occurrences in buffaloes are now undiagnosed in field conditions, resulting in a substantial economic loss. As a result, objective estrus detection methods are in high demand though, the service vaginal fluid fern patterns establish the estrus stage for a breeding decision, the fluid discharge is absent during silent heat. In such cases, alternative and accurate heat detection methods for buffaloes are required. The traditional method of selecting cows for breeding has been to visually evaluate them for signs of oestrus regularly [1]. Measurement of milk progesterone, heat mount detectors, and activity monitors are more sophisticated approaches that are frequently used with visual observation in practice [1]. Despite this, several investigations agree that even when using a combination of these approaches, over 30% of oestrus occurrences may still go undetected [2]. Although salivary miRNA is an excellent biomarker for detecting estrus, its confirmation in a wider population is still under process, and the amount of miRNA acquired from saliva is quite limited. Meanwhile, blood has proven to be an attractive fluid for discovering possible biomarkers, with a higher abundance of miRNA and lncRNA in the blood [3]. Recent studies have identified the role of miRNA, mRNA, and lncRNA in playing a significant role as biomarkers. miRNAs are short RNA molecules that regulate gene expression in animal tissues [4]. These are the most extensively studied small ncRNAs across all species. Most research has focused on extracellular miRNAs as prospective biomarkers since they are persistent (i.e., resistant to ribonucleases) and can be detected in blood, urine, or other bodily fluids using simple, sensitive, and relatively inexpensive tests, even after years of sample preservation [5,6,7].
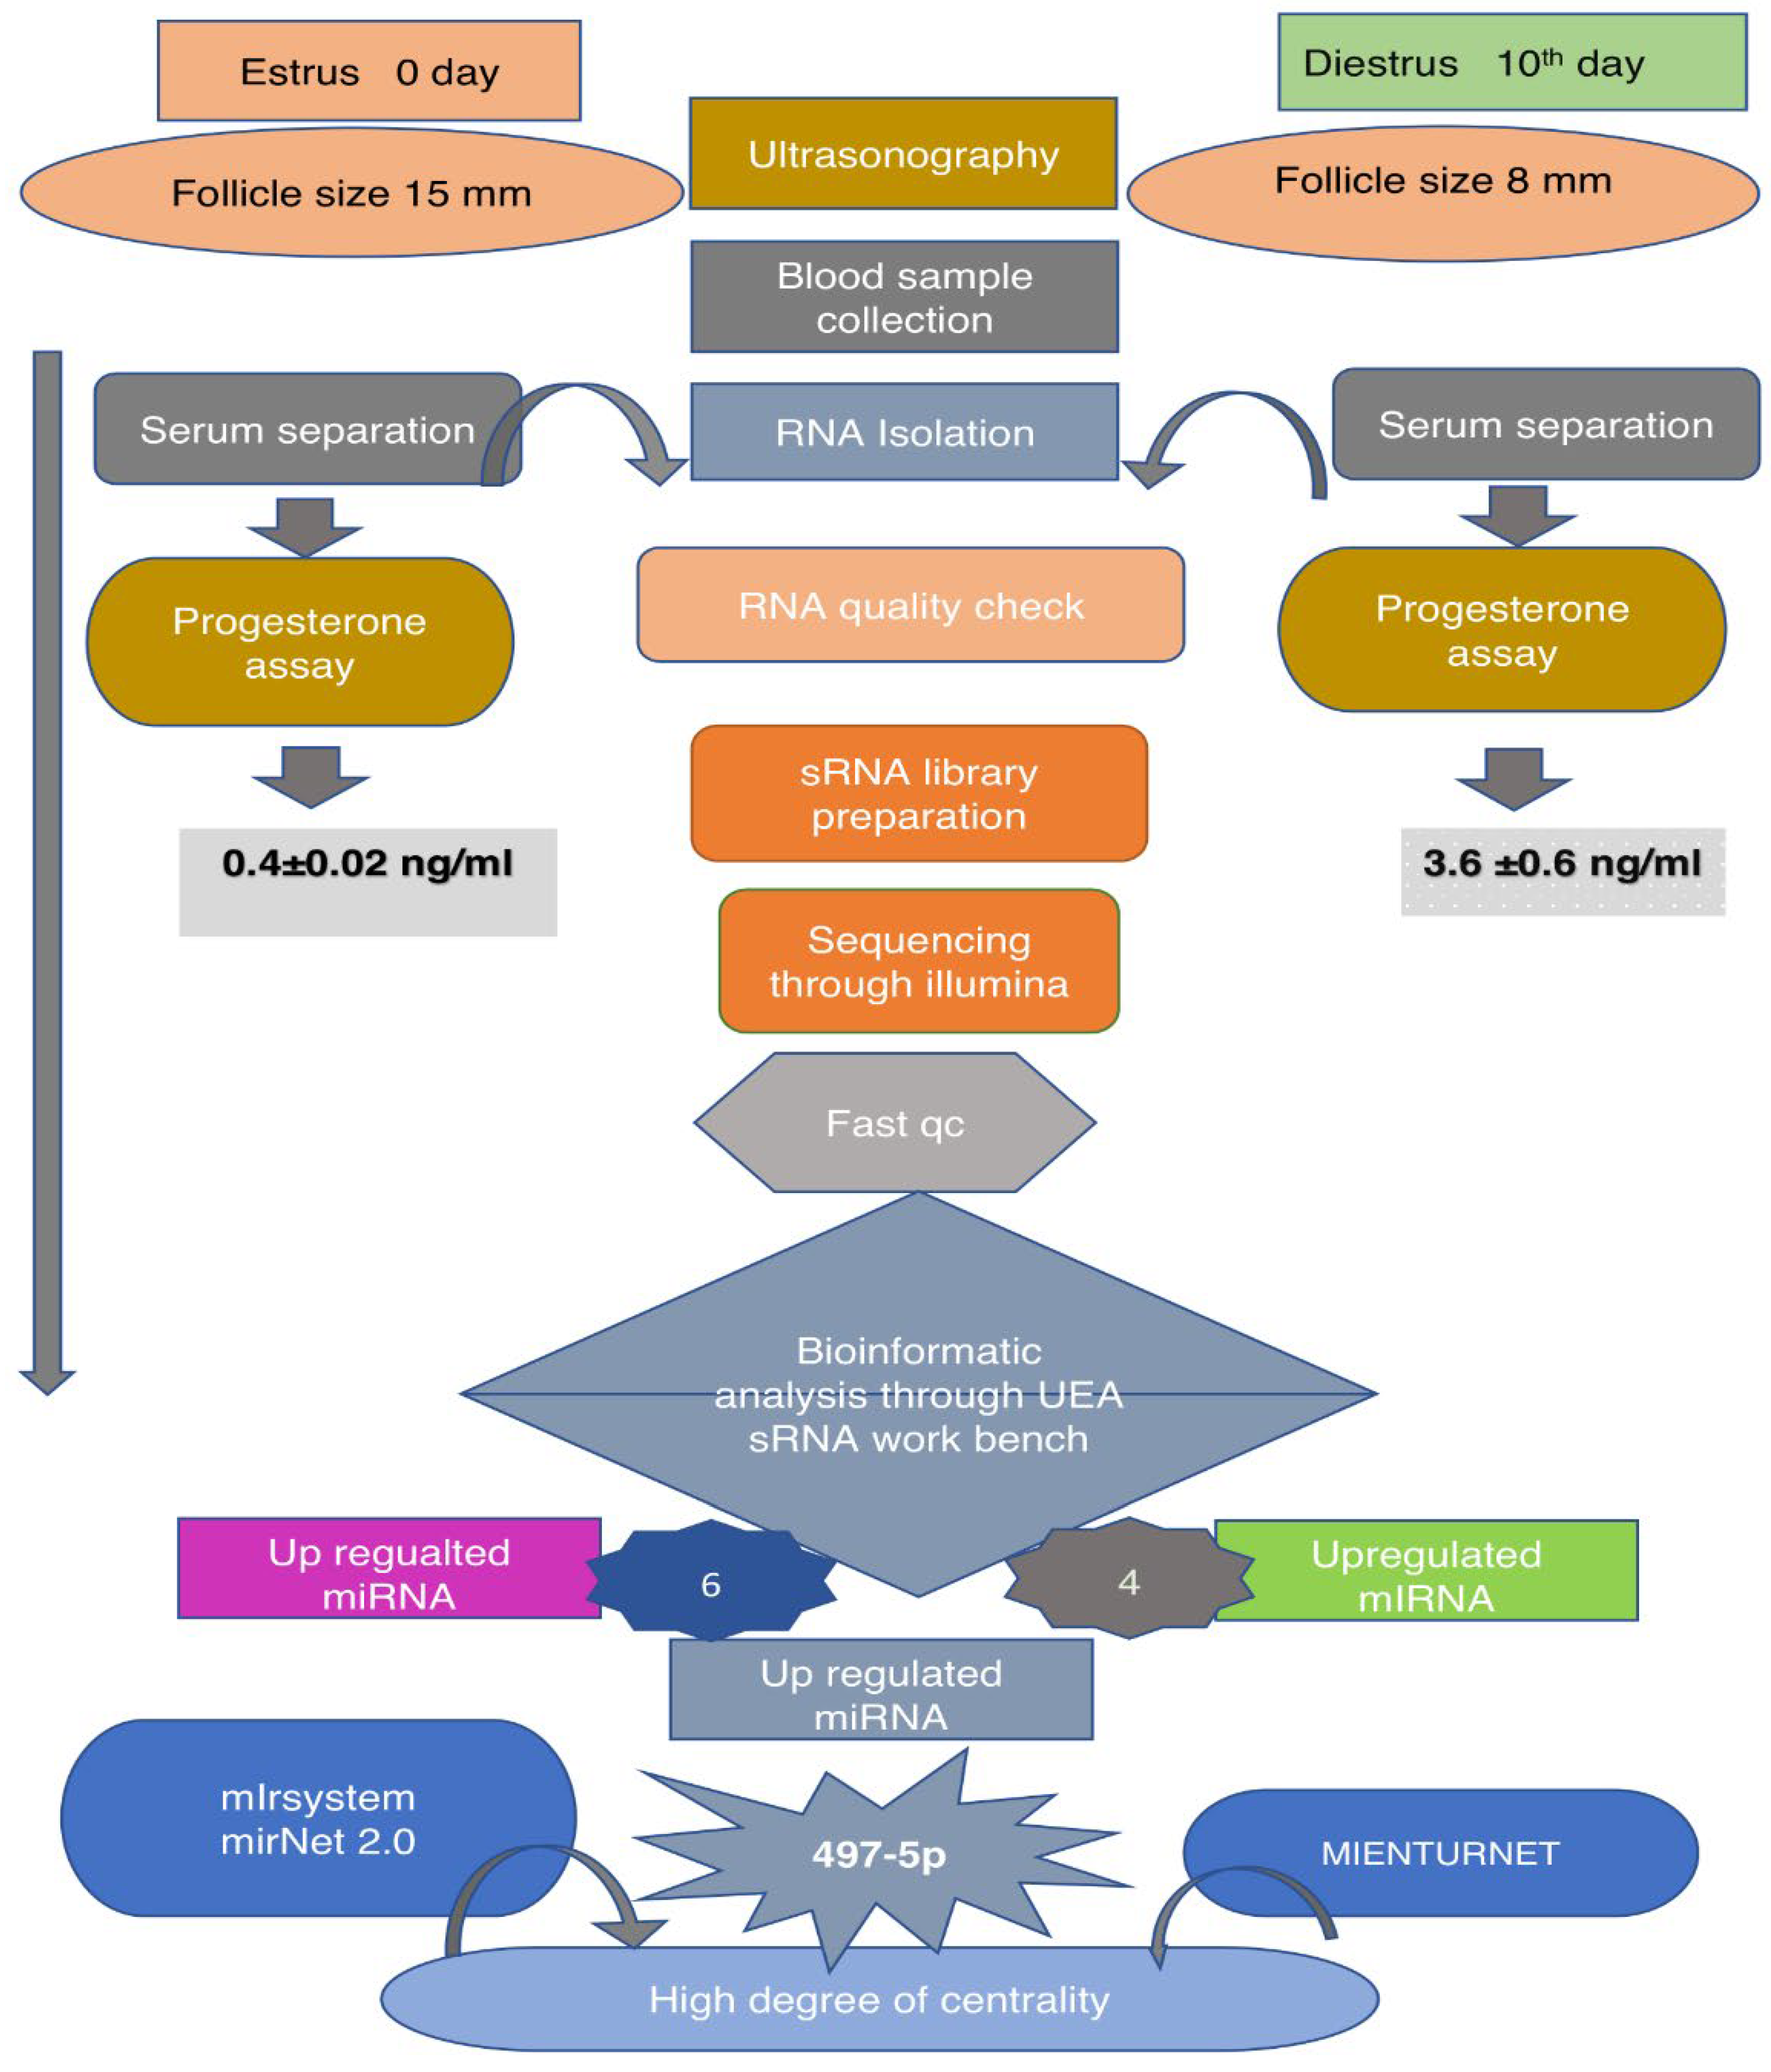
Figure 1. Flow chart depicting the entire work flow and different methods and software used.
Preprints 75688 g001

2. Results

The presence of edematous vulval lips, redness of the vagina, and a change in cervical tone were used to determine estrus in buffaloes. The follicle size on the right ovary was 15mm± 2mm on Ultrasonography, and progesterone levels on estrus and diestrus were 0.40±0.02ng/ml and 3.60±0.6ng/ml, respectively (Figure 2), confirming that the animals were in perfect estrus [8].

2.1. RNA quantity and quality

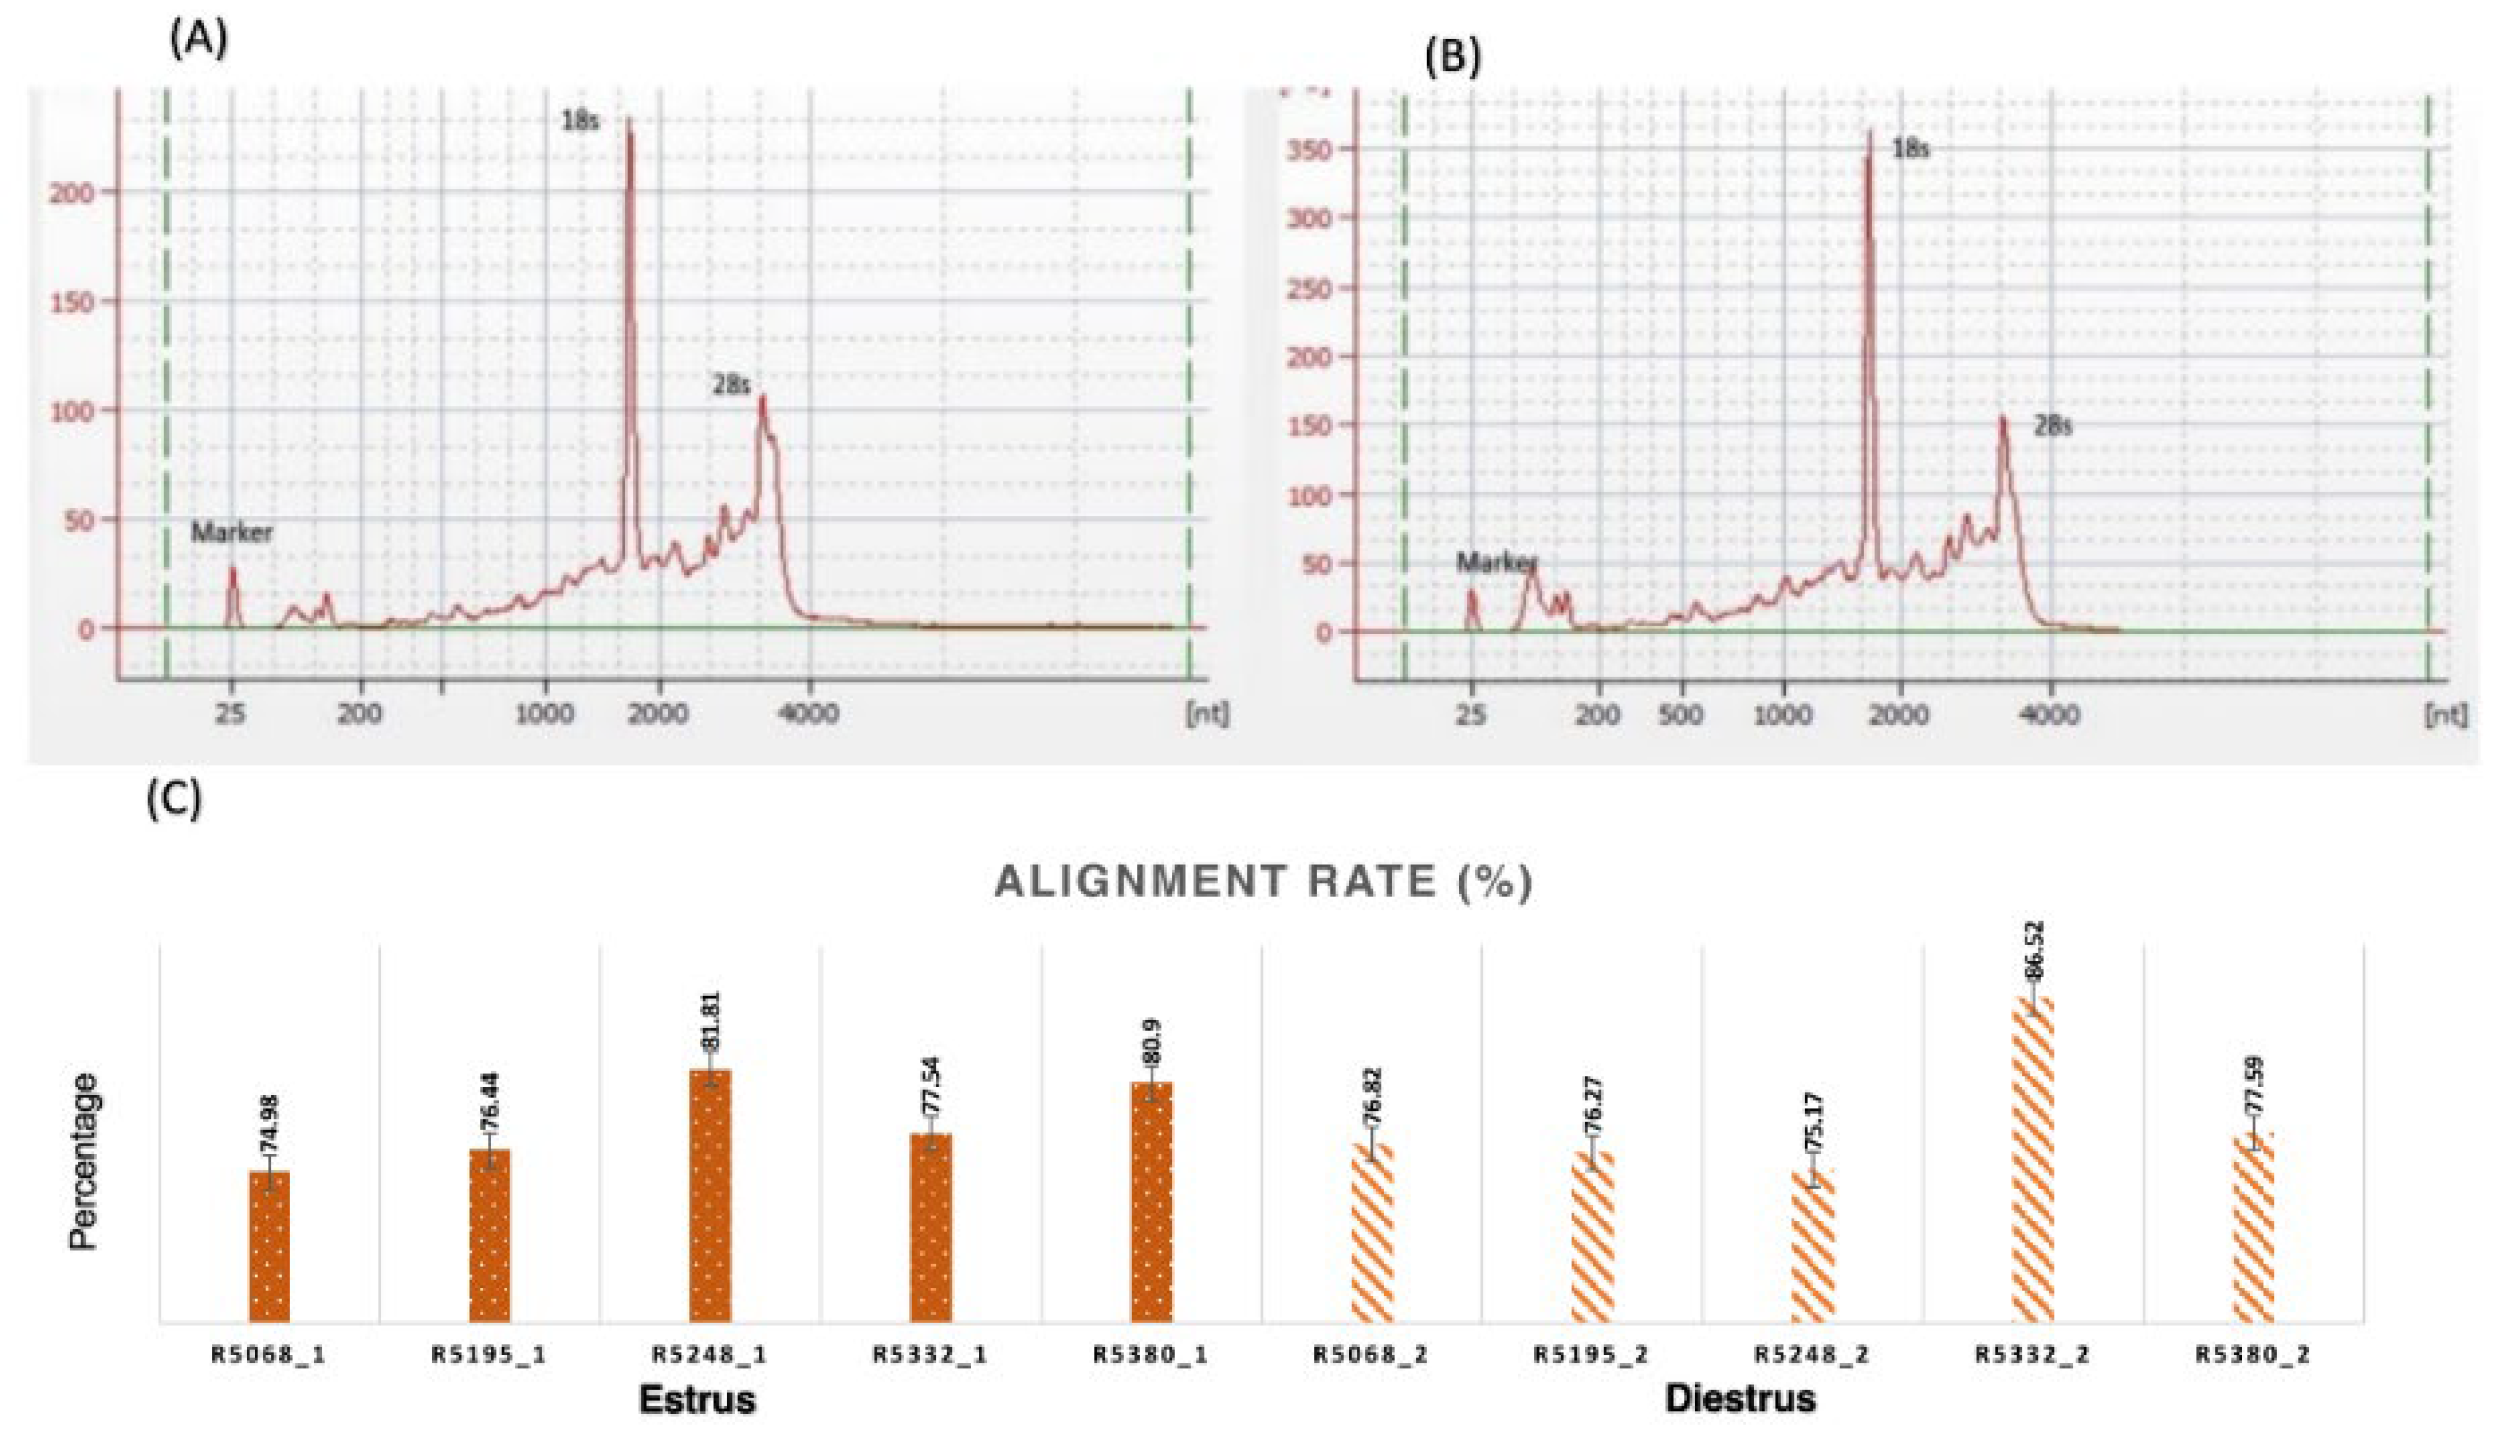
Total RNA extraction has yielded very high-quality RNA for next-generation sequencing. The RIN (RNA integrity number) of all 10 samples was at least 6.5 (Table 1; Figure 3), indicating good RNA quality for NGS sequencing.

2.2. RNA Seq Data

Two cDNA libraries were generated and sequenced from two groups, estrus and diestrus, in this work. All ten blood samples had good quality sequencing reads (> 23), according to FastQC. Below, in the Table 2, the primary properties of the sequencing and annotation data are described.
The quality control (QC) results revealed that cDNA libraries are around 50bp long, with 29,231,215 reads for estrus and 23,149,368 reads for diestrus. The Bos taurus reference genome UMID was matched to 78.33% of clean reads in estrus and 78.47 % of clean reads in diestrus.

2.3. Identification of DEmiRNA

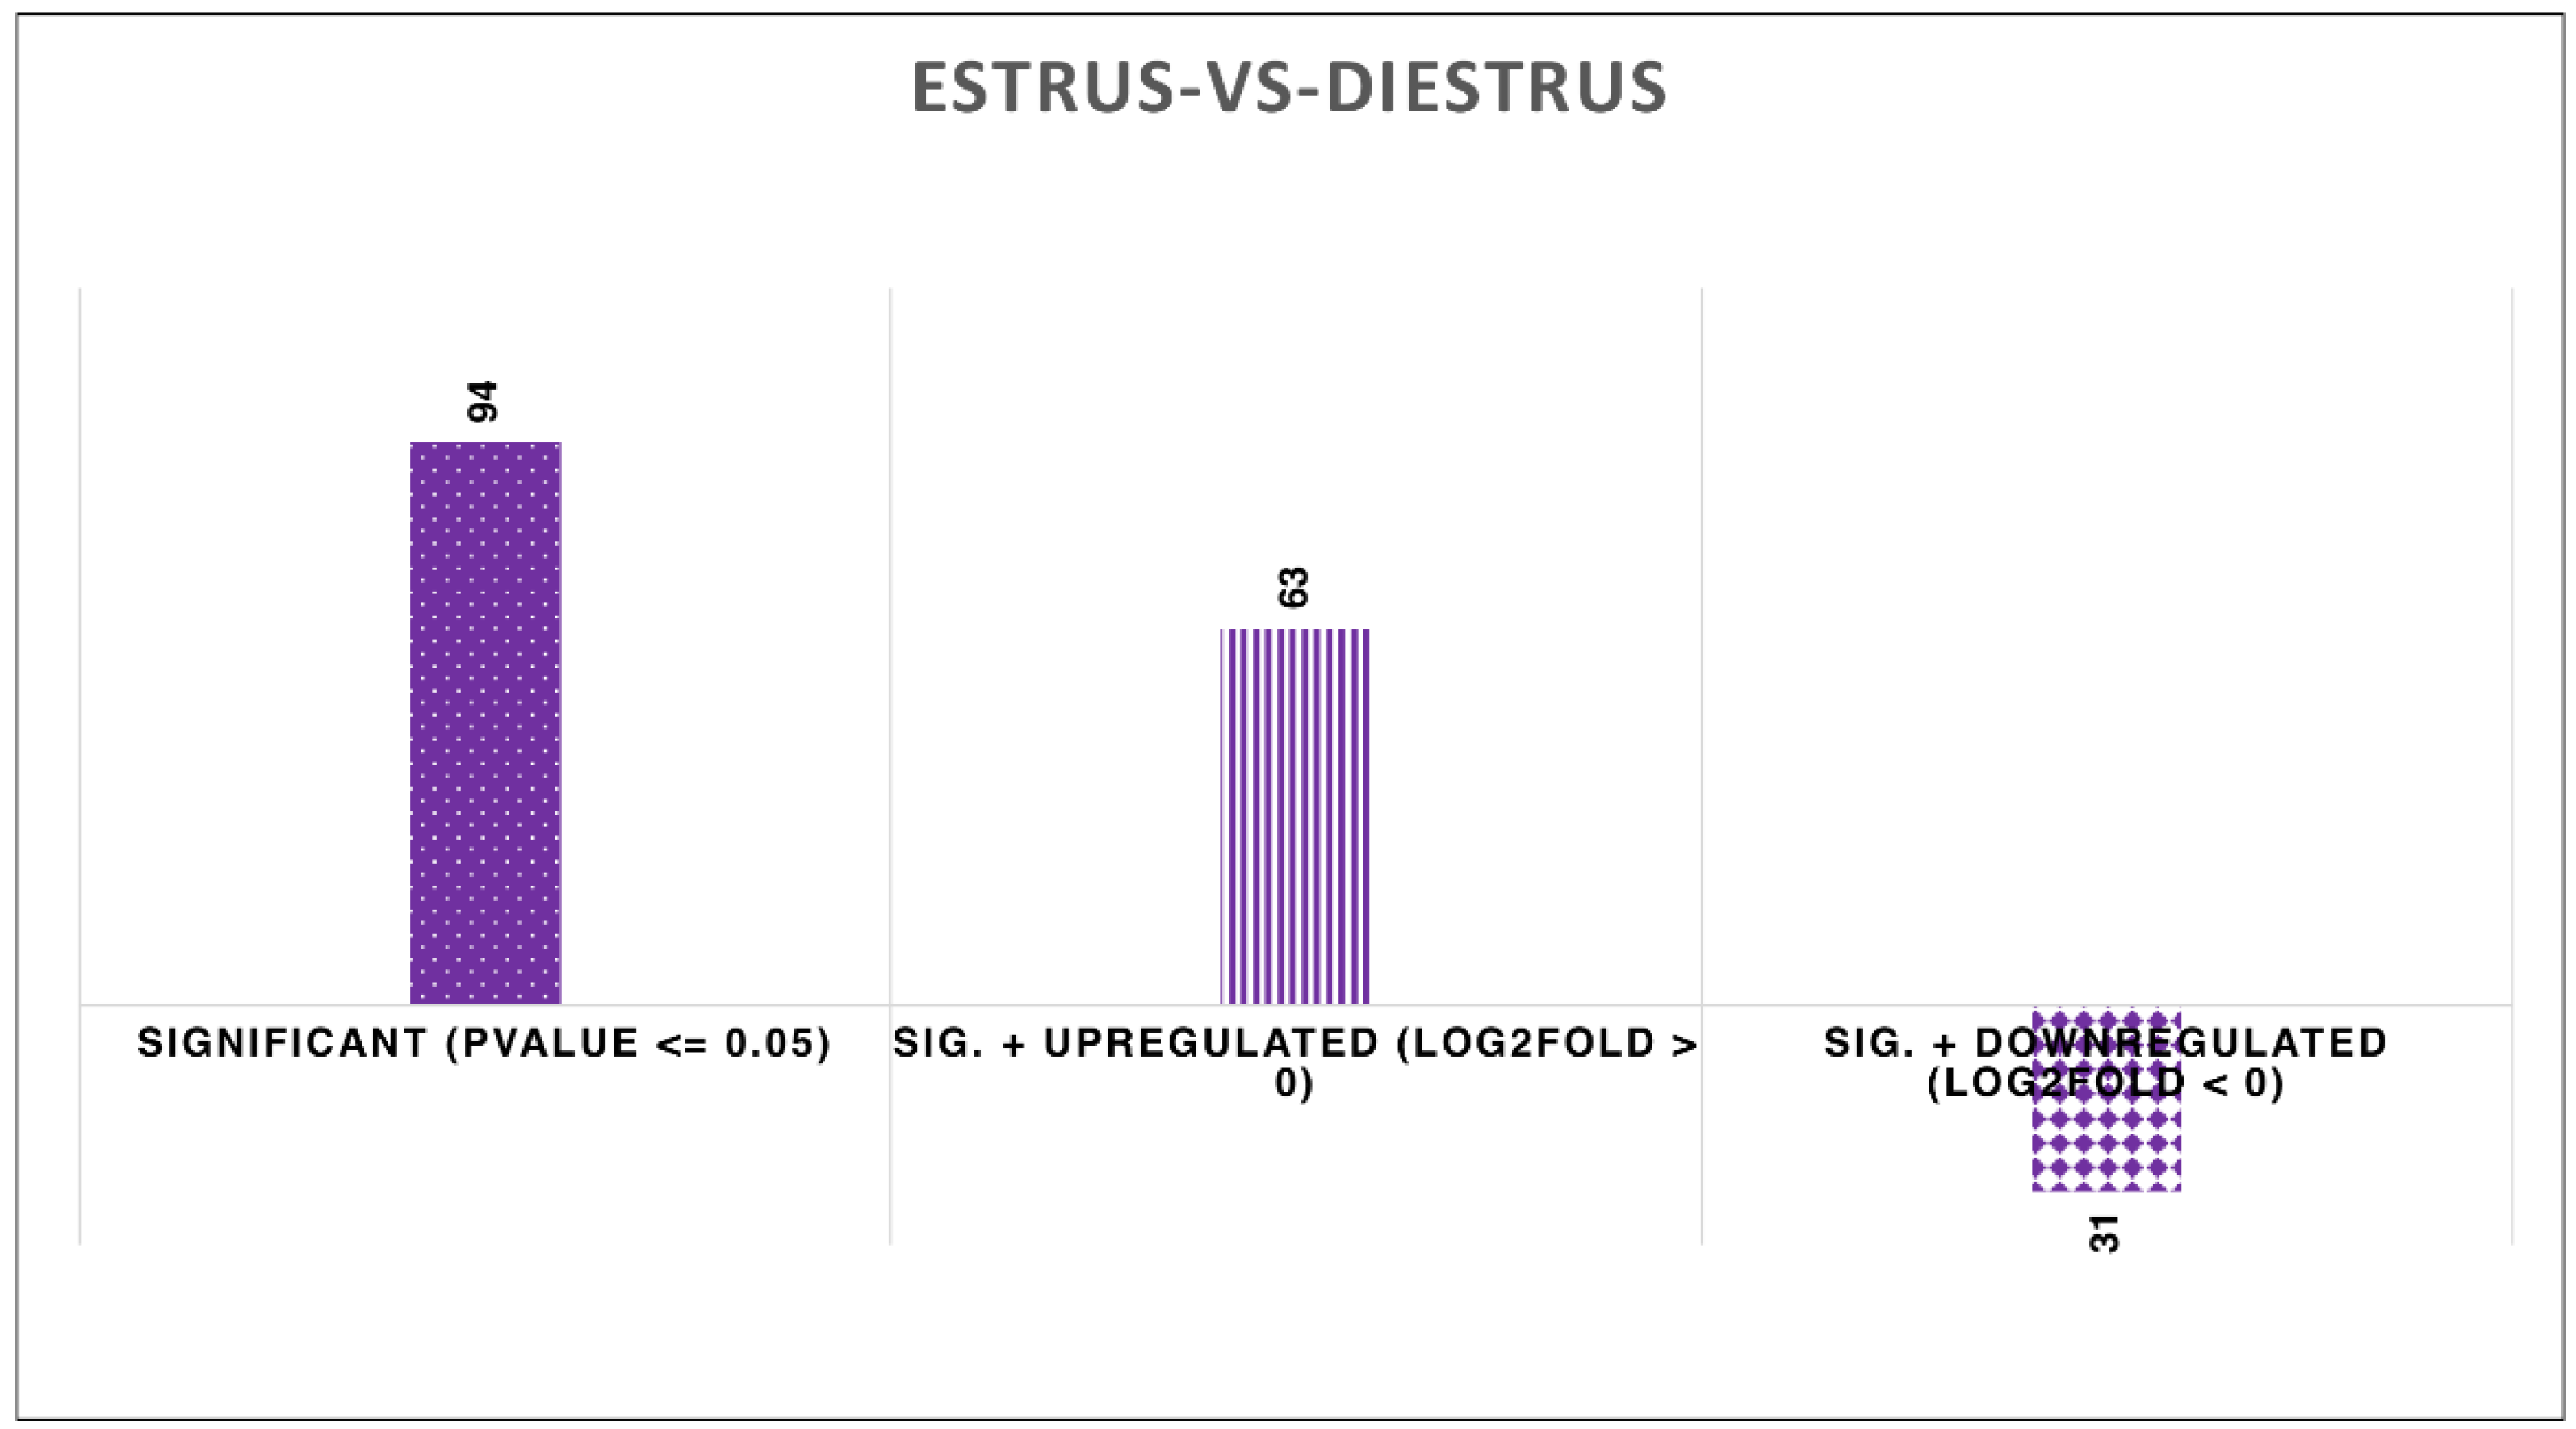
When comparing estrus to diestrus, a total of 94 were significantly expressed (P-value ≤ 0.05). 63 miRNAs were upregulated (log2Fold>0) and 31 miRNAs were downregulated (Log2Fold < 0) (Figure 4).

2.4. Top 10 Significantly different miRNA

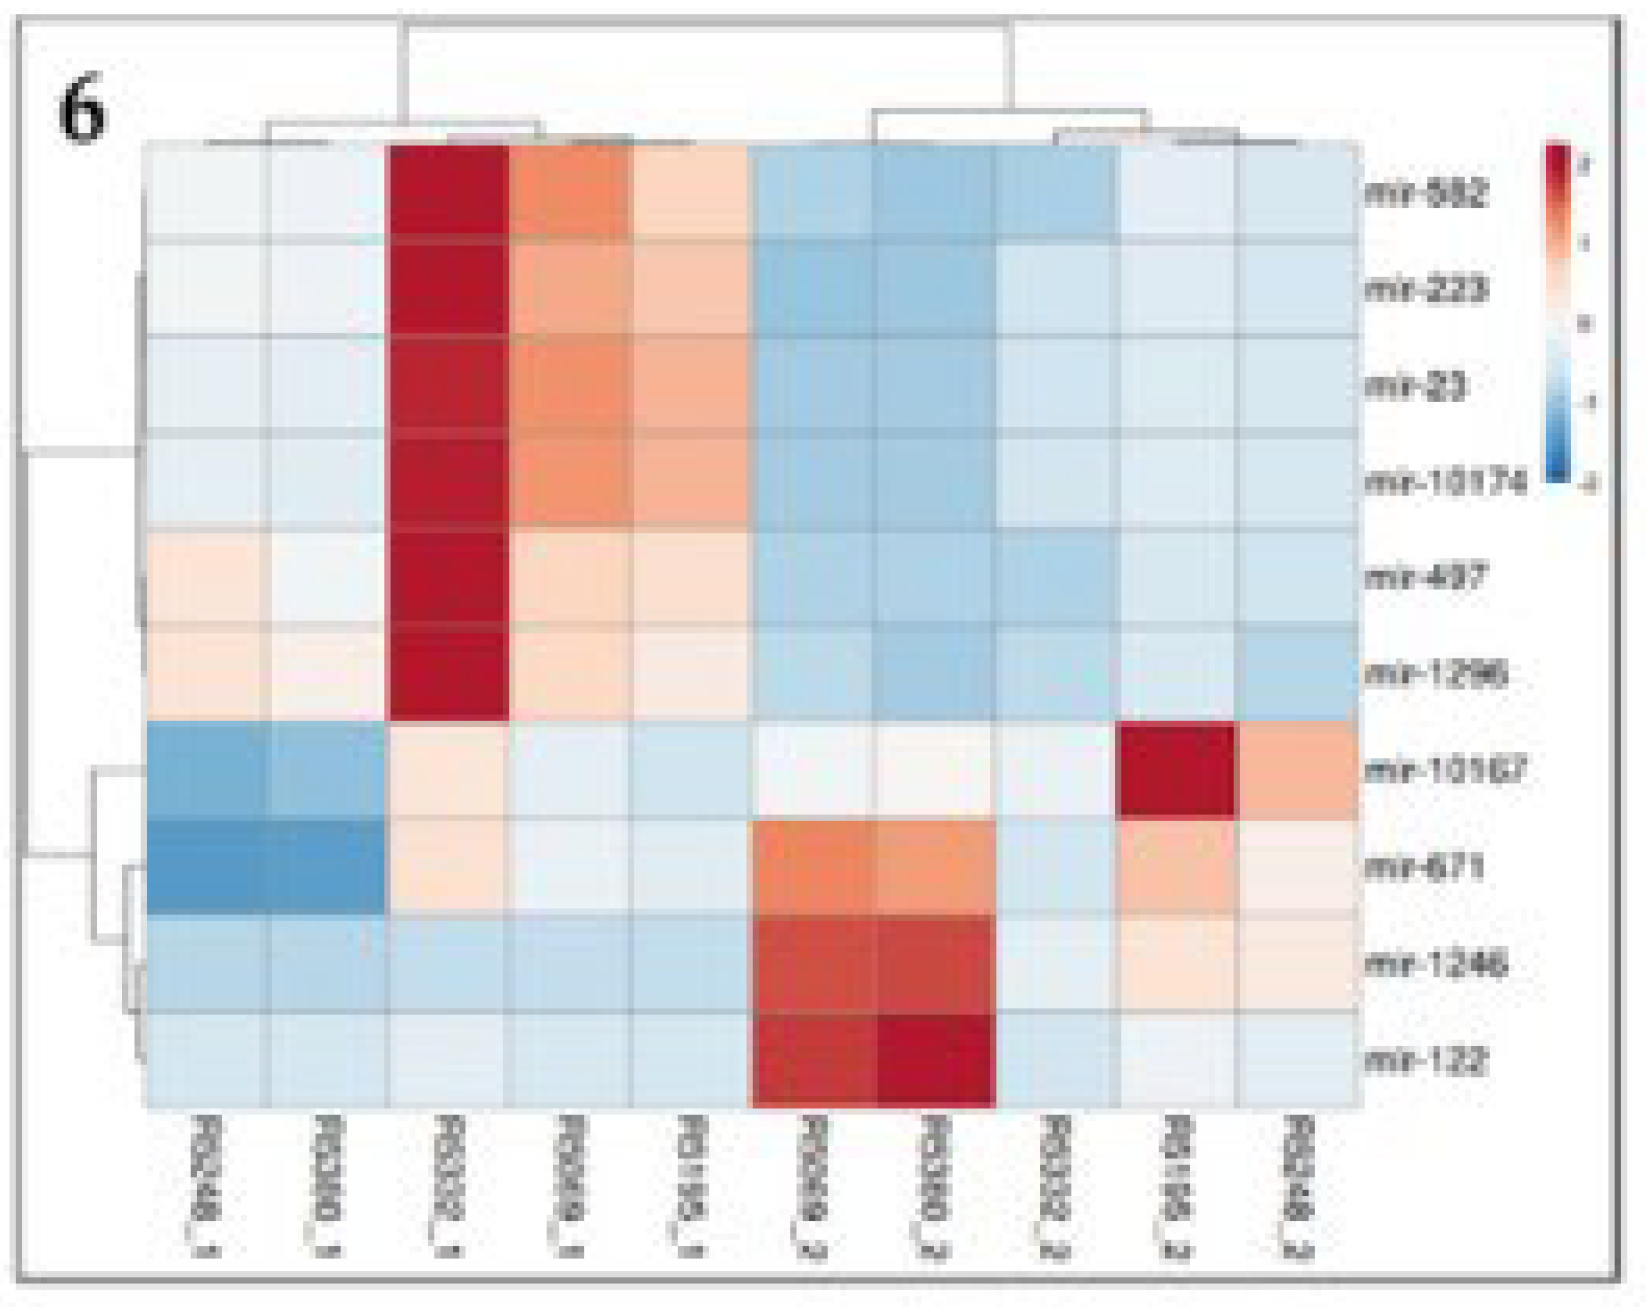
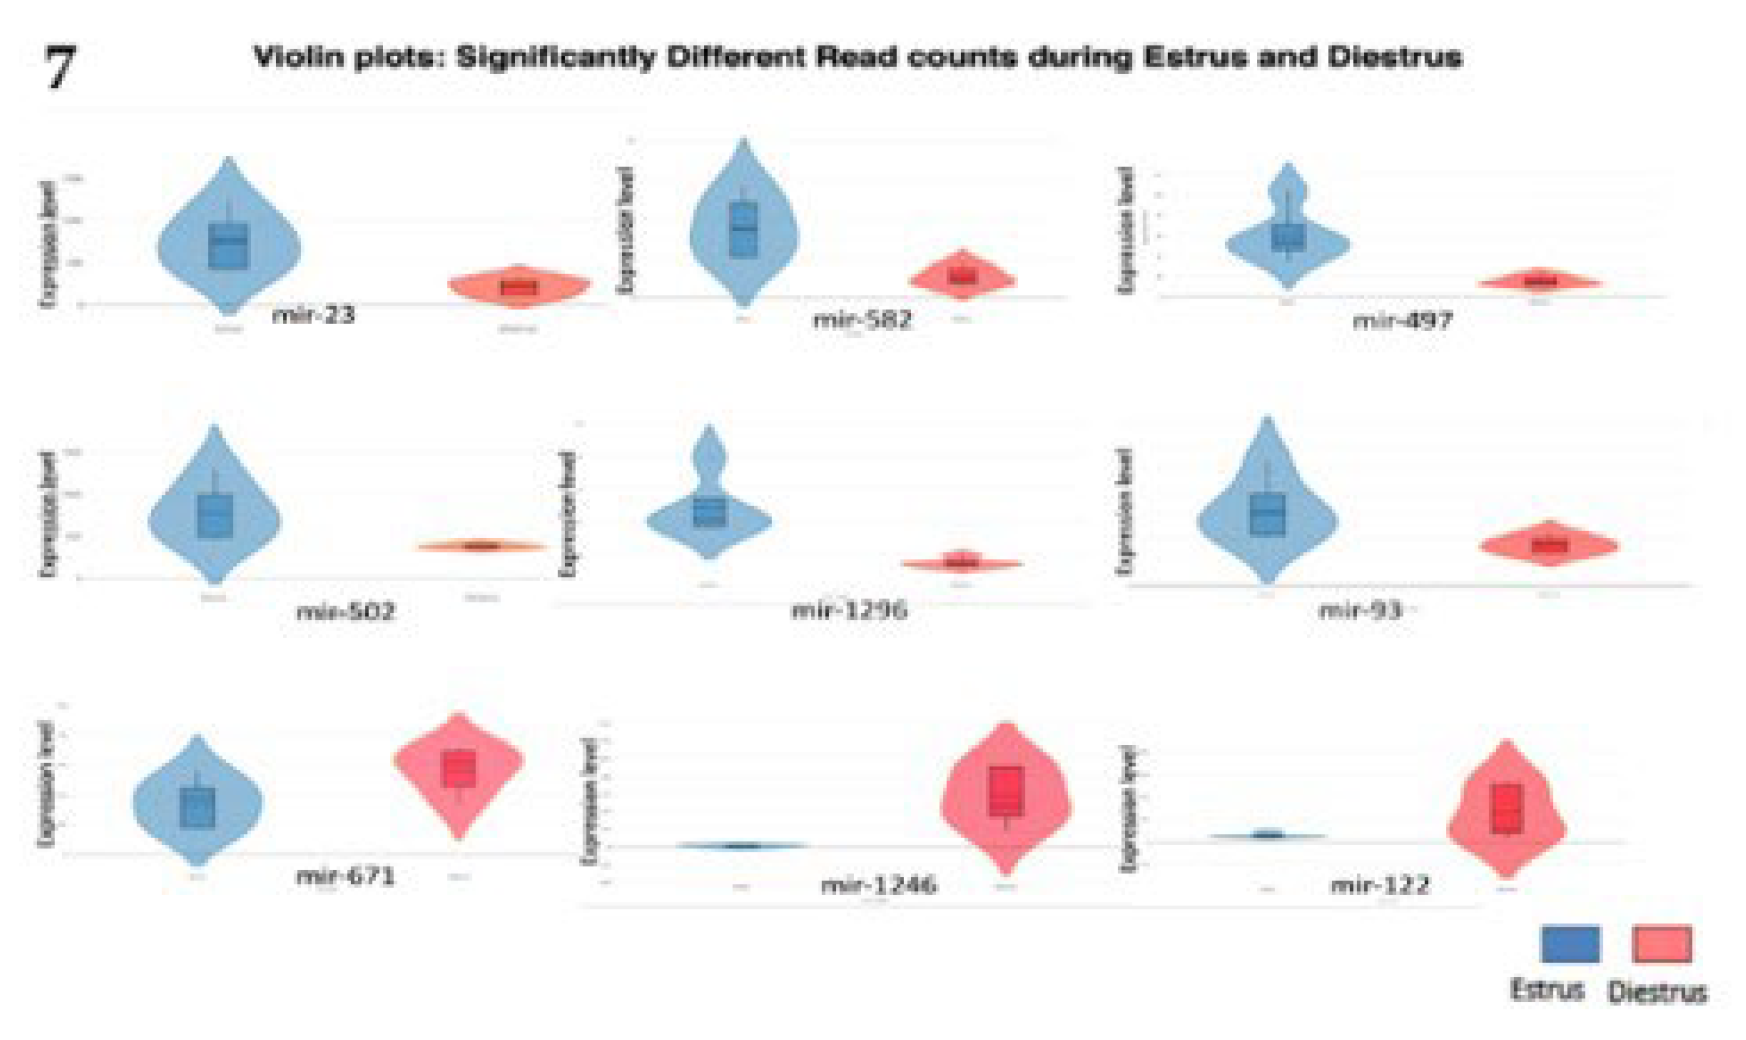
Top 10 miRNAs were selected from a total of 94 substantially different miRNAs, with (log2 fold change >2) indicating upregulation and (log2 fold change<2) indicating downregulation. miR-582, miR-223, miR-23, miR-10174, miR-497, miR-1296 are upregulated, while miR-10167, miR-671, miR-1246, miR-122 are downregulated. miR-497 has a high (log2 fold change>5) among the top 10 miRNAs (Figure 5, Figure 6 and Figure 7).

2.5. Validation by qRT-PCR

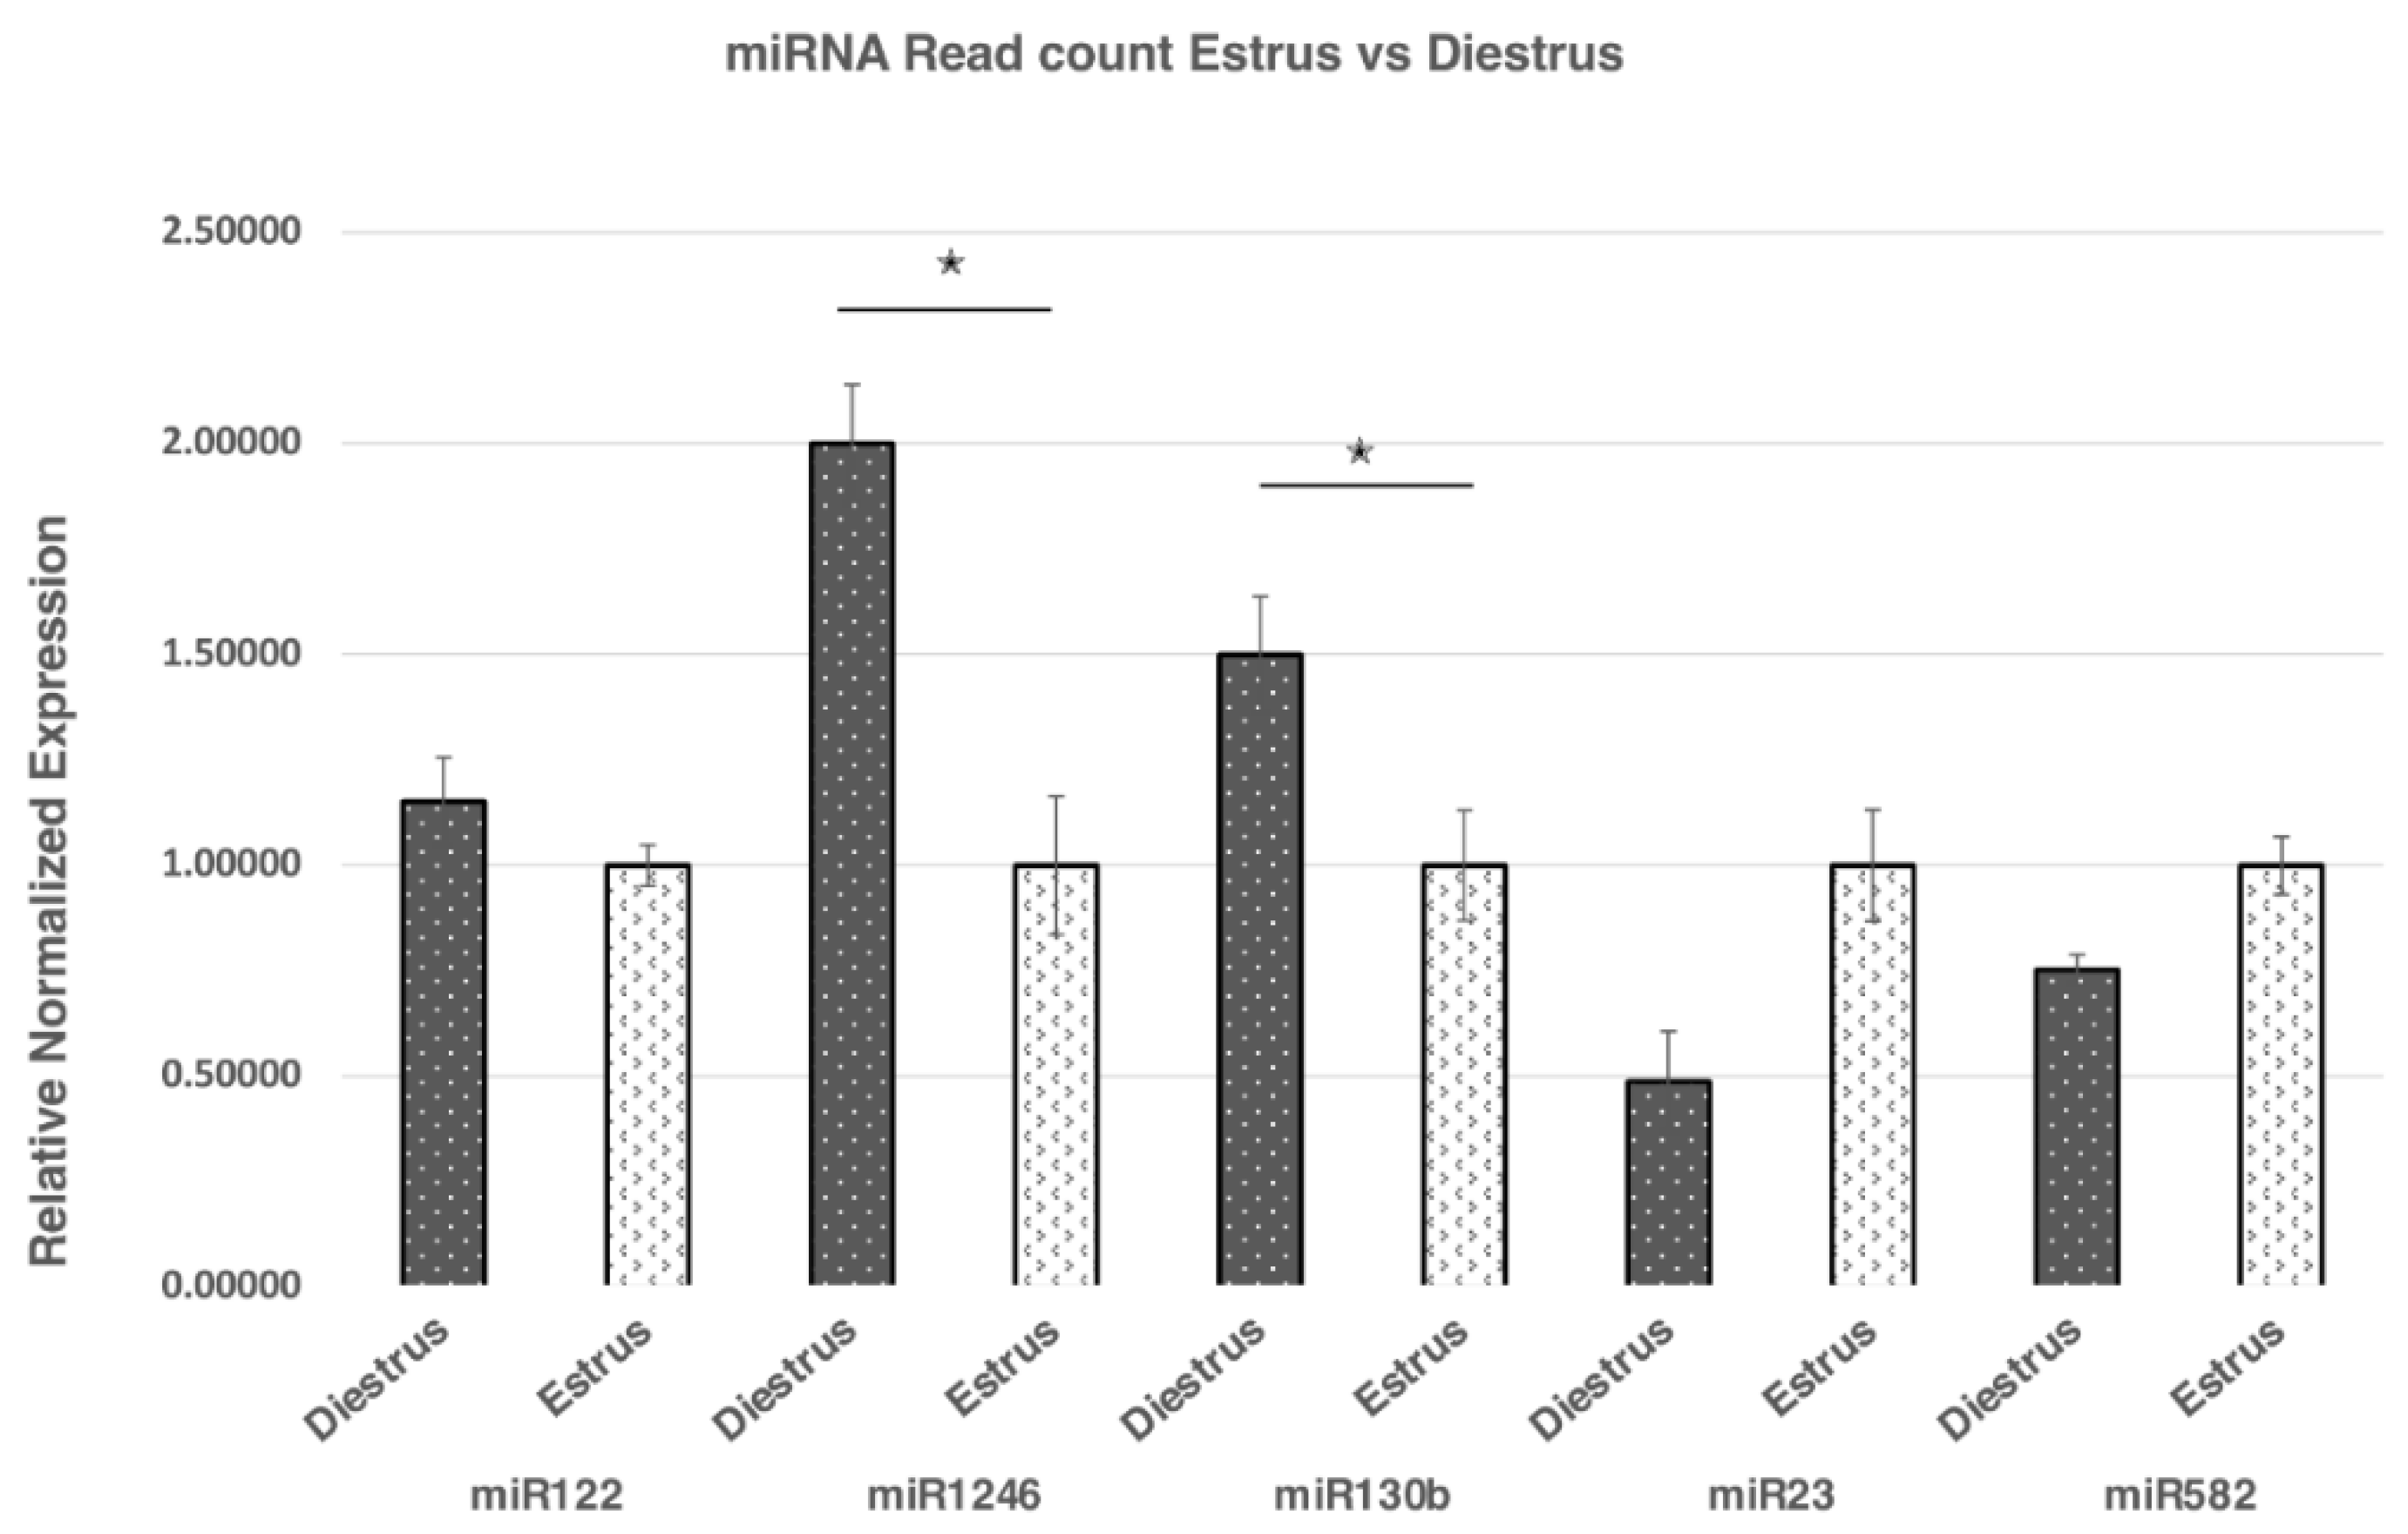
Levels of six differentially expressed miRNA were validated using qRT-PCR miR- 222, 1246, 130b, 582, and 23. Out of these miRNA miR- 1246 and miR 130b were significantly (1.5fold p<0.05) downregulated during estrus as shown in (Figure 8). Other miRNAs were expressed following NGS data.

2.6. Functional and pathway enrichment analysis
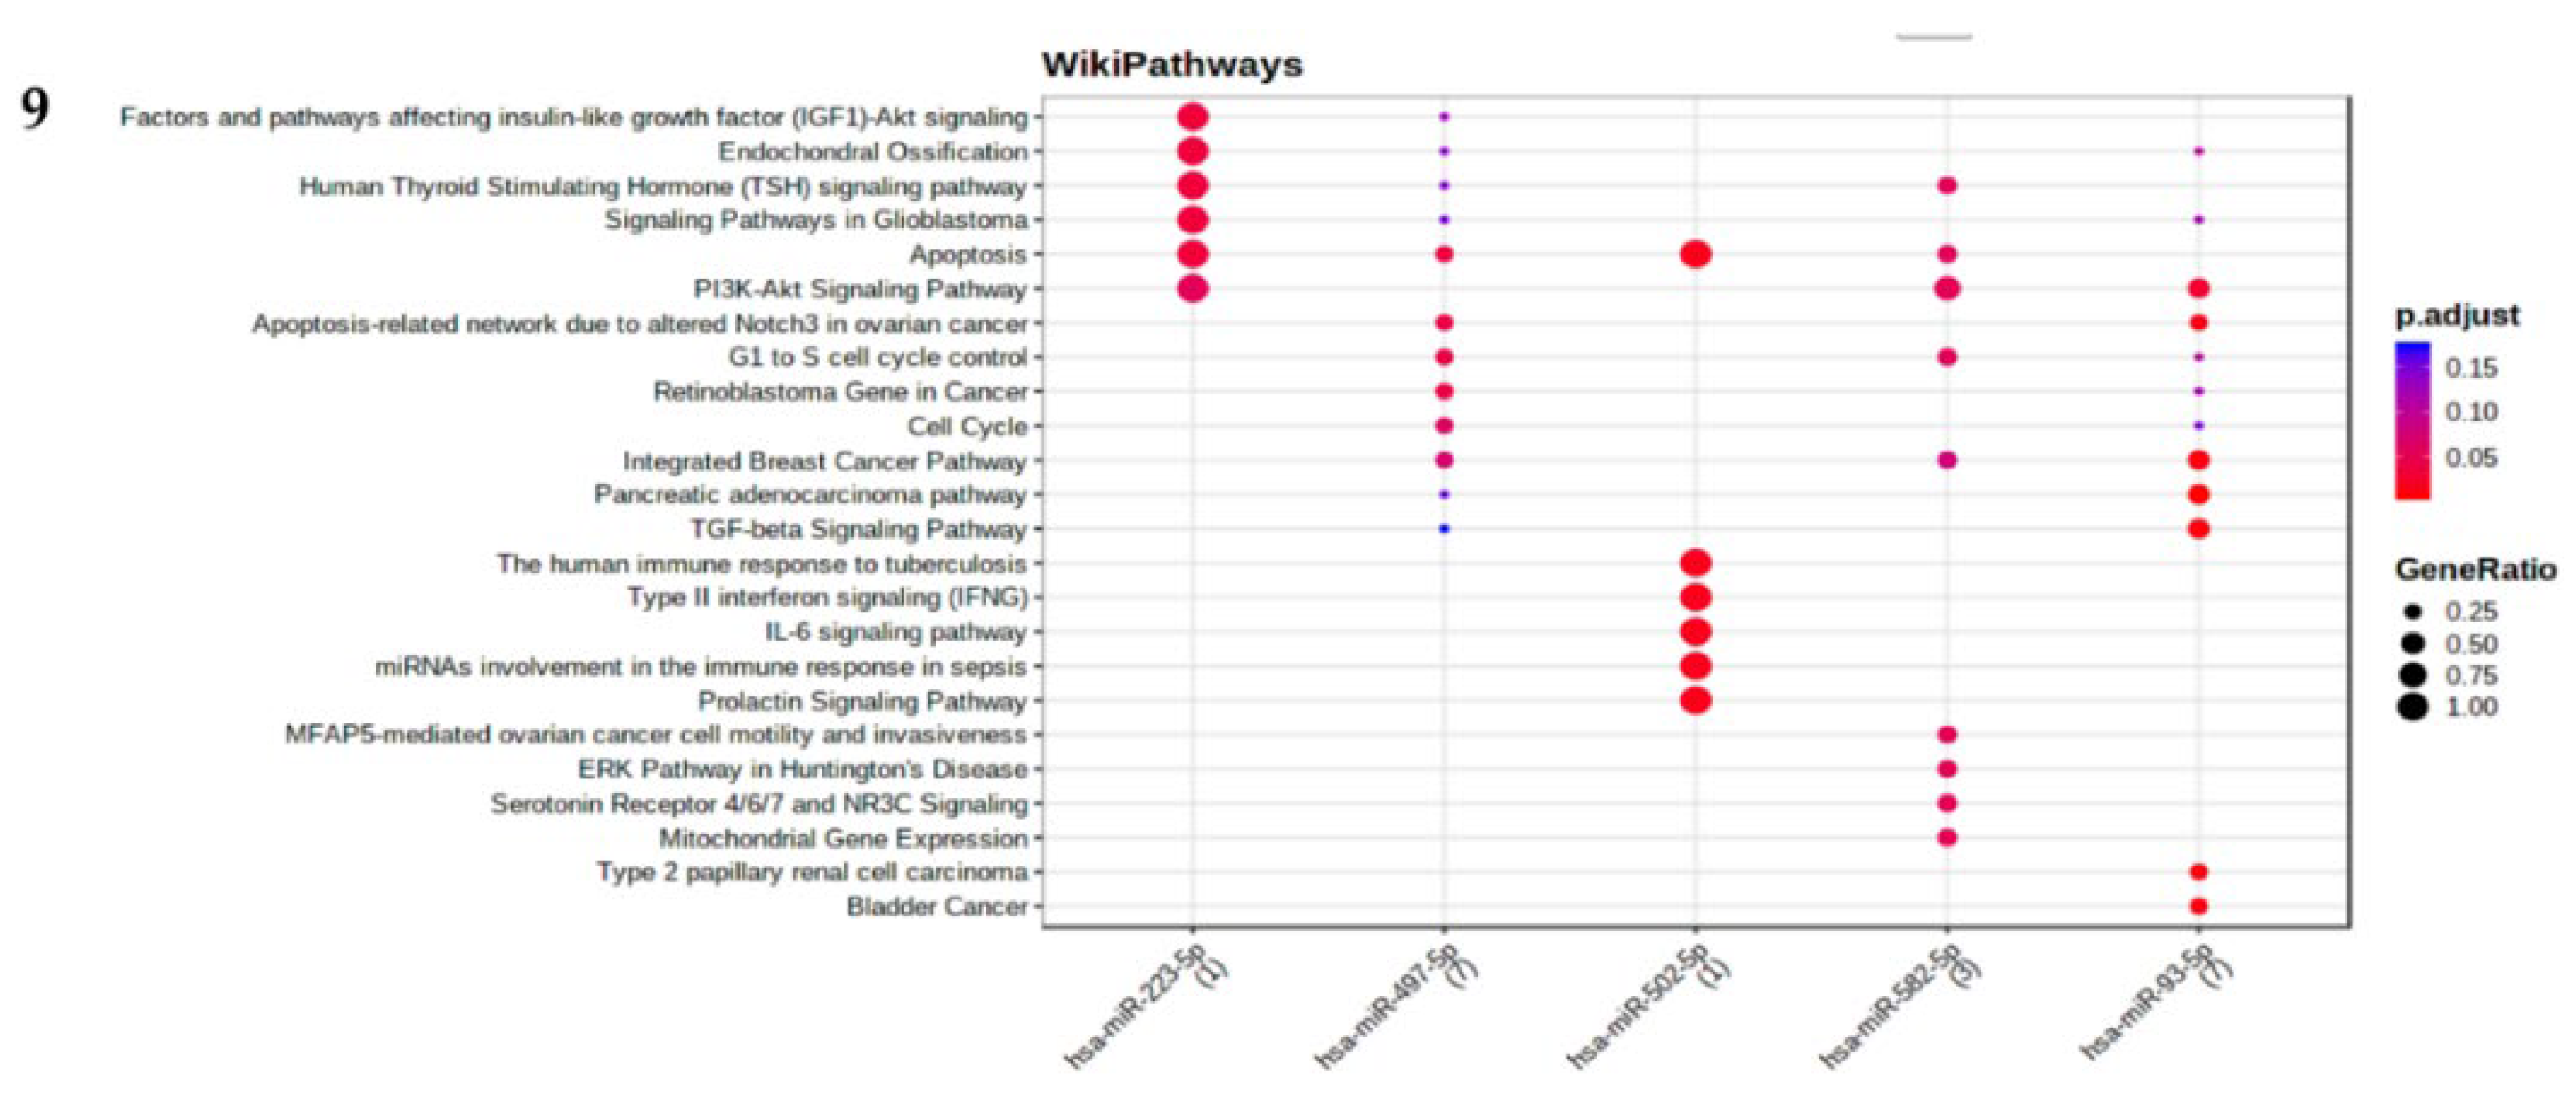
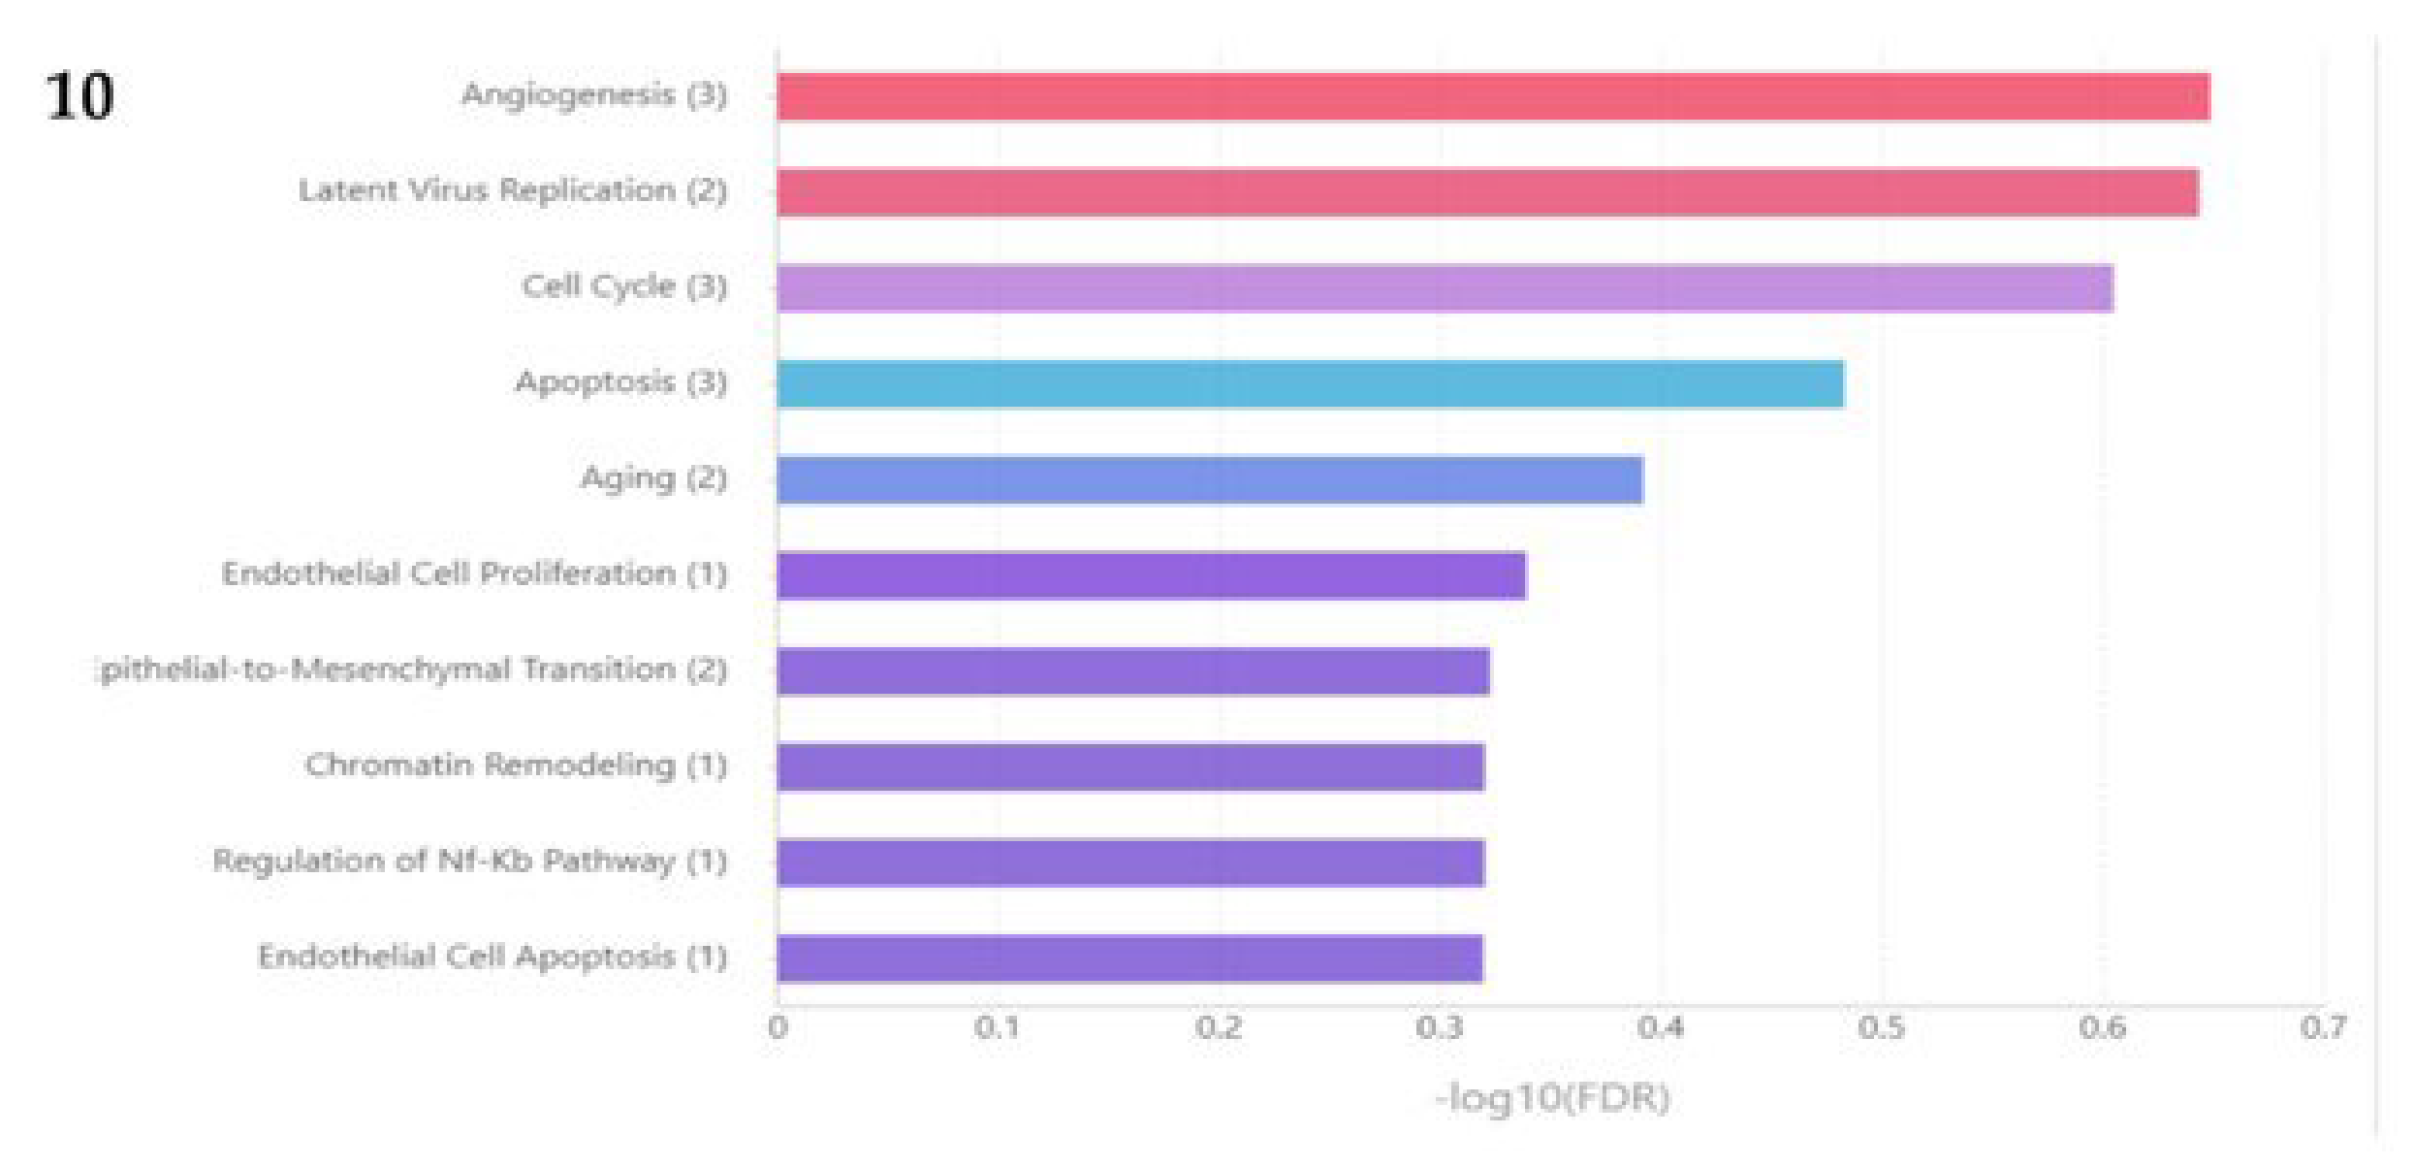
miRNA set analysis of miR-497, 223,1296,23, 582, 10167, 671, 122, 10274, miR-93, and miR-502 through TAM 2.0 software tool [9] has enriched pathways (FDR ≤0.5) that have functional implications of endothelial cell apoptosis, regulation Nf-Kb pathway, ageing, apoptosis, cell cycle and angiogenesis (Figure 9). MIENTURET software tool [10] has revealed that miR-223 is regulating PI3K-Akt Signalling, Apoptosis, TSH signalling pathway and Insulin-like growth factor (IGF1)-Akt. miR-497 is regulating the cell cycle and apoptosis.miR-502 5p is regulating the prolactin signalling pathway and the IL-6 signalling pathway (Figure 9 and Figure 10).
Figure 9. Different miRNAs regulating various pathways by using MIENTURNET Software. X axis is represented by miRNA and y axis are represented by pathways. Gene Ontology (GO) enrichment analysis for the genes in the brown module. The color represents the size of the spots represents the gene number, and the adjusted p-values.
Preprints 75688 g009
Figure 10. miRNA set analysis of miR-497, 223,1296,23, 582, 10167, 671, 122, 0274, miR-93, and miR-502 through TAM 2.0 software tool.
Preprints 75688 g010
Table 3. Reactome, KEGG, Biocarta, wiki pathways of SDE miRNA targets.
Category Term Total genes of
the term
Union_targets
in the term
miRs_in
_the_term
Score
Reactome Axon_guidance 266 78 5 4.298
Reactome Developmental_biology 494 114 5 4.153
KEGG Pathways_in_cancer 325 84 5 3.7
Biocarta Biocarta_mapk_pathway 87 36 5 3.69
Reactome Signalling_by_ngf 221 71 5 3.672
KEGG Neurotrophin_signaling_pathway 127 40 5 3.334
Reactome Ngf_signalling 136 46 5 3.304
KEGG MAPK_signaling_pathway 272 73 5 3.254
Pathway_interaction_ Erbb1_downstream_signaling 106 41 5 3.178
KEGG Insulin_signaling_pathway 137 42 5 3.068
KEGG Wnt_signaling_pathway 150 49 4 3.029
KEGG Axon_guidance 129 43 5 2.996
KEGG Prostate_cancer 89 30 5 2.798
KEGG Olfactory_transduction 388 6 4 2.691
Reactome L1cam_interactions 94 33 5 2.62
KEGG Erbb_signaling_pathway 87 29 5 2.605
KEGG Endocytosis 201 59 5 2.567
PATHWAY_INTERACTION_DATABASE Cdc42_signaling_events 70 27 5 2.533
KEGG Progesterone-mediated_oocyte_maturation 86 27 5 2.531

2.7. miRNA Target prediction and degree centrality

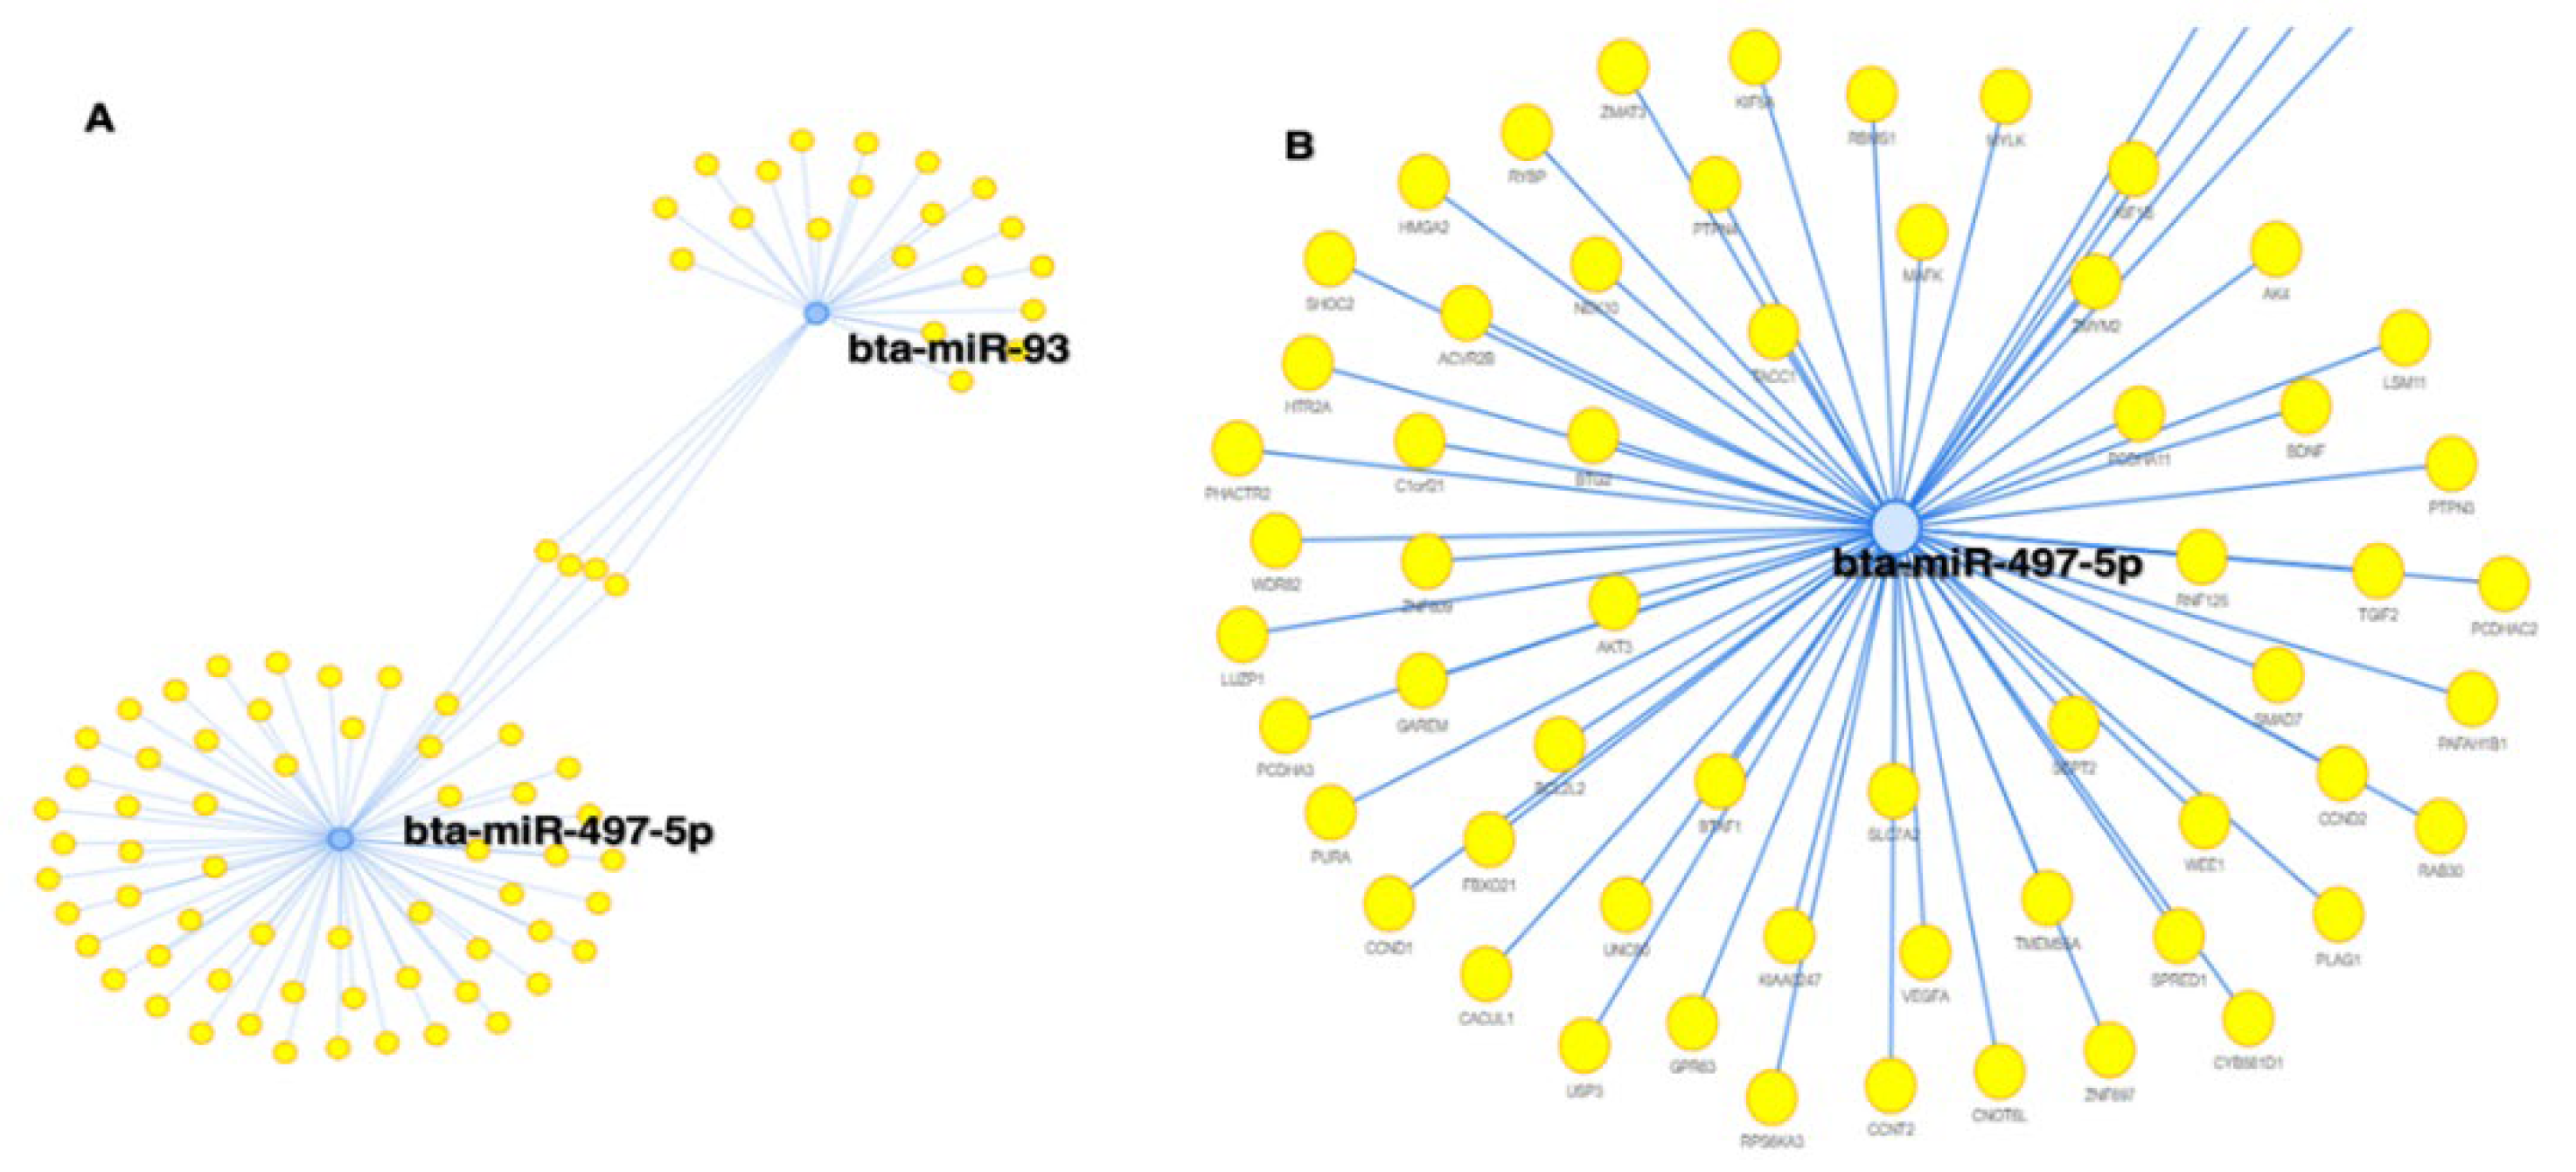
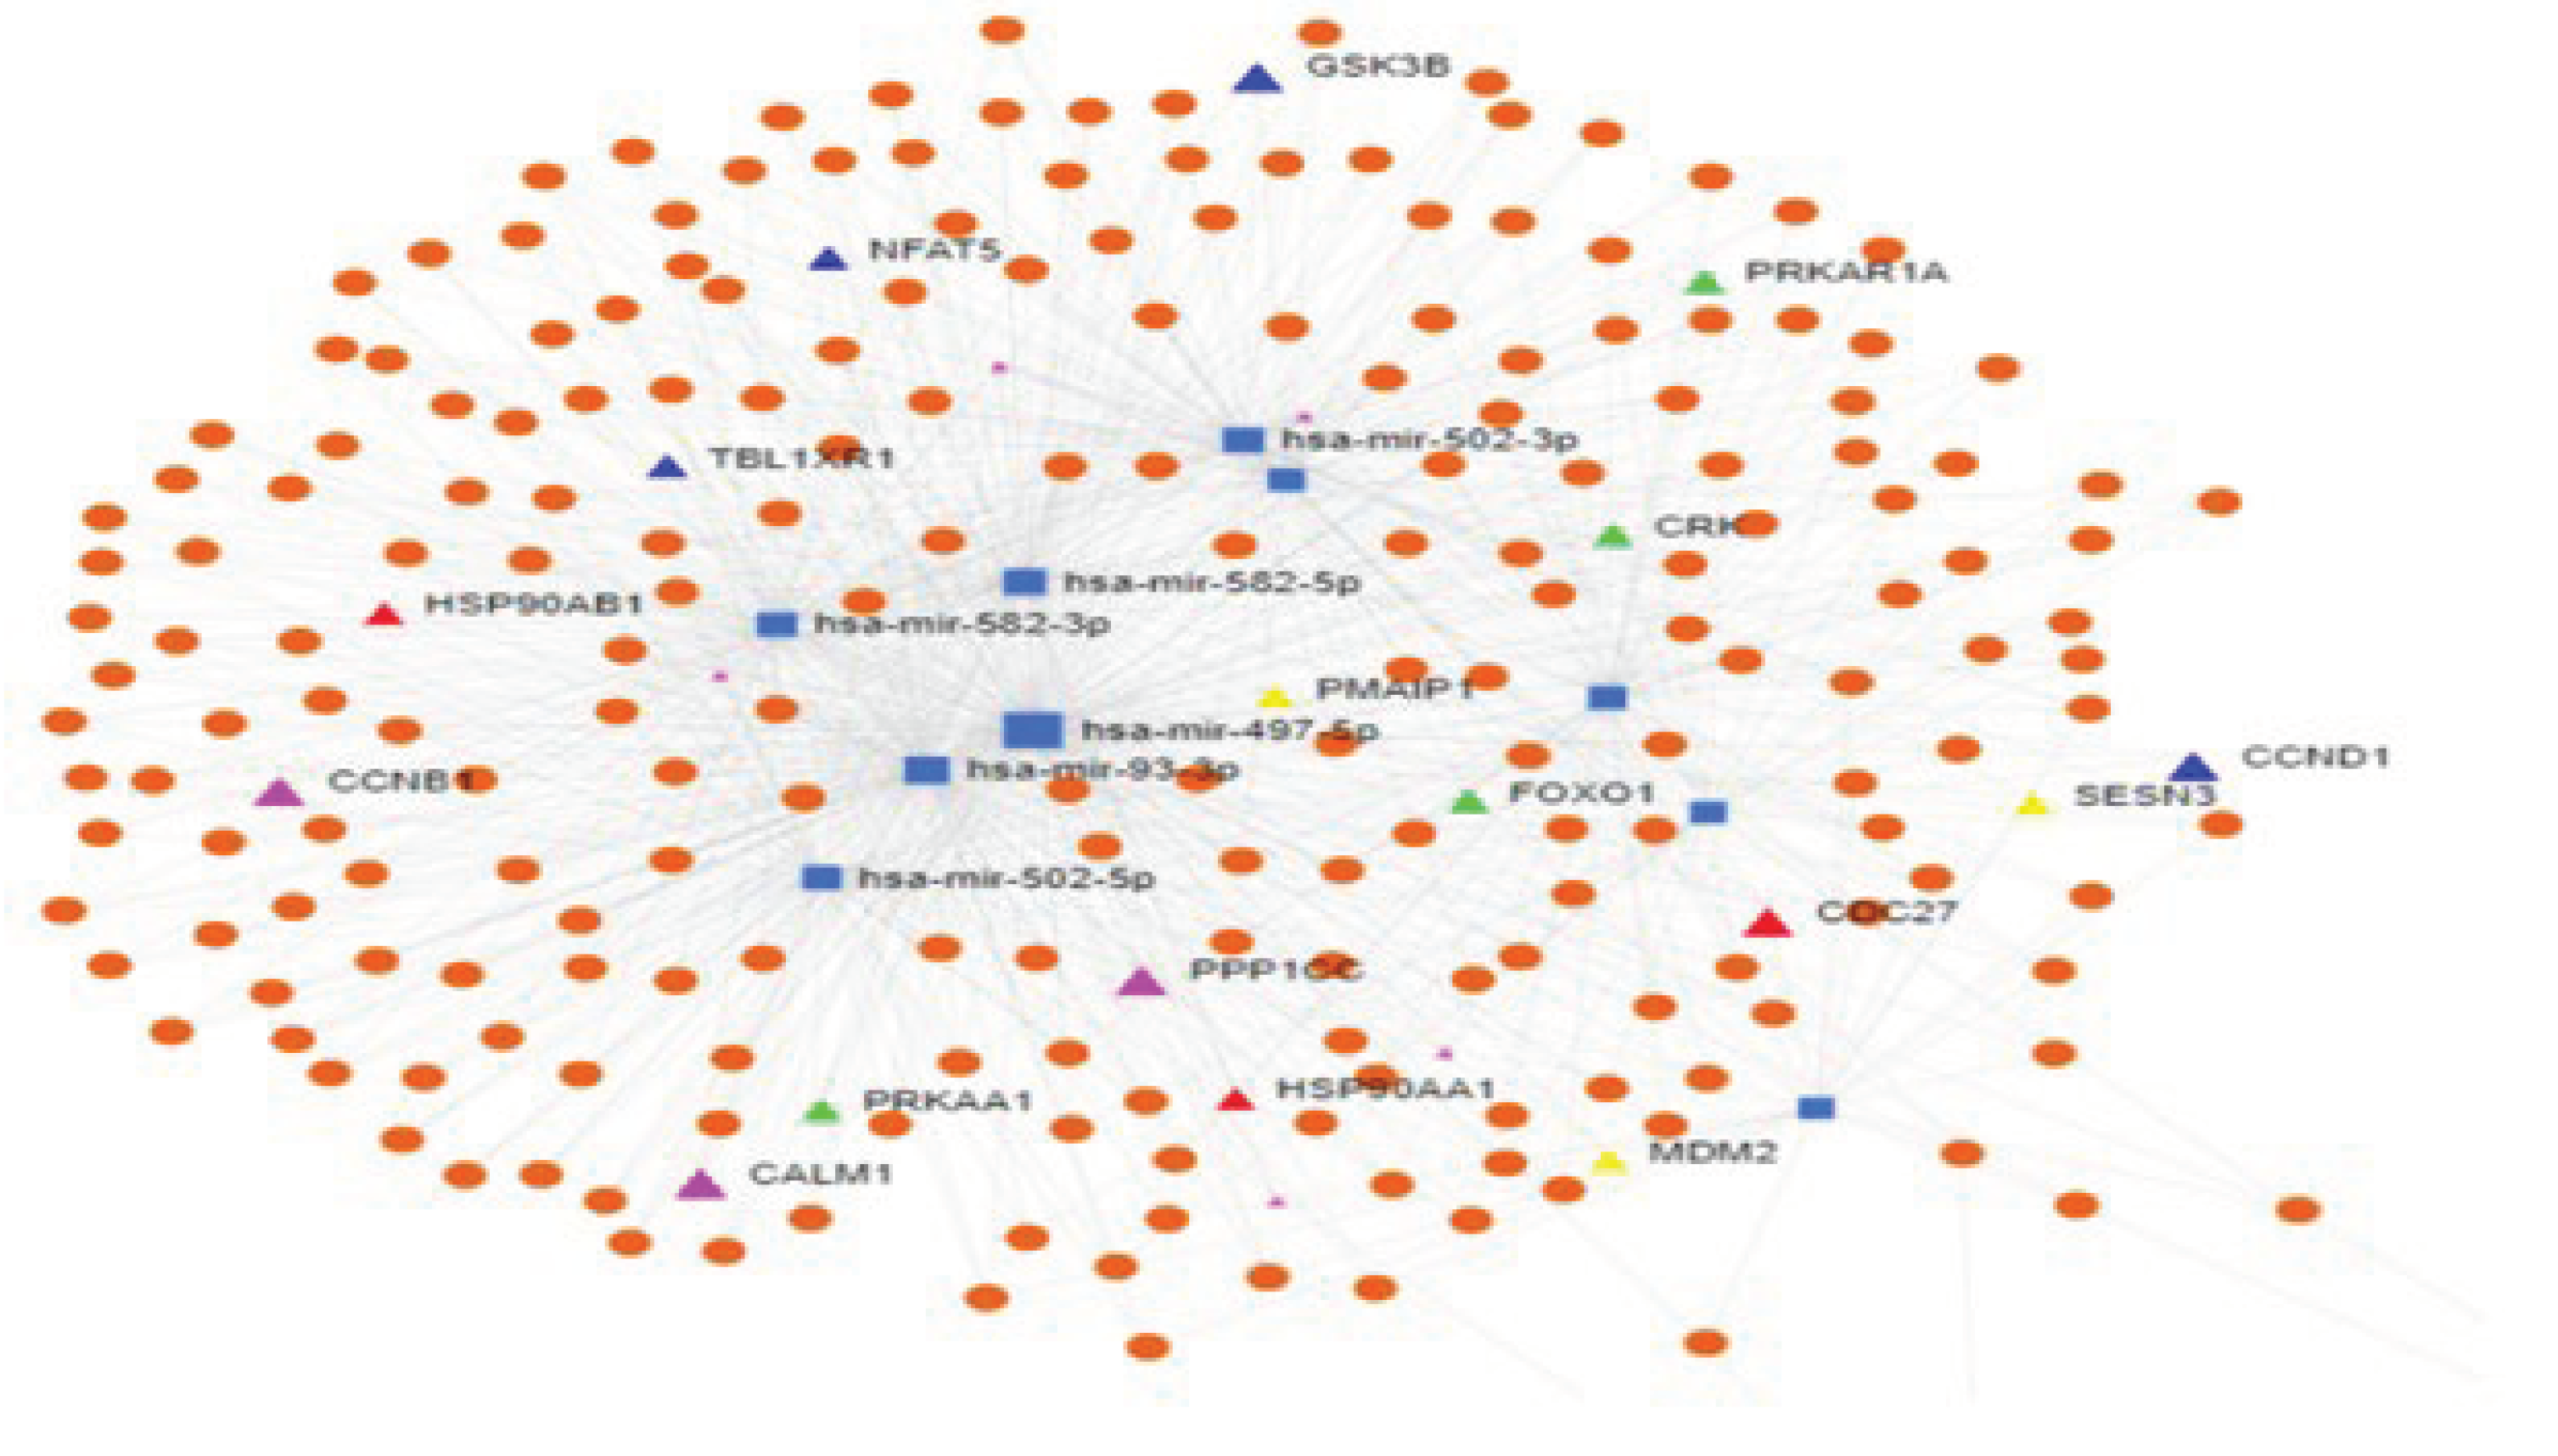
miRNet 2.0 and MIENTURNET software’s analysis of differentially present miRNA revealed miR-497-5p is having highest degree centrality followed by miR-93. It suggests that miR-497-5p is regulating more number of genes involved directly in reproduction and pathways related to reproduction (Figure 11 and Figure 12).

3. Discussion

Hitherto miRNA identification as a biomarker was carried out in different samples like saliva [11,12] and urine [13]. The chances of miRNA from saliva and urine becoming a biomarker can be moderate with certain limitations. To overcome limitations, circulating miRNA can be an alternative predictor of estrus in buffaloes. But there were very few reports on circulating miRNA as estrus biomarkers. To overcome the drawbacks, questions were raised such as 1) do circulatory miRNA differ between estrus and diestrus stages of buffalo. 2) If existing how differentially they are present, and 3) the effect of miRNA on different genes involved during estrus and diestrus.
Small RNA sequencing has produced good quality reads upon FASTQC check. The Phred scores were above 36, which is of very good quality (Ewing and Green; Ewing et al.). On average, 20 million reads were obtained with an average alignment of 78.33% in estrus and 78.47% in diestrus to the Bos taurus reference genome UMID. 3.1. Alignment is above the acceptable range for downstream analysis. Reads Per Kilobase per Million mapped values of more than 1000 were high in estrus compared to diestrus. On mapping these reads to known miRNAs, there were 320 known miRNAs compared to 317 in diestrus. Contrastingly, novel miRNAs are less in estrus compared to diestrus. Further, DEseq analysis has produced 94 significant miRNAs with (p<0.05), out of these, 63 were upregulated and 31 were downregulated at (log2 fold>0) and (log2fold <0). Filtering based on fold change up to (log2 fold >1) and (log2 fold 2) further narrowed down miRNA. The top ten highest foldchange miRNAs were picked from the miRNA expressed. miR-497, 10174, 23 223, 582, 1296, and miR-10167, 671, 1246,122, were elevated, while miR-10167, 671, 1246,122, was downregulated. Of these miRNAs, miR-497 has the highest foldchange >5 between estrus and diestrus followed by others. miR-223, miR-497, miR-502, miR-1296, miR-582, miR-93 were significantly higher in estrus compared to diestrus. Unlike the former, miR-10167, miR-671, miR-1246, and miR-122 were significantly upregulated in diestrus. KEGG, Reactome, Biocarta, wikipathways analysis of miRNA targeted genes through miRSystem [14] and MIENTURNET [10] has revealed the downregulation of pathways like gene expression, Axon guidance, insulin signalling, NGF signalling, WNT signalling, prolactin signalling, IL-6 signalling, TGF signalling, cell cycle, Apoptosis, progesterone mediated signalling pathway, oocyte meiosis, estrogen plasma membrane receptor signalling. Down regulation of NGF signalling and WNT signalling is crucial for estrous cyclicity. Previous studies [15] reported that an excess of nerve growth factor increases androgen secretion and disrupts estrous cyclicity in rats. These studies strongly second the findings of the present study that the NGF signalling pathway has to be downregulated. Similarly, Wnt signalling pathway genes (myc, Birc5) were downregulated during the mouse estrous cycle [16], these findings of earlier studies authenticate the downregulation of the said pathway in the current study. To better understand the relevance of elevated miRNAs, network analysis using miRNet and Cytoscape 3.8.2 found miR-497, which regulates 261 genes and 1164 edges and has a high degree centrality of >60. The KEGG pathway analysis revealed that the p53 signalling pathway and the pathways described above were downregulated. Genes that are downregulated in p53 signalling are CCND1, CDKNIA, MDM2, PMAIP1, SESNI, CYCS, CCND2, CDK6, and CCNB1. Though p53 is not directly involved in the estrous cycle, its downregulation is crucial because it is implicated in the apoptotic route that maintains the steroidogenesis of the cycle via the LIF signalling pathway [17]. In addition, the oocyte meiosis pathway and the progesterone mediated oocyte maturation pathway are downregulated to enable cells to move from G1 to S shift in the cell cycle [18]. However, recent research has demonstrated that progesterone exerts its effects via non-classical signalling pathways, which are frequently mediated by non-genomic signaling [19]. Oocyte maturation occurs mainly through the classical pathway, but sometimes maturation occurs through non-genomic pathways as progesterone mediated. Downregulation of progesterone mediated oocyte maturation may give way to the classical pathway through activation of the Src/p21ras/Erk pathway by the progesterone receptor via cross-talk with the estrogen receptor [20].
In summary, a total of 94 miRNA were identified from the circulating blood of buffalo that were differentially altered at the estrus and diestrus stages of the buffalo oestrous cycle. Among those 94 miRNA; 6 were upregulated (miR 223, miR497, miR-502, miR-1296, miR-582, miR-93) - and 4 were downregulated (miR-10167, miR- 671, miR-1246, miR-122). Of all these mi-497 is considered to be more significantly enriched during estrus and is targeting more genes and pathways with a greater degree of centrality. qRT-PCR validation of random at random proved the accordance of NGS data. Finally, our study implies the differential expression of miRNA potentiates miR-497p to be a predictive biomarker that needs to be deciphered in future studies.

4. Materials and Methods

4.1. Identification of Heifers

Sixty healthy heifers with normal temperature and respiratory rate were selected from the Central Institute for Research on Buffalo’s farm, Hisar (latitude is 29.17 N and longitude is 75.72 E). The entire experiment was carried out from October to February when the temperature was 100C to 150C. They were observed for behavioral signs like bellowing and phlegm reaction. Simultaneously, they were examined for clinical signs like swelling of the vulval lips and reddening of the vagina. Later, estrus was confirmed by ultrasonography and progesterone assay.

4.2. Ultrasonography confirmation

Ultrasonography was conducted on the same animals which were exhibiting the typical clinical signs with ultrasound Doppler made by Hitachi, model (F31 A). A Transrectal probe (7.5 MHz frequency) was introduced into the rectum and gently moved on the surface of the uterus for ovary and follicle examination. Heifers with follicle sizes of more than 12mm were confirmed as estrus animals. Of the above sixty animals, forty animals that were conformed were selected and kept in a group at zero-day estrus and continued till the diestrus stage i.e. 10th day.

4.3. Collection of Blood Samples

Blood samples were collected from zero-day estrus heifers and tenth-day diestrus heifers. The right jugular vein was punctured with a vacutainer needle and blood was put into EDTA precoated vials, serum clot activator vials, and Tempus vials prefilled with RNA stabilizing solution. Blood collected in EDTA vacutainers was processed for haematology analysis and total RNA isolation. The serum collected was processed for progesterone hormonal assay

4.4. Progesterone Assay Confirmation

To confirm animal cyclicity, a progesterone assay was performed for the quantitative determination of progesterone in serum samples, the serum sample was thawed at 4°C for 12 hours before using the assay solid phase Enzyme Immunoassay kit (SECURE). The kit includes enough reagents for 96 tests and allows for the analysis of 41 unknown samples in duplicate.

4.5. RNA Isolation and Quality Assessment

RNA was isolated and modified for the TempusTM technology at DNAxperts in New Delhi. The PAXgeneTM Blood RNA Kit was used to purify the PAXgeneTM Whole Blood RNA samples using the Qiagen method for column purification of nucleic acids (Part Number 762134, Qiagen). The ABI PrismTM 6100 Nucleic Acid PrepStationTM and TempusTM extraction reagents were used to extract whole blood samples collected in TempusTM vacuettes. When samples were collected, they were immediately frozen at -70°C. To compensate for brief blood sample pulls, PBS buffer was added, and then Purification Wash Solution 1 was washed twice at 80% for 500 seconds. Washing step using Purification Wash Solution 2 at 80% vacuum for 120 seconds. Purification Wash Solution 2 was removed from the filter using an additional vacuum stage. Three extra cleaning processes were done using Purification Wash Solution 2 at 80 percent vacuum for 120 seconds after changing the reservoirs on the ABI 6100 PrepStationTM. Adapter plates were replaced one more time during the elution process to ensure the purity of the eluted RNA. The Microcon YM-100 was then used to concentrate the eluted RNA (Millipore, Billerica, MA). Prior to hybridization, the Agilent 2100 Bioanalyzer (Agilent Technologies, Palo Alto, CA) was used to check RNA purity and yield.)

4.6. Next generation sequencing

cDNA libraries were prepared for the RNA samples by using Illumina® TruSeq® RNA sample preparation kit v2 as per manufacturer protocol, and they were sequenced through the Hi-seq-2000 platform. The obtained raw data were deposited in Gene Expression omnibus (need to be submitted) and the data were analyzed using the UEA sRNA workbench as described previously [21]. In brief, the Adapter used during the library was removed using adapter remover (Helper tools) from raw short read sequence data and converted to FASTA format. miRcat and miRprof two pipelines were used to predict mature miRNA and their expression levels.

4.7. Differential expression analysis

For the investigation of differential expression of miRNAs, the DESeq package (v1.28.0) was used, which produced an.xlsx file with the RPKM (Reads per kilobase of transcript per million mapped reads) value for each miRNA. For differential expression analysis, this software employs the negative binomial distribution [22]. For subsequent investigation, the differentially expressed miRNA having a p-value less than 0.05 was utilized.

4.8. Identification of known and novel microRNAs

The novel, as well as known miRNAs, were identified using the miRcat2 software [23].

4.9. Validation by qRT-PCR

The expression levels of mature miRNA were detected using the SYBR green method. Both miRNA-specific primers for miR- 222, 1246, 130b, 582, 23 and universal primers were used. Primers that were used were listed in Table 4. The PCR was performed in a reaction system with 10 μL 2× miRcute miRNA Premix, 0.4 μL specific upstream primer, 0.4 μL universal primer, 1.6 μL and 2 μL cDNA. The reaction tubes were supplemented with RNase-Free ddH2O to a total volume of 20 μL. The reaction mixtures were incubated in a 96-well plate at 95 °C for 2 min, followed by 40 cycles of 94 °C for 20 s and 60 °C for 34 s. All reactions were run in triplicate. Fold changes were determined by the threshold cycle (Ct).

4.10. Target genes and pathway prediction

miRsystem, online software and miRNA database (miRDB), an online database system was employed for the prediction of target genes and functional annotation of expressed miRNAs against human and bovine genomes. The predicted genes were used for the gene ontology and pathways analysis using DAVID (v6.8) [24]. miRNet software (v2.0) [25] was used for the network construction. Network analysis is done by miRNet 2.0.

4.11. Statistical analysis

Statistical analysis was performed using GraphPad Prism 9.3.1 software. Paired T test was used for the levels of the selected miRNAs in blood samples between estrus and diestrus stages while validating the results of Next generation sequencing. The selected miRNA was already found to be specifically higher at one stage of the estrous cycle based on NGS data in the present study.

5. Conclusions

To conclude, the current study found a substantial difference between the estrus and diestrus stages of the estrus cycle. The number of miRNA was differentially present during estrus and diestrus. Above all, miR-497 has a considerable enrichment as well as a higher degree of centrality, which means it is targeting a larger number of genes. It implies an in-depth study on miR-497 can unravel its complexity and understands events on the day of estrus. This will solve many unanswered questions in buffalo estrous cycle. However, to develop a more sensitive heat detection biomarker in buffaloes, this existing difference between mi RNAs needs to be validated to a greater extent at the field level.

Supplementary Materials

The following supporting information can be downloaded at the website of this paper posted on Preprints.org.

Author Contributions

Conceptualization, Naveen Swaroop, Varij Nayan; Study design, Naveen Swaroop, Chhama Singh, Pushpanjali singh, Naresh Selokar, Navneet Saxena, T.K Dutta, Varij Nayan, Rakesh Kumar, Prasanth , Dharmender Kumar R.K Sharma,; methodology, Naveen Swaroop; formal analysis, Naveen Swaroop.; investigation, Naveen Swaroop, Pushpanjali Singh, Chhama singh, Anuradha Bharadwaj, Naresh Selokar, Sunil Yadav, Rakshita Singh, R.K Sharma; writing—original draft preparation, Naveen Swaroop.; writing—review and editing, Naveen Swaroop. All authors have read and agreed to the published version of the manuscript.

Data Availability Statement

All data obtained from this study are already contained in the manuscript. There is no additional dataset generated.

Acknowledgments

Authors are grateful to Bill & Melinda Gates foundation for financial support and also ICAR-Central Institute for research on Buffaloes, Hisar, Haryana, India, ICAR- NDRI for allowing to conduct research at CIRB and finally Sri Venkateshwara Veterinary University, Tirupati, Andhra Pradesh for providing pay and allowances during the study period.

References

  1. Holman, A., J. Thompson, J. E. Routly, J. Cameron, D. N. Jones, D. Grove-White, R. F. Smith, and H. Dobson. Comparison of oestrus detection methods in dairy cattle. Veterinary Record. 2011, 169, 47-47. [CrossRef]
  2. Fricke PM, Carvalho PD, Giordano JO, Valenza A, Lopes G, Amundson MC. Expression and detection of estrus in dairy cows: the role of new technologies. Animal. 2014, 8, 134-43. [CrossRef]
  3. Ioannidis J, Donadeu FX. Circulating microRNA profiles during the bovine oestrous cycle. PloS one. 2016, 24, e0158160.
  4. Hussain MU. Micro-RNAs (miRNAs): genomic organisation, biogenesis and mode of action. Cell and tissue research. 2012, 349, 405-13. [CrossRef]
  5. Weber JA, Baxter DH, Zhang S, Huang DY, How Huang K, Jen Lee M, Galas DJ, Wang K. The microRNA spectrum in 12 body fluids. Clinical chemistry. 2010, 56, 1733-41. [CrossRef]
  6. Al-Muhtaresh HA, Al-Kafaji G. Evaluation of two-diabetes related microRNAs suitability as earlier blood biomarkers for detecting prediabetes and type 2 diabetes mellitus. Journal of clinical medicine. 2018, 26, 12. [CrossRef]
  7. Anfossi S, Babayan A, Pantel K, Calin GA. Clinical utility of circulating non-coding RNAs—an update. Nature reviews Clinical oncology. 2018, 15, 541-63. [CrossRef]
  8. Mondal S, Prakash BS, Palta P. Endocrine aspects of oestrous cycle in buffaloes (Bubalus bubalis): an overview. Asian-australasian journal of animal sciences. 2006, 27, 124-31. [CrossRef]
  9. Li J, Han X, Wan Y, Zhang S, Zhao Y, Fan R, Cui Q, Zhou Y. TAM 2.0: tool for MicroRNA set analysis. Nucleic acids research. 2018, 46, W180-5. [CrossRef]
  10. Licursi V, Conte F, Fiscon G, Paci P. MIENTURNET: an interactive web tool for microRNA-target enrichment and network-based analysis. BMC bioinformatics. 2019, 20, 1-0.
  11. Singh P, Golla N, Singh P, Baddela VS, Chand S, Baithalu RK, Singh D, Onteru SK. Salivary miR-16, miR-191 and miR-223: intuitive indicators of dominant ovarian follicles in buffaloes. Molecular Genetics and Genomics. 2017, 292:935-53. [CrossRef]
  12. Surla GN, Kumar LK, Vedamurthy VG, Singh D, Onteru SK. Salivary TIMP1 and predicted mir-141, possible transcript biomarkers for estrus in the buffalo (Bubalus bubalis). Reproductive Biology. 2022, 22, 100641. [CrossRef]
  13. Hebbar A, Chandel R, Rani P, Onteru SK, Singh D. Urinary cell-free miR-99a-5p as a potential biomarker for estrus detection in buffalo. Frontiers in Veterinary Science. 2021, 17, 643910. [CrossRef]
  14. Lu TP, Lee CY, Tsai MH, Chiu YC, Hsiao CK, Lai LC, Chuang EY. miRSystem: an integrated system for characterizing enriched functions and pathways of microRNA targets. 2012, e42390. [CrossRef]
  15. Dissen GA, Lara HE, Leyton V, Paredes A, Hill DF, Costa ME, Martinez-Serrano A, Ojeda SR. Intraovarian excess of nerve growth factor increases androgen secretion and disrupts estrous cyclicity in the rat. Endocrinology. 2000, 141, 1073-82. [CrossRef]
  16. Zavareh S, Gholizadeh Z, Lashkarbolouki T. Evaluation of changes in the expression of Wnt/β-catenin target genes in mouse reproductive tissues during estrous cycle: An experimental study. International Journal of Reproductive BioMedicine. 2018, 16, 69. [CrossRef]
  17. Kaczmarek MM, Krawczynski K, Najmula J, Reliszko ZP, Sikora M, Gajewski Z. Differential expression of genes linked to the leukemia inhibitor factor signaling pathway during the estrus cycle and early pregnancy in the porcine endometrium. Reproductive Biology. 2014, 14, 293-7. [CrossRef]
  18. Salilew-Wondim D, Ahmad I, Gebremedhn S, Sahadevan S, Hossain MM, Rings F, Hoelker M, Tholen E, Neuhoff C, Looft C, Schellander K. The expression pattern of microRNAs in granulosa cells of subordinate and dominant follicles during the early luteal phase of the bovine estrous cycle. PloS one. 2014, 9, e106795. [CrossRef]
  19. Garg D, Ng SS, Baig KM, Driggers P, Segars J. Progesterone-mediated non-classical signaling. Trends in Endocrinology & Metabolism. 2017, 28, 656-68. [CrossRef]
  20. Migliaccio A, Piccolo D, Castoria G, Di Domenico M, Bilancio A, Lombardi M, Gong W, Beato M, Auricchio F. Activation of the Src/p21ras/Erk pathway by progesterone receptor via cross-talk with estrogen receptor. The EMBO journal. 1998, 17, 2008-18. [CrossRef]
  21. Stocks MB, Moxon S, Mapleson D, Woolfenden HC, Mohorianu I, Folkes L, Schwach F, Dalmay T, Moulton V. The UEA sRNA workbench: a suite of tools for analysing and visualizing next generation sequencing microRNA and small RNA datasets. Bioinformatics. 2012, 28, 2059-61. [CrossRef]
  22. Anders S, Huber W. Differential expression analysis for sequence count data. Genome Biol. 2010, 11:R106.
  23. Paicu C, Mohorianu I, Stocks M, Xu P, Coince A, Billmeier M, Dalmay T, Moulton V, Moxon S. miRCat2: accurate prediction of plant and animal microRNAs from next-generation sequencing datasets. Bioinformatics. 2017, 33, 2446-54. [CrossRef]
  24. Huang DW, Sherman BT, Lempicki RA. Systematic and integrative analysis of large gene lists using DAVID bioinformatics resources. Nature protocols. 2009, 4, 44-57. [CrossRef]
  25. Chang L, Xia J. MicroRNA Regulatory Network Analysis Using miRNet 2.0. Transcription Factor Regulatory Networks. 2022, 21, 185-204.
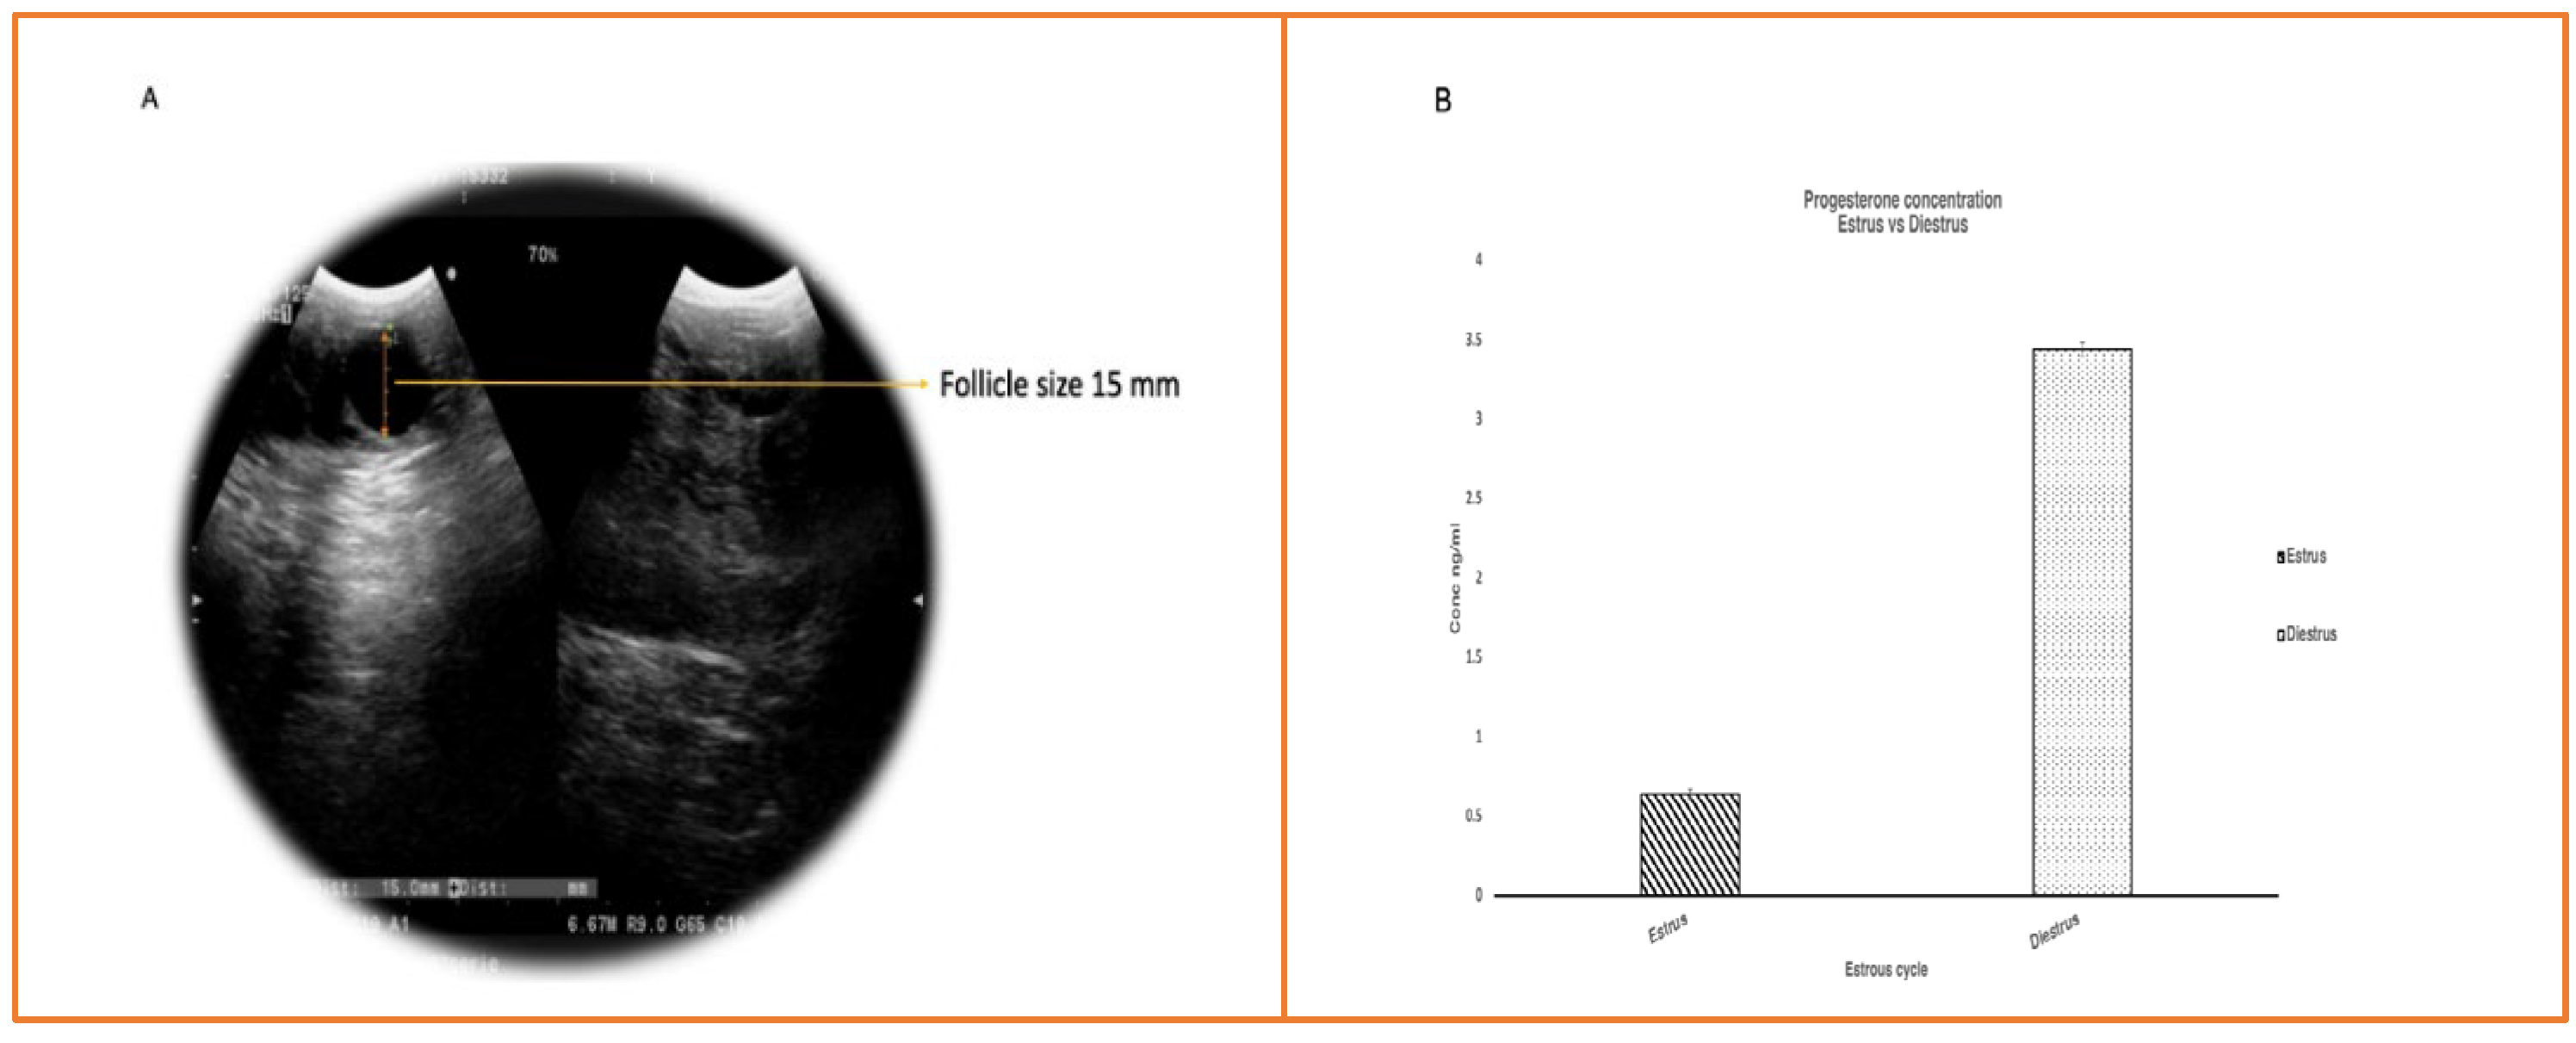
Figure 2. (A) Ultrasonography picture showing 15mm follicle confirming animal is in estrus; (B) Progesterone assay Bar graph showing progesterone levels during estrus and diestrus with mean ± SEM of 0.4ng±0.02 ng/ml and 3.6±0.6 ng/ml respectively.
Preprints 75688 g002
Figure 3. (A,B) Bioanlyzer picture depicting quality of RNA First peak indicates florescent Marker, second peak indicates 18sRNA, third peak indicates 28s RNA; (C) Graph showing alignment rate of reads with Bos taurus reference genome in estrus group (Mean±SEM,77±1.21) and diestrus group (77.59 ± 2.04).
Preprints 75688 g003
Figure 4. Bar chart showing significantly upregulated and downregulated miRNA at different P values and log2 fold change, X axis represent significant at P<0.05, upregulated log2 fold > 0 and log 2 foldchange < 0.
Preprints 75688 g004
Figure 5. (A) MA plot showing miRNA that are differentially expressed between Estrus and Diestrus. In the above plot significantly differentially expressed known miRNAs are represented by red dots. Higher number of data points falling above the one threshold on the y-axis indicate a more significant number of genes being upregulated, while below -1 indicate downregulation; (B) Volcano plot showing miRNA compared between Estrus and Diestrus. Significantly differently upregulated are present away from origin towards positive values and downregulated are represented in red towards negative values from 0.
Preprints 75688 g005
Figure 6. Heat map showing top ten significantly differentially expressed miRNA. Legend in red indicates its up regulated in diestrus and blue indicates it is upregulated during estrus.
Preprints 75688 g006
Figure 7. Violin plots: shows miRNA Read count expression level during estrus and diestrus; Red colour violin plots indicate diestrus and blue colour indicated estrus.
Preprints 75688 g007
Figure 8. RT pcr Validation: shows miRNA bta-miR-1246 and bta-miR-131b are significantly present in diestrus than in estrus. These results corroborate the results of NGS data.
Preprints 75688 g008
Figure 11. MIENTURNET software analysis showing degree of centrality; miR-497-5p at the center is targeting more number of genes compared to miR-93.
Preprints 75688 g011
Figure 12. miRNet 2.0 Network analysis: showing miRNA regulating different genes in different pathways. Highlighted genes are represented as triangles, different colours yellow–p53 signalling, green – Insulin signalling, pink-oocyte meiosis signalling, red- progesterone signalling pathway, blue- wnt signalling pathway.
Preprints 75688 g012
Table 1. RNA integrity and concentration of different blood samples.
ID Concentration ng/ul RIN
1 5195- Estrus 137 7.4
2 5195-Diestrus 128 7.1
3 5248-Estrus 165 6.8
4 5248-Diestrus 135 6.8
5 5069-Estrus 257 6.8
6 5069-Diestrus 194 7.0
7 5380-Estrus 219 7.2
8 5380-Diestrus 180 6.9
9 5332-Estrus 140 7.1
10 5332-Diestrus 115 7
Table 2. Basic statistics of quality control of Reads.
Groups Samples No. of Reads Read Length Bases GC% Read Alignment (%)
Estrus R5068_1 26755063 50 1337753150 48 74.98
R5195_1 23952660 50 1197633000 49 76.44
R5248_1 24501790 50 1225089500 48 81.81
R5332_1 48454450 50 2422722500 46 77.54
R5380_1 22492112 50 1124605700 59 80.9
Diestrus R5068_2 22661330 50 1133066500 47 76.82
R5195_2 24500720 50 1225036000 47 76.27
R5248_2 20872662 50 1043633100 48 75.17
R5332_2 24160605 50 1208030250 47 86.52
R5380_2 23551522 50 1177576100 47 77.59
Table 4. List of miRNA and primer sequence.
miRNA FORWARD PRIMER SEQUENCE
5SRNA GCCCGATCTCGTCTGATCT
miR122 CGCGTGGAGTGTGACAATGG
miR1246 GAATGGATTTTTGGAGCAGGAA
miR130b AGCAGGCAGTGCAATGATGA
miR23 ATCACATTGCCAGGGATTTCCA
miR582 TTACAGTTGTTCAACCAGTTACT
U6 CTCGCTTCGGCAGCACA
Universal reverse primer ATGGCGGTAAGTCCAGATACG
Disclaimer/Publisher’s Note: The statements, opinions and data contained in all publications are solely those of the individual author(s) and contributor(s) and not of MDPI and/or the editor(s). MDPI and/or the editor(s) disclaim responsibility for any injury to people or property resulting from any ideas, methods, instructions or products referred to in the content.
Copyright: This open access article is published under a Creative Commons CC BY 4.0 license, which permit the free download, distribution, and reuse, provided that the author and preprint are cited in any reuse.
Prerpints.org logo

Preprints.org is a free preprint server supported by MDPI in Basel, Switzerland.

Subscribe

© 2024 MDPI (Basel, Switzerland) unless otherwise stated