1. Introduction
Arabic coffee in the Arab world is considered an important part of Arab culture and tradition, particularly, in Saudi Arabia, and surrounding Arab countries, where it is said to be the most popular hot beverage [
1]. Arabica coffee beans are the primary ingredient [
2]. An estimated 1.4 billion cups of coffee are consumed daily throughout the world. Consumption of coffee has significantly grown in Saudi Arabia, where 18,000 tons of coffee are imported each year at a cost of
$54 million [
3]. According to recent estimates, the typical Saudi adult consumes between 60 and 300 mL of Arabic coffee in a single sitting, amounting to 1.6 kg of coffee per person yearly [
2].
Coffee drinking has certain beneficial effects on human health as a result of its biochemical features [
4,
5], especially non-communicable diseases [
6]. There is proof that drinking coffee can improve several functions, such as memory, mood, and cognitive performance [
7,
8,
9].
On the other side, coffee can raise LDL-C and the body’s total cholesterol, which can increase the risk of cardiovascular disease [
10,
11]. Additionally, drinking Arabic coffee was linked to a significant osteoporosis increase in Saudi females over the age of 40 [
12]. Regardless of whether drinking coffee is harmful or beneficial, it is apparent that there are many people who do so worldwide, especially in Saudi Arabia when it comes to Arabic coffee.
Arabic coffee comes in several types with varying levels of roasting. The roasting temperature and roasting time affect the degree of roasting, and these two factors determine whether the coffee is a light, medium, or dark roast in terms of color [
13]. The biological activity and chemical composition of the coffee can be altered significantly during the roasting process. According to Wang et al. [
14], certain components, such as natural phenolic compounds, can be lost while other elements, such as antioxidants, including Maillard reaction products, can be generated. As a result, antioxidants can be either preserved or enhanced.
Hence, it is crucial to be able to categorize coffee into one of its three common roasting degrees (light, medium, or dark) for human consumption since each has a different effect on health. For instance, Alamri et al. [
3] recommended medium Arabic coffee as having a high concentration of chemicals with antioxidants and other biologically advantageous effects.
The interesting research of Alamri et al. [
3] examined the chemical composition of typically roasted Arabic coffee at three distinct roasting levels: light, medium, and dark. To analyze various facets of coffee, the researchers used a variety of methodologies. They measured the amount of caffeine using a UV-visible spectrophotometer, the amount of acrylamide using a gas chromatograph, and the amount of free radical scavenging power using the 1,1-Diphenyl-2-picryl-hydrazy (DPPH) technique. They also used Gas Chromatography-Mass Spectrometry (GC-MS) to separate and distinguish the volatile components contained in the coffee samples, and they estimated the browning index. A temperature of
was held for around
minutes for the light roast,
minutes for the medium roast, and
minutes for the dark roast. Their laboratory experiments were conducted on nine Arabic coffee samples, three for each type. According to their findings, roasting Arabic coffee alters its chemical compositions such as moisture content, ether extract, crude protein, crude fiber, ash content, nitrogen-free extract (NFE), caffeine content, acrylamide levels, and DPPH activity, and
Table 1 and
Table 2 demonstrate that each roasting degree has unique chemical component value. in addition, they provided distinctive color information for each coffee type using the L*a*b* color system and browning index as shown in
Table 3.
There are several studies in the literature designed to classify Arabic coffee and coffee, in general, using various sources of information and technologies, including coffee beans images [
15,
16,
17,
18], Infrared spectroscopy [
19,
20,
21,
22,
23], and electronic nose [
24,
25,
26]. To the best of our knowledge, none of them, however, addressed the chemical classification of Arabic coffee.
The aim of this paper is to address the classification of Arabic coffee using its chemical compounds. For this purpose we utilize the data obtained by [
3] (shown in
Table 1,
Table 2 and
Table 3), to generate new samples for each type of Arabic coffee using the Monte Carlo method because we only have one mean value for each feature ± its standard deviation. Then, using the simulated data, we employ a variety of machine-learning approaches to classify Arabic coffee; feature importance is also explored in this study to determine which chemical components have the most influence on the classification process. It is worth noting that obtaining significant samples of real data for each chemical test involves laboratory testing, which comes at a very high cost that we cannot afford at present.
4. Results
The chemical tests conducted in the laboratory for the three types of coffee by [
3] can be classified into three categories of information as follows:
Arabic Coffee color information: This category includes measurements such as the Browning index, which is determined using a UV-Vis spectrophotometer at a wavelength of 420 nm, in addition, it includes color information based on the International Commission of Illumination (CIE) color system, which involves the L*, a*, and b* channels.
Arabic Coffee Antioxidant information: This category comprises the caffeine percentage, acrylamide concentration (measured in mg per 100g), and DPPH.
Arabic Coffee chemical compositions: This category includes the percentage of moisture content, percentage of ether extract, percentage of crude protein, percentage of crude fiber, percentage of ash content, and percentage of NFE.
A series of experiments focusing on the aforementioned types of information were carried out to evaluate the proposed Arabic coffee classification system based on its chemical properties. It’s worth noting that all of the tests used machine learning methods, and a 10-fold cross-validation approach was applied with each method’s default parameters. This approach ensures that the evaluation was consistent and unbiased across all experiments.
Table 5 shows the classification results of Arabic coffee based on its color information: L*, a*, and b*. We did not add the browning index to this information category because it can be assessed from the L*, a*, and b* channels according to [
50].
According to the data presented in Table , it is evident that the color information alone was sufficient to achieve perfect classification of Arabic coffee into its three types: light, medium, and dark. This observation can be attributed to the fact that the CIE colors of these three classes are easily differentiated. Furthermore,
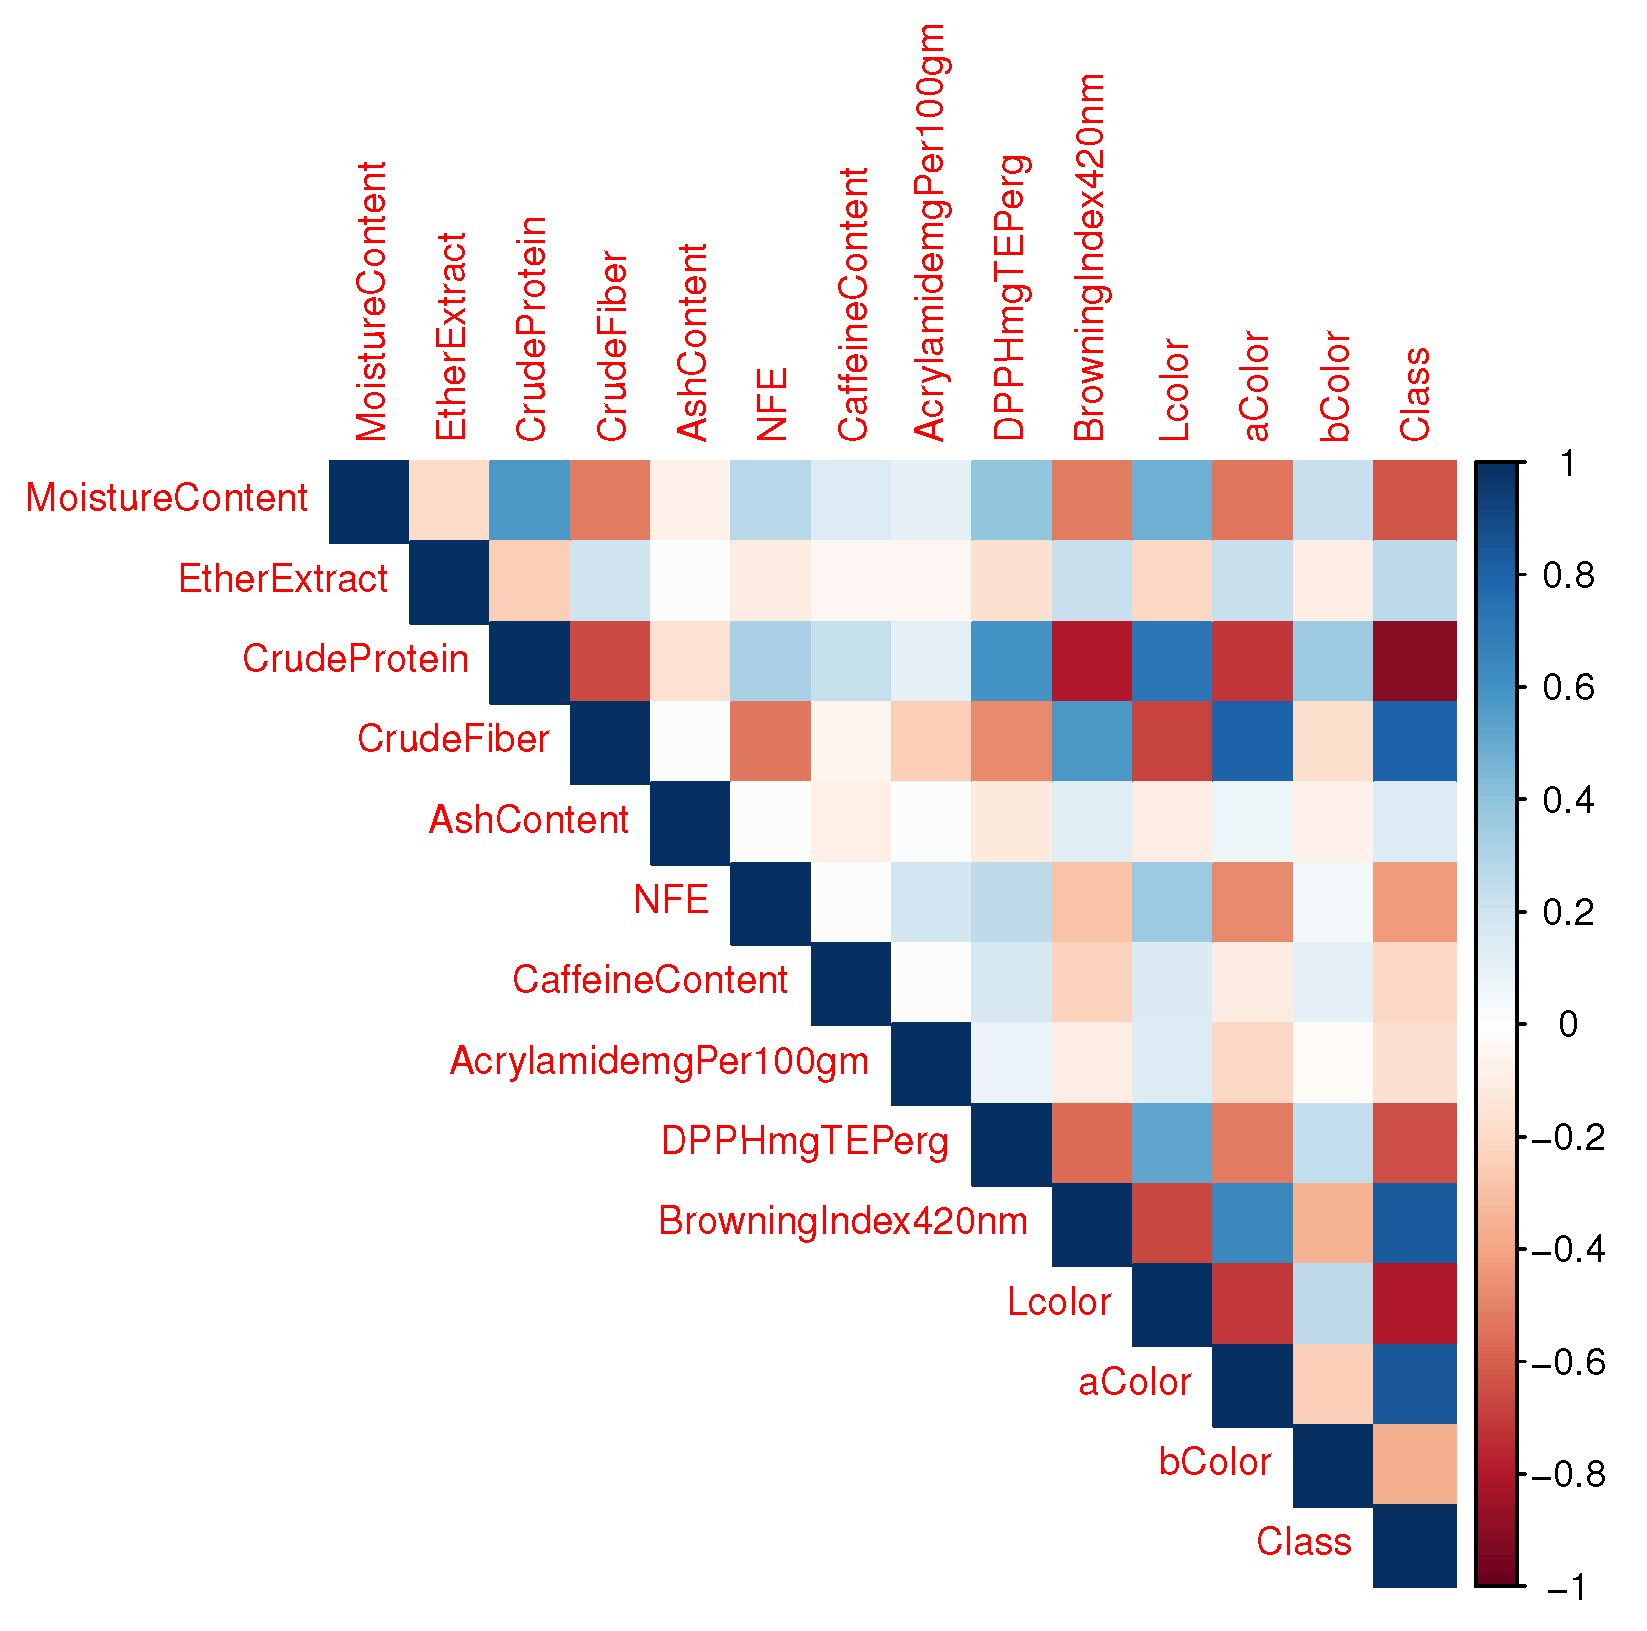
Figure 2 depicts the high correlation between color information and coffee classes, underlining the association between color and coffee classification. Additionally,
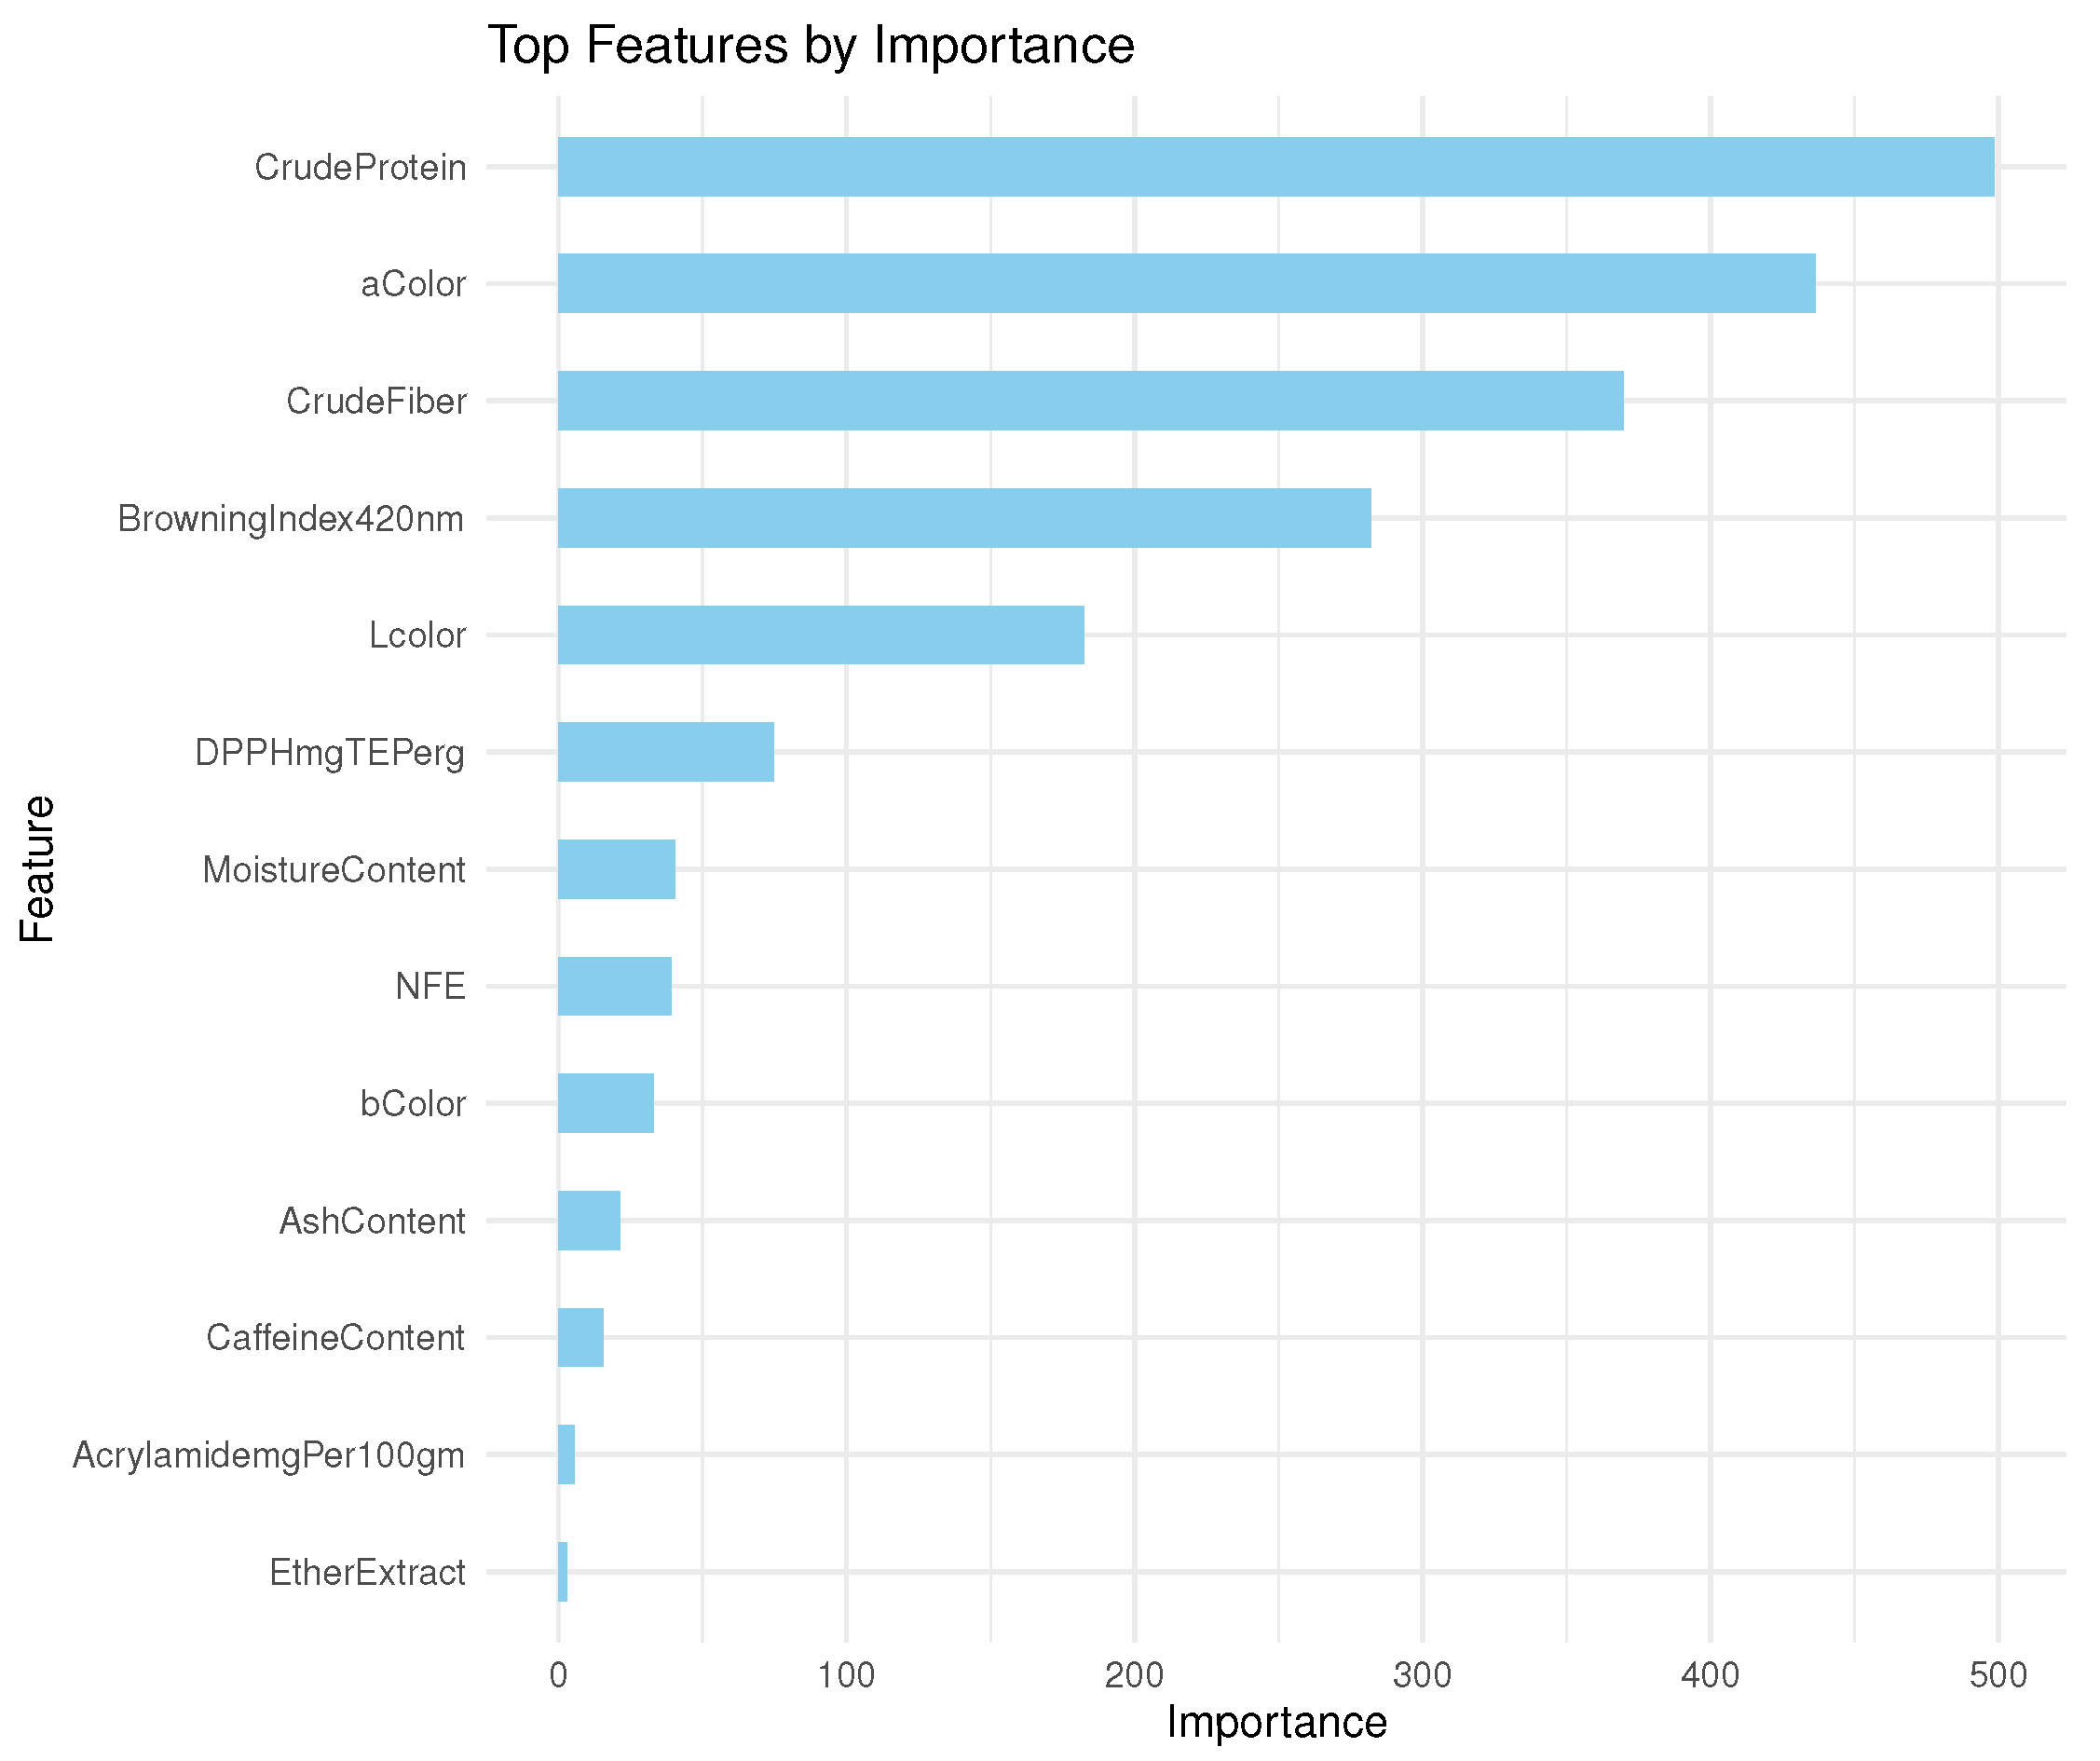
Figure 3 demonstrates the significant value of color information in discriminating across coffee types.
Table 6 presents the classification results of Arabic coffee based on its antioxidant information: caffeine percentage, acrylamide concentration, and DPPH.
Results presented in
Table 6 show that when both the color and chemical composition information were eliminated; leaving only the Antioxidant information, the classification results significantly decreased. The performance of the classifiers varied, with the best performer being NB, followed by RF. This means that depending exclusively on antioxidant information is insufficient for accurate Arabic coffee classification. The correlation analysis illustrated in
Figure 2 and
Figure 3 supports this observation. The correlation values and importance rankings show that variables like caffeine percentage and acrylamide concentration are less important in the classification process and have weaker correlations with the dependent variable (coffee class).
A closer look at
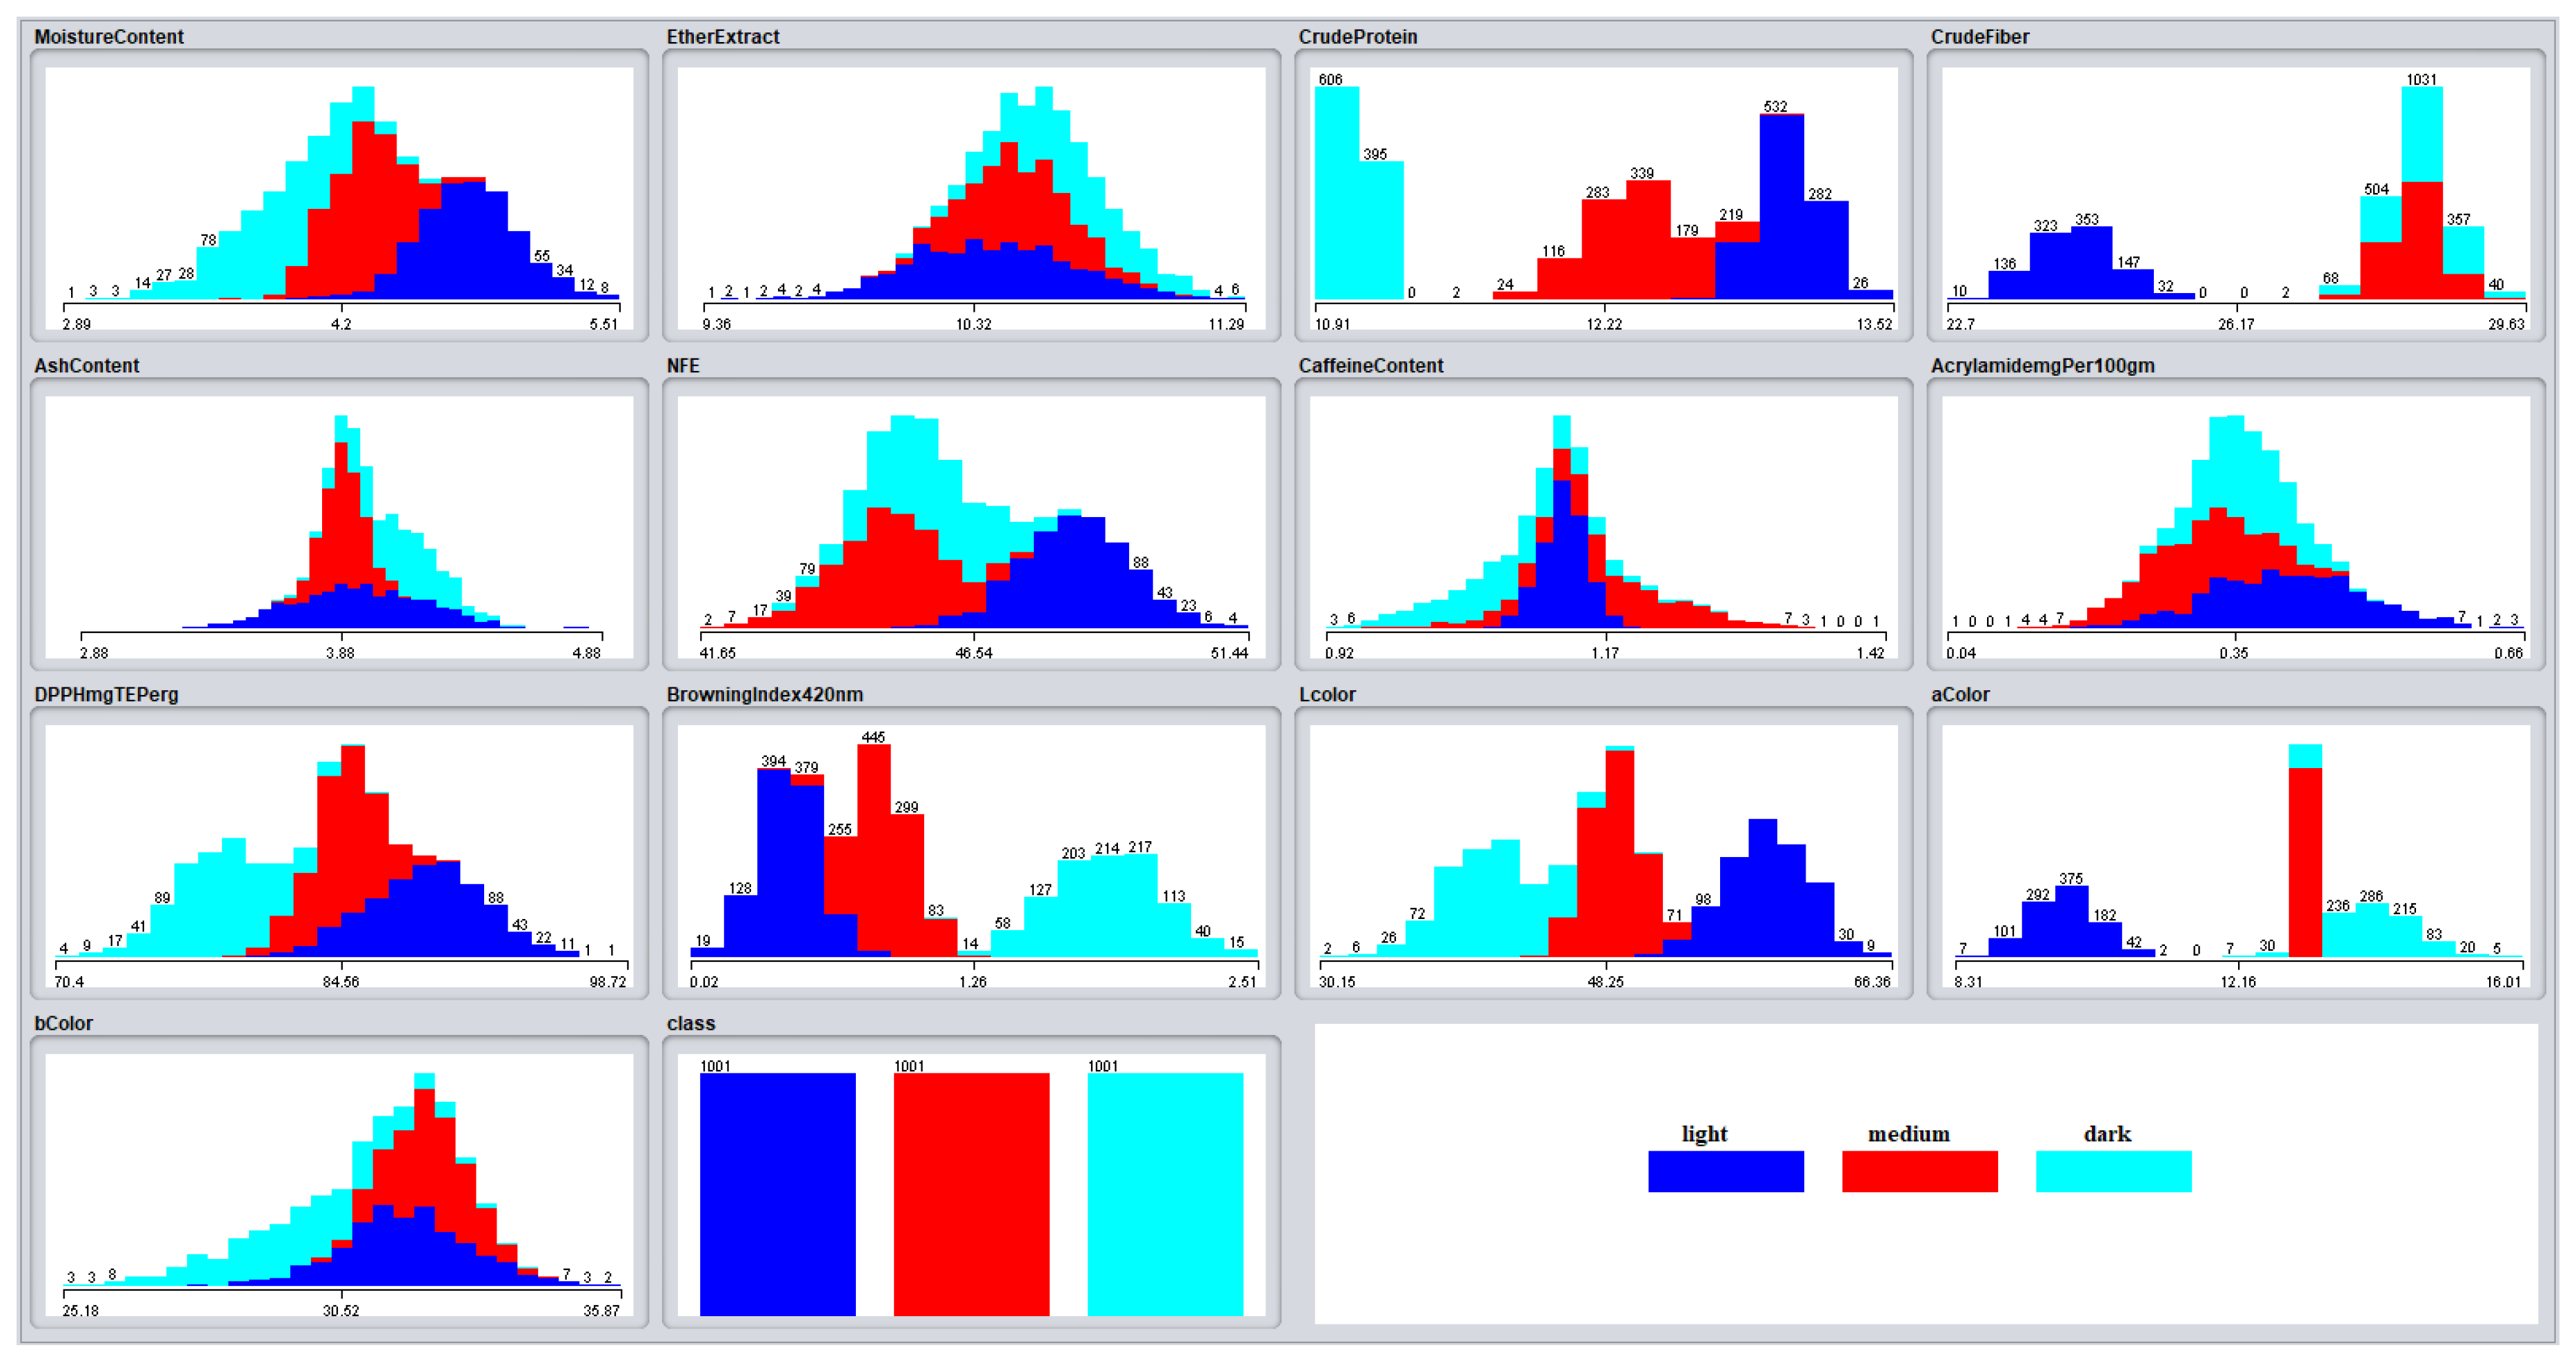
Figure 1 reveals that some of the curves depicting these features for the three types of Arabic coffee have significant overlap. This overlap implies that the values of these features for various types of coffee are not unique enough to create obvious borders or distinctions between the classes. As a result, depending entirely on Antioxidant features for classification would almost certainly result in misclassifications or poorer classification accuracy. The observed difficulties in effectively identifying Arabic coffee based on antioxidant information can be attributable mostly to the near proximity of these variables’ actual values. As shown in
Table 1, the caffeine percentages of light, medium, and dark coffee were reported as 1.13±0.02, 1.17±0.07, and 1.08±0.06, respectively.
Table 7 presents the classification results of Arabic coffee based on its chemical compositions information: Moisture content %, Ether extract %, Crude protein %, Crude fiber %, Ash content %, and NFE) %.
According to the data in
Table 7, all classifiers’ classification results are either perfect, with the exception of J48, which earned a classification accuracy of 0.999. However, this classifier achieved perfect training accuracy by obtaining the following rules:
if CrudeProtein <= 11.283023 then class= 3 (1001 out of 1001 examples).
if CrudeProtein > 11.283023 and CrudeFiber <= 25.642686 then class= 1 (1001 out of 1001 examples).
if CrudeProtein > 11.283023 and CrudeFiber > 25.642686 then class= 2 (1001 out of 1001 examples).
This level of agreement and excellent accuracy across classifier families shows that the training data utilized in the studies was distinct and well-separated. Based on these outcomes, it is clear that chemical composition data alone was sufficient to achieve faultless classification of Arabic coffee into three types: light, medium, and dark. This great precision is most likely due to the distinctive characteristics of the chemical composition information for these classes.
Figure 2 also shows a substantial link between chemical composition information and coffee classes. The percentages of crude protein and crude fiber, in particular, have strong correlation values of -0.91 and 0.80, respectively. This demonstrates the connection and discriminatory power of these variables in classifying coffee types.
Furthermore,
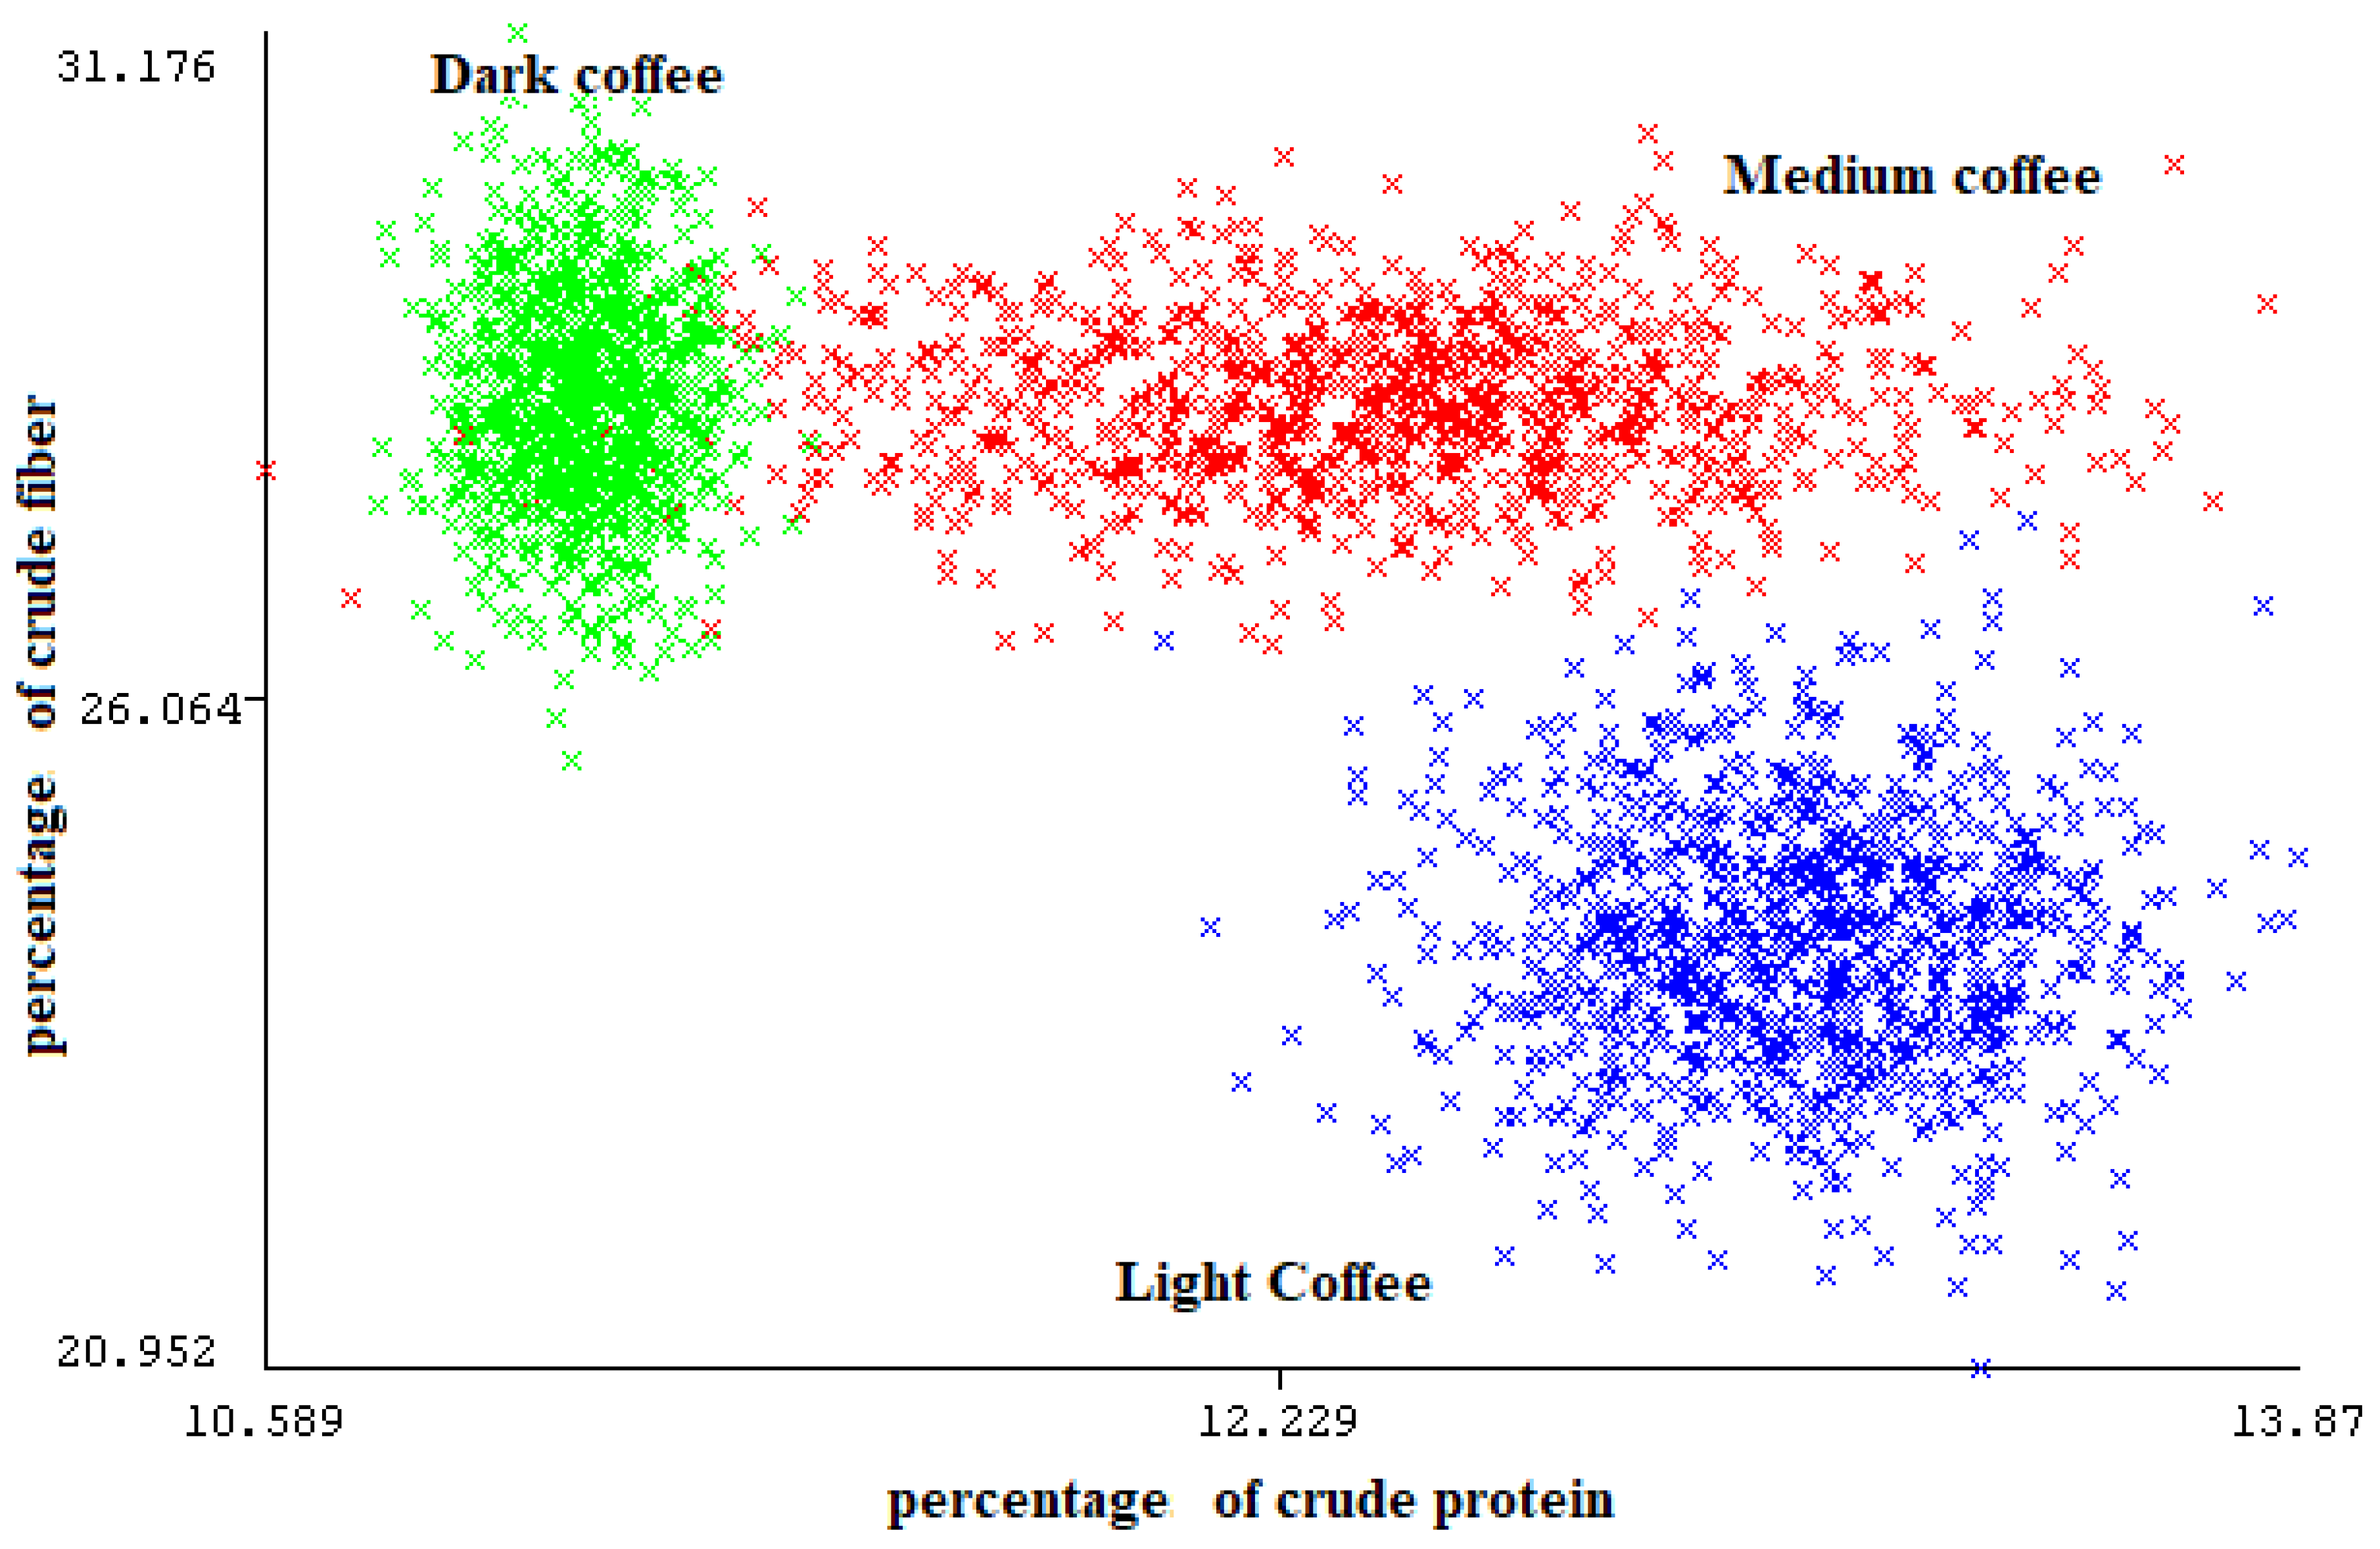
Figure 3 shows that when compared to other features, the percentage of crude protein ranks first and the percentage of crude fiber is ranked third. This highlights the importance and discriminative capacity of this type of information in the classification of coffee types, particularly, crude protein and crude fiber, which are extremely separable as shown in
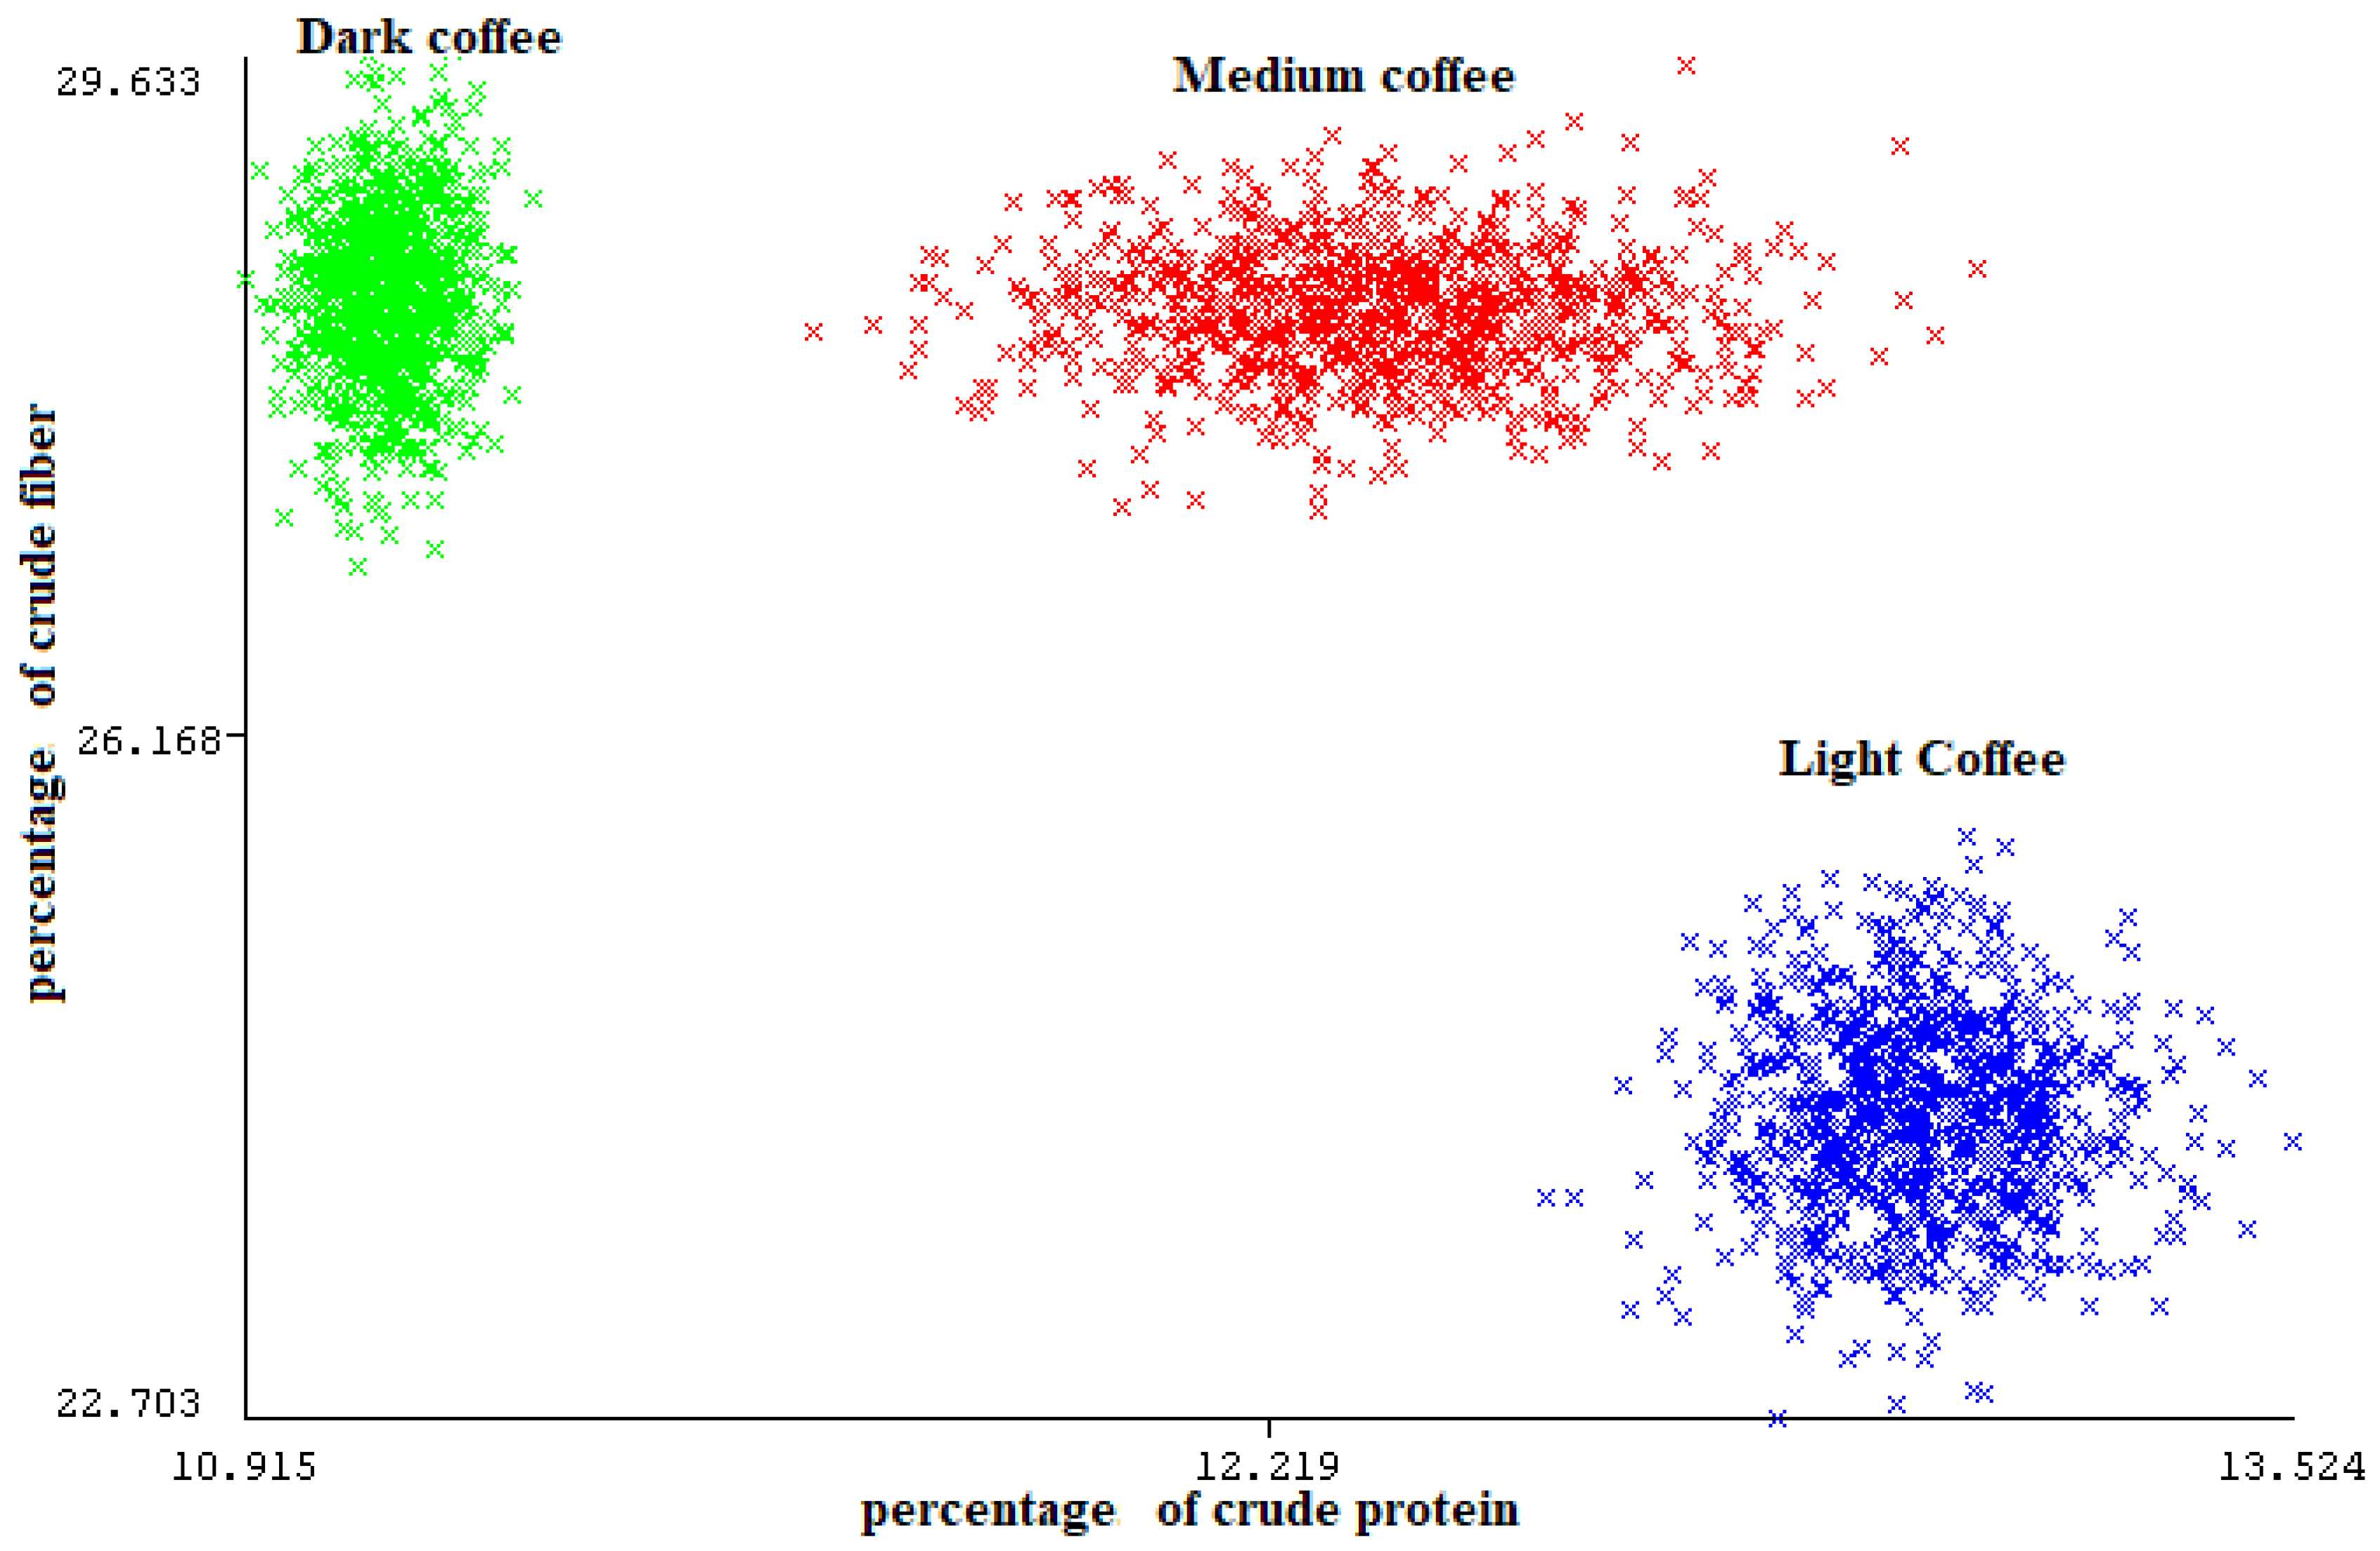
Figure 4 and can achieve perfect classification alone even without the need for the other variables.
Based on the preceding results, it is evident that the simulated data used for classification was clean and well-suited for various types of classifiers, owing to the features’ strong discriminatory power. This was especially true for the categories of color information and chemical composition information.
The standard deviation of the normal distribution for each feature was doubled (2STD) to bring more unpredictability and variability into the simulated data, resulting in a dataset with higher dispersion. By providing more variability in the feature values, this modification attempts to increase diversity and make the classification task more challenging. The classification results of the new 2STD simulated data are shown in
Table 8,
Table 9,
Table 10, and
Table 11.
According to the results obtained from the newly generated data with doubled standard deviation, the classification performance of Arabic coffee based on its 2STD simulated chemical composition information reduced by 1% to 3%. Similarly, depending on the classifier, the classification results based on its 2STD simulated color information are reduced by 2% to 5%. This decrease in performance might be due to the growing complexity of the data, which causes classifiers to differ in their performance. It is worth mentioning that clean data often yields superior classification accuracy regardless of the classifier used.
In the case of the 2STD simulated antioxidant information, The classification results showed a drop of 16% to 20%, depending on the classifier utilized. The KNN classifier, in particular, performed poorly in this scenario due to its reliance on similarity across samples for classification, which becomes less accurate when dealing with complicated data.
This drop in performance can be traced primarily to the nature of the original data shown in
Table 1. The antioxidant characteristics in the table demonstrate no significant difference between the three coffee classes (light, medium, and dark). As a result, increasing the standard deviation to generate the 2STD simulated data reduced the distinctiveness and separability of the antioxidant characteristics, resulting in an overall decrease in classification accuracy.
When analyzing the antioxidant classification results, it is critical to recognize these constraints as well as the impact of data characteristics. In such circumstances, additional characteristics or alternative methodologies may be necessary to improve classification performance.
The observed decline in classification performance, as well as the variation in performance among classifiers, emphasizes the need for classifier selection when dealing with complicated data.
Figure 5 (2STD simulated data) and
Figure 4 (1STD data) show how the data became increasingly complex and overlapping. This intricacy is illustrated further in
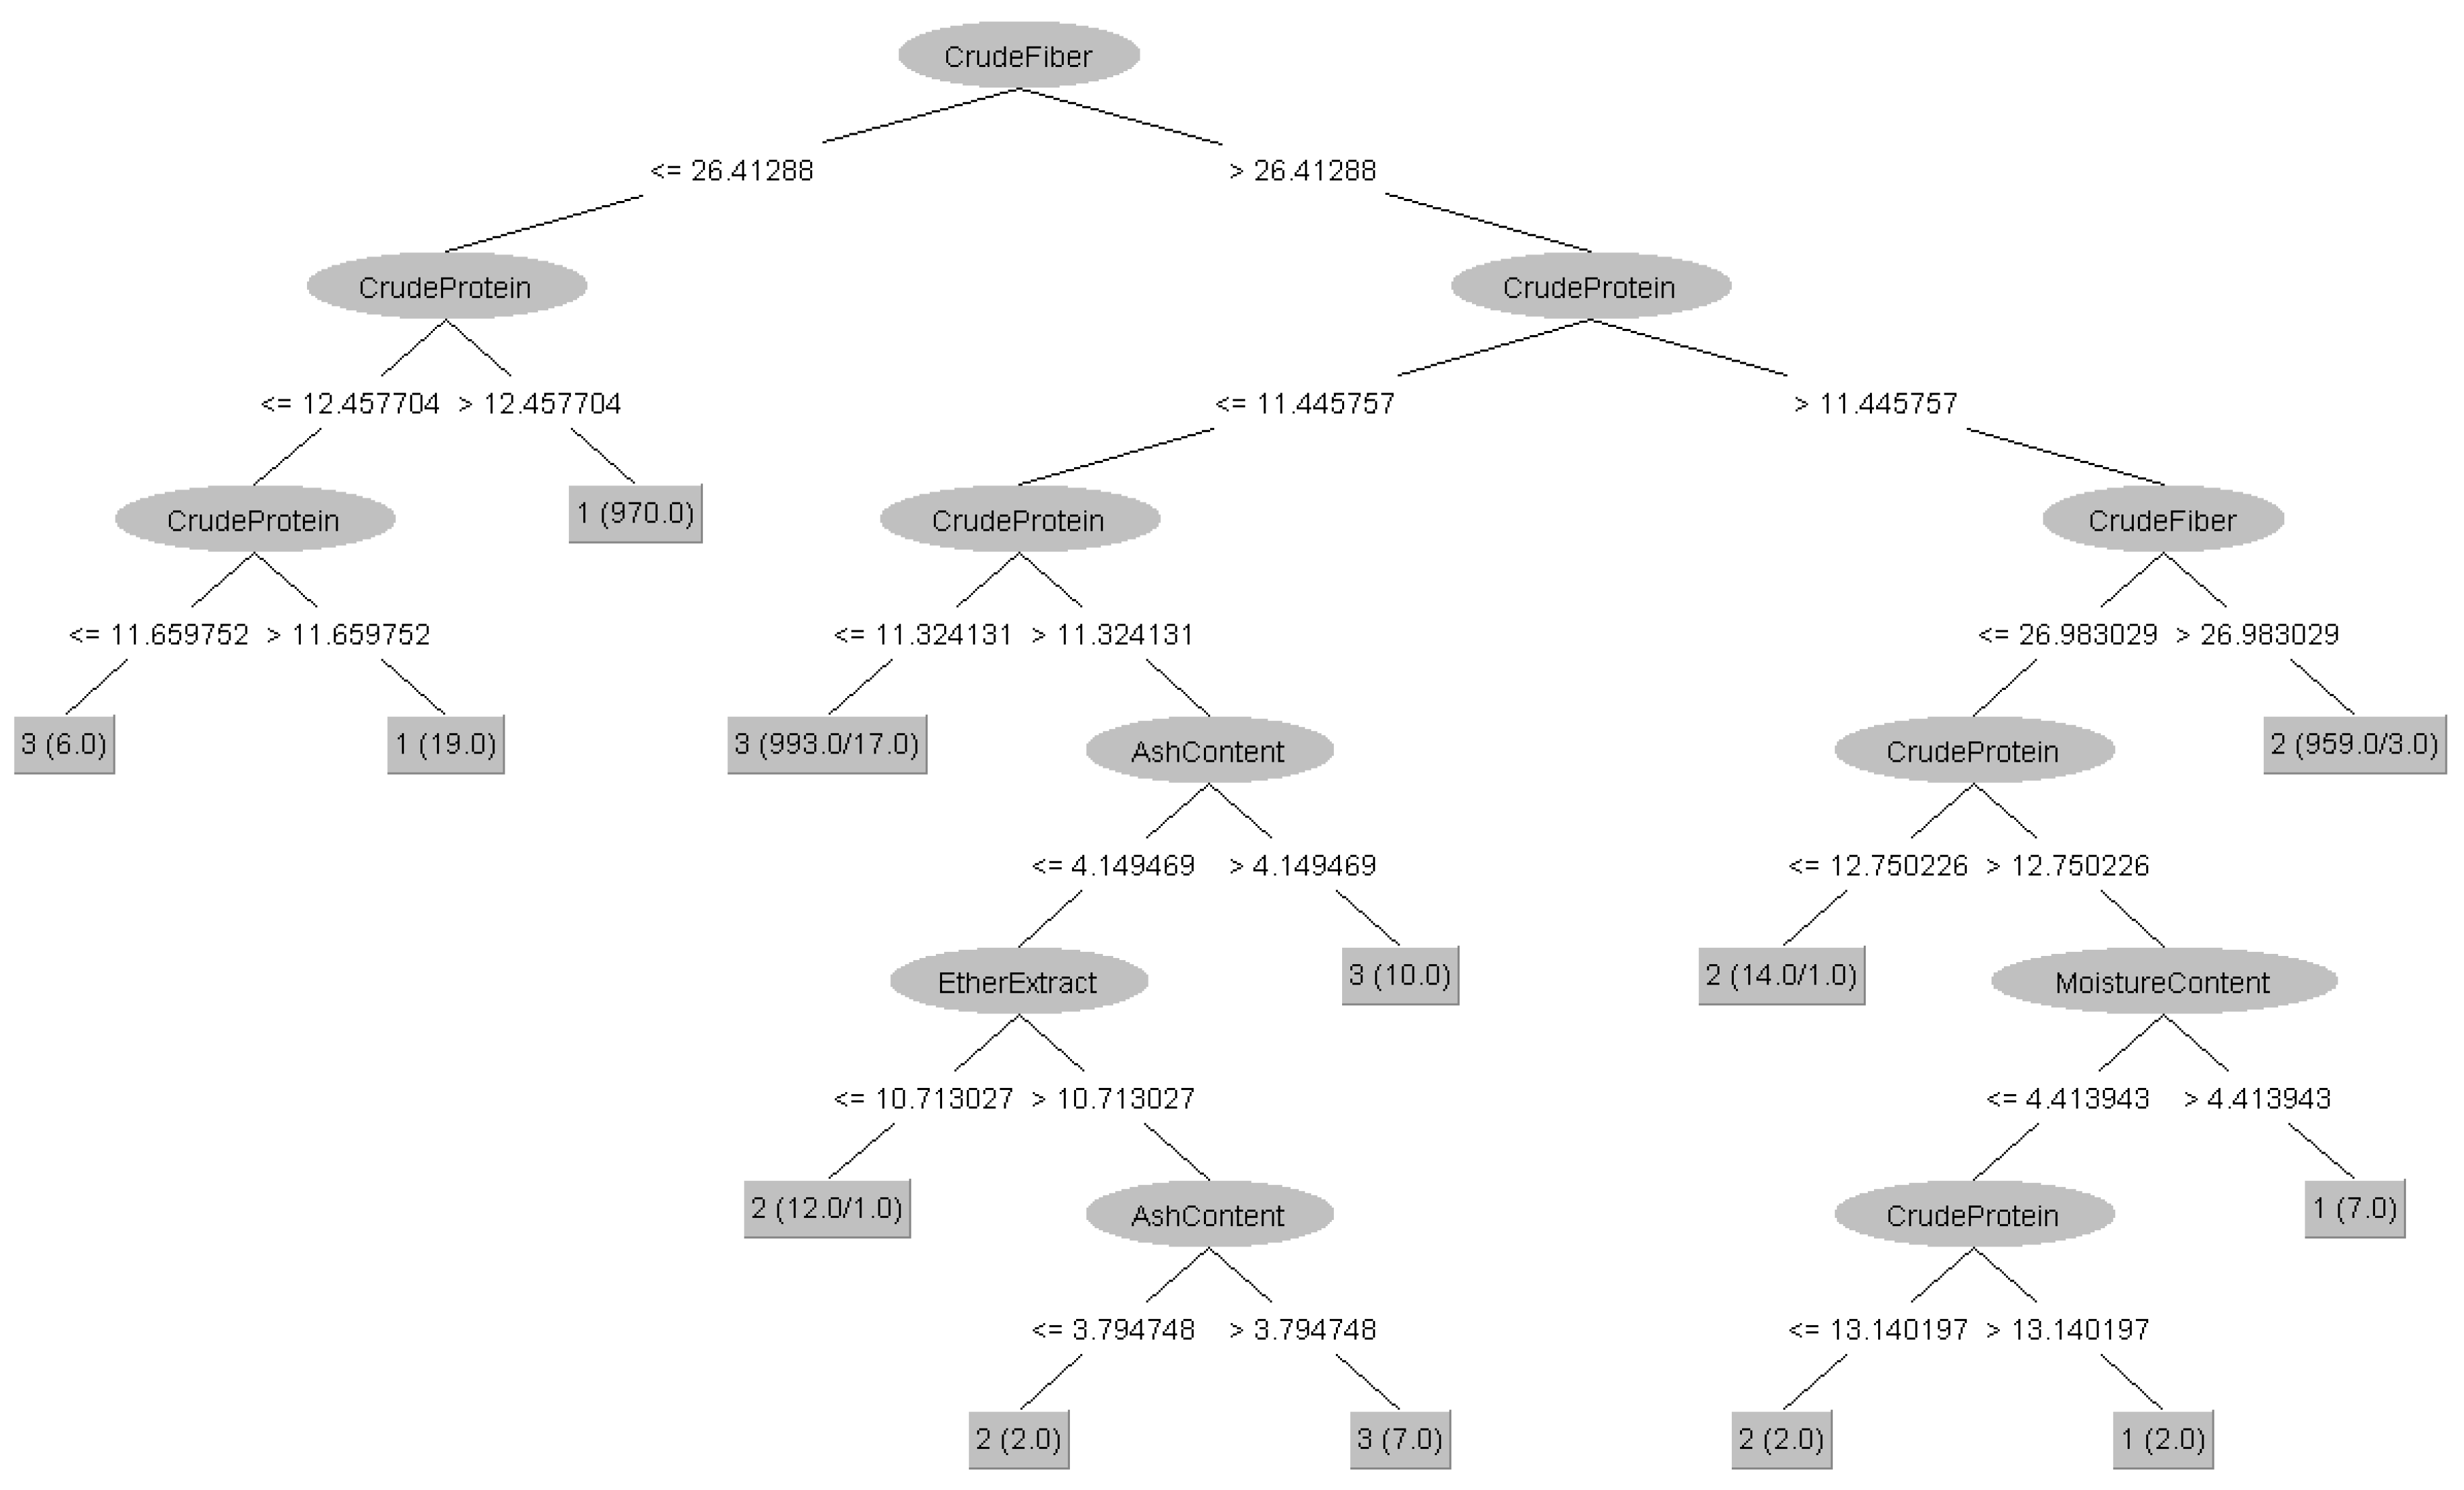
Figure 6 by the decision tree of J48, where the rules have become more intricate. However, it is worth mentioning that the increase in data complexity had no significant effect on classification accuracy for color information and chemical composition.
5. Conclusions
In this paper, we evaluated the applicability of classifying Arabic coffee into three major varieties, light, medium, and dark, using simulated data based on Iman’s actual data of color information, antioxidant laboratory tests, and chemical composition tests. We created two types of simulated data using the Monte Carlo approach: the first used the standard deviation of each of the actual measures, and the second used a double standard deviation of each of the actual measures. We classified both of the simulated data using a number of commonly used classifiers.
Based on our large set of experiments, several key findings have emerged:
The color information alone proved to be quite successful in accurately classifying Arabic coffee into three types: light, medium, and dark. The different CIE color values, as well as the excellent correlation between color information and coffee classes, were critical in achieving faultless classification outcomes.
When the antioxidant information was considered alone, it became clear that this type of information was insufficient for correct coffee classification. The results showed that relying simply on antioxidant information reduced classification performance significantly, and different classifiers performed differently. The KNN classifier in particular struggled with the additional data complexity (2STD simulated data).
In identifying Arabic coffee types, the chemical composition information revealed significant discriminatory strength. This information alone produced flawless classification results, demonstrating its significance and separability among the coffee groups. The substantial correlation between certain chemical composition features, such as crude protein and crude fiber, underscored their importance in the classification process even more.
The classification performance of the antioxidant information and the choice of classifier grew more relevant as the data complexity rose. The overlapping curves and increasingly elaborate decision tree rules demonstrated the difficulties encountered when dealing with complex data and the importance of proper classifier selection.
Indeed, based on the data stated, color information alone has proved the ability to reliably identify the type of coffee, showing its practical application potential. Using this knowledge, it is possible to create a smartphone application that analyzes the color of a coffee sample using image recognition technology such as [
51,
52,
53,
54]. Such an application could allow end users, such as consumers, to utilize their smartphone’s camera to snap an image of their coffee. The application would next transform the image’s RGB pixel values to the CIE color space, extracting the color information required for classification. After recognizing the coffee type, the application might offer the consumer with useful information on the chemical components of their coffee. Details such as caffeine content, antioxidant levels, moisture content, and other pertinent chemical compositions could be included. Our future mobile application would provide users with a handy and user-friendly tool for understanding the qualities of their coffee and making informed decisions depending on their tastes by delivering such information. Furthermore, it has the potential to increase transparency in the coffee sector, allowing customers to make more educated purchasing decisions.
There are various limitations that could be addressed in future coffee classification studies:
The paper largely concentrated on color, antioxidant, and chemical composition information. Exploring additional features that could improve classification accuracy, such as scent profiles, geographical origin, or processing processes, would be advantageous. Incorporating a larger variety of characteristics may result in a more comprehensive understanding of the factors determining coffee classification.
According to the findings, the distinctness and separability of certain variables, particularly antioxidant information, were limited, resulting in lower classification accuracy. Introducing more diverse and representative datasets with a broader range of actual (not simulated) antioxidant feature values could help alleviate this restriction and provide a more genuine portrayal of coffee variations.
The study focused on several off-the-shelf classifiers, although different algorithms or ensemble approaches could produce better results [
55,
56,
57,
58]. Exploring and comparing different classifier alternatives could provide useful insights into the most successful ways for coffee classification.
This paper focused on Arabic coffee varieties and classification. It would be beneficial to replicate the study using different coffee types from various places throughout the world to improve the generalizability of the findings. This would assist test the categorization algorithms’ efficiency across different coffee varieties and broaden the research’s practicality.
Our future studies will focus on these limitations in order to progress the field of coffee classification and contribute to more accurate and comprehensive classification models. Furthermore, additional research and development would be required to ensure the reliability and practicality of our future mobile application.
Author Contributions
Conceptualization, E.A., and A.H.; methodology, A.H., E.A., and G.A.; software, A.H., and G.A.; validation, E.A., H.B.; formal analysis, E.A., H.B.; investigation, H.B., and A.H.; resources, E.A., H.B.; data curation, A.H., G.A.; writing—original draft preparation, A.H., E.A., G.A., and H.B.; writing—review and editing, A.H., E.A., G.A., and H.B.; visualization, G.A., and A.H.; supervision, A.H.; project administration, E.A., and A.H. All authors have read and agreed to the published version of the manuscript.
Figure 1.
The distribution of each simulated feature. The visualization of the data is generated using Weka 3 [
47].
Figure 1.
The distribution of each simulated feature. The visualization of the data is generated using Weka 3 [
47].
Figure 2.
The results of the Pearson correlation analysis between all features and the Class variable, which represents the three coffee types.
Figure 2.
The results of the Pearson correlation analysis between all features and the Class variable, which represents the three coffee types.
Figure 3.
The importance scores of each feature were determined using a random forest algorithm to classify the three different coffee types.
Figure 3.
The importance scores of each feature were determined using a random forest algorithm to classify the three different coffee types.
Figure 4.
The crude fiber% as a function of crude protein for all simulated data points. The visualization of the data is generated using Weka 3 [
47].
Figure 4.
The crude fiber% as a function of crude protein for all simulated data points. The visualization of the data is generated using Weka 3 [
47].
Figure 5.
The crude fiber% as a function of crude protein for all 2STD simulated data points. The visualization of the data is generated using Weka 3 [
47].
Figure 5.
The crude fiber% as a function of crude protein for all 2STD simulated data points. The visualization of the data is generated using Weka 3 [
47].
Figure 6.
J48 decision tree for classifying coffee types based on 2STD simulated chemical compositions information. The visualization of the data is generated using Weka 3 [
47].
Figure 6.
J48 decision tree for classifying coffee types based on 2STD simulated chemical compositions information. The visualization of the data is generated using Weka 3 [
47].
Table 1.
Caffeine content, acrylamide, and free radical scavenging capacity (DPPH) in light, medium, and dark coffee [
3].
Table 1.
Caffeine content, acrylamide, and free radical scavenging capacity (DPPH) in light, medium, and dark coffee [
3].
| Degree |
Light coffee |
Medium coffee |
Dark coffee |
| Caffeine content % |
1.13±0.02 |
1.17±0.07 |
1.08±0.06 |
| Acrylamide(mg/100gm) |
0.41±0.086 |
0.31±0.063 |
0.36±0.048 |
| DPPH (mg TE/g) |
88.72±2.91 |
84.61±1.76 |
78.76±2.49 |
Table 2.
Proximate chemical composition (% in dry matter) content in light, medium, and dark coffee [
3].
Table 2.
Proximate chemical composition (% in dry matter) content in light, medium, and dark coffee [
3].
| Degree |
Light coffee |
Medium coffee |
Dark coffee |
| Moisture content % |
4.80±0.24 |
4.30±0.17 |
3.89±0.28 |
| Ether extract % |
10.39±0.30 |
10.47±0.19 |
10.65±0.22 |
| Crude protein % |
13.05±0.14 |
12.36±0.24 |
11.10±0.06 |
| Crude fiber % |
24.24±0.47 |
28.31±0.31 |
28.40±0.42 |
| Ash content % |
3.95±0.26 |
3.89±0.08 |
4.10±0.17 |
| Nitrogen free extract (NFE) % |
48.37 |
44.97 |
45.76 |
Table 3.
Color information in light, medium, and dark coffee [
3].
Table 3.
Color information in light, medium, and dark coffee [
3].
| Degree |
Light coffee |
Medium coffee |
Dark coffee |
| Browning index |
0.4540±0.13b |
0.8600±0.13b |
1.8400±0.24a |
| L * |
58.62±2.73a |
48.83±1.73b |
41.04±3.06b |
| a * |
9.75±0.44b |
13.04±0.07a |
13.93±0.62a |
| b * |
31.74±1.21a |
32.21±0.75a |
29.80±1.52b |
Table 4.
The statistical characteristics of the simulated data, 1000 samples for each class, in addition to the three actual samples.
Table 4.
The statistical characteristics of the simulated data, 1000 samples for each class, in addition to the three actual samples.
| Class |
Light coffee |
Medium coffee |
Dark coffee |
| Features |
Min |
Max |
Mean |
Min |
Max |
Mean |
Min |
Max |
Mean |
| MoistureContent |
3.98 |
5.51 |
4.80 |
3.67 |
4.83 |
4.30 |
2.89 |
4.93 |
3.90 |
| EtherExtract |
9.36 |
11.29 |
10.39 |
9.90 |
11.04 |
10.48 |
10.04 |
11.26 |
10.65 |
| CrudeProtein |
12.58 |
13.52 |
13.05 |
11.64 |
13.13 |
12.36 |
10.91 |
11.28 |
11.10 |
| CrudeFiber |
22.70 |
25.64 |
24.23 |
27.30 |
29.55 |
28.31 |
27.02 |
29.63 |
28.39 |
| AshContent |
2.88 |
4.88 |
3.95 |
3.63 |
4.16 |
3.89 |
3.51 |
4.59 |
4.10 |
| NFE |
45.29 |
51.44 |
48.36 |
41.65 |
48.17 |
44.98 |
42.48 |
49.27 |
45.74 |
| CaffeineContent |
1.07 |
1.19 |
1.13 |
0.95 |
1.42 |
1.17 |
0.92 |
1.27 |
1.08 |
| Acrylamide |
0.12 |
0.66 |
0.40 |
0.04 |
0.52 |
0.31 |
0.20 |
0.50 |
0.36 |
| DPPH |
78.22 |
98.72 |
88.80 |
79.54 |
90.07 |
84.68 |
70.40 |
86.05 |
78.64 |
| Browning Index |
0.02 |
0.90 |
0.44 |
0.35 |
1.23 |
0.86 |
1.04 |
2.51 |
1.84 |
| Lcolor |
48.67 |
66.36 |
58.44 |
43.52 |
53.87 |
48.81 |
30.15 |
52.24 |
41.10 |
| aColor |
8.31 |
11.25 |
9.78 |
12.79 |
13.24 |
13.04 |
12.08 |
16.01 |
13.92 |
| bColor |
27.56 |
35.87 |
31.75 |
30.00 |
34.46 |
32.22 |
25.18 |
35.43 |
29.76 |
Table 5.
Classification results of Arabic coffee based on its color information: L*, a* and b*.
Table 5.
Classification results of Arabic coffee based on its color information: L*, a* and b*.
| Classifier |
Precision |
Recall |
F-Measure |
| RF |
1.000 |
1.000 |
1.000 |
| NB |
0.998 |
0.998 |
0.998 |
| SVM |
0.993 |
0.993 |
0.993 |
| KNN |
0.994 |
0.994 |
0.994 |
| J48 |
0.993 |
0.993 |
0.993 |
Table 6.
Classification results of Arabic coffee based on its antioxidant information: caffeine percentage, acrylamide concentration, and DPPH.
Table 6.
Classification results of Arabic coffee based on its antioxidant information: caffeine percentage, acrylamide concentration, and DPPH.
| Classifier |
Precision |
Recall |
F-Measure |
| RF |
0.900 |
0.899 |
0.900 |
| NB |
0.912 |
0.912 |
0.912 |
| SVM |
0.866 |
0.856 |
0.858 |
| KNN |
0.868 |
0.868 |
0.868 |
| J48 |
0.893 |
0.892 |
0.892 |
Table 7.
Classification results of Arabic coffee based on its chemical compositions information: Moisture content %, Ether extract %, Crude protein %, Crude fiber %, Ash content %, and NFE) %.
Table 7.
Classification results of Arabic coffee based on its chemical compositions information: Moisture content %, Ether extract %, Crude protein %, Crude fiber %, Ash content %, and NFE) %.
| Classifier |
Precision |
Recall |
F-Measure |
| RF |
1.000 |
1.000 |
1.000 |
| NB |
1.000 |
1.000 |
1.000 |
| SVM |
1.000 |
1.000 |
1.000 |
| KNN |
1.000 |
1.000 |
1.000 |
| J48 |
0.999 |
0.999 |
0.999 |
Table 8.
Classification results of Arabic coffee based on its color information: L*, a*, and b*, obtained from 2STD simulated data.
Table 8.
Classification results of Arabic coffee based on its color information: L*, a*, and b*, obtained from 2STD simulated data.
| Classifier |
Precision |
Recall |
F-Measure |
| RF |
0.968 |
0.968 |
0.968 |
| NB |
0.972 |
0.972 |
0.972 |
| SVM |
0.953 |
0.952 |
0.952 |
| KNN |
0.957 |
0.956 |
0.956 |
| J48 |
0.964 |
0.964 |
0.964 |
Table 9.
The confusion matrices of four classifiers of 2STD simulated color data.
Table 9.
The confusion matrices of four classifiers of 2STD simulated color data.
| |
Light |
Mediun |
Dark |
|
Light |
Mediun |
Dark |
| Light |
1001 |
0 |
0 |
|
992 |
0 |
9 |
| Mediun |
0 |
980 |
21 |
|
0 |
968 |
33 |
| Dark |
12 |
53 |
936 |
|
9 |
94 |
898 |
| |
KNN |
|
RF |
| Light |
991 |
0 |
10 |
|
993 |
1 |
7 |
| Mediun |
0 |
959 |
42 |
|
0 |
969 |
32 |
| Dark |
8 |
71 |
922 |
|
10 |
47 |
944 |
Table 10.
Classification results of Arabic coffee based on its 2STD simulated antioxidant information: caffeine percentage, acrylamide concentration, and DPPH.
Table 10.
Classification results of Arabic coffee based on its 2STD simulated antioxidant information: caffeine percentage, acrylamide concentration, and DPPH.
| Classifier |
Precision |
Recall |
F-Measure |
| RF |
0.701 |
0.700 |
0.700 |
| NB |
0.740 |
0.740 |
0.740 |
| SVM |
0.678 |
0.660 |
0.662 |
| KNN |
0.640 |
0.641 |
0.640 |
| J48 |
0.749 |
0.703 |
0.725 |
Table 11.
Classification results of Arabic coffee based on its 2STD simulated chemical compositions information: Moisture content %, Ether extract %, Crude protein %, Crude fiber %, Ash content %, and NFE) %.
Table 11.
Classification results of Arabic coffee based on its 2STD simulated chemical compositions information: Moisture content %, Ether extract %, Crude protein %, Crude fiber %, Ash content %, and NFE) %.
| Classifier |
Precision |
Recall |
F-Measure |
| RF |
0.991 |
0.991 |
0.991 |
| NB |
0.993 |
0.993 |
0.993 |
| SVM |
0.967 |
0.998 |
0.982 |
| KNN |
0.983 |
0.983 |
0.983 |
| J48 |
0.985 |
0.985 |
0.985 |
