Preprint
Article

Study of Like and Dislike of the Historical Urban Landscape of Ibarra, Ecuador

Altmetrics

Downloads

109

Views

41

Comments

0

A peer-reviewed article of this preprint also exists.

Submitted:

05 June 2023

Posted:

06 June 2023

You are already at the latest version

Alerts
Abstract
This article presents the results of the study on the elements and spaces that likes and dislikes’ historical urban landscape of Ibarra's city, Ecuador, based on the analysis of the urban image. This research aims to propose an objective way to intervene a historical landscape based on the opinion of the people who frequent the place. Our hypothesis is that the characteristics (age, gender, educational level, and frequency of visits) of the interviewees condition their judgment on liking and disliking. It is proposed to know which of these characteristics condition the judgment. The methodology has two parts: a descriptive statistical analysis with graphs and frequencies used to map each point on the maps, and a logistic regression model to study the relationships between liking and disliking with interviewee characteristics. As results, (1) it has been possible to obtain those elements or spaces that are liked and disliked in proportion graphs and in planimetry. (2) Explanatory analysis of liking and disliking through the logistic regression model and inference to study significant characteristics. It emphasizes that "frequency of visits" is the significant characteristic for the elements and spaces that dislike. It's concluded that the study carried out provides objective tools to obtain the opinion of people and it's useful seen it in planimetry. Also, could be establish priorities to urban authorities about improve and intervention on elements or spaces that people judge because they are liking or disliking.
Keywords: 
Subject: Arts and Humanities  -   Other

1. Introduction

1.1. Study Overview

The urban image refers to mental scheme created by people about elements and spaces they remember. For historic urban landscapes, this scheme is configured from representative signs of its culture, local knowledge and, social cohesion that, occasionally, is affected by conflicts.
Understanding the development of these landscape in relation to the current moment is vital to preserve the history, culture, and values ​​as a sample of a heritage maintained and transmitted to future generations. It’s fundamental to understand that decisions based on people opinions that conduces to do more sustainable the historic places. The visual and functional landmarks of the urban space exhibit an expression of the diversity of the shared sociocultural and natural heritage and a basis of the identity of the historical landscape (ICOMOS, 2014).
Although there are different perspectives to examine the behaviour of people in relation to the valuation of the environment, we are interested in those approaches oriented to the perception of the urban environment, focused on understanding the relationships of people with it. Nassauer and others indicates to further support well-being, scale of greenspace investigations should be more closely related to both the scale of everyday neighbourhood experiences and to the scale of potential landscape interventions. Greater understanding of how everyday experience of greenspace may affect well-being is needed (Nassauer et al., 2021). And that’s apply to urban landscape if we give an integrates focus to improve design projects transferring management strategies (Å. K. Ode & Fry, 2002). Studies shows us that improve quality of historical urban neighbourhoods contributes to do that more social sustainability (von Schönfeld et al., 2018).
Historical landscapes reflect social cohesion (Hussein et al., 2020; Kent et al., 2017; Méndez et al., 2021) by showing the past and the elements of value and cultural identity. Buildings and squares are characteristic of these places, especially in Latin American cities. They all share this heritage in their layout and architecture, expressing the character of these urban downtown. However, the current conditions of this built heritage show a deterioration that is perceived by those who visit its spaces. Additionally, not all spaces and buildings are remembered by people, even when they have heritage value.
Public regulations and institutions in Ecuador (Instituto Nacional de Patrimonio Cultural, Ecuador, n.d.), for example, indicates the importance of heritage values, their contribution to the sustainability of the city by transferring this historical heritage. So, how to find those that are valued better or worse? Are there clear connections between them? Are all buildings and heritage spaces valued in the same way? Can priorities be established to improve built heritage based on what people value? Are there differences between the elements or spaces remembered by people who frequent or live the place or not?
The analysis of image and preferences (Lynch, 2015; Kaplan, S. y Kaplan, 1982; Russell, 2003) addresses the human mind: how it apprehends, knows, interacts, and interprets information from the outside world, based on sequenced elements that guide reading from the city. Urban image is the synthetic graphic representation created through urban cognitive maps where patterns are identified. “As a product of the orientation process, route-based knowledge is considered the most basic type of spatial knowledge. Signs and routes between places and/or people are often the first things learned when traveling through a new environment” (Mondschein et al., 2006).
Other authors argues that urban design lacks a theory supported by scientific evidence (Marshall, 2012). Many occasions, design decisions are made without sufficiently clear studies that provide the necessary evidence to undertake projects. The work we present points in this direction. The study has an ecological view about perception and mental image or remembering, because both are part the cognition process.
The historical landscape of Ibarra, Ecuador, contains a large part of the city's tangible and intangible heritage. It is evidenced in its regular and compact urban layout, squares, architecture, and its social and cultural practices. Although it has an important value, its elements appear disconnected and deteriorated. And there are no objective criteria to urban authorities about elements or spaces people appreciate or not, that must be intervened to improve urban quality.
We present the results of the study of the elements of the urban image of the historical landscape of Ibarra, in relation to liking or disliking they represent for people. It has two objectives. The first seeks to identify the elements and spaces that like or dislike. The second objective seeks to understand the answers between identified elements or spaces and characteristics of people.
The hypothesis that we proposed is that the elements identified or remembered are related to the characteristics of the subject, especially familiarity with the sector, and this affects liking as a value judgment or “affective response”. It is conjectured that these characteristics condition the given judgment, and it is interesting to know which ones do so.
To carry out this research, a survey was designed whose objective was to determine the identity and structure of the urban image. The instrument was applied in two days in November 2017. The data obtained was prepared and arranged in an Excel file and processed with the statistical software R (R Core Team, 2018).

1.2. Perceptual Assessment and Urban image

For the cognitive process, remembering the phenomena implies to elaborate a mental image based on structured sequences on identified elements. This approach has two precepts: remember and value.
Kevin Lynch explains the way in which people perceive and organize spatial information through “mental maps” (Lynch, 2015), configured by identifying five elements: paths, borders, districts or urban sectors, nodes, and references. When these elements can be remembered and the relationships that are established from public spaces, we can affirm that we have a structured image of the city. Identity and structure constitute the components of the meaning that is generated in relation to spatial form. But we ask, is meaning related to some characteristics of the subject, these characteristics do they condition the judgment issued about what is attractive or not?
Assigning value to identified elements supposes a response based on emotional satisfaction, which contributes to physical and mental well-being.
Aguilar explains that “the aesthetic pleasure that the landscape grants is, without a doubt, is an educational process that has all its references in culture (Aguilar, 2006). The perception of the landscape as ‘landscape’ has a different relationship depending on the characteristics, the cultural and aesthetic baggage of the observer”. Additionally, other authors suggest that people remember objects or spaces by the type of daily interaction they have with them (Mondschein et al., 2006). According to these ideas, can it be deduced that people assign value to what they remember, based on their accumulated aesthetic experience related to age, education and familiarity with the place?
Responses of liking and disliking can relate to factors before described (Russell, 1980), that suggested including “pleasure and exaltation” in studies of aesthetic judgments -given the quality of the landscape-. The works of Russell and Russell and Pratt (Russell, 1980) (Russell & Pratt, 1980), identify both factors as the main “affective responses” manifested by individuals in their physical relationship with the landscape. Such responses constitute a valuable conceptual and empirical tool linked to affective psychological functioning, which adds to the idea of ​​well-being. The affective state is defined as “a neurophysiological state that can be consciously accessed as a simple, non-reflective feeling that is an integral combination of hedonic values ​​(pleasure-displeasure) and arousal (passive-active)” (Russell, 2003). Pleasure is also equivalent to the assumptions of Chenoweth and Gobster , who affirm that, for the feelings or emotions derived from the aesthetic experience, the landscape is evocative of pleasure, pride, happiness, relaxation, exploration, and exercise (Chenoweth & Gobster, 1990).
Supported by recognition of affective (Johansson et al., 2016) and cognitive relationships, this type of research explores the way in which the built environment affects behavior. From interesting activities or the beauty of some elements will be producing pleasures aesthetic experiences. It is argued that the built environment “has a unique potential to influence our quality of life and well-being” (Kent et al., 2017). Also reinforces the sense of community identity to the extent that it satisfies needs associated with interaction social, privacy and citizen participation. Such needs have been indicated by Matsuoka and Kaplan as part of the design process that needs to assess the relationship of people with the environment in which they live (Matsuoka & Kaplan, 2008). Authors affirm that the design must seek to influence “cognitive properties such as pleasure, ..., significant for an appropriate physical-social context” that seek mental health and the idea of well-being, in its broadest sense (Sotoudeh & Abdullah, 2013).
In relation to value, the Urban Landscape Forum suggests considering different dimensions (Verdaguer, 2005). Nevertheless, for this work, two are especially interest: the space-time dimension, expressed in keys and structured tours of the city, and the socio-cultural dimension, where the landscape is considered a heritage element, whose visual excellence is observed in those that are key to identity, and cohesion of the whole. McHarg points out that there is a system of natural and social values identified through the “elaborated and received form” (McHarg, 2000). Elaborated form refers to the presence of key elements of the landscape. Received form refers to the perception of landscape, that is, how people value them.
The approach of environmental psychology has interest to evaluate the answers issued by people on the elements they remember in relation to the aesthetic judgment. The most used instrument is the survey. In this regard, Galindo and Corraliza propose considering three categories in relation to the study on the judgment issued: “(a) descriptive scales, referring to spatial configuration properties and physical attributes of the stimuli; (b) affective scales, fundamentally referring to the reactions of the subjects while they are exposed to the landscapes under study and (c) evaluative scales, indicative of the value and/or aesthetic quality of the environments of interest” (Galindo & Corraliza, 2012). The first consists of identifying elements, the second is presented conditioned by the people’s characteristics and the third category shows the value they give it, for example, like or dislike.
Identifying and giving value are conditioned by the characteristics of the subject in interaction with situations that produce pleasure, therefore, they are pleasant.
Luo et al. provides a study based on a survey of 227 subjects on landscape preferences, considering the “perceptual priority (PP) and cognitive preference (PC)” from two approaches: perceived landscape and cognitive landscape. The first is objective, elements are also identified, the second is constructed subjectively, taking into consideration that the answers are conditioned by age, sex, education, among others. They determine that there is a moderate preference for the natural landscape in contrast to the dislike for the artificial landscape, based on the demographic characteristics of the subjects, in particular: “age and education showed a significant influence on the preference of the landscape” (Luo et al., 2019).
Different investigations indicates about liking and disliking, how people respond to the meaning of the place and favorite places, discovering the way in which the brain reacts to them (Gatersleben et al., 2020). They emphasize that this type of study has received contributions from the social, urban, ecological, and psychological fields, among others, in which the landscape is valued according to cultural identity. In other words, people fell appreciation and well-being, the well-known places with which they identify culturally. These affective feelings are involved in a variety of affective and behavioral dimensions based on memories, social connections, or emotional bonds. They highlight the value of the natural landscape compared to the built one, for which they affirm that greater visual attention is required, hence our interest.
One of the conclusions of this study explains, regarding the brain's medial prefrontal cortex (mPFC), that “it could be argued that activity in the mPFC for significant places reflects conscious access to positive memories and feelings associated with that place. Such personal memories and feelings of places contribute to appreciating the place and perceiving its restorative qualities” (Gatersleben et al., 2020). The study had 19 participants (too few to establish statistical significance), 10 female and 9 males, aged between 19 and 53 years. They brought images of landscapes or objects with which they identified. Also, they were shown other images of rural and urban landscapes, to carry out the analysis.
On the concept of naturalness in relation to the analysis of preferences, some studies inspire urban research. Ode et al. show results from a study of 703 respondents. The two demographic factors that most contributed to the formation of preferences were gender and having a profession related to landscape (A. Ode et al., 2009).
Therefore, is necessary to understand the responses given by people based on the elements they remember and identify. These elements or spaces identified in a map and the value that people give it (like or dislike) is very important. Also, the relation between that response and characteristics of the people such as their age, sex, his education, and his familiarity with the place. For this, the logistic regression model is proposed as a statistical tool.

1.3. Logistic Regression Model

Suppose a Bernoulli phenomenon, that is, an experiment whose result in relation to an individual can only be a success or a failure (or equivalently, the presence or absence of a characteristic, the membership or not of a certain group or other similar forms). Suppose also that an investigator wishes to test whether the outcome of the experiment is determined by certain measurable characteristic(s) in everyone (and possibly the direction of the relationship, if any). Now, a model that makes it possible to estimate the probability of success (or failure) of the response and relates it linearly to the characteristics measured in individuals seems plausible.
In 1944, Joseph Berkson introduced the logistic regression technique for explanatory variables of a continuous nature and its counterpart, the logit model, for categorical explanatory variables or explanatory factors (Hilbe, 2009). The logit function is defined as:
l o g i t p = l o g p 1 p
For p ∈ (0,1). If p represents the probability of success of a dichotomous phenomenon, then the logit represents the natural logarithm of the possibility, the latter being understood as the ratio between the probability of success and that of failure. The possibility takes values between the positive real numbers and their logarithm in the entire real line, so, if we have a sample of size k, it is consistent to postulate:
l o g i t p i = x i ' β ,   i = 1,2 , . . . , k
where x i ' is a row vector whose elements are variables or explanatory factors observed for the i-th individual in the sample and β is a column vector of unknown parameters that must be estimated from the data.
McCullagh and Nelder show that the logit model belongs to the family of Generalized Linear Models (MCCullagh, P.; Nelder, 1989) [see also (Agresti, 2015)], when the response variable is dichotomous or binomial, and develop the statistical details of the model, including the estimation of its parameters using the reweighted iterative least squares method, its goodness-of-fit forms and hypothesis tests, among other details.
In this work, logistic regression models will be proposed, trying to relate the response variables “mentioned as liking or not mentioned” and “mentioned as disliking or not mentioned”, for each building or place of the general list of mentions of the interviewees, with the variable explanations: Gender, Age, Educational level and Condition of to frequenting site.

2. Methods

2.1. Spatial Scope of the Historic Landscape of Ibarra

Ibarra’s city is located at 2200 meters above sea level in a 242 km2 valley, in northern Ecuador. The character of this city is to be a crossroads between the country’s capital, Quito, and its neighbor Colombia. The historic landscape was configured since its foundation in 1606, following the Spanish colonial model. It is a regular layout in the form of a checkerboard made up of 81 blocks. The downtown is limited to the east and west by the Tahuando and Ajaví rivers, respectively. These natural elements served as an input for life, as well as roads linked to the system of agricultural cities, typical of the colonial period. The church and monastery of Santo Domingo, together with “La Demarcación” street (now Colón Street), marked the north and south limits (Figure 1). To the south, and as a scenic background of the small city, the Imbabura volcano is located.
After the strong earthquake of 1868, the city is rebuilt with wider streets and sidewalks maintaining its grid layout, smaller blocks, and the predominant classic republican decorative style in Europe. The squares go to call parks because the landscaping green design. The city remains with few changes until the first years of the decade that begins in 1950. The greatest variations are introduced in its borders, with the consequent loss of the rivers as important natural protagonists of the colonial era. In 1999, the first inventory of patrimonial real estate was carried out, most of which are contained in the historic downtown (Saltos, R. y Torres, 1999). Ibarra is the third city in the country with the largest number of registered and inventoried heritage assets. Historic landscape is an important attractive for tourist.

2.2. The Survey

We applied a survey by statistical sampling, through a data collection instrument directed at the passers-by of the place, uniformly distributed (Figure 1).
Before applying for the survey, we made a count by sectors, to have an estimate of the number of people who passed through the historic downtown in a typical week. This amount was estimated at 110000 people per week (with possible repetitions). For all practical purposes, no problems were foreseen in locating the interviewees, considering this number a large population, when compared to the estimated population of the city, which was around 140000 people according to the last census carried out in 2010. Additionally, we asked a randomly selected group of passers-by (1850 people) the key question of the study: in terms of its beauty, what do you think of the place where we are? The intention was to determine, in a preliminary way, the proportion of people who think favorably and unfavorably about the aesthetics of the historic landscape and incorporate this data into the definitive calculation of the sample size.
Considering success (p) as an unfavorable response (since the interest is centered on problems or disagreements), p = 0.47 was estimated for the pilot sample. Consequently, the favorable response had a ratio of 1 - p = 0.53. With these proportions, setting a maximum allowable estimation error of 0.05, a definitive sample size of 399 people was calculated, using the formula for simple random sampling of proportions in finite populations (Scheaffer, Richard L.; Mendenhall III, William; Lyman Ott, R.; Gerow, 2012). Finally, the applied survey achieved a sample of 462 people, with which the mentioned estimation error was slightly lower than expected at the time of its planning.
Starting from 11 open questions, the fieldwork was carried out on two different days. The data was later transcribed, organized, and adjusted, resulting in 56 variables.
Regarding this work, the questions of interest were the following:
  • Likes to: What are the three places, objects, buildings, or roads that you like the most in the historic downtown of the city of Ibarra?
  • Dislikes to: What are the three places, objects, buildings, or roads that you most dislike in the historic downtown of the city of Ibarra?
Each of these questions produced three free answers from the interviewees and induced three variables, one for each place mentioned. Each variable was carefully reviewed and coded so that equivalent places were considered the correct number of times they were mentioned.
Even when the importance of the order in which the places are mentioned can be raised, considering that people first mention what they remember the most, on this occasion the analysis is limited to the set of mentions, regardless of the order.

2.3. Quantitative Data Analysis

The graphs of proportions are presented with percentages of liking and disliking of buildings or places with the most mentions.
A logistic regression model is proposed to study liking and disliking, using as a response variable, about each of the buildings or places mentioned in general, if the interviewee mentions it as like/dislike (True) or does not mention it (False).
The number of places mentioned as liking was 150 out of an amplified sample of 1150 observations, while the number of places mentioned as disliking was 217 out of an amplified sample of 929 observations. In both cases, the amplification of the sample occurs by repeating the characteristics of the interviewee for each of the three possible mentions. Also, in both cases, those records with some non-response in any of the variables considered have been removed.

2.4. Planimetry

To spatially locate each of the points of liking and disliking mentioned by the respondents, a high-definition raster image of the center of the city of Ibarra was superimposed on a map in .dwg format (Autodesk's AutoCAD software). It was geo-referenced with UTM coordinates (Universal Transverse Mercator. South American Datum, 1956). We draw a 100 meter by 100-meter grid and locate Cartesian axes at the edges of the photo, graduated to the same measurement.
For dimensioning of liking and disliking points, the relative frequencies of each response were used, scaling them to a base size of 30 meters radius in the geo-referenced image, for the highest frequency. The location of each object as a point on the plane was made by assigning different colors.
To graph both variables together, the smaller circle was superimposed on the larger one, so that it could be shown whether there is greater liking or disliking. To indicate the streets, these were marked at the end of the study area and arrows were added to indicate their direction.

3. Results

3.1. Descriptive Analysis of Liking and Disliking

3.1.1. Description of Liking

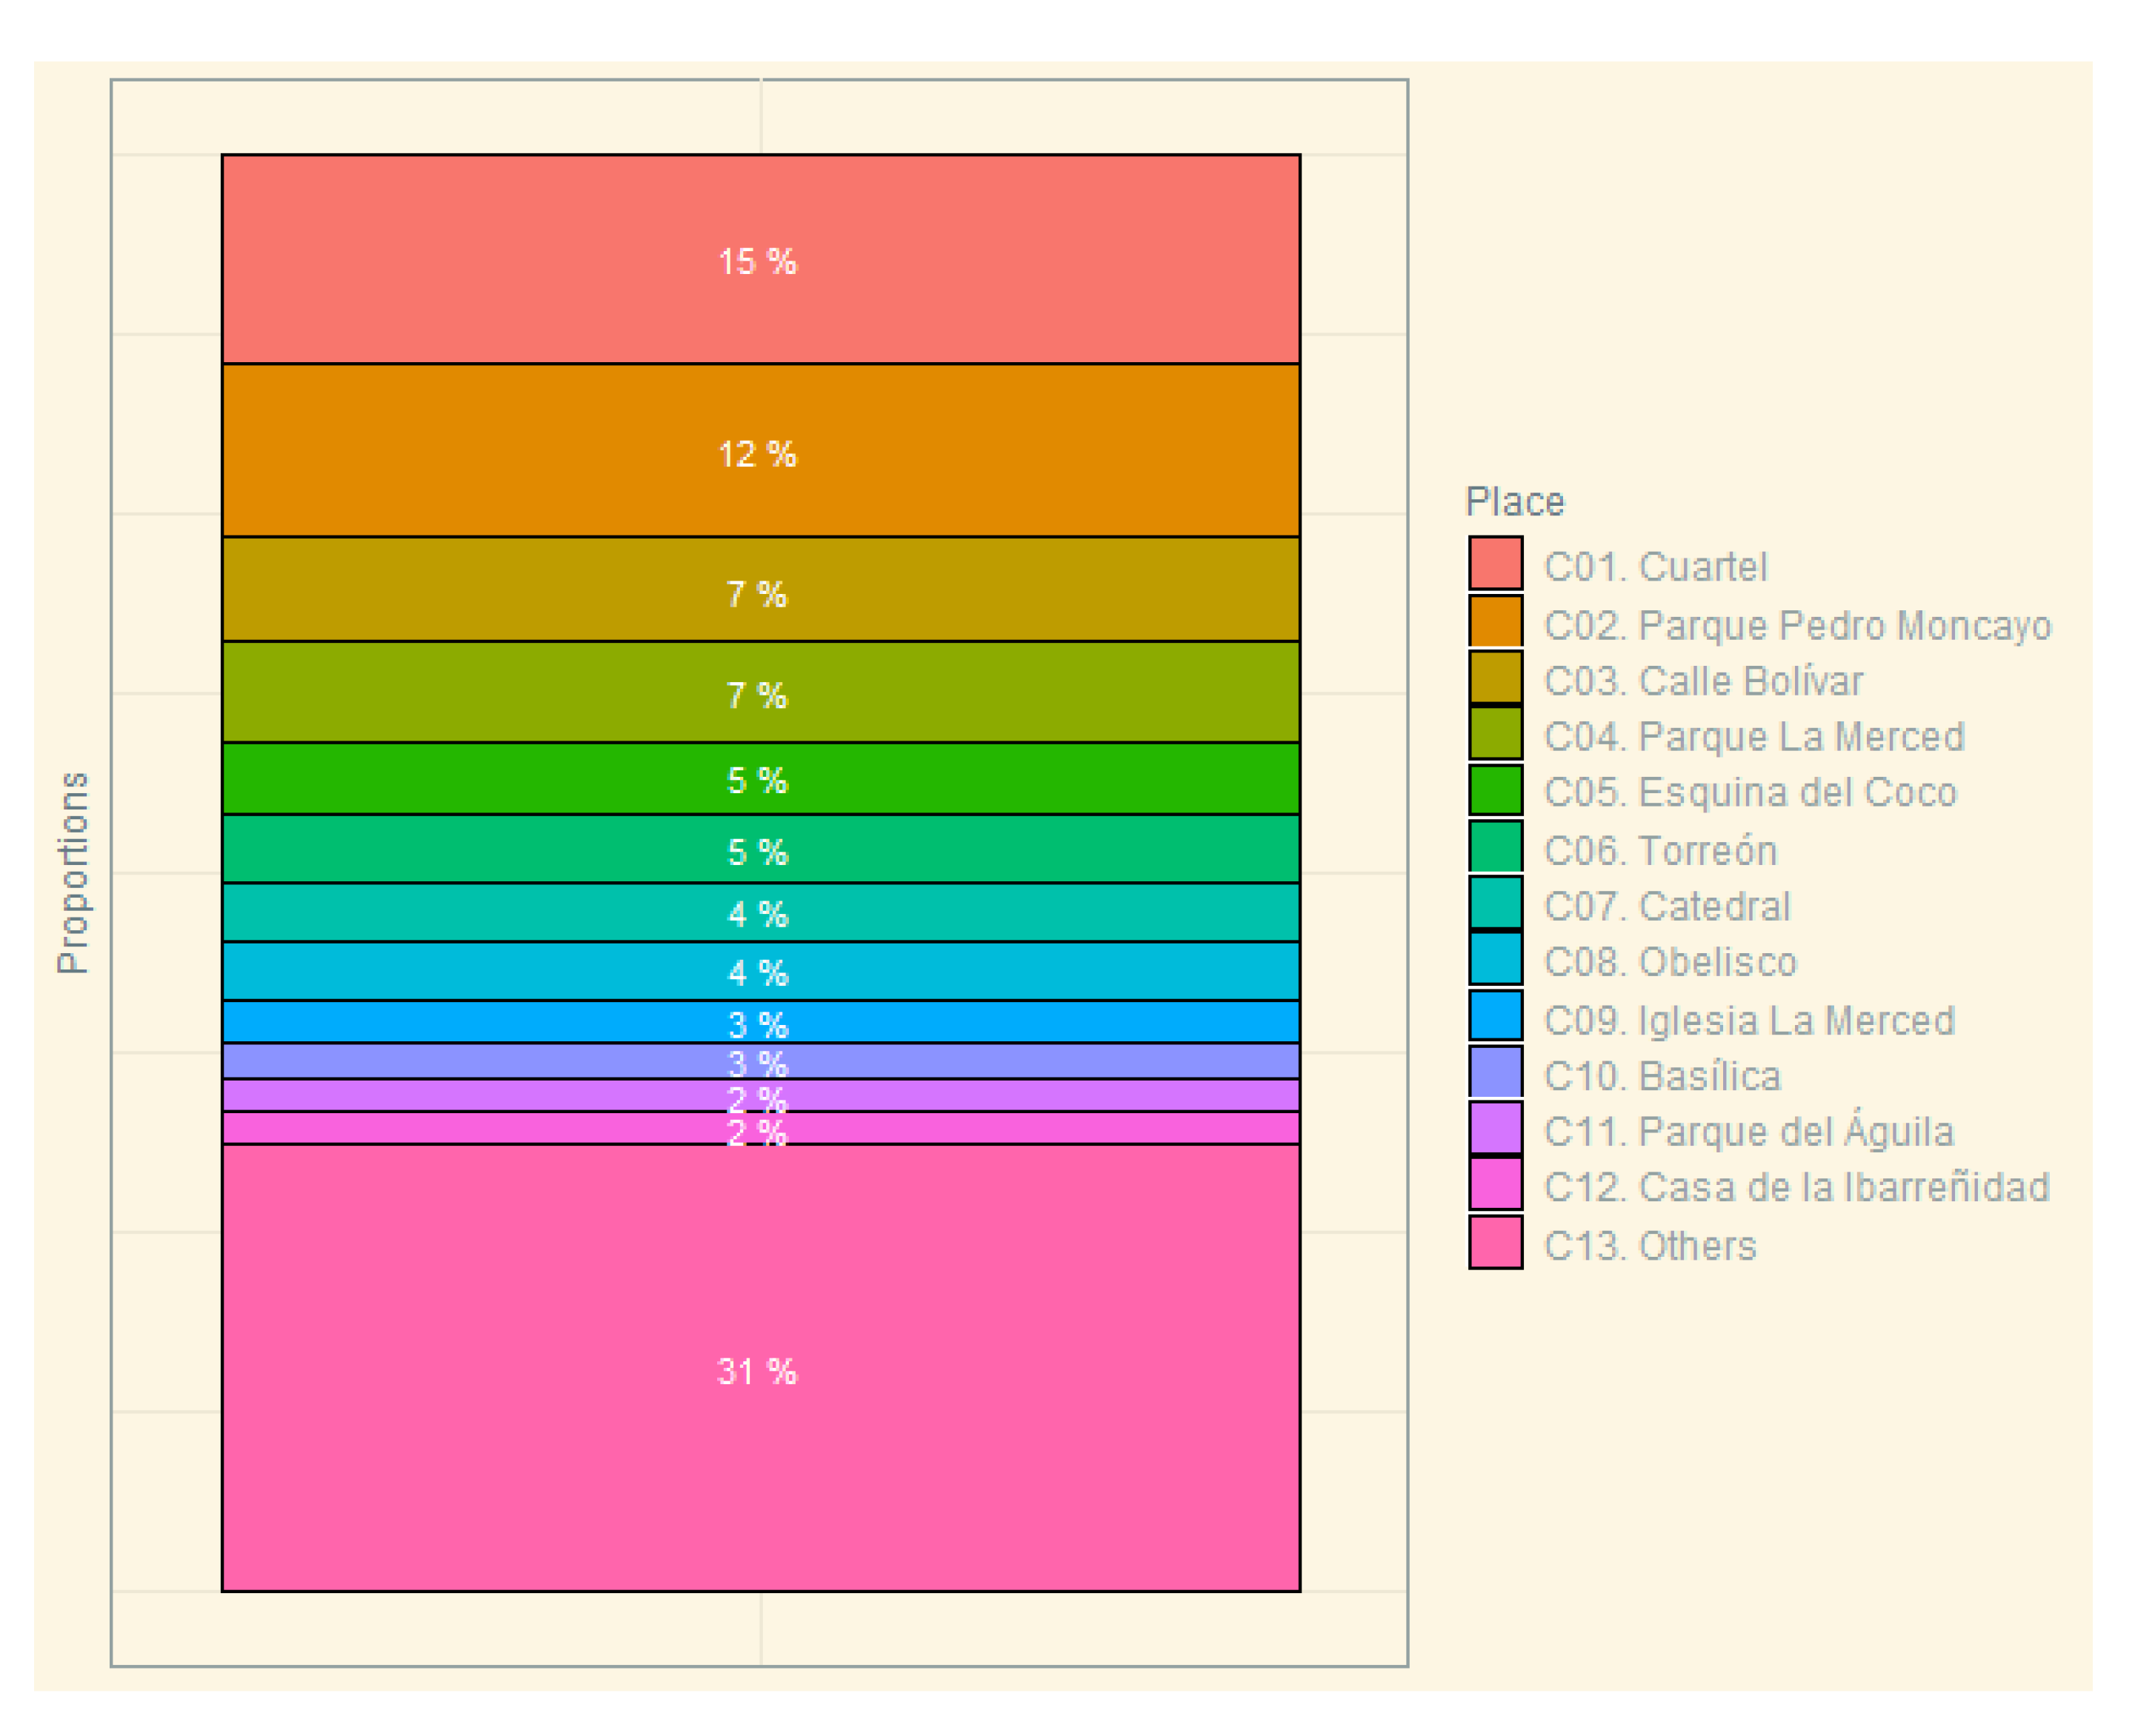
The interviewees mentioned a total of 150 different places in the historic landscape. Figure 2 shows the percentages of those 12 most frequently mentioned places.
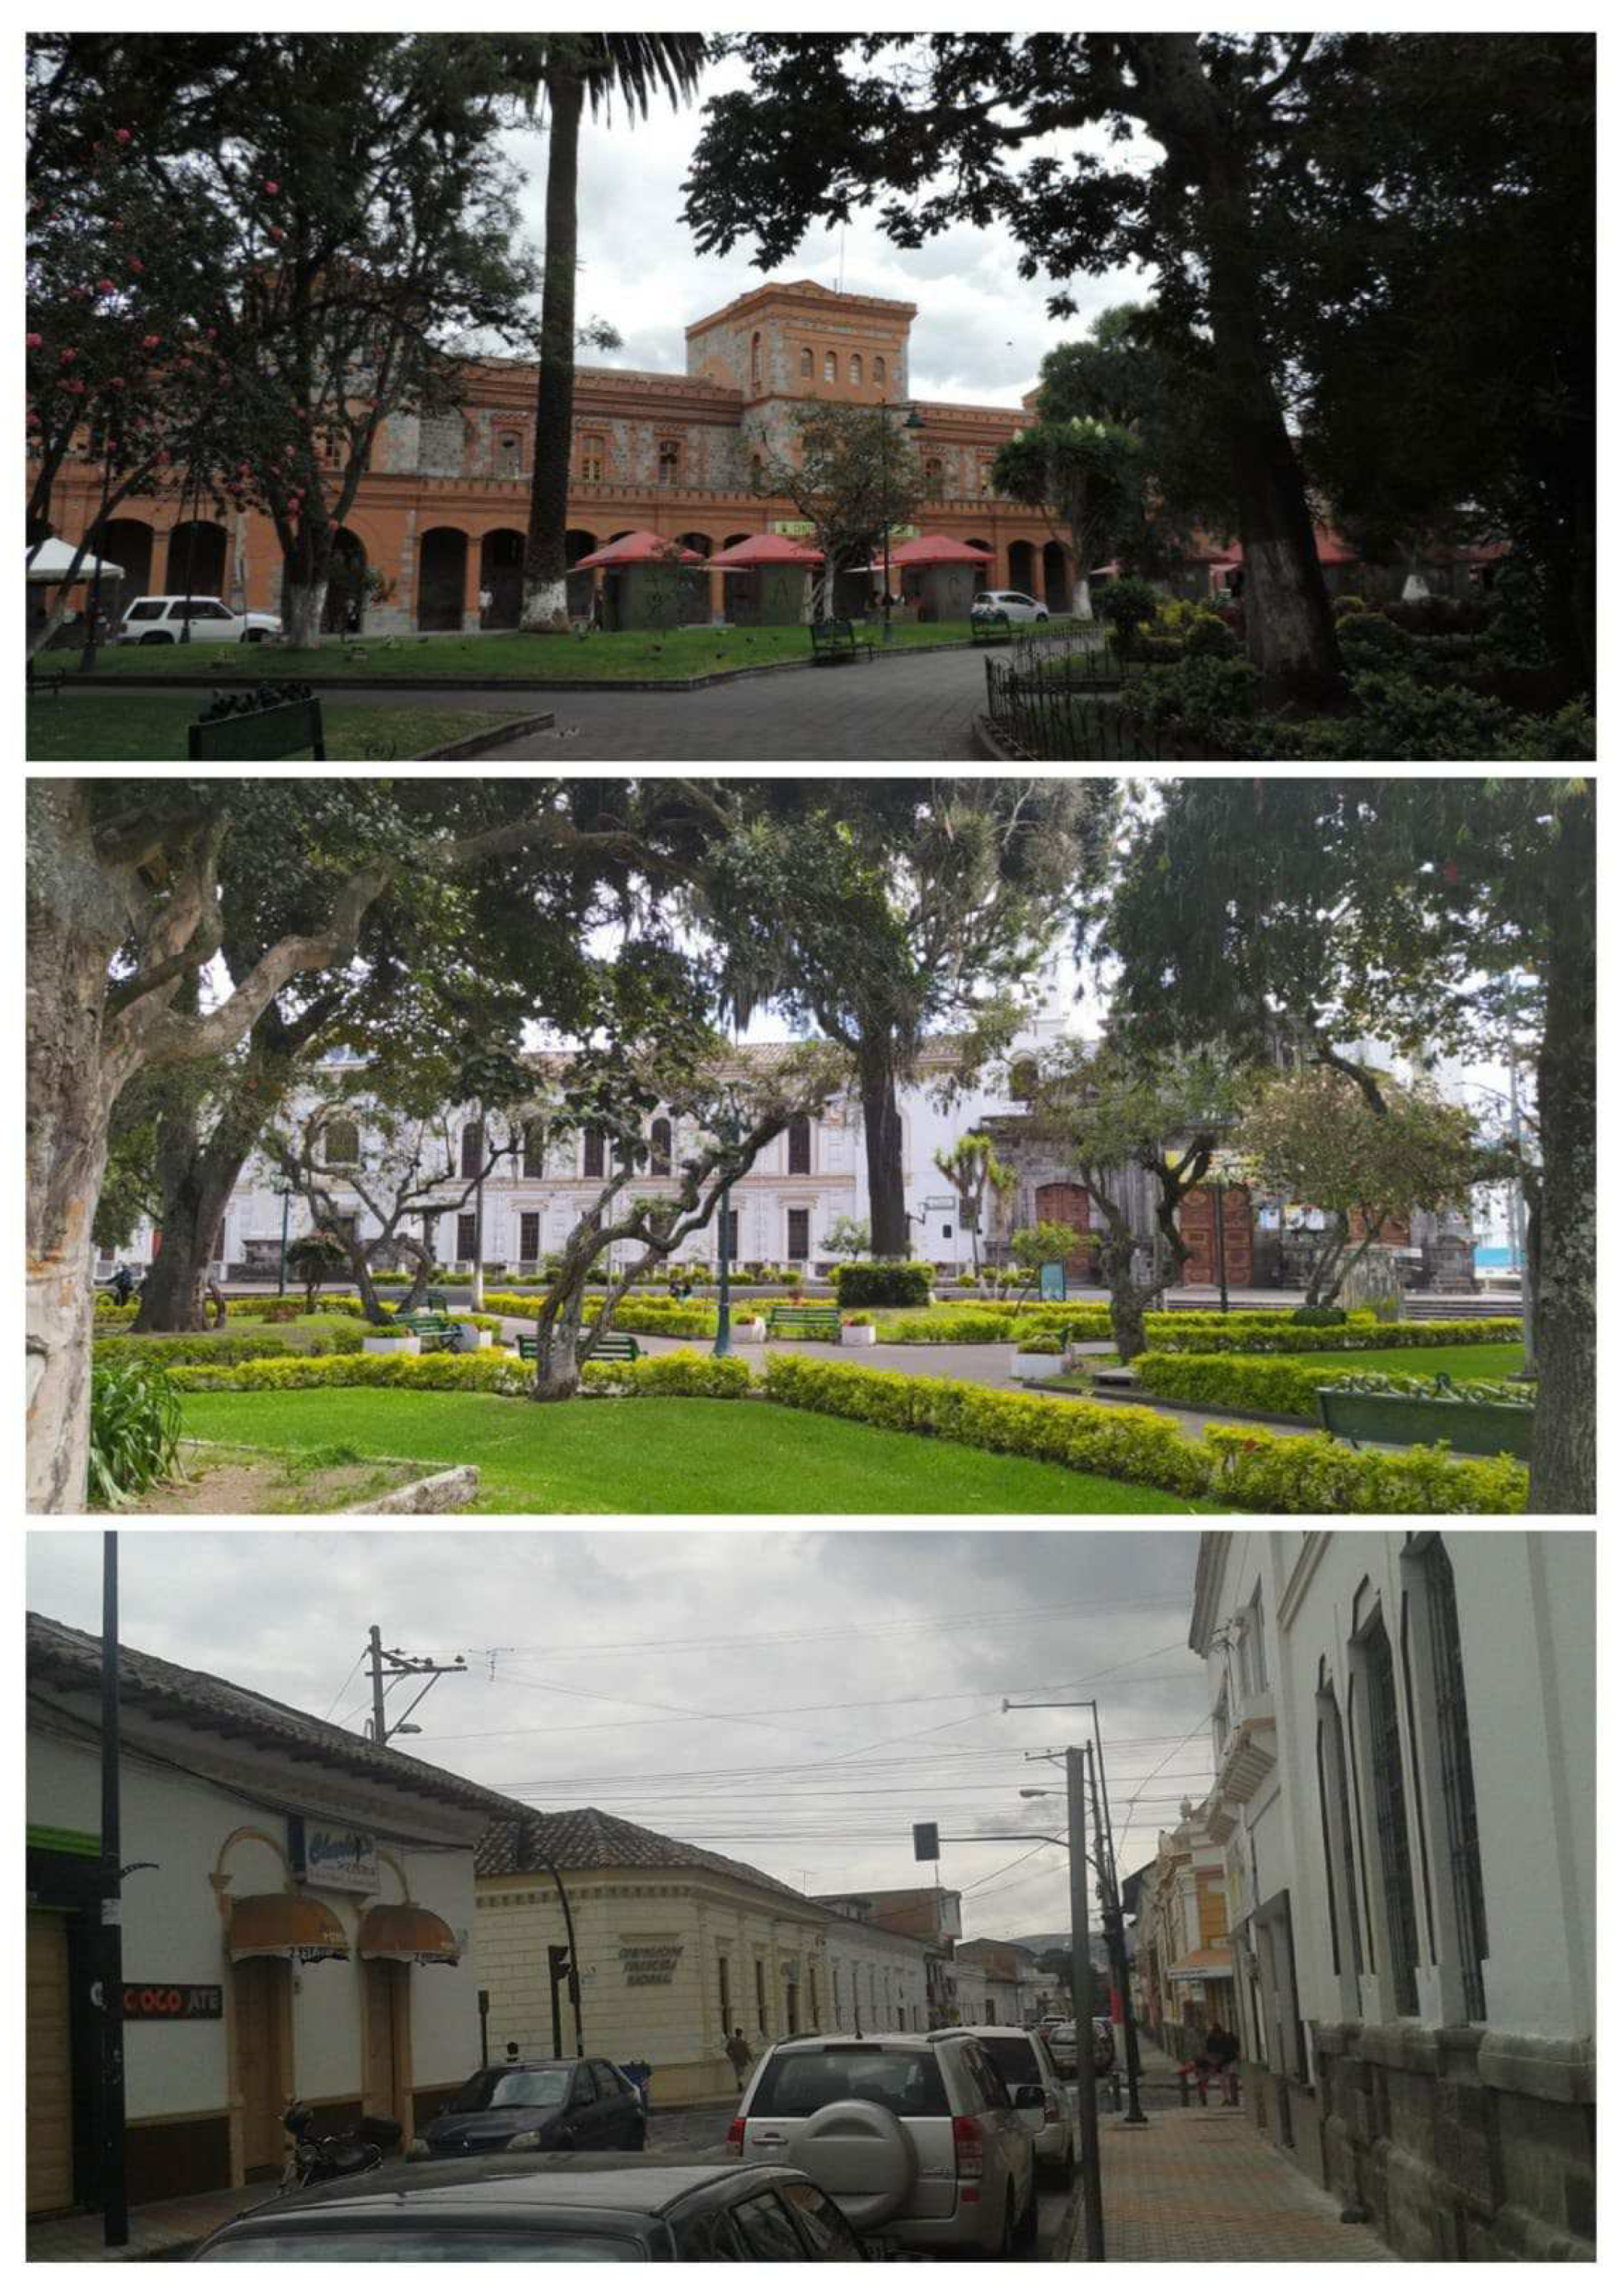
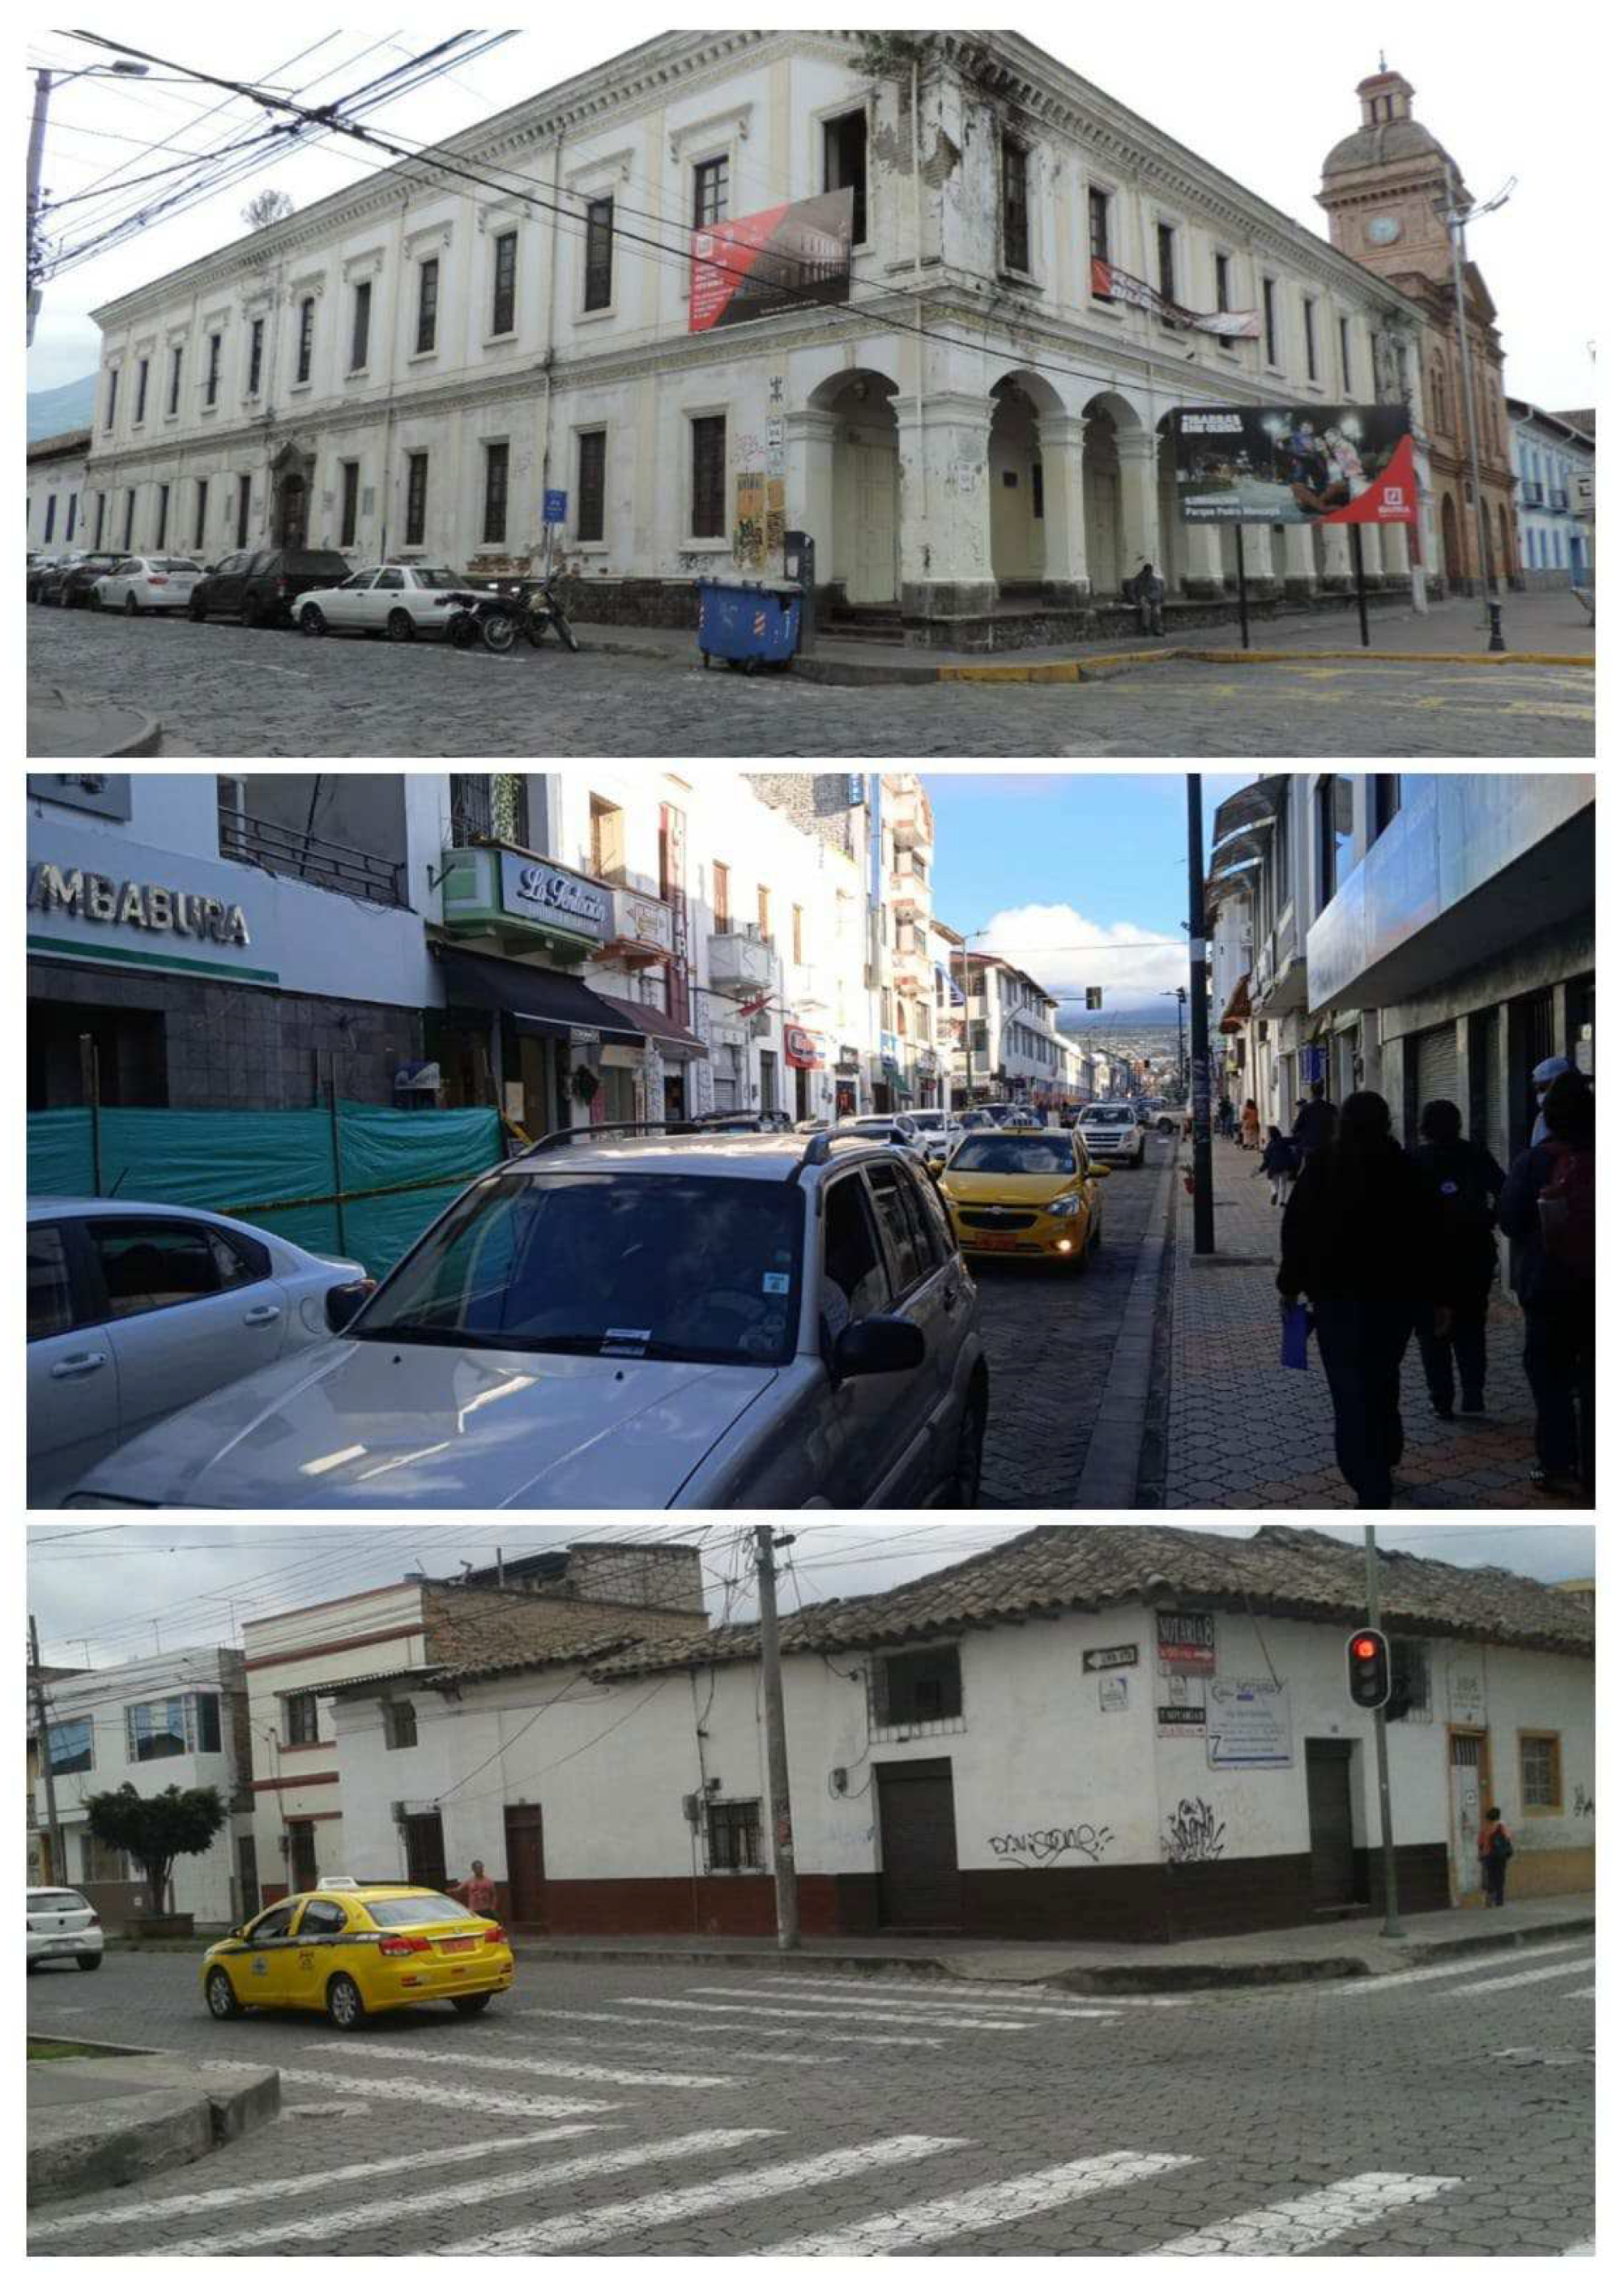
The three places that the interviewees like the most are El Cuartel, Pedro Moncayo Park and Bolívar Street (figure 3), located in the foundational nucleus, with 15%, 12% and 7% of the interviewees who mentioned them, respectively. These percentages were calculated in all cases considering the amplified sample, that is, giving the same interviewee the opportunity to mention several of them in a different order. The natural beauty and proximity between these places are determining reasons for people to identify them as liking.
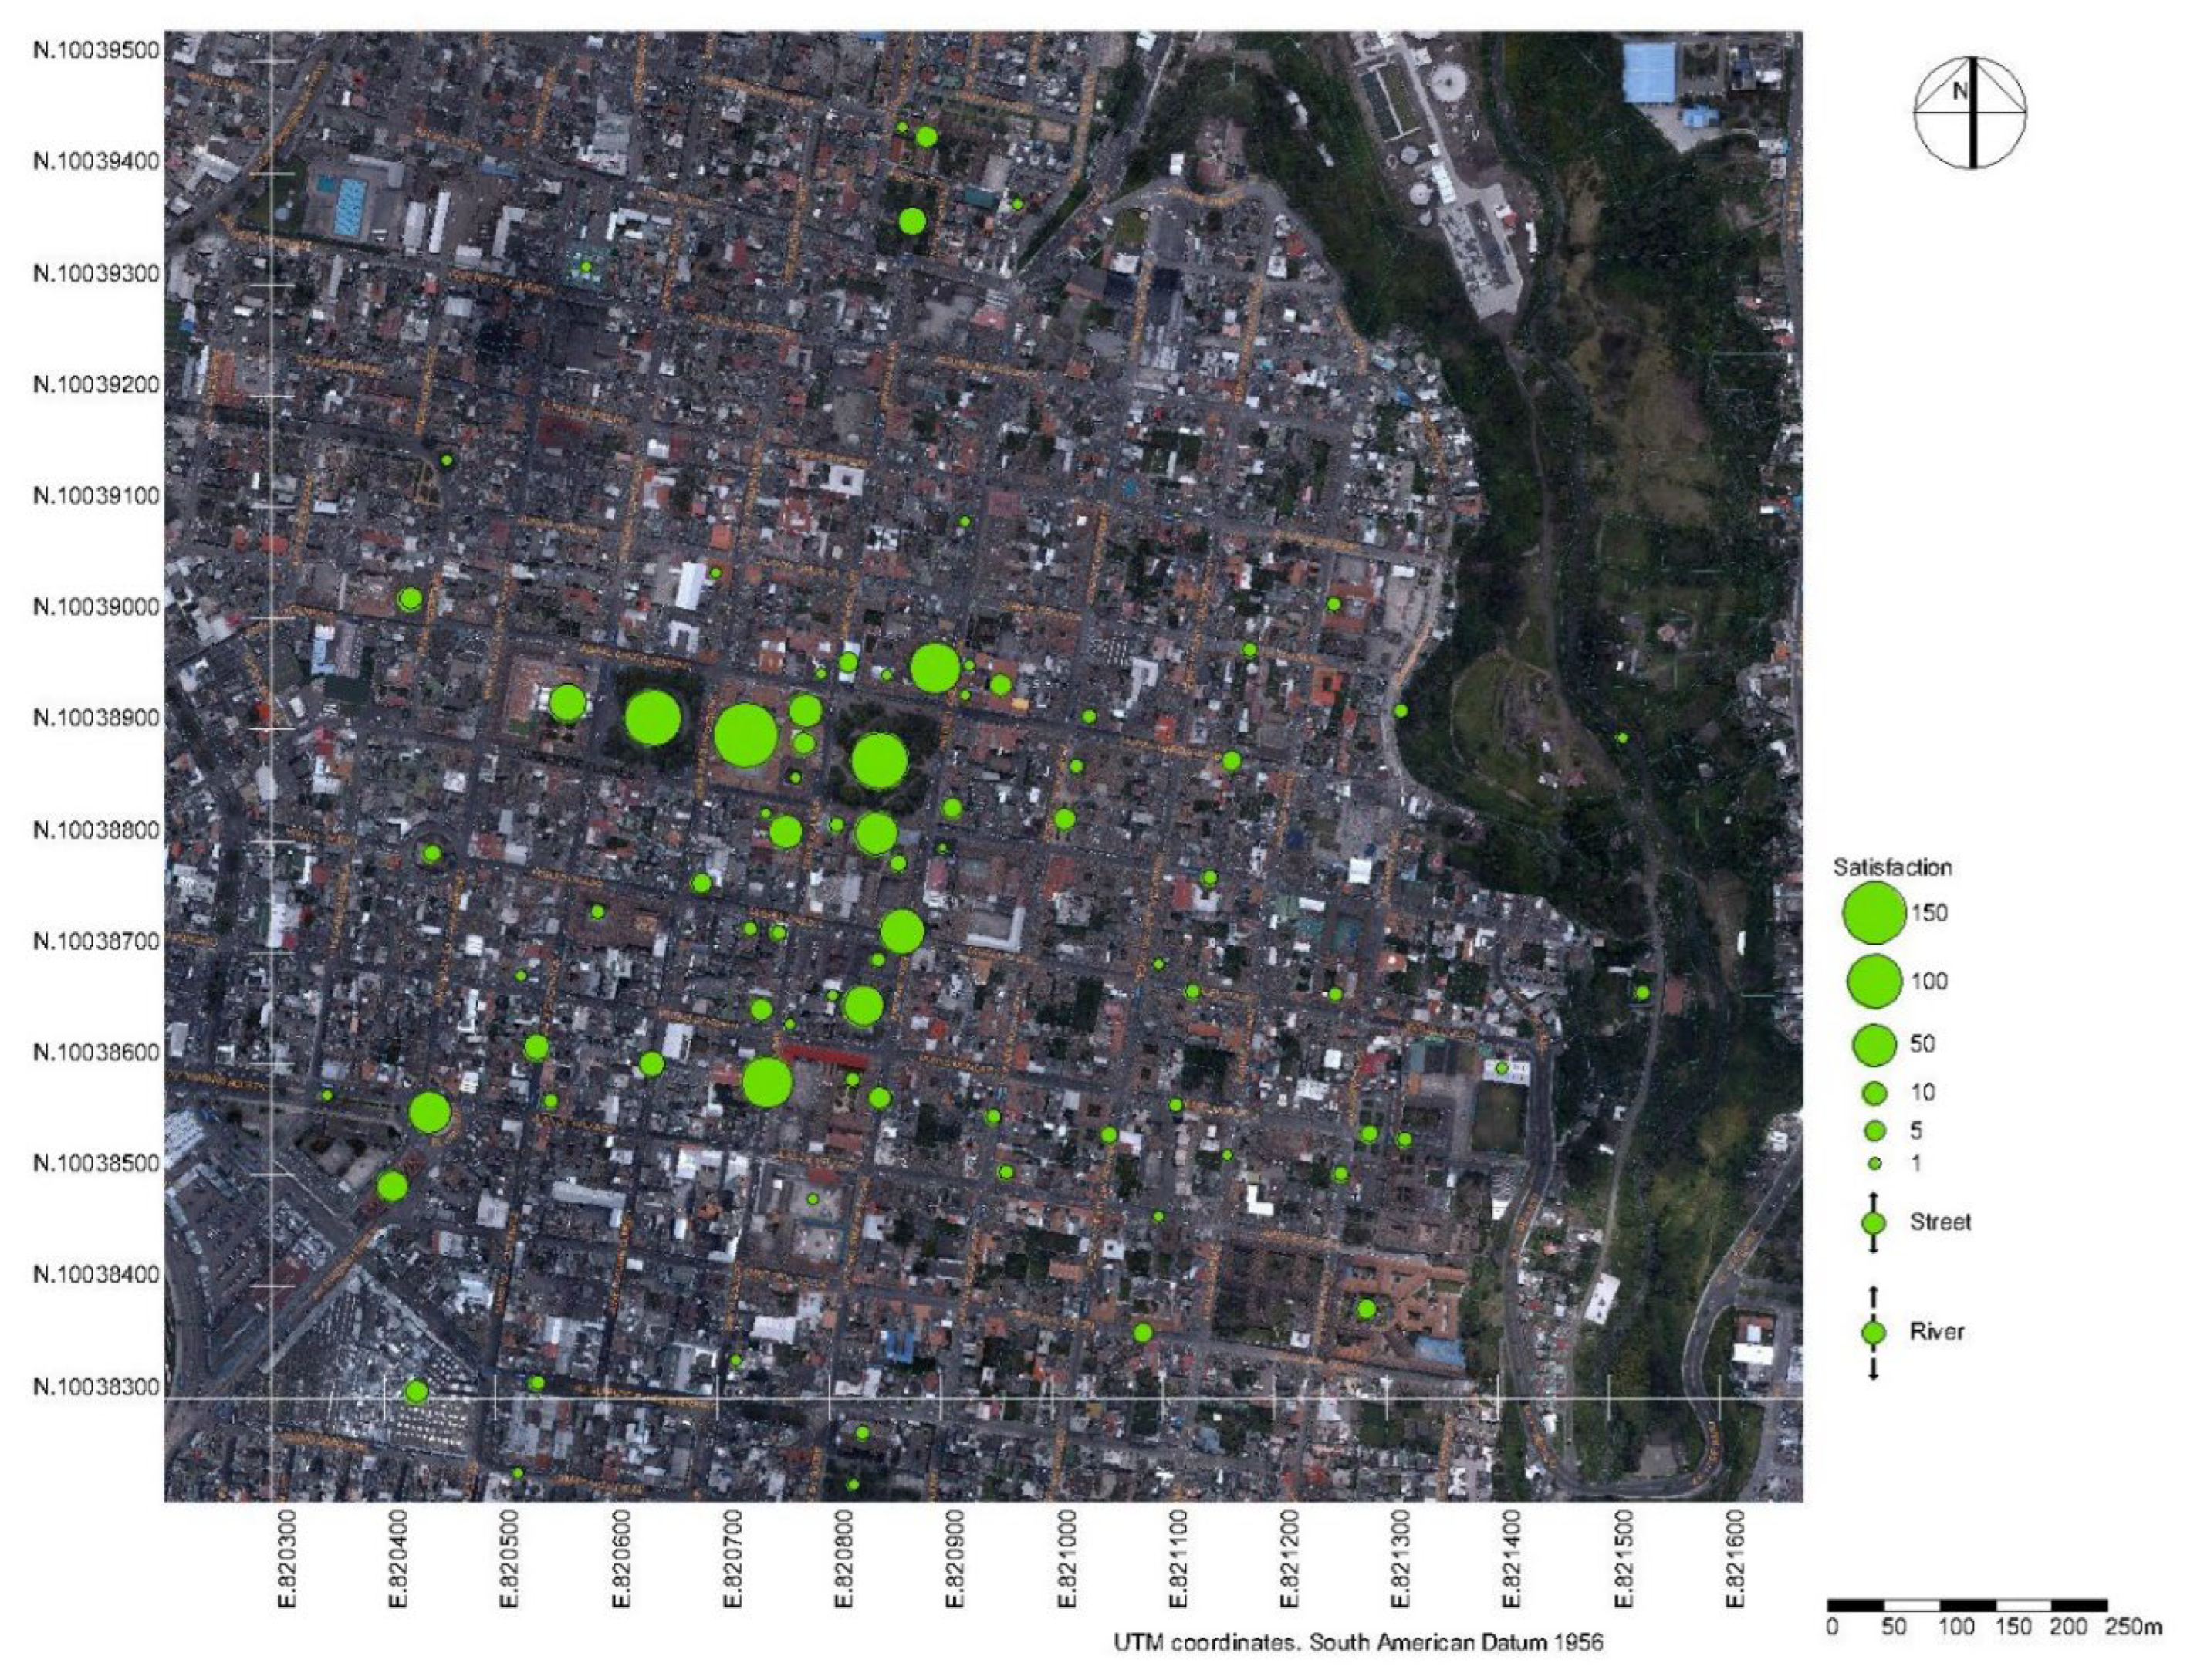
Figure 4 corresponds to a map where the places mentioned pleasant by the interviewees have been indicated. Proportionally, the frequencies with which these places were mentioned are added to the map.
The places mentioned are part of the heritage of the historic landscape. By proximity of the points identified in the map (figure 4), three sectors are observed:
  • The foundational nucleus in the center of the map, formed by the elements close to the Pedro Moncayo and La Merced Parks. In these places the natural elements are remembered as the reason for liked.
  • To the south, is the “Esquina del Coco”, Águila square, joined to Bolívar Street.
  • To the southwest, the Obelisk near train station.
The three sectors mark a sequence in the route from the center to the south, which may well be related to the frequency and intensity of use of these spaces. Bolívar Street stands out as the one that liking the most.
The Boyacá Park to the north with Santo Domingo church, although it is far and it is not mentioned with the same intensity as the previous ones, could constitute a fourth sector.

3.1.2. Description of Disliking

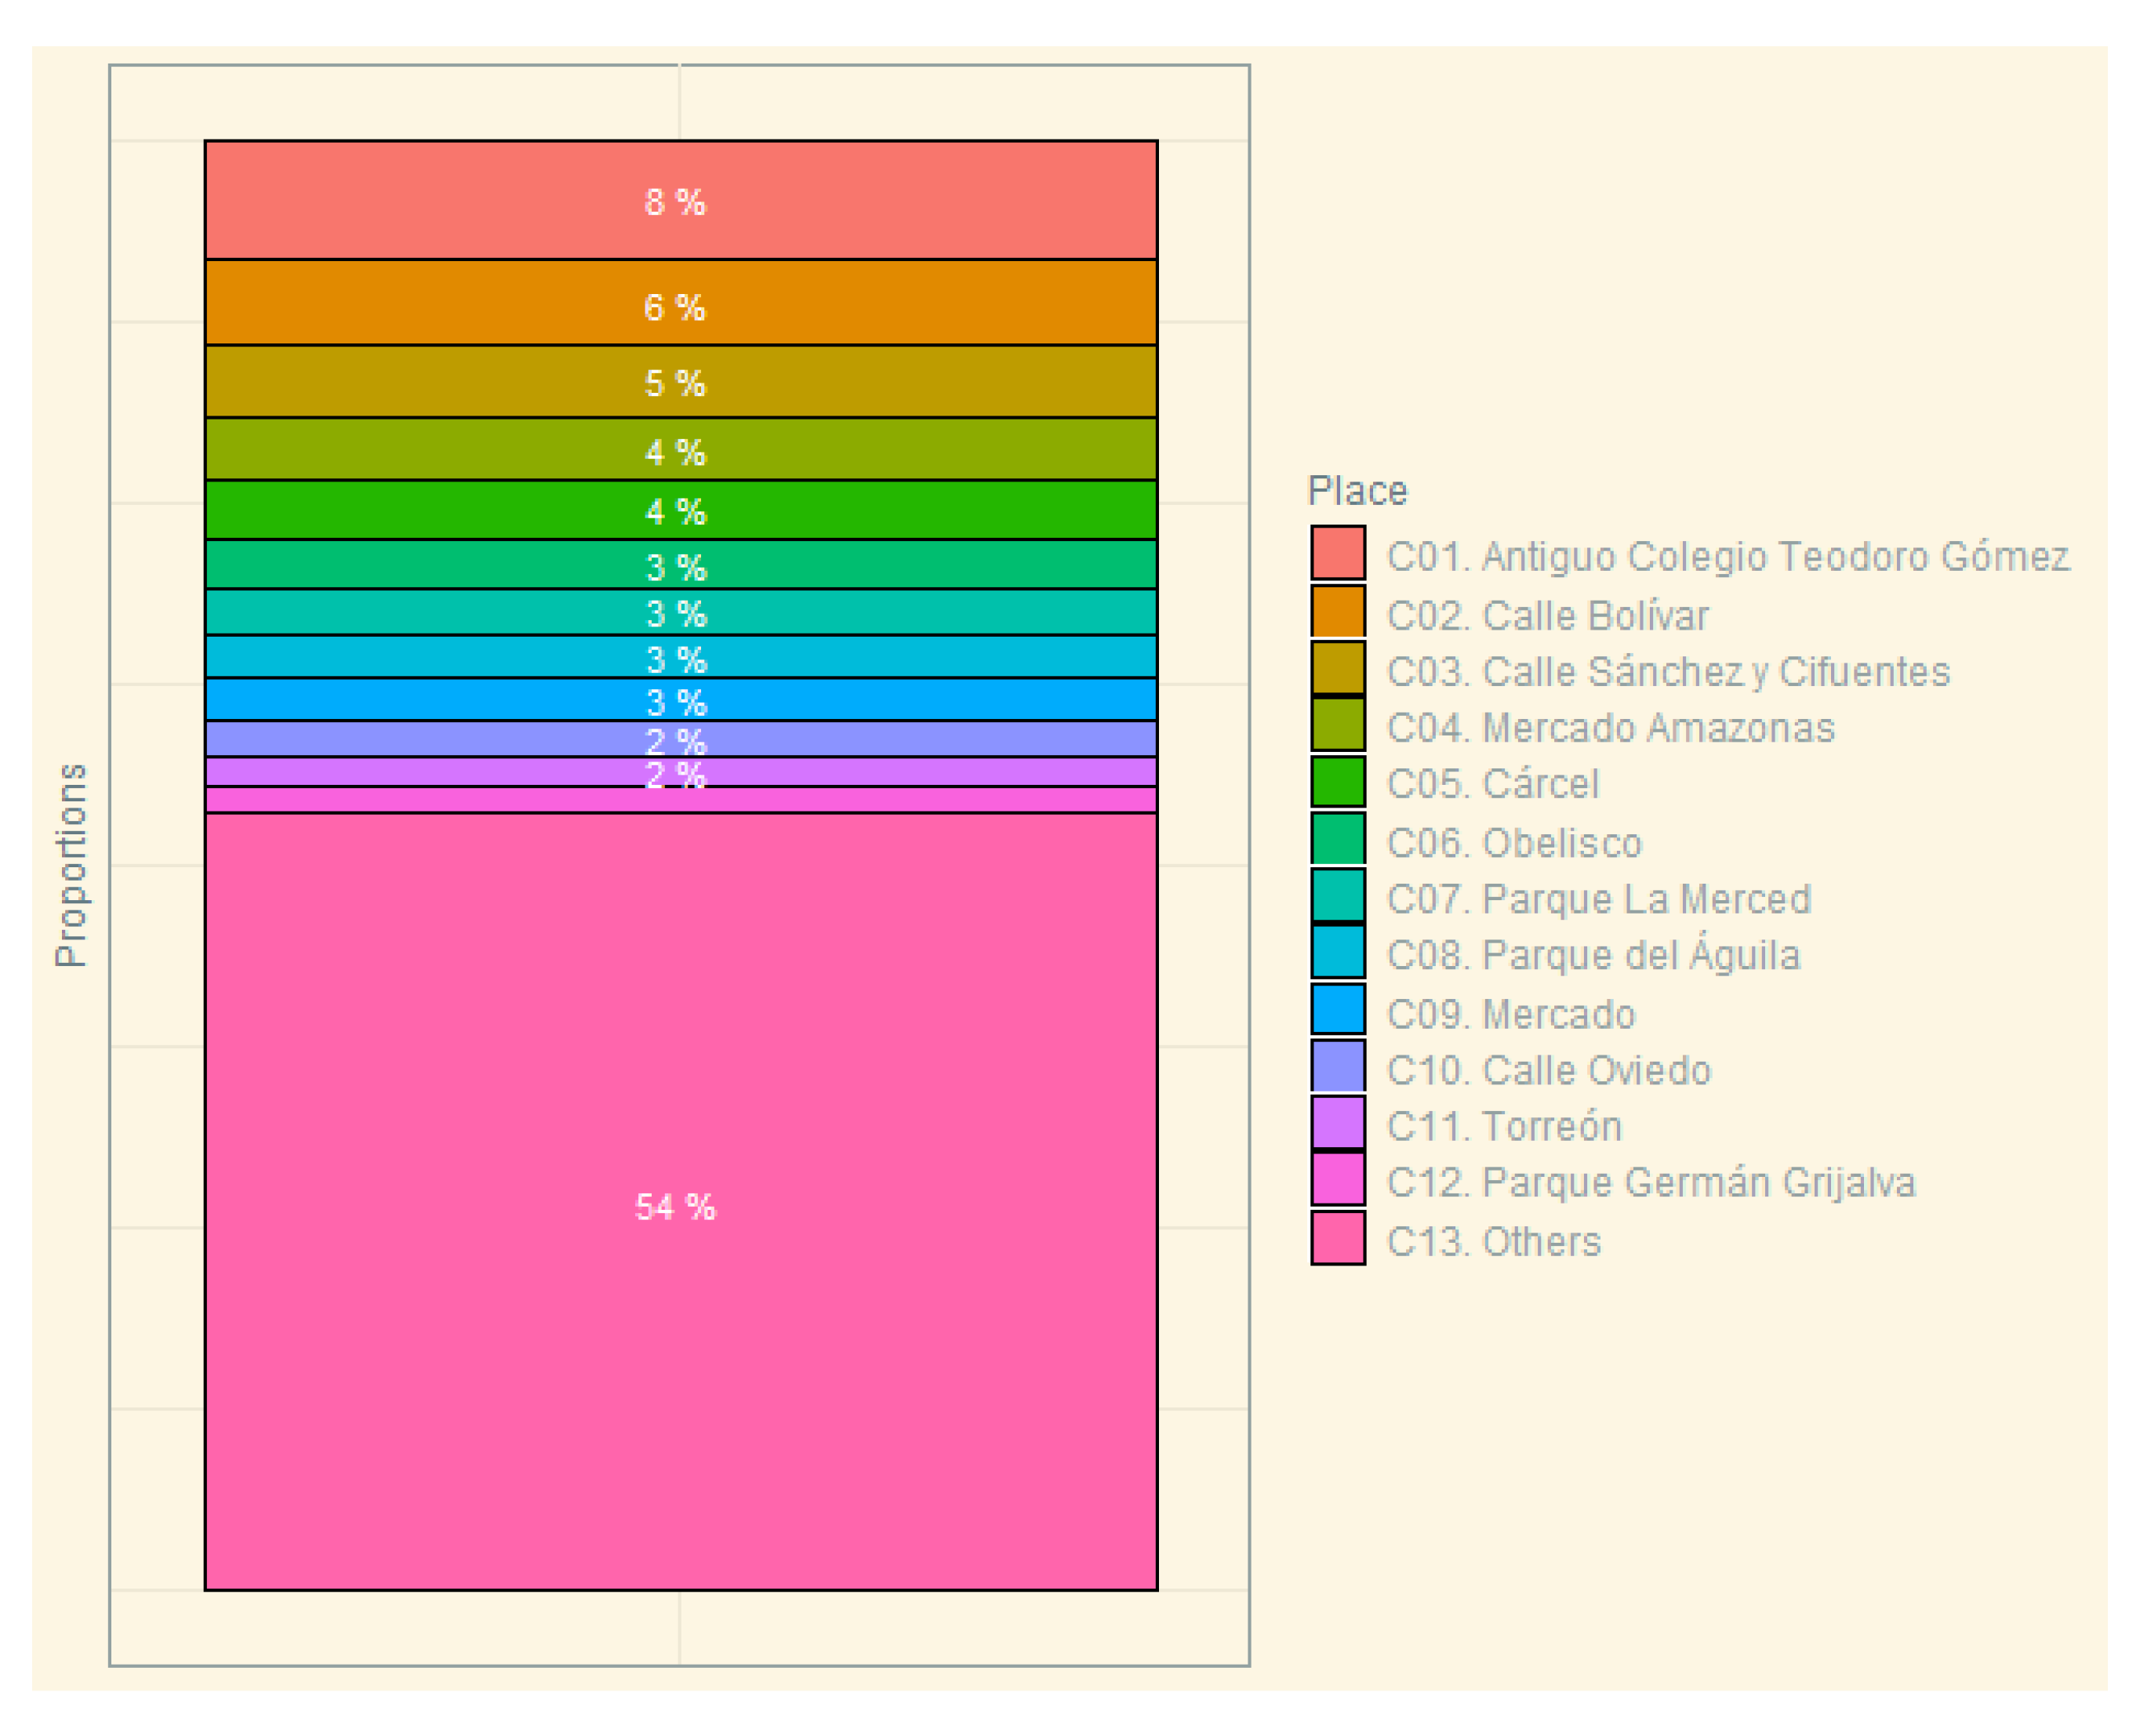
The interviewees mentioned a total of 217 different places in the historic landscape. Figure 5 shows the percentages of those 12 most frequently mentioned places.
The three elements that the interviewees most dislike are the old school Teodoro Gómez, and Bolívar, and Sánchez and Cifuentes streets, with 8%, 6% and 5% of the interviewees who mentioned them, respectively (Figure 6). As before, these percentages were calculated in all cases considering the amplified sample. It can be noted from the examination of figures 4 and 5 that there is greater consensus regarding liking than disliking, since in the latter case the dispersion of the places mentioned is greater.
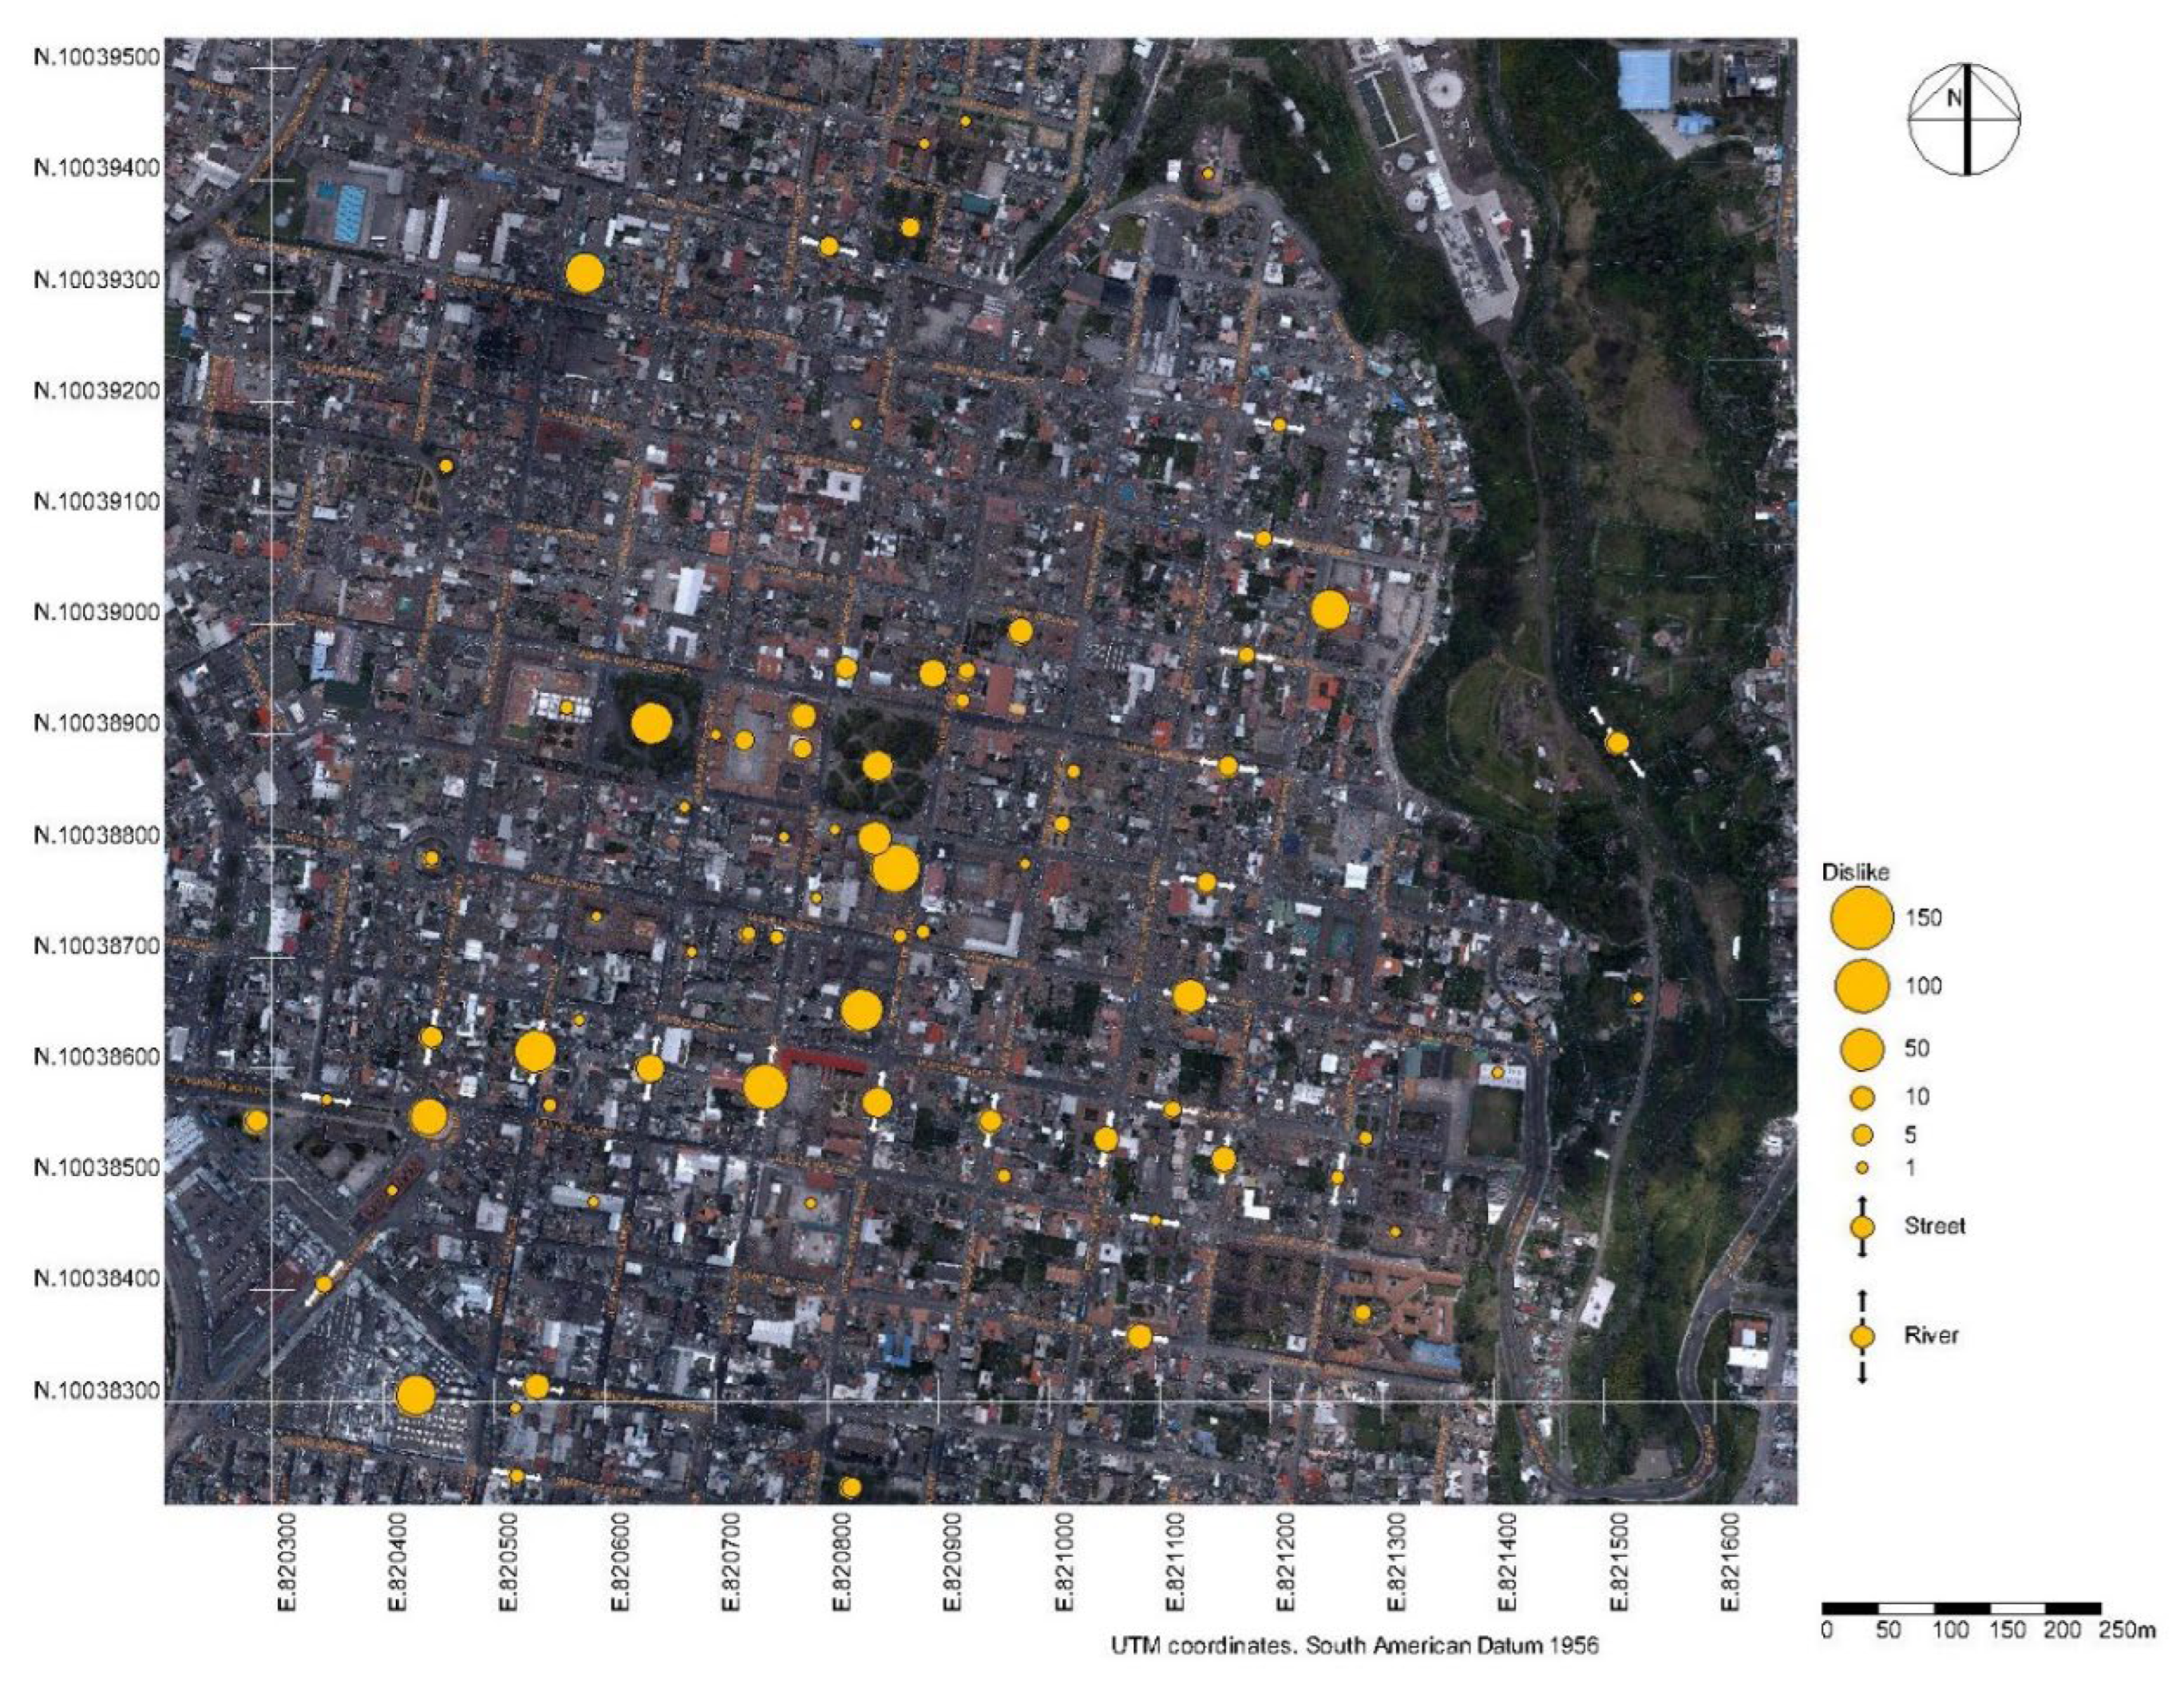
In Figure 7, the places mentioned as unpleasant are indicated. As before, proportionally, the frequencies with which these places were mentioned are added to the map.
Although the elements are more dispersed, Figure 7 highlights four grouped sectors:
  • The central nucleus (the Teodoro Gómez School and the Torreón, the Municipality and the La Merced and Moncayo Parks stand out).
  • To the southwest, the Obelisk and the Amazon Market.
  • To the northeast, the jail (“La Cárcel”), as a third sequence linked to the edge of the slope of the Tahuando River, a predominantly residential sector.
  • To the northwest, the Santo Domingo market linked to Boyacá Park to the north.
The elements are concentrated in the sites with institutional use.
All streets are identified on the map, highlighting Sánchez and Cifuentes from the Obelisk to the Church and La Merced Park. Sucre and Salinas streets in a north-south direction and Miguel Oviedo Street, in an east-west direction. Miguel Oviedo Street runs through the historic downtown. It is from the west edge (Roundel “Cabezas Borja”) passing through the “Esquina del Coco” and ending to the east (San Francisco school) and the Stairway to the slope of 17 de Julio. Along Sucre Street, the largest number of disliking elements identified by people are concentrated. The jail (“La Cárcel”) is located to the northeast with Salinas Street.

3.2. Net Liking Description

The net frequency of the mention of each object has been calculated considering liking mentions with positive numbers and disliking with negative numbers.
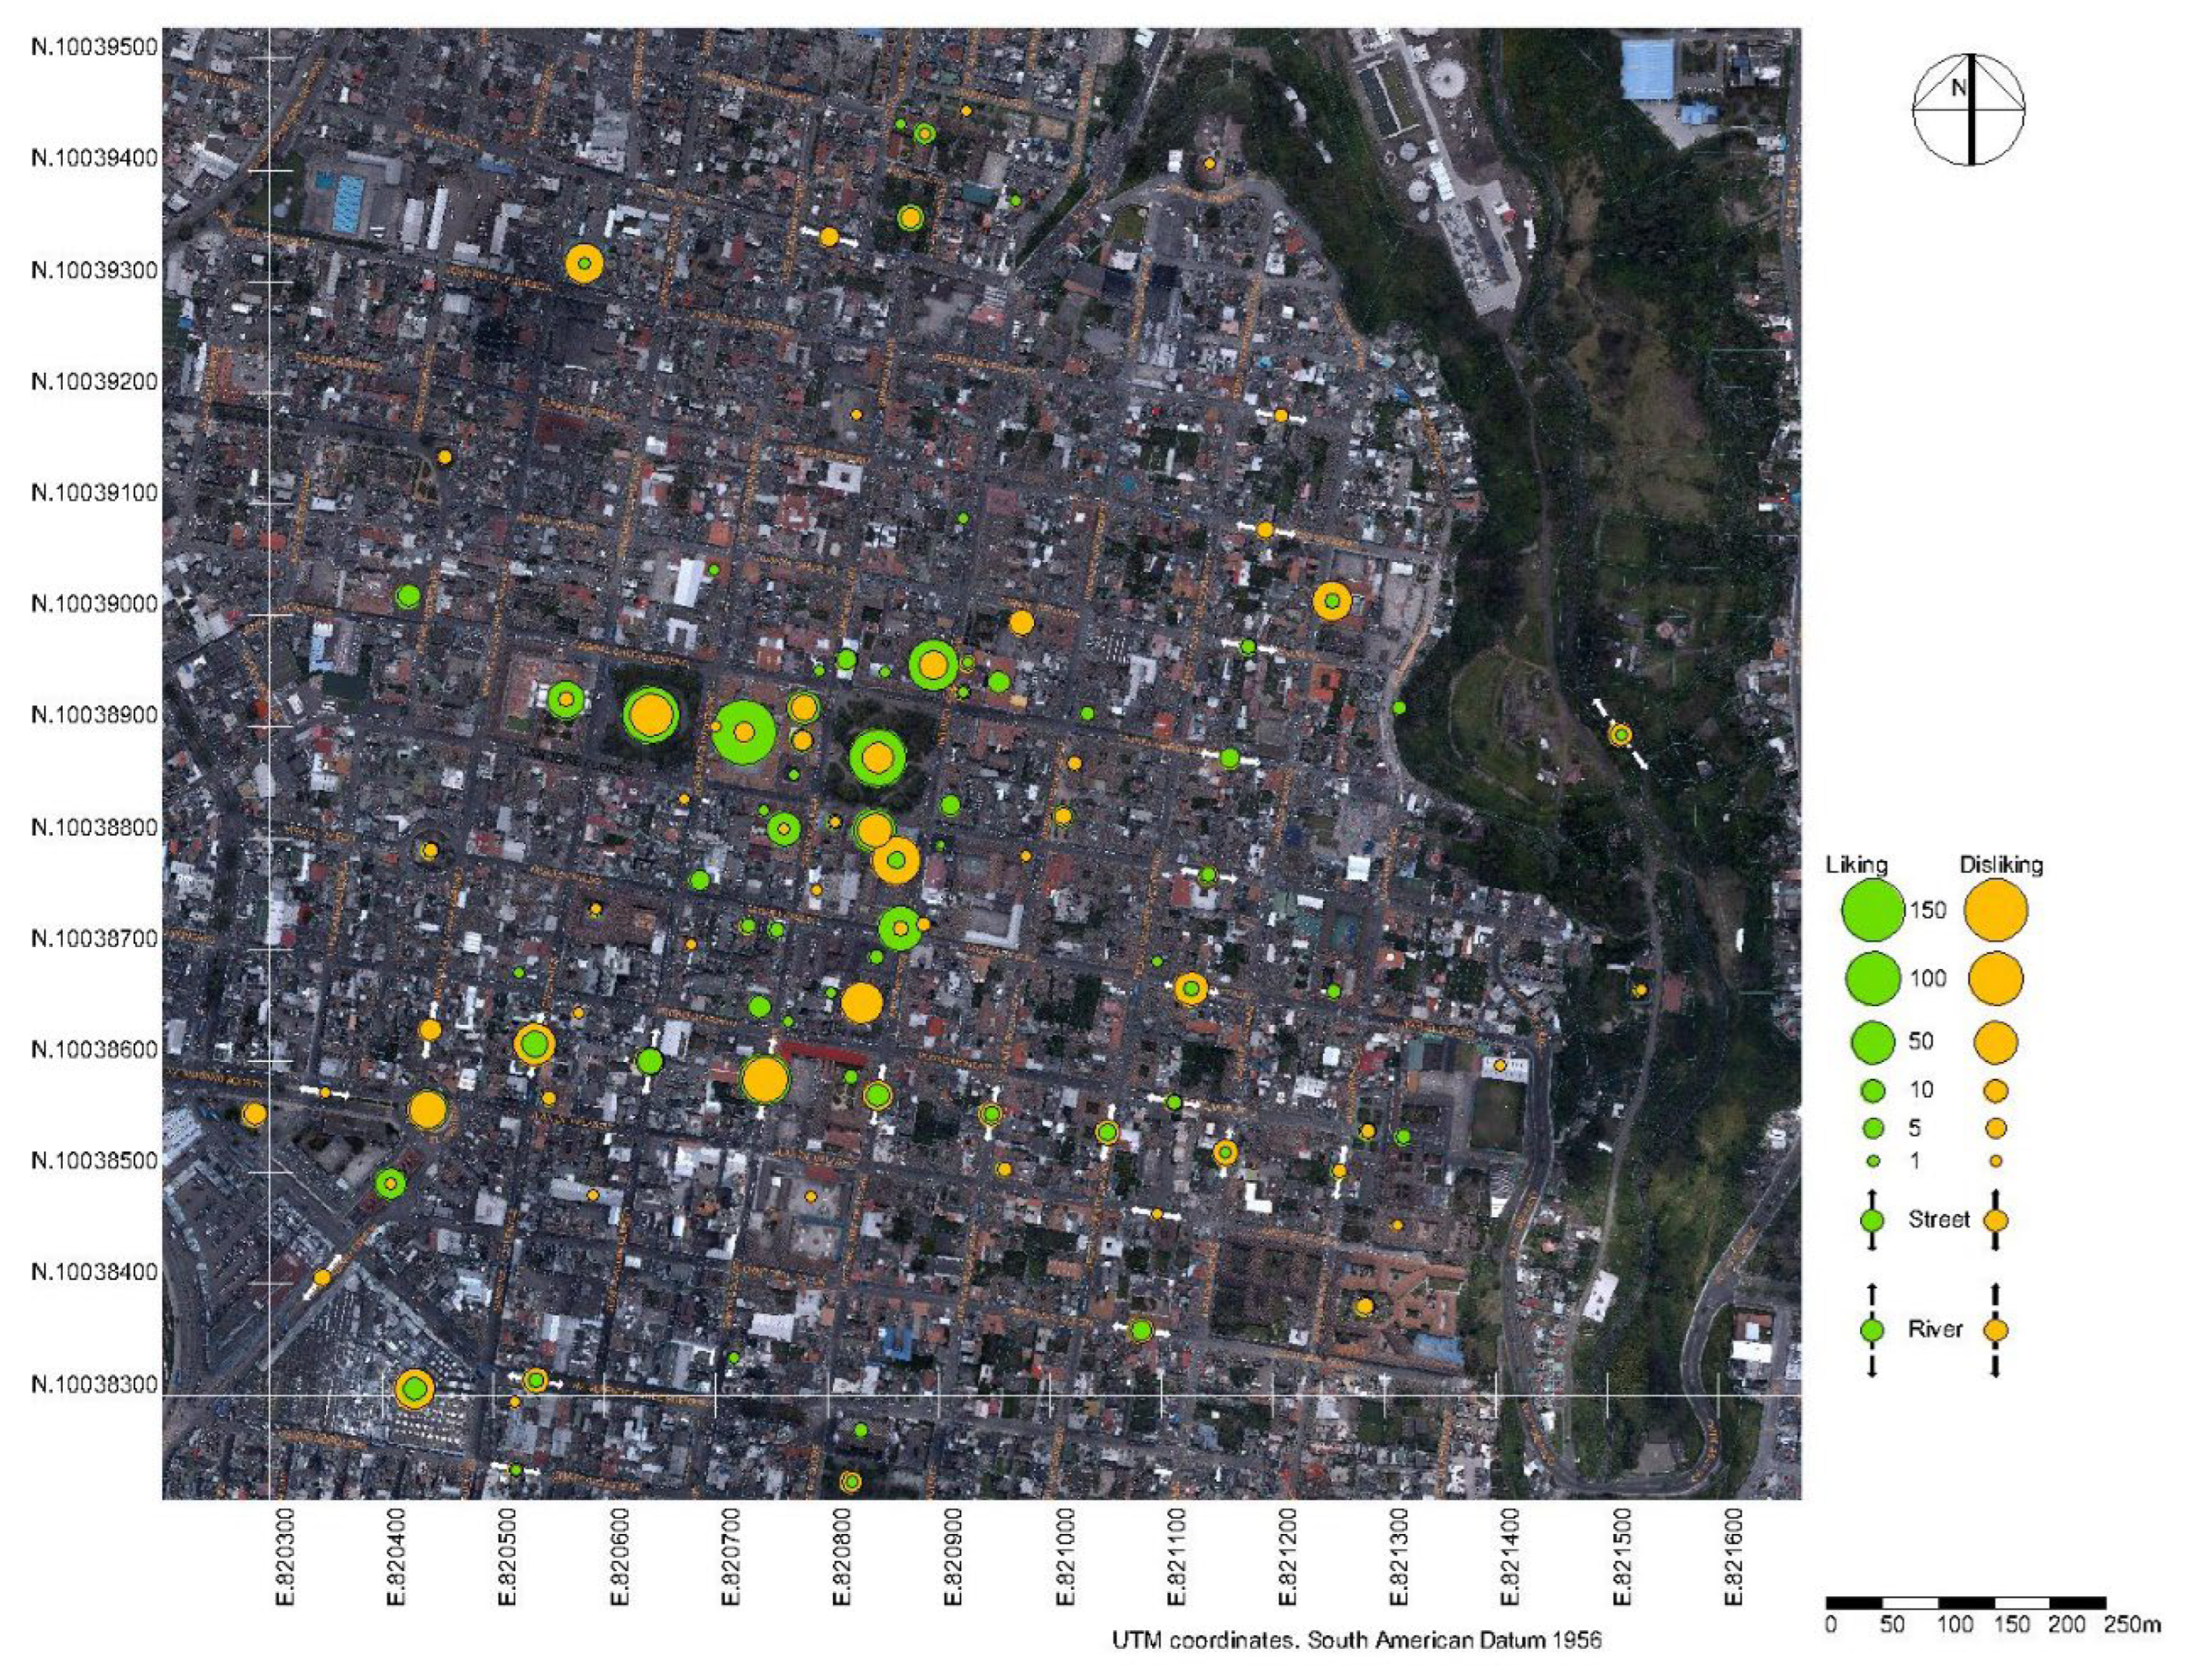
Figure 8 shows the places mentioned, both liking and disliking, displayed together. Two points with the frequencies with which these places were mentioned are added proportionally to the map, placing the lowest frequency in the foreground and the highest in the background.
From the liking and disliking overlap, the elements are concentrated in the central core of the study area.
  • The Cuartel, Pedro Moncayo Park, La Merced Park, the Cathedral stand out for the pleasure they represent. For the church of La Merced and the house of Ibarreñidad, liking diminishes. Of this central nucleus, the Old Teodoro Gómez School stands out due to felt disliking. Towards the south, the “Esquina del Coco”, shows more liking than disliking.
  • “Santo Domingo” market to the northwest, shows greater disliking.
  • The jail (“La Cárcel”) to the northeast shows greater disliking.
  • The train station and the Obelisk to the southwest, complete the access to the historic downtown as places that like and dislike, respectively.
As for the streets, Bolívar stands out as the most liked. Sánchez and Cifuentes, Oviedo, Germán Grijalva, Sucre and Salinas streets are the most unfavorable areas of the study sector.
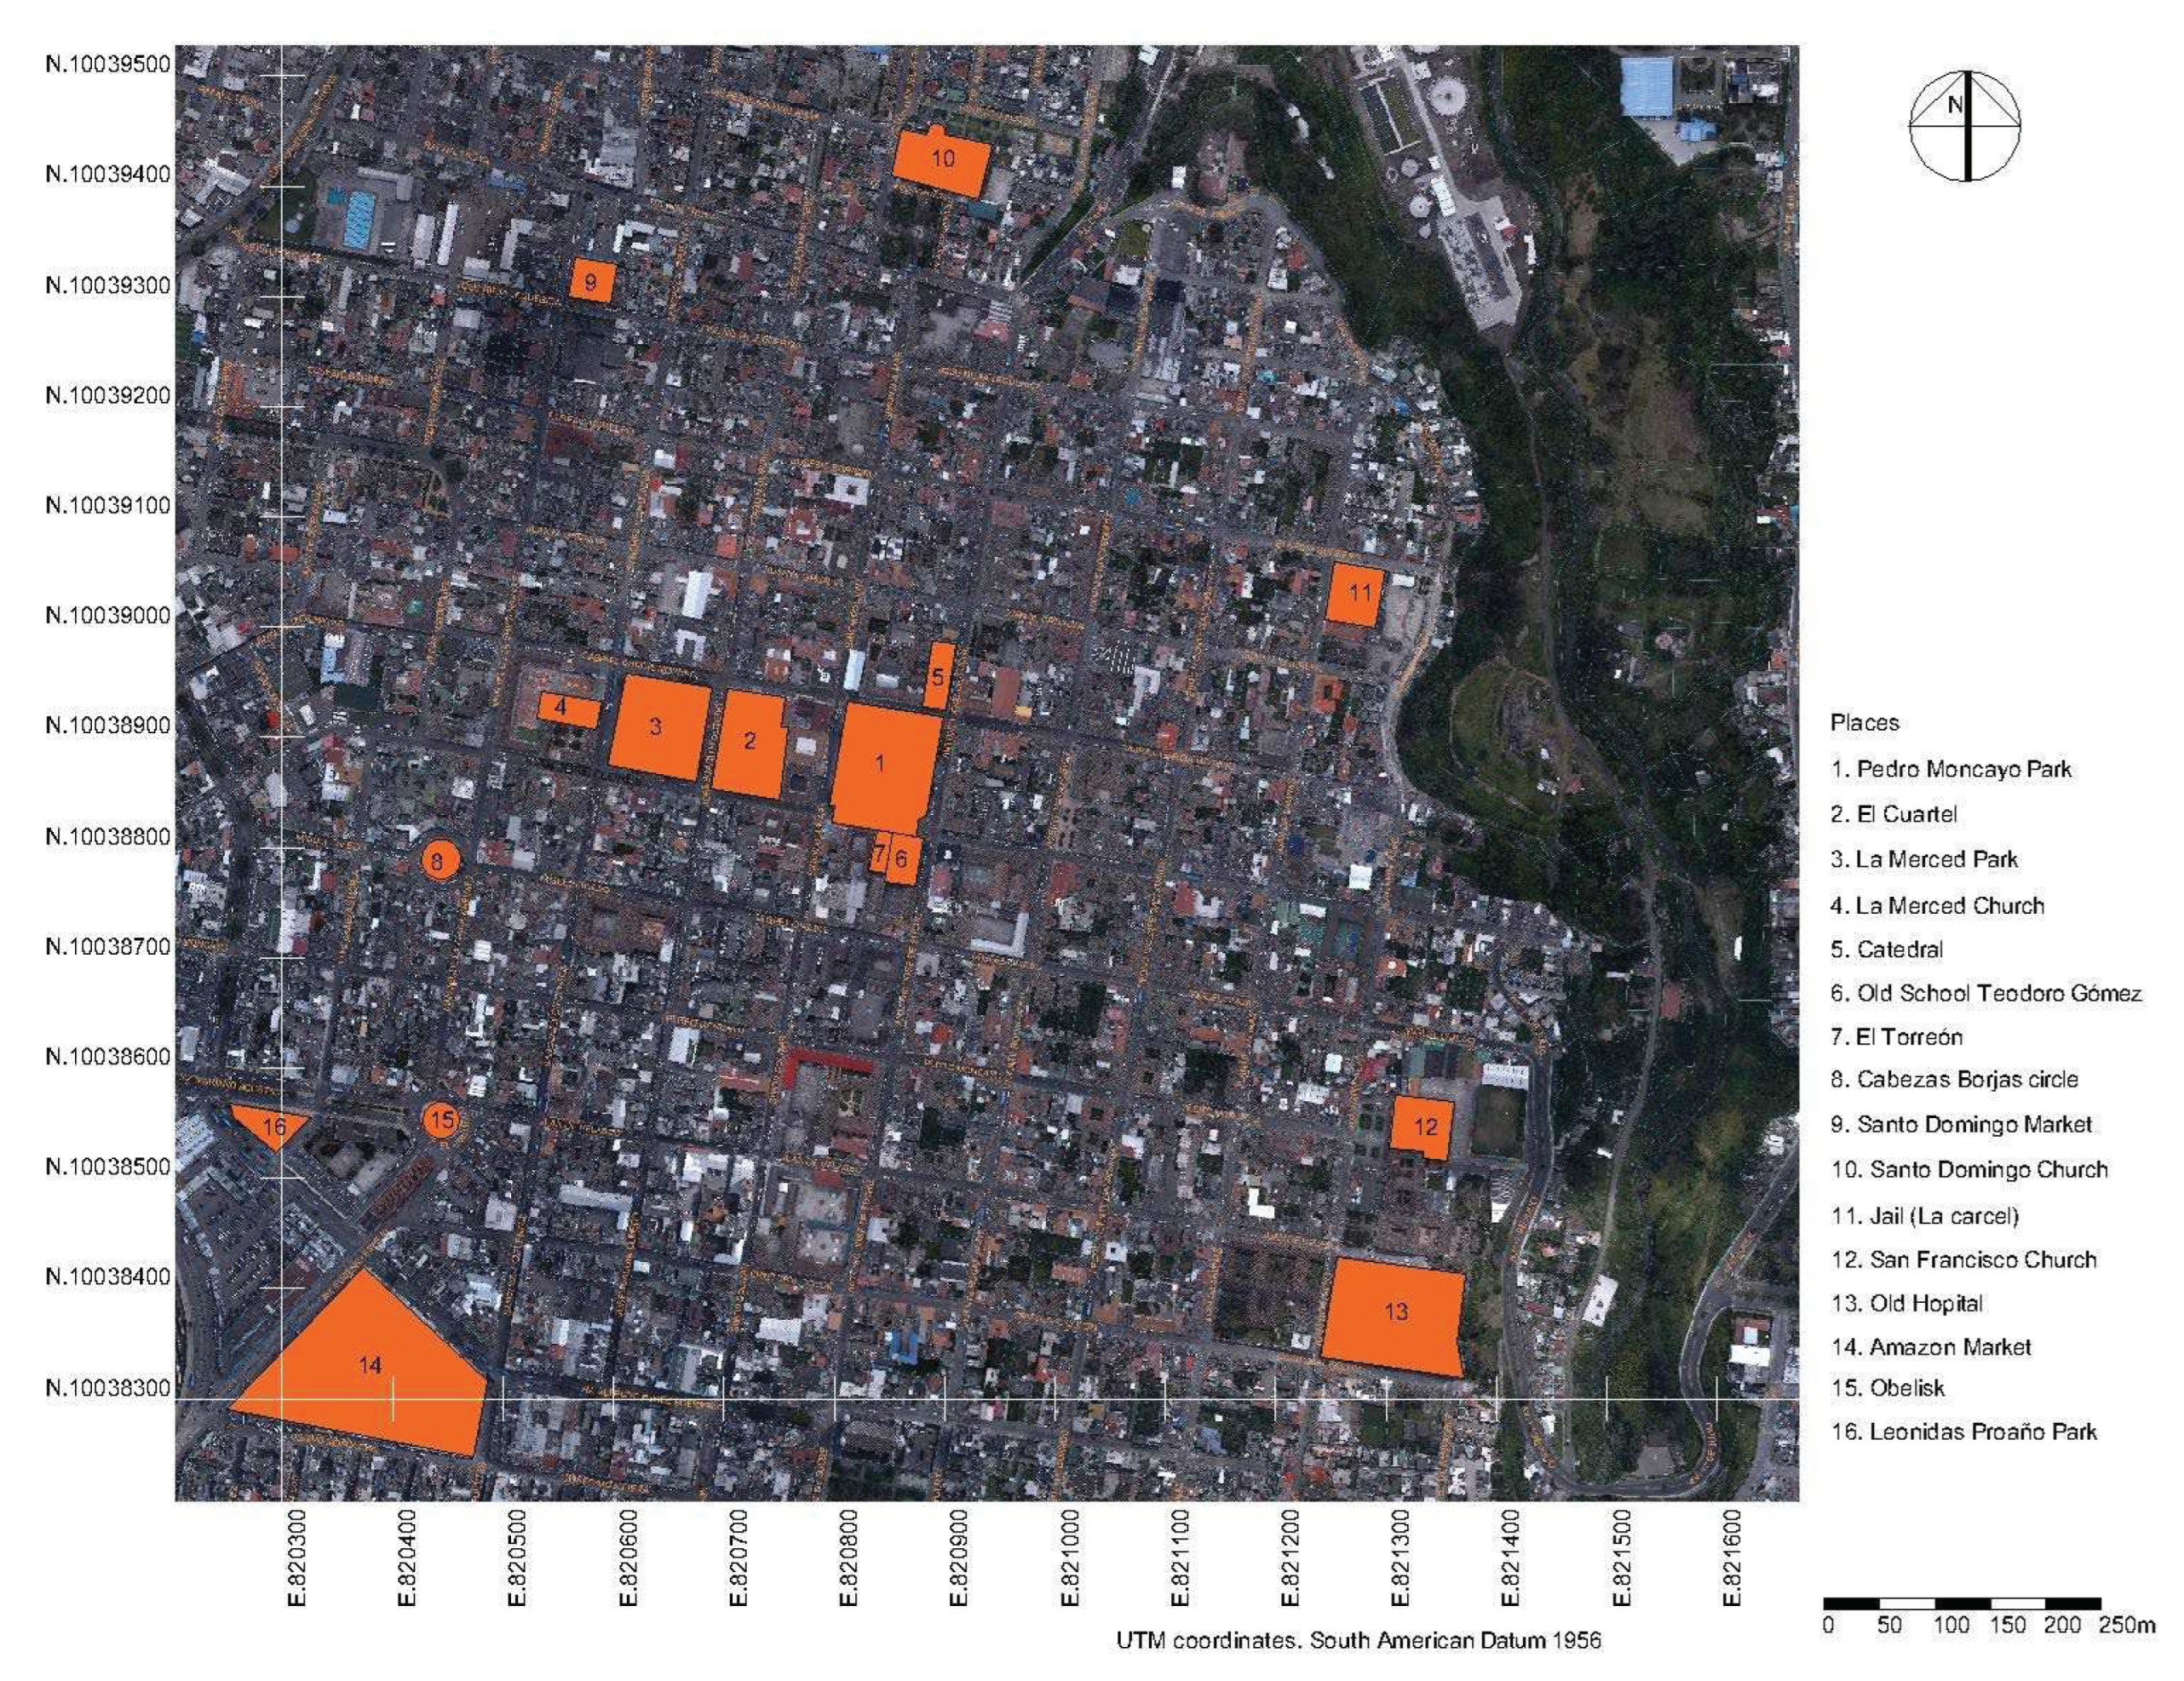
The Map shows us liking and disliking places and buildings identified by his names (Figure 9).

3.3. Explanatory Analysis of Liking

For each of the 150 buildings or places that are liked, an attempt is made to fit a logistic regression model, dichotomizing the response variable as: The place is mentioned/The place is not mentioned. The probability of success p i j corresponds to the probability that the i-th interviewee has mentioned the j-th place as pleasant. The explanatory variables selected in all cases are gender (Gender), age (Age), educational level attained (Level) and frequency of visits to the sector (Frequency). That is:
l o g i t p i j = μ + G e n d e r i j β 1 + A g e i j β 2 + L e v e l i j β 3 + F r e q u e n c y i j β 4
i=1,2,⋯,1150; j=1,2,⋯,150.
Only Age is a quantitative variable, so the parameter β 2 is a scalar. Gender is a factor at 2 levels (Masculine, Feminine) so the parameter β 1 is a representation of the parameters that accompany each level. Level is a factor at 6 levels (Neither reads nor writes, Reads and writes, Primary, Secondary, University, Postgraduate) so, likewise, β 3 is a representation of parameters that accompany each level. Frequency is at 3 levels (Little, Quite a lot, Much) so, also, β 4 is a representation of parameters that accompany each level. The parameter μ represents an intercept.
Only twelve of the 150 places (8%) show evidence of association between the explanatory factors considered and the response. For the rest, the fitted model is not conclusive. Table 1 reproduces the mentions received for each place as well as the probability values associated with the estimated test statistic for each factor, using the deviance test. Values less than 0.1 have been highlighted as significant, considering a confidence level of 90%, which, in this case, has been considered reasonable.

3.4. Explanatory Analysis of Disliking

For each of the 217 disliked buildings or places, an attempt is made to fit a logistic regression model, as before, by dichotomizing the response variable as: The place is mentioned/The place is not mentioned. The probability of success p i j corresponds to the probability that the i-th interviewee has mentioned the j-th place as unpleasant. The explanatory variables selected in all cases are again gender (Gender), age (Age), educational level achieved (Level) and frequency of visits to the sector (Frequency). That is:
l o g i t p i j = μ + G e n d e r i j β 1 + A g e i j β 2 + L e v e l i j β 3 + F r e q u e n c y i j β 4
i=1,2,⋯,929; j=1,2,⋯,217.
The characteristics of the explanatory variables are the same mentioned for liking.
Only twenty-two of the 217 places (10.14%) show evidence of association between the explanatory factors considered and the response. Table 2 reproduces for each place the mentions received as well as the probability values associated with the estimated test statistic for each factor, through the deviance test. As before, values less than 0.1 have been highlighted as significant, considering a confidence level of 90%.

4. Discussion

In those buildings or places in which the association has been established through the logistic regression model, the factors of liking considered were significant in the following opportunities:
  • Gender in 4 opportunities,
  • Age 5 times,
  • Level in 2 opportunities.
  • Frequency in 3 opportunities.
Age, Gender, Frequency and Level, in that order of importance, are factors that explain the classification of buildings in terms of liking.
Since the disliking, in those buildings or places in which the association could be established through the logistic regression model, the factors considered were significant in the following opportunities:
  • Gender in 7 opportunities,
  • Age 8 times,
  • Level in 2 opportunities.
  • Frequency in 11 opportunities.
Now, the order of importance is Frequency, Age, Gender, and Level as factors that explain the classification of buildings in terms of dislike.
On the other hand, decisions to intervene in the historic downtown can be made by municipal (or regional or national) authorities and by private individuals. In any case, it is logical to assume that the objectives that are proposed when investing are at least two:
  • Mitigate the public's perception of dislike for the historic downtown.
  • Strengthen the perception of the public's liking for said sector.
Both objectives are not necessarily contradictory unless the availability of funds is limited. This means that, given sufficient funds, both could be addressed at the same time. However, otherwise, it is reasonable to think that mitigating the unpleasantness is more important than enhancing the pleasantness (which, in any case, must be preserved with an adequate maintenance policy).
For landscape under study, we assumed that the investments will be made in the places or buildings that the interviewees mentioned as disliking, however, how to decide which places should preferably receive improvement investments?
A first answer to this question is to consider the frequency of mention of disliking in descending order. From the results shown in figure 5, we have five investment priorities for the objective of mitigating the disliking perception among citizens. These priorities are the following: Old Teodoro Gómez School, Bolívar Street, Sánchez and Cifuentes Street, Amazonas Market and Jail.
However, this list was composed with the opinion of all those interviewed, without consideration conditions of gender, age, educational level, or to frequent the place. It is therefore reasonable to consider validating this list by taking these variables into consideration, in the order of importance indicated, in more detailed future studies.
On the other hand, if the investment objective is to promote the buildings that liking, from figure 2 the following list is obtained, now in descending order of liking: El Cuartel, Pedro Moncayo Park, Bolívar Street, La Merced Park and “Coco” corner. Again, it is worth validating this list taking into consideration the explanatory factors mentioned. In any case, an order of priority is provided for elements and spaces that need to be maintained or improved, even if they are considered due to their proximity on the maps.

5. Conclusions

The hypothesis raised that identified main elements or remembered are related to subject characteristics is confirmed. Frequency of visit the place was important for disliking identified elements, age and gender was important to liking. Apparently, the educational level of the interviewee is less relevant. This result, although it does not refute the hypothesis of Aguilar who points out that “the aesthetic pleasure that the landscape grants is, without a doubt, an educational process that has all its references in culture...” (Aguilar, 2006), adds the element of familiarity with sector. In this perspective, people remember objects or spaces by the type of daily interaction. Moreover, reaffirmed by Mondschein, Blumenberg and Taylor.
The first objective made it possible to identify the elements and spaces remembered and to precise in maps the places that concentrate what is liked or disliked. From there, spatial sequences and patterns through the streets that require intervention actions can be read. The historic landscape has a very consolidated central nucleus, where actions are necessary to reduce the displeasure expressed by people about the old Teodoro Gómez School.
Despite having a respectable number of buildings of heritage value, these are not clearly identified by people, their reading is very unclear. In this sense, improvement actions can be formulated through the streets to connect buildings and squares in a more structured, set through sequences of urban design on microscale. Actions in that direction may be improve social cohesion in relationship between people’s knowledge and elements and spaces that represent his culture (von Schönfeld et al., 2018).
Second objective allowed us to understand the answers about the elements that like or dislike in relation to the characteristics of the people. It constitutes a contribution to urban design on well-being-oriented studies, providing quantitative techniques in consideration of the particular approaches (Russell, 2003), (Gatersleben et al., 2020), (Galindo & Corraliza, 2012), (Marshall, 2012).
Maps used lead us to the identification of patterns in four subsectors of the historical landscape. These patterns are concentrated in the foundational nucleus, to the southwest, north and northeast of the site. Through the streets that present the greatest problems, it is possible to relate elements that please and reduce displeasure with specific actions on buildings or public urban spaces (authors,2021).
Finally, with the research carried out on microscale, specific projects can be undertaken to propose design options that involve different intervention scenarios and how this is accepted or not by those who frequent the place. For future studies, indices of liking or disliking can be determined that, located on an evaluative scale, allow establishing priorities such as those shown in this work, both in historical landscapes and other interest ones.

References

  1. Agresti, A. (2015). Foundations of Linear and Generalized Linear Models. (J. W. & Sons. (Ed.)).
  2. Aguilar, A. (2006). Algunas consideraciones teóricas en torno al paisaje como ámbito de intervención institucional. Redalyc, 79, 5–20.
  3. Briceño Ávila, M., Sánchez Villarreal, A., Tamayo Revilla, J., Izquierdo Guerrero, H., Ponsot Balaguer, E., Ulloa Quintero, R., & Camacho Peña, L. (2021). Capas Historicas del Paisaje Urbano de Ibarra. Revista Geográfica Venezolana, 62 (1), 256–271.
  4. Chenoweth, R. E., & Gobster, P. H. (1990). The Nature and Ecology of Aesthetic Experiences in the Landscape. Landscape Journal, 9(1). [CrossRef]
  5. Galindo, M. P., & Corraliza, J. A. (2012). Estética ambiental y bienestar psicológico: algunas relaciones existentes entre los juicios de preferencia por paisajes urbanos y otras respuestas afectivas relevantes. Apuntes De Psicología, 30(1–3).
  6. Gatersleben, B., Wyles, K. J., Myers, A., & Opitz, B. (2020). Why are places so special? Uncovering how our brain reacts to meaningful places. Landscape and Urban Planning, 197. [CrossRef]
  7. Hilbe, J. M. (2009). Logistic Regression Models. (C. & Hall. (Ed.); 1st. editi).
  8. Hussein, F., Stephens, J., & Tiwari, R. (2020). Cultural memories and sense of place in historic urban landscapes: The case of Masrah Al Salam, the demolished theatre context in Alexandria, Egypt. Land, 9(8). [CrossRef]
  9. ICOMOS. (2014). The Florence Declaration on Heritage and Landscape as Human Values. 18th General Assembly, 7.
  10. Instituto Nacional de Patrimonio Cultural, Ecuador. (n.d.). https://www.patrimoniocultural.gob.ec/.
  11. Kaplan, S. y Kaplan, R. (1982). Cognition and Environment. Functioning in an uncertain world (P. Publishers (Ed.)).
  12. Kent, J. L., Ma, L., & Mulley, C. (2017). The objective and perceived built environment: What matters for happiness? Cities and Health, 1(1). [CrossRef]
  13. Luo, T., Xu, M., Liu, J., & Zhang, J. (2019). Measuring and Understanding Public Perception of Preference for Ordinary Landscape in the Chinese Context: Case Study from Wuhan. Journal of Urban Planning and Development, 145(1). [CrossRef]
  14. Lynch, K. (2015). La imagen de la ciudad. (Tercera ed). Gistavo Gili.
  15. Marshall, S. (2012). Science, pseudo-science and urban design. Urban Design International, 17(4), 257–271. [CrossRef]
  16. Matsuoka, R. H., & Kaplan, R. (2008). People needs in the urban landscape: Analysis of Landscape And Urban Planning contributions. In Landscape and Urban Planning (Vol. 84, Issue 1). [CrossRef]
  17. MCCullagh, P.; Nelder, J. (1989). Generalized Linear Models. (C. & Hall. (Ed.); 2d. editio).
  18. McHarg, I. (2000). Proyectar con la naturaleza. (G. Gili (Ed.)).
  19. Méndez, M. L., Otero, G., Link, F., López Morales, E., & Gayo, M. (2021). Neighbourhood cohesion as a form of privilege. Urban Studies, 58(8), 1691–1711. [CrossRef]
  20. Mondschein, A., Blumenberg, E., & Taylor, B. D. (2006). Cognitive mapping, travel behavior, and access to opportunity. Transportation Research Record, 1985. [CrossRef]
  21. Nassauer, J. I., Webster, N. J., Sampson, N., & Li, J. (2021). Care and safety in neighborhood preferences for vacant lot greenspace in legacy cities. Landscape and Urban Planning, 214. [CrossRef]
  22. Ode, A., Fry, G., Tveit, M. S., Messager, P., & Miller, D. (2009). Indicators of perceived naturalness as drivers of landscape preference. Journal of Environmental Management, 90(1), 375–383. [CrossRef]
  23. Ode, Å. K., & Fry, G. L. A. (2002). Visual aspects in urban woodland management. Urban Forestry & Urban Greening, 1(1), 15–24. [CrossRef]
  24. Ponsot, Briceño, Izquierdo, Rondón, Sánchez, Tamayo, Ulloa, C. (2019). Imagen urbana del centro histórico de Ibarra. Reporte estadístico. (P. Coeditado PUCE (Ed.); 1ra. Edici).
  25. R Core Team. (2018). “R: A language and environment for statistical computing.” R Foundation for Statistical Computing, Vienna, Austria.
  26. Russell, J. A. (1980). A circumplex model of emotion. Journal of Personality and Social Psychology, 39(6), 1161–1178.
  27. Russell, J. A. (2003). Core Affect and the Psychological Construction of Emotion. Psychological Review, 110(1), 145–172. [CrossRef]
  28. Russell, J. A., & Pratt, G. (1980). A description of the affective quality attributed to environments. Journal of Personality and Social Psychology, 38(2), 311–322. [CrossRef]
  29. Saltos, R. y Torres, F. (1999). Inventario arquitectónico y urbano de Ibarra y Caranqui. Tomos I, II, III, IV.
  30. Scheaffer, Richard L.; Mendenhall III, William; Lyman Ott, R.; Gerow, K. (2012). Elementary Survey Sampling. (C. L. Brooks/Cole (Ed.); 7th. editi).
  31. Sotoudeh, H., & Abdullah, W. M. Z. W. (2013). Evaluation of fitness of design in urban historical context: From the perspectives of residents. Frontiers of Architectural Research, 2(1). [CrossRef]
  32. Verdaguer, C. (2005). I FORO URBANO DE PAISAJE VITORIA-GASTEIZ 2005 Periferias : hacia dentro , hacia fuera ”. 1–11.
  33. von Schönfeld, K. C., Bertolini, L., Jalaladdini, S., Oktay, D., Gavrilidis, A. A., Ciocănea, C. M., Niţă, M. R., Onose, D. A., Năstase, I. I., Santos, H., Valença, P., Fernandes, E. O., Zhang, Y., Wei, T., Talen, E., Wheeler, S. M., Anselin, L., Said, S., Samadi, Z., … Werthmann, C. (2018). Urban Streets between Public Space and Mobility. Landscape and Urban Planning, 177(August 2017), 221–229. [CrossRef]
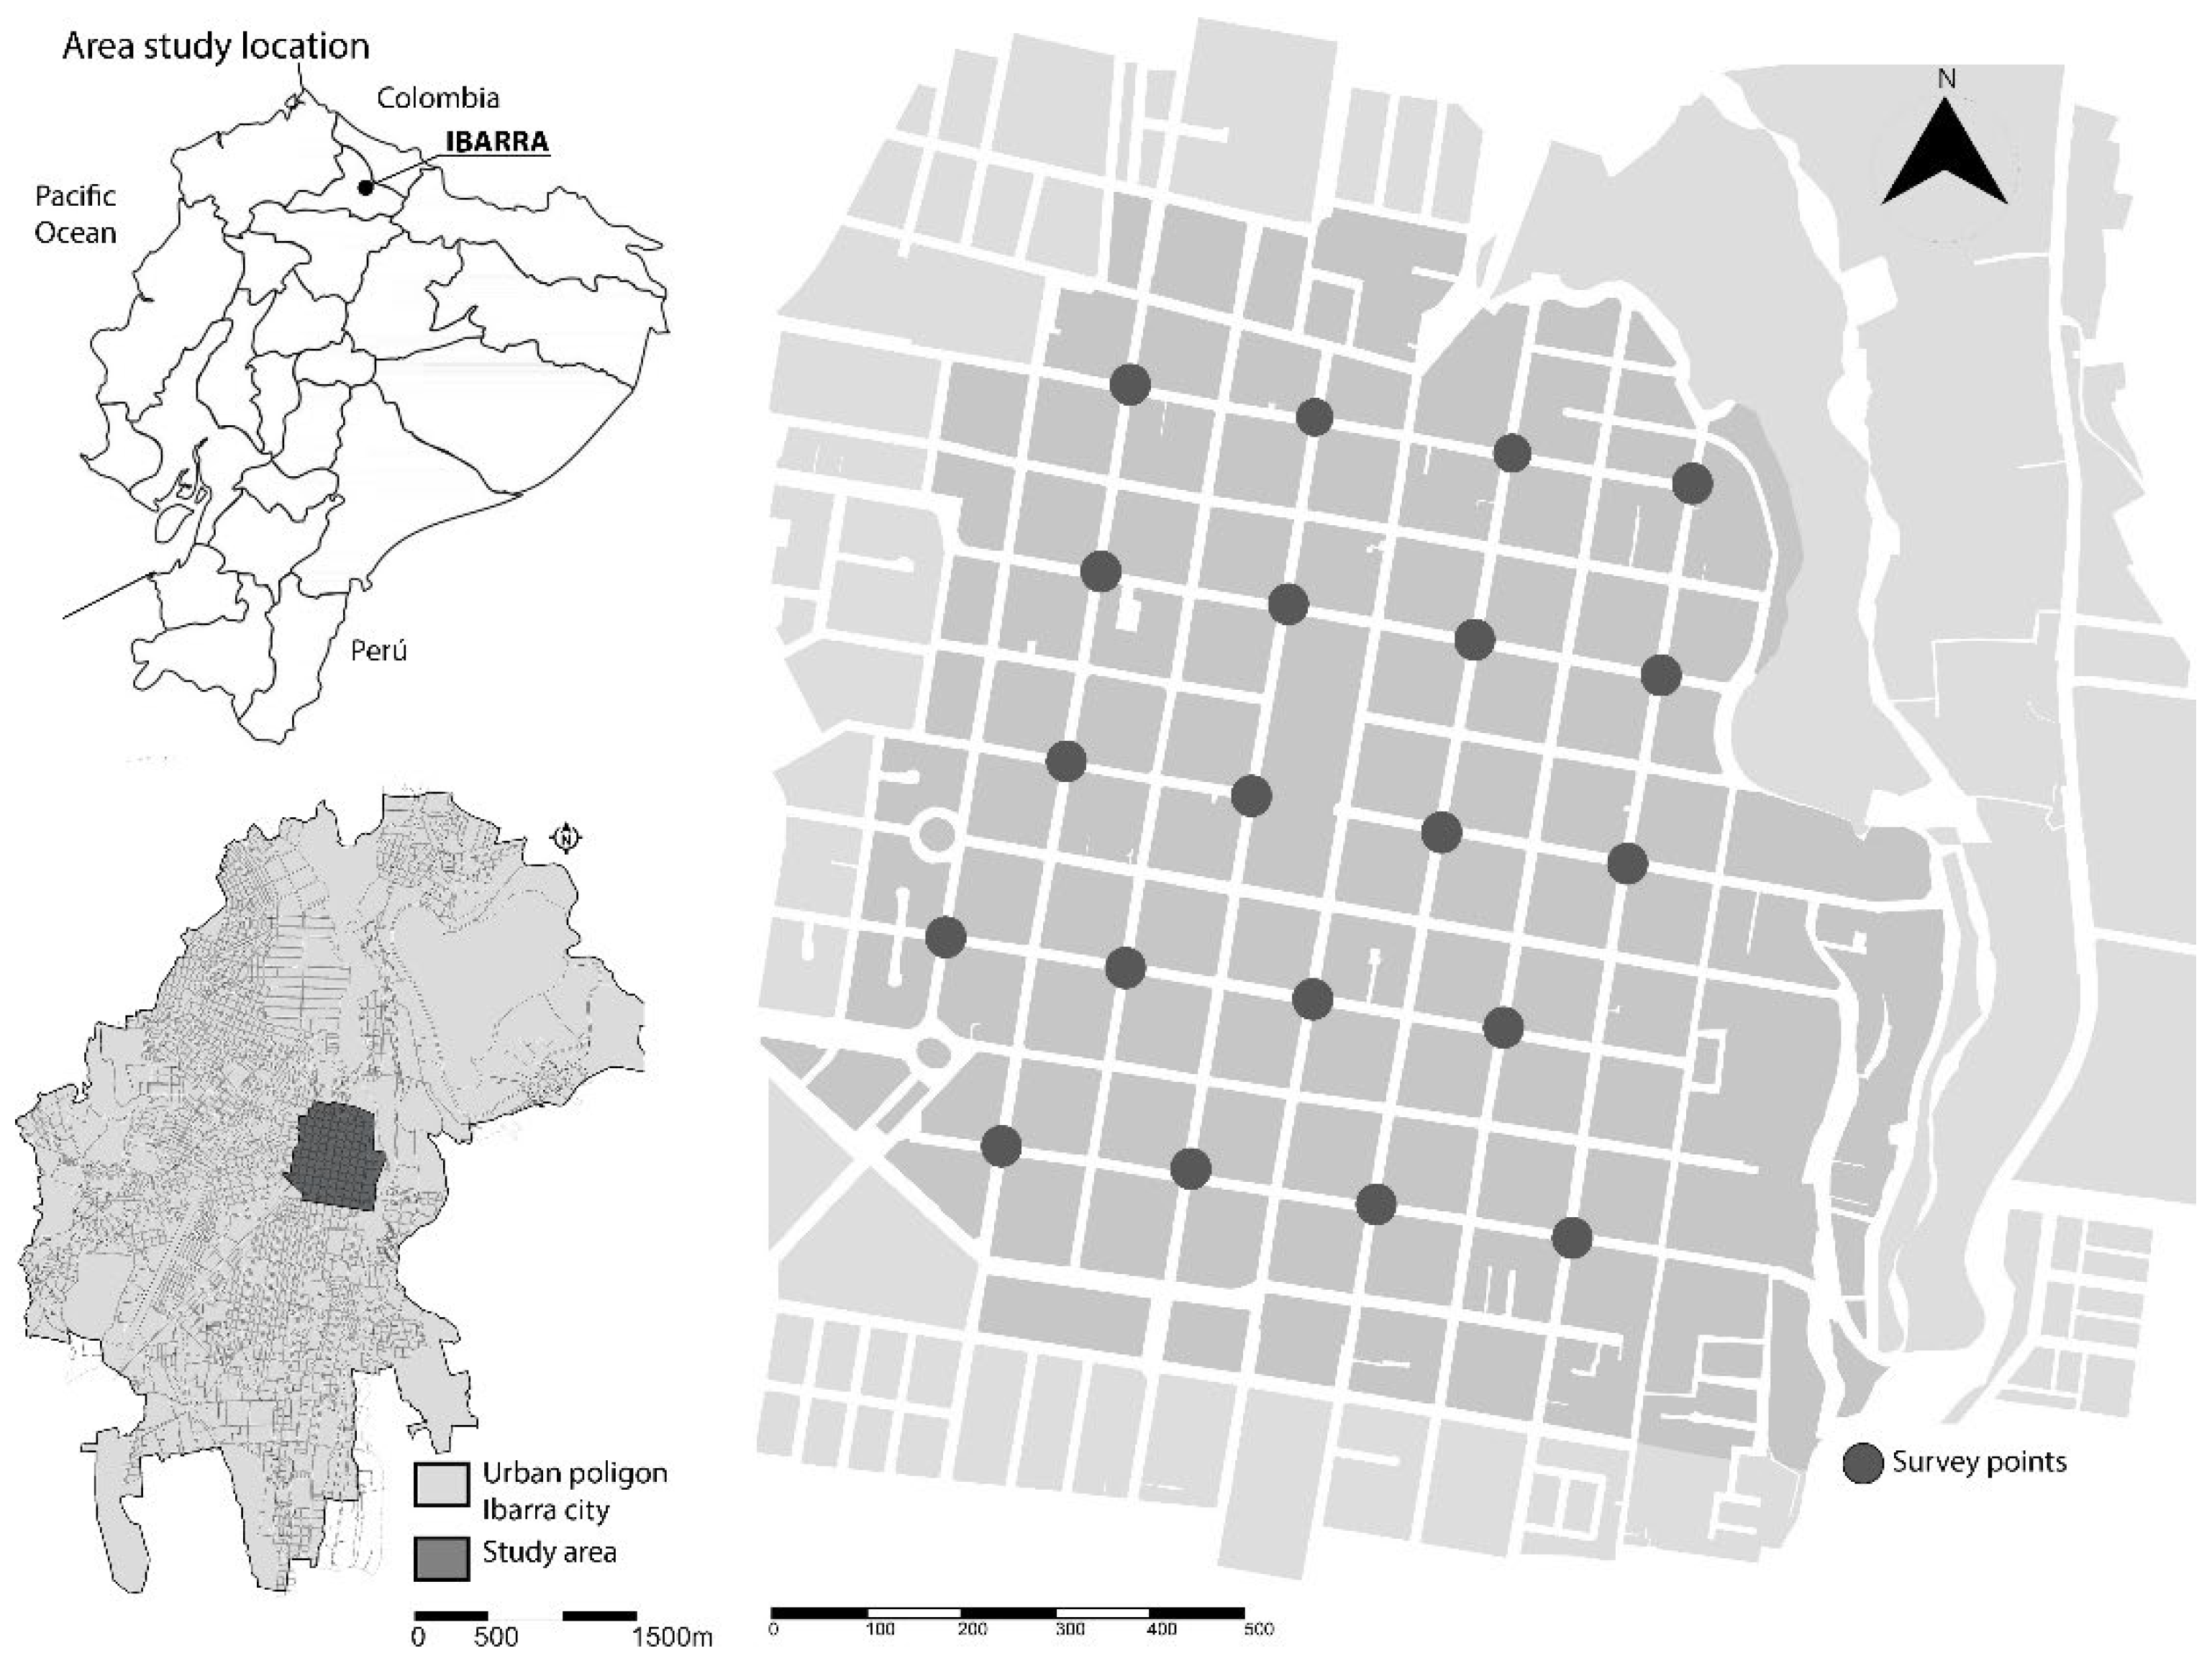
Figure 1. Places of application of the First survey on the urban image of the historic downtown of Ibarra. Source: (Ponsot, Briceño, Izquierdo, Rondón, Sánchez, Tamayo, Ulloa, 2019).
Preprints 75770 g001
Figure 2. Proportion of mentions received by places considered pleasant.
Preprints 75770 g002
Figure 3. The Cuartel, Pedro Moncayo Park and Bolívar Street.
Preprints 75770 g003
Figure 4. Planimetric location of the places that the interviewees like (larger diameter equals greater relative frequency of the place mentioned).
Preprints 75770 g004
Figure 5. Proportion of mentions received by places considered disliking.
Preprints 75770 g005
Figure 6. Old school Teodoro Gómez, Bolívar, and Sánchez and Cifuentes.
Preprints 75770 g006
Figure 7. Planimetric location of the places that the interviewees dislike (larger diameter equals higher relative frequency of the place mentioned).
Preprints 75770 g007
Figure 8. Joint liking/disliking among the interviewees (larger diameter equals higher relative frequency of the place mentioned).
Preprints 75770 g008
Figure 9. Some mentioned places and buildings by liked and disliked.
Preprints 75770 g009
Table 1. Mentions and probability values according to the deviation of the factors considered for liking.
Place Mentions Gender Age Level Frequency
Bolívar Street 83 0.7416429 0.0292015 0.4441903 0.8351808
La Merced Park 81 0.8628450 0.4893984 0.0650289 0.9683314
“Coco” corner 56 0.0657850 0.1754848 0.1495044 0.1942257
Águila park 27 0.1416262 0.0383923 0.9390357 0.7279376
House of Ibarreñidad 25 0.0230201 0.7701085 0.2145067 0.3100739
Municipality 21 0.0009448 0.0927905 0.9212920 0.0688232
Parks 15 0.8958459 0.6263178 0.9172531 0.0243222
Amazonas market 9 0.3999454 0.1323162 0.0051522 0.4088890
Gubernation 8 0.0698998 0.8883960 0.9436454 0.3407143
House of Culture 7 0.9483484 0.0118852 0.9738643 0.6938977
San Agustin Park 5 0.3028039 0.3634427 0.9376864 0.0468278
Santo Domingo Park 5 0.4086241 0.0238938 0.5796059 0.7864686
Table 2. Mentions and probability values according to the deviation of the factors considered for displeasure.
Place Mentions Gender Age Level Frequency
Old School Teodoro Gómez 77 0.8866097 0.0024428 0.7303522 0.0072908
Bolívar street 55 0.0785330 0.1869312 0.3509629 0.0855646
Oviedo street 23 0.5743604 0.7984397 0.0480603 0.2813004
Torreón 19 0.0193507 0.0075865 0.2009983 0.0699608
Sucre street 15 0.0676320 0.6716970 0.9360196 0.3390099
Streets 14 0.0253150 0.3562462 0.4202115 0.2437234
Águila corner 14 0.0922955 0.3790603 0.5076561 0.7452506
Colón street 10 0.4276690 0.7525072 0.5390799 0.0418257
La Merced 9 0.8858647 0.4555600 0.7361766 0.0536881
Parks 9 0.8858647 0.0775044 0.1658753 0.7805286
CDP 9 0.5883539 0.9530894 0.0283807 0.2666959
Pérez Guerrero avenue 8 0.3107308 0.0409240 0.9105563 0.5584130
Rocafuerte street 7 0.1095277 0.0453028 0.1493349 0.0853283
García Moreno Street 7 0.1151545 0.0946186 0.3550165 0.2340110
Downtown 7 0.1151545 0.1869640 0.9520019 0.0662332
Maldonado street 7 0.4573733 0.0907178 0.6540553 0.2565751
Cuartel 6 0.0366411 0.7813976 0.1682423 0.0209531
Houses 5 0.4198078 0.3989958 0.8965343 0.0310402
Sidewalks 5 0.0031974 0.9016575 0.1029840 0.4694090
Buildings 4 0.7495943 0.7064859 0.1802656 0.0391396
Pedro Moncayo street 4 0.4744064 0.0720332 0.9868813 0.9342418
Heritage houses 4 0.1804498 0.1468933 0.9488239 0.0370756
Disclaimer/Publisher’s Note: The statements, opinions and data contained in all publications are solely those of the individual author(s) and contributor(s) and not of MDPI and/or the editor(s). MDPI and/or the editor(s) disclaim responsibility for any injury to people or property resulting from any ideas, methods, instructions or products referred to in the content.
Copyright: This open access article is published under a Creative Commons CC BY 4.0 license, which permit the free download, distribution, and reuse, provided that the author and preprint are cited in any reuse.
Prerpints.org logo

Preprints.org is a free preprint server supported by MDPI in Basel, Switzerland.

Subscribe

© 2024 MDPI (Basel, Switzerland) unless otherwise stated