1. Introduction
Due to the decreasing cost of wind turbines, wind-generated power has increased significantly worldwide in the last decade, both stand-alone and grid-connected configurations [
1,
2]. By the end of 2021, about 38% of energy production belonged to renewable energy, reflecting the commitment of nations to reduce the carbon footprint produced by fossil fuels. According to the report of [
3] wind energy reached 93 Giga-Watts (GW) and, together with solar energy, represents more than half of renewable energy production.
However, this increase in production can bring significant challenges in the electricity sector due to the stochastic nature and decentralized model of renewable energies. Centralized energy systems are complex because large and sophisticated infrastructures are needed before they are distributed to end users. In addition to production, delivering electricity to consumers under technical parameters is a very complex task due to the tolerances that must be met in the voltage magnitudes, frequency, and losses that can occur in electricity distribution [
4,
5].
In contrast, decentralized renewable energy systems can easily cope with failures because each node can be powered by multiple energy production units, which can be connected to a global grid, thus democratizing energy access [
5] .
Wind turbines can have noticeable adverse effects on the performance of distributed systems because wind variability causes active and reactive power fluctuations. The voltage at the point of standard connections varies at time intervals; this represents a challenge to grid operators because the distribution system needs to be designed to allow the connection of power systems. The power electronic devices, together with the operation of nonlinear appliances inject harmonics into the network that can potentially create voltage distortion problems [
6].
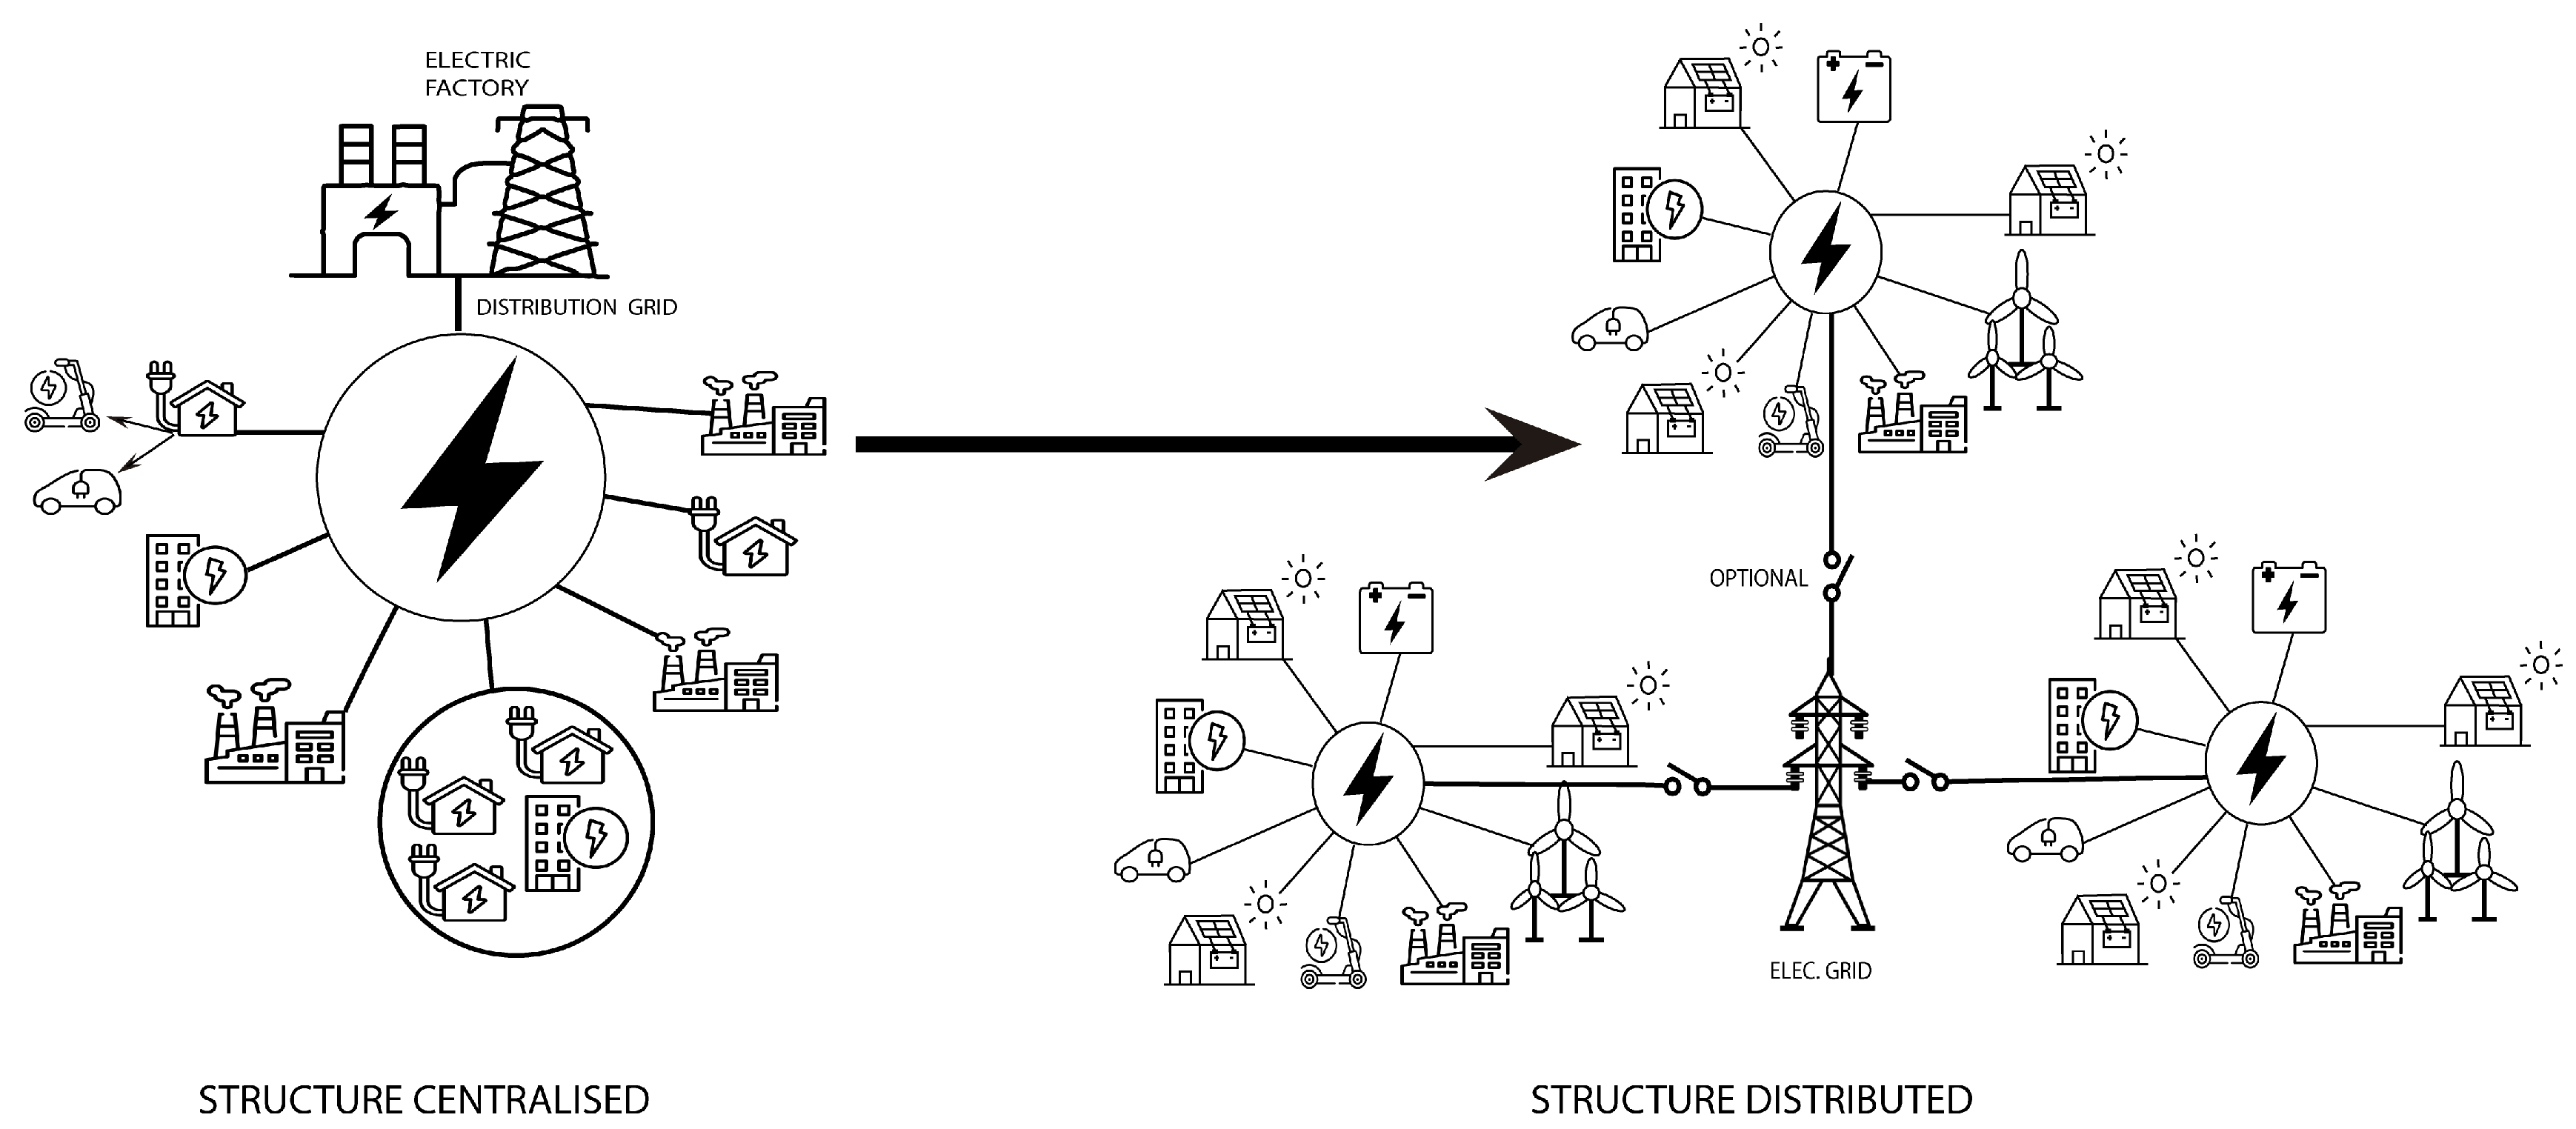
Figure 1.
Change from a centralized to a distributed system (
a) Centralized (
b) Decentralized [
5].
Figure 1.
Change from a centralized to a distributed system (
a) Centralized (
b) Decentralized [
5].
Therefore, the main wind power quality (PQ) problems encounter with the integration of wind energy into the distribution network are as follows [
7,
8]:
Due to the climatic conditions of the wind (speed, gusts, direction) and its variability, the production of electrical energy is intermittent, which causes power fluctuations in the grid.
In a weak network, power fluctuations cause severe voltage fluctuations and significant line losses.
Uncontrollable reactive power consumption and low power factor.
The injection of harmonics into the network can create voltage distortion problems.
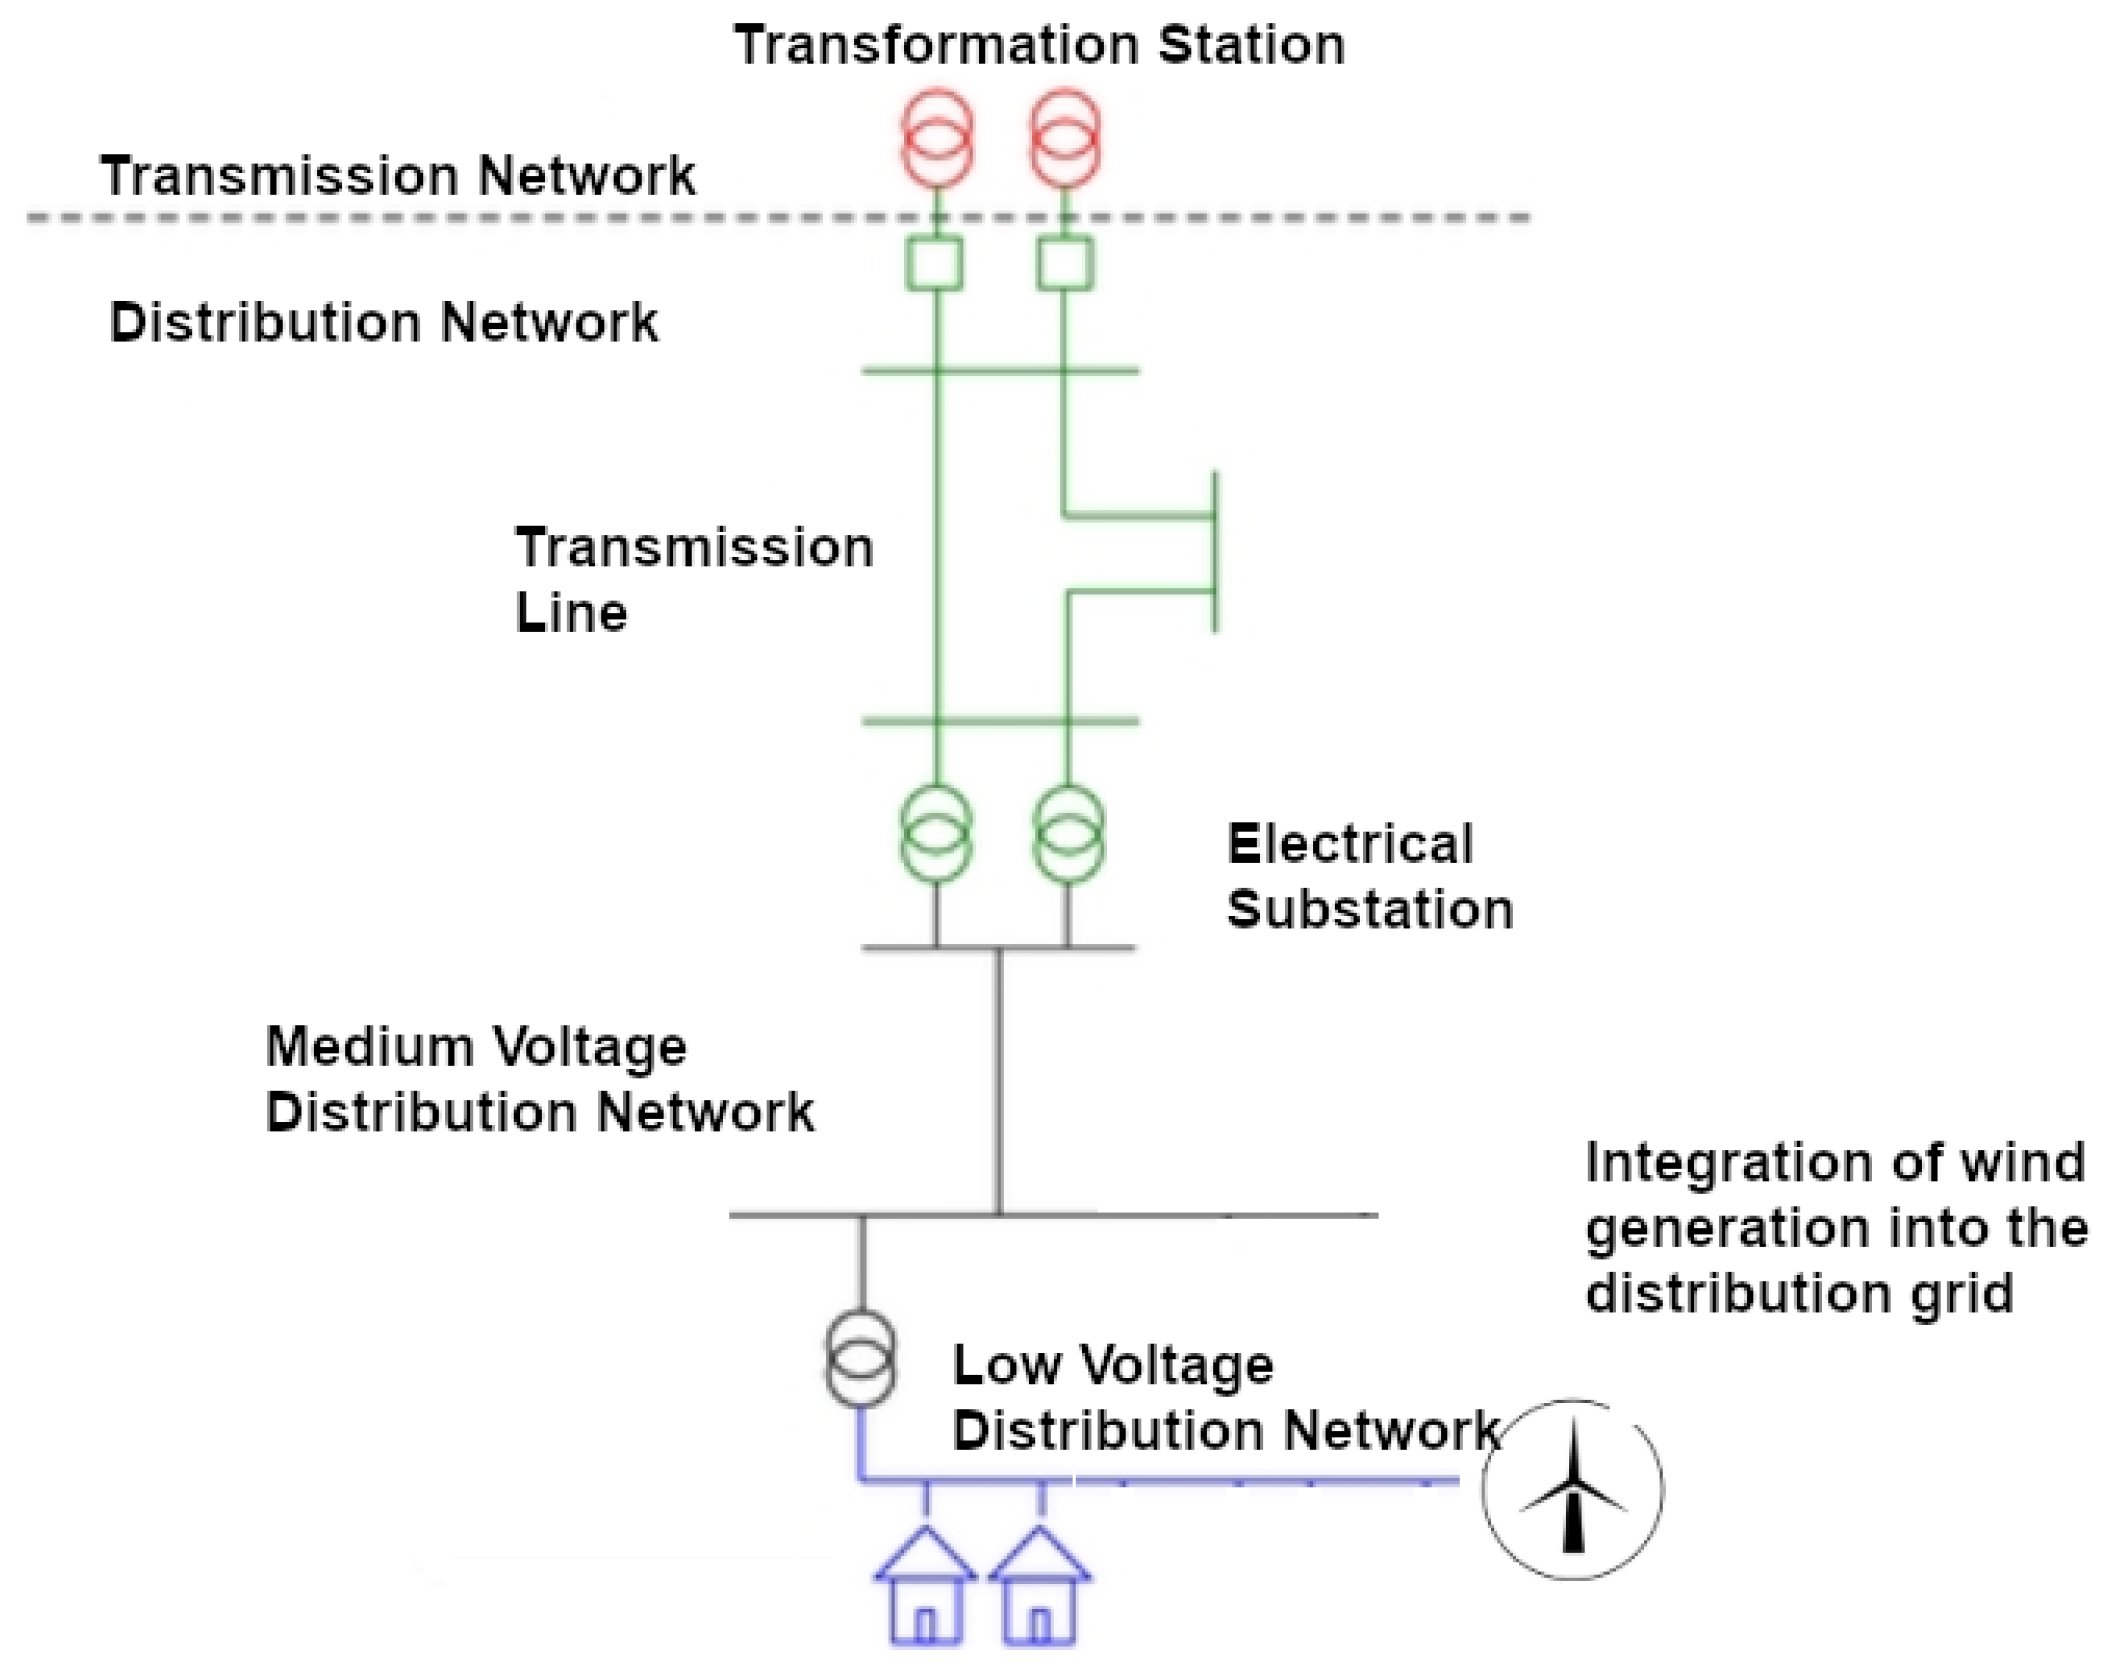
Figure 2.
Integration of wind generation into the distribution grid.
Figure 2.
Integration of wind generation into the distribution grid.
If the wind generation’s effect on the distribution system’s voltage profile is analyzed, the low voltage profile in distribution systems is mainly the result of power losses in the line, causing voltage drops in it [
6]. This problem has traditionally been solved by using voltage regulators and on-load-tap-changing transformers. Using these devices at the main distribution substation improves the voltage at nearby nodes, but the voltage drops along the lines remain approximately constant [
9,
10]. Despite voltage regulation strategies, there may still be an unacceptable voltage drop on transmission lines. Adding wind generation at critical points of a distribution system generally increases the voltage profile. The result is a reduction in line losses, as shown in [
1], which performed the impact of a wind turbine on a distributed network composed of 33 nodes. In some cases, it is much higher than the nominal voltage.
However, the presence of wind turbines may have a secondary effect of increasing the voltage in the distribution networks above the acceptable limit. In such cases, it is essential to have appropriate power management or control strategies to keep the voltage within acceptable limits. An alternative is to coordinate the voltage profile of the grid to which the wind turbines are connected with voltage regulators at substations near the transformers with taps changes or to store excess energy in a storage device that may be available [
10].
The impact of wind generation on the grid can be reduced in the following aspects [
11] :
1.1. Voltage Control
The load is an important aspect to consider, an increase in it causes a voltage drop due to the change of impedance in the line this will force the wind generator to deliver more power to the grid to make up for the voltage drop.
Wind generation effect analysis on the variability of the primary resource (wind profiles) indicates that wind energy resources are not distributable; therefore, the power output of wind devices is variable depending on the instantaneous wind speed. As a result, the voltage profile of the distribution system to which such technologies are connected could be quite variable. The percentage variation in voltage depends on the size of the wind turbine compared to the size of the distribution system and the availability of the primary resource. Wind-generated power during gusty or no-wind periods can cause voltage regulation problems. Therefore, such systems must be sized appropriately, and those load management strategies and coordination with the nearby voltage regulator are in place to keep voltage fluctuations to a minimum and not allow the voltage to exceed the allowable limit [
7].
The voltage regulator must not be sensitive to minor variations in busbar voltages caused by frequent fluctuations in wind turbine output power, which could otherwise lead to mechanical failures and maintenance problems. Such fluctuations could be avoided by providing adequate dead-bands for the voltage regulators. Other load management strategies may also be necessary, such as load shifting, use of storage devices, and storing or consuming excess available energy to avoid unwanted overvoltage [
7]. Another option is to reduce the substation voltage with the wind generator connected. However, this last solution cannot be applied if no wind generator is available because the grid voltage would drop to deficient levels. Another technique is to use synchronous machines that absorb the reactive power of the wind turbine, thus avoiding voltage increases in the grid or dynamic reactive power control elements such as the static synchronous compensator (STATCOM) [
12].
1.2. Quality of energy
Voltage increases depend on several factors: the X/R ratio, the loads, and the power injected by the generator. An example of this is generated when the turbine exceeds its rated power; then, to protect itself, it will disconnect from the grid, causing an increase in feeder current or a voltage drop.
Currently, the power quality standard for wind turbines is regulated by the International Electrotechnical Commission in resolution IEC 61400-21, which defines the parameters and recommendations for turbine performance. During normal conditions, the voltage quality of a turbine can be characterized by the following:
Steady state in continuous production: The voltage at the point of common connection (PCC), which can be affected by the wind turbines’ operation, must be regulated. Methods must be applied to prevent the voltage magnitude from exceeding the limits.
Voltage fluctuations: Fluctuations can induce a limiting factor in grid integration, especially in weak grids. These fluctuations in power output are due to wind speed variations and switching operations, the latter occurring due to the change in power output.
Harmonics: The distortion of the fundamental sine wave (60 Hz) produced by the inverters of the generators. This generates significant currents that can overheat transformers or even damage electronic circuits.
1.3. Reactive power and voltage variations
One of the fundamental requirements is controlling the voltage variation in the network. Dynamic reactive power control is necessary to achieve this requirement because the voltage variation is related to the reactive power according to Equation (
1).
Voltage fluctuations can affect the power quality in the network due to the peaks that can occur when it is integrated [
13].
2. System Modeling
The wind turbine is the most crucial element within the wind energy conversion system; it is the device in charge of transforming wind energy (kinetic energy of the wind) into electrical power. The two most commonly used models in the study of wind are the 3-bladed horizontal axis and the squirrel cage [
14]. Applying these systems in wind farms has proven to be a viable solution for generating clean energy. This section shows the mathematical models used for the general study of the behavior of a wind turbine.
2.1. Mathematical model of a 3-blade horizontal axis wind generator
For a 3-bladed horizontal axis wind generator, the produced power is given by (
2):
Which:
r: Radius formed by the wind turbine blade
wind speed
: air density
: rotor power coefficient.
The power coefficient
, is based on the ratio of the tangential speed at the end of the rotor blade and the wind speed, represented by
and the angle formed between the rotor plane and the chord
. It is also called the Betz limit, and its maximum value is 0.59 (16/27); in practice, the maximum value for high-speed turbines is between 0.4 to 0.5, and for turbines with three or more blades between 0.2 to 0.4 [
15].
2.2. Mathematical model squirrel cage wind generator
If we analyze the mathematical modeling for a squirrel cage generator, we notice that it is an induction or asynchronous generator. It consists of three coils in the stator like, as, bs, and cs, separated from each other by 120 o. The rotor comprises three coils, ar, br, and cr; it consists of a series of copper bars, which are short-circuited at each end by the use of rings. The rotor can be considered to adopt the same distribution and number of poles N as the stator.
In the mathematical model of the squirrel cage generator, it is necessary the Park transform that is in charge of converting the coordinates of the 3 phases a, b, and c into coordinates of the stationary axis d, q [
16].
Table 1.
Nomenclature used.
Table 1.
Nomenclature used.
| Símbolo |
Nomenclatura |
|
Stator longitudinal and transverse current (d,q plane) |
|
Rotor longitudinal and transverse current (d,q plane) |
|
Stator voltage components (d,q plane) |
|
Rotor voltage components (d,q plane) |
|
Inductances rotor, stator |
|
Total inductance on the rotor, stator |
|
Mutual inductance |
| N |
Number of poles |
| J |
Total Moment of Inertia referred to the generator axis |
|
Electrical Torque, Mechanical Turbine Torque |
|
Stator and rotor resistances |
|
Rotational speed (d,q plane), electrical speed |
|
Stator voltage, current, and flux |
|
Voltage, current, and rotor flux |
|
Longitudinal components and stator flux quadrature (d,q plane) |
|
Longitudinal components and rotor flux quadrature (d,q plane) |
Equation (
5) shows the coordinate transformation matrix.
The three-phase voltages are given by:
The relationship between the electromagnetic fields of the stator and rotor as a function of the currents in the dq plane is given by:
The modeling of the rotor and stator electrical system consists of voltages, magnetic fluxes, and dynamic motion; applying the reference plane dq, it is obtained:
Replacing the above equations, the state representation of the squirrel cage generator is obtained:
Expressing the electric torque and the generated power we obtain:
The mechanical speed is represented by:
2.3. Wind Speed
The intermittent and variable nature of the wind makes it difficult to predict, and the wind speed varies constantly depending on the geographical conditions in the study area. A Weibull probability density function can model the wind speed variations over a while; this function needs two parameters, the shape factor
k, and the scale factor
c, which can be obtained qualitatively using the average wind speed [
17], mathematically, it is defined by [
15]:
3. Results
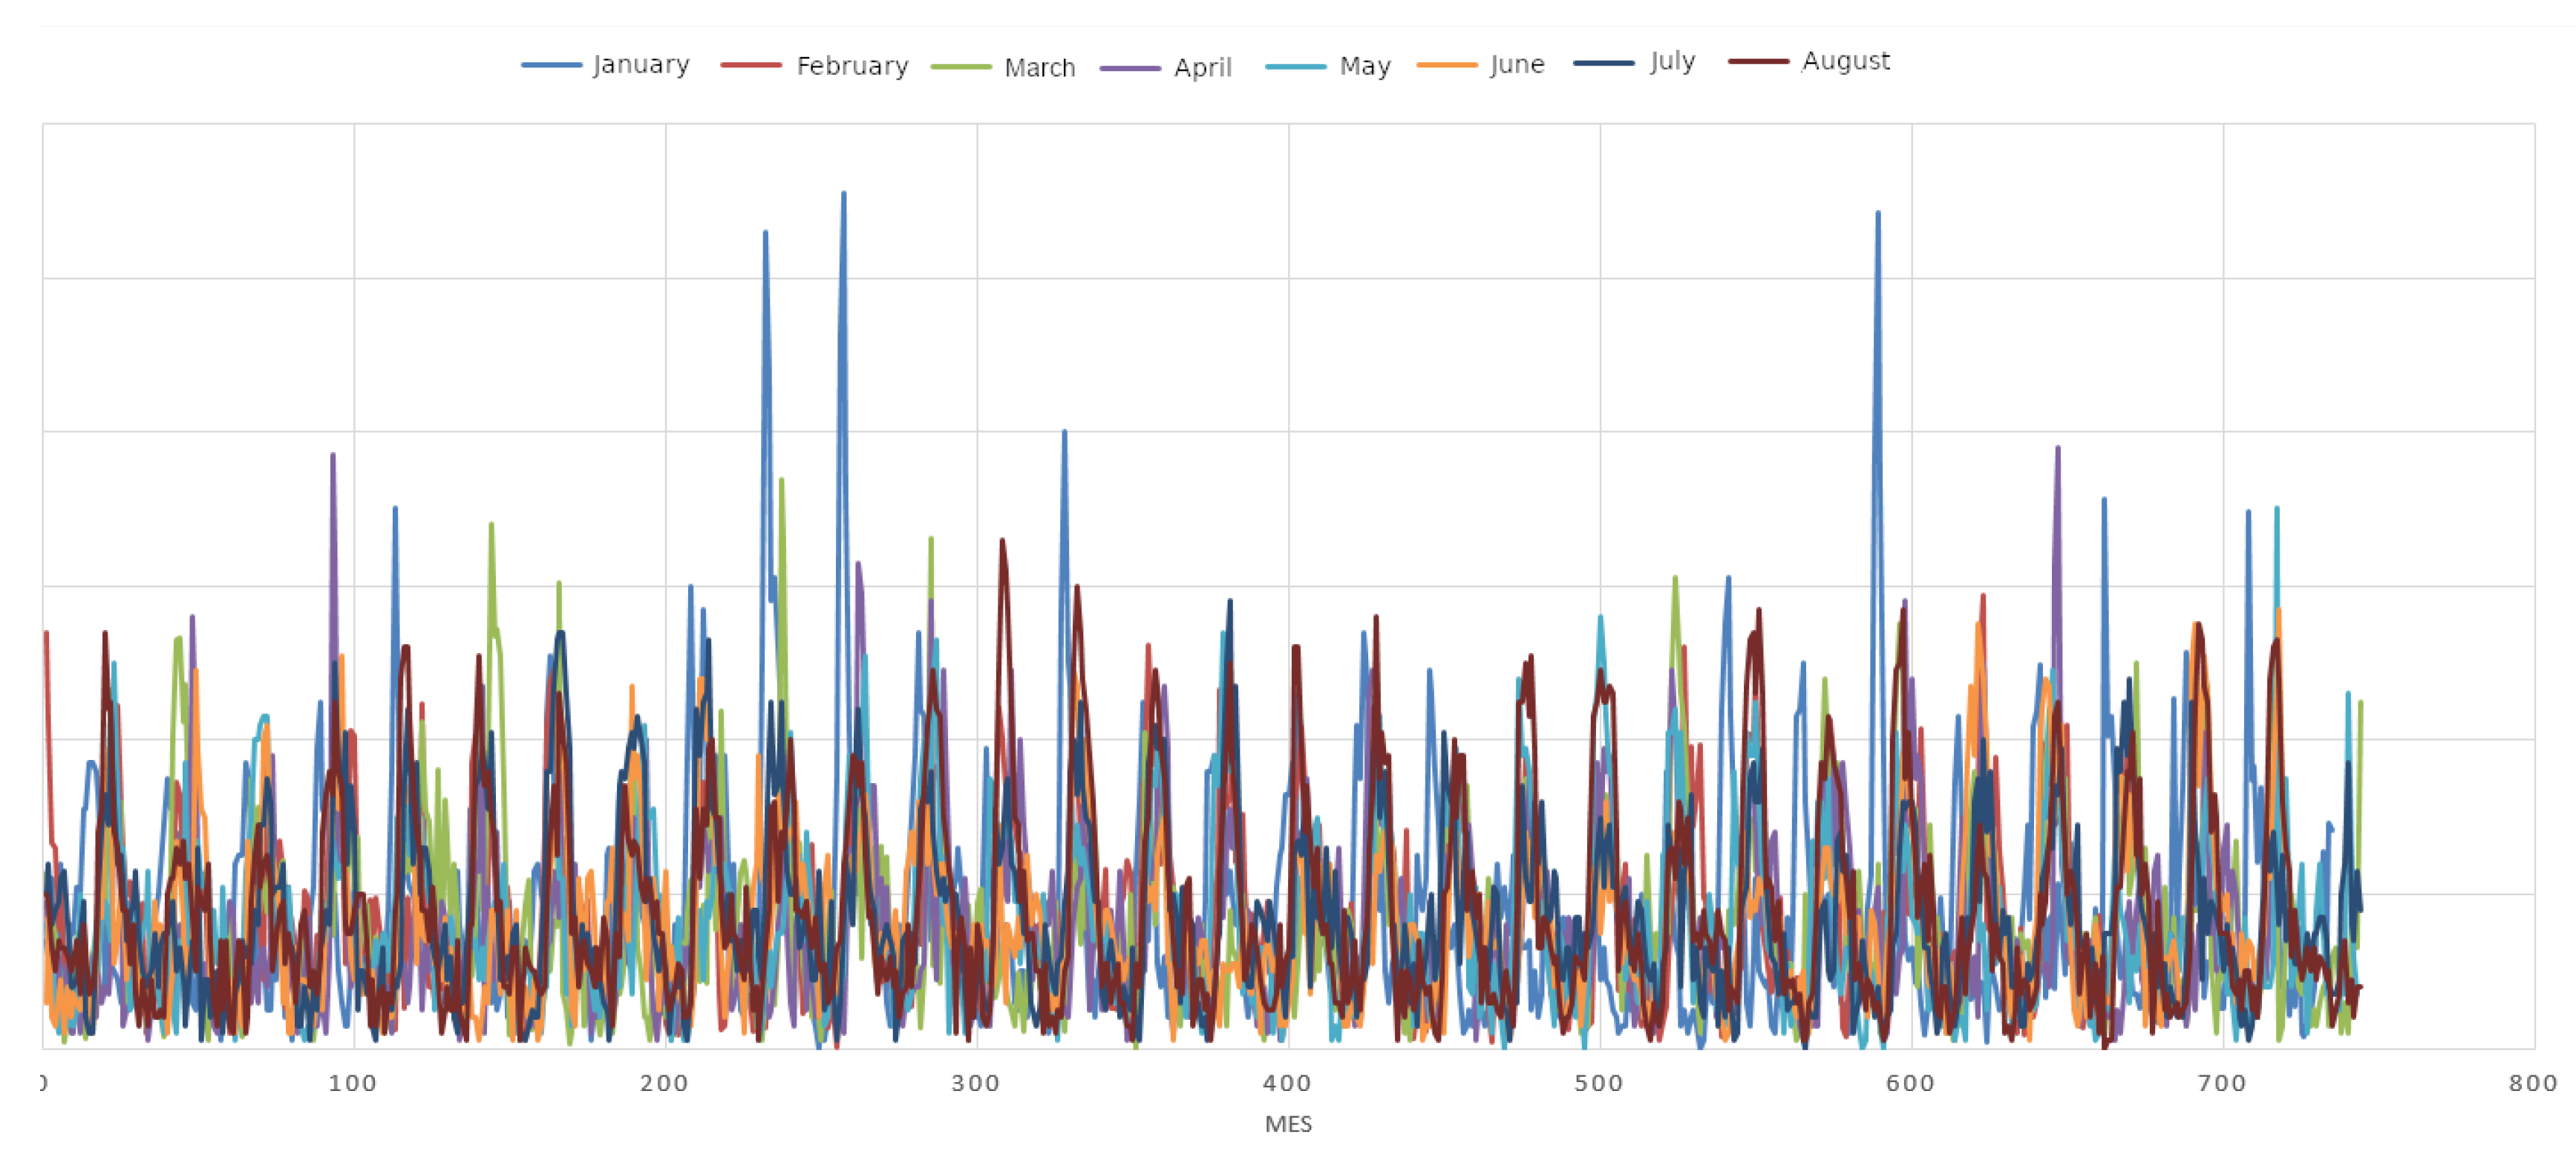
The values obtained from the Center for Research, Innovation, and Technology Transfer (CIITT by its Spanish acronym) meteorological station indicate the behavior of the wind resource, as shown in
Figure 3:
It is important to emphasize that the velocities measured by the anemometer are at 2.5 meters in height, so to find the wind turbine’s extractable wind power, an extrapolation must be made to 8.5 m since the wind turbine is located at this height. The value of the roughness length should be taken into account to perform this extrapolation, which for the investigation is
, defined as the height at which the wind speed becomes zero [
15].
The calculation of the mean and standard deviation using the following formulas must be applied to obtain the monthly average of wind speed and turbulence:
Table 2.
Descriptive statistics of weather station data.
Table 2.
Descriptive statistics of weather station data.
| Months |
Mean |
Desviation |
Turbulence |
| January |
1.78 |
1.48 |
0.83 |
| February |
1.76 |
1.15 |
0.66 |
| March |
1.62 |
1.17 |
0.73 |
| April |
1.53 |
1.15 |
0.75 |
| May |
1.60 |
1.13 |
0.71 |
| June |
1.62 |
1.08 |
0.67 |
| July |
1.73 |
1.13 |
0.65 |
| August |
1.83 |
1.35 |
0.74 |
3.1. Distribution Transformer Characteristic
The transformer has an apparent nominal power of 100KVA, but when considering a power factor of 0.95 (value required by the electric distributing company), its nominal real power is:
With this value, it is possible to calculate the wind turbine penetration level in the distribution network. It is calculated by dividing the installed power of distributed generation
by the nominal power of the transformer
. If the wind turbine works at 100% of its nominal capacity, its penetration percentage would be as follows:
The percentage of power is meager compared to the capacity of the distribution network (less than 1%), so this turbine does not disturb the network. It can be considered a distributed generation. It is also necessary to analyze the impact on the grid if the eight additional wind turbines that the laboratory has to cover the entire demand were implemented. Therefore, the percentage of penetration of the entire wind system in the distribution grid would be as follows:
These percentages show that the energy delivered to the grid is still tiny, and the system’s total power would be 5.4 KW, well below the value of 10 MW, which is considered the maximum recommended value for any power plant to the distribution system. Regarding power quality at low voltage distribution network transformers substations, the level or variation of voltage, harmonics and power factor are analyzed according to the CONELEC 004-01 since 2015 named ARCONEL. The DIgSILENT tool is used to perform this analysis.
Two values need to be known to find the voltage variation level on the low voltage side
: the nominal voltage
at the measurement point and the root mean square voltage (rms)
. In
Figure 5 can be seen that the rms voltage value is 1 pu. Since the base voltage value on the low voltage side is 220V, the rms voltage value would also be 220V.
According to ARCONEL’s electric power supply regulations, the low voltage variation in urban areas has an allowed percentage of in sub-stage 1 and an allowed percentage of in sub-stage 2. Therefore, the voltage variation of the study site is within the established limits.
The next value to be analyzed is the total harmonic distortion (THD), which measures how the system load distorts the ideal power waveform supplied by the utility company. TDH is always presented in both current and voltage; however, excessive distortion can cause inconvenience. Understanding TDH is the first step to ensure that no damage is caused to the loads in the low-voltage system.
According to the DIgSILENT simulation
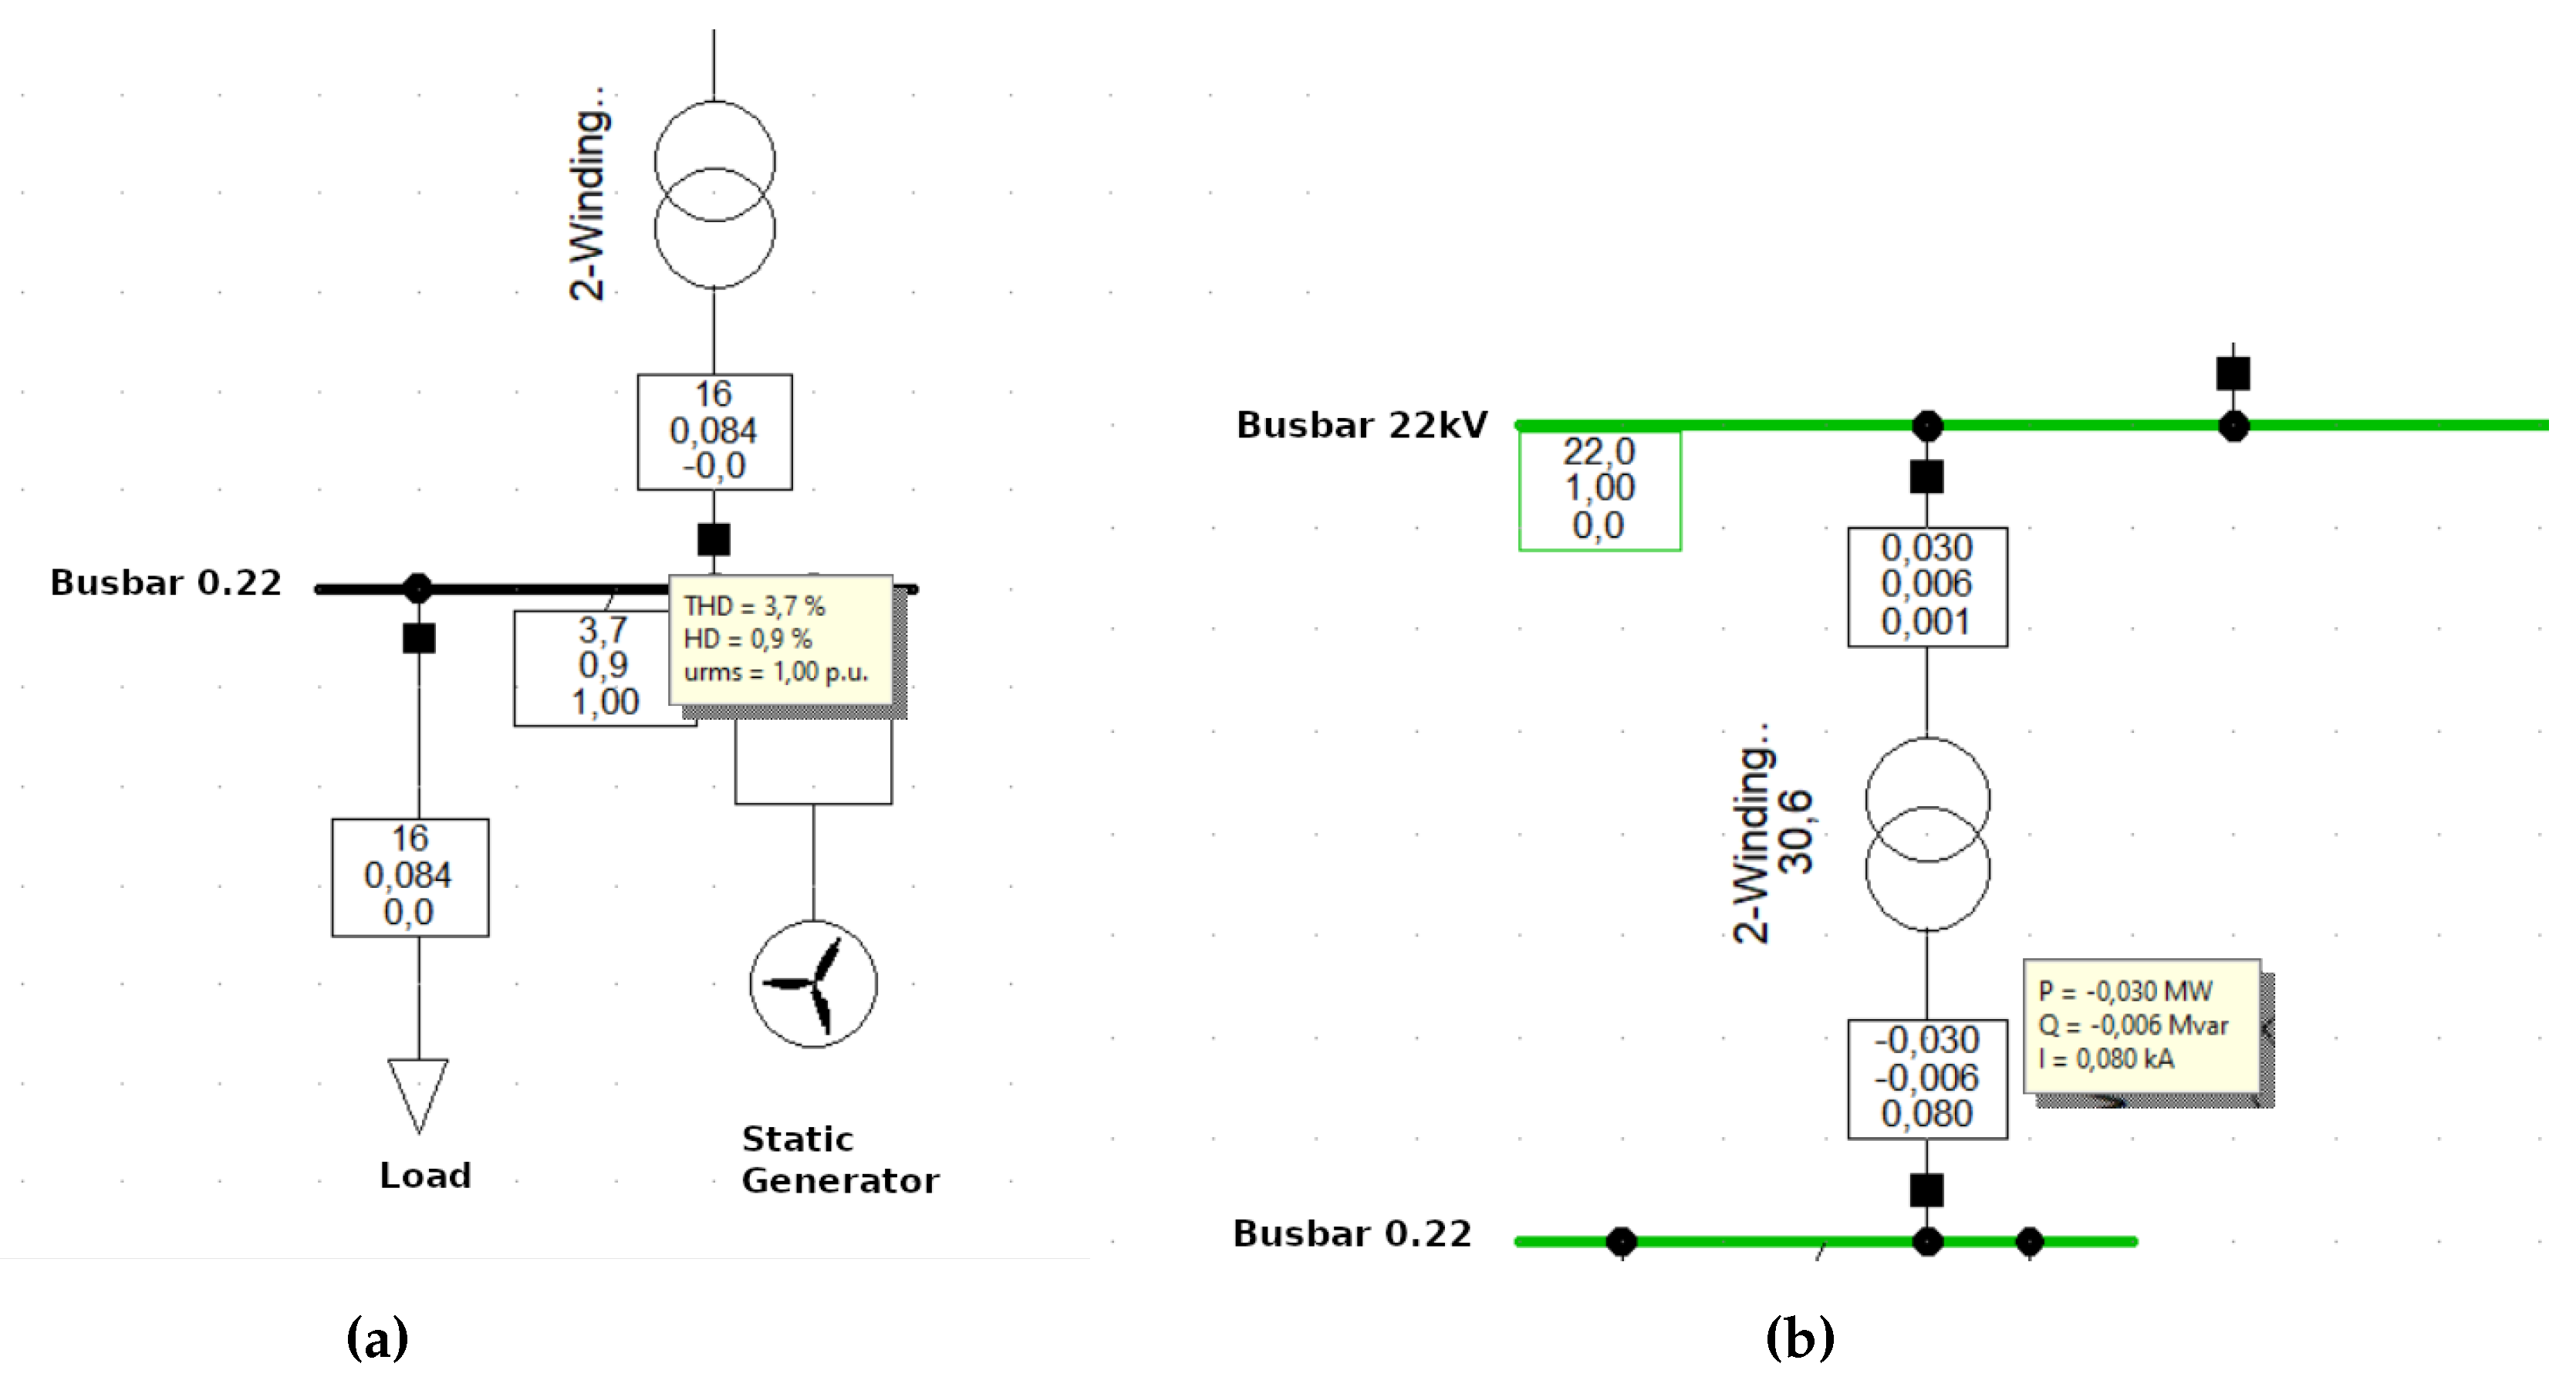
Figure 5a, the THD value on the low voltage side is
, well below the 8% maximum THD value allowed for distribution transformers according to ARCONEL because, like the voltage variation, the THD value is within the permitted limits.
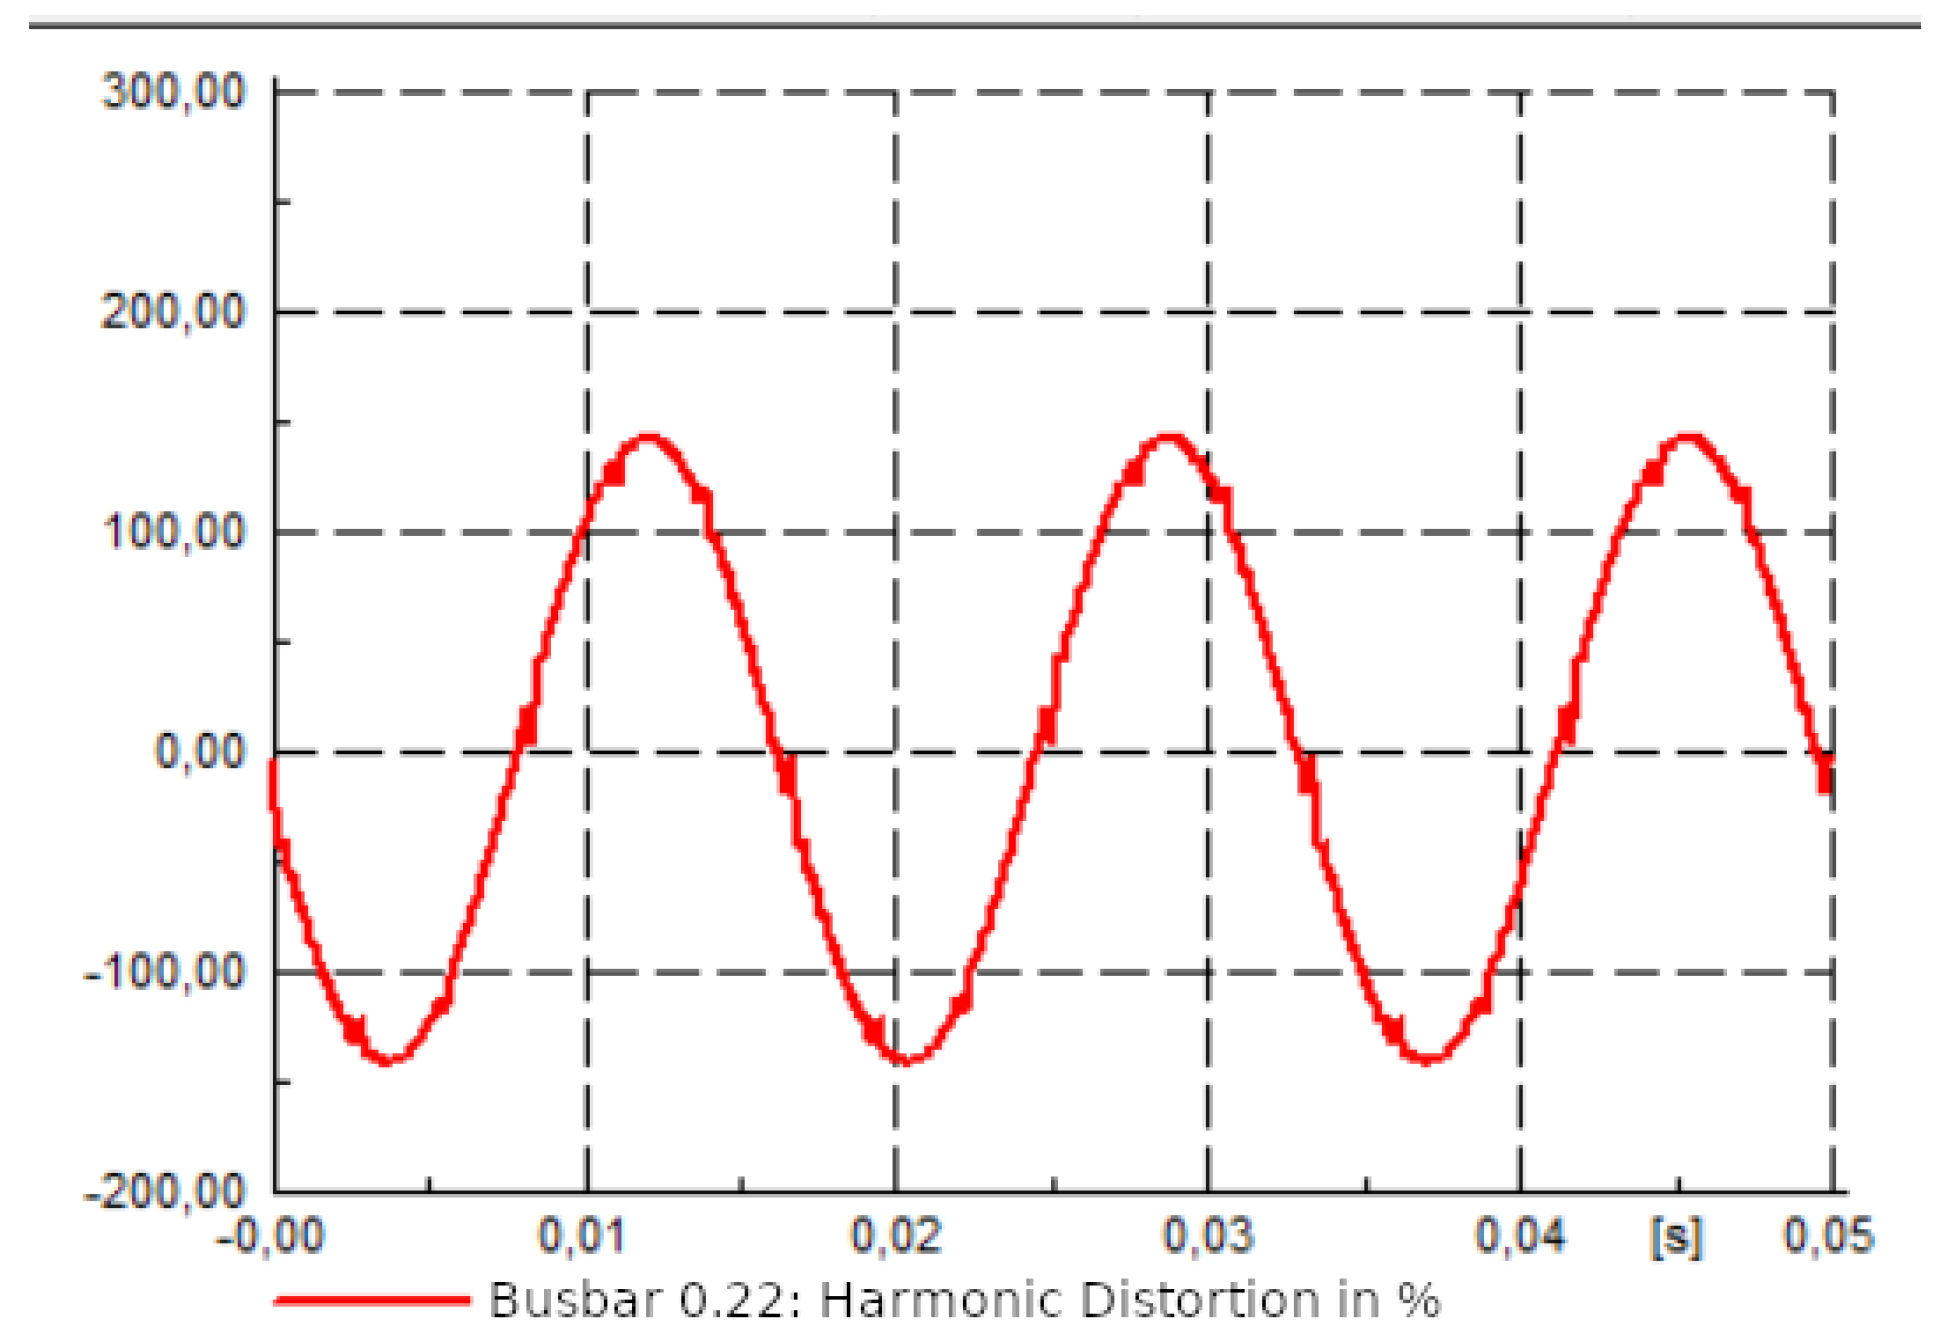
Figure 4 shows low harmonic distortion and minimal voltage variation on one of the transformer phases on the low voltage side.
Figure 4.
Voltage waveform analysis on the low voltage side (Voltage Variation and Harmonic Distortion).
Figure 4.
Voltage waveform analysis on the low voltage side (Voltage Variation and Harmonic Distortion).
Figure 5.
DIgSILENT simulation: (a) Harmonic distortion and rms voltage values on the low voltage side. (b) Active and Reactive Power Values on the low voltage side of the distribution transformer.
Figure 5.
DIgSILENT simulation: (a) Harmonic distortion and rms voltage values on the low voltage side. (b) Active and Reactive Power Values on the low voltage side of the distribution transformer.
From
Figure 5b, the power factor can be obtained, which is calculated as follows:
According to CONELEC regulation 004-01 [
18], the power factor obtained is acceptable since this regulation states that for good power quality, there must be a minimum power factor of 0.92 by the distribution transformer.
3.2. Impact on the electric distribution network
The first case considers three 100KVA transformation centers with a 600W wind turbine in each center.
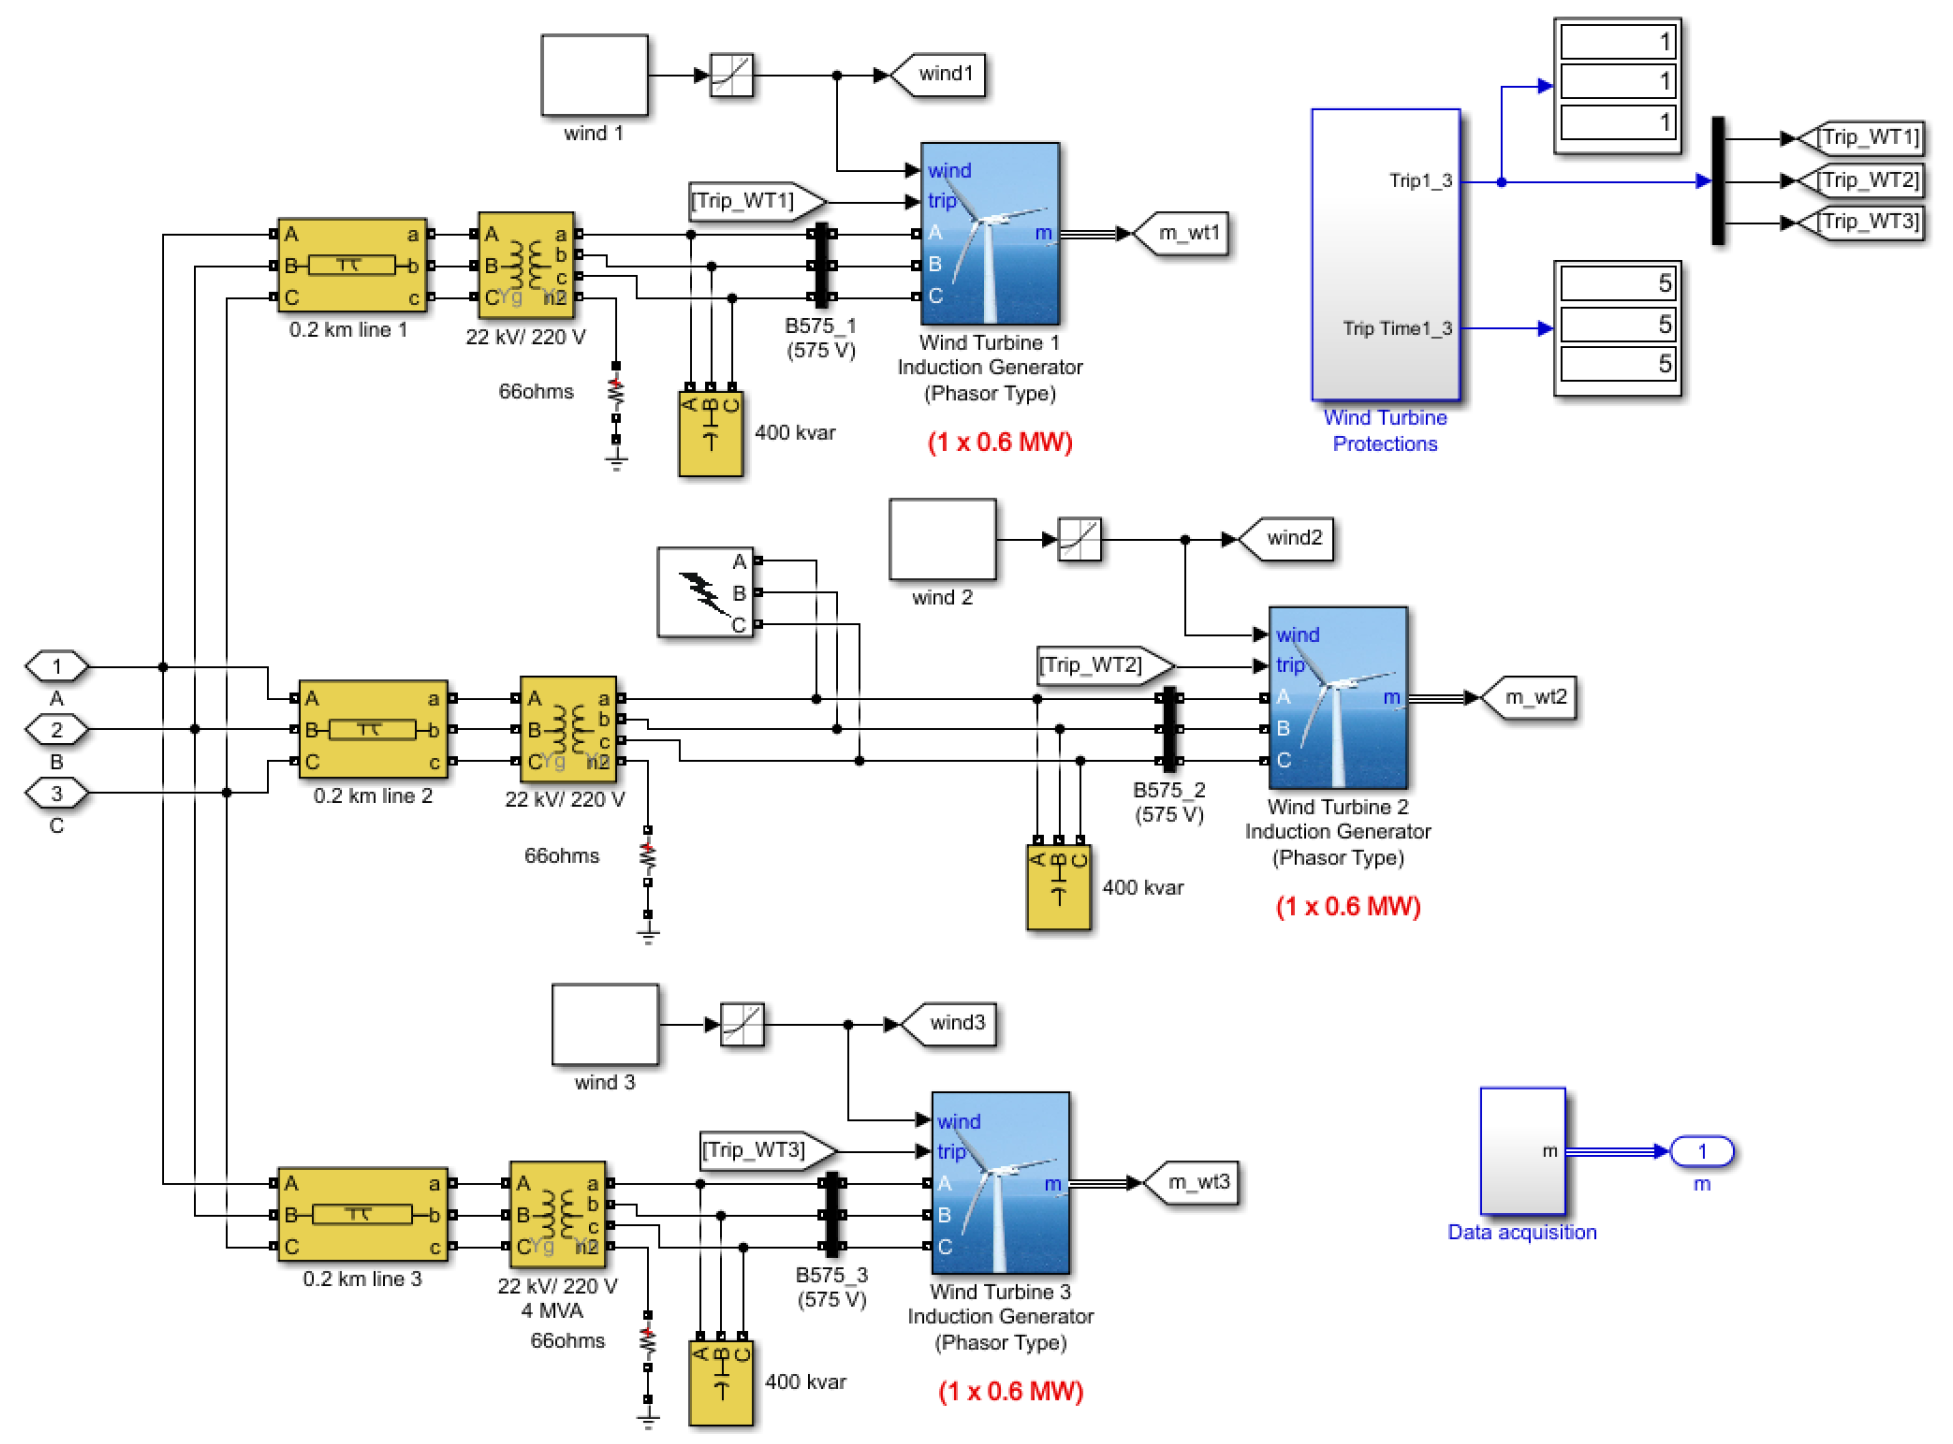
Figure 6 shows the 1800W generation block comprising three 600W wind turbines in an electrical power system connected through bus B25, where the system data acquisition will be performed.
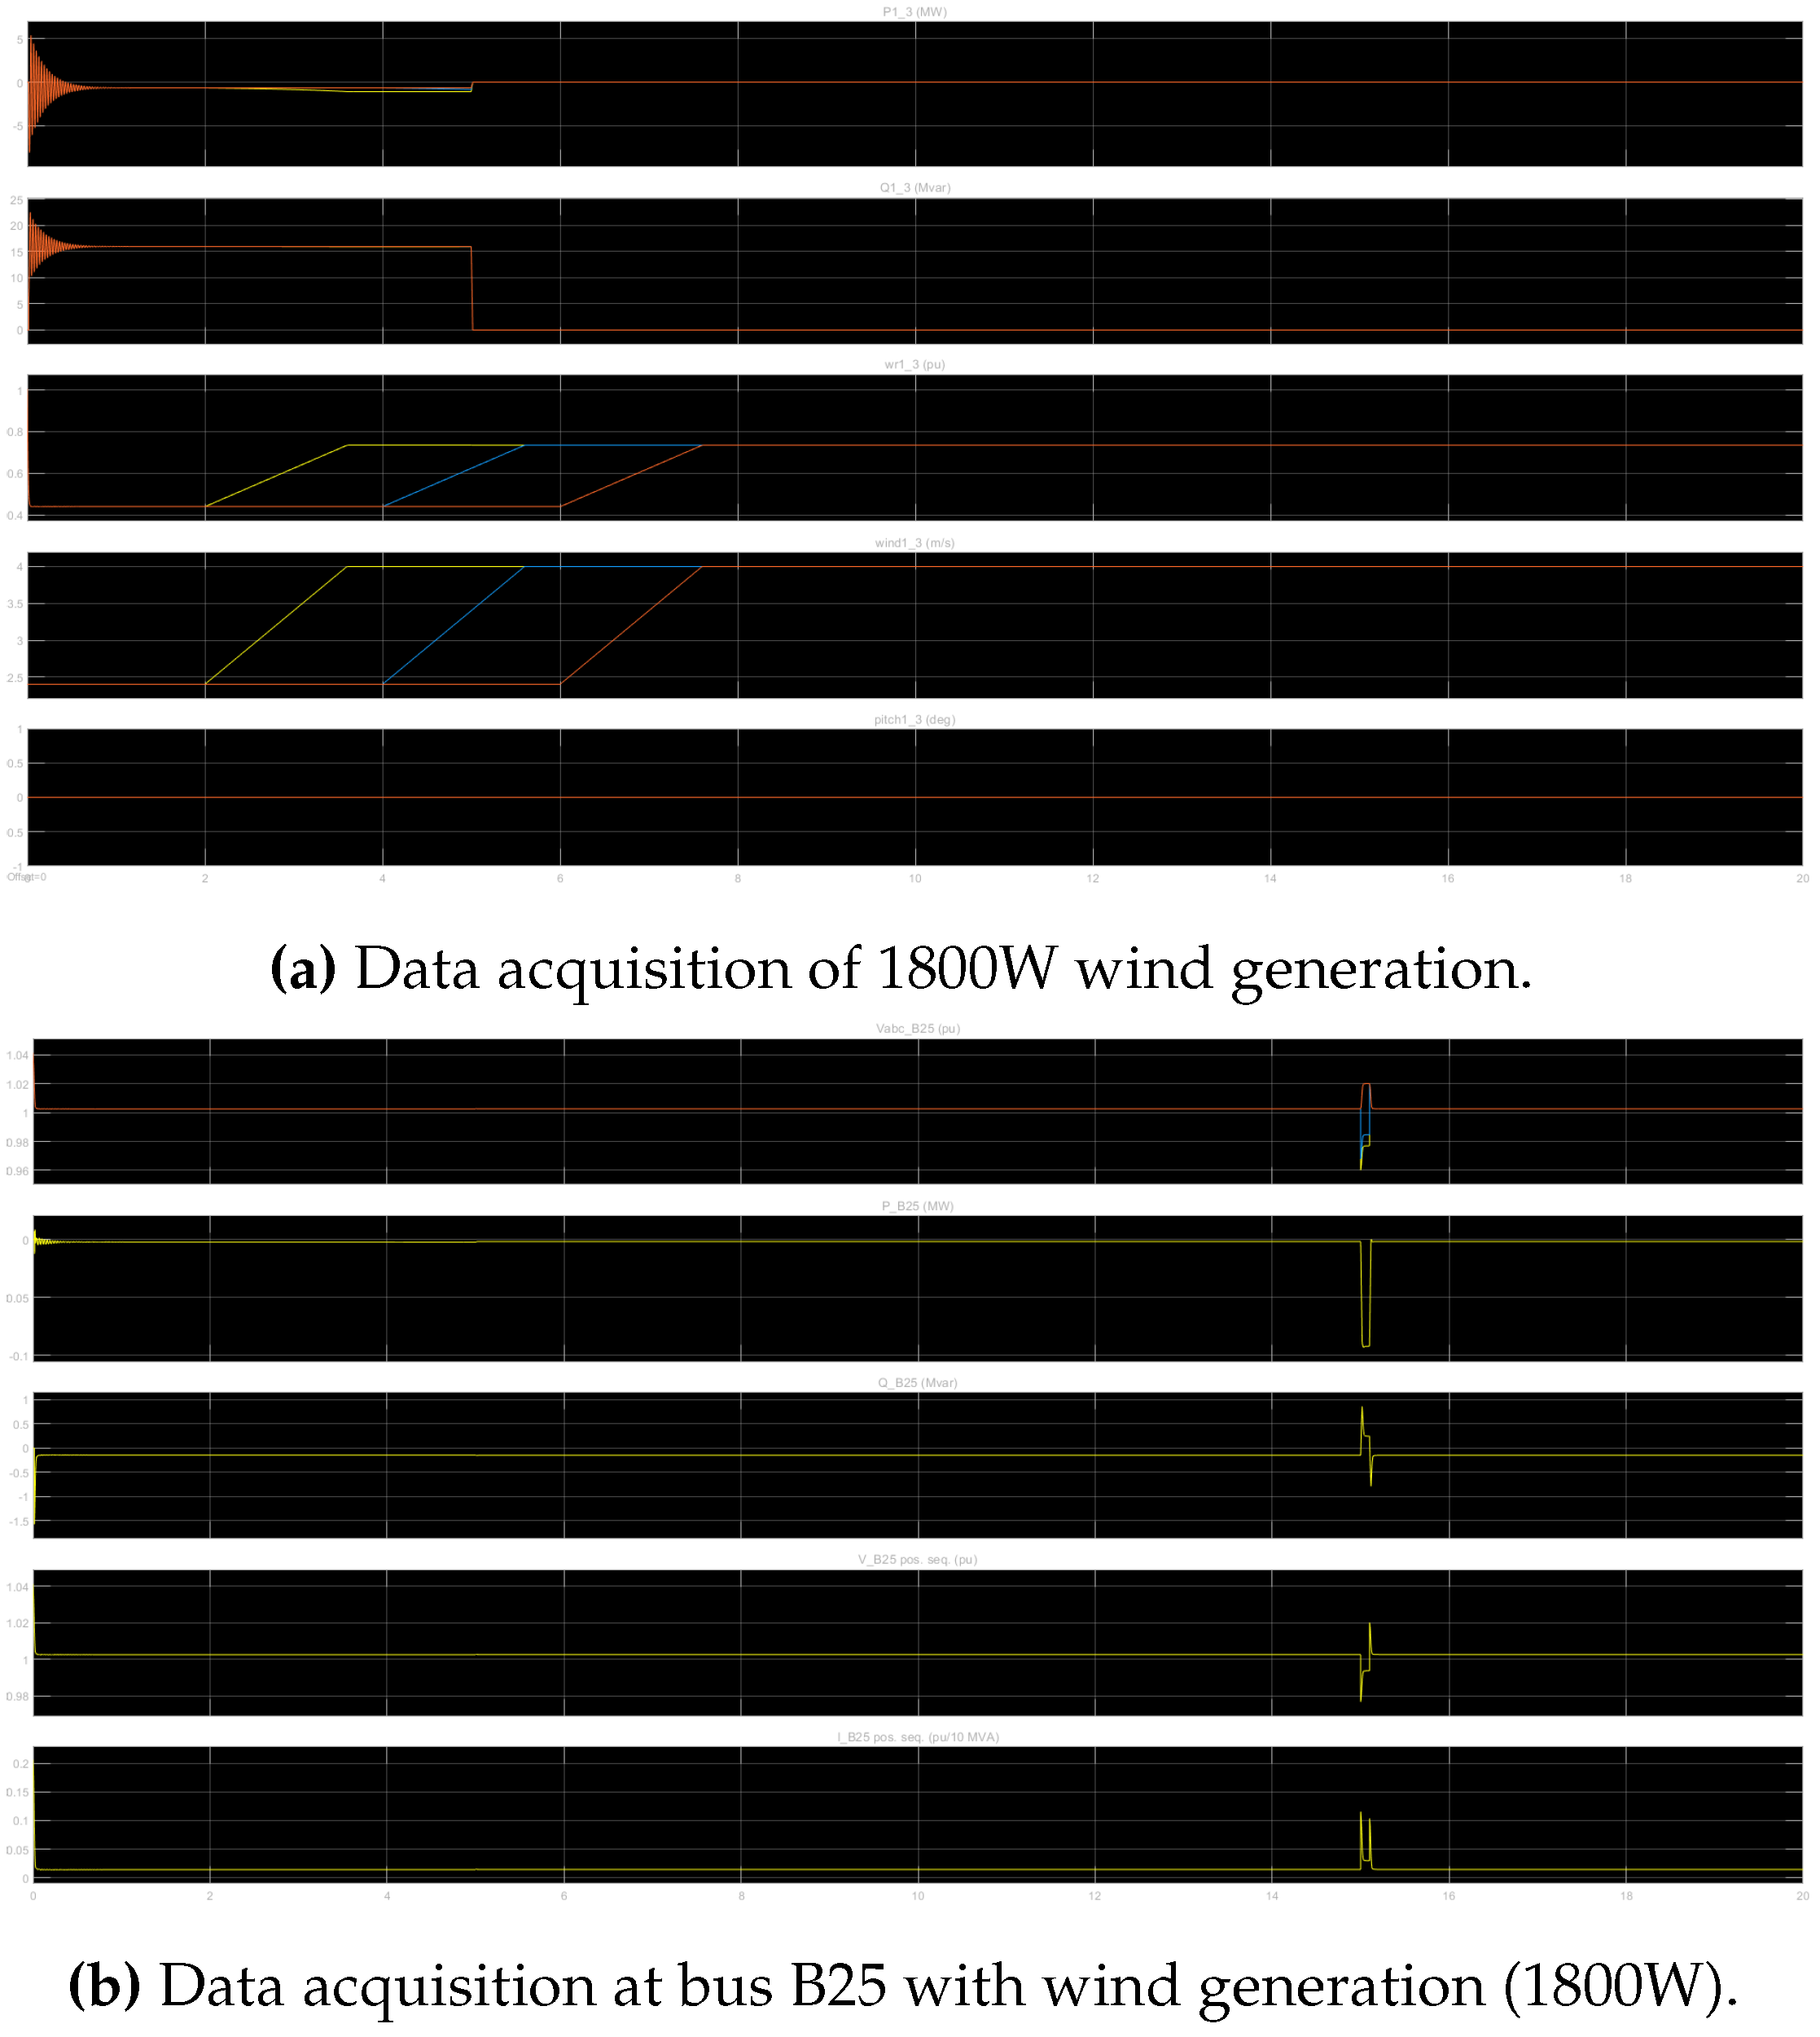
Setting the parameters for the 220v generators, frequency of 60Hz, a power factor of 0.9, wind speed range of 4 to 8 , and power of 100KVA with a primary voltage of 22KV and secondary voltage of 220v for the transformers, the following graphs are obtained:
Figure 7.
Data Acquisition.
Figure 7.
Data Acquisition.
4. Discusión
The results obtained in bus B25 of the electrical system considering the incorporation of three 600W wind turbines in the distribution network show linear waveforms in their different magnitudes; with this analysis, it can be observed that the quality parameters are met. From this analysis, it can be noticed that the quality parameters are met; both the voltage variation in low voltage (limit ), and harmonic distortion (THD, limit ), as shown in the graphs, they are below the acceptable limits established in the CONECEL 004-001 regulation. So, the generation by the wind turbines will not have any impact on the transformer substations.
According to the results obtained from the primary energy in the area under study, the wind turbine impact is less than , however, performing the analysis for nine wind turbines and the same working at maximum capacity generates an impact of 5.68% to the system. Using the simulation in DIgSILENT, it was possible to determine and compare the necessary parameters according to the CONECEL 004-01 regulation for an efficient power quality. Results were obtained for voltage variation, being this value and falling within limits according to the regulation, which provides a value of less than in sub-stage 1 and in sub-stage 2. In the case of total harmonic distortion (THD), the result is , well below the permitted value of and Finally, the power factor value is 0.98, exceeding the minimum acceptable value of 0.92 according to the regulation; therefore, the wind turbine does not impact the low-voltage transformer, and the system is considered a distributed generation. It was possible to determine through the Simulink program that adding the distribution network power generated by wind turbines less than the power of the transformation center does not impact the network. Therefore, accomplishing the necessary parameters according to the CONECEL 004-01 standard of efficient energy quality. It was also possible to determine the impact on the network in the case of power supplied to the network more than the power of the transformer substations; the impact on the grid is the predominance of wind turbine power towards the load. Thus forming harmonic distortion greater than the limit (THD, ) established in the ARCONEL regulation demonstrates that they do not comply with the power quality parameters.
Funding
This research received no external funding.
Institutional Review Board Statement
Not applicable.
Informed Consent Statement
Not applicable.
Data Availability Statement
Not applicable.
Conflicts of Interest
The authors declare no conflict of interest.
Abbreviations
The following abbreviations are used in this manuscript:
| CIITT |
Center for Research, Innovation, and Technology Transfer |
| ARCONEL |
Electricity Regulation and Control Agency |
| PQ |
Power Quality |
| IEC |
International Electrothecnical Commission |
References
- Yang, J.; Li, G.; Wu, D.; Suo, Z. The impact of distributed wind power generation on voltage stability in distribution systems. In Proceedings of the 2013 IEEE PES Asia-Pacific Power and Energy Engineering Conference (APPEEC); 2013; pp. 1–5, ISSN: 2157-4847. [Google Scholar] [CrossRef]
- Balamurugan, K.; Srinivasan, D.; Reindl, T. Impact of Distributed Generation on Power Distribution Systems. Energy Procedia 2012, 25, 93–100, Publisher: Elsevier. [Google Scholar] [CrossRef]
- Agency., I.R.E. Agency., I.R.E. Renewable Capacity Statistics 2022. Technical report, 2022.
- Tomsovic, K.L.; Venkatasubramanian, V.M. Power System Operation and Control. 2004.
- Vezzoli, C.; Ceschin, F.; Osanjo, L.; M’Rithaa, M.K.; Moalosi, R.; Nakazibwe, V.; Diehl, J.C. Distributed/Decentralised Renewable Energy Systems. In Designing Sustainable Energy for All: Sustainable Product-Service System Design Applied to Distributed Renewable Energy; Vezzoli, C., Ceschin, F., Osanjo, L., M’Rithaa, M.K., Moalosi, R., Nakazibwe, V., Diehl, J.C., Eds.; Green Energy and Technology, Springer International Publishing: Cham, 2018; pp. 23–39. [Google Scholar] [CrossRef]
- Kersting, W.H. Distribution System Modeling and Analysis, 4th edition ed.; CRC Press: Boca Raton, 2017. [Google Scholar]
- Shafiullah, G.M.; Oo, A.M.T.; Ali, A.B.M.S.; Stojcevski, A. Influences of Wind Energy Integration into the Distribution Network. Journal of Wind Energy 2013, 2013, 1–21, Publisher: Hindawi Limited. [Google Scholar] [CrossRef]
- Ibrahim, H.; Ghandour, M.; Dimitrova, M.; Ilinca, A.; Perron, J. Integration of Wind Energy into Electricity Systems: Technical Challenges and Actual Solutions. Energy Procedia 2011, 6, 815–824. [Google Scholar] [CrossRef]
- Thomas Allen Short. Electric Power Distribution Handbook, 2nd edition ed.; CRC Press: Boca Raton, 2014. [Google Scholar]
- Coster, E.J.; Myrzik, J.M.A.; Kruimer, B.; Kling, W.L. Integration Issues of Distributed Generation in Distribution Grids. Proceedings of the IEEE 2011, 99, 28–39, Conference Name: Proceedings of the IEEE. [Google Scholar] [CrossRef]
- Ackermann, T.; Knyazkin, V. Interaction between distributed generation and the distribution network: operation aspects. In Proceedings of the IEEE/PES Transmission and Distribution Conference and Exhibition; 2002; Vol. 2, pp. 1357–1362. [Google Scholar] [CrossRef]
- Aggarwal, M.; Singh, M.; Gupta, S.K. Improving voltage profile of load bus of wind generation system using DSTATCOM. Journal of Energy in Southern Africa 2015, 26, 81–87, Publisher: University of Cape Town. [Google Scholar] [CrossRef]
- Kumar, P. A Review on Power Quality in Grid Connected Renewable Energy System. CVR Journal of Science and Technology 2013, 5, 57–61. [Google Scholar] [CrossRef]
- Manyonge, A.; Manyala, R.; Onyango, F.; Shichika, J. Mathematical Modelling of Wind Turbine in a Wind Energy Conversion System: Power Coefficient Analysis. Applied Mathematical Sciences 2012, 6, 4527–4536. [Google Scholar]
- Mukund, R. Patel. Wind and Solar Power Systems Design, Analysis, and Operation, 2nd edition ed.; CRC Press: Boca Raton, 2005. [Google Scholar]
- Martinez-Velasco, J.A. (Ed.) Power System Transients: Parameter Determination; CRC Press: Boca Raton, 2017. [Google Scholar] [CrossRef]
- Seguro, J.V.; Lambert, T.W. Modern estimation of the parameters of the Weibull wind speed distribution for wind energy analysis. Journal of Wind Engineering and Industrial Aerodynamics 2000, 85, 75–84. [Google Scholar] [CrossRef]
- CONELEC. Regulacion-No.-CONELEC-004-01. Directorio del Consejo Nacional de Electricidad, 2001. Directorio del Consejo Nacional de Electricidad.
|
Disclaimer/Publisher’s Note: The statements, opinions and data contained in all publications are solely those of the individual author(s) and contributor(s) and not of MDPI and/or the editor(s). MDPI and/or the editor(s) disclaim responsibility for any injury to people or property resulting from any ideas, methods, instructions or products referred to in the content. |
© 2023 by the authors. Licensee MDPI, Basel, Switzerland. This article is an open access article distributed under the terms and conditions of the Creative Commons Attribution (CC BY) license (http://creativecommons.org/licenses/by/4.0/).
