Submitted:
06 June 2023
Posted:
06 June 2023
You are already at the latest version
Abstract
Keywords:
1. Introduction
2. Materials and Methods
2.1. Materials
2.2. Intercalation and modification of sericite
2.3. Preparation of composite coatings
2.4. Materials characterization
2.5. Corrosion evaluation
3. Results
3.1. Characterization of sericite before and after pretreatment
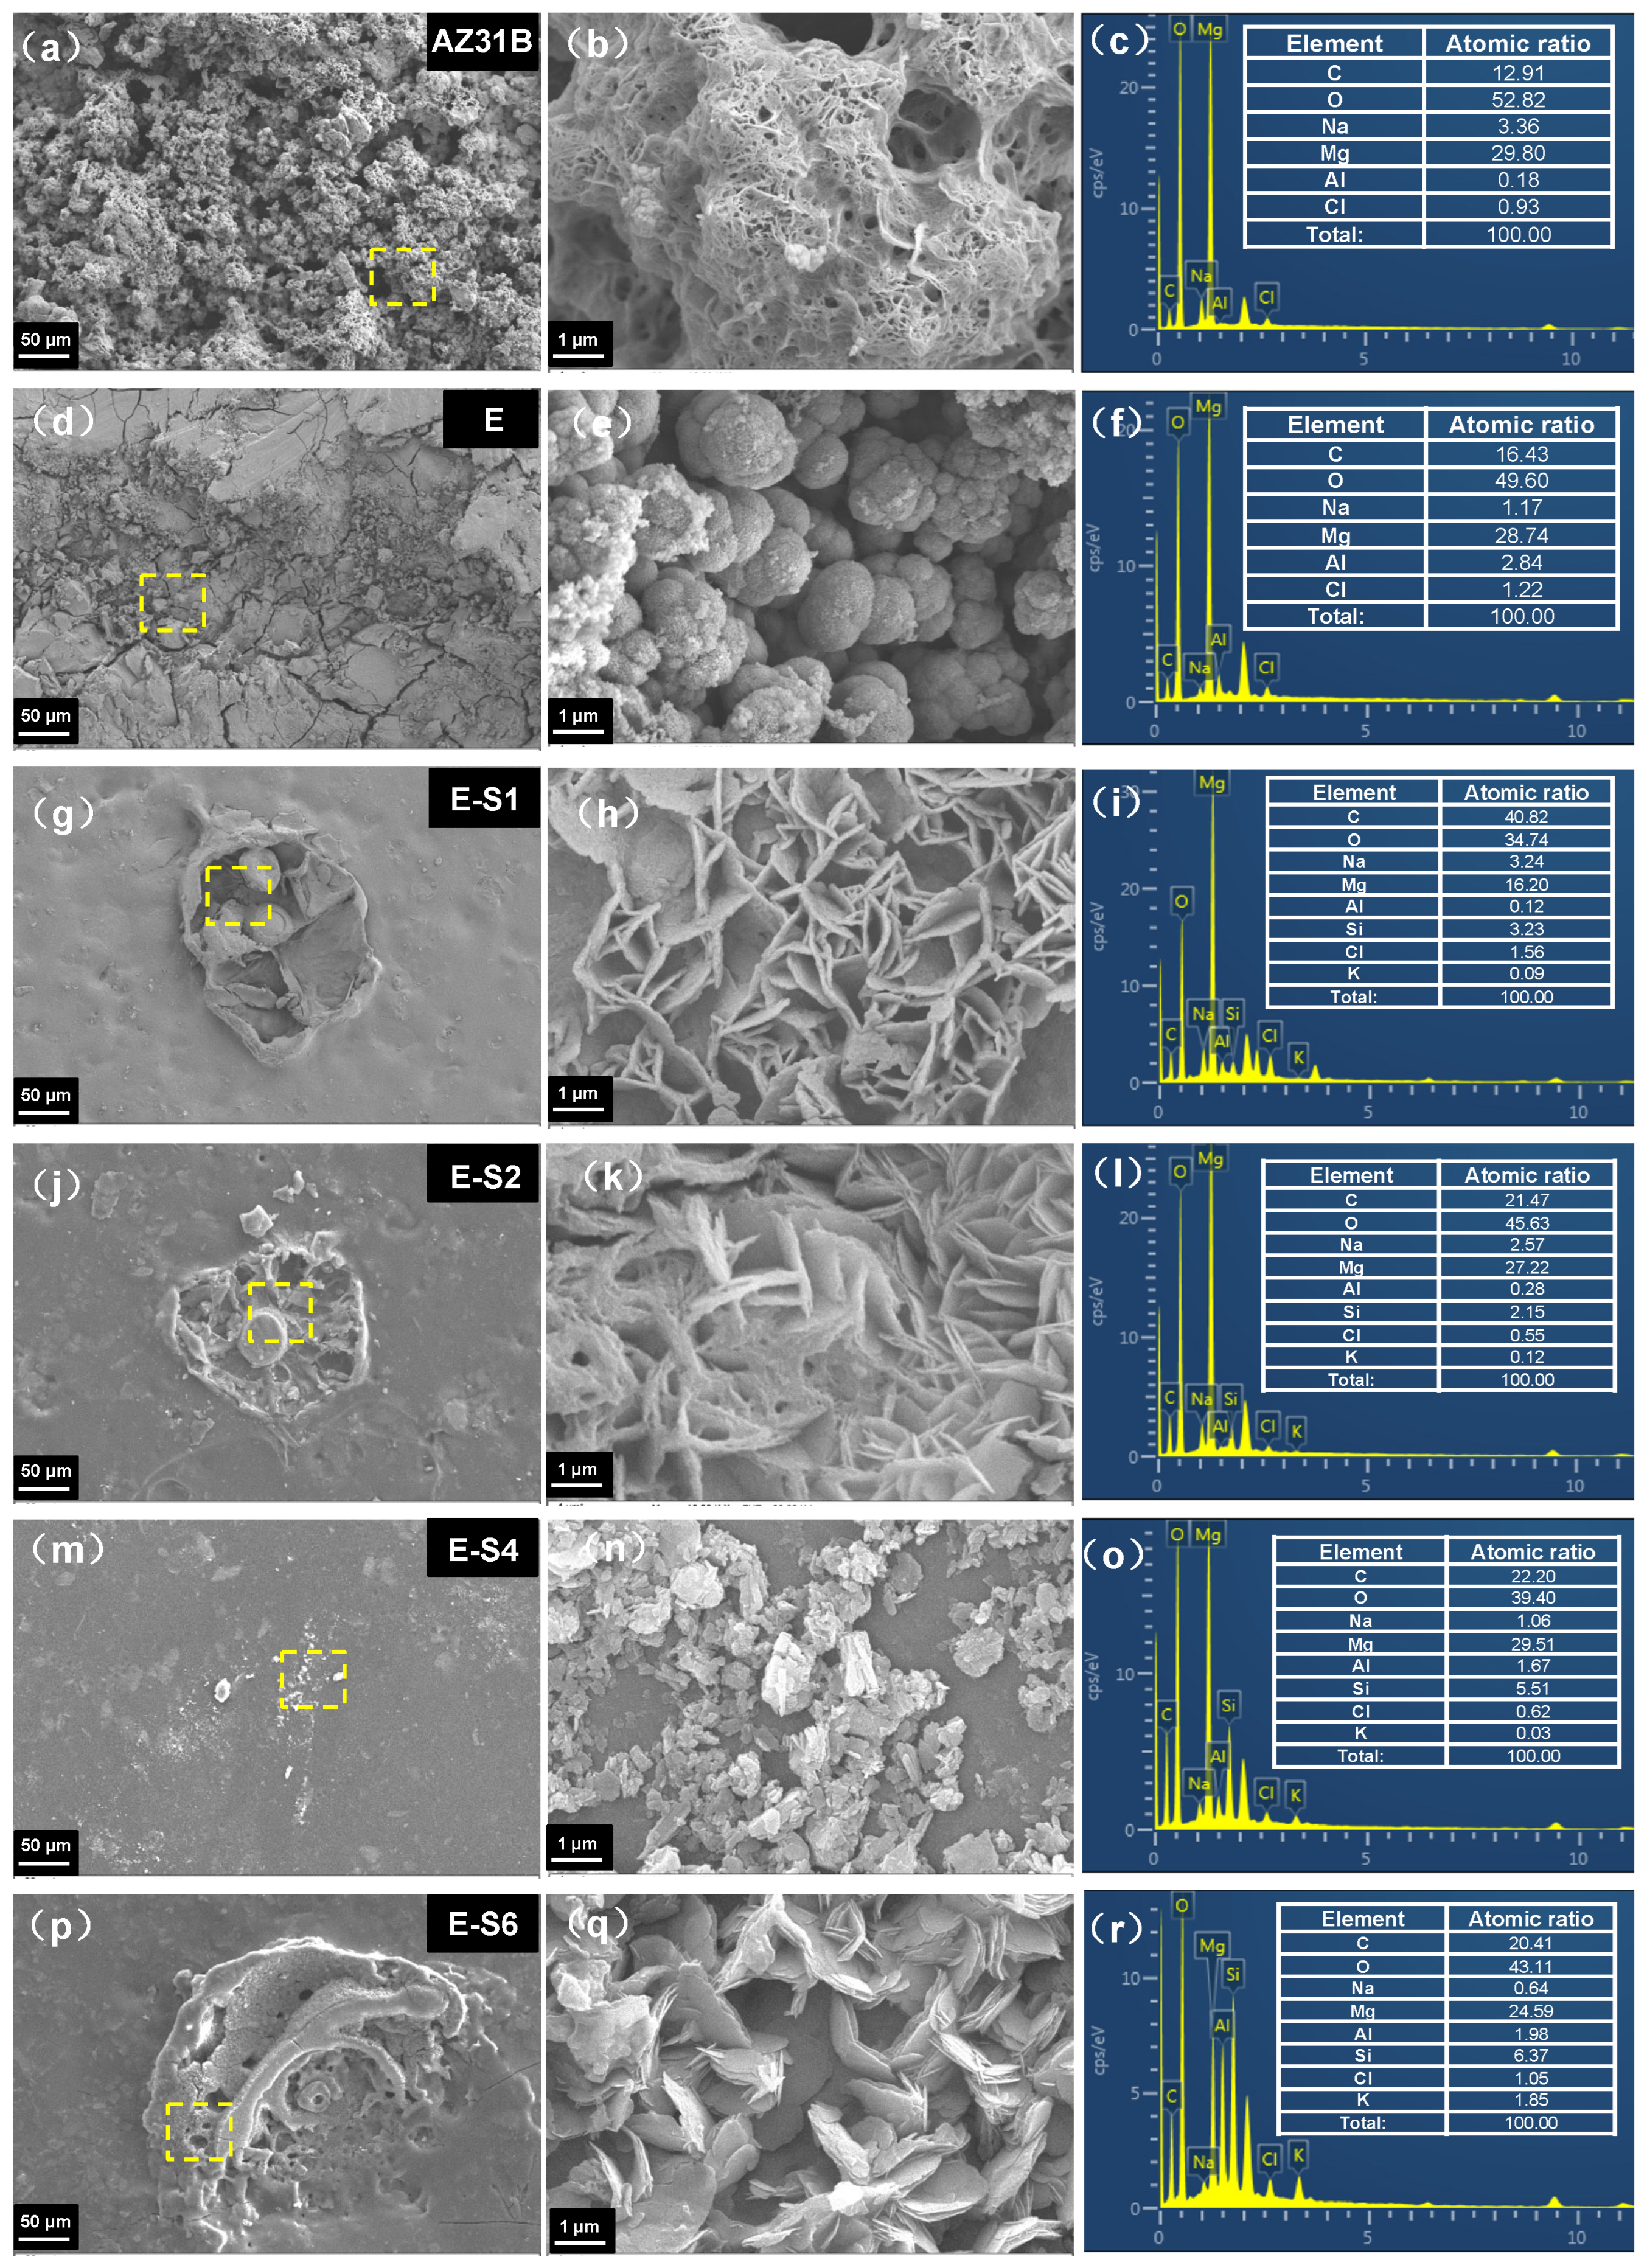
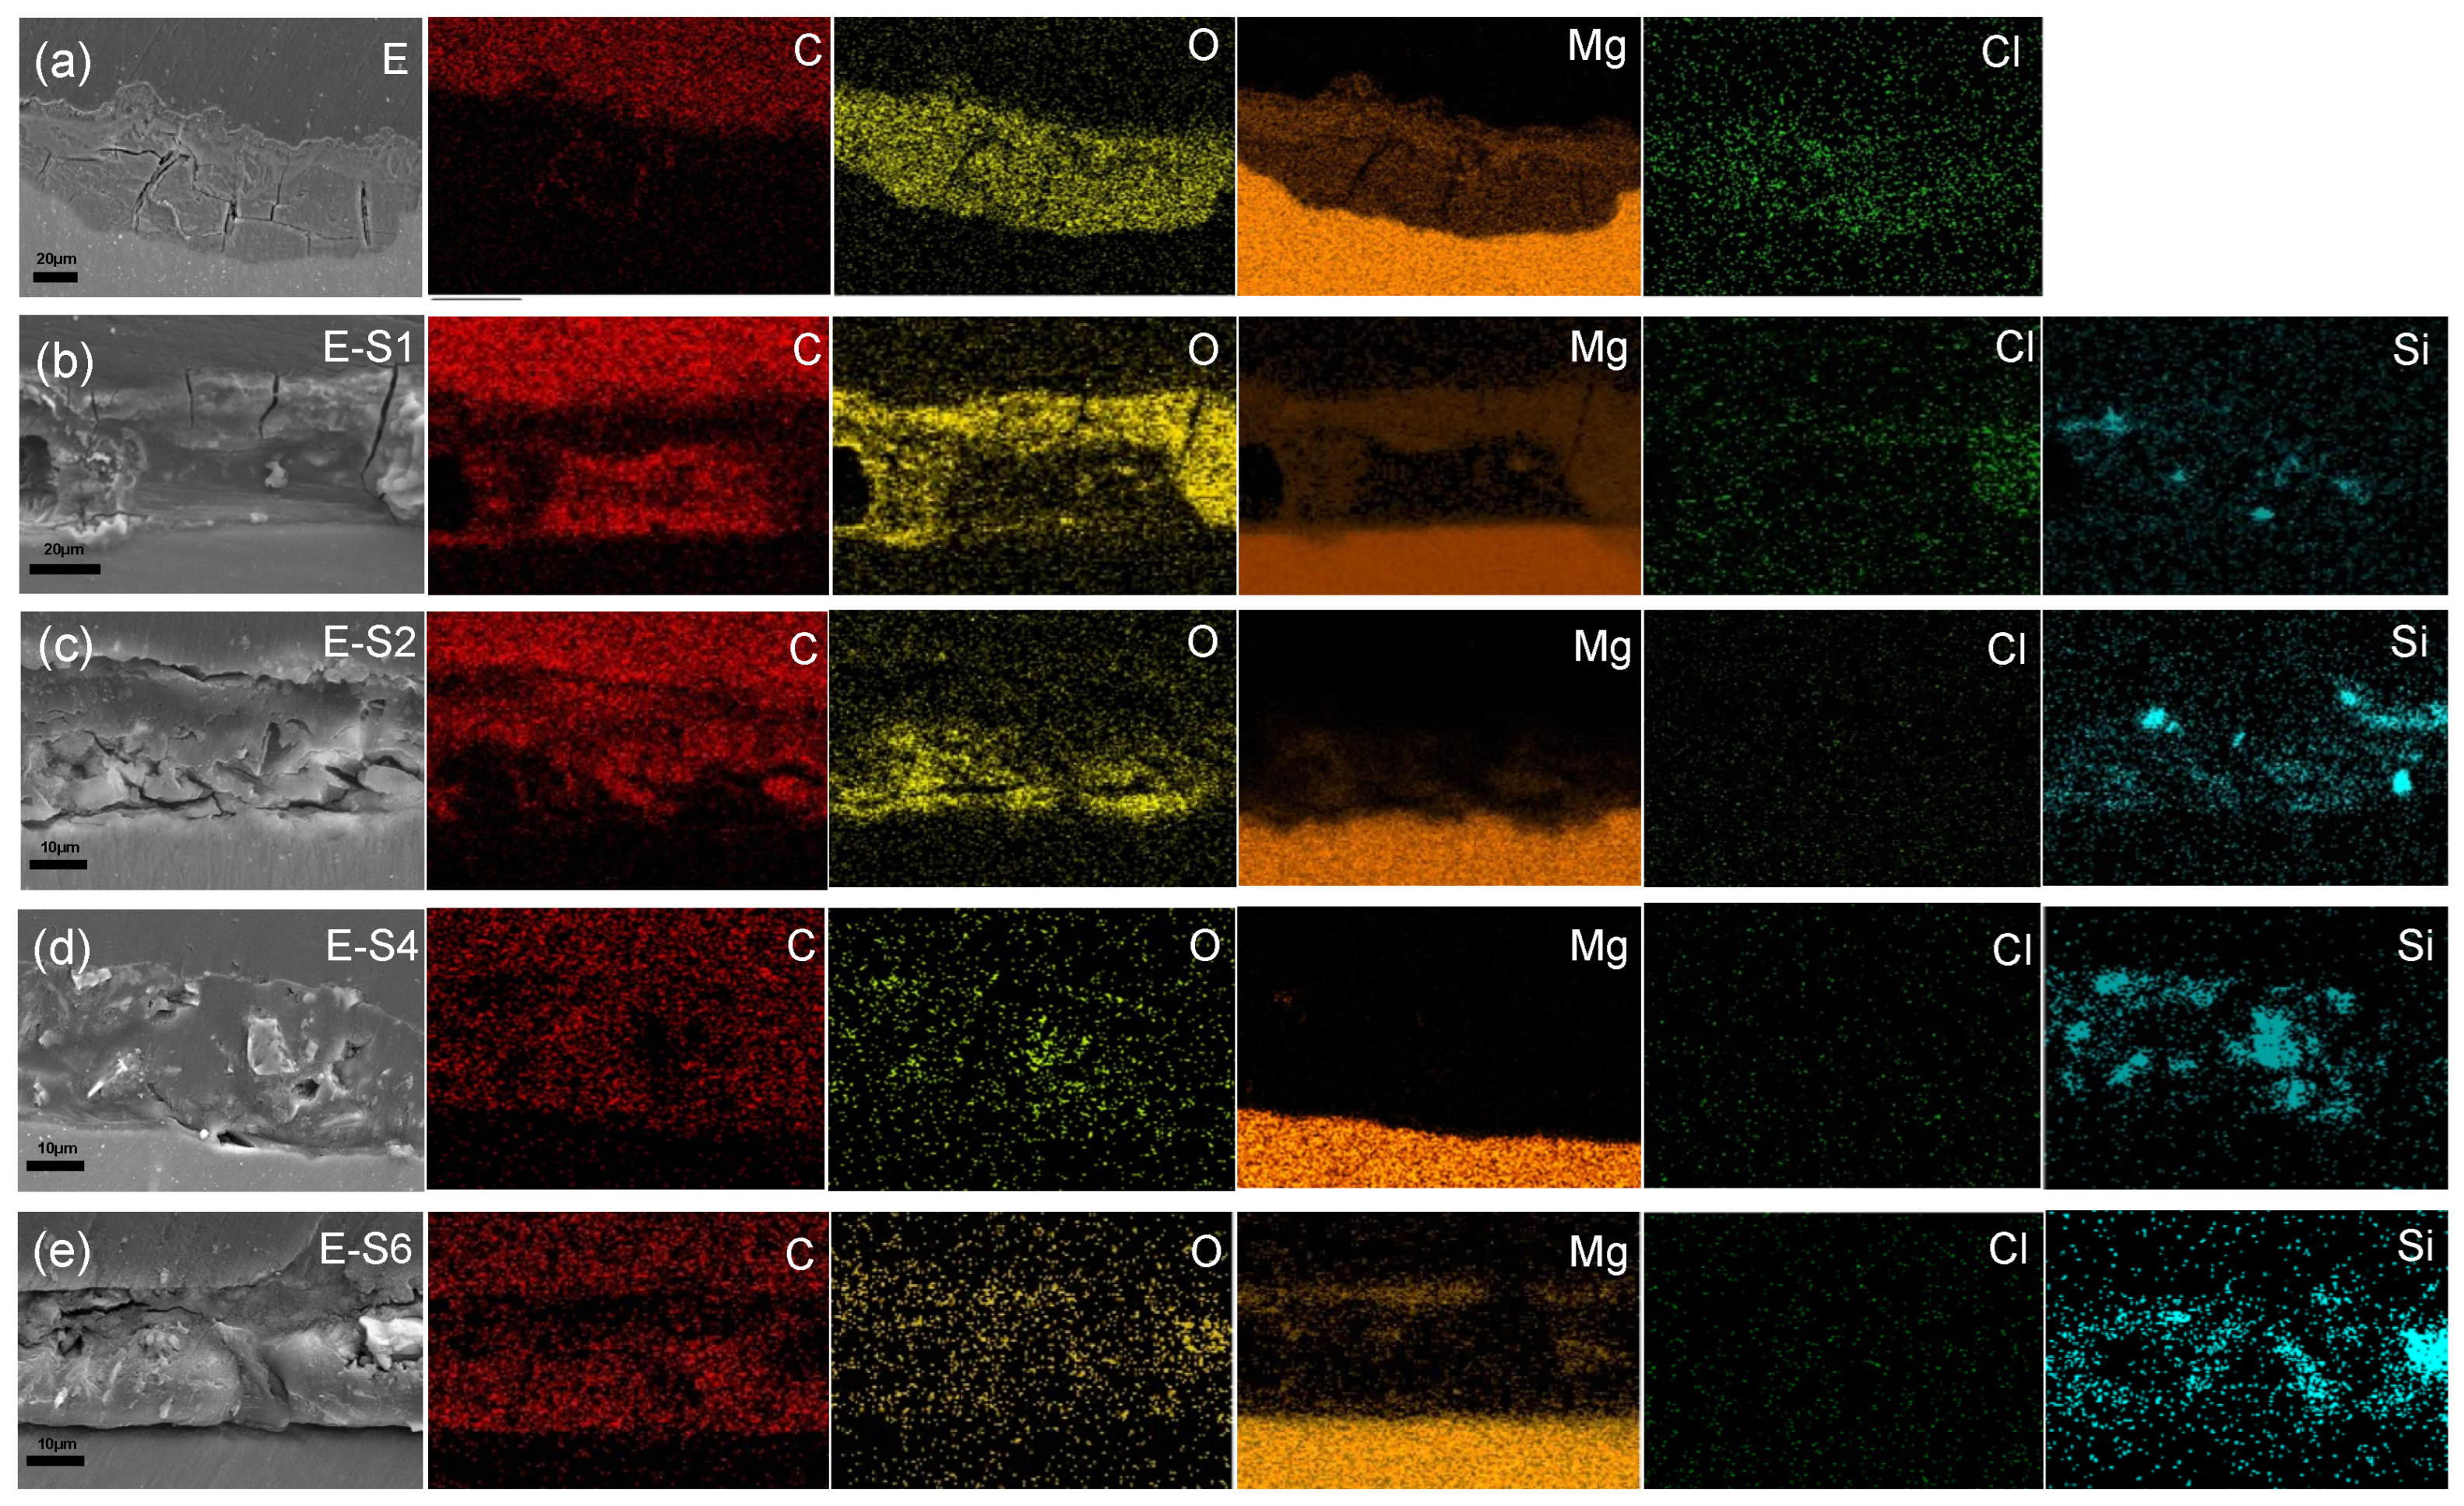
3.2. Surface morphology and cross-section of coatings
3.3. Electrochemical corrosion tests
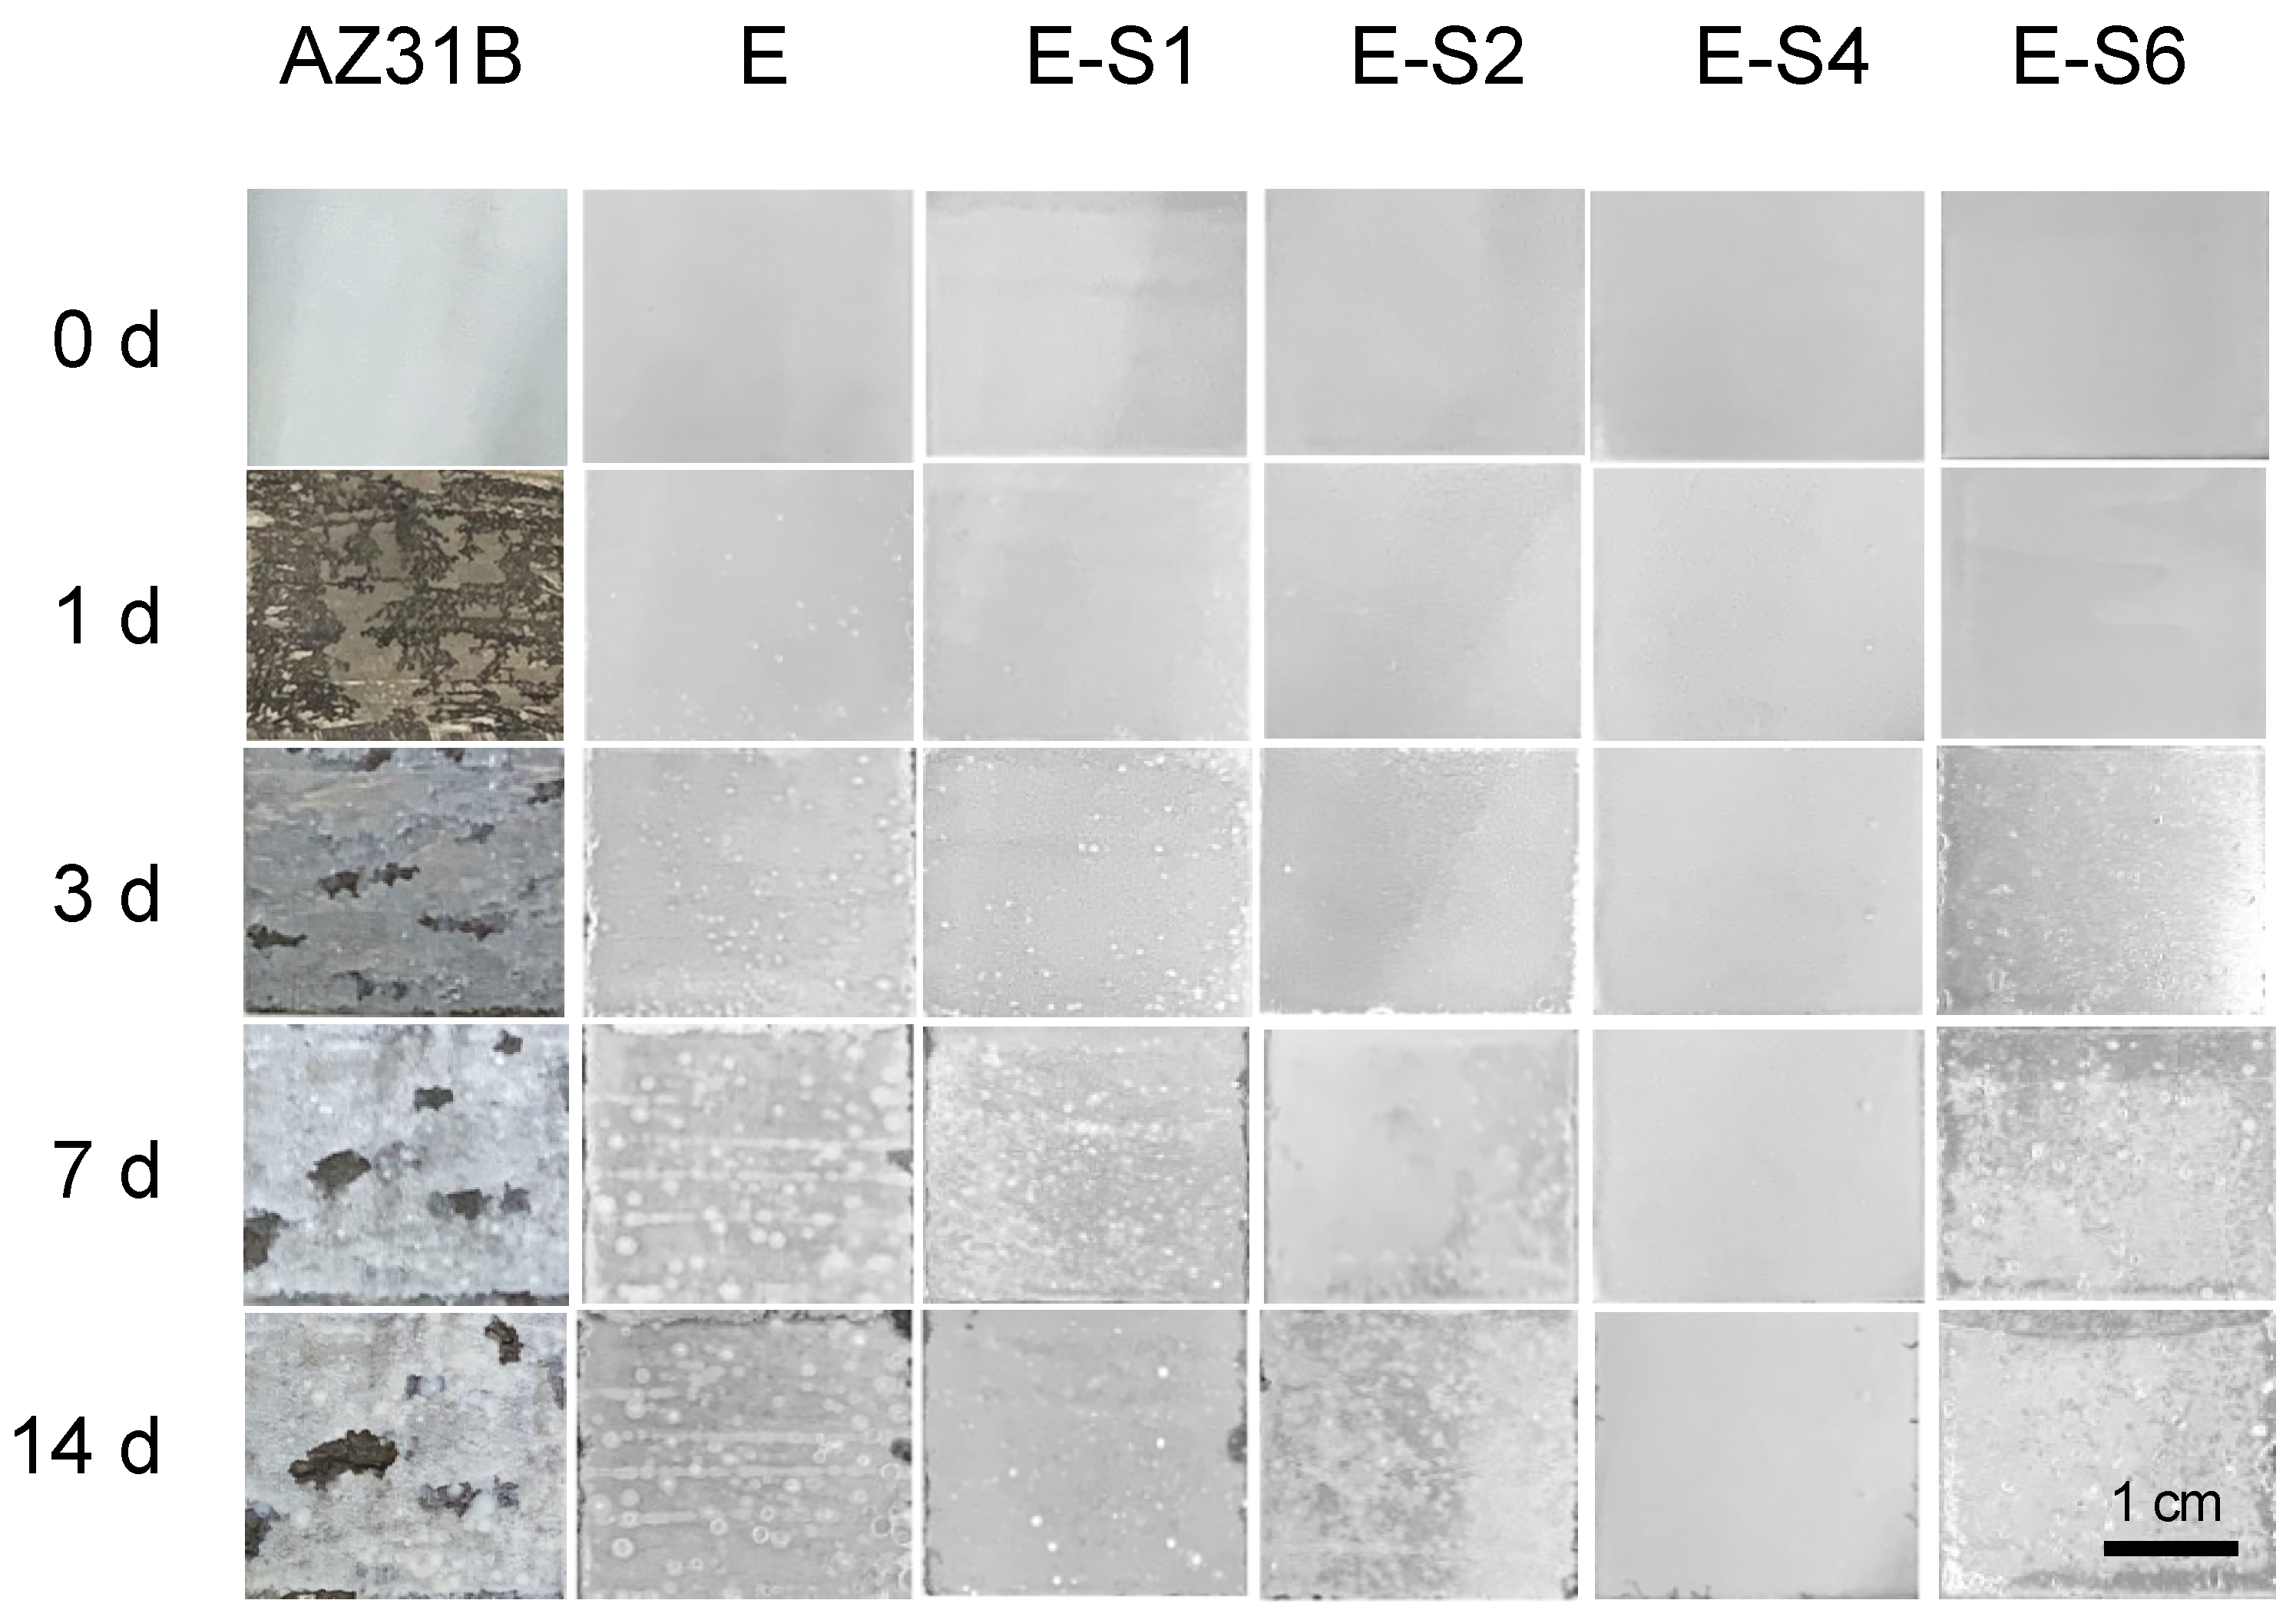
3.4. Immersion tests
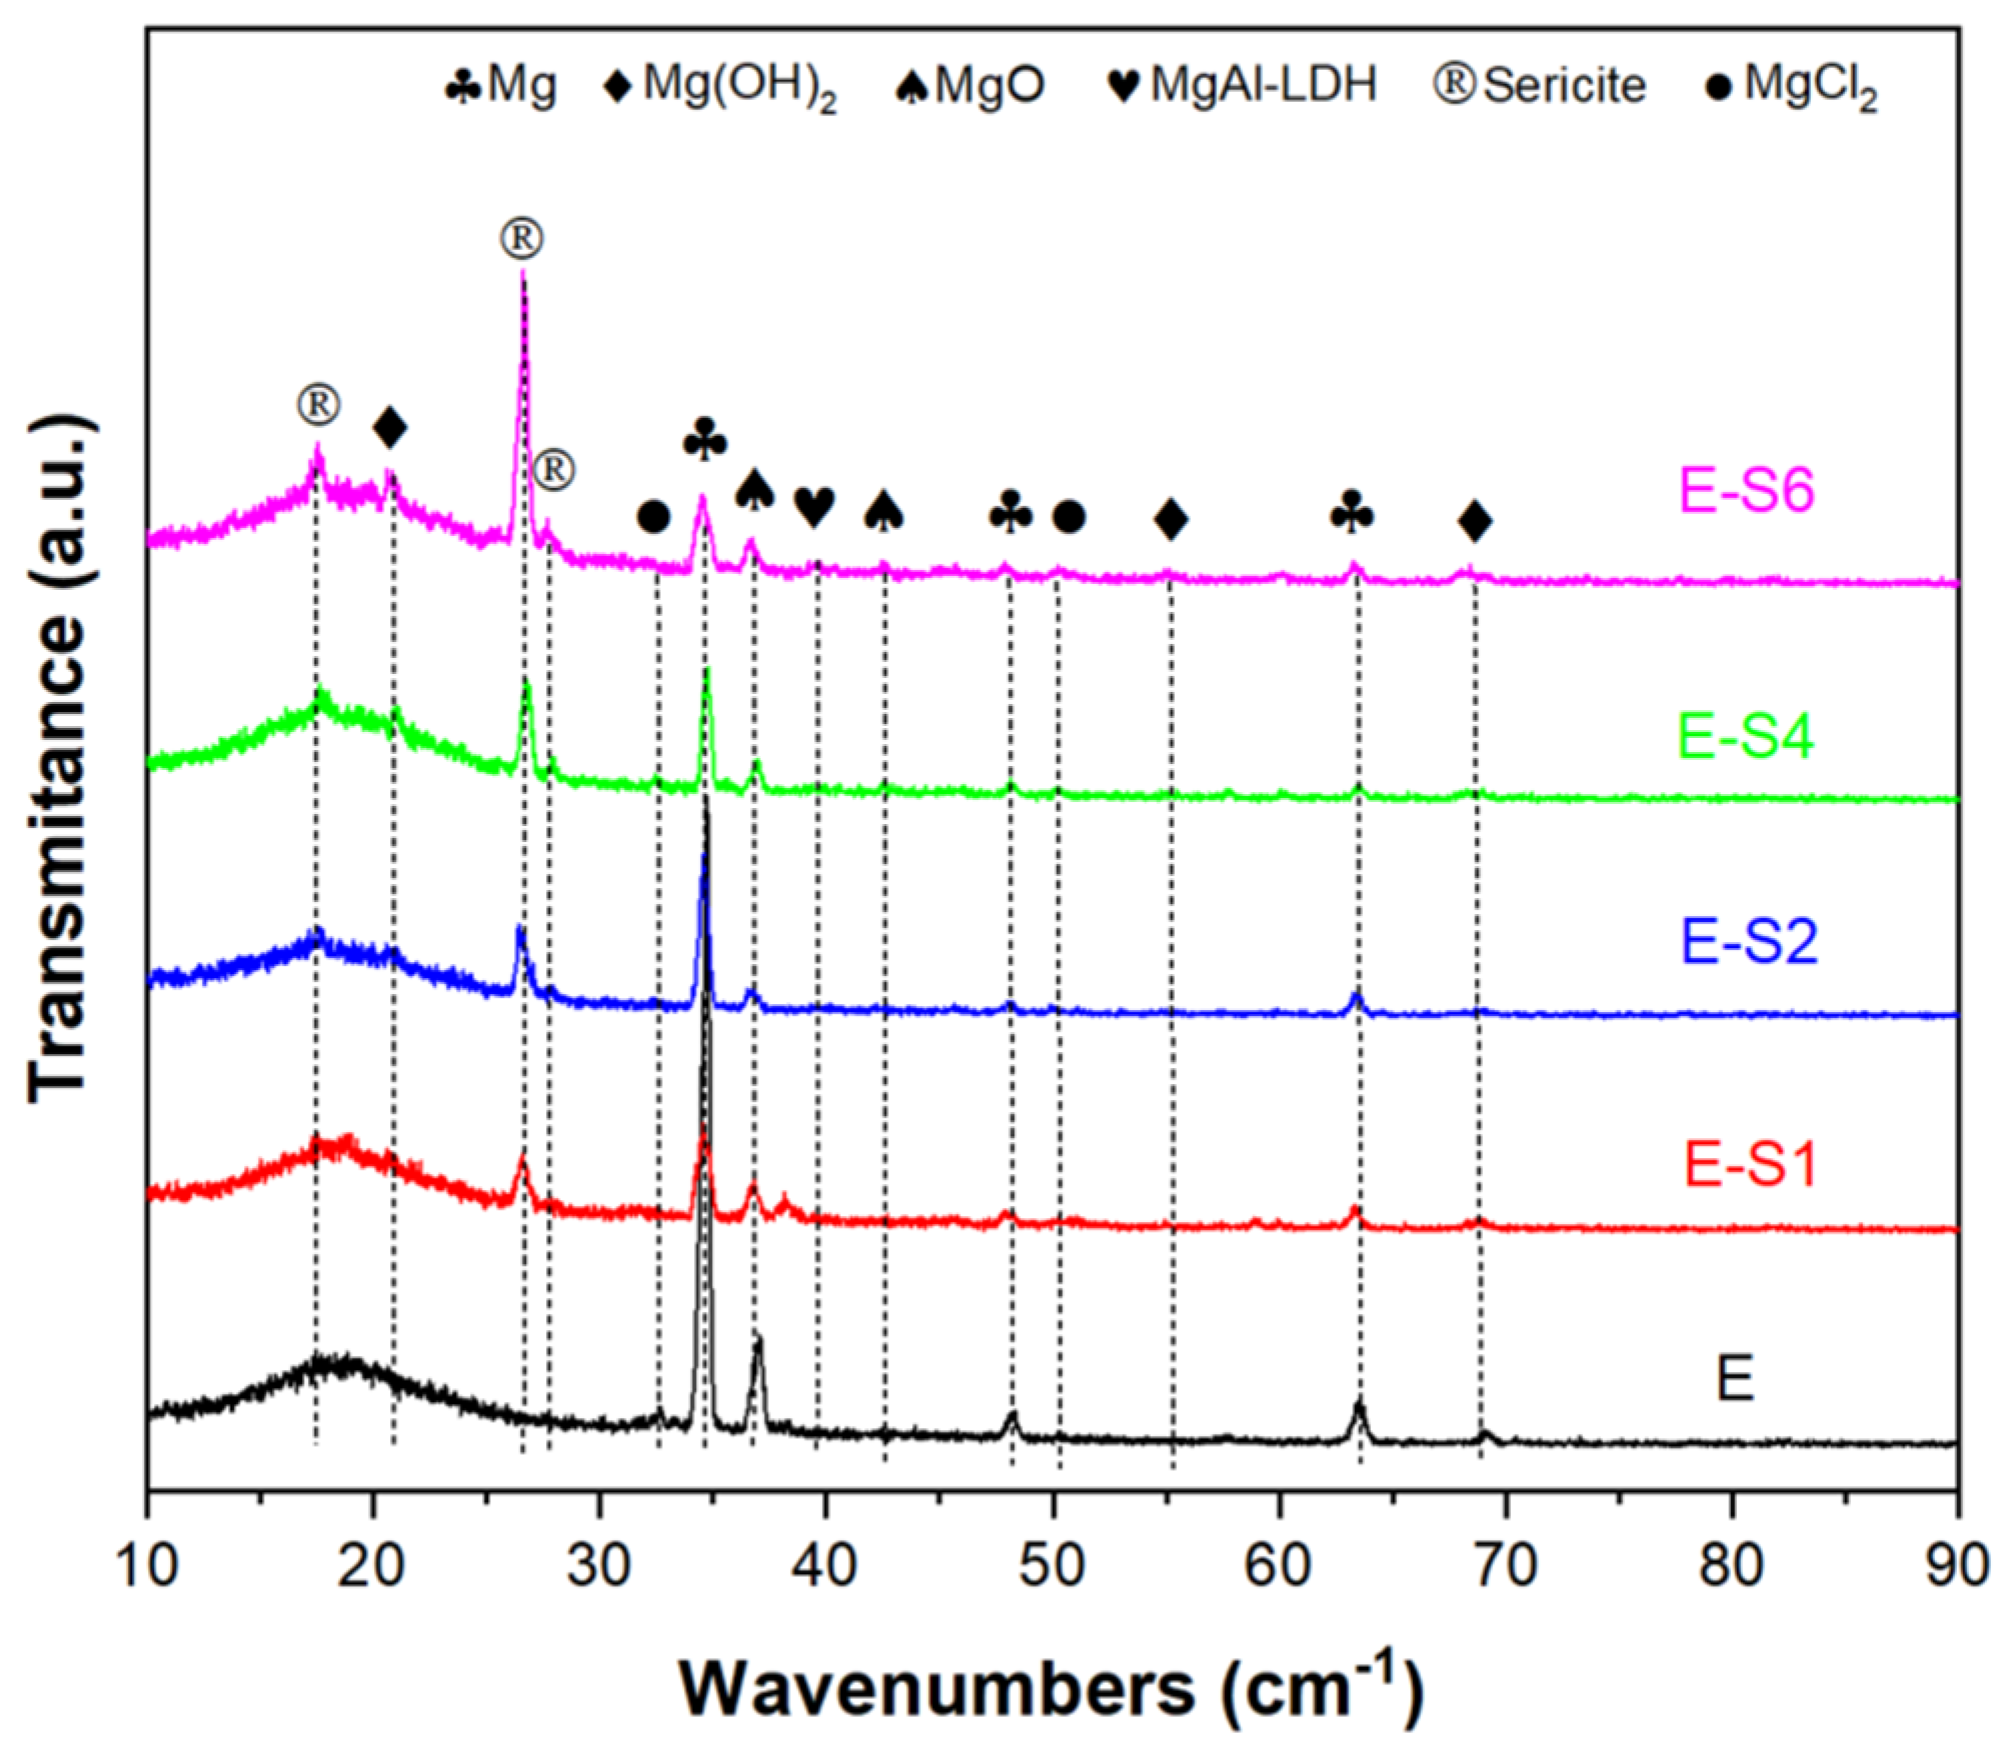
3.5. Corrosion products analysis
4. Discussion
5. Conclusions
Author Contributions
Funding
Conflicts of Interest
References
- Chu, S.; Majumdar, A. Opportunities and challenges for a sustainable energy future. Nature 2012, 488, 294–303. [Google Scholar] [CrossRef]
- Esmaily, M.; Svensson, J.E.; Fajardo, S.; Birbilis, N.; Frankel, G.S.; Virtanen, S.; Arrabal, R.; Thomas, S.; Johansson, L.G. Fundamentals and advances in magnesium alloy corrosion. Progress in Materials Science 2017, 89, 92–193. [Google Scholar] [CrossRef]
- Yu, D.; Qiu, H.; Mou, X.; Dou, Z.; Zhou, N.; Guo, Q.; Lyu, N.; Lu, L.; Yang, Z.; Huang, N. One-Pot but Two-Step Vapor-Based Amine- and Fluorine-Bearing Dual-Layer Coating for Improving Anticorrosion and Biocompatibility of Magnesium Alloy. ACS Biomater Sci Eng 2019, 5, 4331–4340. [Google Scholar] [CrossRef] [PubMed]
- Xu, B.; Sun, J.; Han, J.; Yang, Z.; Zhou, H.; Xiao, L.; Xu, S.; Han, Y.; Ma, A.; Wu, G. Effect of hierarchical precipitates on corrosion behavior of fine-grain magnesium-gadolinium-silver alloy. Corrosion Science 2022, 194, 109924. [Google Scholar] [CrossRef]
- Lu, X.; Li, Y.; Ju, P.; Chen, Y.; Yang, J.; Qian, K.; Zhang, T.; Wang, F. Unveiling the inhibition mechanism of an effective inhibitor for AZ91 Mg alloy. Corrosion Science 2019, 148, 264–271. [Google Scholar] [CrossRef]
- Wang, C.; Wu, L.; Xue, F.; Ma, R.; Etim, I.-I.N.; Hao, X.; Dong, J.; Ke, W. Electrochemical noise analysis on the pit corrosion susceptibility of biodegradable AZ31 magnesium alloy in four types of simulated body solutions. Journal of Materials Science & Technology 2018, 34, 1876–1884. [Google Scholar] [CrossRef]
- Chen, Y.; Lu, X.; Blawert, C.; Zheludkevich, M.L.; Zhang, T.; Wang, F. Formation of self-lubricating PEO coating via in-situ incorporation of PTFE particles. Surface and Coatings Technology 2018, 337, 379–388. [Google Scholar] [CrossRef]
- Song, Z.; Xie, Z.; Ding, L.; Zhang, Y.; Hu, X. Preparation of corrosion-resistant MgAl-LDH/Ni composite coating on Mg alloy AZ31B. Colloids and Surfaces A: Physicochemical and Engineering Aspects 2022, 632. [Google Scholar] [CrossRef]
- Yilmaz, O. A hybrid polyacrylate/OMMT nanocomposite latex: Synthesis, characterization and its application as a coating binder. Progress in Organic Coatings 2014, 77, 110–117. [Google Scholar] [CrossRef]
- González-García, Y.; González, S.; Souto, R.M. Electrochemical and structural properties of a polyurethane coating on steel substrates for corrosion protection. Corrosion Science 2007, 49, 3514–3526. [Google Scholar] [CrossRef]
- Luo, X.; Zhong, J.; Zhou, Q.; Du, S.; Yuan, S.; Liu, Y. Cationic Reduced Graphene Oxide as Self-Aligned Nanofiller in the Epoxy Nanocomposite Coating with Excellent Anticorrosive Performance and Its High Antibacterial Activity. ACS Appl Mater Interfaces 2018, 10, 18400–18415. [Google Scholar] [CrossRef]
- Zhou, H.; Chen, R.; Liu, Q.; Liu, J.; Yu, J.; Wang, C.; Zhang, M.; Liu, P.; Wang, J. Fabrication of ZnO/epoxy resin superhydrophobic coating on AZ31 magnesium alloy. Chemical Engineering Journal 2019, 368, 261–272. [Google Scholar] [CrossRef]
- Zhang, Y.; Tian, J.; Zhong, J.; Shi, X. Thin Nacre-Biomimetic Coating with Super-Anticorrosion Performance. ACS Nano 2018, 12, 10189–10200. [Google Scholar] [CrossRef]
- Yan, H.; Cai, M.; Li, W.; Fan, X.; Zhu, M. Amino-functionalized Ti3C2T with anti-corrosive/wear function for waterborne epoxy coating. Journal of Materials Science & Technology 2020, 54, 144–159. [Google Scholar] [CrossRef]
- He, L.-J.; Shao, Y.; Li, S.-Q.; Cui, L.-Y.; Ji, X.-J.; Zhao, Y.-B.; Zeng, R.-C. Advances in layer-by-layer self-assembled coatings upon biodegradable magnesium alloys. Science China Materials 2021, 64, 2093–2106. [Google Scholar] [CrossRef]
- Zhu, X.; Yan, Q.; Cheng, L.; Wu, H.; Zhao, H.; Wang, L. Self-alignment of cationic graphene oxide nanosheets for anticorrosive reinforcement of epoxy coatings. Chemical Engineering Journal 2020, 389. [Google Scholar] [CrossRef]
- Hosseini, M.G.; Jafari, M.; Najjar, R. Effect of polyaniline–montmorillonite nanocomposite powders addition on corrosion performance of epoxy coatings on Al 5000. Surface and Coatings Technology 2011, 206, 280–286. [Google Scholar] [CrossRef]
- Guo, L.; Wu, W.; Zhou, Y.; Zhang, F.; Zeng, R.; Zeng, J. Layered double hydroxide coatings on magnesium alloys: A review. Journal of Materials Science & Technology 2018, 34, 1455–1466. [Google Scholar] [CrossRef]
- Schriver, M.; Regan, W.; Gannett, W.J.; Zaniewski, A.M.; Crommie, M.F.; Zettl, A. Graphene as a long-term metal oxidation barrier: worse than nothing. ACS nano 2013, 7, 5763–5768. [Google Scholar] [CrossRef] [PubMed]
- Cui, C.; Lim, A.T.O.; Huang, J. A cautionary note on graphene anti-corrosion coatings. Nat Nanotechnol 2017, 12, 834–835. [Google Scholar] [CrossRef] [PubMed]
- Xi, K.; Wu, H.; Zhou, C.; Qi, Z.; Yang, K.; Fu, R.K.Y.; Xiao, S.; Wu, G.; Ding, K.; Chen, G.; et al. Improved corrosion and wear resistance of micro-arc oxidation coatings on the 2024 aluminum alloy by incorporation of quasi-two-dimensional sericite microplates. Applied Surface Science 2022, 585, 152693. [Google Scholar] [CrossRef]
- Abdullah, N.H.; Shameli, K.; Abdullah, E.C.; Abdullah, L.C. Low cost and efficient synthesis of magnetic iron oxide/activated sericite nanocomposites for rapid removal of methylene blue and crystal violet dyes. Materials Characterization 2020, 163. [Google Scholar] [CrossRef]
- Pan, X.F.; Gao, H.L.; Lu, Y.; Wu, C.Y.; Wu, Y.D.; Wang, X.Y.; Pan, Z.Q.; Dong, L.; Song, Y.H.; Cong, H.P.; et al. Transforming ground mica into high-performance biomimetic polymeric mica film. Nat Commun 2018, 9, 2974. [Google Scholar] [CrossRef] [PubMed]
- Shih, Y.; Shen, Y. Swelling of sericite by LiNO3-hydrothermal treatment. Applied Clay Science 2009, 43, 282–288. [Google Scholar] [CrossRef]
- Ding, H.; Wang, Y.; Liang, Y.; Qin, F. Preparation and Characterization of Cetyl Trimethylammonium Intercalated Sericite. Advances in Materials Science and Engineering 2014, 2014, 1–8. [Google Scholar] [CrossRef]
- Lalhmunsiama; Tiwari, D.; Lee, S.-M. Surface-functionalized activated sericite for the simultaneous removal of cadmium and phenol from aqueous solutions: Mechanistic insights. Chemical Engineering Journal 2016, 283, 1414–1423. [Google Scholar] [CrossRef]
- Lu, C.; Mai, Y.-W. Influence of Aspect Ratio on Barrier Properties of Polymer-Clay Nanocomposites. Physical Review Letters 2005, 95, 088303. [Google Scholar] [CrossRef]
- Sinha Ray, S.; Okamoto, M. Polymer/layered silicate nanocomposites: a review from preparation to processing. Progress in Polymer Science 2003, 28, 1539–1641. [Google Scholar] [CrossRef]
- Paul, B.; Martens, W.N.; Frost, R.L. Organosilane grafted acid-activated beidellite clay for the removal of non-ionic alachlor and anionic imazaquin. Applied Surface Science 2011, 257, 5552–5558. [Google Scholar] [CrossRef]
- Musso, T.B.; Parolo, M.E.; Pettinari, G.; Francisca, F.M. Cu(II) and Zn(II) adsorption capacity of three different clay liner materials. J Environ Manage 2014, 146, 50–58. [Google Scholar] [CrossRef] [PubMed]
- Ren, X.; Zhang, Z.; Luo, H.; Hu, B.; Dang, Z.; Yang, C.; Li, L. Adsorption of arsenic on modified montmorillonite. Applied Clay Science 2014, 97-98, 17–23. [Google Scholar] [CrossRef]
- Zhao, R.; Kong, W.; Sun, M.; Yang, Y.; Liu, W.; Lv, M.; Song, S.; Wang, L.; Song, H.; Hao, R. Highly Stable Graphene-Based Nanocomposite (GO-PEI-Ag) with Broad-Spectrum, Long-Term Antimicrobial Activity and Antibiofilm Effects. ACS Appl Mater Interfaces 2018, 10, 17617–17629. [Google Scholar] [CrossRef]
- Huang, X.; Yu, L.; Dong, Y. Corrosion resistance of a novel ceria doped aluminum phosphate ceramic coating on cast Al-Si alloy by steam-assisted curing. Corrosion Science 2021, 182, 109256. [Google Scholar] [CrossRef]
- Cui, X.-j.; Lin, X.-z.; Liu, C.-h.; Yang, R.-s.; Zheng, X.-w.; Gong, M. Fabrication and corrosion resistance of a hydrophobic micro-arc oxidation coating on AZ31 Mg alloy. Corrosion Science 2015, 90, 402–412. [Google Scholar] [CrossRef]
- Zoltowski, P. On the electrical capacitance of interfaces exhibiting constant phase element behaviour. Journal of Electroanalytical Chemistry 1998, 443, 149–154. [Google Scholar] [CrossRef]
- Wu, H.; Qasim, A.M.; Xiao, S.; Huang, Q.; Zhang, F.; Wu, Z.; Fu, R.K.Y.; Wu, G.; Chu, P.K. Magnetron-sputtered fluorocarbon polymeric film on magnesium for corrosion protection. Surface and Coatings Technology 2018, 352, 437–444. [Google Scholar] [CrossRef]
- Wu, H.; Xi, K.; Xiao, S.; Qasim, A.M.; Fu, R.K.Y.; Shi, K.; Ding, K.; Chen, G.; Wu, G.; Chu, P.K. Formation of self-layered hydrothermal coating on magnesium aided by titanium ion implantation: Synergistic control of corrosion resistance and cytocompatibility. Surface and Coatings Technology 2020, 401, 126251. [Google Scholar] [CrossRef]
- Wu, G.; Zhang, X.; Zhao, Y.; Ibrahim, J.M.; Yuan, G.; Chu, P.K. Plasma modified Mg–Nd–Zn–Zr alloy with enhanced surface corrosion resistance. Corrosion science 2014, 78, 121–129. [Google Scholar] [CrossRef]
- Zhang, Y.; Yan, C.; Wang, F.; Li, W. Electrochemical behavior of anodized Mg alloy AZ91D in chloride containing aqueous solution. Corrosion Science 2005, 47, 2816–2831. [Google Scholar] [CrossRef]
- Xin, Y.; Hu, T.; Chu, P.K. Degradation behaviour of pure magnesium in simulated body fluids with different concentrations of HCO3. Corrosion Science 2011, 53, 1522–1528. [Google Scholar] [CrossRef]
- Wan, H.; Song, D.; Li, X.; Zhang, D.; Gao, J.; Du, C. A new understanding of the failure of waterborne acrylic coatings. RSC advances 2017, 7, 38135–38148. [Google Scholar] [CrossRef]
- Wang, C.; Jiang, B.; Liu, M.; Ge, Y. Corrosion characterization of micro-arc oxidization composite electrophoretic coating on AZ31B magnesium alloy. Journal of Alloys and Compounds 2015, 621, 53–61. [Google Scholar] [CrossRef]
- Wang, H.; Sun, T.; Chang, L.; Liu, F.; Liu, B.; Zhao, C.; Xue, X.; Xiong, X. Preparation of Ca doping ZrO 2 coating on NiTi shape memory alloy by cathodic plasma electrolytic deposition and its structure, in-vitro bioactivity and biocompatibility analysis. Surface and Coatings Technology 2017, 325, 136–144. [Google Scholar] [CrossRef]
- Wu, H.; Shi, Z.; Zhang, X.; Qasim, A.M.; Xiao, S.; Zhang, F.; Wu, Z.; Wu, G.; Ding, K.; Chu, P.K. Achieving an acid resistant surface on magnesium alloy via bio-inspired design. Applied Surface Science 2019, 478, 150–161. [Google Scholar] [CrossRef]
- Fan, X.; Yan, H.; Cai, M.; Song, S.; Huang, Y.; Zhu, M. Achieving parallelly-arranged Ti3C2Tx in epoxy coating for anti-corrosive/wear high-efficiency protection. Composites Part B: Engineering 2022, 231, 109581. [Google Scholar] [CrossRef]
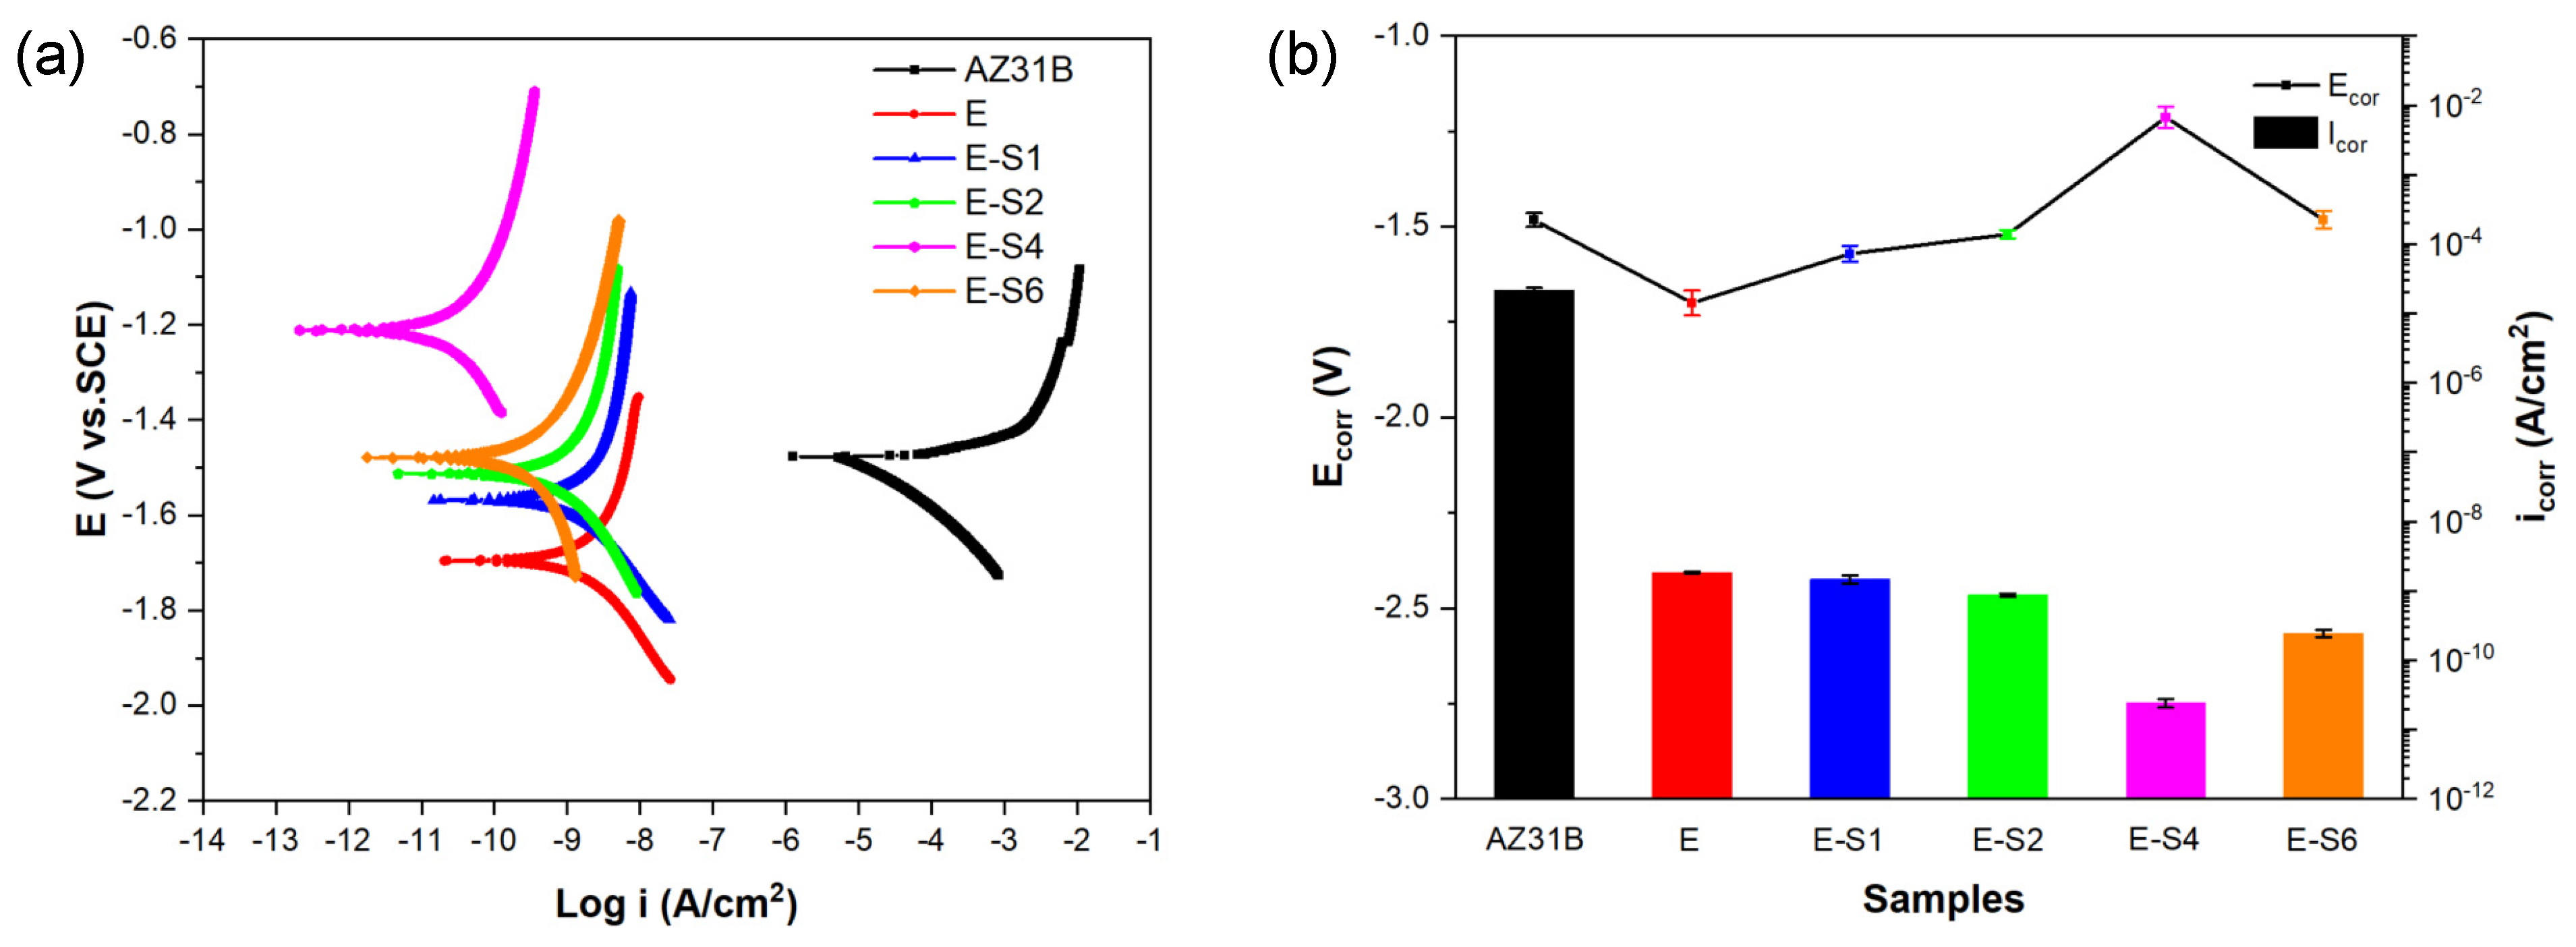

| Sample | Ecorr(V vs.SCE) | icorr(A*cm-2) | βc(V/decade) |
|---|---|---|---|
| AZ31B | -1.483 ± 0.018 | (2.153 ± 0.19) × 10-5 | -0.138 ± 0.006 |
| E | -1.700 ± 0.032 | (1.831 ± 0.05) × 10-9 | -0.216 ± 0.009 |
| E-S1 | -1.571 ± 0.021 | (1.464 ± 0.20) × 10-9 | -0.196 ± 0.008 |
| E-S2 | -1.520 ± 0.011 | (8.723 ± 0.43) × 10-10 | -0.238 ± 0.001 |
| E-S4 | -1.214 ± 0.028 | (2.412 ± 0.35) × 10-11 | -0.260 ± 0.002 |
| E-S6 | -1.482 ± 0.023 | (2.435 ± 0.29) × 10-10 | -0.247 ± 0.002 |
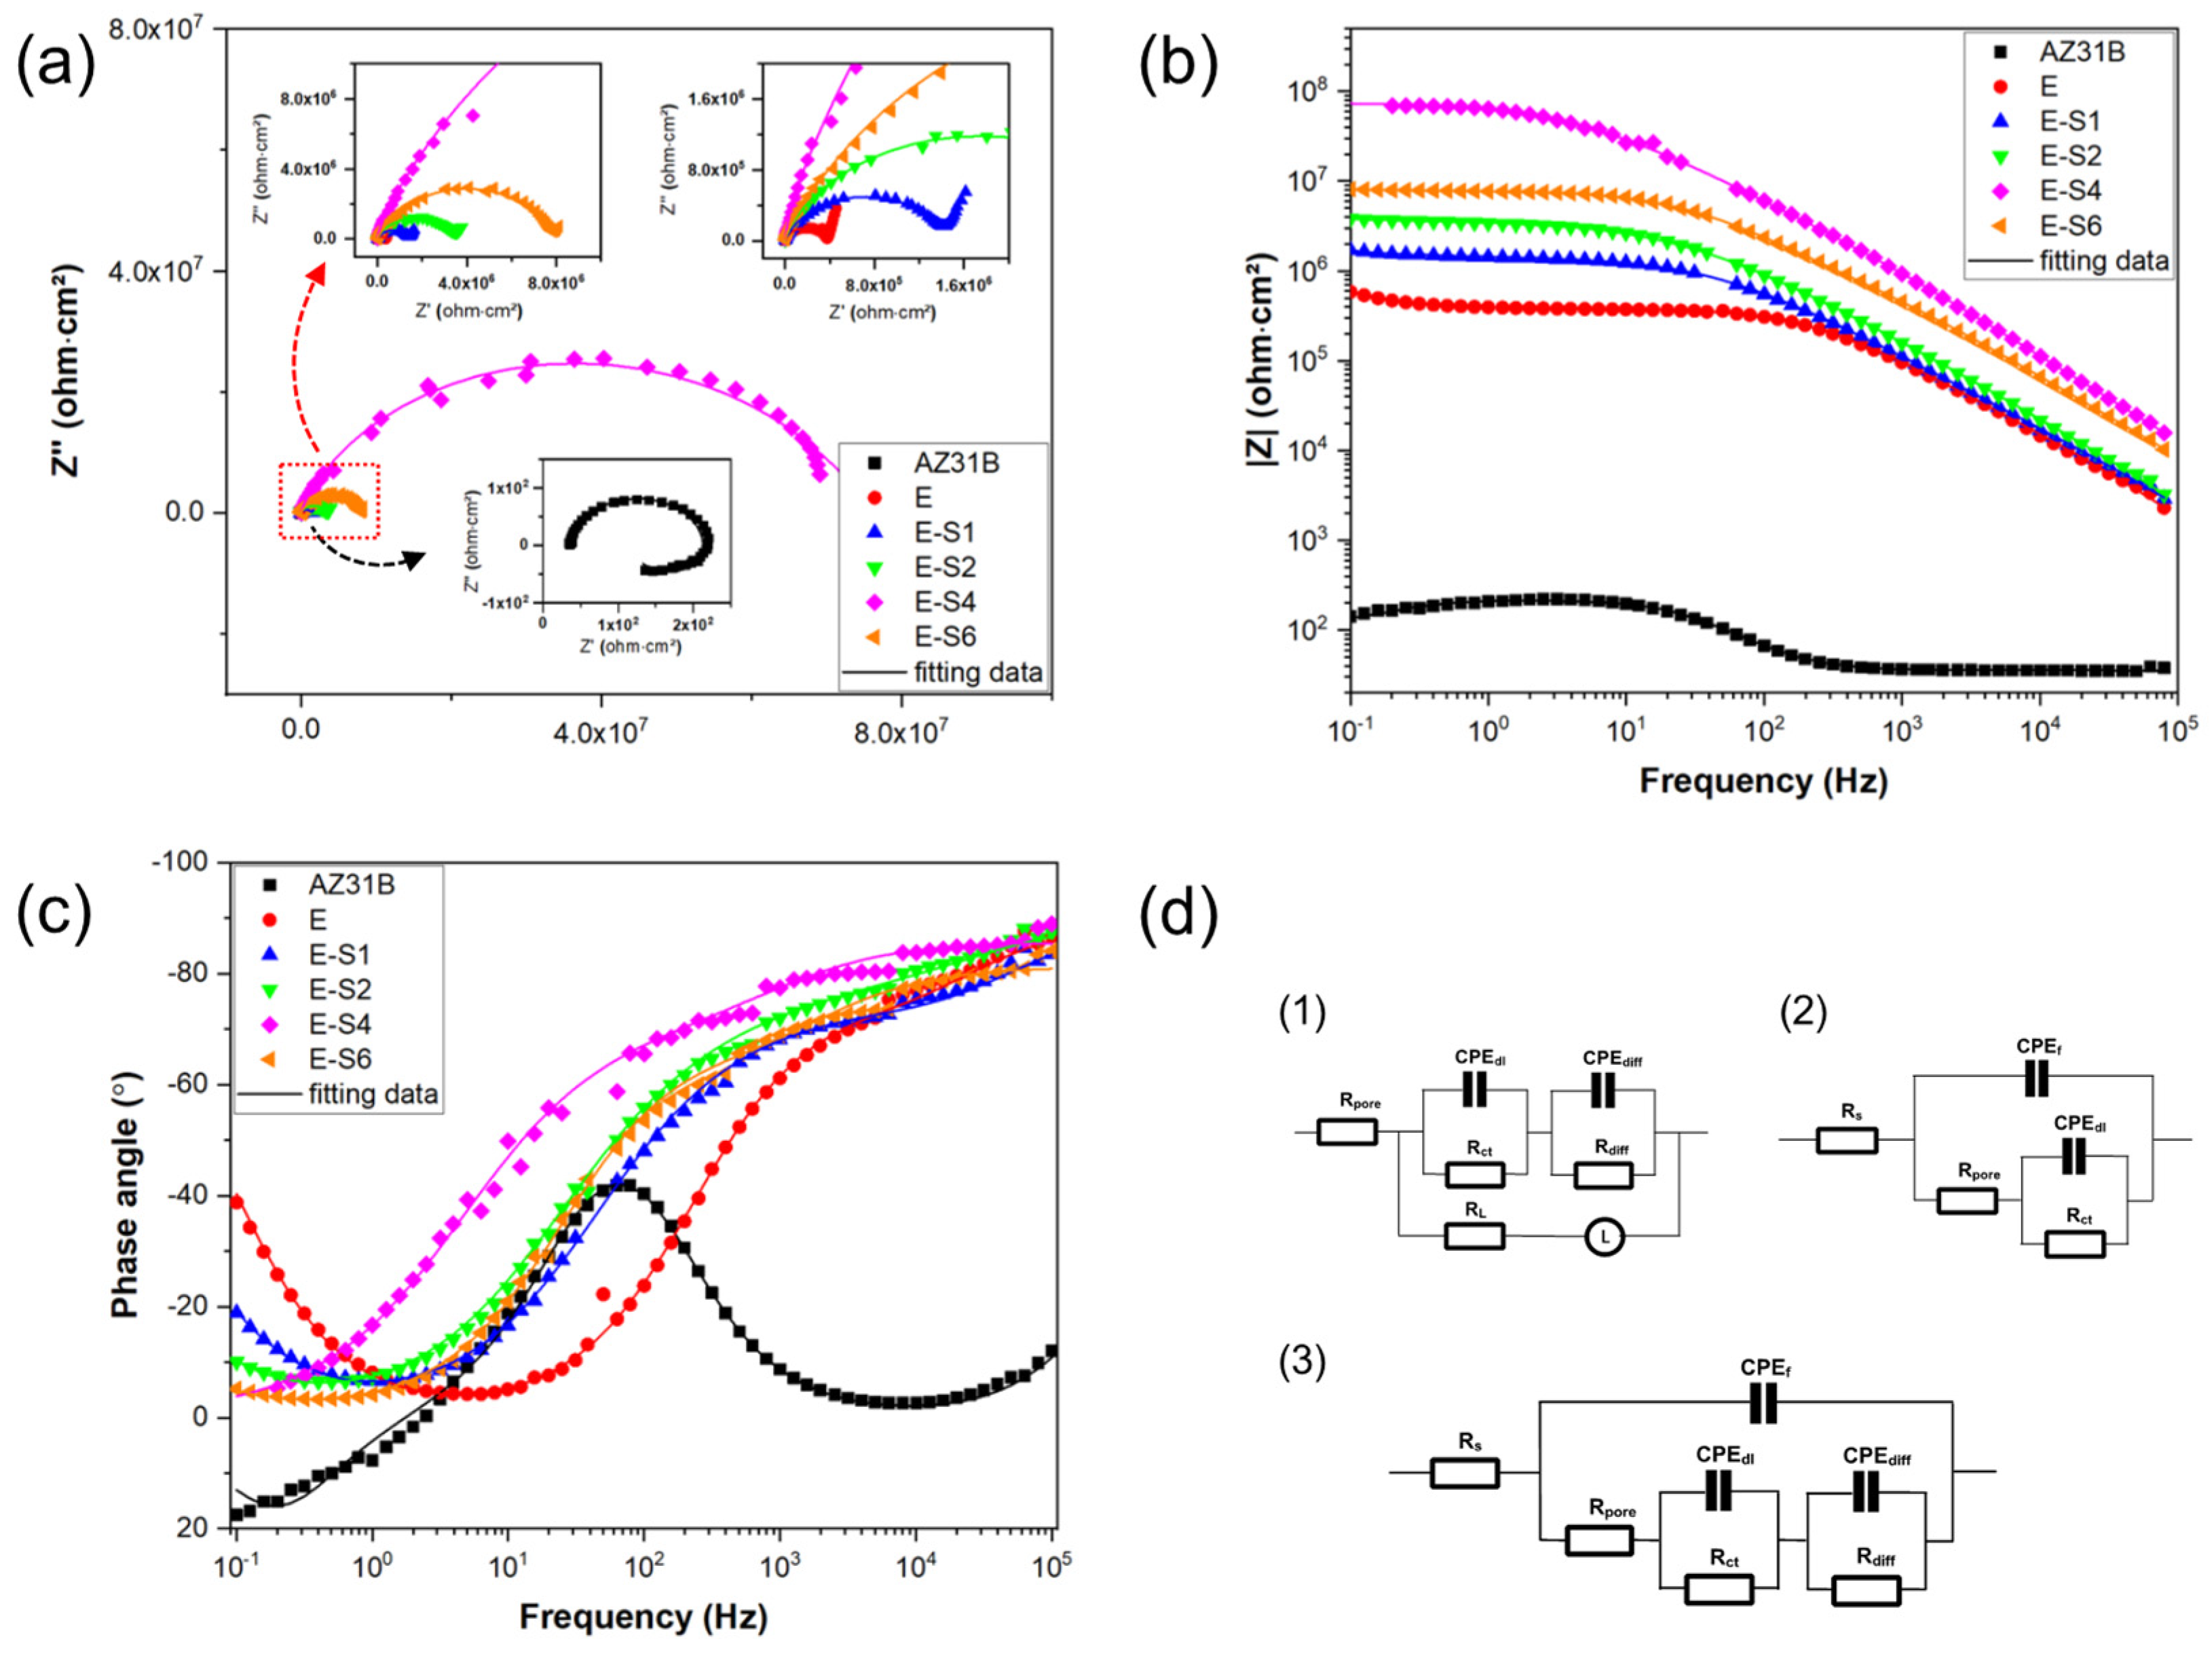
| AZ31B | E | E-S1 | E-S2 | E-S4 | E-S6 | |
|---|---|---|---|---|---|---|
| Equivalent Circuit | R(((QR)(QR))RL) | R(Q(R((QR)(QR)))) | R(Q(R((QR)(QR)))) | R(Q(R((QR)(QR)))) | R(Q(R((QR)(QR)))) | R(Q(R((QR)(QR)))) |
| Rs (ohm·cm2) | 15.60 | 11.88 | 12.95 | 10.46 | 14.60 | 4.88 |
| Y0 f (ohm-2·cm-2·S-n) | - | 9.72×10⁻¹⁰ | 6.36×10⁻¹⁰ | 5.94×10⁻¹⁰ | 2.35×10⁻¹⁰ | 6.73×10⁻¹⁰ |
| nf | - | 0.9702 | 1 | 1 | 0.9529 | 0.9040 |
| Rpore (ohm·cm2) | - | 1.57×10⁴ | 1.64×10⁴ | 3.56×10⁴ | 3.64×10⁶ | 1.12×10⁶ |
| Y0 dl (ohm-2·cm-2·S-n) | 2.78×10⁻⁸ | 1.29×10⁻⁸ | 1.26×10⁻⁸ | 1.00×10⁻⁸ | 1.35×10⁻⁹ | 2.13×10⁻⁹ |
| ndl | 1 | 0.6781 | 0.6937 | 0.6506 | 0.6338 | 0.7179 |
| Rct (ohm·cm2) | 20.23 | 1.55×10⁶ | 2.81×10⁶ | 3.61×10⁶ | 7.27×10⁷ | 6.83×10⁶ |
| Y0 diff (ohm-2·cm-2·S-n) | 4.65×10⁻⁵ | 2.61×10⁻⁶ | 2.654×10⁻⁶ | 2.417×10⁻⁶ | - | 2.29×10⁻⁶ |
| ndiff | 0.9449 | 0.9553 | 0.8420 | 0.8556 | - | 0.8048 |
| Rdiff (ohm·cm2) | 179.6 | 2.48×10⁶ | 9×10⁷ | 2.13×10⁷ | - | 1.32×10⁷ |
| L (H) | 252.2 | - | - | - | - | - |
| RL (ohm·cm2) | 223.1 | - | - | - | - | - |
| χ2 | 1.39×10⁻³ | 7.86×10⁻⁴ | 6.74×10⁻⁴ | 7.48×10⁻⁴ | 1.67×10⁻³ | 5.34×10⁻⁴ |
Disclaimer/Publisher’s Note: The statements, opinions and data contained in all publications are solely those of the individual author(s) and contributor(s) and not of MDPI and/or the editor(s). MDPI and/or the editor(s) disclaim responsibility for any injury to people or property resulting from any ideas, methods, instructions or products referred to in the content. |
© 2023 by the authors. Licensee MDPI, Basel, Switzerland. This article is an open access article distributed under the terms and conditions of the Creative Commons Attribution (CC BY) license (http://creativecommons.org/licenses/by/4.0/).


