Preprint
Article

Characteristics and Projection of Rainfall Erosivity Distribution in The Hengduan Mountains

Altmetrics

Downloads

117

Views

28

Comments

0

Submitted:

01 June 2023

Posted:

06 June 2023

You are already at the latest version

Alerts
Abstract
The spatiotemporal variations of rainfall erosivity in the Hengduan Mountains, charac-terized by rugged terrain and high potential soil erosion risks, over the past 30 years was exam-ined. The changing trends of rainfall erosivity for 2025-2040 was also be investigated under the comprehensive scenario of moderate socio-economic development (SSP2-4.5) combined with me-dium-low radiative forcing, using four global climate models (GCMs) based on CMIP6. The results indicated that: (1) The annual distribution of rainfall erosivity in the Hengduan Mountains exhib-ited significant seasonal variations, with the order of erosivity being summer > autumn > spring > winter on a seasonal scale. (2) Over the past 30 years, there has been a slight decrease in annual precipitation and a slight increase in rainfall erosivity, with periodic extreme values occurring every 6-8 years. (3) Rainfall erosivity showed a decreasing gradient from southeast to northwest in terms of spatial distribution. There was a significant positive correlation between rainfall ero-sivity and precipitation, while a significant negative correlation existed with elevation in the ver-tical direction. Moreover, there was an increasing trend of rainfall erosivity in the northeastern part of the Hengduan Mountains and a decreasing trend in the southern region. (4) Under the joint driving forces of increased precipitation and erosive rainfall events, rainfall erosivity in the future is expected to significantly increase, posing a more severe risk of soil erosion in the Heng-duan Mountains.
Keywords: 
Subject: Environmental and Earth Sciences  -   Other

1. Introduction

In recent years, under the influence of global climate change, soil erosion has become an increasingly severe issue, leading to global soil depletion, water resource wastage, farmland degradation, and ecosystem destruction [1]. Rainfall is the primary driving factor of soil erosion, and rainfall erosivity is an important indicator for assessing the extent and risk of soil erosion [2].Rainfall erosivity refers to the impact energy generated by raindrop impact on the surface, and it is the main driving force behind the detachment and transport of soil particles from the surface [3]. Intense rainfall results in higher erosivity, accelerating the soil erosion process. Rainfall erosivity is influenced by various factors, including rainfall intensity, amount, drop size, and velocity [4].
Research on rainfall erosivitty in soil erosion mainly focuses on two aspects. Firstly, by measuring and analyzing rainfall erosivity, we can quantitatively assess the impact of rainfall events on regional soil erosion in terms of time and space, providing a scientific basis for soil conservation and land management [5,6]. Secondly, through the analysis and study of rainfall erosivity, we can predict future trends in soil erosion. Long-term observation and analysis of erosivity of different rainfall events allow us to understand the development trends of global or regional soil erosion under the background of climate change. Based on different local conditions and climate scenarios, some regions show an increasing trend in rainfall erosivity [7,8], while others show a decreasing [9,10] or significantly decreasing trend [11]. In some areas, the number of erosive rainfall events decreases, but their intensity increases, leading to complex variations in rainfall erosivity in those regions [10].This indicates that the development trends of soil erosion in different regions worldwide are not consistent. It is important to consider the information on regional soil erosion trends provided by rainfall erosivity in future soil management and agricultural practices to help us take appropriate measures to mitigate the risk of soil erosion and ensure the sustainable utilization of land resources.
Research on rainfall erosivity primarily focuses on the construction and modeling of rainfall erosivity datasets. A global rainfall erosivity database has been established by integrating remote sensing databases, measurement data, and climate datasets [12,13]. This database has been effectively applied in various studies [14,15]. In terms of modeling, scholars have developed rainfall erosivity calculation equations based on daily, monthly, seasonal, and annual rainfall data by investigating the mathematical relationship between EI30 and rainfall amount [16,17,18]. For instance, Yu et al. [19] proposed a daily rainfall model suitable for New South Wales, Hoyos et al. [20] established a seasonal rainfall model in the Andes Mountains, Renard et al. [21] developed monthly and annual rainfall models based on U.S. rainfall data, while Wu Suye [22], Zhou Fujian [23], Zhang Wenbo [18], and Shi Dongmei et al. [24] created simplified rainfall erosivity algorithms for different regions in China.
Previous studies have assessed the extent and trends of soil erosion, predicted future changes, and formulated corresponding soil conservation and ecological restoration strategies by investigating global and regional rainfall erosivity. In China, based on the assessment results of soil erosion by Teng Hongfen [25] and others, it is found that 91.82% of Chinese soil experiences slight erosion, with moderate soil erosion being dominant in the Hengduan Mountains, surpassing the national average and making it one of the most severely eroded regions in China.the national average and making it one of the most severely eroded regions in China.
The Hengduan Mountains are situated in the transitional zone between the Qinghai-Tibet Plateau and the plains. They were formed due to the compression and collision of the Indian Plate subducting beneath the Eurasian Plate. This geological process resulted in a series of north-south geological folds, which is distinct from the predominantly east-west orientation of most other mountain ranges in China. Additionally, the deep incision by rivers has created high mountains and deep valleys in the Hengduan Mountains, leading to pronounced vertical zonation of climate [26],vegetation [27], and erosion characteristics [28]. The rugged terrain and abundant precipitation in the region contribute to a higher degree of erosion compared to the national average [29]. Consequently, the area experiences widespread development of gullies and ravines, severe soil degradation, and frequent geological disasters such as landslides and debris flows [30]. However, there have been limited reports exploring regions with such pronounced topographic variations and distinct vertical zonation of erosion characteristics. Understanding the spatiotemporal variation patterns of rainfall erosivity in the Hengduan Mountains is of great significance for assessing potential soil erosion risks in the region. Moreover, given the context of global climate change, predicting rainfall erosivity in the Hengduan Mountains based on CMIP6 models is crucial for future land resource management, ecological protection, and sustainable development in the region.
Therefore, this study focuses on two main aspects. Firstly, employing trend analysis methods, it examines the temporal variation trend of rainfall erosivity in the Hengduan Mountains, simulates the spatial distribution patterns of rainfall erosivity using spatial interpolation methods, and explores the relationship between rainfall erosivity and precipitation at different altitudes. These analyses aim to reveal the spatiotemporal differentiation patterns of rainfall erosivity in the Hengduan Mountains, assess potential soil erosion risk zones, and identify key areas for rainfall erosivity control in the region. Secondly, utilizing the Delta downscaling method, it extracts data from five atmospheric circulation models based on CMIP6 to predict the trend of rainfall erosivity in the Hengduan Mountains from 2025 to 2040. This endeavor seeks to provide reference information for long-term soil and water conservation efforts in the region.

2. Overview of the Study Area

The Hengduan Mountains region is a transitional zone between the Qinghai-Tibet Plateau, the Sichuan Basin, and the Yungui Plateau. It is located approximately between 24.5°N to 33.9°N latitude and 96.3°E to 104.5°E longitude (Figure 1). The elevation ranges from 600 to 7200 meters, gradually decreasing from north to south and from west to east, encompassing a total area of approximately 360,000 square kilometers [31]. The Hengduan Mountains region exhibits complex terrain, characterized by high mountains and deep valleys, making it one of the most climatically diverse vertical zones in the world. The region receives winter and spring precipitation through westerly wind moisture transport, while summer and autumn precipitation is influenced by monsoon transport [32]. These distinct moisture sources result in uneven precipitation distribution throughout the year, with well-defined wet and dry seasons. The north-south-oriented mountain ranges impede the westward transport of moisture, leading to moisture accumulation in the eastern and southern parts of the Hengduan Mountains. Conversely, the western areas experience longer sunshine duration, dry air, and reduced precipitation. Overall, the distribution of precipitation exhibits a decreasing trend from south to north within the study area.

3. Materials and Methods

3.1. Data

Daily rainfall data from 34 ground stations were selected for the calculation of rainfall erosivity in the study area, ensuring a data completeness of over 98% to guarantee the accuracy of the calculations. ArcGIS 10.5 was employed to stitch and clip images to obtain the elevation map of the Hengduan Mountains region, and the zoning statistical function was utilized to extract the ground elevation points. The elevation data was sourced from SRTM with a spatial resolution of 90 meters, while the rainfall data was obtained from the China Meteorological Data Network with a temporal resolution of daily.
To estimate potential changes in rainfall erosivity in the future, the SSP2-4.5 scenario, which closely represents future human society, from the CMIP6 dataset was selected to predict rainfall erosivity in the Hengduan Mountains region from 2015 to 2040. Considering the proximity of the study area to the southeastern Tibetan region with similar climatic conditions, four models from CMIP6 that performed well on the Tibetan Plateau were chosen for ensemble averaging [33] in predicting rainfall erosivity. To ensure comparability and informative results, daily rainfall data was selected, and statistical downscaling techniques were applied to downscale the data to the station level for statistical calculations. The specific four global climate models (GCMs) used are listed in the table below.
Table 1. The datasets used in this research.
Model name Institution Resolution (Latitude ×Longitude)
EC-Earth3-Veg EC-Earth-Cons (Europe) 0.7°×0.7°
MPI-ESM1.2-HR MPI-M(Germany) 0.93°×0.94°
MRI-ESM2-0 MRI(Japan) 1.12°×1.12°
NorESM2-LM NCC(Norway) 1.89°×2.5°

3.2. Research Methods

3.2.1. Calculation of Rainfall Erosivity (RE)

Since the Hengduan Mountains region is in the humid and semi-humid zones of China, characterized by abundant precipitation, this study adopted the daily rainfall model proposed by Zhang Wenbo[34]. This model exhibits high accuracy with an average calculation error of 4.2%, making it suitable for the rainfall-rich southern regions.
M i = α j k D j β
In the equation: Mi represents the rainfall erosivity of the ith half-month period, expressed in MJ mm ha-1h-1; α and β are model parameters; k represents the number of days in the half-month period; Dj represents the daily rainfall greater than 12mm on the jth day within the half-month period, while rainfall below 12mm is considered as 0. The calculation formulas for parameters α and β are as follows:
β = 0.8363 + 18.144 / P d 12 + 24.455 / P y 12
α = 21.586 β 7.189
In the equation, Pd12 represents the average daily precipitation with a daily precipitation ≥ 12 mm within the half-month period, and Py12 represents the annual average precipitation with a daily precipitation ≥ 12 mm.

3.2.2. Calculation of Rainfall Erosivity Density (RED)

Rainfall erosivity density represents the erosive force per unit of rainfall and is the ratio of rainfall erosivity to precipitation [35]. RED reflects the intensity and duration of erosive rainfall, where low RED values indicate that rainfall erosivity is primarily driven by the total precipitation, while high RED values indicate that rainfall erosivity is mainly influenced by high-intensity rainfall [36]. The calculation formula for rainfall erosivity density is as follows:
E D = R P
where: ED represents the rainfall erosivity density, R represents the rainfall erosivity, and P represents the precipitation.

3.2.3. Trend Analysis

Trend analysis of long-term rainfall erosivity and rainfall erosivity density provides valuable insights into their dynamic changes over time and allows for preliminary predictions of future trends [37]. In this study, linear regression analysis and moving average method were primarily employed to analyze the interannual variation of rainfall erosivity in the Hengduan Mountain region. The linear regression model is expressed as follows:
Y = a X + b
where: Y represents the fitted values of the linear regression, X represents time, a represents the rate of change, b represents the intercept after linear fitting.

3.2.4. Theil-Sen Median Trend Analysis and Mann-Kendall Test

This section may be divided by subheadings. It should provide a concise and precise description of the experimental results, their interpretation, as well as the experimental conclusions that can be drawn.
The Theil-Sen Median trend analysis is a non-parametric method for trend estimation that is computationally efficient and robust against outliers. It is commonly used for trend analysis of long-term time series. The Mann-Kendall (MK) test, on the other hand, is employed for testing the significance of the trend [38]. In this study, MATLAB software was utilized to analyze the trend changes of rainfall erosivity in the Hengduan Mountain region using Theil-Sen trend analysis and the MK test. The calculation formulas are as follows:
β s l o p e = m e a n x j x i j i , j > i
In the equation: β slope represents the calculated trend value, xi and xj represent the sample values of the ith and jth years, where i or j represents the time index. In this study, the change trend is defined as significant at the 0.05 confidence level, indicating significance when the value is below the 0.05 confidence level.

3.2.5. Extreme Rainfall Erosivity Index

To clarify the driving factors of rainfall erosivity in the Hengduan Mountains region, this study, based on its own characteristics and referencing the research of W. Wang [39], calculated four indices related to extreme rainfall erosivity for each station: Extreme Erosive Precipitation (EEP), defined as precipitation (≥12mm) exceeding the 95th percentile; Extreme Erosive Days (EED), representing the total number of days in a year with daily precipitation exceeding the threshold for extreme erosivity; Longest Continuous Erosive Days (LCED), which is the longest consecutive period of precipitation (≥12mm) meeting erosivity criteria during the study period; and Total Erosive Precipitation (TEP), representing the annual cumulative precipitation (≥12mm) meeting erosivity criteria.

4. Results

4.1. Temporal Dynamics of Rainfall Erosivity in the Hengduan Mountains Region

4.1.1. Annual Distribution of Rainfall Erosivity in the Hengduan Mountains Region

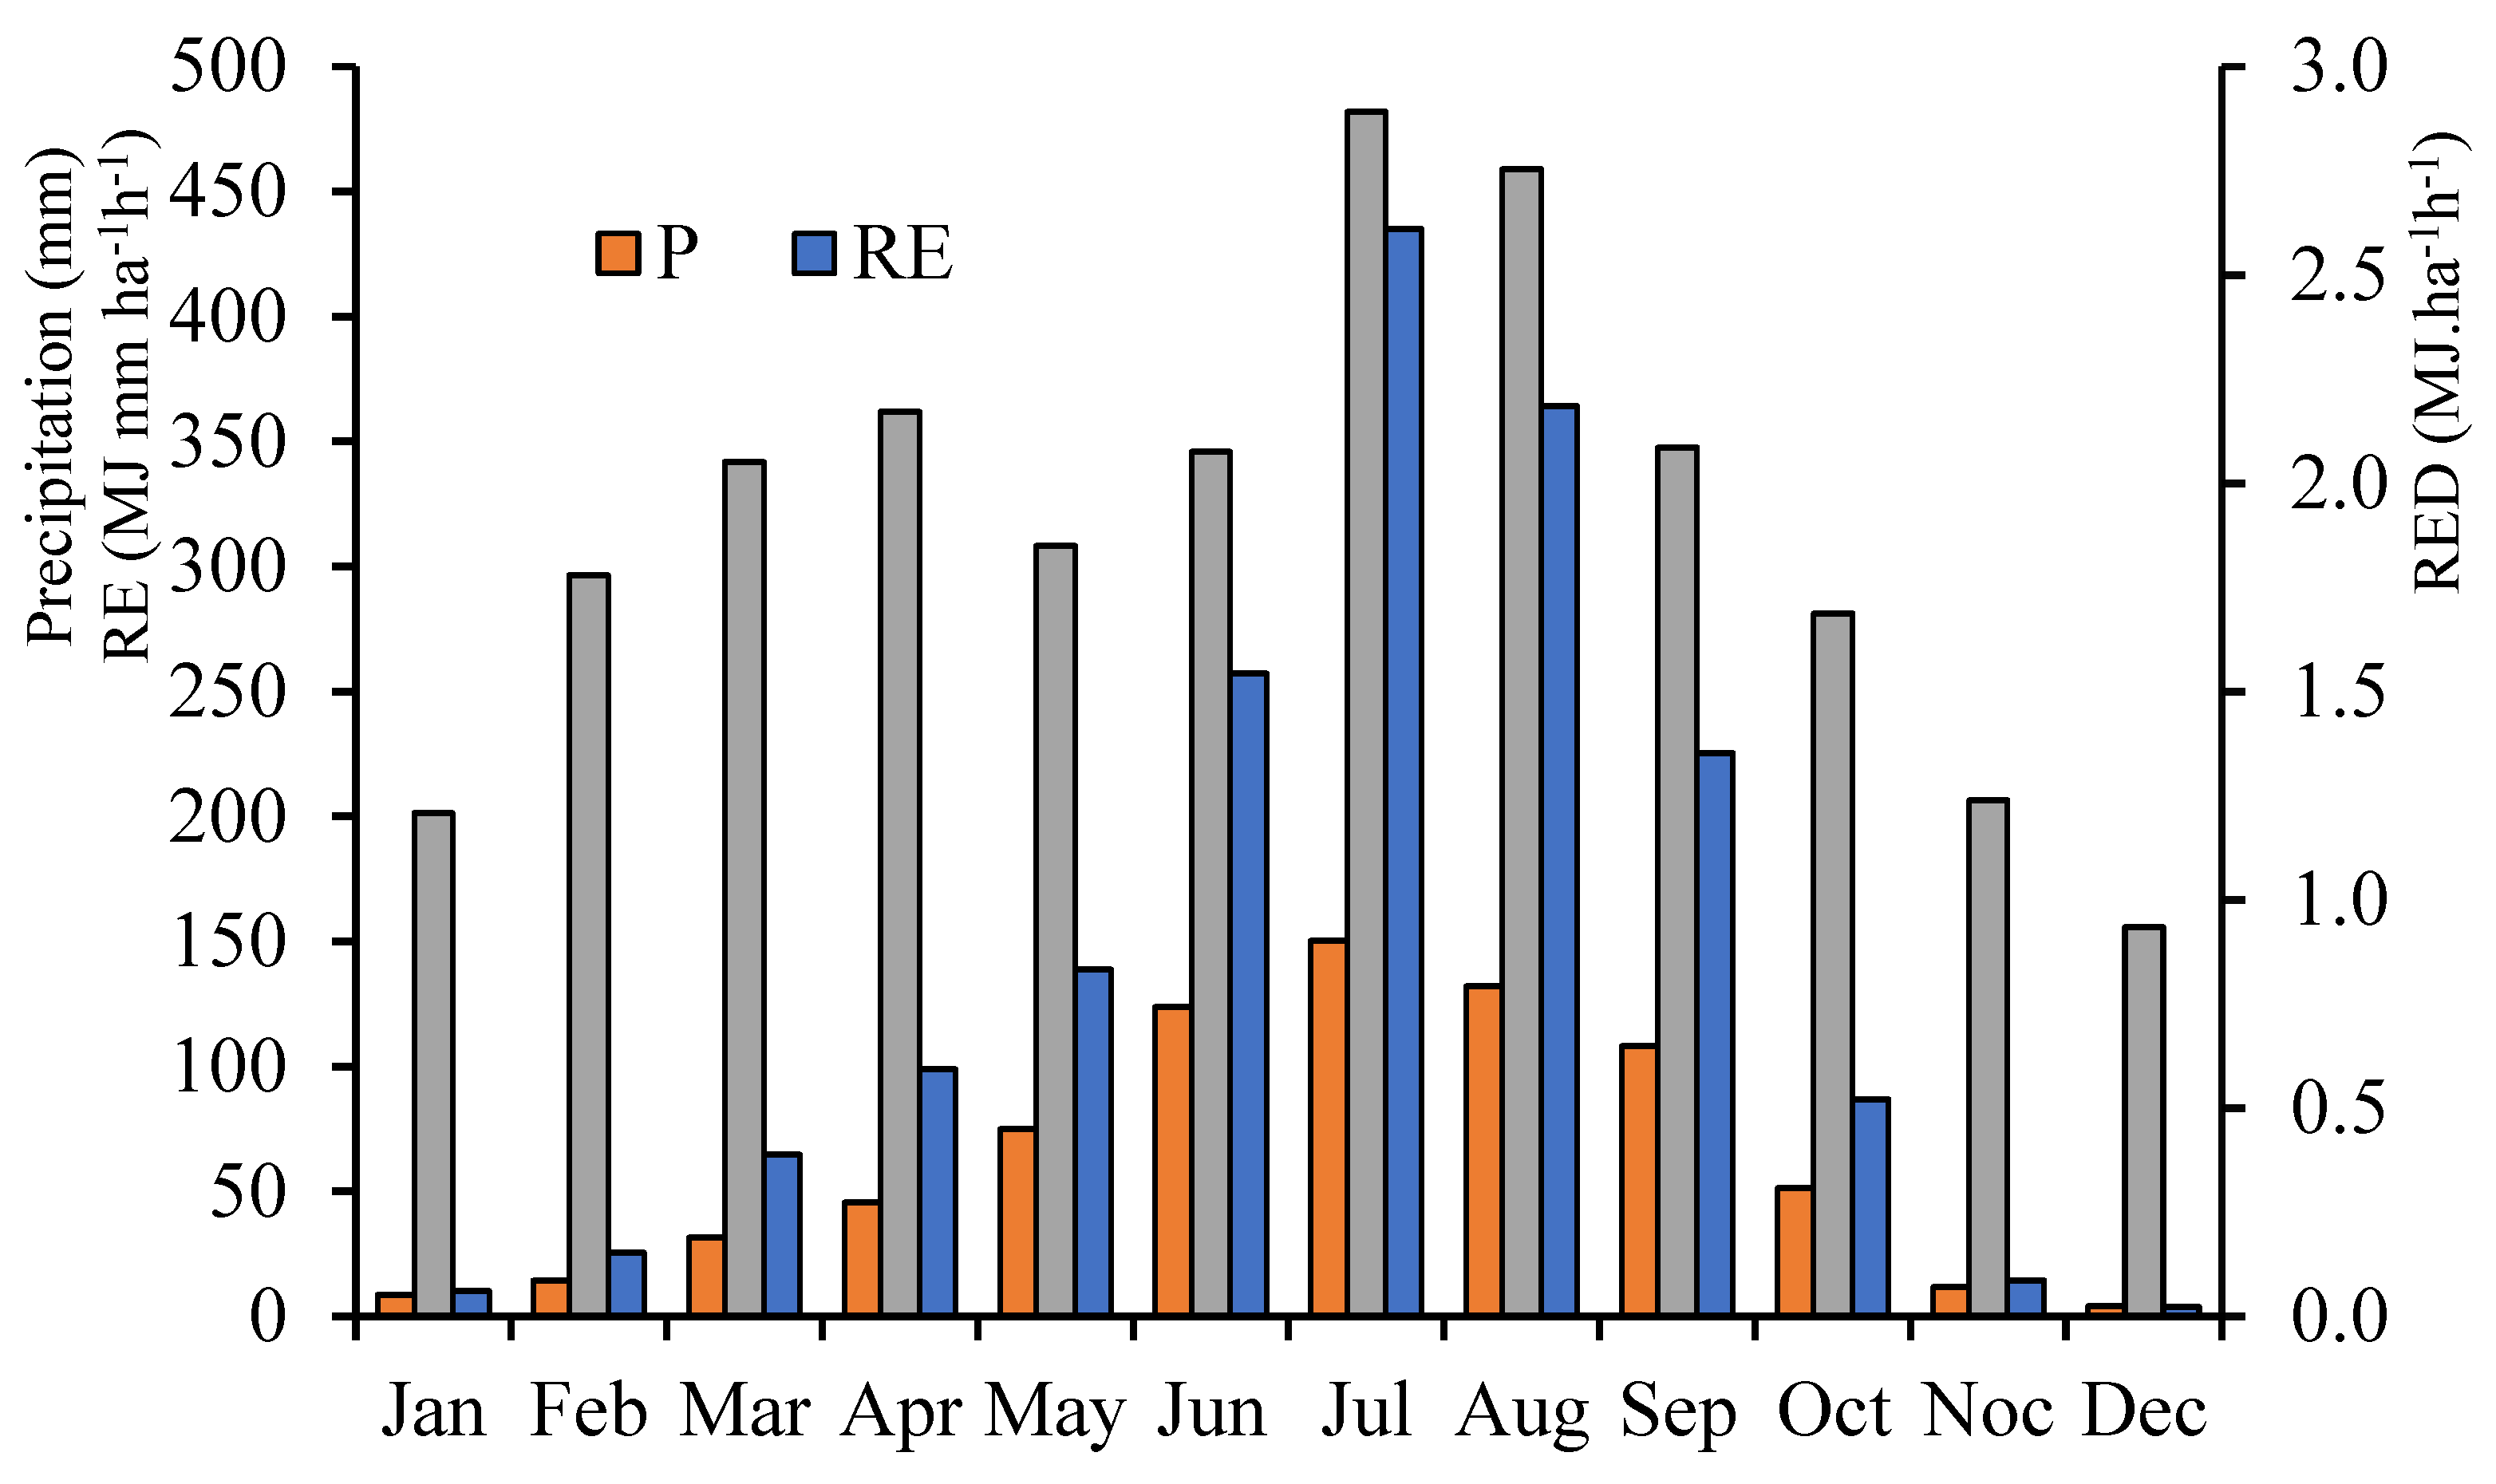
From Figure 2, significant variations can be observed in both rainfall amount and the annual distribution of rainfall erosivity in the Hengduan Mountains region. These two factors exhibit a strong correlation and synchronicity. The minimum values for both rainfall amount and rainfall erosivity occur in December, while the maximum values occur in July. The maximum monthly precipitation is 36.7 times higher than the minimum value, and the maximum monthly rainfall erosivity is 113.3 times higher than the minimum value. This indicates a close relationship between rainfall erosivity and precipitation but also suggests that they are highly influenced by rainfall characteristics such as intensity and duration.
Both precipitation and rainfall erosivity show an increasing trend followed by a decrease. They rise from January, reach their peak in July, and gradually decrease from August to December, exhibiting distinct monsoonal characteristics. The trend of rainfall erosivity density aligns closely with that of rainfall erosivity. The average value is 1.89 MJ mm ha-1h-1, reflecting that single intense rainfall events are the main cause of soil erosion in the Hengduan Mountains region. The rainfall erosivity density shows two peaks throughout the year, which significantly differs from the annual distribution of rainfall amount and rainfall erosivity. This indicates that the erosive effect of precipitation on the soil varies in different months. In months with higher rainfall erosivity, it is mainly influenced by short-duration, high-intensity rainfall events that have a destructive impact. In months with lower rainfall erosivity, the cumulative erosive effect on the soil relies more on low erosive rainfall events [36]. Furthermore, rainfall erosivity density is closely related to runoff. Studies have shown that months with higher rainfall erosivity density tend to have higher average runoff depths, leading to more severe erosion [40].
Influenced by the monsoon climate, the overall seasonal distribution pattern of rainfall erosivity and precipitation in the Hengduan Mountains region is as follows: summer > autumn > spring > winter (Figure 3). The coefficient of variation for seasonal rainfall erosivity was calculated to be 0.88, indicating moderate variability. On the other hand, the coefficient of variation for precipitation was 1.38, indicating strong variability. Compared to rainfall erosivity, the seasonal distribution of precipitation is more uneven, with a concentration of precipitation in summer being the main cause of soil erosion in the Hengduan Mountains region.
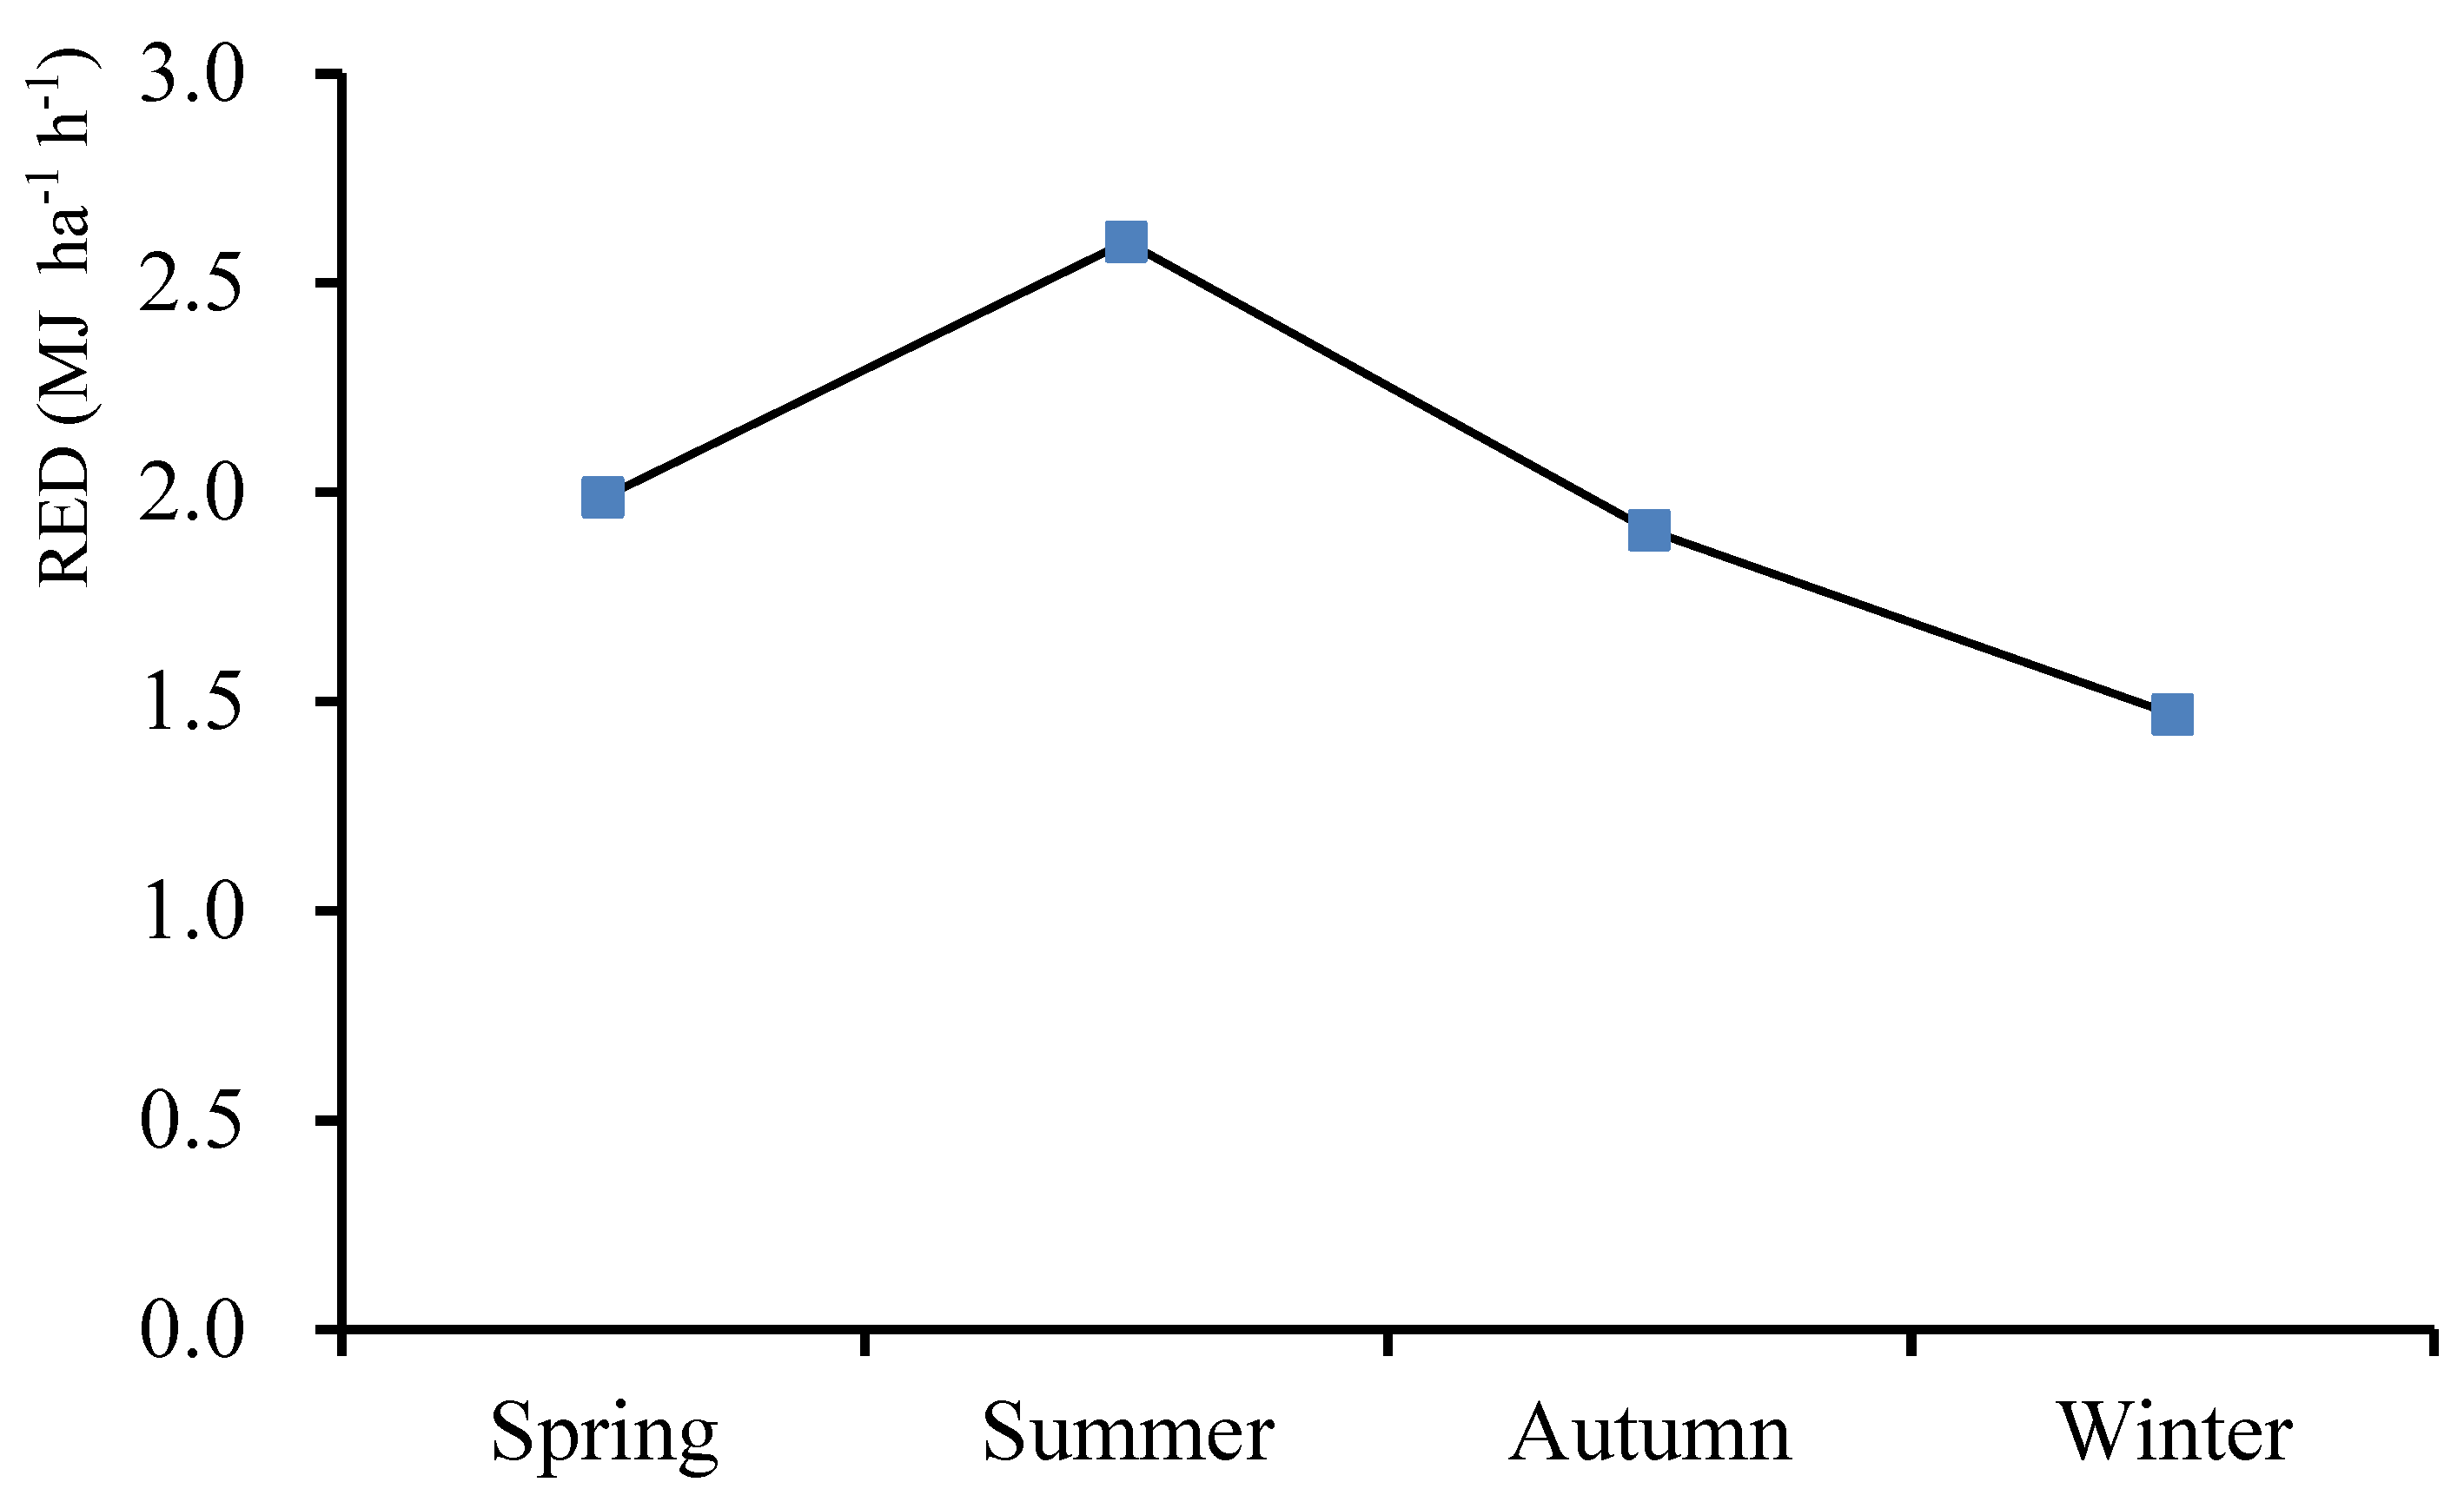
According to the results shown in Figure 4, the pattern of rainfall erosivity density follows the order: summer > spring > autumn > winter, with values ranging from 1.47 to 2.59 MJ ha-1h-1. The erosivity density for all four seasons is greater than 1, indicating that the rainfall type in the Hengduan Mountains region is characterized by short duration and high intensity, which results in a higher erosive power per unit of rainfall. Moreover, summer is the peak season for heavy rainfall in the region, leading to intensified cumulative soil erosion. The repeated erosion caused by multiple heavy rain events increases the risk of geological hazards such as landslides and debris flows [41].

4.1.2. Interannual Variation of Rainfall Erosivity

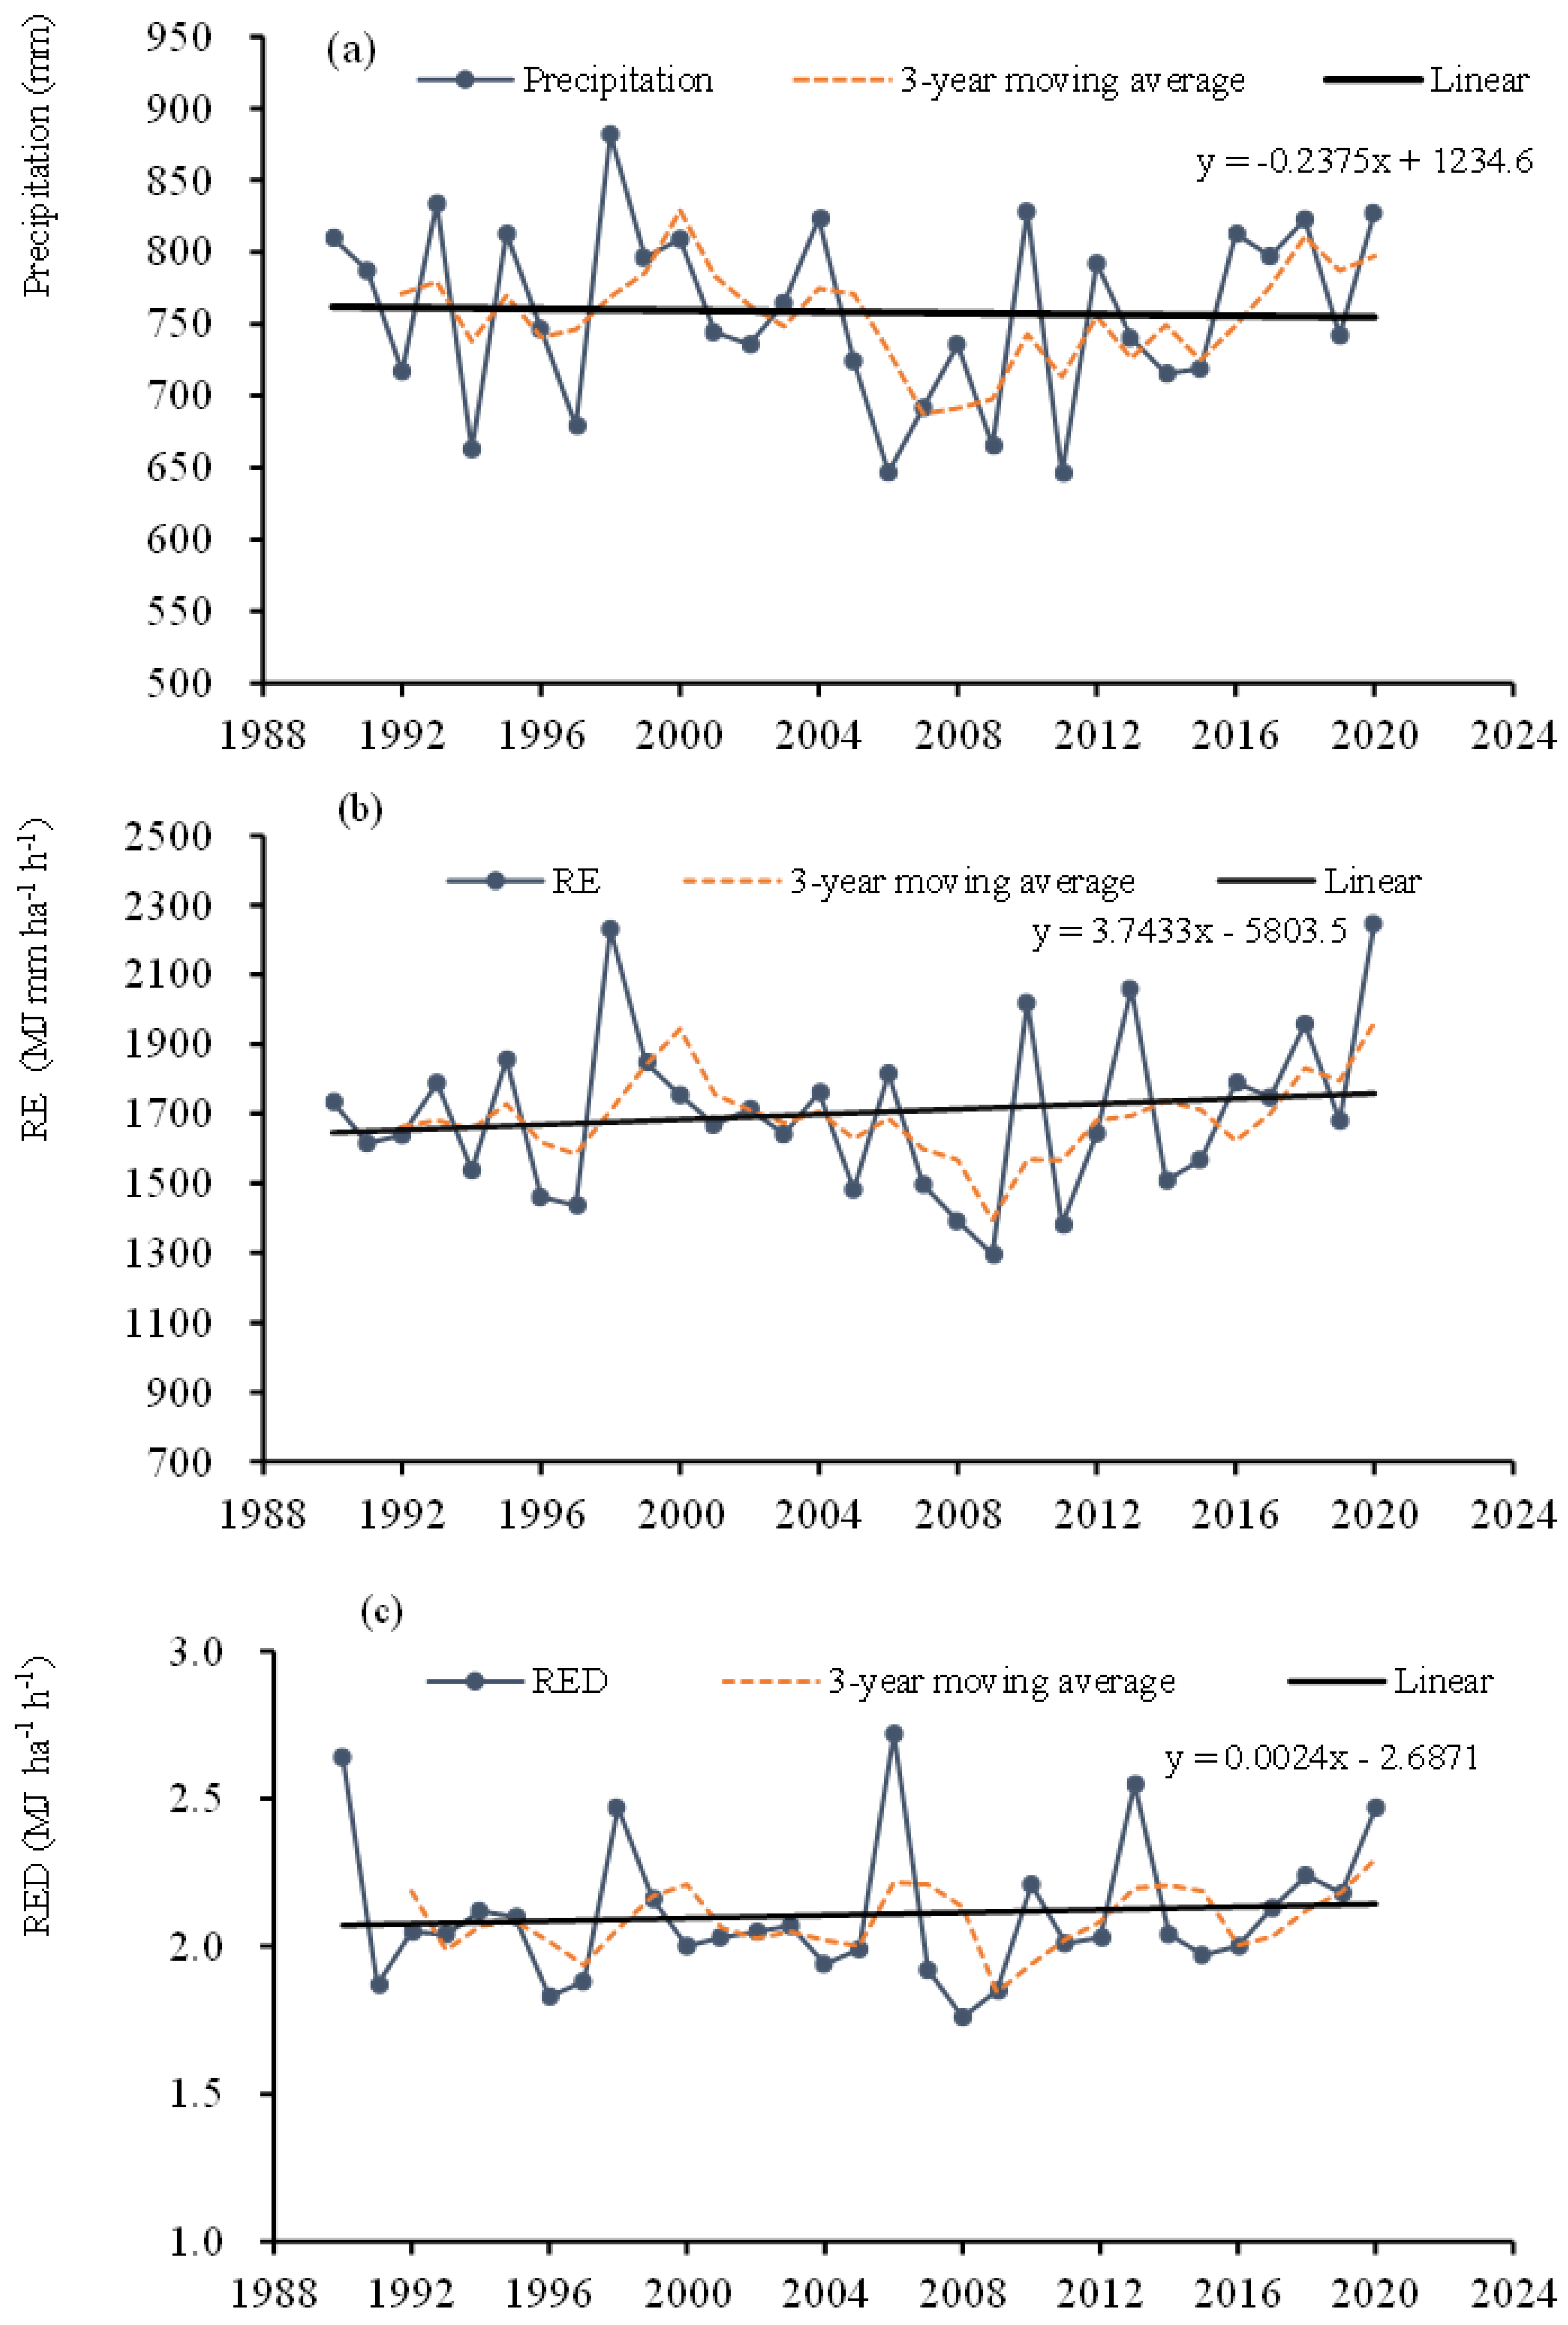
Both rainfall amount and rainfall erosivity have remained relatively stable over the years. According to the results of linear trend analysis (Figure 5), the change rate of rainfall amount is -2.75 mm/10yr, indicating a non-significant decreasing trend. On the other hand, the linear change rate of rainfall erosivity is 37.43 MJ ha-1h-1/10yr, showing a slow increasing trend. To reduce the impact of rainfall cycles on the analysis results, a moving average was used to fit the trends of rainfall amount and rainfall erosivity. Based on the results of the moving average, the overall trend of rainfall amount during the period 1990-2001 showed a fluctuating increase, followed by a decreasing trend from 2001 to 2008, and a significant increasing trend after 2008. Similarly, the moving average results of rainfall erosivity were consistent with the changes in rainfall amount. From 1990 to 2001, rainfall erosivity in the Hengduan Mountains region showed a non-significant upward trend, followed by a decline from 2001 to 2009, which was statistically significant at P<0.05. However, after 2009, rainfall erosivity exhibited an upward trend.
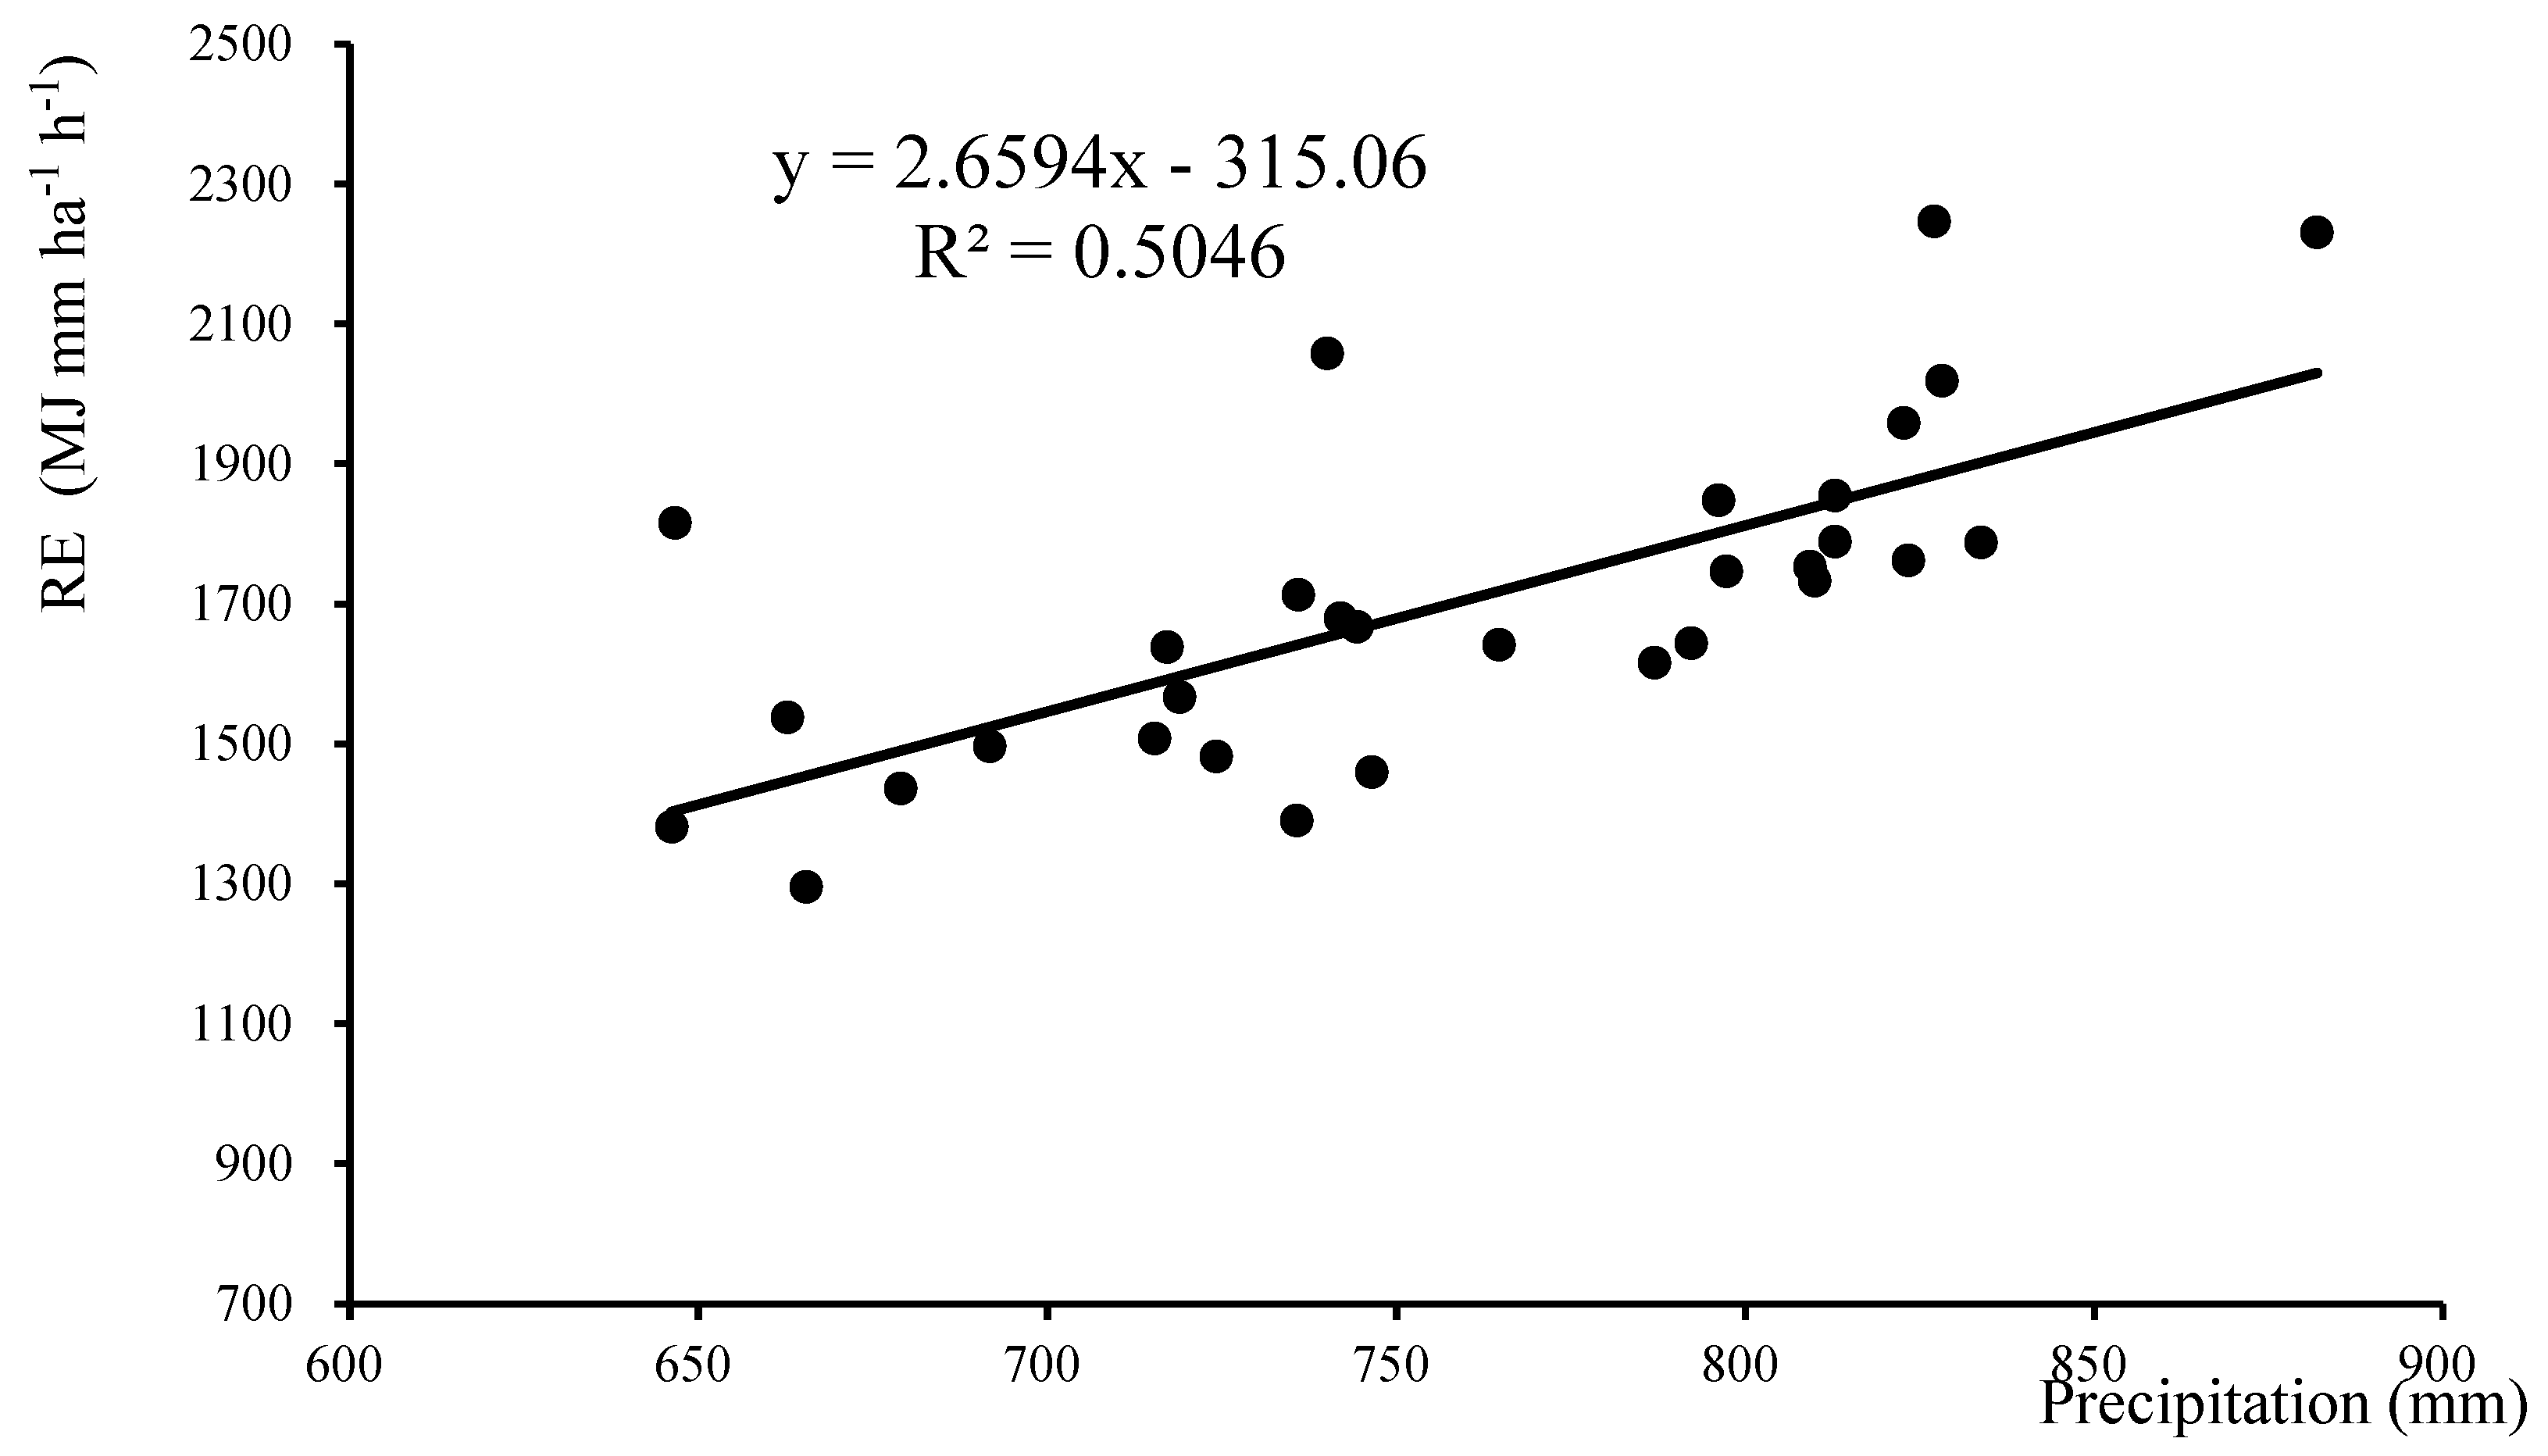
Through Pearson analysis, a significant correlation was found between annual rainfall amount and rainfall erosivity (Figure 6), with a correlation coefficient of 0.71. However, the correlation between annual rainfall amount and annual rainfall erosivity is not as strong as the correlation between monthly rainfall amount and monthly rainfall erosivity. The main reason is that rainfall exhibits periodic extreme values, which weaken the correlation. Additionally, during the winter and spring seasons, most rainfall does not meet the erosive criteria, so although it contributes to the overall rainfall amount, it does not cause soil erosion. Furthermore, months with higher rainfall amounts are also associated with frequent heavy rain events. The combined effect of rainfall intensity and amount results in a higher rainfall erosivity, making the correlation more evident at the monthly scale.
Compared to the trends in rainfall amount and rainfall erosivity density, the rainfall erosivity density exhibits regular periodic fluctuations (Figure 6), which are also verified in the 3-year moving average. This suggests that the Hengduan Mountains region experiences years with a higher frequency of heavy rainfall in certain periodic cycles, typically around 6 to 8 years. According to the research by Panagos P [36], years with higher rainfall erosivity density are more prone to flooding or drought natural disasters. By comparing the data, it is found that in the years with higher rainfall erosivity density, such as 1998, 2006, 2013, and 2020, the Hengduan Mountains region experienced various degrees of flooding or drought disasters. In 1998, a nationwide flood disaster occurred [42]. In 2006, there was a drought in the Sichuan Basin and the western plateau area [43]. In 2013, regions such as Aba and Wenchuan in western Sichuan experienced heavy rain and subsequent mudslides [44]. And in 2020, the southwestern region was hit by extensive flooding due to heavy rainfall in the Yangtze River basin [45]. It can be observed that rainfall erosivity density is closely related to meteorological and geological disasters, and monitoring and early warning of relevant disasters can be initiated based on rainfall erosivity density.

4.2. Spatial Distribution Patterns of Rainfall Erosivity

4.2.1. Spatial Distribution Characteristics of Rainfall Erosivity at the Seasonal Scale

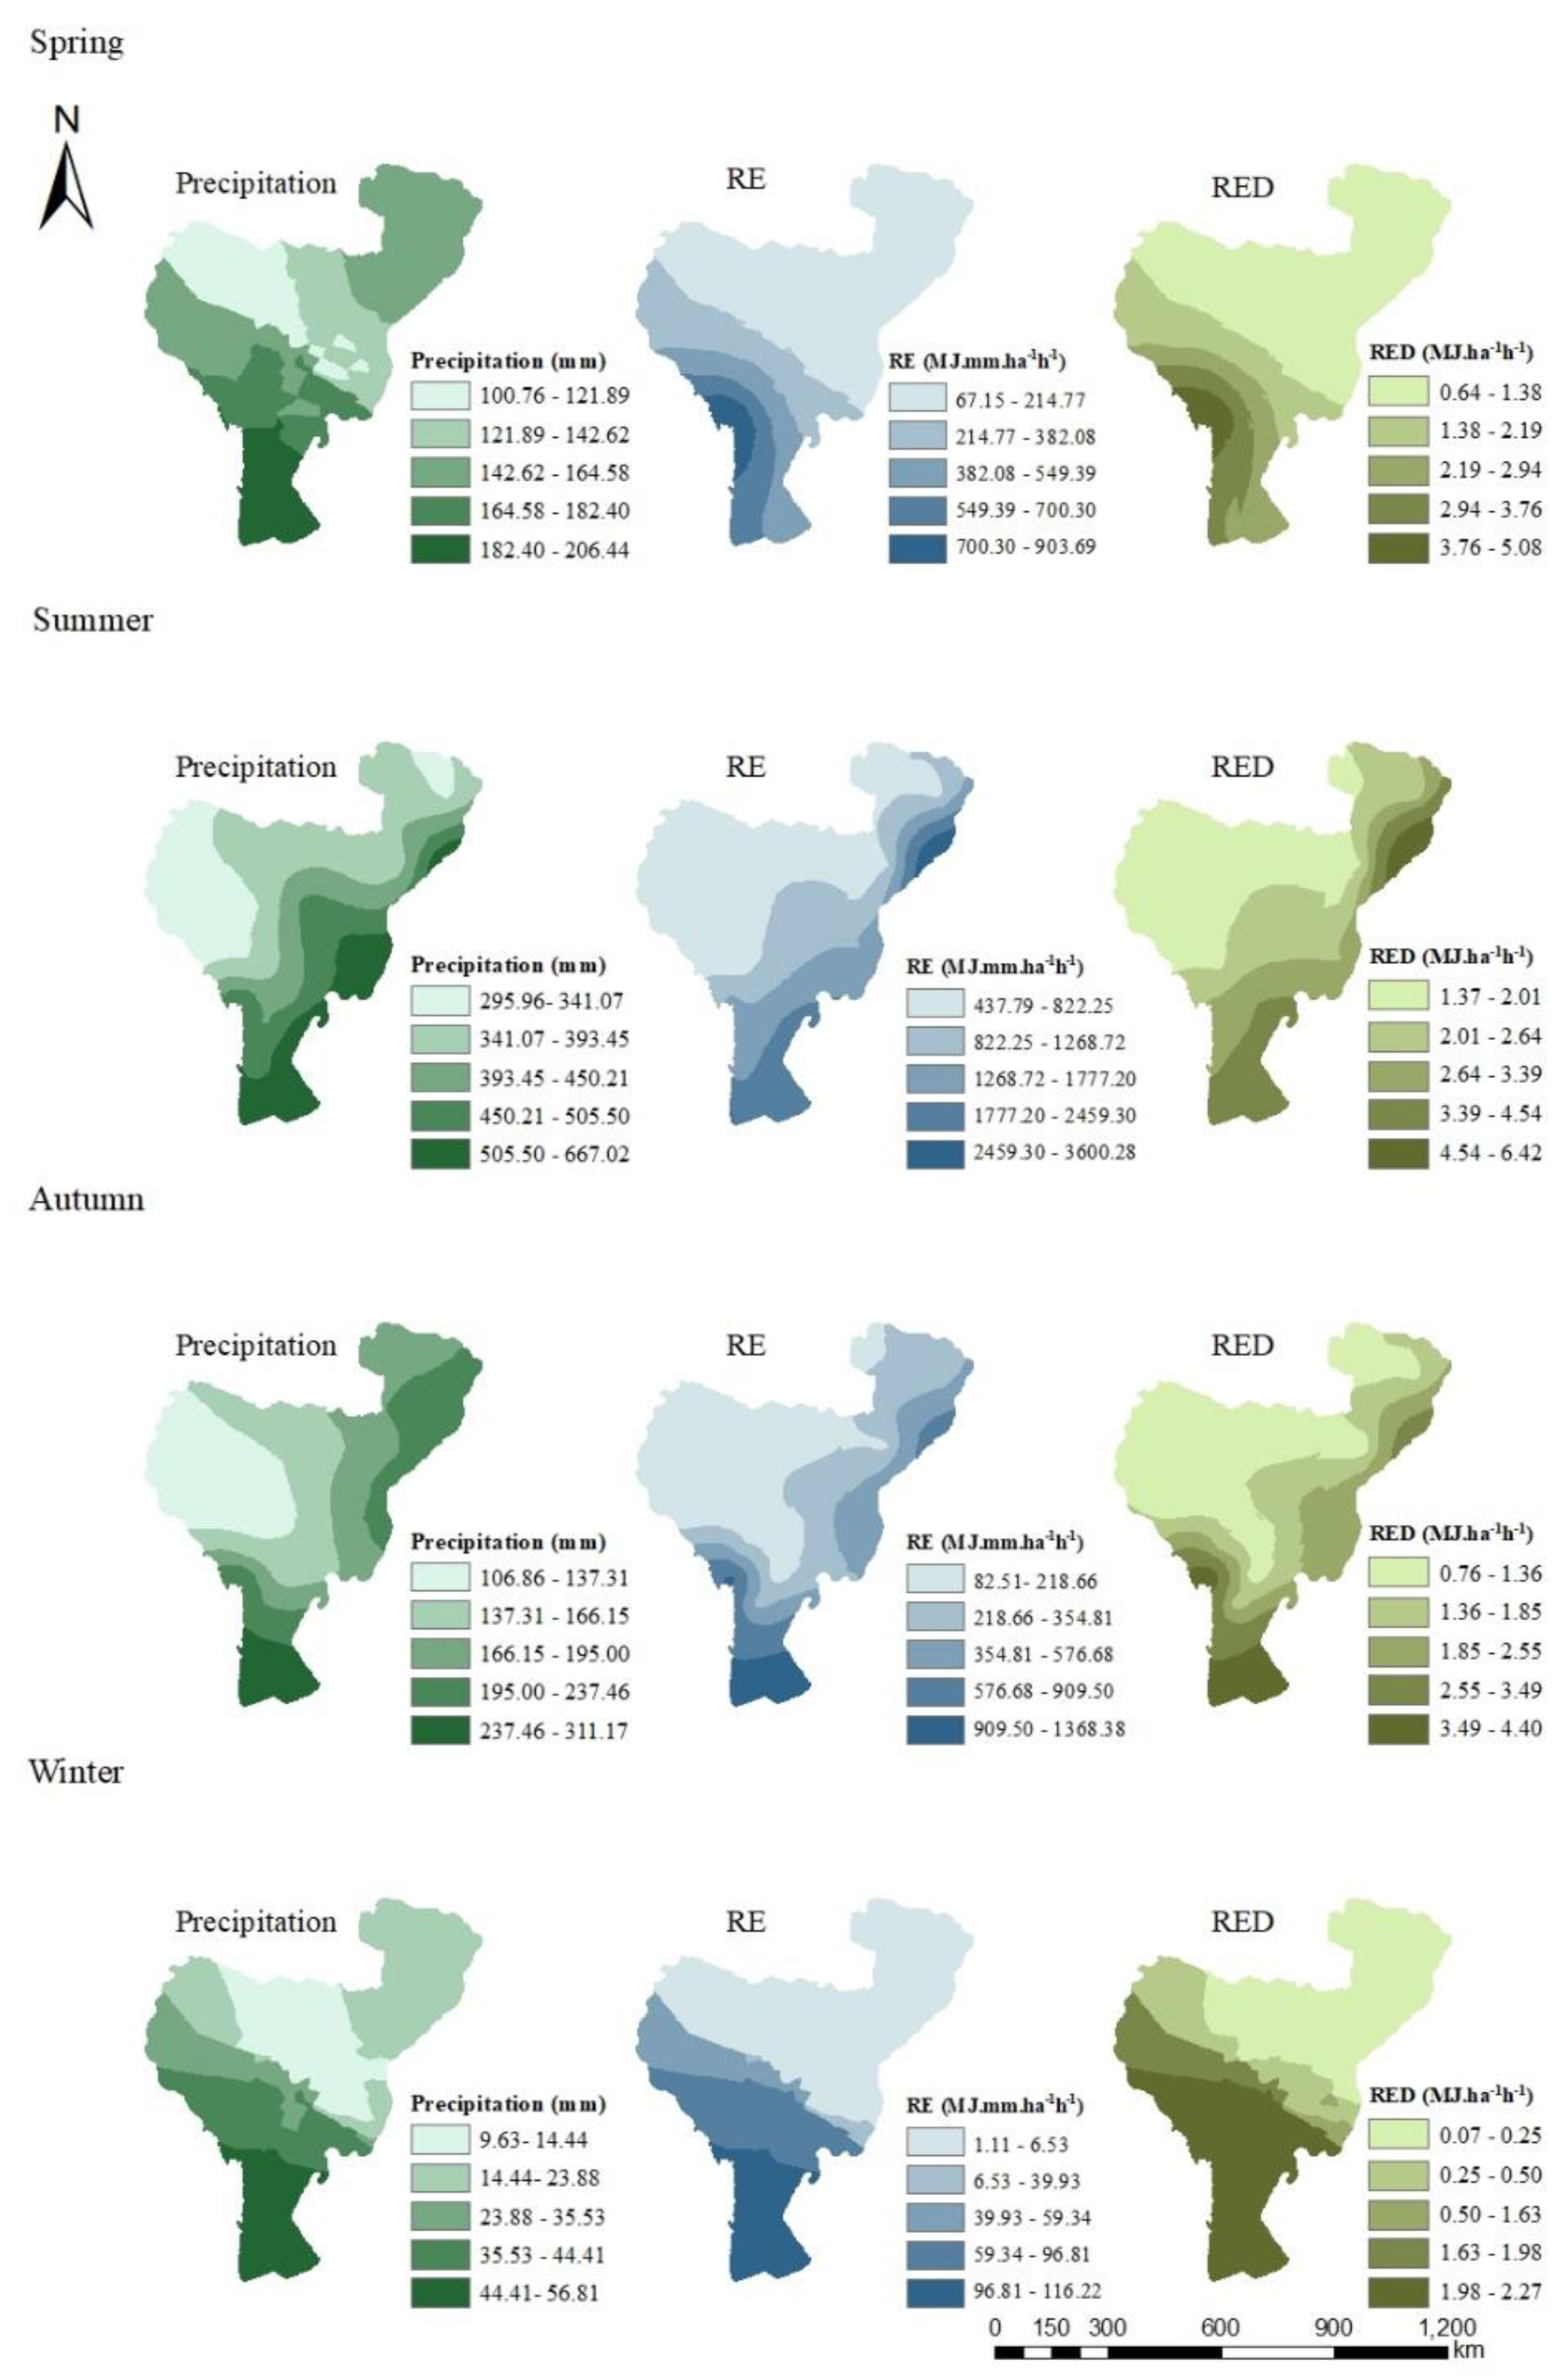
Analyzing the spatial variations of rainfall erosivity enables the identification of areas prone to water erosion, as well as potential risk zones for geological disasters such as mudslides and landslides. It also provides an initial assessment of the agricultural damage caused by rainfall [46]. Referring to previous studies on the spatial analysis of rainfall erosivity [47], this study employs ordinary kriging interpolation based on rainfall data collected from 34 ground stations within the research area to analyze the spatial distribution patterns of rainfall amount, rainfall erosivity, and rainfall erosivity density in the Hengduan Mountains region (Figure 7).
The spatial distribution of rainfall amount varies among different seasons. In spring, the areas with the least rainfall are mainly located in the northwest of the Hengduan Mountains region (northern Changdu and southwestern Ganzi), while the areas with the highest rainfall are primarily distributed in the southern part of the Hengduan Mountains region (south of Nujiang Prefecture). In summer, the areas with the least rainfall are found in the western part of the Hengduan Mountains region, particularly in Changdu, while the areas with the highest rainfall are concentrated on the eastern edge of the Hengduan Mountains region and in the southern cities of Dali and Baoshan. During summer, due to the strengthening of the monsoon, the spatial variability of rainfall amount is relatively low, resulting in a more balanced spatial distribution. In contrast, in winter, which is the non-monsoon period, there is reduced moisture transport in the western part of the Hengduan Mountains region, leading to a more pronounced uneven distribution of precipitation between the eastern and western regions (Table 2).
Compared to rainfall, the spatial distribution of rainfall erosivity exhibits more regularity and a more pronounced gradient distribution. Additionally, the spatial distribution of rainfall erosivity in different seasons is influenced to varying degrees by rainfall. In spring, high values of rainfall erosivity are mainly concentrated in the southwest of the Hengduan Mountains region, while low-value areas are distributed in the northern regions of the Hengduan Mountains area. The distribution patterns of rainfall erosivity in summer and autumn are consistent with the distribution patterns of rainfall, gradually decreasing from east to west. On the other hand, in winter and spring, the distribution pattern of rainfall erosivity decreases from south to north. The spatial distribution of rainfall erosivity in spring is essentially consistent with the distribution of rainfall erosivity density. In summer and autumn, the spatial distribution of rainfall erosivity and rainfall erosivity density show a high degree of similarity with the distribution of rainfall amount. In winter, the similarity between rainfall erosivity and rainfall amount is even higher. Therefore, it can be inferred that the distribution pattern of rainfall erosivity in the Hengduan Mountains region in spring is mainly influenced by rainfall intensity. In summer and autumn, it is the combined effect of rainfall intensity and amount, while in winter, the spatial distribution of rainfall erosivity is primarily the result of rainfall amount.
The spatial distribution pattern of rainfall erosivity density is generally consistent with that of rainfall erosivity. In winter, the entire region exhibits low rainfall erosivity density, with the maximum value reaching only 2.27 MJ ha-1h-1. In contrast, the maximum value in summer reaches 6.42 MJ ha-1h-1. The rainfall erosivity in summer and autumn is the result of the combined effects of rainfall amount and high-intensity rainfall, making soil erosion more likely to occur during these seasons. Areas with steep slopes are more prone to soil erosion. In the eastern edge of the Hengduan Mountains region (including counties such as Li, Mao, Wenchuan, and Baoxing), not only do they experience high rainfall erosivity density during summer, but their slopes are generally above 35°. These areas are more susceptible to soil erosion and geological hazards such as landslides and debris flows.

4.2.2. Annual-scale Spatial Distribution Characteristics of Rainfall Erosivity

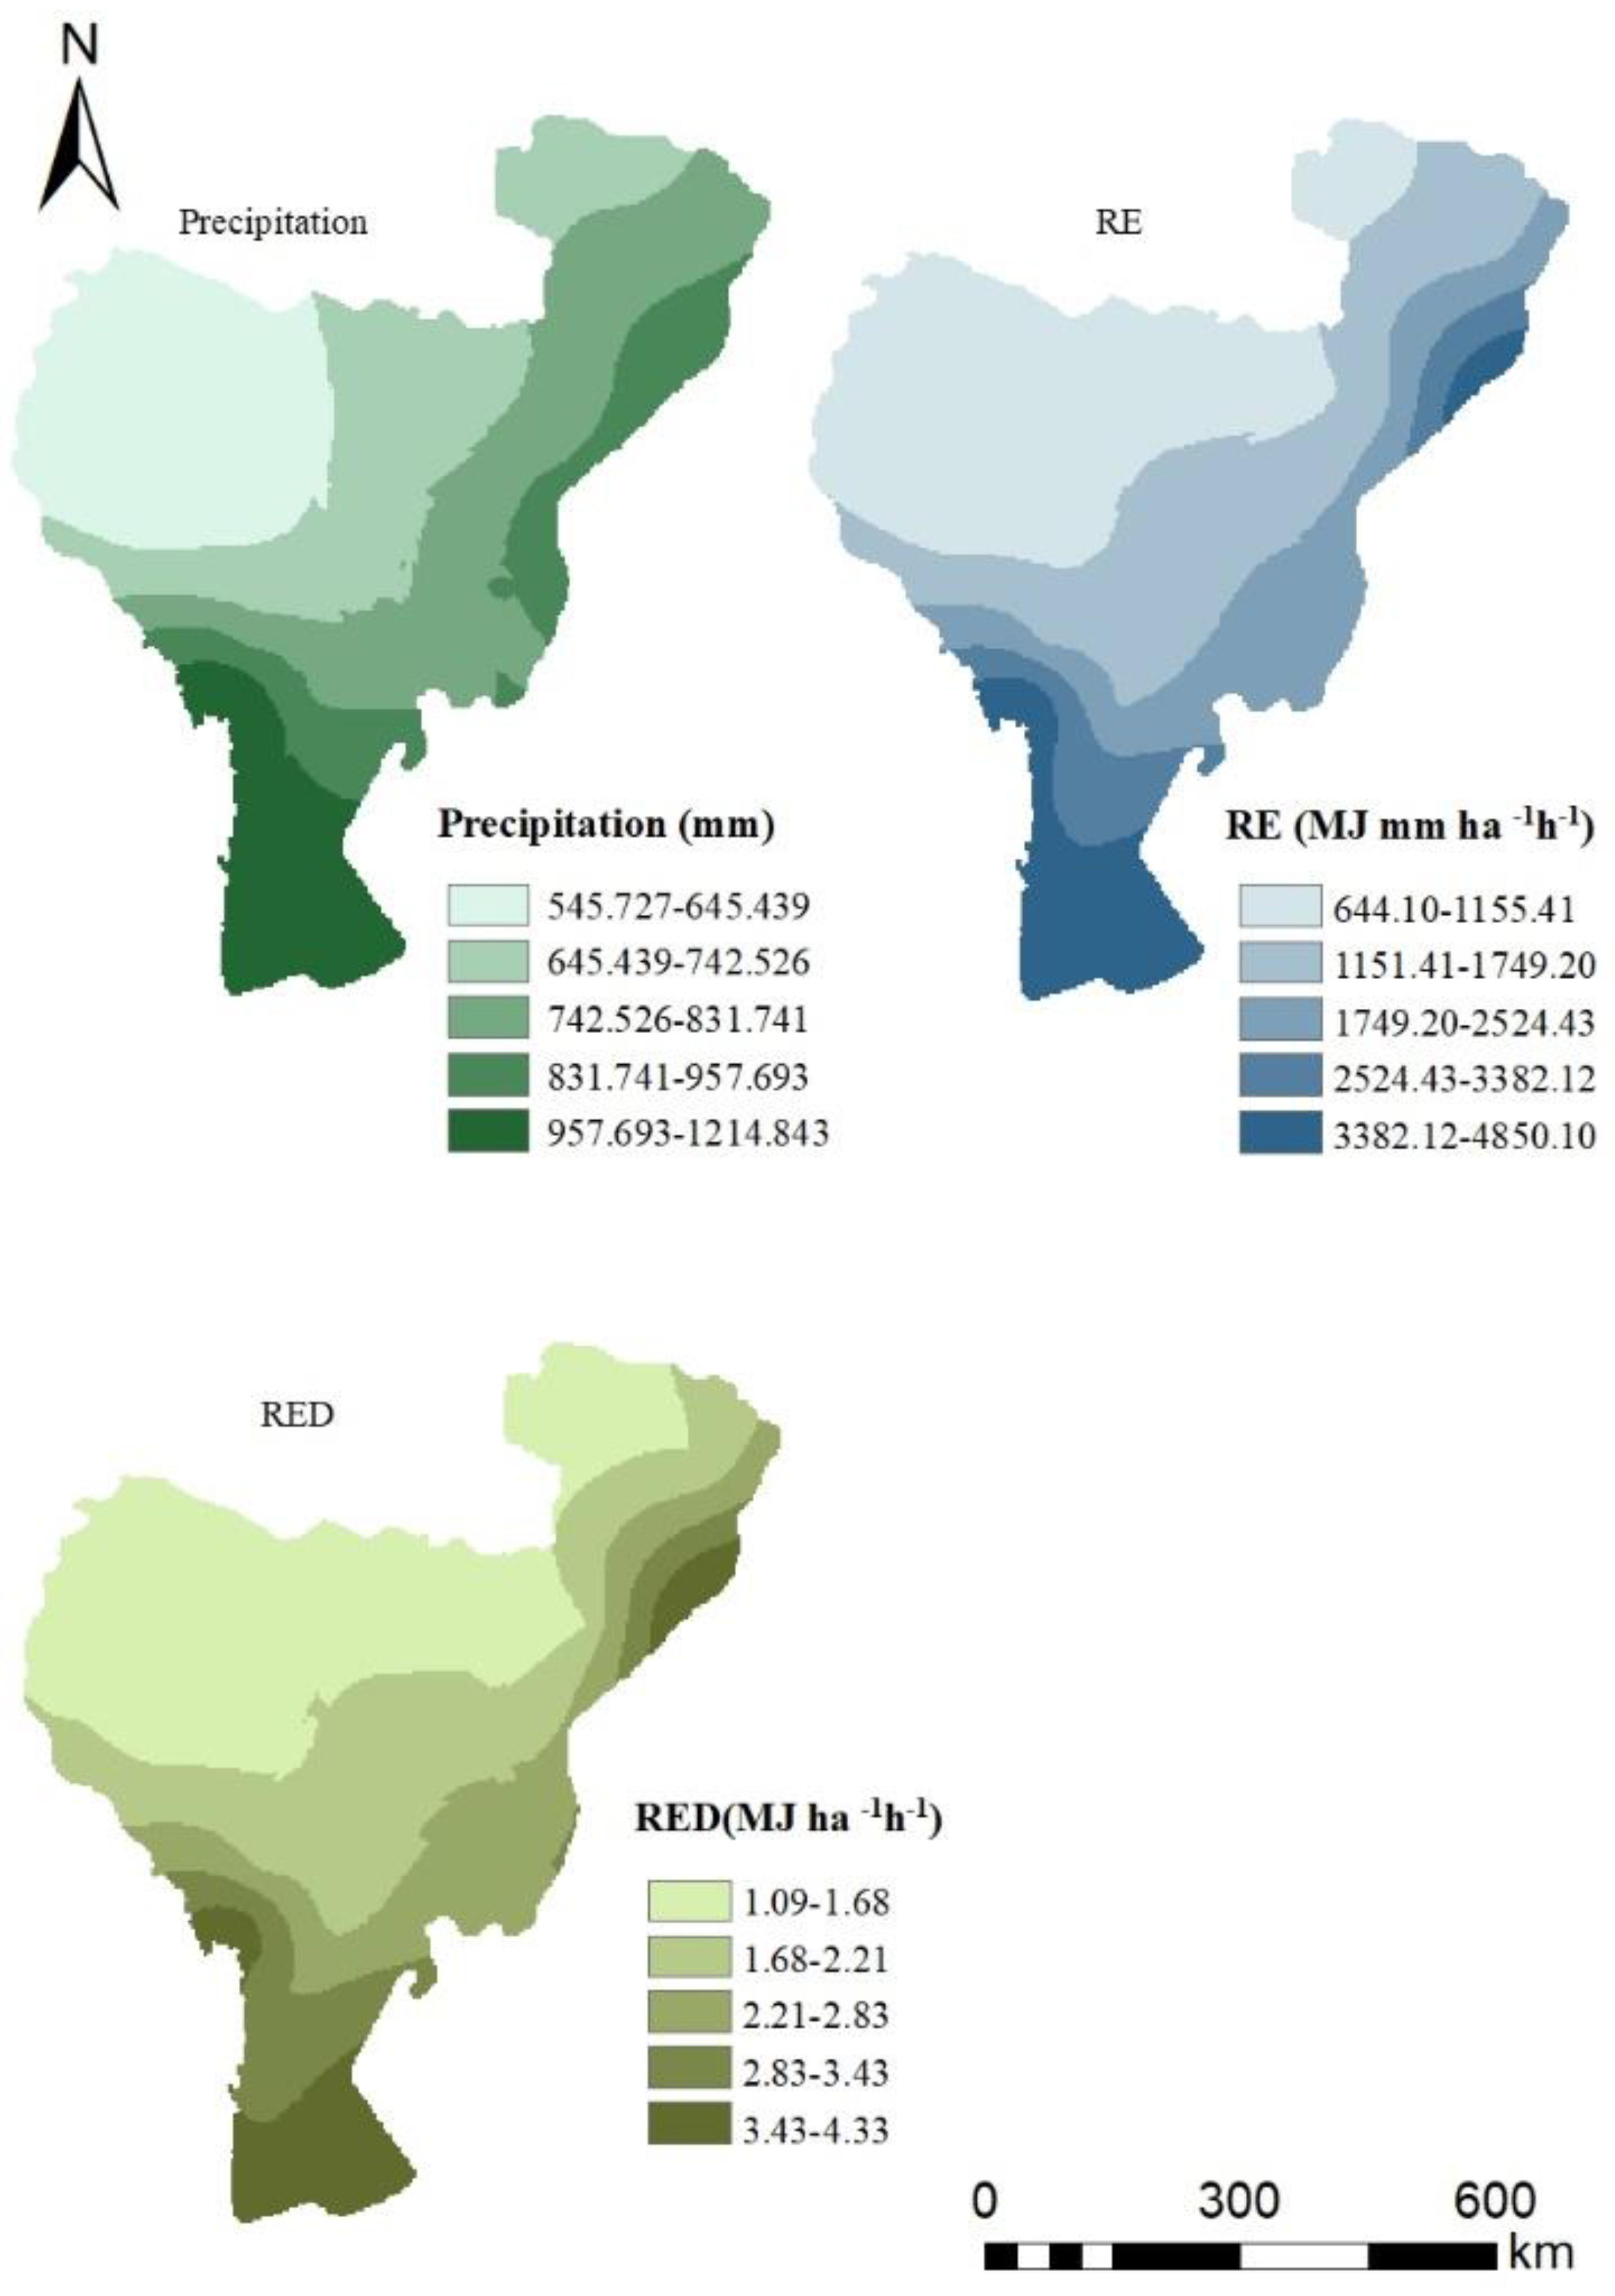
By analyzing the spatial distribution maps of average annual rainfall, rainfall erosivity, and rainfall erosivity density (Figure 8), it is observed that they exhibit similar spatial distribution characteristics with significant spatial variations. They all show a decreasing gradient from southeast to northwest, consistent with the trend of the East Asian monsoon. This finding is consistent with the spatial distribution patterns of rainfall in the Hengduan Mountains region obtained by Zhang Tao [32], indicating that the spatial distribution of rainfall plays a significant role in determining the spatial variation of rainfall erosivity.
Areas with higher values of rainfall erosivity are mainly concentrated in the southern and eastern edge regions of the Hengduan Mountains, reaching up to 2500 MJ mm ha-1h-1. These areas receive abundant precipitation, with an average annual precipitation of 950 mm, which is consistent with the distribution of high rainfall erosivity during the summer in the Hengduan Mountains region. This further indicates that the annual rainfall erosivity in the Hengduan Mountains region is primarily influenced by concentrated summer rainfall.
The distribution patterns of rainfall erosivity and rainfall erosivity density are in good agreement. According to the classification results of rainfall erosivity density by Das [48], the northern part of the Hengduan Mountains region (including Changdu, northern Ganzi, and parts of Aba such as Ruoergai, Hongyuan, Songpan, and Jinchuan) belongs to the low rainfall erosivity density category, indicating that this area experiences mainly low-intensity rainfall. In contrast, the southern part of the Hengduan Mountains region (including Dali and Baoshan) and the eastern edge region (Wenchuan, Mao, and Li) have high rainfall erosivity density, indicating more frequent occurrence of heavy rainstorms and a higher susceptibility to flood-related disasters, consistent with the findings of Sun [49].
It is worth noting that both rainfall and rainfall erosivity show a decreasing trend with increasing elevation. To further explain the influence of elevation on rainfall and rainfall erosivity, this study extracted 21,926 elevation points and their corresponding rainfall and rainfall erosivity data from the study area. Through correlation analysis, it was found that elevation is significantly negatively correlated with both rainfall and rainfall erosivity, with correlation coefficients of -0.736 for both variables. The mountainous terrain in the Hengduan Mountains region runs from south to north, with lower elevations in the eastern and southern parts. The mountain range acts as a barrier, blocking the moisture transported by the monsoon and causing it to accumulate in the eastern and southern parts of the Hengduan Mountains region [50]. Moreover, these areas are characterized by abundant vegetation and forests, resulting in high annual precipitation and subsequently high rainfall erosivity. However, as the elevation increases, the north-south mountain range blocks the monsoon, leading to thinner moisture above 1500m and predominantly grassland vegetation types with less precipitation, resulting in the lowest rainfall erosivity. In addition, the spatial variability of precipitation, rainfall erosivity, and rainfall erosivity density also differs. As shown in Table 3, the maximum value of precipitation is approximately twice the minimum value, while the maximum value of rainfall erosivity is about 7.5 times the minimum value. The spatial variation of rainfall erosivity is greater than that of precipitation, which is consistent with the temporal variation of precipitation and rainfall erosivity mentioned earlier.

4.2.3. Spatial Distribution Characteristics of the Trend in Rainfall erosivity

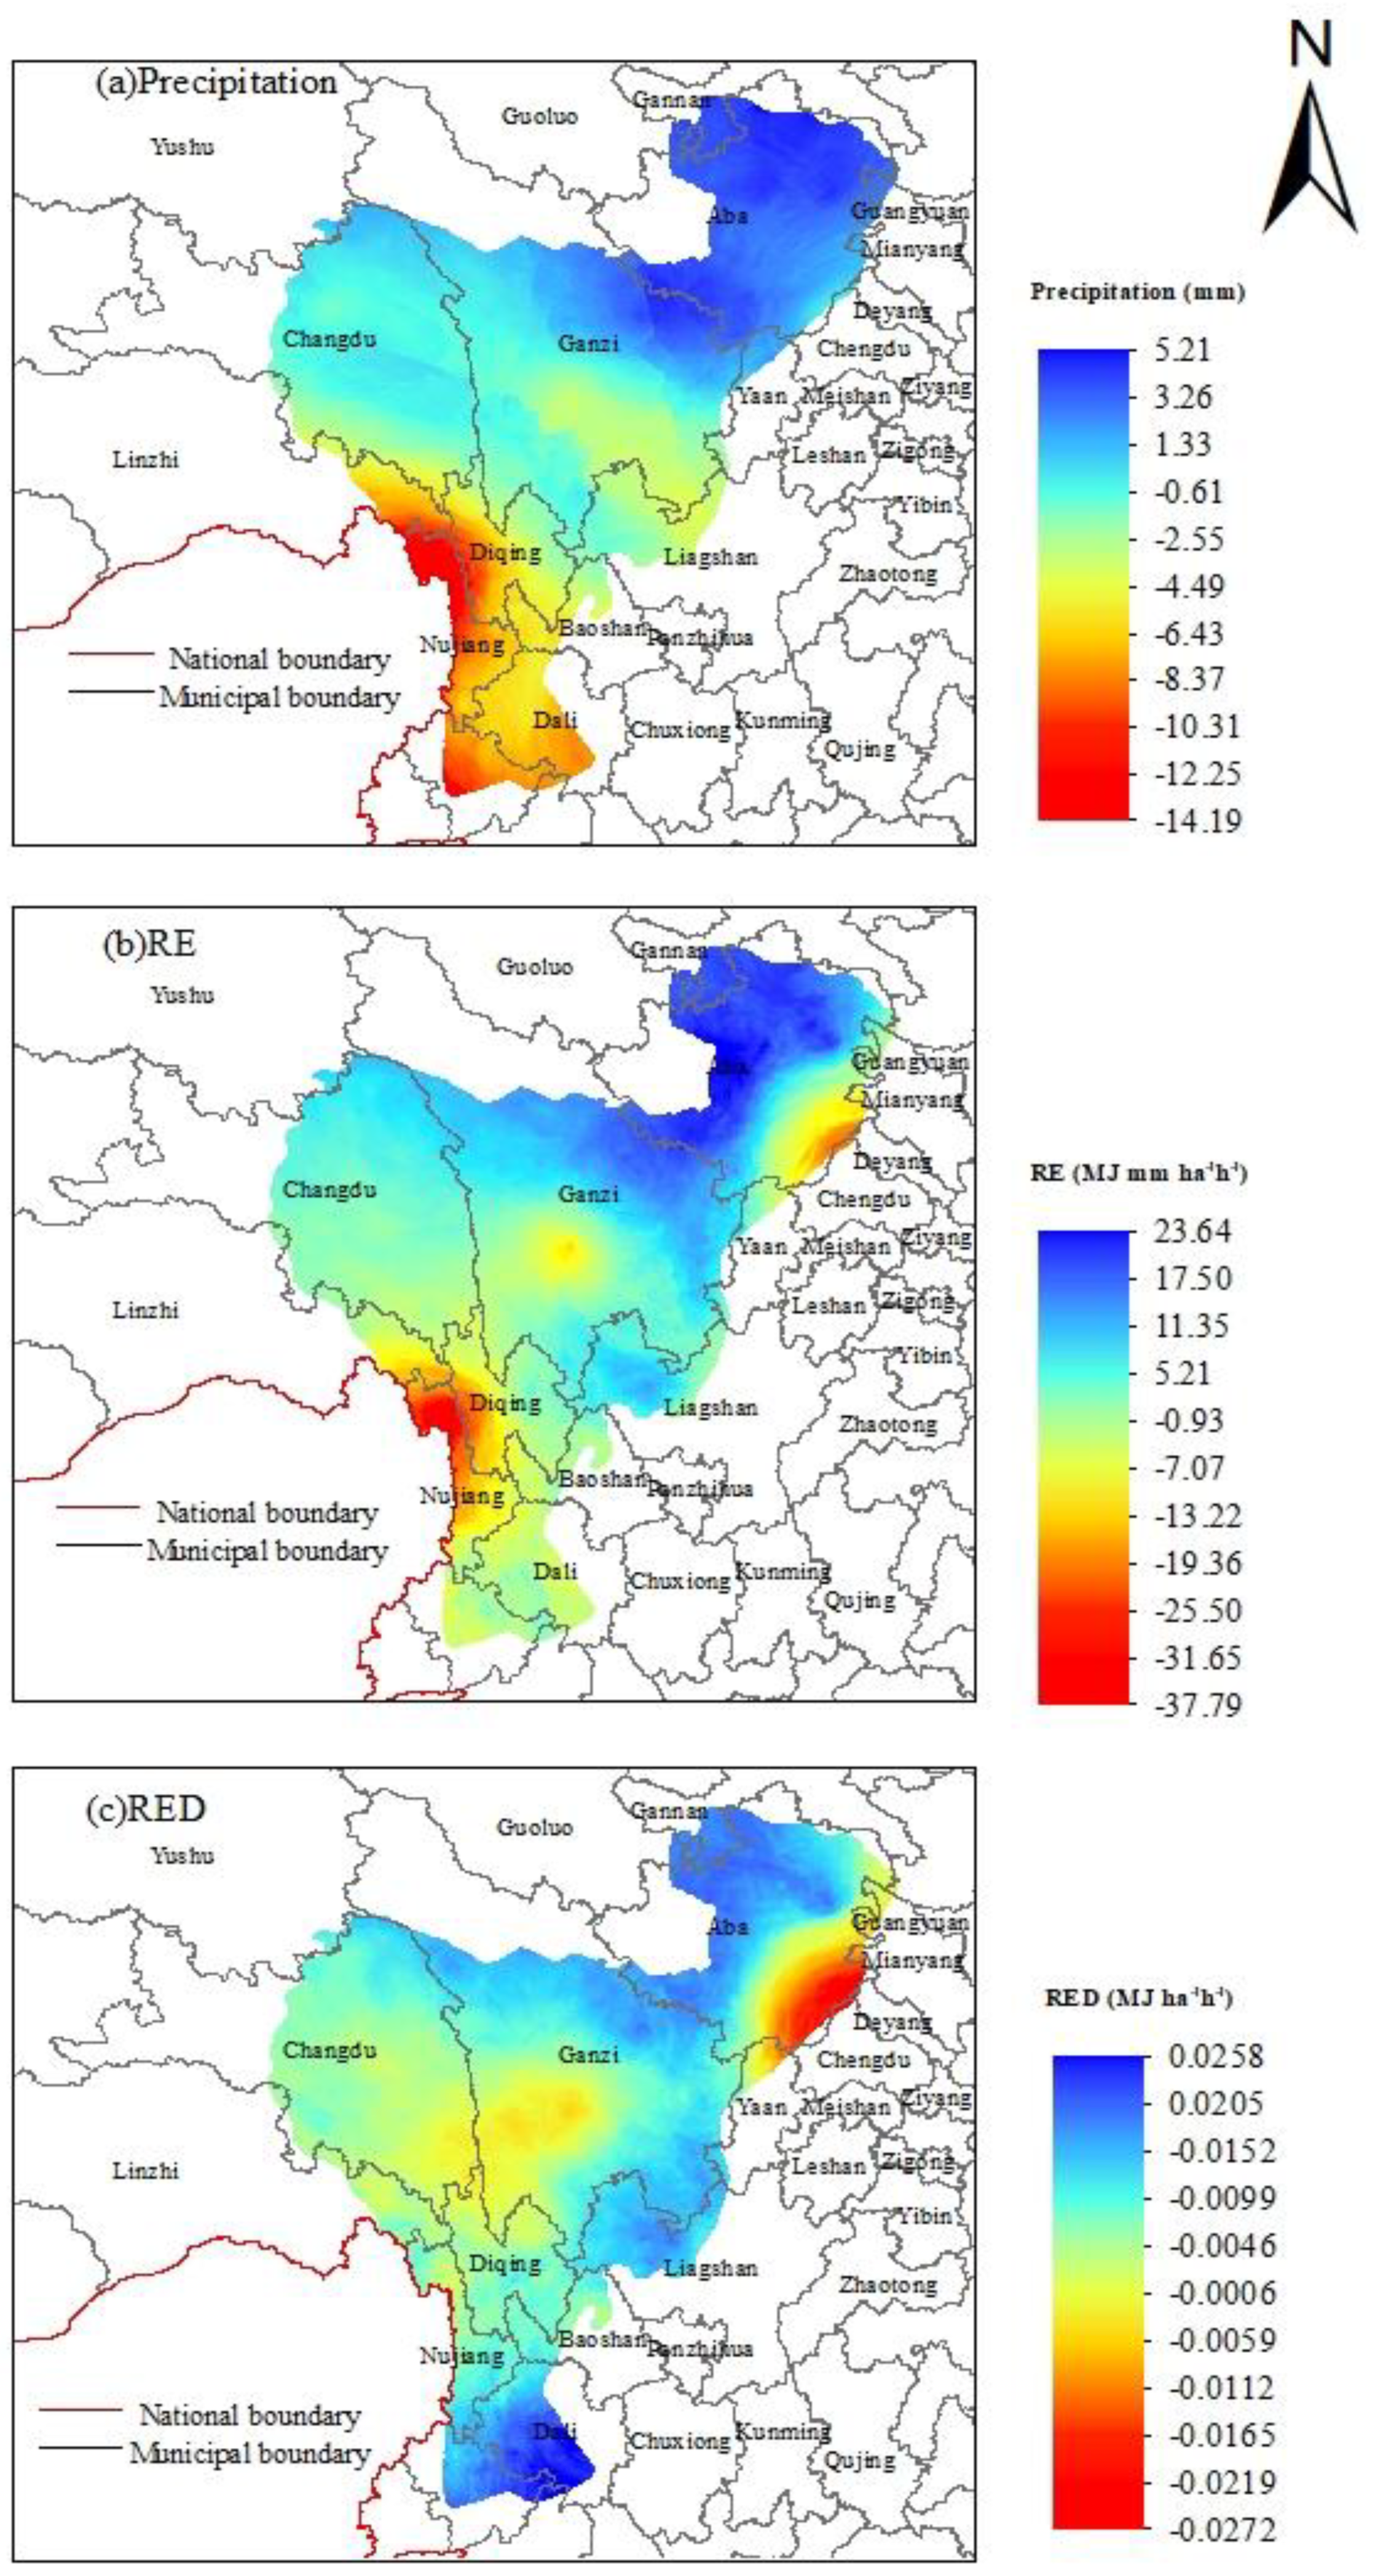
In this study, the Theil-Sen trend analysis method was used to obtain the spatial distribution maps of precipitation, rainfall erosivity, and rainfall erosivity density in the Hengduan Mountains region over a period of 31 years (Figure 9). The results indicate significant differences in both numerical values and spatial distribution among the three variables. Overall, the rainfall erosivity shows the largest range of change, followed by precipitation, and rainfall erosivity density shows the smallest range. This is mainly due to the susceptibility of rainfall erosivity and precipitation to extreme years, while rainfall erosivity density reflects the erosive rainfall characteristics of the study area and exhibits more stable data. To enhance the reliability of the results, it is necessary to perform significance tests using the Mann-Kendall (MK) test method in combination with the obtained results.
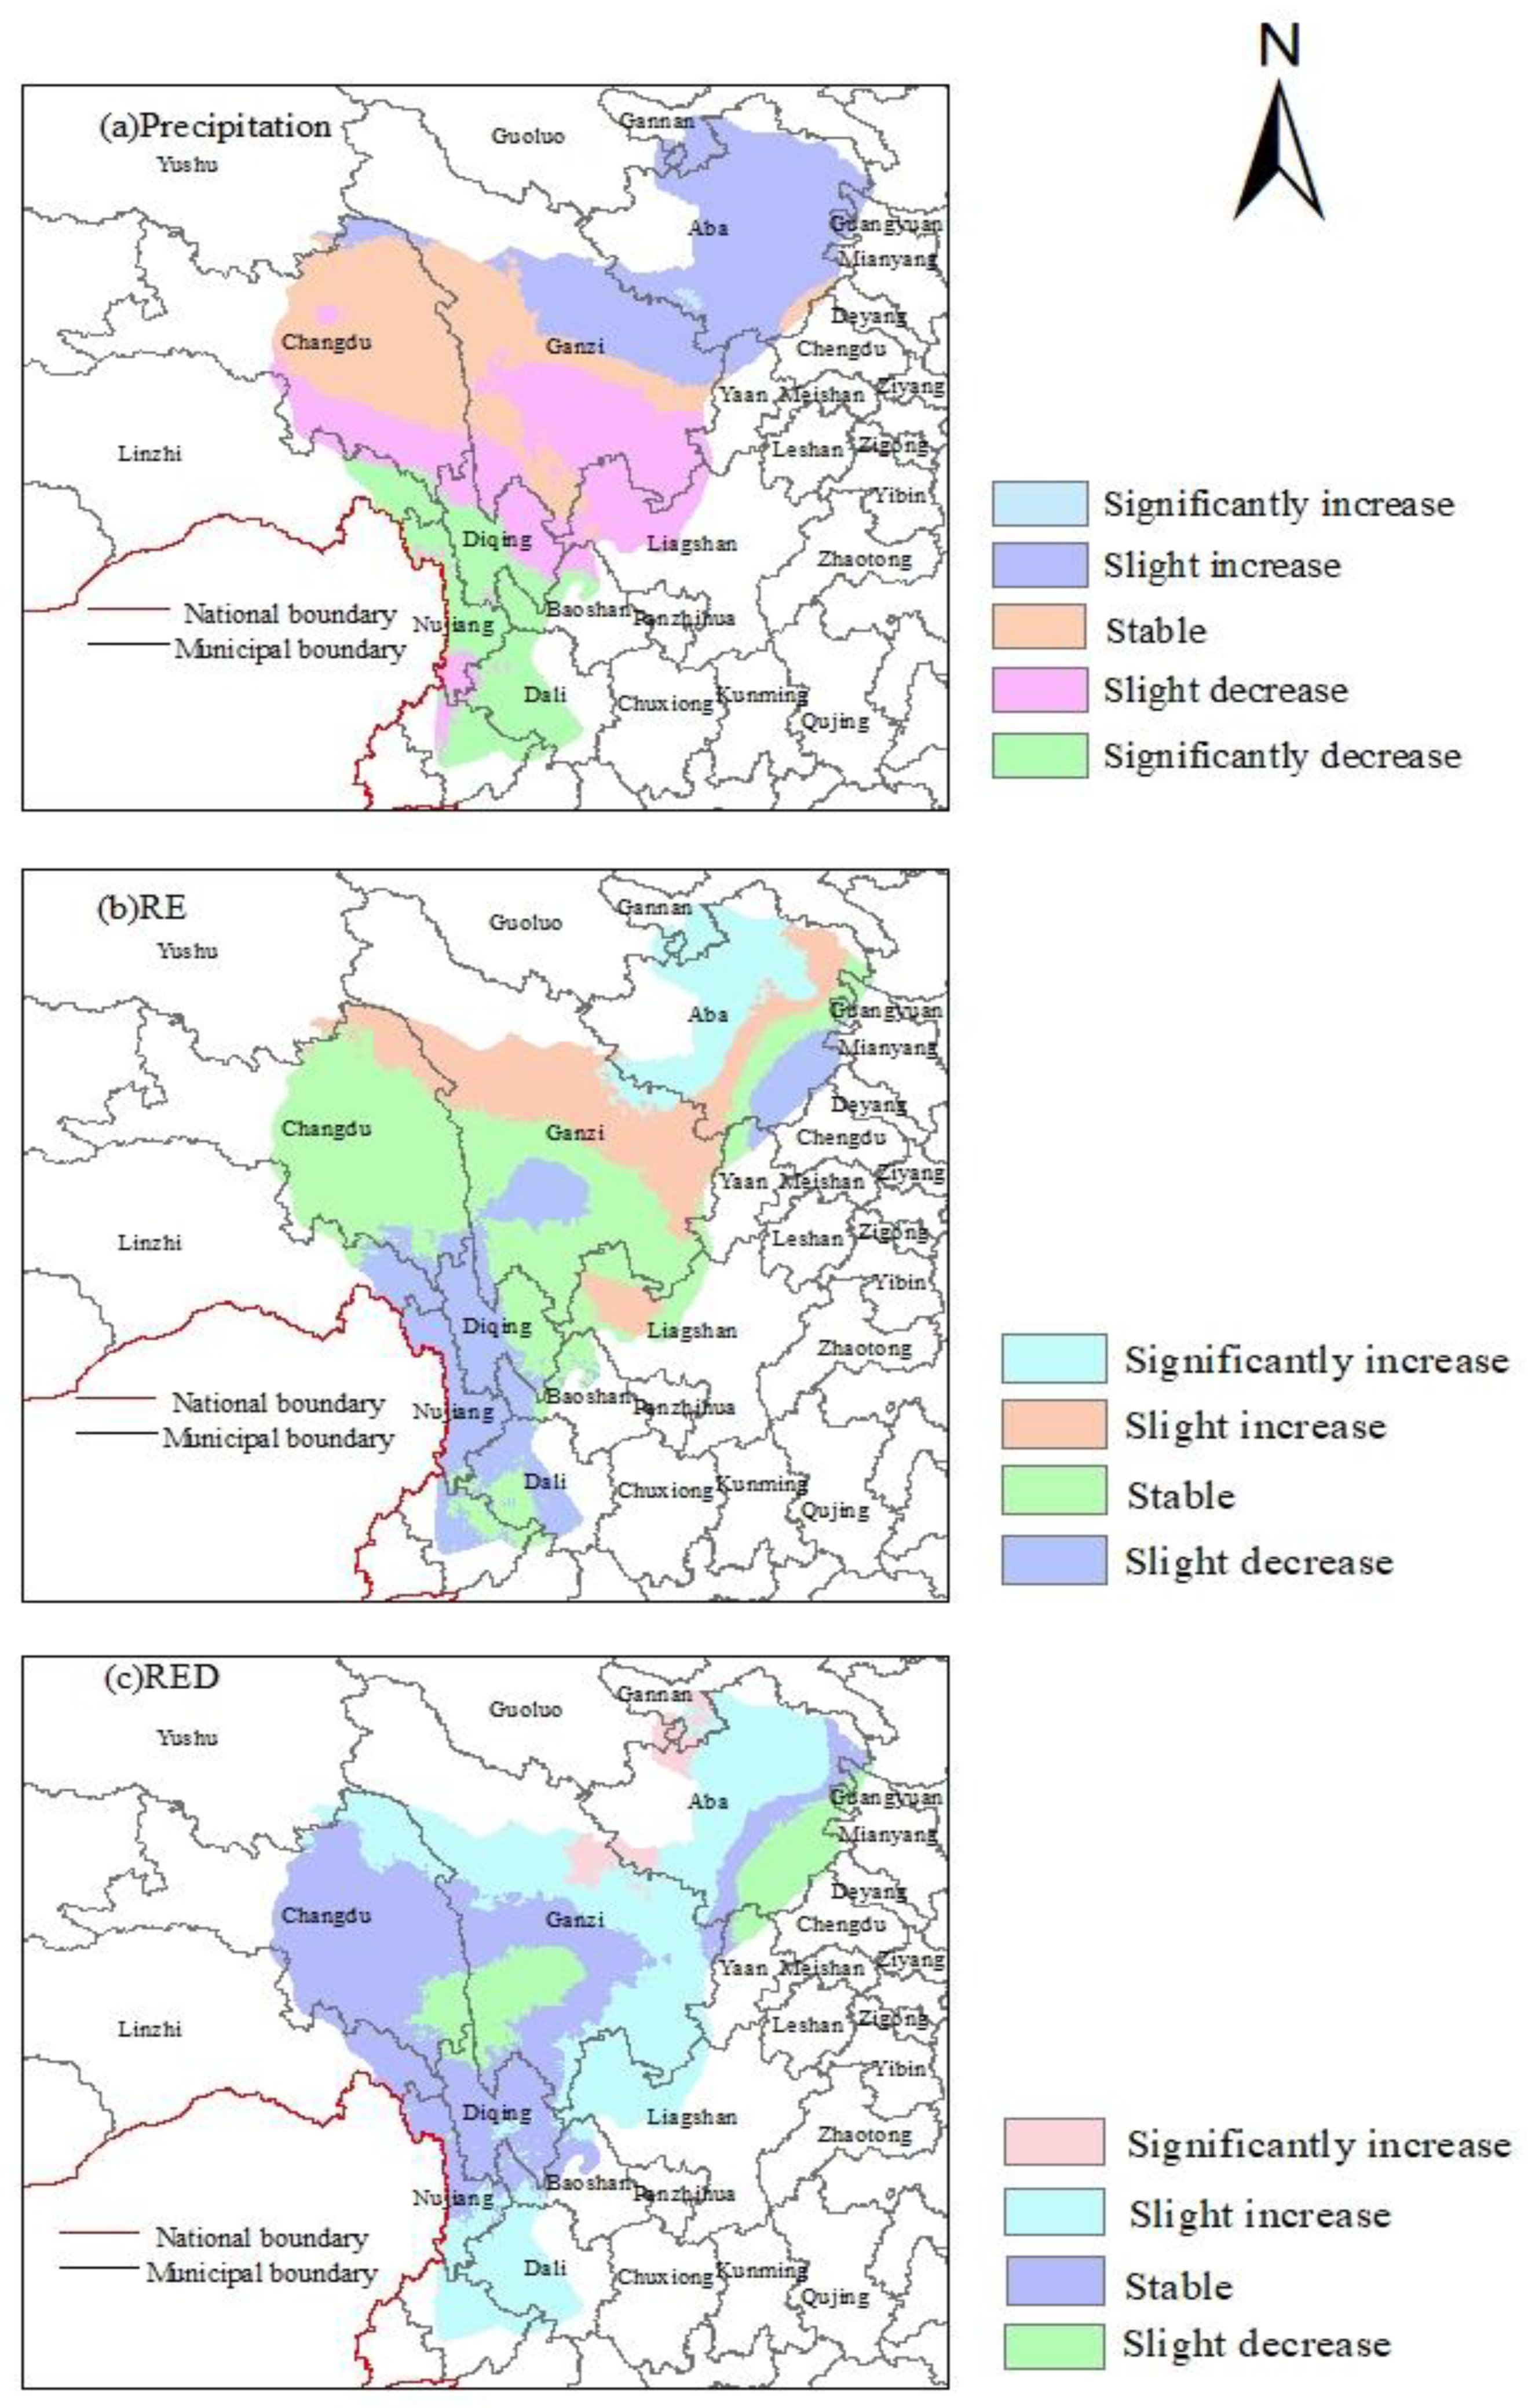
Significantly increasing areas in precipitation only account for 0.18% of the study area, while significantly increasing areas in rainfall erosivity account for 6.69% of the study area (Table 4). Moreover, there is high spatial similarity between the distribution of rainfall erosivity and precipitation, indicating that the increase in rainfall erosivity is primarily attributed to the increase in precipitation. In the southern part of the Hengduan Mountains region (south of Ganzi and Changdu), there is a significant decrease in precipitation, while the northeastern part of the study area (Abazhou and the eastern part of Ganzi) shows an upward trend. However, Xu Fei et al.’s [51] study suggests a declining trend in rainfall volume in the southern and northern parts of the Hengduan Mountains region, with a more pronounced decline in the southern part compared to the northern part. The main reason for the difference between their study and this research lies in the choice of trend analysis method and the use of different station data.
The comparison of the significance distribution maps for precipitation, rainfall erosivity, and rainfall erosivity density (Figure 10) indicates a decreasing trend in precipitation and rainfall erosivity in the southern and eastern edge regions of the Hengduan Mountains, where precipitation is relatively high. The main reason for this trend is the weakening of the East Asian summer monsoon in the 1970s, which resulted in reduced rainfall in the southern region [52]. In comparison to the variations in precipitation, both rainfall erosivity and rainfall erosivity density exhibit greater stability. The stable areas account for more than 40% of the total area, while the areas with unchanged precipitation represent 26.65% (Table 4). The regions where rainfall erosivity and rainfall erosivity density remain stable are generally consistent with the areas of stable precipitation within the region.

4.3. Prediction of Rainfall erosivity in the Hengduan Mountains

4.3.1. Prediction of Rainfall erosivity Index in the Hengduan Mountains

For the prediction of rainfall erosivity in the Hengduan Mountains, this study mainly used data from four global climate models in CMIP6. The data were preprocessed through downscaling and removal of outliers to calculate the rainfall erosivity for the period 2025-2040 in the Hengduan Mountains. To provide reference and facilitate comparative analysis, the baseline period was set from 2005 to 2020. By comparing the rainfall erosion indices between the baseline period and the forecast period (2025-2040), the changes in future rainfall erosivity in the Hengduan Mountains were analyzed.
According to the statistical results in Table 5, it can be observed that, compared to the baseline period, 76% of the stations show a decreasing trend in extreme erosive precipitation (EEP). The stations with the largest decrease in extreme erosive precipitation are mainly located in the eastern edge of the Hengduan Mountains and regions with abundant precipitation, such as Yunnan. Conversely, the stations with an increase in extreme erosive rainfall are mainly found in areas with less precipitation, such as the Ganzi and Aba regions. The number of extreme erosive days (EED) and the total annual erosive precipitation (TEP) for the selected stations both exhibit an increasing trend. The longest consecutive erosive days (LCED) also show an increase, except for the Daofu station. The regions with the most significant increase in total annual erosive precipitation are mainly concentrated in areas with less precipitation and lower rainfall erosivity, such as Ganzi, Aba, and Changdu. Although Yunnan and the eastern edge region also show an increase, the magnitude is much smaller compared to the other regions
These results indicate that the regional differentiation of rainfall erosivity in the Hengduan Mountains is gradually weakening, and there is a tendency towards a more homogeneous distribution of rainfall erosivity in the region. The decrease in extreme erosive rainfall and the general increase in the number of extreme erosive days and total erosive precipitation reflect that future rainfall erosivity in the Hengduan Mountains is primarily driven by the combined effects of rainfall duration and intensity. It also suggests that the occurrence of intense rainfall events will decrease in the study area, and erosion dynamics will be mainly driven by continuous high-erosivity rainfall, particularly in areas with high rainfall erosivity.

4.3.2. Prediction of Rainfall erosivity Variation

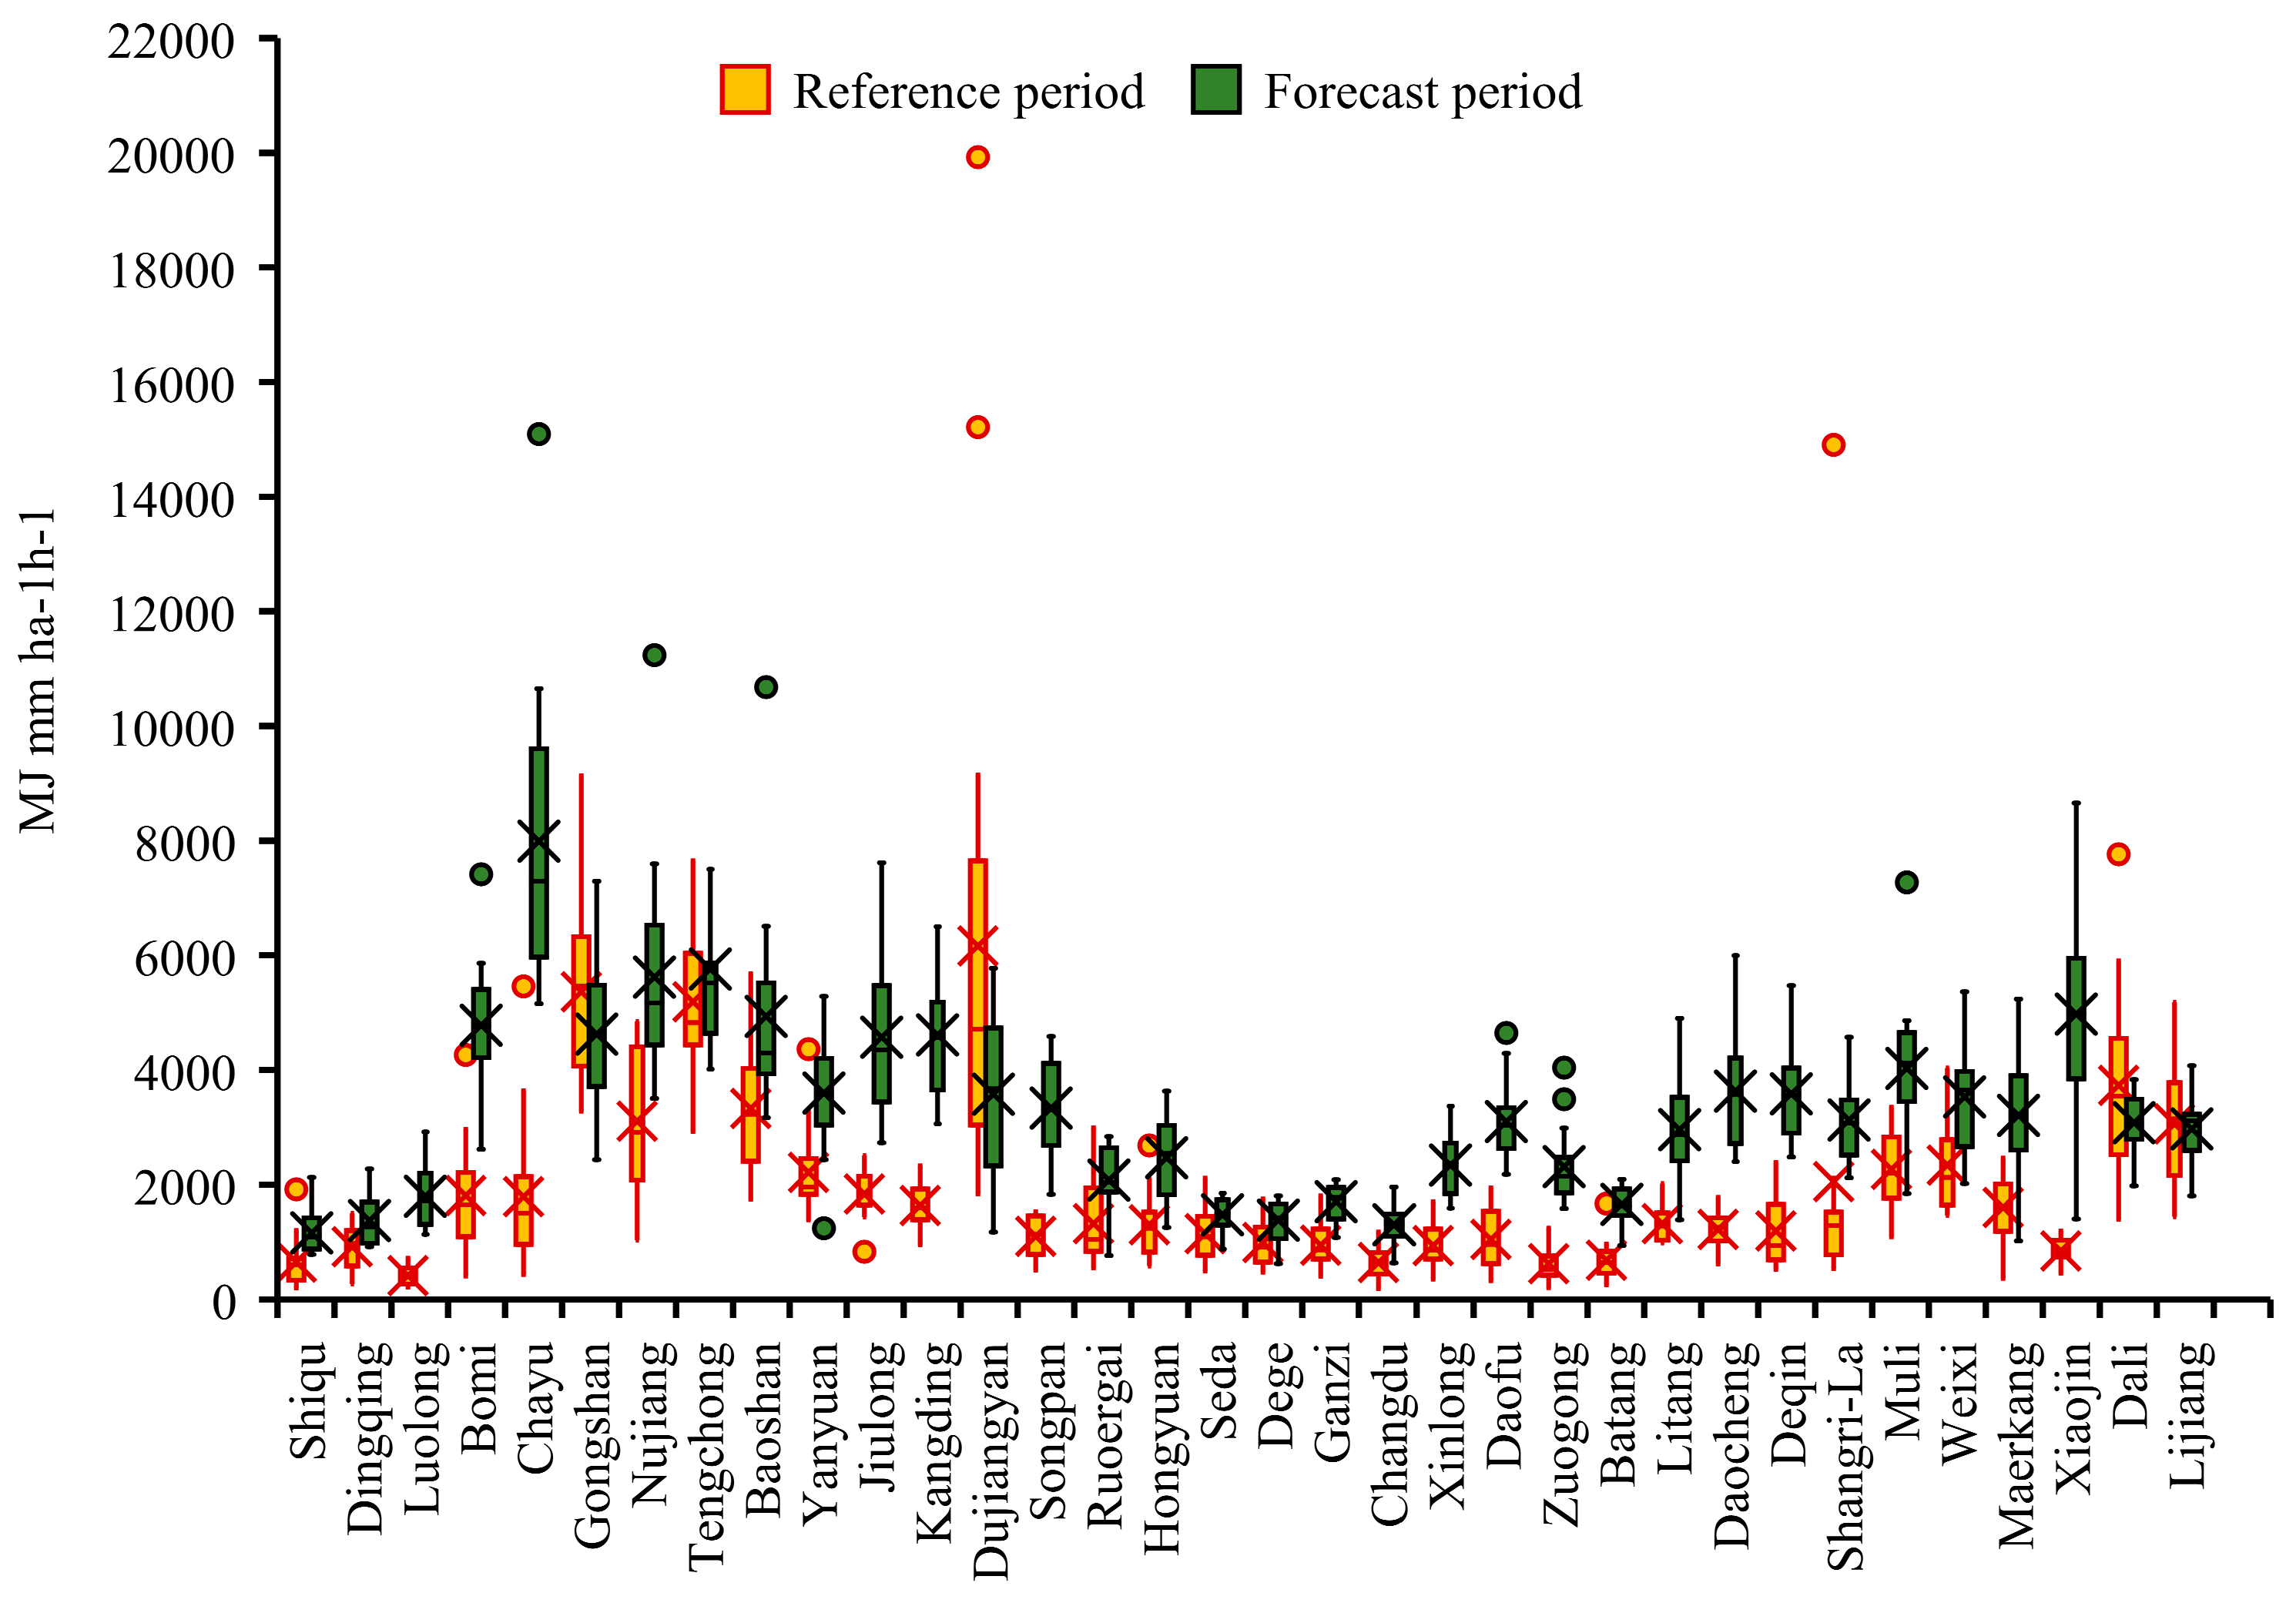
After conducting a statistical analysis of the rainfall erosivity for all stations during the baseline period (2005-2020) and the forecast period (2025-2040), it was found that most stations experienced a significant increase in rainfall erosivity. However, in areas with abundant precipitation and high rainfall erosivity, such as Dujiangyan, Dali, and Lijiang, the rainfall erosivity showed a decreasing trend (Figure 11), despite an increase in precipitation. This further confirms that the main reason for the increase in rainfall erosivity is the decrease in erosive rainfall events and single rainfall intensities. Additionally, based on the results shown in Figure 11, it can be observed that although rainfall erosivity generally increases in the future, the occurrence of extreme erosive years decreases, and the maximum values of rainfall erosivity significantly decrease compared to the baseline period.
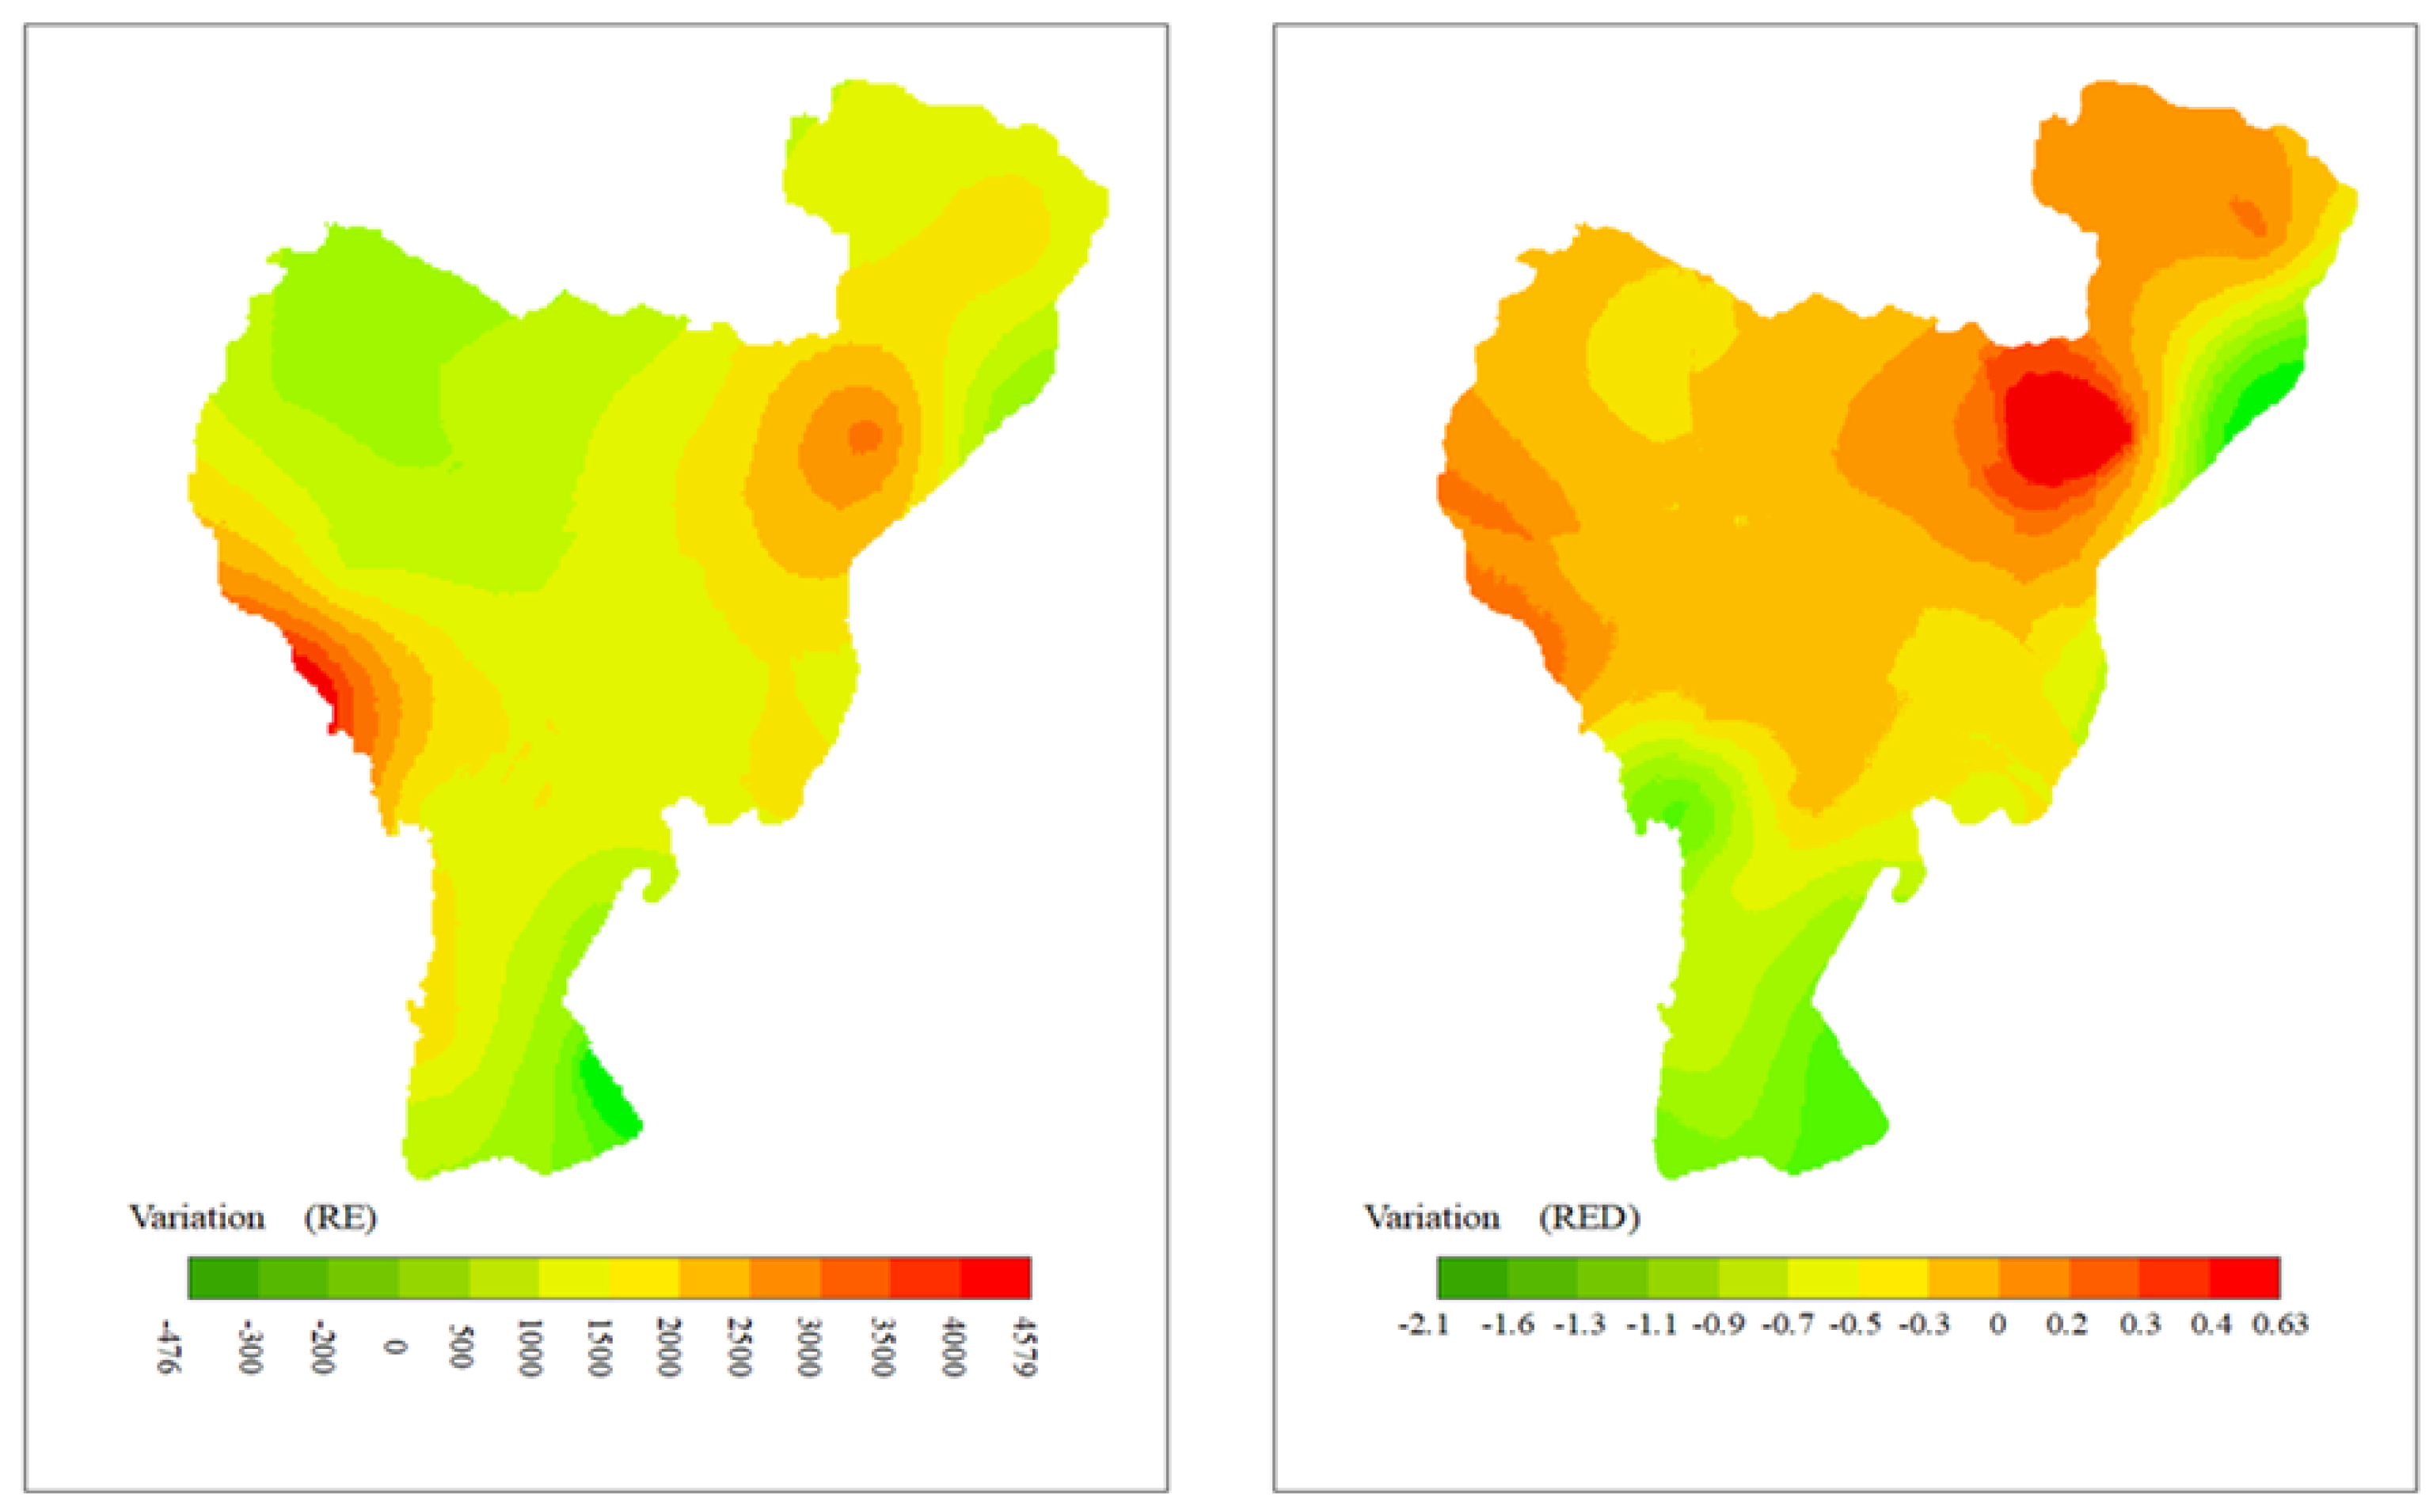
To further analyze the changes in rainfall erosivity in the Hengduan Mountains under the SSP2-4.5 scenario, a comparison was made between the forecast period and the baseline period for rainfall erosivity and rainfall erosivity density. This analysis resulted in a spatial distribution map of rainfall erosivity variation in the Hengduan Mountains (Figure 12). According to the spatial distribution of changes in rainfall erosivity and rainfall erosivity density, only 1.17% of the entire Hengduan Mountains region showed a decrease in rainfall erosivity compared to the baseline period. This indicates that the issue of soil erosion in the future will become even more severe in the Hengduan Mountains. However, in most areas, the rainfall erosivity density decreased, covering 73.3% of the study area. This reflects the reduction in the influence of rainfall intensity on rainfall erosivity, with erosion being driven more by continuous rainfall. This finding aligns with the conclusion drawn in section 4.3.1. The regions with the most significant increase in rainfall erosivity are mainly located in the western edge of the Hengduan Mountains, and these areas also experience a significant increase in rainfall erosivity density. Consequently, these regions will face a greater threat of soil erosion caused by heavy rainfall in the future.

5. Discussion and Conclusion

5.1. Discussion

After conducting a statistical analysis of the intra-annual distribution of rainfall erosivity in the Hengduan Mountains region, it is evident that the rainfall erosivity in this area exhibits typical monsoon characteristics. This is manifested not only in the significant difference between the rainfall erosivity values during the monsoon and non-monsoon periods but also in the varying spatial distribution patterns of rainfall erosivity in different seasons, influenced by the amount of precipitation. According to the research by Liang Jingyu et al. [53], the annual distribution pattern of rainfall erosivity in the Hengduan Mountains region is closely related to the radiative effect of the summer subtropical high-pressure system. Furthermore, they pointed out that as rainfall intensity increases, the erosion density also increases, further indicating that in areas with high rainfall erosivity density, rainfall erosivity is primarily driven by highly erosive heavy rainfall.
In the eastern edge of the Hengduan Mountains region (Wenchuan County, Li County, Mao County, Baoxing County) and the southern region (Gongshan County, Weixi County), where rainfall erosivity is high and intense rainstorms are prone to occur in summer, coupled with steep slopes and significant surface undulations, these areas are also prone to debris flows and flash floods, as revealed in the study by Hu Kaiheng et al. [54]. Therefore, it is speculated that rainfall erosivity plays a significant triggering role in geological hazards. Thus, in soil erosion control, attention should be given not only to areas requiring priority management but also to the prevention of secondary disasters caused by soil erosion. Hence, this study has practical implications for soil erosion protection work in the Hengduan Mountains region.
Under global climate warming and human influence, significant differences are observed in the increase or decrease of precipitation in different areas of the Hengduan Mountains region, resulting in varying trends of rainfall erosivity across regions. From the perspective of rainfall erosivity prediction, although extreme erosive rainfall is expected to decrease in the future, the combined effects of erosion frequency and continuous erosion duration indicate that the Hengduan Mountains region will face more severe soil erosion issues, particularly with high-frequency and high-intensity long-duration erosions. In a study on soil erosion prediction in the Qinghai-Tibet Plateau by Teng Hongfen et al. [55], it was found that rainfall erosivity will increase in the future, leading to intensified soil erosion. Since the Hengduan Mountains region is geographically adjacent to the Qinghai-Tibet Plateau, this prediction implies that future climate change poses severe challenges to soil management in China. The widespread increase in rainfall frequency will elevate the risk of geological hazards in many areas of China and significantly impact agriculture.
This study provides a comprehensive analysis of the temporal and spatial scales of rainfall erosivity changes in the Hengduan Mountains region, elucidates the distribution mechanism of rainfall erosivity in this region, and effectively mitigates the influence of anomalous years on trend analysis by employing Theil-Sen trend analysis and MK test. It visually depicts the degree of change in precipitation, rainfall erosivity, and rainfall erosivity density in the Hengduan Mountains region from 1990 to 2020. However, due to the study area’s location in the southwestern border region of China, there is a scarcity of ground stations compared to the eastern coastal areas. Additionally, each station covers a limited area, resulting in limited accuracy of the interpolated results. Overcoming the problem of insufficient coverage of ground stations is a key focus of future research.
The causes of soil erosion are multifaceted, and vegetation, topography, and rainfall can all influence the extent of soil erosion [56]. This study analyzed the variation patterns of rainfall erosivity in the Hengduan Mountains region, providing a certain basis for soil erosion control in this area. However, for a more scientific assessment of soil erosion conditions in the Hengduan Mountains region, it is necessary to consider other soil erosion factors for in-depth analysis, which is also a direction for future research.
In this study, rainfall data corrected by the Delta method were utilized, and the rainfall erosivity in the Hengduan Mountains region was predicted through ensemble averaging. This approach addressed the issue of low accuracy in large-scale data and compensated for the limitations of single climate models in simulating accuracy, significantly enhancing the reliability of the predictions. However, it is important to note that the CMIP6 data used in this study inherently exhibit systematic biases towards wetness [57], which can affect the accuracy of the results and, to some extent, lead to an overestimation of rainfall erosivity.

5.2. Conclusion

(1) The rainfall erosivity in the Hengduan Mountains region exhibits significant seasonal variations, demonstrating typical monsoonal characteristics. Both rainfall erosivity and precipitation follow the pattern of summer > autumn > spring > winter, and they are significantly positively correlated. The high rainfall erosivity in summer is attributed to the combined effect of rainfall amount and high-intensity rainfall. The linear trend rate of rainfall erosivity in the Hengduan Mountains region is 37.43 MJ mm ha-1h-1/10yr, while the trend rate for rainfall amount is -23.75 mm/10yr. Over the years, the rainfall erosivity have maintained a slightly increasing trend. Based on the trend of rainfall erosivity density, the study area experiences periodic flooding or drought disasters approximately every 6-8 years, which can be forecasted based on these cycles.
(2) Rainfall erosivity in the Hengduan Mountains region decreases gradually from southeast to northwest, displaying a distinct gradient pattern. This pattern is formed under the combined influence of precipitation and elevation. The spatial distribution also varies across different seasons, with winter exhibiting the most pronounced spatial variation in rainfall erosivity, followed by spring and autumn, while summer has the least spatial variation.
(3) The areas with the most significant increase in rainfall erosivity in the Hengduan Mountains region are primarily located in the northeastern part, where both rainfall amount and intensity show an increasing trend. The variability in rainfall amount is more pronounced compared to rainfall erosivity, which is mainly due to the weakening of the Southeast Asian monsoon, leading to a significant decrease in precipitation in the southern part of the Hengduan Mountains region.
(4) In the future, rainfall erosivity in the Hengduan Mountains region is expected to increase universally, posing a more severe soil erosion risk. Under the combined influence of erosion intensity and frequency, the western edge of the Hengduan Mountains region experiences the most significant increase in rainfall erosivity, while in the Yunnan region, there is a slight decrease in rainfall erosivity due to reduced rainfall intensity, although the decrease is not substantial. In general, areas with scarce rainfall and low rainfall erosivity show a significant increase in rainfall erosivity, while regions with abundant precipitation and high rainfall erosivity exhibit a smaller increase or even a decrease, leading to a trend of homogenization in rainfall erosivity distribution.

Author Contributions

Conceptualization, X.L. (Xinlan Liang); investigation and data curation, L.Z(Lie Zhang); methodology, X.L. (Xinlan Liang), L.Z.(Lie Zhang) and S.H.(Shuqin He); project administration, K.S.(Ke Song) and Z.Z.(Zicheng Zheng); resources, Z.Z.(Zicheng Zheng); software, validation and visualization, L.Z(Lie Zhang); writing—original draft, L.Z(Lie Zhang); writing—review & editing, X.L.(Xinlan Liang), S.H.(Shuqin He) and Z.Z. (Zicheng Zheng). All authors have read and agreed to the published version of the manuscript.

Funding

This study was funded by the National Key Research and Development Program (2022YFF1302903).

Data Availability Statement

Data are available from the authors upon request.

Conflicts of Interest

The authors declare no conflict of interest.

References

  1. Fenta, A.A.; Yasuda, H; Shimizu, K; Haregeweyn, N; Kawai, T; Sultan, D; Ebabu, K; Belay, A S. Spatial distribution and temporal trends of rainfall and erosivity in the Eastern Africa region. Hydrol Process 2017, 31, 4555–4567. [CrossRef]
  2. Jia, L.; Yu, K.; Li, Z.; Li, P.; Zhang, J.; Wang, A.; Ma, Ling; Xu, G.; Zhang, X. Temporal and spatial variation of rainfall erosivity in the Loess Plateau of China and its impact on sediment load. CATENA 2022, 210, 105931. [Google Scholar] [CrossRef]
  3. Tsitsagi, M.; Berdzenishvili, A.; Gugeshashvili, M. Spatial and temporal variations of rainfall-runoff erosivity (R) factor in Kakheti, Georgia. Annals of Agrarian Science 2018, 16, 226–235. [Google Scholar] [CrossRef]
  4. Wischmeier, W.H.; Smith, D.D. Rainfall energy and its relationship to soil loss. Eos:Transactions American Geo-physical Union 1958, 39, 285–291. [Google Scholar] [CrossRef]
  5. Xu, X.; Yan, Y.; Dai, Q.; Yi, X.; Hu, Z.; Cen, L. Spatial and temporal dynamics of rainfall erosivity in the karst region of southwest China: Interannual and seasonal changes. CATENA 2023, 1, 106763. [Google Scholar] [CrossRef]
  6. Shin, J.; Kim, T.; Heo, J.; Lee, J. Spatial and temporal variations in rainfall erosivity and erosivity density in South Korea. CATENA 2019, 176, 125–144. [Google Scholar] [CrossRef]
  7. Mondal, A.; Khare, D.; Kundu, S. Change in rainfall erosivity in the past and future due to climate change in the central part of India. Int. Soil Water Conserv. Res. 2016, 4, 186–194. [Google Scholar] [CrossRef]
  8. Amanambu, A.C.; Li, L.; Egbinola, C.N.; Obarein, O.A.; Christophe, M.; Chen, D. Spatio-temporal variation in rainfall-runoff erosivity due to climate change in the Lower Niger Basin, West Africa. CATENA 2019, 172, 324–334. [Google Scholar] [CrossRef]
  9. Correa, S.W.; Mello, C.R.; Chou, S.C.; Curi, N.; Norton, L.D. Soil erosion risk associated with climate change at Mantaro River basin, Peruvian Andes. CATENA 2016, 147, 110–124. [Google Scholar] [CrossRef]
  10. Grillakis, M.G.; Polykretis, C.; Alexakis, D.D. Past and projected climate change impacts on rainfall erosivity: Ad-vancing our knowledge for the eastern Mediterranean island of Crete. CATENA 2020, 193, 104625. [Google Scholar] [CrossRef]
  11. Riquetti, N.B.; Mello, C.R.; Beskow, S.; Viola, M.R. Rainfall erosivity in South America: Current patterns and future perspectives. Sci. Total Environ. 2020, 724, 138315. [Google Scholar] [CrossRef]
  12. Panagos, P.; Borrelli, P. Global rainfall erosivity assessment based on high-temporal resolution rainfall records. Sci Rep 2017, 7, 4175. [Google Scholar] [CrossRef]
  13. Bezak, N.; Ballabio, C.; Mikoš, M.; Petan, S.; Borrelli, P.; Panagos, P. Reconstruction of past rainfall erosivity and trend detection based on the REDES database and rea-nalysis rainfall. J. Hydrol. 2020, 590, 125372. [Google Scholar] [CrossRef]
  14. Bezak, N.; Borrelli, P.; Panagos, P. Exploring the possible role of satellite-based rainfall data in estimating inter- and intra-annual global rainfall erosivity. Hydrol. Earth Syst. Sci. 2022, 26, 1907–1924. [Google Scholar] [CrossRef]
  15. Panagos, P.; Borrelli, P.; Matthews, F.; Liakos, L.; Bezak, N. Global rainfall erosivity projections for 2050 and 2070. J. Hydrol. 2022, 610, 127865. [Google Scholar] [CrossRef]
  16. Angulo-Martínez, M.; Beguería, S. Estimating rainfall erosivity from daily precipitation records: A comparison among methods using data from the Ebro Basin (NE Spain). J. Hydrol. 2009, 379, 111–121. [Google Scholar] [CrossRef]
  17. Richardson, C.W.; Foster, G.R.; Wright, D.A. Estimation of Erosion Index from Daily Rainfall Amount. Trans. ASABE 1983, 26, 0153–0156. [Google Scholar] [CrossRef]
  18. Zhang, W.B.; Fu, J.S. RAINFALL EROSIVITY ESTIMATION UNDER DIFFERENT RAINFALL AMOUNT. Re-sources Science 2003, 35–41. [Google Scholar] [CrossRef]
  19. Yu, B. and C. Rosewell, An assessment of a daily rainfall erosivity model for New South Wales. Aust. J. Soil Res. 1996, 34, 139–152. [Google Scholar] [CrossRef]
  20. Hoyos, N.; P.R. Waylen; J. Álvaro. Seasonal and spatial patterns of erosivity in a tropical watershed of the Co-lombian Andes. J. Hydrol. 2005, 314, 177–191. [CrossRef]
  21. Renard, K.G.; J.R. Freimund. Using monthly precipitation data to estimate the R-factor in the revised USLE. J. Hydrol. 1994, 157, 287–306. [CrossRef]
  22. Suye, W. Simplified algorithm and spatiotemporal distribution pattern of rainfall erosivity in the Dabie Mountains of Anhui Province. Soil and Water Conservation in China 1994, 12–13. [Google Scholar] [CrossRef]
  23. Zhou, F.J.; Y.H. Huang. R value of rainfall erosivity index in Fujian Province. Journal of Soil and Water Conservation 1995, 9, 13–18.
  24. Shi, D.M.; X.P. Lu; G.Y. Jiang. Simulation on simple algorithm of rainfall erosivity in purple hilly area. Transactions of the Chinese Society of Agricultural Engineering 2010, 26, 116–122. [CrossRef]
  25. Teng, H. Assimilating multi-source data to model and map potential soil loss in China. Doctor, Zhejiang University, Zhejiang China, 2017.
  26. Wang, Y.; Dai, E.; Ge, Q.; Zhang, X.; Yu, C. Spatial heterogeneity of ecosystem services and their trade-offs in the Hengduan Mountain region, Southwest China. CATENA 2021, 207, 105632. [Google Scholar] [CrossRef]
  27. Yu, H.; Miao, S.; Xie, G.; Guo, X.; Favre, A. Contrasting Floristic Diversity of the Hengduan Mountains, the Himalayas and the Qinghai-Tibet Plateau Sensu Stricto in China. Front. Ecol. Evol. 2020, 8, 136. [Google Scholar] [CrossRef]
  28. F Fan, J.; Liu, F.; Gong, K.; Guo, F. Spatial characteristics of soil erosion in Hengduan Mountain region, eastern Tibet based on GIS. Journal of Arid Land Resources and Environment 2012, 26, 144–149. [Google Scholar] [CrossRef]
  29. TENG, H.; HU, J.; ZHOU, Y.; ZHOU, L.; SHI, Z. Modelling and mapping soil erosion potential in China. J. Integr. Agric. 2019, 18, 251–264. [Google Scholar] [CrossRef]
  30. Wu, W.; Zhang, Q.; Singh, V.; Wang, G.; Zhao, J.; Shen, Z.; Sun, S. A Data-Driven Model on Google Earth Engine for Landslide Susceptibility Assessment in the Hengduan Mountains, the Qinghai&ndash Tibetan Plateau. Remote Sens. 2022, 14, 4662. [Google Scholar] [CrossRef]
  31. Li, B.Y. Exploration of the Range of the Hengduan Mountains. Mountain Research 1987, 5, 74–82. [Google Scholar]
  32. Zhang, T.; Li, B.L.; He, Y.Q.; Du, J.K.; Niu, H.W.; Xin, H.J. Spatial and Temporal Distribution of Precipitation Based on Corrected TRMM Data in Hengduan Mountains. Journal of Natural Resources 2015, 30, 260–270. [Google Scholar] [CrossRef]
  33. Zhu, Y.; Yang, S. Evaluation of CMIP6 for historical temperature and precipitation over the Tibetan Plateau and its comparison with CMIP5. Adv. Clim. Chang. Res. 2020, 11, 239–251. [Google Scholar] [CrossRef]
  34. Zhang, W.B.; Y. Xie; B.Y. Liu. Rainfall Erosivity Estimation Using Daily Rainfall Amounts. Scientia Geographica Sinica 2002, 22, 705–711. [CrossRef]
  35. Kinnell, P.I.A. Event soil loss, runoff and the Universal Soil Loss Equation family of models: A review. J. Hydrol. 2010, 385, 384–397. [Google Scholar] [CrossRef]
  36. Panagos, P.; Ballabio, C.; Borrelli, P.; Meusburger, K. Spatio-temporal analysis of rainfall erosivity and erosivity density in Greece. CATENA 2016, 137, 161–172. [Google Scholar] [CrossRef]
  37. Li, X.; Hu, Q.; Zhang, Q.; Wang, R. Response of rainfall erosivity to changes in extreme precipitation in the Poyang Lake basin, China. J. Soil Water Conserv. 2020, 75, 537–548. [Google Scholar] [CrossRef]
  38. Wang, X.; Li, T.; Ikhumhen, H.O.; M. Sá, R. Spatio-temporal variability and persistence of PM2.5 concentrations in China using trend analysis methods and Hurst exponent. Atmos. Pollut. Res. 2022, 13, 101274. [CrossRef]
  39. Wang, W.; Yin S.; Gao G.; Papalexiou S.M.; Z., Wang. Increasing trends in rainfall erosivity in the Yellow River basin from 1971 to 2020. J. Hydrol. 2022, 610, 127851. [CrossRef]
  40. Dash, C.J.; N.K. Das; P.P. Adhikary. Rainfall erosivity and erosivity density in Eastern Ghats Highland of east India. Nat. Hazards 2019, 97, 727–746. [CrossRef]
  41. Li, X.; X. Ye.Variability of Rainfall Erosivity and Erosivity Density in the Ganjiang River Catchment, China: Characteristics and Influences of Climate Change. Atmosphere 2018, 9, 48. [CrossRef]
  42. Zhi-xian, S. The Causes of 98 Catastrophic Flood of the Yangtze River and Corresponding Countermeasure. JOURNAL OF SICHUAN TEACHERS COLLEGE NATURAL SCIENCE EDITION 2000, 21, 69–80. [Google Scholar] [CrossRef]
  43. Pan, J.H. and X.Q. Liu. Analysis of the unusual high temperature & drought during midsummer in Sichuan in 2006. JOURNAL OF SICHUAN METEOROLOGY 2006, 1003-7187, 12–14. [CrossRef]
  44. Lusi, W.; Linlin, C.; Xiaohan, Z.; Zhaowu, Z. Comparison Analysis of Three Torrential Rain Events in Summer, 2013 in Sichuan Basin. Plateau and Mountain Meteorology Research 2015, 35, 86–91. [Google Scholar] [CrossRef]
  45. Qiu, H.; Xiong, Y.; Xing, W.H.; Wang, L. Study on characteristics and causes of rainstorm in Yangtze River Basin during major flood season in 2020. Yangtze River 2020, 51, 104–110. [Google Scholar] [CrossRef]
  46. L., J.L.; M., S.E.; Olivia, M.; Andreas, K.;Wolfgang, S; Shengping, W.; Peter, S. An update of the spatial and temporal variability of rainfall erosivity (R-factor) for the main agricultural production zones of Austria. CATENA 2022, 215, 106305. [CrossRef]
  47. Ji, H.; YuRong, W.; HaiTao, C.; SongLin, W. Effects of Land Use Change on Rainfall Erosion in Luojiang River Basin, China. Sustainability 2022, 14, 8441. [Google Scholar] [CrossRef]
  48. Das, S.; M.K. Jain; V. Gupta. A step towards mapping rainfall erosivity for India using high-resolution GPM satellite rainfall products. CATENA 2022, 212, 106067. [CrossRef]
  49. Sun, X.; Zhang, G.; Wang, J.; Li, C.; Wu, S. Spatiotemporal variation of flash floods in the Hengduan Mountains region affected by rainfall properties and land use. Nat. Hazards 2022, 111, 465–488. [Google Scholar] [CrossRef]
  50. Li, Z.; He, Y.; Xin, H.; Wang, C. Spatio-temporal Variations of Temperature and Precipitation in Mts. Hengduan Region during 1960-2008. Acta Geographica Sinica 2010, 65, 563–579. [Google Scholar] [CrossRef]
  51. Fei, X.; Yangwen, J.; Cunwen, N.; Jiajia, L.; Wenhai, Z. Variation Character of Annual, Seasonal and Monthly Temperature and Precipitation. Mountain Research 2018, 36, 171–183. [Google Scholar]
  52. Zhou, C.; X. Jiang; Y. Li. Features of Climate Change of Water Vapor Resource over Eastern Region of the Tibetan Plateau and Its Surroundings. Plateau Meteorology 2009, 28, 55–63.
  53. Yujing, L.; Runping, S.; Chunxiang, S.; Yajie, X.; Shuai, S. Rainfall erosivity in China based on CLDAS fusion precipitation. Arid Land Geography 2022, 45, 1333–1346. [Google Scholar] [CrossRef]
  54. Kaiheng, H.; Wei, L.; Shuang, L.; Xiuzhen, L. Spatial pattern of debris flow catchments and the rainfall amount of triggering debris flows in the Hengduan Mountains region. Acta Geographica Sinica 2019, 74, 2303–2313. [Google Scholar] [CrossRef]
  55. Teng, H.; Liang, Z.; Chen, S.; Liu, Y. Current and future assessments of soil erosion by water on the Tibetan Plateau based on RUSLE and CMIP5 climate models. Sci. Total Environ. 2018, 635, 673–686. [Google Scholar] [CrossRef]
  56. Chuenchum, P.; M. Xu; W. Tang.Predicted trends of soil erosion and sediment yield from future land use and climate change scenarios in the Lancang–Mekong River by using the modified RUSLE model. Int. Soil Water Conserv. Res. 2020, 8, 213–227. [CrossRef]
  57. Lun, Y.; Liu, L.; Cheng, L.; Li, X.; Li, H.; Xu, Z. Assessment of GCMs simulation performance for precipitation and temperature from CMIP5 to CMIP6 over the Tibetan Plateau. Int. J. Climatol. 2021, 41, 3994–4018. [Google Scholar] [CrossRef]
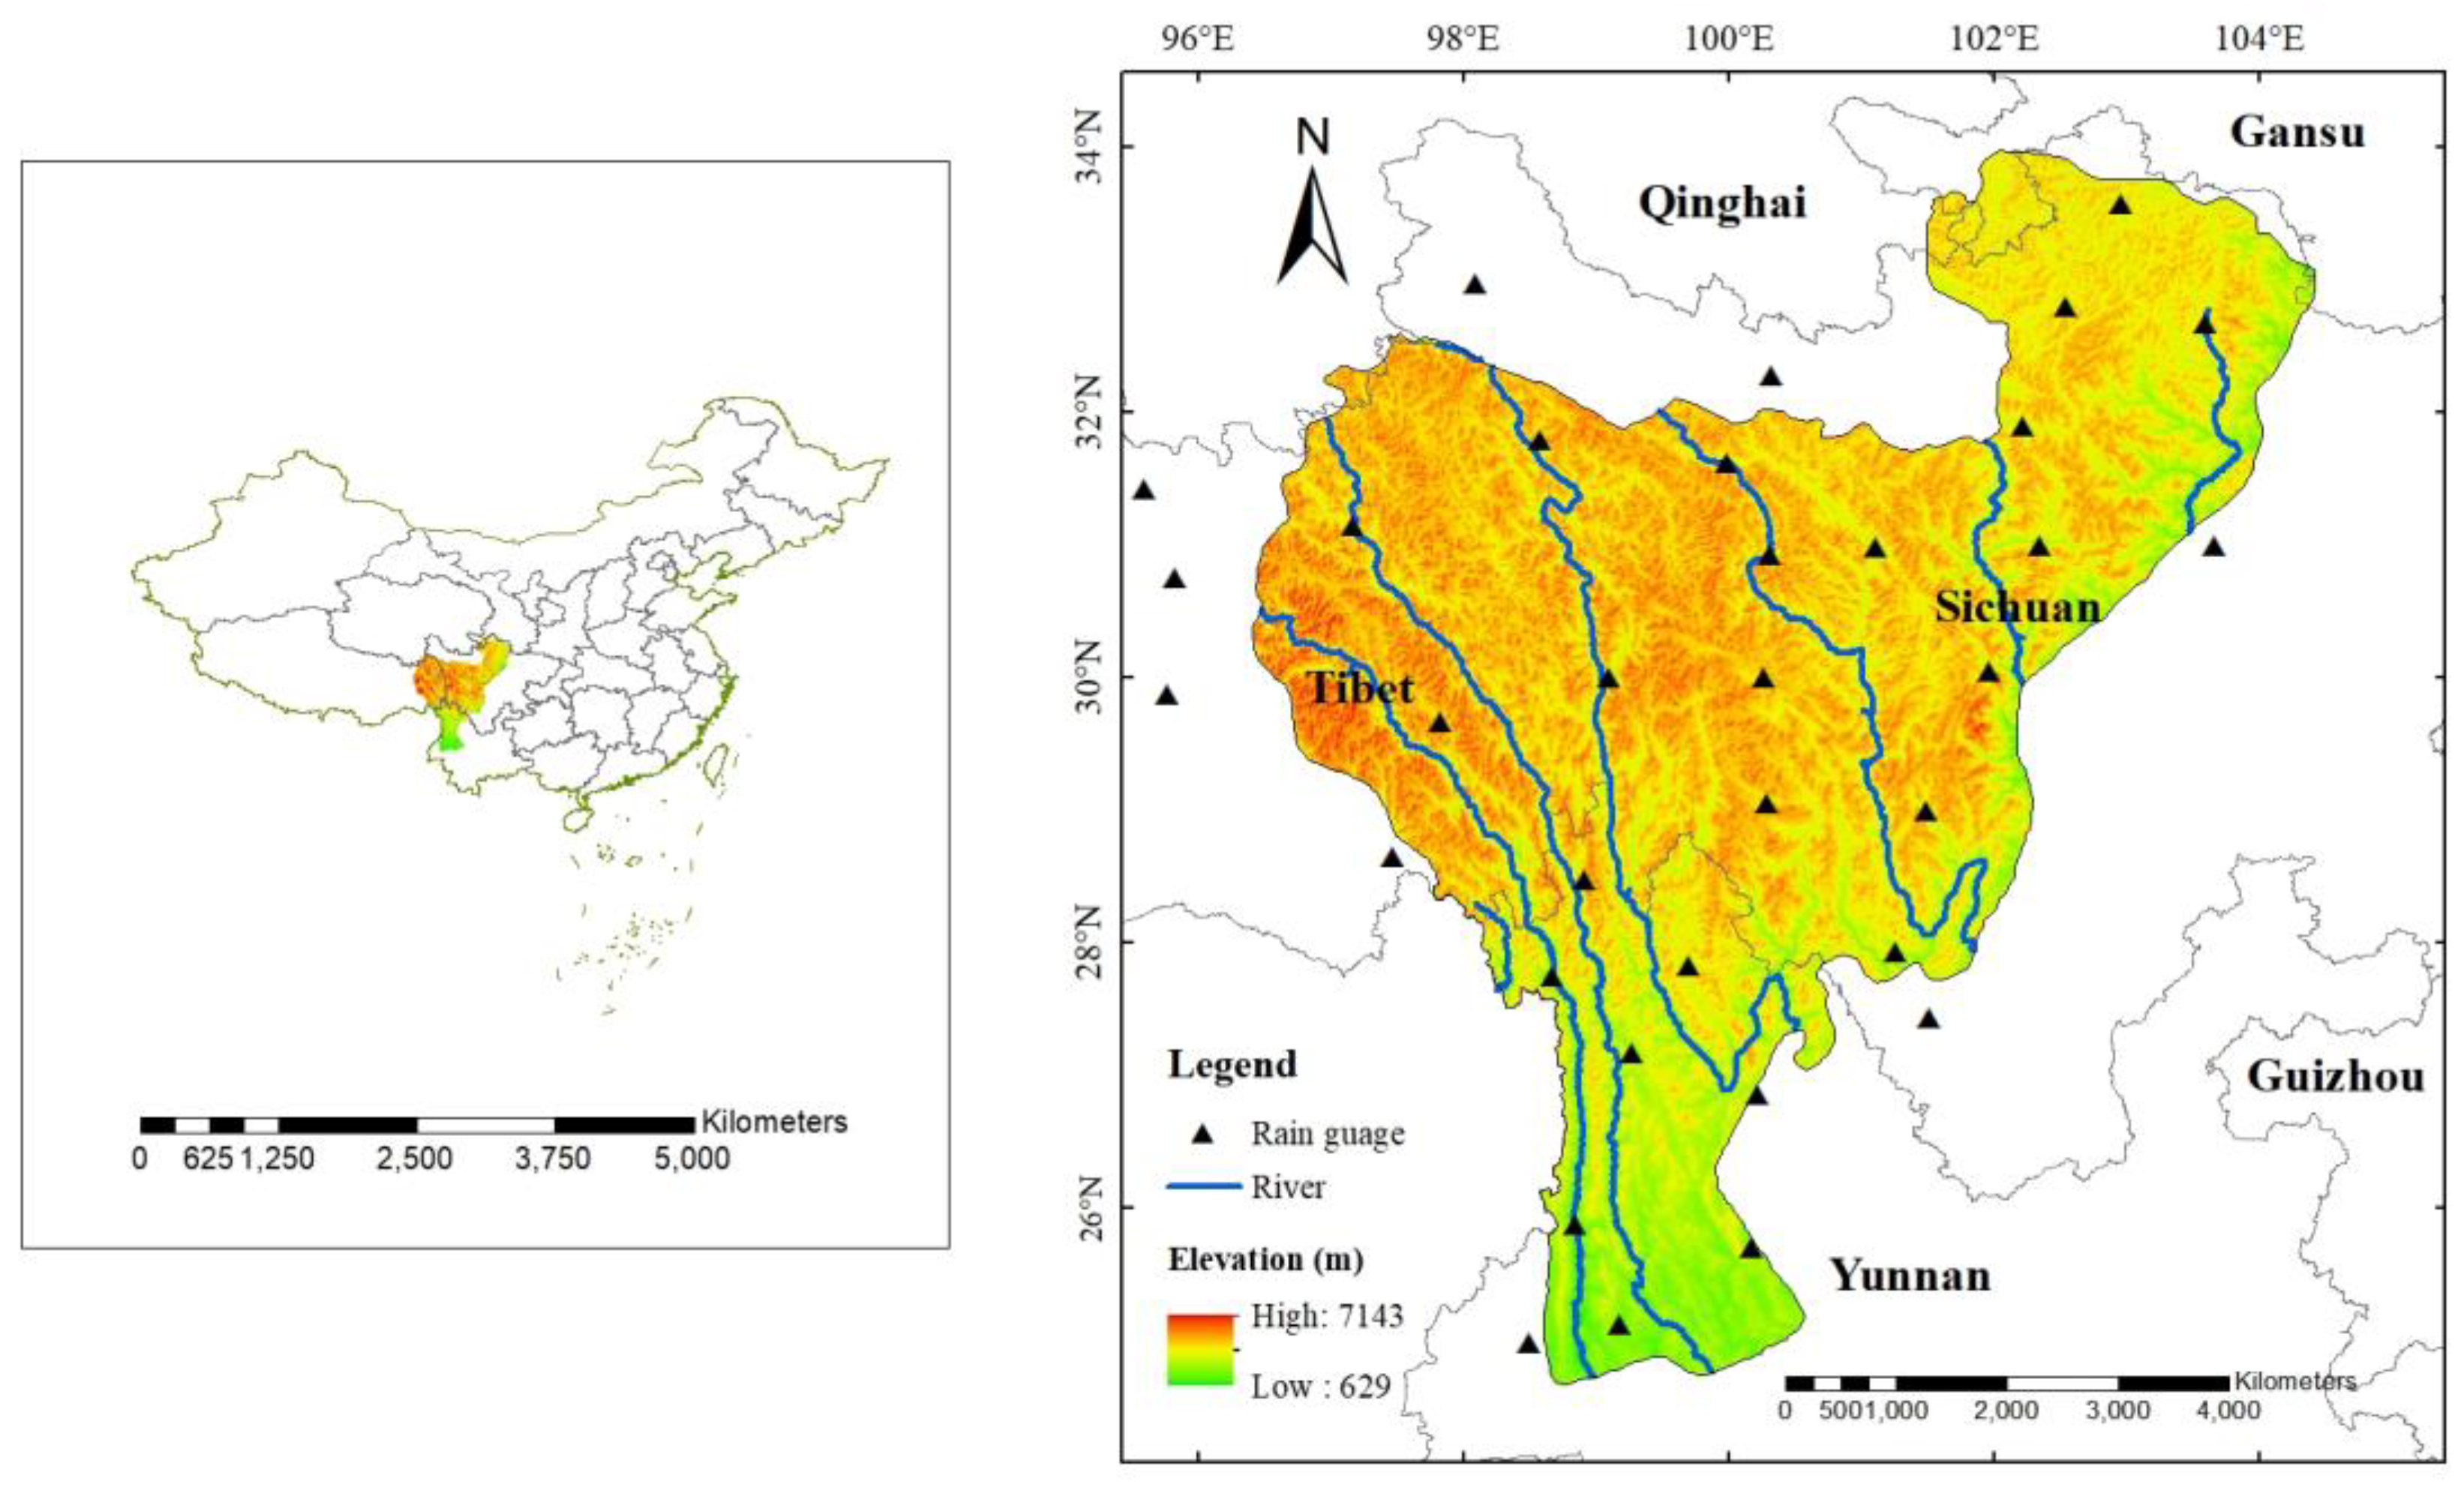
Figure 1. Location of study area.
Preprints 75390 g001
Figure 2. The annual distribution of rainfall amount and rainfall erosivity in the Hengduan Mountains region.
Preprints 75390 g002
Figure 3. Seasonal variation in precipitation and rainfall erosivity.
Preprints 75390 g003
Figure 4. Seasonal variation in rainfall erosivity density.
Preprints 75390 g004
Figure 5. Interannual Trend of (a) Rainfall Amount(b) Rainfall Erosivity (c)Rainfall Erosion Erosivity Density.
Preprints 75390 g005
Figure 6. Liner relationship between annual rainfall erosivity and rainfall amount.
Preprints 75390 g006
Figure 7. The spatial distribution of rainfall amount, rainfall erosivity and rainfall erosivity density.
Preprints 75390 g007
Figure 8. Annual spatial distribution of rainfall amount, rainfall erosivity and rainfall erosivity density.
Preprints 75390 g008
Figure 9. Trend distribution of precipitation, rainfall erosivity and rainfall erosivity density.
Preprints 75390 g009
Figure 10. Significance distribution of precipitation, rainfall erosivity and rainfall erosivity density.
Preprints 75390 g010
Figure 11. Rainfall erosivity statistics by site.
Preprints 75390 g011
Figure 12. The variation of rainfall erosivity and rainfall erosivity density.
Preprints 75390 g012
Table 2. Seasonal variations in rainfall erosivity and rainfall erosivity.
Season Type MIN MAX MEAN Cv
Spring Rainfall 100.76 206.45 152.08 0.17
Rainfall Erosivity 67.15 903.7 270.96 0.70
Rainfall Erosivity Density 0.65 5.08 1.66 0.56
Summer Rainfall 295.97 667.02 405.40 0.19
Rainfall Erosivity 437.79 3600.28 1045.67 0.52
Rainfall Erosivity Density 1.38 6.42 2.46 0.35
Autumn Rainfall 106.87 311.18 170.84 0.24
Rainfall Erosivity 82.51 1368.38 326.46 0.76
Rainfall Erosivity Density 0.77 4.41 1.74 0.48
Winter Rainfall 9.64 56.82 26.78 0.55
Rainfall Erosivity 1.12 116.23 39.53 1.11
Rainfall Erosivity Density 0.07 2.27 1.02 0.90
Table 3. Annual variations in precipitation, rainfall erosivity and rainfall erosivity density.
Type MIN MAX MEAN Cv
Precipitation 545.73 1218.18 758.41 0.19
Rainfall Erosivity 644.1 4850.11 1699.93 0.56
Rainfall Erosivity Density 1.09 4.43 2.09 0.36
Table 4. Trend grade.
Type S Z Trend Area percentage
precipitation >1 >|1.96| Significantly increase 0.18
>1 -1.96~1.96 Slightly increase 29.50
-1~1 -1.96~1.96 Stable 26.65
<-1 >|1.96| Significantly decrease 16.52
<-1 -1.96~1.96 Slightly decrease 27.15
Rainfall erosivity >5 >|1.96| Significantly increase 7.69
>5 -1.96~1.96 Slightly increase 24.99
-5~5 -1.96~1.96 Stable 44.31
<-5 -1.96~1.96 Slightly decrease 23.01
Rainfall erosivity density >0.005 >|1.96| Significantly increase 3.41
>0.005 -1.96~1.96 Slightly increase 43.28
-0.005~0.005 -1.96~1.96 Stable 41.60
<-0.005 -1.96~1.96 Slightly decrease 11.7
Table 5. Rainfall erosivity index.
Rain guage Reference period (2005-2010) Forecast period (2025-2040)
EEP EED LCED TEP EEP EED LCED TEP
Shiqu 25.8 1 3 179.9 21.4 1 6 276.5
Dingqing 30.3 1 4 245.1 23.7 1 7 290.3
Luolong 27.2 1 2 129.0 26.7 1 8 384.0
Bomi 37.5 1 6 397.9 34.4 3 11 882.6
Chayu 39.9 1 4 362.4 42.3 3 14 1335.8
Gongshan 50.5 2 7 1065.6 39.3 3 13 957.8
Nujiang 50.2 1 4 577.2 37.0 3 16 834.4
Tengchong 49.4 2 5 1001.0 35.8 3 16 797.5
Baoshan 53.3 1 5 589.4 34.8 2 11 697.1
Yanyuan 41.5 1 3 467.0 34.2 2 11 661.0
Jiulong 30.8 1 4 481.3 31.5 2 11 702.2
Kangding 32.5 1 4 422.9 33.5 2 8 795.7
Dujiangyan 90.8 1 6 790.3 41.9 2 8 707.7
Songpan 29.5 1 4 307.4 37.0 2 8 651.1
Ruoergai 33.2 1 3 308.5 30.1 2 6 538.1
Hongyuan 29.3 1 3 342.1 30.7 2 7 623.1
Seda 27.6 1 4 289.3 24.0 1 7 405.3
Dege 28.9 1 4 278.9 23.1 1 7 369.0
Ganzi 26.1 1 3 282.5 24.5 2 9 467.9
Changdu 34.4 1 3 164.0 24.8 1 8 309.7
Xinlong 29.1 1 5 266.4 26.3 2 9 568.9
Daofu 30.7 1 9 288.1 28.2 2 7 670.8
Zuogong 27.7 1 3 178.4 29.8 1 7 453.7
Batang 30.4 1 4 178.3 26.2 1 10 378.7
Litang 32.9 1 4 344.0 27.1 2 9 604.2
Daocheng 31.7 1 5 309.1 28.5 2 11 630.8
Deqin 37.5 1 5 281.2 32.0 2 11 747.1
Shangri-La 37.1 1 3 287.5 31.3 2 11 693.1
Muli 42.3 1 4 474.0 33.8 2 13 697.6
Weixi 40.0 1 5 517.0 34.7 3 13 756.3
Maerkang 32.1 1 5 408.8 31.1 2 7 736.7
Xiaojin 29.3 1 4 249.4 35.9 3 12 1589.3
Dali 57.2 1 4 708.5 33.0 2 10 1076.7
Lijiang 50.0 1 4 580.1 31.5 2 10 1156.7
Disclaimer/Publisher’s Note: The statements, opinions and data contained in all publications are solely those of the individual author(s) and contributor(s) and not of MDPI and/or the editor(s). MDPI and/or the editor(s) disclaim responsibility for any injury to people or property resulting from any ideas, methods, instructions or products referred to in the content.
Copyright: This open access article is published under a Creative Commons CC BY 4.0 license, which permit the free download, distribution, and reuse, provided that the author and preprint are cited in any reuse.
Prerpints.org logo

Preprints.org is a free preprint server supported by MDPI in Basel, Switzerland.

Subscribe

© 2024 MDPI (Basel, Switzerland) unless otherwise stated