Preprint
Article

Booting Heat Stress Alters Leaf Photosynthesis, Growth Rate, Phenology and Yield in Rice

Altmetrics

Downloads

155

Views

65

Comments

0

A peer-reviewed article of this preprint also exists.

Submitted:

05 June 2023

Posted:

06 June 2023

You are already at the latest version

Alerts
Abstract
Global warming causes an alarming increase in temperature which negatively affects growth, physiology, and yield of rice. To gain some insights into the impacts of booting HT (at 42°C, 3 h for 7 days), we investigated its effect in three rice genotypes, namely, N22, KDML105 and IR64. Booting HT caused an extended phenology and lower photosynthesis and plant growth rate but an increase in chalkiness. Although, prolonged phenology from dough to physiological maturity led to longer duration of grain filling, the negative effects of its was significantly lower yield components, yield and harvest index in all rice. Among cultivars, N22 presented adapted ability to maintain leaf gas exchange and compensated vegetative part by an increase in tiller numbers resulting in less affected growth rate. It prolonged phenology that caused extended grain filling. Consequence, N22 was the lowest reduction in number of seed panicle–1, number of filled seeds hill–1, yield, HI as well as the lowest percentage chalkiness. KDML105 adapted to booting HT by maintaining leaf gas exchange, increasing specific leaf area and prolonging phenology. The longest extended phenology together with the maintenance of high photosynthesis during dough grain were associated with moderate yield reduction and chalkiness. However, IR64 showed dramatic reductions in photosynthesis, growth rate, and yield but highest percentage grain chalkiness. Therefore, in response to booting HT, N22, KDML105 and IR64 could be indicated as being heat tolerant, moderately heat sensitive, and heat sensitive, respectively. This can be applied for crop modelling and rice heat tolerance in breeding program.
Keywords: 
Subject: Biology and Life Sciences  -   Plant Sciences

1. Introduction

Global warming leads to an increase in frequency and severity of high temperature incidence. The global surface temperatures are above the critical temperature threshold namely heat stress, can severely affect crop growth and development, alter physiological processes and dramatically reduce agricultural crop productivity throughout the world especially in the rice-growing regions. In consequence, crops yield including rice yield are reduced [1]. According to [2], during rice-growing season, every 1°C increase in average temperature led to 6.2% yield reduction. Rice is a cereal crop and the staple food for people around the world. It can grow well in mostly tropical Asian countries. In Thailand, rice is usually cultivated in wet and dry (off-season) seasons. During the off-season in Thailand, rice is cultivated during January to April [3] and nowadays, growing rice off-season is becoming more popular in Thailand. Surprisingly, the rice productivity in off-season was reported to be higher (631 kg/rai) than on-season rice (440 kg/rai) [4]. In the Northeast of Thailand, rice production in the off-season is conducted from January to May during which time the weather is dry and the temperature may exceed 40°C from the end of March to early April. Therefore, rice cultivated off-season is normally affected by high temperature stress during the reproductive stage. [5] reported that rice plants at the reproductive stage are more sensitive to heat stress especially, the process of panicle initiation, the development of male and female gametophyte and the reduction of pollen viability, pollination, fertilization, and seed setting. Moreover, the negative effects of heat stress appear in some studies as follows: [6] reported that heat stress inhibited chlorophyll synthesis resulting in a decrease in chlorophyll accumulation leading to decrease photosynthetic mechanism and inhibit growth in pea. [7] suggested that the functions of photosystem II (PSII), the protein complex embedded in the chloroplast thylakoid membrane, is the most heat sensitive because heat stress caused severe PSII damage leading to alter the photochemical reaction in the stroma lamellae and dramatic reductions in the maximum quantum yield of PSII efficiency (Fv/Fm), electron transport rate and ATP synthesis. The study of [8] in 29-rice cultivars at panicle initiation-maturity exposed to heat stress (6–8°C above the ambient temperature) exhibited decreased net photosynthetic rate and chlorophyll contents but there were an increased in stomatal conductance, transpiration rate and specific leaf area (SLA). In addition, 14-Vietnamese rice cultivars exposed to heat stress (at ˃36°C) at grain filling stage showed a sharp decreased in shoot dry weight, CGR and grain yield but an increase in percentage of rice grain chalkiness [9]. According to the study of [10] reported that two-japonica rice cultivars subjected to heat stress at booting and flowering stages exhibited a reduction in dry matter accumulation/day, HI and yield. High night temperature which caused an increase in respiration rate also negatively affected rice yield and quality as demonstrated in rice cultivars N22, Gharib and IR64 exposed to high night temperature at 29°C at 50% flowering [11]. Most studies in physiology, growth and yield of rice under heat stress have been conducted in rice growing in a temperate zone such as in China [12] and Japan [13]. There are a relatively less information on the effects of heat stress during booting stage of rice growing in the tropical monsoon regions. Therefore, this research aimed to elucidate the response of phenology, photosynthetic performance, growth rate and yield of indica rice cultivars under heat stress during the booting stage. The useful information obtained from this research will provide the basic information for the study of a simulation model of rice exposed to heat stress and it may provide an useful knowledge regarding rice heat tolerance for breeding programs.

2. Results

2.1. Rice experimental growing period under various climatic conditions

The influence of booting heat stress on rice phenological development, photosynthesis, growth and yield were conducted during 20th May to 19th November 2021 in the open greenhouse or in the growth chamber during heat stress exposure. Climatic data during the experimental course in the open greenhouse or in the growth chamber are shown in Figure 1. The maximum/minimum temperatures exposure of cvs. N22 (Figure 1A), KDML105 (Figure 1B) and IR64 (Figure 1C) were 37.1/21.2°C, 37.8/22.5°C and 37.4/19.8°C, respectively. The average temperatures in the open greenhouse were 27.2 °C (N22), 27.9 °C (KDML105) and 27.5 °C (IR64). The average RH, PAR and VPDair were recorded at 79.1%, 1345.9 µmol.m–1.s–1 and 0.76 kPa, respectively, for N22 (Figure1D, G and J), 78.4%, 1426.2 µmol.m–1.s–1 and 0.82 kPa, respectively, in KDML105 (Figure 1E, H and K) and 79.5%, 1339.3 µmol.m–1.s–1 and 0.76 kPa, respectively, in IR64 (Figure 1F, I and L). During the 7 days of heat stress treatments, the ranges of temperature, RH, PAR and VPDair in the growth chamber were 26.1–42.4°C, 41–70%, 0–390 µmol.m–1.s–1 and 2.10–2.43 kPa, respectively, as displayed in the area flanked by vertical dash lines in Figure 1. And the climate of booting HT in the growth chamber, the highest temperature, PAR and VPDair for 3 h were 42.4°C, 390 µmol.m–1.s–1 and 2.43 kPa, respectively, but the lowest RH for 3 h was 41%. Therefore, during the period of rice growing in the open greenhouse, the maximum and average temperatures exposed to the three rice cultivars were similar. Minimum temperature, PAR and VPDair of KDML105 were slightly higher but those for IR64 were a bit lower compared to the other. However, the overall climatic conditions in the open greenhouse such as maximum, average, and minimum temperatures, RH, PAR and VDPair during the entire period were non-significantly different among all rice plants and the climates in the growth chamber were also non-significantly different.

2.2. AGDD and GDD of booting heat stress influence rice phenology shift

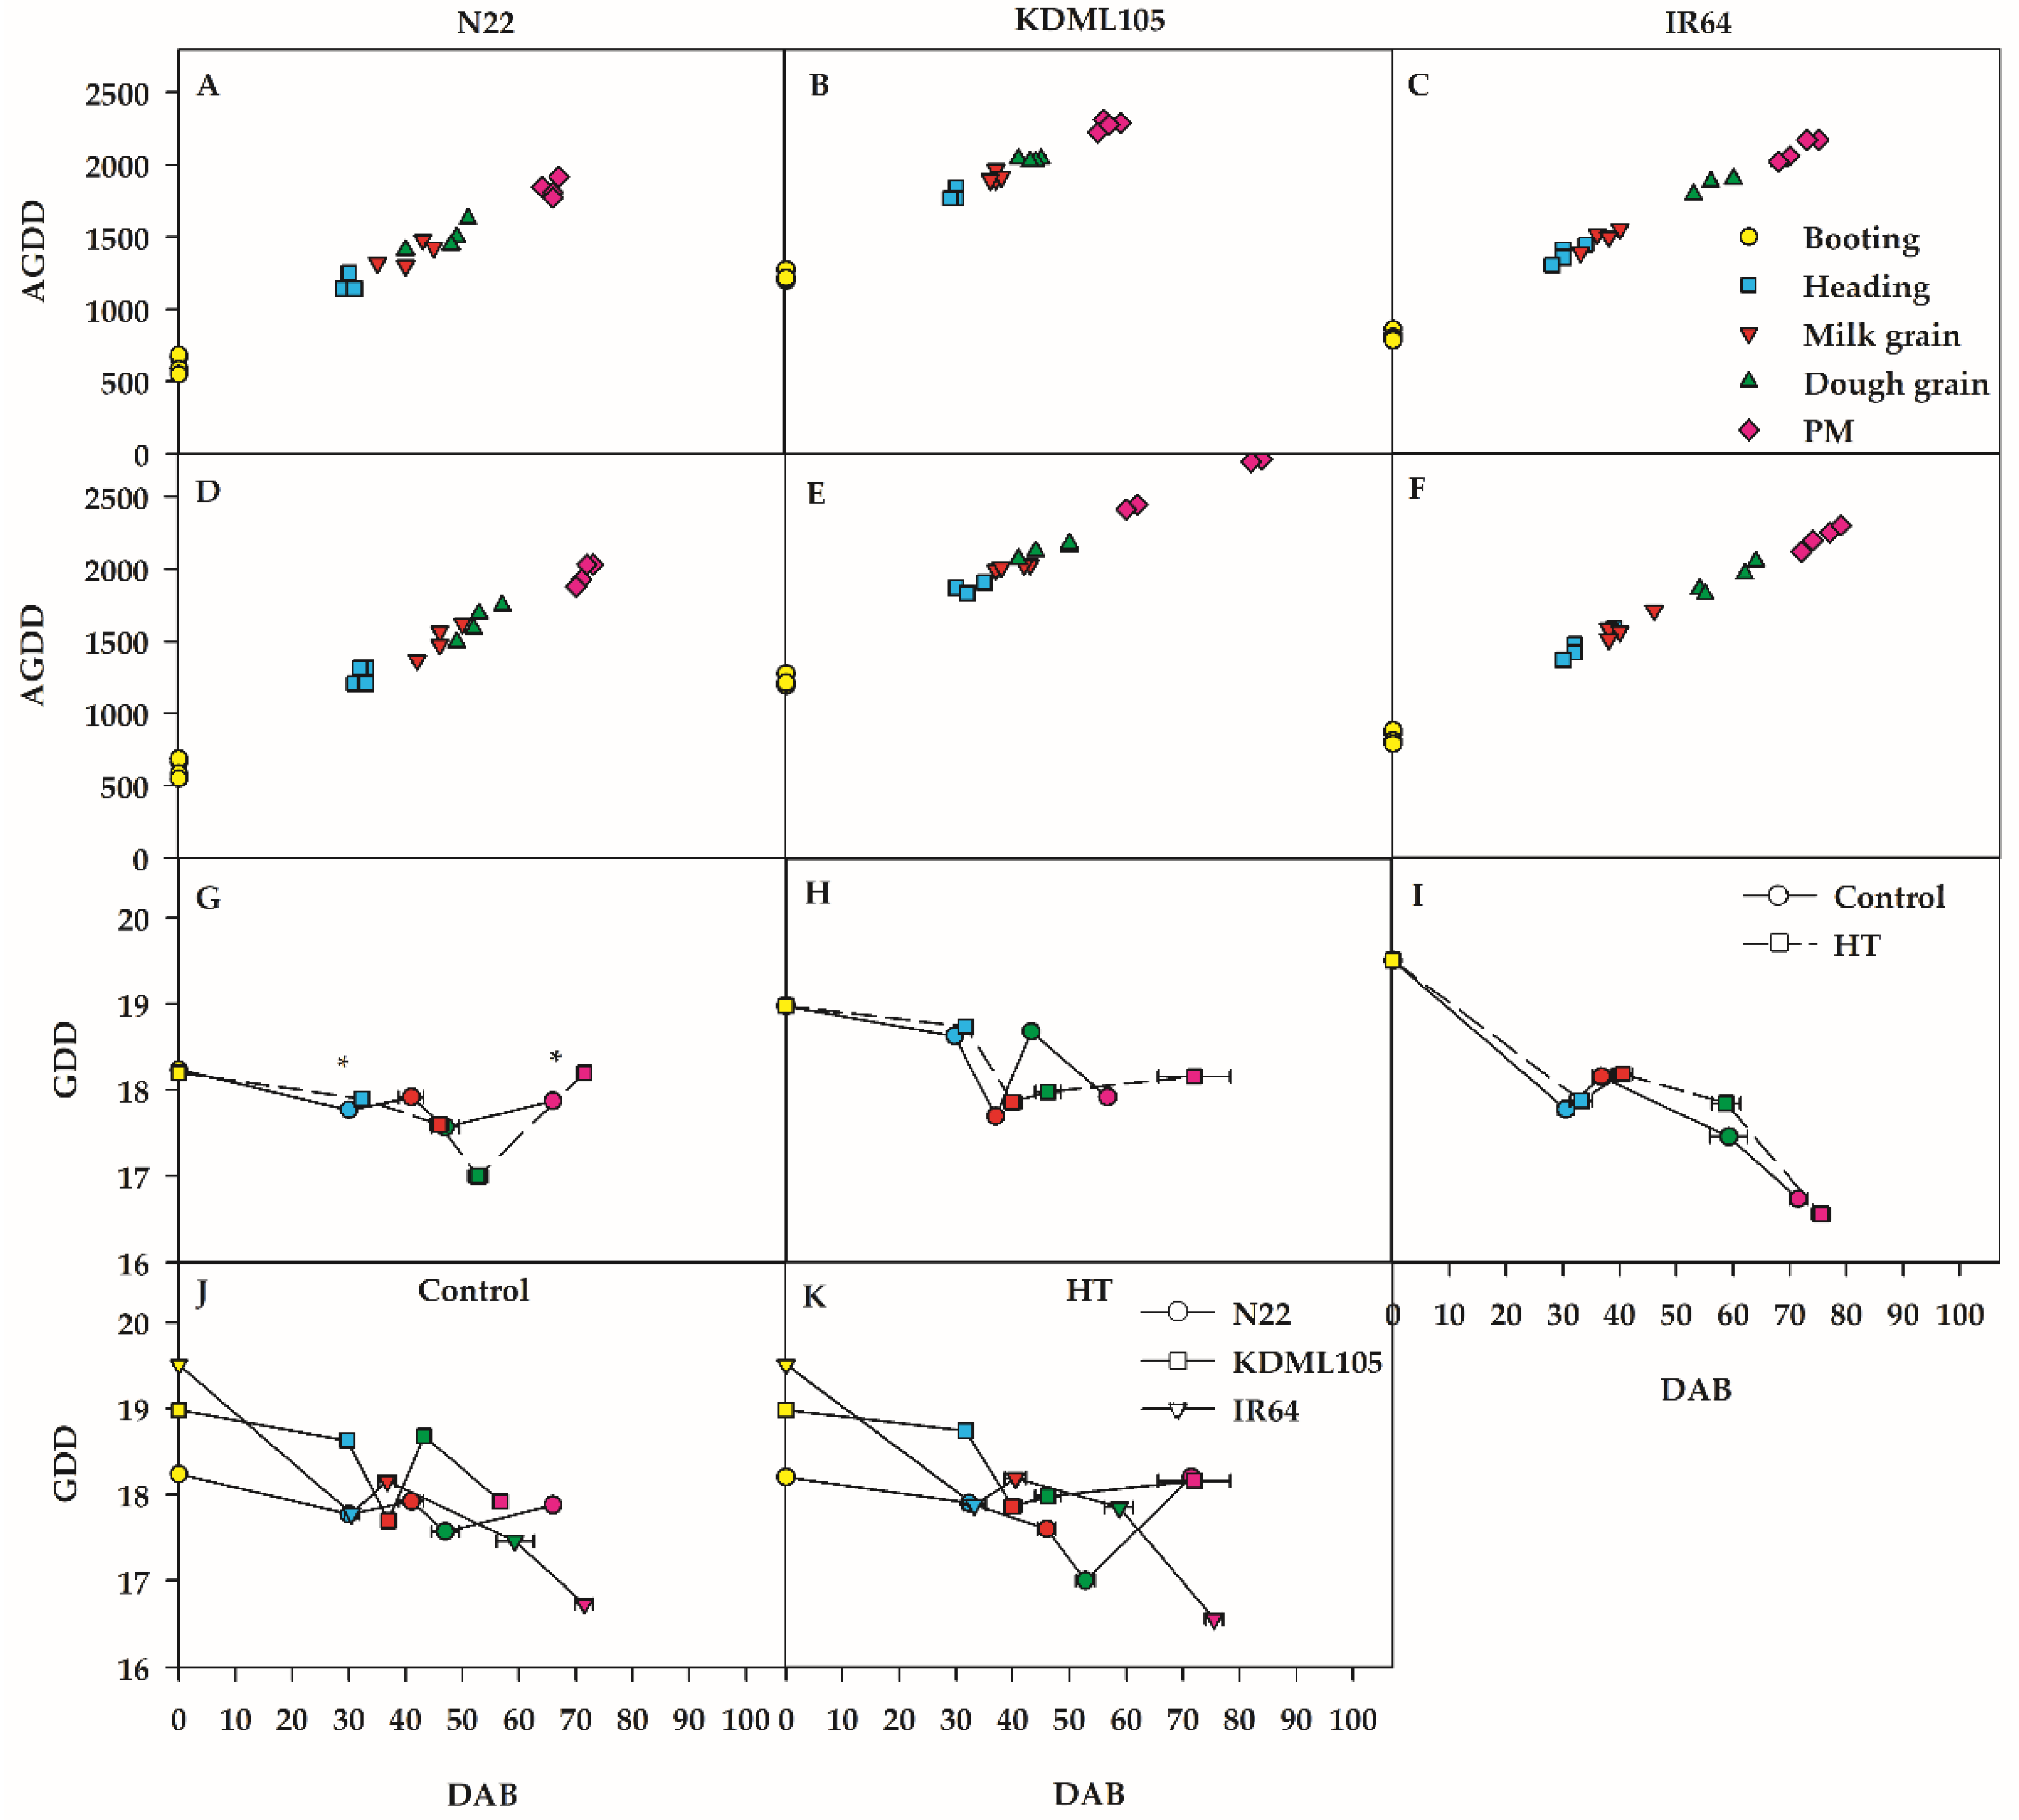
Post-booting development processes for N22, KDML105 and IR64 under heat temperature treatment are shown in Figure 2. Under the open greenhouse temperature (as control), the average accumulated growing degree day (AGDD) values from booting to physiological maturity (PM) were slightly increased approximately 1838.15, 2276.25 and 2106.28°C for N22, KDML105 and IR64, respectively (Figure 2A–C). When rice was exposed to booting heat stress (booting HT) from booting to PM, AGDD) increased greatly to 1969.20, 2593.75 and 2216.83°C for N22, KDML105 and IR64, respectively (Figure 2D–F). It is noted that the phenology of all rice cultivars at different phases were shifted as a result of HT. The developmental durations from booting to PM for the booting HT plants were 71.5, 72 and 75.5 days after booting (DAB) in N22, KDML105 and IR64, respectively, while those of controls were 65.75, 56.8 and 71.5 DAB in N22, KDML105 and IR64, respectively. The extended phenology of the booting HT plants at booting-PM was 5.75, 15.20 and 4.00 days in N22, KDML105 and IR64, respectively, compared to the controls. KDML105 after booting HT showed the highest prolongation phenology in accordance with the highest AGDD of 2593.75°C during booting to PM. In addition, from dough grain to PM, the high AGDD of the plants treated with booting HT resulted in the highest extended rice phenology in N22 (18.75 DAB) and KDML105 (25.80 DAB) (Figure 2D and E). For IR64, the longest extended phenology occurred during milk grain to dough grain stage showing the value of 18.30 DAB (Figure 2D-F). Thus, the greatly increased AGDD as a result of booting HT influenced the extended phenology of all rice cultivars at booting-PM. The booting HT plants of KDML105 showed greater forward phenology shift at booting-PM and at dough grain-PM than other rice cultivars due to its higher AGDD.
For rice treated with booting HT, the average growing degree day (GDD) at booting-PM were 17.79, 18.35 and 18°C in N22, KDML105 and IR64, respectively, while the GDD of the control plants were 17.93, 18.38 and 17.93 °C in N22, KDML105 and IR64, respectively (Figure 2G-I). The trend of GDD at booting-PM under booting HT was similar to control in all rice. The GDD trend of N22 decreased after booting-dough grain, and then increased at dough grain–PM compared to the GDD of booting (18.24°C). The GDD trend of KDML105 and IR64 sharply decreased after booting-PM compared to booting (18.98 and 19.51°C, respectively). The lowest GDD at dough-PM after booting HT was found in IR64 compared to other rice (Figure 2K). The extended phenology of all rice after booting HT exhibited as 5.75, 15.20 and 4.00 days in N22, KDML105 and IR64, respectively at booting-PM compared to those of the controls. KDML105 after booting HT showed the highest prolongation of its phenology due to GDD being approximately 18.35°C at booting-PM. Thus, similar to AGDD, GDD at booting-PM after booting HT resulted in extended all rice phenology (Figure 2G-K). KDML105 after booting HT showed the most forward phenology shift at booting-PM and dough grain-PM than other rice due to its higher GDD.

2.3. Rice photosynthesis as affected by booting heat stress

2.3.1. PSII efficiency

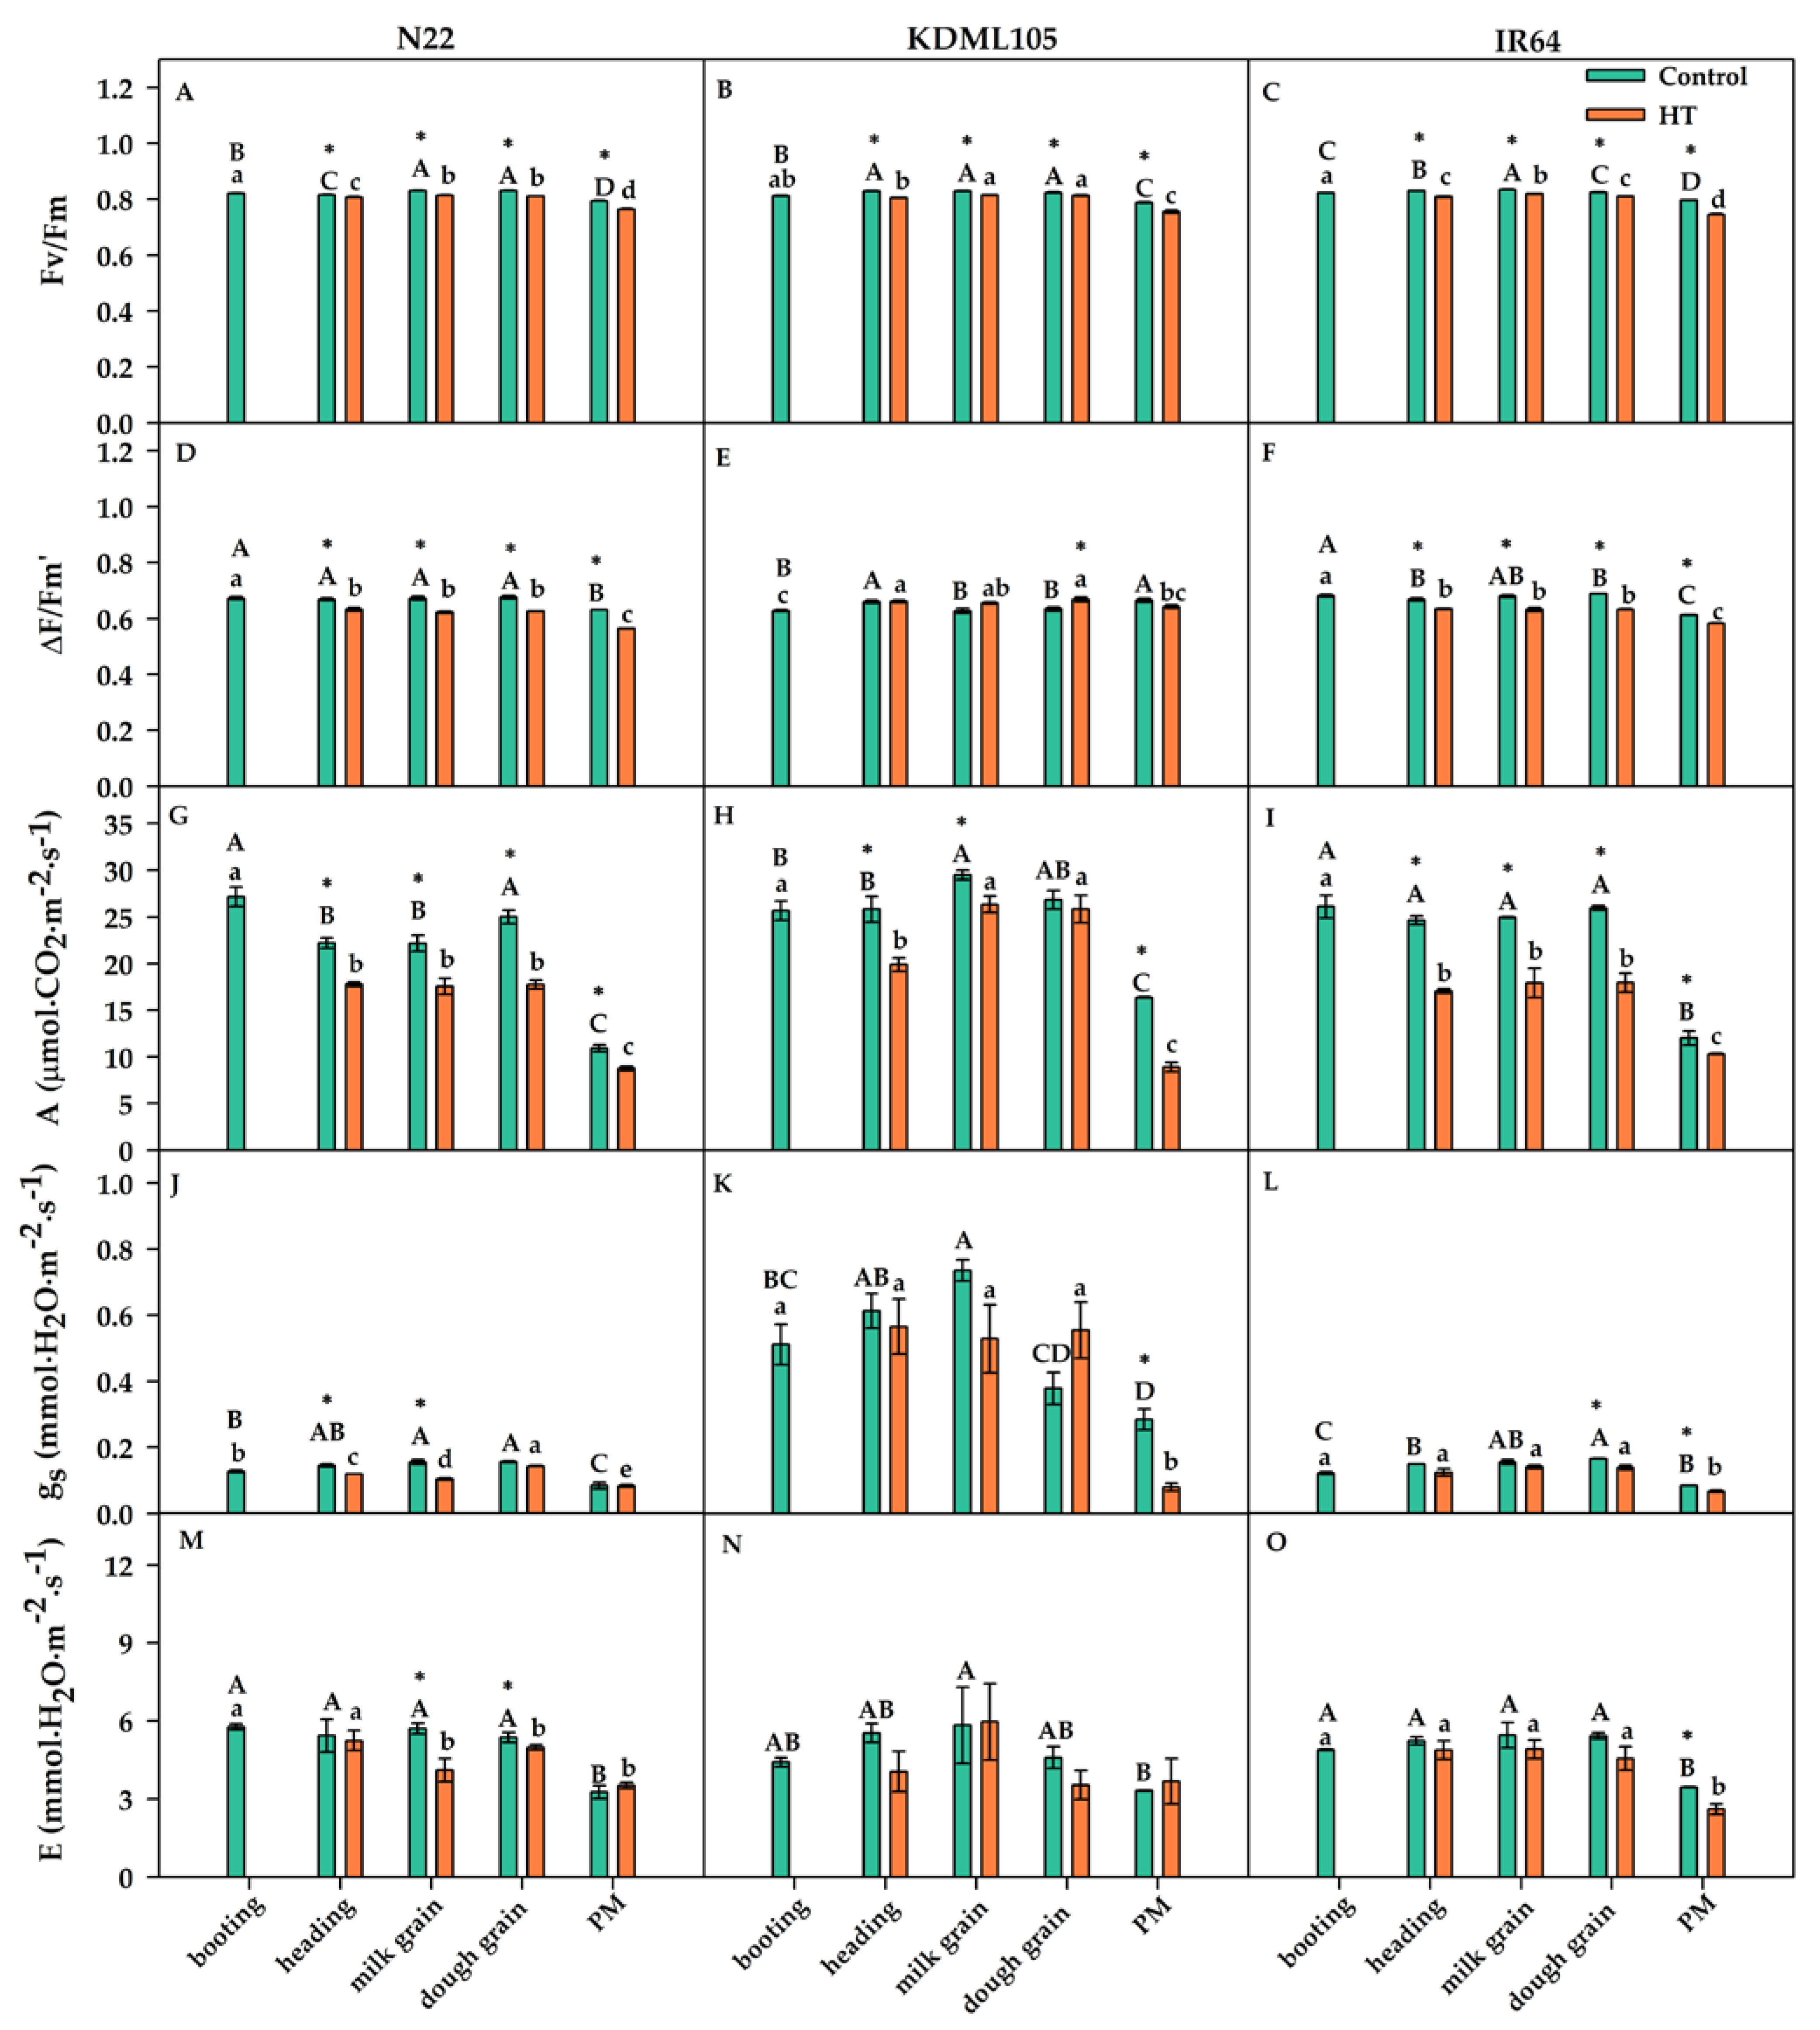
The effect of booting heat stress on PSII efficiency parameters including maximum quantum yield of PSII efficiency (Fv/Fm) and effective quantum yield of PSII efficiency (∆F/Fm’) is shown in Figure 3A-F. At pre-booting HT, Fv/Fm in N22, KDML105 and IR64 were in the range of 0.812–0.823 (Figure 3A-C). The Fv/Fm at latest stages in all rice subjected to booting HT tended to slightly decreased showing the values between 0.746 and 0.819. The Fv/Fm values of N22 and IR64 from heading to PM were significantly lower than the pre-booting HT. In contrast, Fv/Fm of booting HT plants of KDML105 during heading to dough grain remained similar to that at pre-booting HT. However, all rice cultivars subjected to booting HT exhibited the lowest values of Fv/Fm at PM. The negative effects of booting HT on all three cultivars were clearly shown by the significant differences in Fv/Fm between the control and booting HT plants at each growth stage. The ∆F/Fm’ values in all rice cultivars at pre-booting HT were in the range of 0.628–0.682 (Figure 3D-F). The ∆F/Fm’ values at heading-PM for N22 and IR64 after booting HT exhibited marked decrease as shown in Figure 3D and F. In contrast, booting HT plants of KDML105 exhibited no effect of ∆F/Fm’ from heading to dough grain but a decrease ∆F/Fm’ at PM (Figure 3E). Therefore, booting HT affected PSII efficiency by declining Fv/Fm and ∆F/Fm’ of all rice cultivars, especially a marked decline at PM. However, KDML105 seemed to less affect PSII efficiency compared to other cultivars.

2.3.2. A, gs, and E

The effect of booting heat stress (HT) on leaf gas exchange parameters including net photosynthetic rate (A), stomatal conductance (gs) and transpiration rate (E) of N22, KDML105 and IR64 is shown in Figure 3G-O. Net photosynthetic rate (A) at pre-booting HT were 27.19, 25.70 and 26.12 µmol.m–2.s–1, for N22, KDML105 and IR64, respectively, as shown in Figure 3G-I. The booting HT plants of N22 and IR64 exhibited the same reduction pattern of A from heading to PM and A values of N22 and IR64 were reduced at PM stage by –19.67 and –14.07% of control (Table 1), respectively (Figure 3G and I). The A of booting HT plants of KDML105 showed a significant reduction at heading but at milk and dough grain stages, A recovered to the rates similar to that at booting and then dramatically reduced at PM (–45.72% of control; Table 1) (Figure 3H). Stomatal conductance (gs) and transpiration rate (E) of three rice cultivars at pre-booting heat stress were in the range of 0.12–0.67 mmol.H2O.m–2.s–1 and 4.40–5.96 mmol.H2O.m–2.s–1, respectively (Figure 3J-O). It was noted that KDML105 was several folds higher gs than N22 and IR64. The booting HT plants of all rice at heading and milk grain stages, theirs gs were reduced in the range from –7.59 to –33.03% of control (Table 1). At PM stage after booting HT, a slight- and moderate-decreased of gs were found in N22 (–1.22% of control; Table 1) and IR64 (–20.68% of control; Table 1), respectively. Surprisingly, the booting HT plants of KDML105 at dough grain, its gs exhibited dramatic increase by +46.29% of control (Table 1) and then a sharp decrease by –71.89% of control (Table 1) at PM stage (Figure 3K). The trend of E for all rice from heading to dough grain stages showed reduced after booting HT, excluding a slight increase in KDML105 at milk grain (+2.21% of control; Table 1) (Figure 3M-O). At PM stage, the E values of N22 and KDML105 were a slight increase by +7.81 and +10.72% of control (Table 1), respectively. In contrast, the E value of IR64 at PM stage was still declined by –24.52% of control (Table 1). Therefore, booting HT was less effect on leaf gas exchange of N22 by maintaining gs and E at PM stage. KDML105 after booting HT showed low reduction of A at milk and dough grain stages due to maintain E (at milk grain) and gs (at dough grain), respectively.

2.4. Rice growth performance under booting heat stress

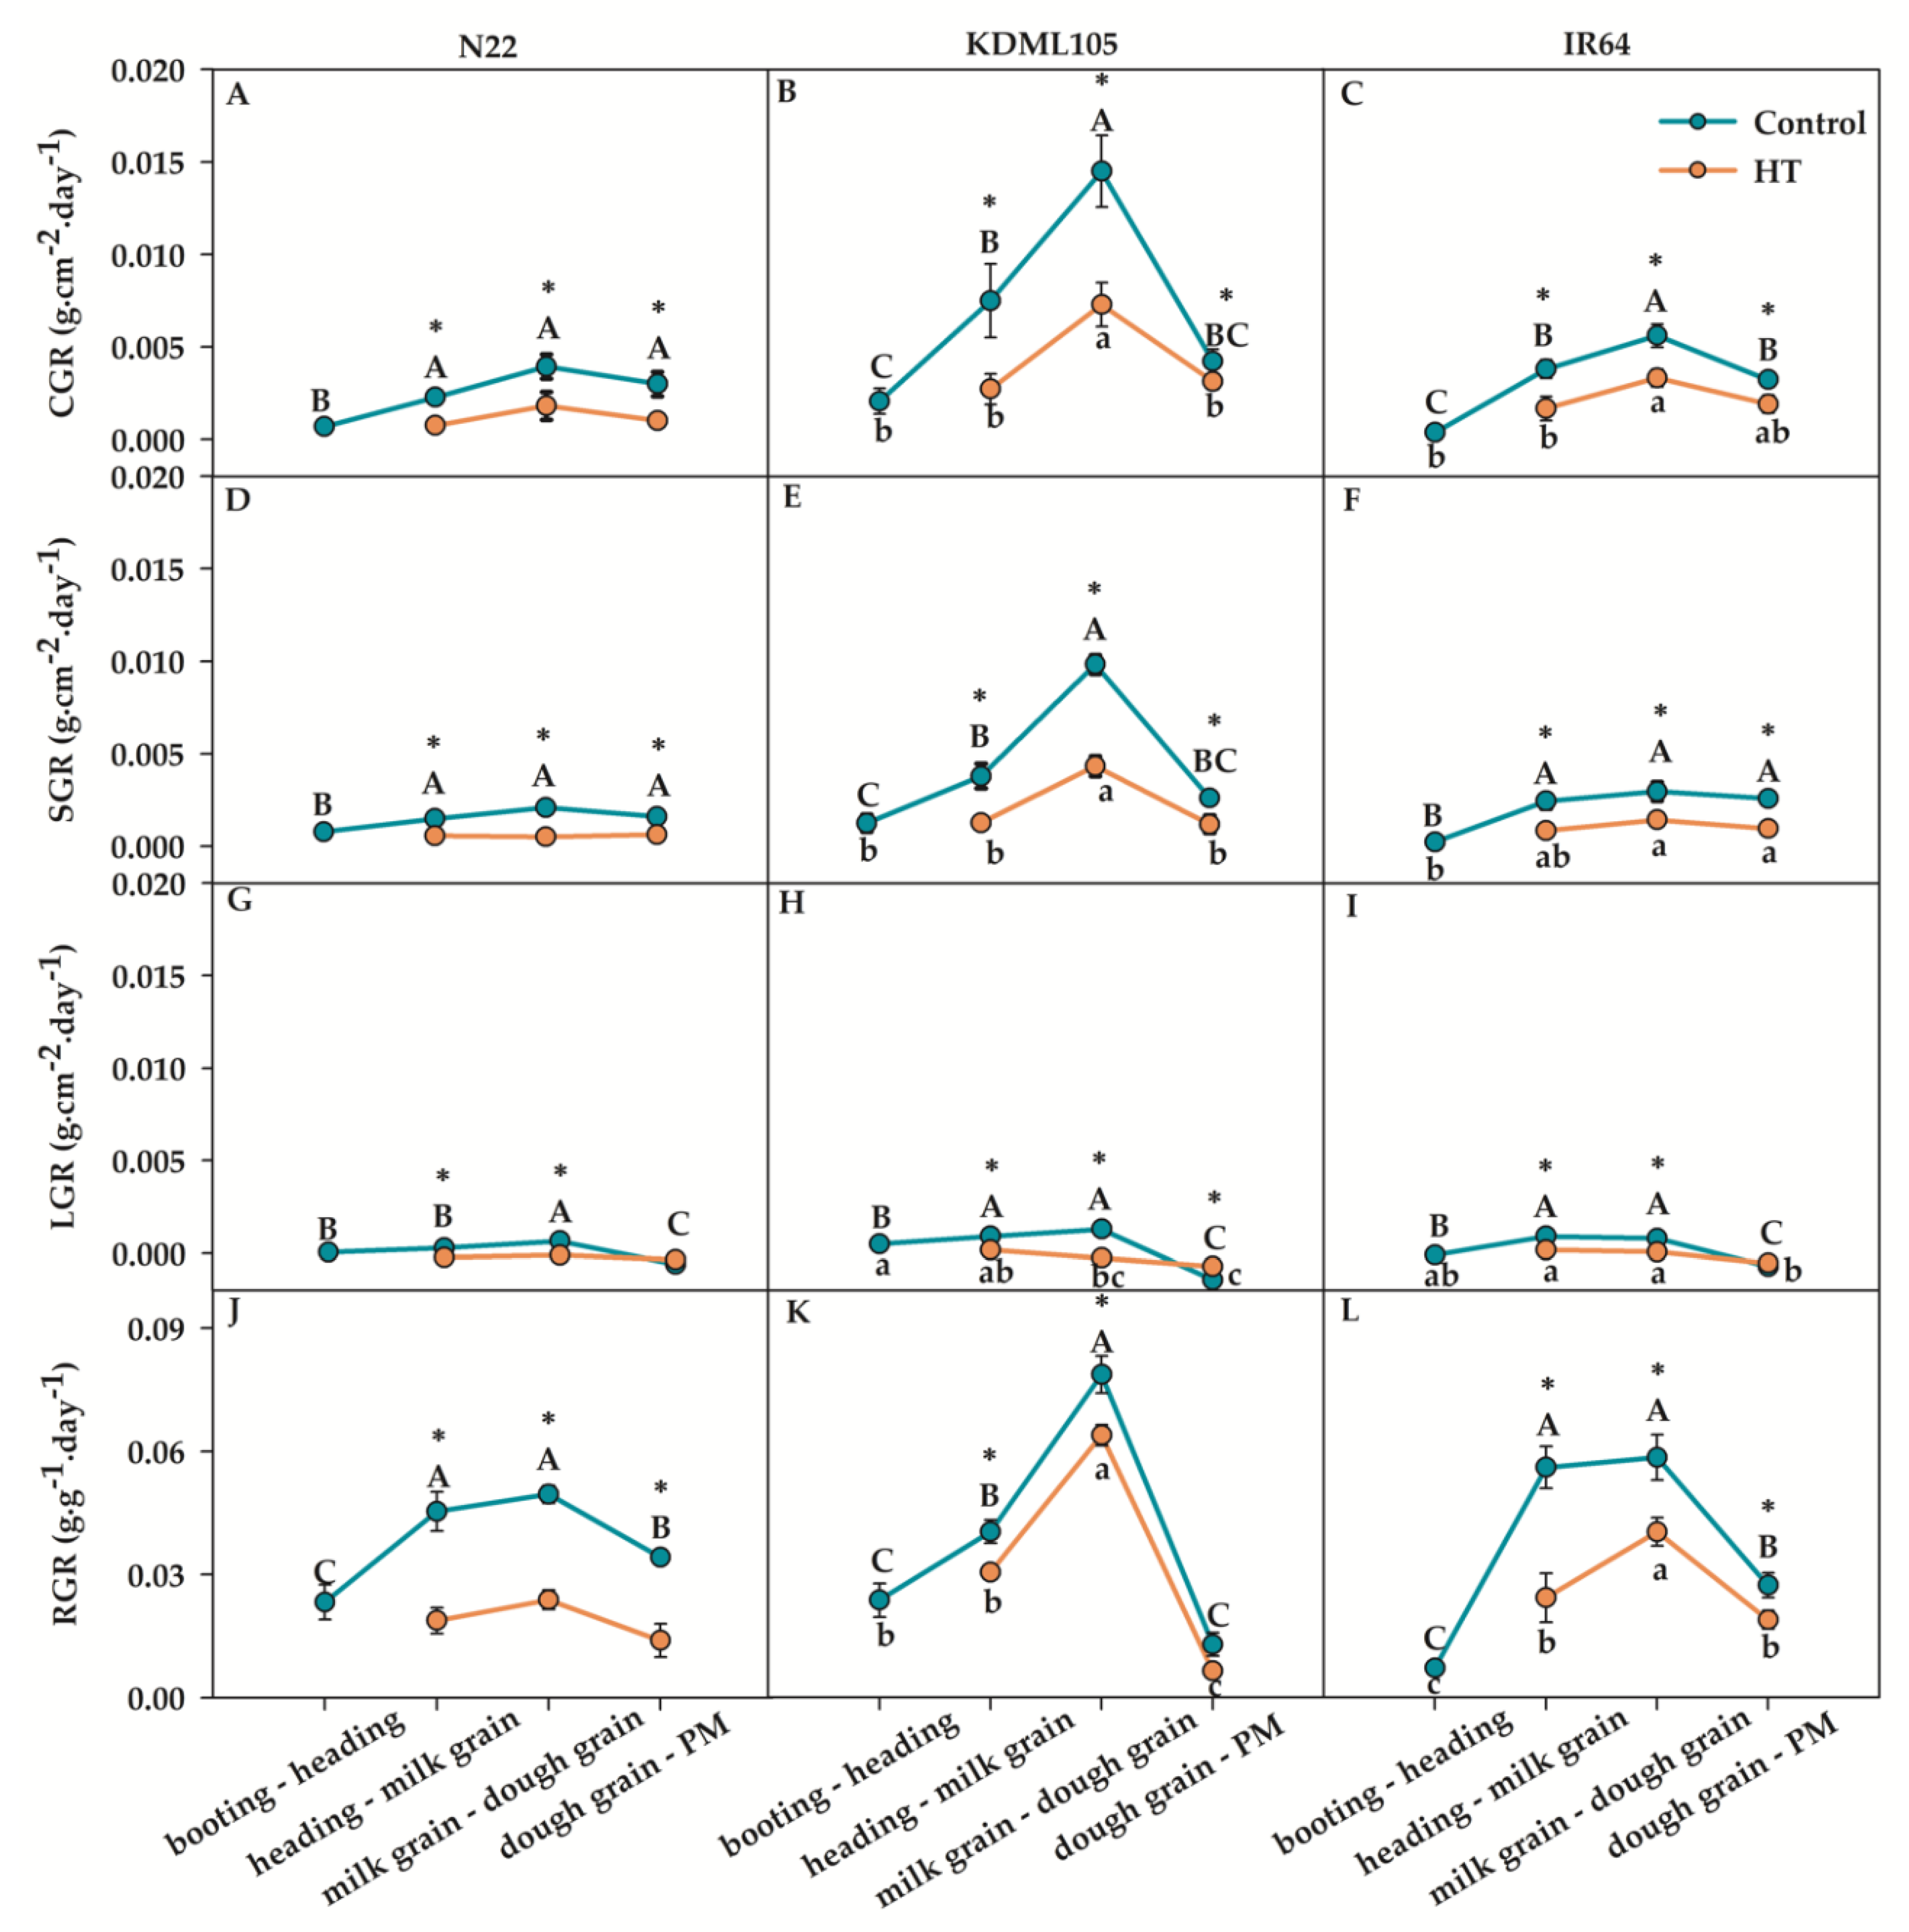
The CGR, SGR, LGR and RGR were the parameter to determine for the whole plant growth (Figure 4) and the leaf growth characteristic was determined as LA, LAI, SLA and NAR (Figure 5). The CGR, SGR, LGR and RGR in all rice at all growth stages declined after booting HT compared to control (Figure 4A-F and J-L), excluding the slightly increased LGR at dough grain-PM (Figure 4G-I). The highest CGR, SGR and RGR were recorded at milk grain – dough grain of all rice in both conditions. The averages of the highest CGR, SGR and RGR parameters in all rice after booting HT were 0.004 and 0.002 g.cm–2.day–1 and 0.043 g.cm–2.day–1, respectively. The highest LGR after booting HT was found at milk grain - dough grain in N22 (–0.0001 g.cm–2.day–1) and at heading – milk grain in KDML105 and IR64 (0.0002 g.cm–2.day–1). The CGR, SGR and LGR in N22 after booting HT were less changed at booting-PM compared to other rice. RGR in KDML105 after booting HT was less changed at booting-PM compared to other rice.
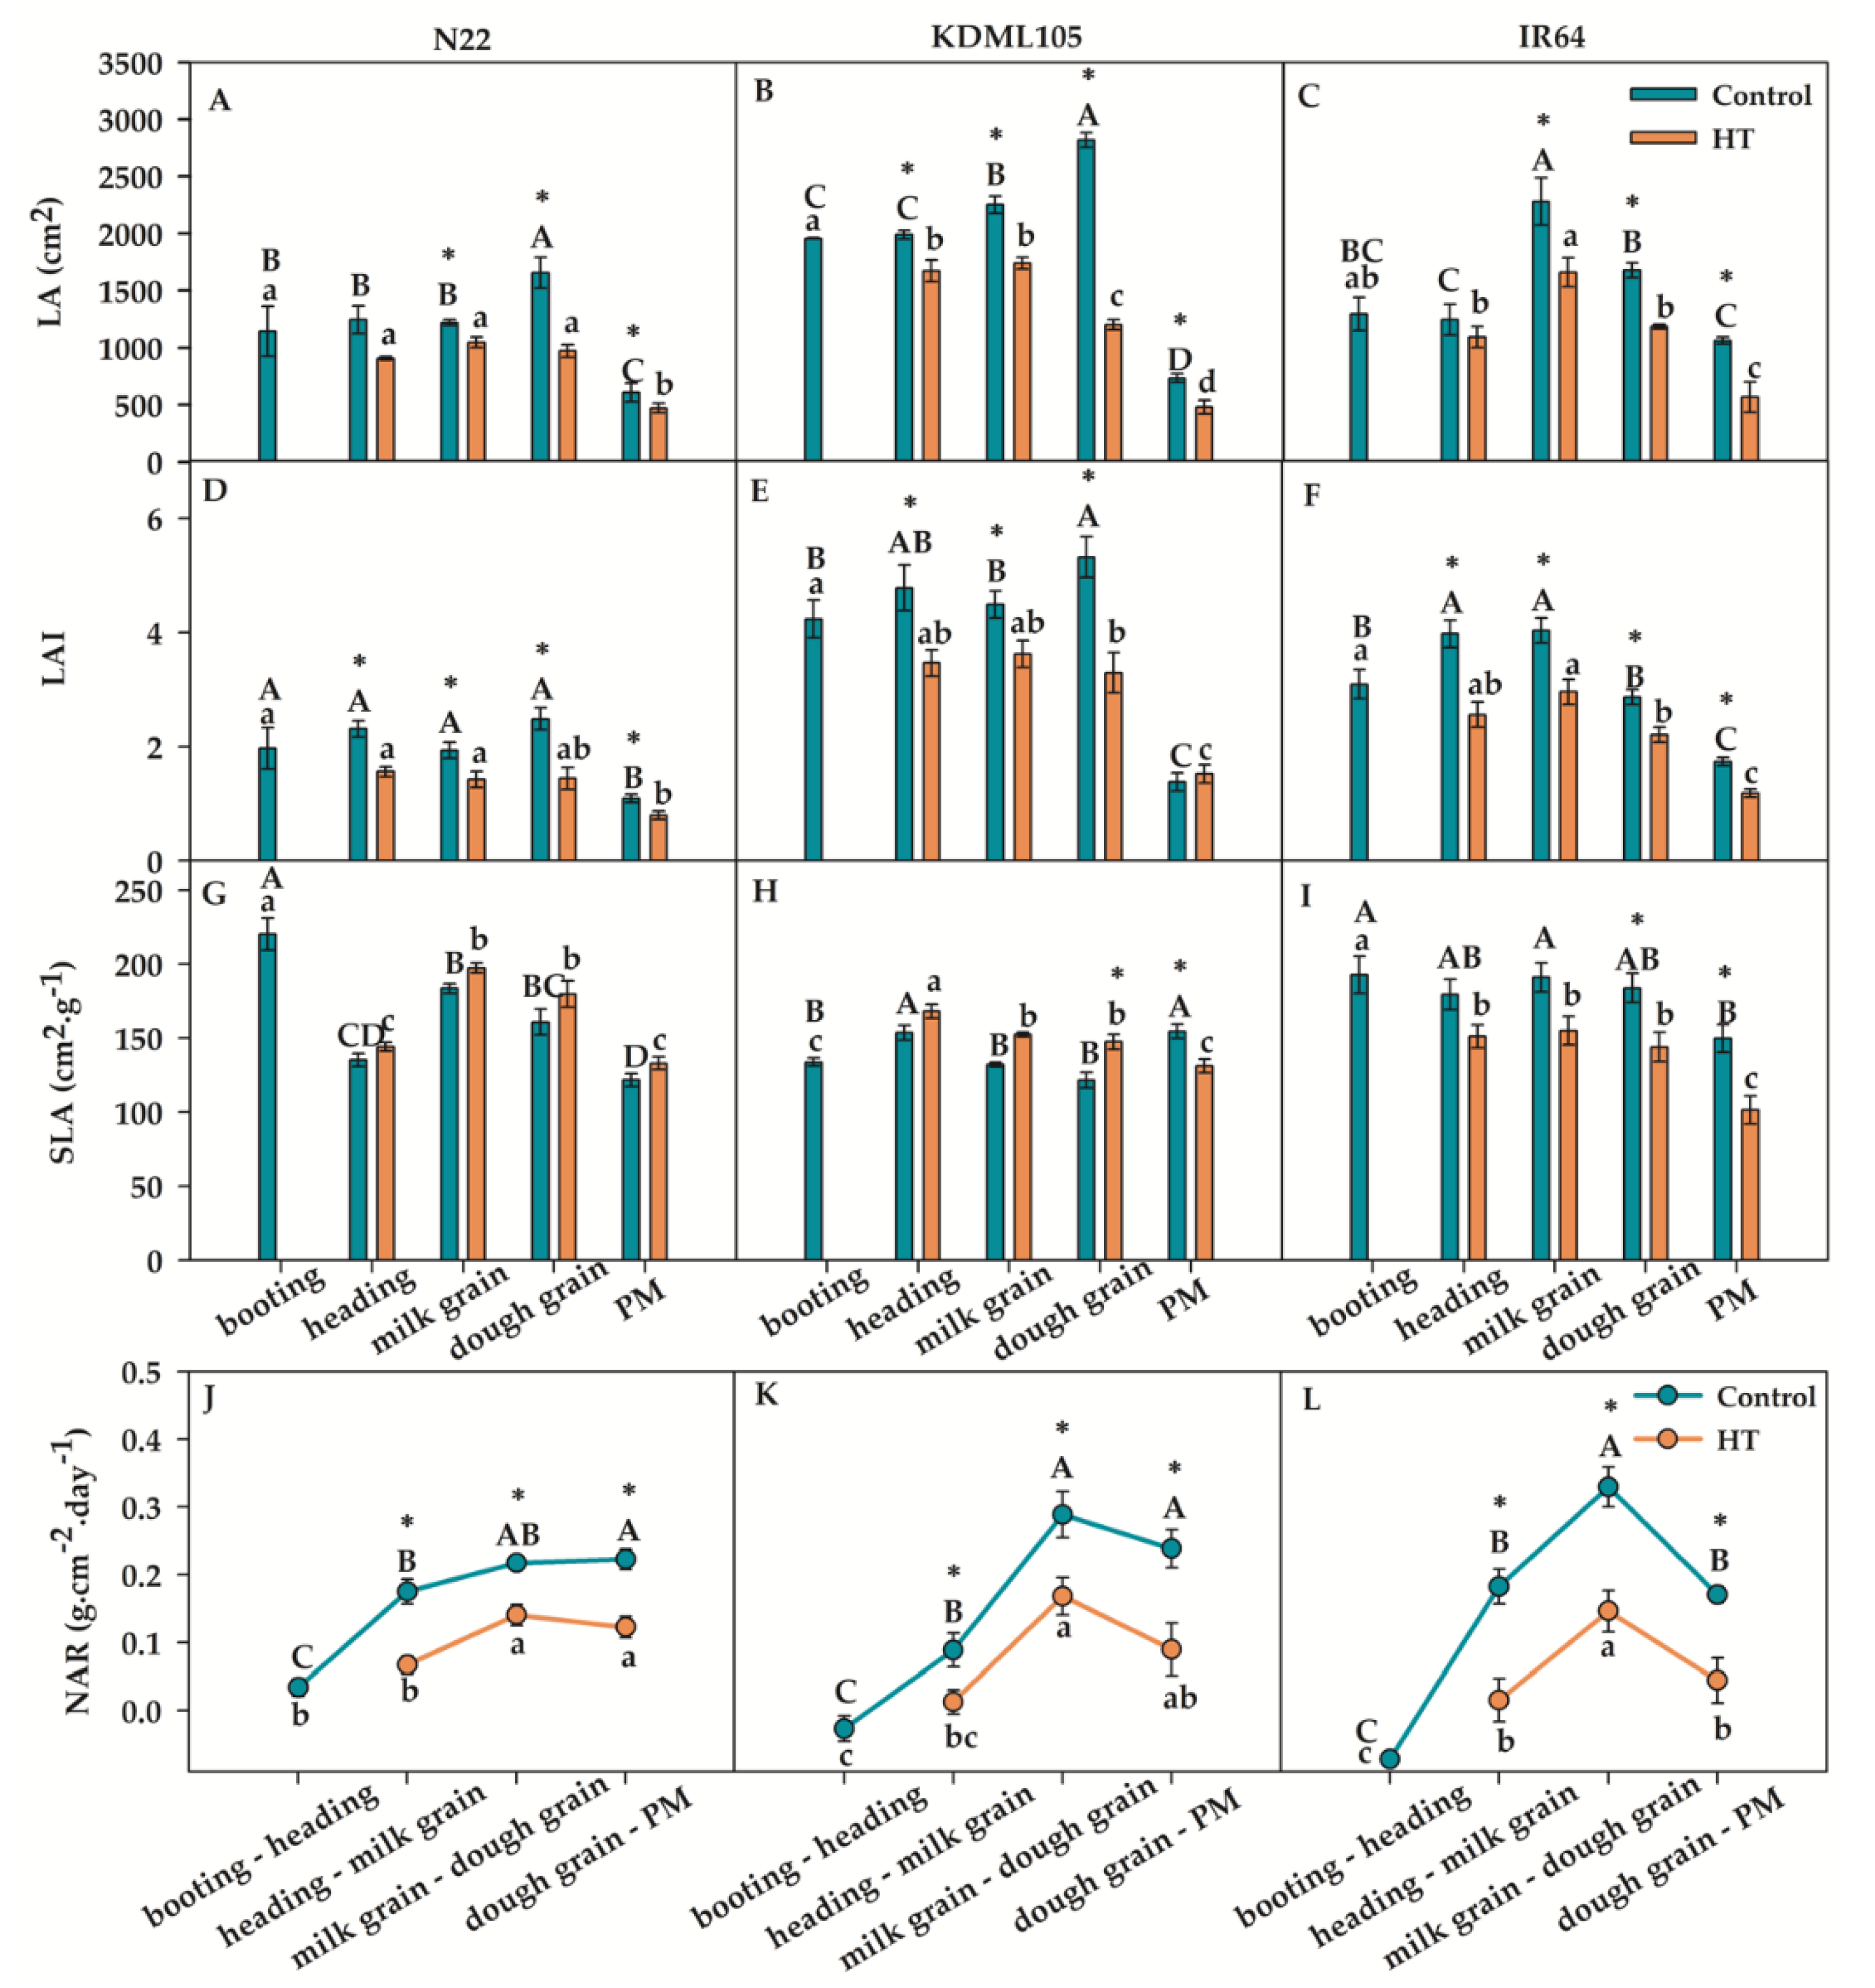
Leaf growth characteristics, including LA, LAI, SLA and NAR, after booting HT were observed as shown in Figure 5. The LA, LAI and NAR of all rice after booting HT were decreased at all growth stages compared to control, excluding a slight increase in LAI of KDML105 at PM. The LA and LAI in N22 after booting HT remained at heading to dough grain comparable to that at booting, and significantly reduced only at PM (Figure 5A and D). The dramatic decreased of LA and LAI in KDML105 were found at dough grain (Figure 5B and E) but the significant reduction of LA and LAI in IR64 were found at milk grain and heading, respectively (Figure 5C and F). The SLA of N22 and KDML105 after booting HT tended to increase at all growth stages compared with the control, excluding the slightly lower SLA in KDML105 at PM (Figure 5G-H). In contrast, IR64 after booting HT was lower SLA than the controls at all growth stages (Figure 5I). The trend of NAR of all rice after booting HT was sharp increase from booting to dough grain. Then, at PM, KDML105 and IR64 was marked decrease in NAR (Figure 5L). However, the NAR of N22 was slight increase at PM (Figure 5J).
Therefore, plant growth rate in the whole plant and in leaf characteristics of three rice cultivars showed a decrease after booting HT, excluding the increased SLA in N22 (at all growth stages) and in KDML105 (at heading, milk grain and dough grain excluding PM). At milk grain-dough grain and at dough grain tended to be more sensitive to booting HT than other stages indicated by the highest reduction values. However, at PM, all plant growth rate parameters of booting HT plants were lower than those of the controls, excluding SLA in N22. In addition, CGR, SGR, LGR, LA, LAI and NAR of booting HT for N22 were less affected compared to other rice cultivars.

2.5. Rice yield components and yield response to booting heat stress

The yield components and yield of the control and the booting heat stress (HT) plants of N22, KDML105, and IR64 were shown in Table 2. After booting HT, the vegetative part of the yield component i.e. the number of tillers per hill significantly increased in N22 (+10.23% of control) and IR64 (+14.05% of control), while that of KDML105 was significantly reduced (Table 2). The yield components of the reproductive part, including the number of seeds per panicle, filled seeds per hill and 1000-seed weight, of all booting HT rice were markedly decreased, excluding a small increase in 1000-seed weight of IR64 by +0.13% of control. However, IR64 exhibited the highest reduction in number of seeds per panicle and filled seeds per hill by –35.63 and –61.70% of control, respectively. Yield and HI in all booting HT rice exhibited a sharp decrease compared to the controls, especially IR64 showing –65.20% yield reduction. Notably, N22 showed the lowest reduction in number of seeds per panicle, filled seeds per hill, yield and HI. Therefore, booting HT affected reproductive part more than the vegetative part and it reduced yield components (reproductive part), yield and HI. The highest reduction in yield components and yield occurred in IR64 followed by KDML105, and N22 was the least affected.

2.6. Chalky rice grain due to booting heat stress

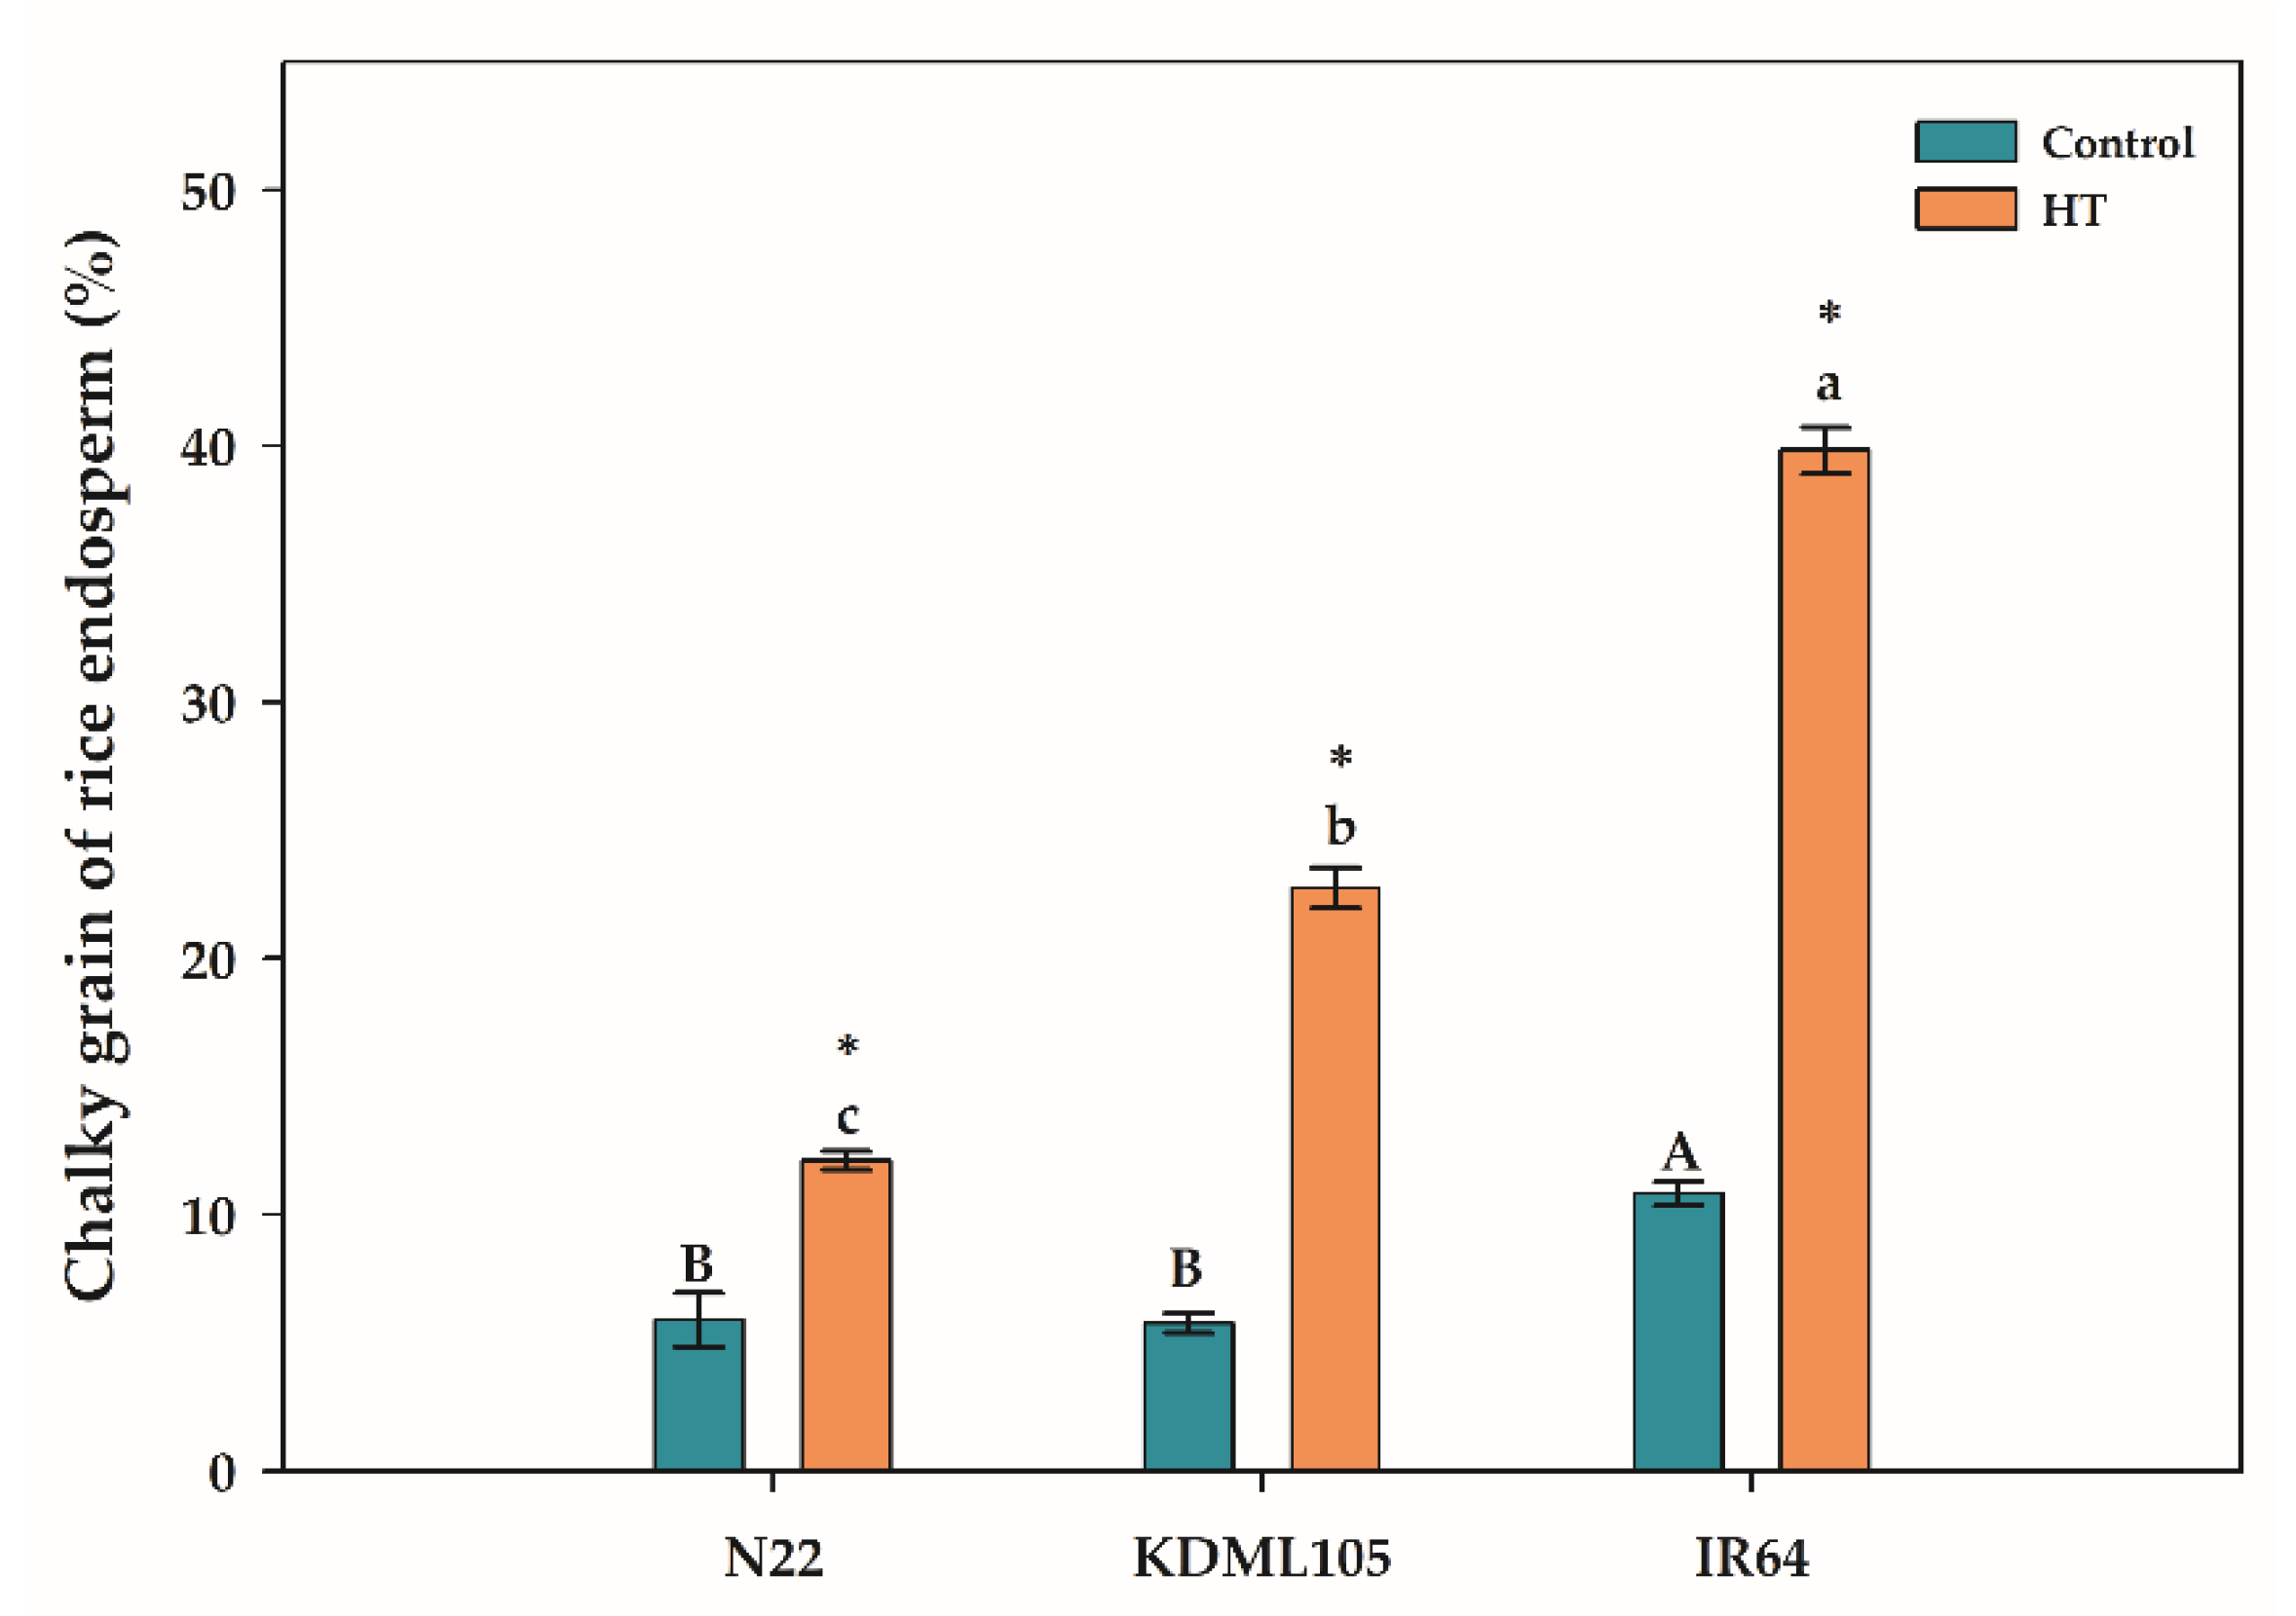
The percentage of chalky grain in the rice endosperm as affected by booting HT was shown in Figure 6. There was a sharp increase in the percentage of chalky grain in the endosperms of all booting HT rice compared to the controls. The highest incidence of chalky grains was found in IR64 (39.82%), followed by KDML105 (22.74%) and N22 (12.10%). Therefore, booting HT induced chalkiness in endosperm of all rice cultivars with IR64 being the most affected and N22 was the most resistant followed by KDML105.

3. Discussion

3.1. Booting heat stress initiating forward phenological development in rice

Phenology is the time change in seasonal events such as budburst, flowering and dormancy. The changes in phenology is linked with growing season and it is sensitive to temperature change. Generally, high temperature above the optimum temperature may present no effects on crop phenology or decrease crop developmental rate. However, in the rice, an exposure to temperature above threshold temperature (35°C) induced an increase in developmental rate after anthesis.
In our study, booting heat stress (HT) caused the greater increase of AGDD and GDD on the phenological development of post-booting stages of rice i.e., milk grain, dough grain and physiological maturity. According to [14], phenology shift also occurred in rice grown in the most areas of South China after post-heading heat stress. Our results revealed high AGDD and GDD after booting HT influenced and extended rice phenology from booting to PM. KDML105 after booting HT showed the most forward phenology shift at booting-PM and dough grain-PM. We suggested that booting HT extended rice phenology and reduced photo-assimilate synthesis indicated by the negative correlation between phenology and Fv/Fm, ∆F/Fm´, A and gs in all rice cultivars exposed to booting HT (Figure 7A-C). In addition, booting HT also slowdown the rate of grain-filling stage causing reduced filled grains. Thus, rice plants overcame the effects of booting heat stress by extending phenological period in the grain filling stage, especially KDML105, thereby prolonging the timing of producing, translocating and accumulating photo-assimilates from sources (flag leaf, leaf sheaths and culms) to sink (rice grains) resulting in mitigating of the percentage reduction of filled grains in N22 (indicated as heat tolerance) and KDML105 (indicated as moderate heat sensitive). In contrast to our results, [15] pronounced that hybrid rice plants exposed to increased temperature above 2 and 4°C of ambient temperature were shortened in various phenological periods such as tillering, panicle initiation, 50% flowering and harvesting. Moreover, [16] also pronounced that high AGDD led to alter phenology of rice by shortening the growing period from sowing to PM and reducing anthesis day and the development of embryo and endosperm, resulting in yield reduction.

3.2. Booting heat stress altering leaf characteristic and leaf function in rice

The leaf is a photosynthetic workplace in plants and its characteristics, such as size and shape, play an important role in plant architecture that mostly influences crop productivity [17]. Crop productivity is influenced by leaf photosynthetic rate, leaf area expansion and photosynthetic duration. Crop simulation models in winter wheat exposed to extreme temperatures revealed that crop growth and yield can be predicted by the extent of leaf area damaging and leaf withering. In addition, the extreme temperatures also led to the reduction of photosynthetic rates and the leaf area as indicated by LAI [18]. According to our results, booting HT affected leaf function by reducing leaf photosynthesis as indicated by PSII efficiency (Fv/Fm and ∆F/Fm’), CO2 gas exchange (A, gs and E) and photosynthetic duration (NAR). In addition, booting HT also affected leaf characteristics as indicated by decreased LA and LAI in all three rice cultivars, and decreased leaf thickness as indicated by increasing SLA in both N22 (all growth stage) and KDML105 (at heading, milk grain and dough grain). Similar to our result, the study of [8]. reported the increased SLA in most rice cultivars after high temperature treatment. In contrast, the significantly declined SLA was found in wheat plants during the reproductive stage after an exposure to temperatures at 37/31°C [19].
Heat stress also influenced the performance of photosynthesis because it inhibits PSII and the electron transport chain and affects stomatal conductance (gs) and intercellular CO2 concentration. Our results showed that booting HT affected PSII efficiency by declining Fv/Fm and ∆F/Fm’ of all rice cultivars at all growth stages, especially with a marked decline at the PM stage. All leaf gas exchange parameters i.e., A, gs and E, of three rice cultivars also decline after booting HT. However, N22 after booting HT was less effect on leaf gas exchange by maintaining gs and E, especially at PM stage. Several studies showed that high temperature affected different rice varieties [8,20] by decreasing photosynthetic rate, stomatal conductance and transpiration rate [21]. In addition, we found a high positive correlation between leaf characteristics such as LA, LAI and SLA, and leaf function, Fv/Fm, A and gs under booting HT (Figure 7). This suggested that booting HT reduced leaf area and leaf thickness associated with the markedly reduced photosynthesis capability in both light reaction (PSII efficiency) and CO2 assimilation process (leaf gas exchange).

3.3. Booting heat stress impacting on biomass in rice

Growth at plant and canopy level refers to biomass accumulation caused from the balance between carbon assimilation and losses via respiration, leakage or shedding [22]. In the case of the optimum environment, high biomass production is mostly due to high CGR resulting from high photosynthesis in the day time and low stable respiration in night time. In contrast adverse environment high temperature led to a marked decline biomass accumulation in wheat [29], reduce panicle dry matter in rice [12] and a dramatic decrease shoot and panicle dry matter and CGR in rice [9]. Similarly, in this study, booting HT reduced the CGR, SGR, LGR and RGR in all rice at all growth stages. However, there was less reduction of the CGR, SGR and LGR in N22 and the RGR in KDML105 at booting-PM.
This suggested that booting HT dramatically reduced biomass accumulation in rice, resulting in high growth rate reduction in IR64 and KDML105. This was mainly due to the reduction leaf photosynthesis capability (Fv/Fm, ∆F/Fm’, A, gs and E). According to several previous studies in rice, high temperatures influenced the reduction of Fv/Fm [23,24], ∆F/Fm’ [25,26] and A [19]. However, N22 after booting HT was enable to maintain gs and E, resulting in lower A reduction, and low reduction in biomass accumulation indicated by less reduction of CGR, SGR and LGR.

3.4. Booting heat stress affecting rice yield and grain quality

The economic value of rice can be determined by rice yield. The quantity and quality of rice yields can be decreased by high temperature [2]. Our results showed dramatic reduction in yield components in reproductive parts, such as the number of seeds per panicle, filled seeds per hill and 1000-seed weight, yield and HI after booting HT and the highest reduction was found in IR64. This suggested that a high temperature during the booting stage led to a reduction in spikelet fertility, reduced 1000-grain weight and increased in sterile and aborted spikelets per panicle caused great yield reduction [27]. High temperature inhibited the ovary development at the meiosis stage, and it also affected pollen mother cells, and microspore development which led to male sterility [28,29]. Moreover, high temperature disturbed tapetum functions resulting in abnormal or poor anther dehiscence [30]. The increased sterile spikelets in rice at early reproductive stage such as the booting stage, are caused by pollen infertility, abnormal or poor anther dehiscence [38], inhibited pollen shedding, reduced pollination, poor pollen germination [31], failure to fertilize [32], poor seed setting, empty or unfilled grains and low grain weight [33]. The heat-induced abnormally of all components during booting stage led to loss of grain yield. The reduction of 1000-grain weight of the booting HT rice plants could be due to the inhibition of spikelet growth or poor grain filling. Usually, the 1000-grain weight was determined by hull and endosperm development. Thus, high temperature caused abnormal spikelet development resulting in less hull size and grain weight [34].
In contrast to yield components in the reproductive part, we found yield components in the vegetative part i.e., the number of tillers per hill increased in booting HT plants of N22 and IR64. Therefore, booting HT affected the reproductive parts more than the vegetative parts of rice which as similar to the report of [32]. In addition, our results showed booting HT induced chalkiness in endosperm of all rice cultivars with the highest chalkiness in IR64. The chalkiness is an indicator of rice yield quality. High temperature led to loosely packing of starch granules leading to chalky endosperm due to the large amount of air space during endosperm development [13].
In addition, chalkiness was also caused by the reduction of amyloplast packing due to starch degradation by α-amylase causing chalkiness [35]. The characteristic of chalky grain is a white discoloration of endosperm which decreases the value of head rice kernels [36]. The high temperature leads to a decline in the quantity of whole kernel head rice and an increase in the quantity of broken kernels [2]. A previous study showed the increase in daily maximum temperatures decreased paddy rice yields, dramatically changed the distribution of heads and broken rice and markedly increasing chalkiness [2]. We found a negative correlation between chalky grain and GCR (N22 and IR64), SGR (N22 and IR64), LGR (KDML105 and IR64) and RGR (N22 and IR64) in rice under booting HT (Figure 7). This suggested that booting HT led to a reduction in the accumulation of dry matter in leaves, stems and all plant parts, resulting in plant starvation. This caused starch degradation in grain, leading to lose packing of starch granules (especially, amyloplast packing) resulting in an increase in grain chalkiness.

4. Materials and Methods

4.1. Plant materials

Three rice cultivars, namely N22 (heat tolerant rice [37]), IR64 (heat sensitive rice [38]) and KDML105 (Thai jasmine rice) were used as the experimental plant materials. Rice seeds were sterilized and then germinated on well-watered filter paper. After 7 days, three-germinated seeds were transferred to a pot of size 12.5 L filled paddy soil with 20 pots in each treatment. The soil properties were sandy loam with pH =6.26, EC=0.008 dS.m–1, N =0.019%, P=0.63 mg.kg–1, K=17.21 mg.kg–1, OM=0.17%. The plants were grown in the open greenhouse under natural light from May to November 2021 at the Agronomy Field Station, Faculty of Agriculture, Khon Kaen University, Khon Kaen, Thailand (16°28’ N, 102°48’ E). The research experiment was designed in 2 x3 factorial in a completely randomized design (CRD) with four replications. The factors of the factorial design consisted of 2 temperatures i.e., open greenhouse temperature (control) and 42.0°C , 3 h for 7 days (heat stress, HT), and 3 rice cultivars (N22, KDML105 and IR64). The 21-day-old rice seedlings in each pot were thinned to a healthy seedling and it was allowed to grow until the booting stage. Rice plants at the booting stage were divided into two groups: 1) control; the plants were grown in the open greenhouse during the entire experimental period at the average temperature approximately 27.5°C ) and 2) heat stress (HT); during booting stage the plants were transferred to the growth chamber (VRV.Corp., Ltd., Bangkok, Thailand) for 7 days during which the plants were daily exposed to HT at 42.0°C for 3 h. The temperature, relative humidity (RH), and light intensity in the growth chamber during the 7-day heat exposure period are shown in Table 3. The climate data in the open greenhouse such as temperature, RH, and photosynthetically active radiation (PAR) were daily recorded by an automatic weather station (WatchDog 1000 Series Micro Stations, Spectrum Technology Inc., Illinois, USA) every 15 min throughout the rice growing period (20th May to 19th November 2021). The air vapor pressure deficit (VPDair) was calculated according to [39] as follows (1):
VPD (kPa) = 0.61078 × (1 – RH / 100) × (17.27 × T/ (T + 237.3))
where, T is the air temperature (°C).
After the 7 days of heat exposure, the HT plants were returned and continued growing in the open greenhouse until the physiological maturity (PM) stage. Plant phenology, photosynthetic and growth analysis parameters were recorded at booting, heading, milk grain, dough grain and PM stages. Yield components, yield, and chalky grain were investigated at the PM stage.
Temperature and relative humidity were attained from the Agronomy field station, Faculty of Agriculture, Khon Kaen University, Khon Kaen, Thailand during March-May 2015– 2018. Light intensity was investigated by light incident on the rice leaves at 0.3 m from the light source.

4.2. Phenological development

Rice phenological development data was observed throughout the experimental period by visual daily observation at booting, heading, milk grain, dough grain and physiological maturity (PM). The visual daily observation of rice was determined accorded to [40].

4.3. AGDD calculation

The accumulated high temperatures, expressed in accumulated growing degree day (AGDD), were calculated by the summation of growing degree day (GDD) of the rice growing period. GDD was calculated according to [41]. as follows (2):
GDD = (Tmax + Tmin) / 2 − Tbase
where, Tmax and Tmin are the daily maximum and minimum temperatures, respectively, and Tbase is the base temperature (Tbase of rice = 10.0°C ).

4.4. Photosynthetic determination

4.4.1. PSII efficiency

The determination of PSII efficiency was recorded in the maximum quantum yield of PSII efficiency in the dark-adapted state (Fv/Fm), effective quantum yield of PSII efficiency in the light-adapted state (∆F/Fm′), minimal fluorescence in the dark-adapted state (Fo), maximal fluorescence in the dark-adapted state (Fm), minimal fluorescence in the light-adapted state (Fs) and maximal fluorescence in the light-adapted state (Fm´) using a chlorophyll fluorometer (Mini PAM, Walze, Effeltrich, Germany). Both Fv/Fm (3) and ∆F/Fm′ (4) were calculated as described by [42] as follows:
Fv ∕ Fm = (Fm – Fo) ∕ Fm
ΔF ∕ Fm′ = (Fm′ – Fs) / Fm’

4.4.2. CO2 gas exchange

The leaf CO2 gas exchange parameters including net photosynthetic rate (A), stomatal conductance (gs) and transpiration rate (E) were investigated in the middle part of flag leaf using a Licor-6400XT Portable Photosynthesis System (LICOR Inc., Lincoln, Nebraska, USA). The measurement of leaf CO2 gas exchange was conducted using a sun sky head from 9.00 a.m. to 12.00 a.m. with the following conditions i.e., CO2 concentration at 400 ppm, air flow rate at 500 mmol.s–1, leaf temperature at 30°C , PAR at 1000 µmol.m–2.s–1 and leaf area of 3 cm2.

4.5. Growth analysis

Four plants from each treatment were sampled at booting, heading, milk grain, dough grain and PM stages after HT to determine crop growth rate (CGR), stem growth rate (SGR), leaf growth rate (LGR), relative growth rate (RGR), leaf area (LA), leaf area index (LAI), specific leaf area (SLA) and net assimilation rate (NAR). The sampled rice plants were separated into leaves, stems and panicles. All plant materials were used to measure for the growth analysis. Sampled green leaves were measured leaf area using a leaf area meter (LI-Cor 3100, LICOR Inc., Lincoln, NE, USA). All plant organs were dried at 80°C until reaching the constant weight, and then the dry weight of each plant organ was measured. Growth rates including CGR, SGR, LGR and RGR for four different growth stage durations (booting-heading, heading-milk grain, milk grain-dough grain and dough grain-PM) were calculated for each plant organ and expressed as the change in dry weight per ground pot area per unit of time. The LAI values at booting, heading, milk grain, dough grain and PM stages were calculated as the ratio of plant leaf area to ground pot area. The plant leaf area and its dry weigh at booting, heading, milk grain, dough grain and PM stages were used to calculate SLA. The plant leaf area and its dry weight with change per unit of time at booting, heading, milk grain, dough grain and PM stages were used to calculate NAR [43].
The formulas for calculation of CGR (5), RGR (6), LAI (7), SLA (8) and NAR (9) were given by [43] as follows:
CGR = 1 / GA × ((W2 – W1) / (t2 – t1))
RGR = 1 / W × (dW / dt) = ((lnW2 – lnW1) / (t2 – t1))
LAI= LA / GA
SLA= LA / LW
NAR = 1 / LA × (dW) / (dt) = ((lnLA2 – lnLA1) / (t2 – t1)) × ((W2 – W1) / (LA2 – LA1))
where, W1 is initial plant dry weight at time t1, W2 is final plant dry weight at time t2, GA is ground pot area, t1 is initial time, t2 is final time, LA is leaf area, LA1 is initial leaf area at time t1, LA2 is final leaf area at time t2, LW is leaf dry weight, LW1 is initial leaf area at time t1 and LW2 is final leaf dry weight at time t2. SGR and LGR for four different growth stage durations were calculated in stem and leaf parts, respectively, with change in their dry weight per ground pot area per unit of time.

4.6. Yield components and yield

Yield components and yield including number of tillers per hill, number of seeds per panicle, filled seeds per hill, 1000-seed weight and harvest index (HI) were determined for all plants in each pot at the PM stage. The HI was calculated as follows (10):
HI = EY / BY
where, EY is the economic yield and BY is the biological yield.

4.7. Chalky grain

Twenty-rice grains were collected from the main panicle in each pot for investigating chalky grains as described by [44]. Then rice grains were photographed and the percentage of chalkiness was calculated based on the non-transparent areas compared to the whole grain areas by using Photoshop (Adobe Photoshop CC 2018).

4.8. Experimental design and statistical analysis

The experimental design was conducted using a completely randomized design (CRD). Data were subjected to one-way analysis of variance (ANOVA) and Duncan’s multiple range tests (DMRT) at p≤0.05, to test the differences among three rice cultivars in control and HT. An independent-sample t-test was performed to test the difference between control and HT in each rice cultivar. All statistical analysis was performed using SPSS version 28.

5. Conclusions

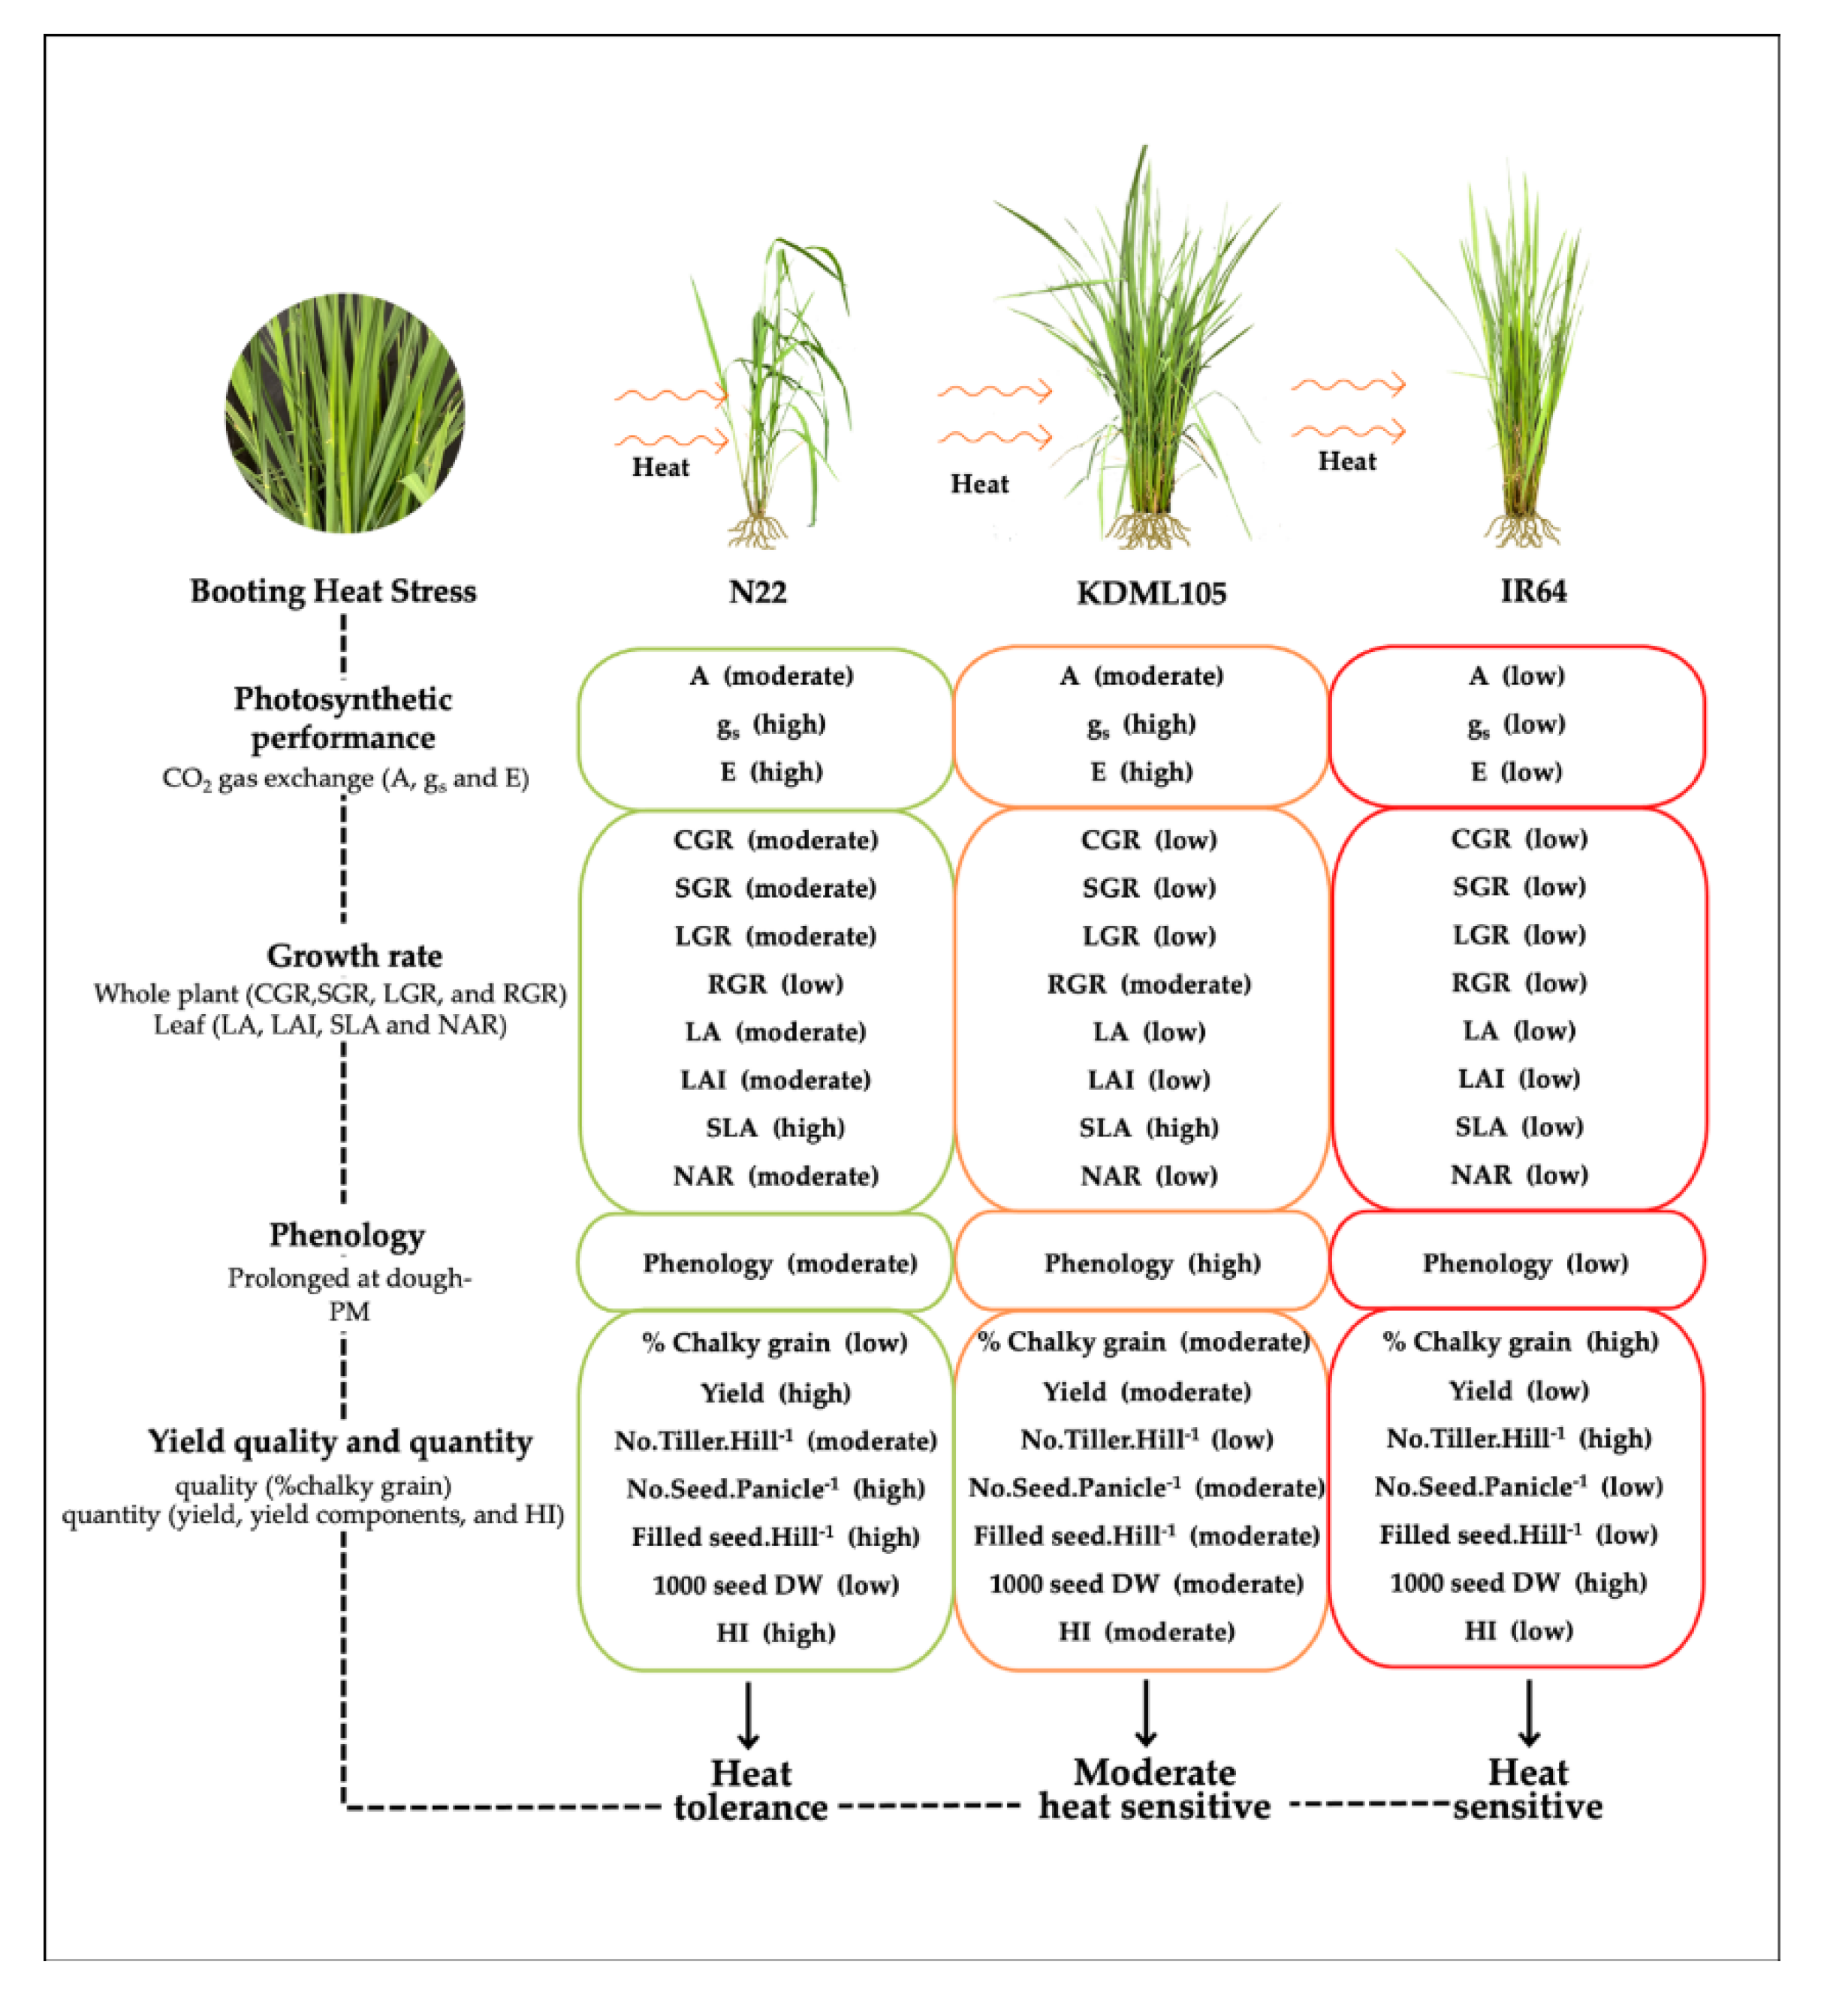
As a summary of this study, booting heat stress (HT) causes an extended phenology of all rice cultivars from the booting to physiological maturity stage (PM). Booting HT caused the reduction all physiological and yield parameters including photochemical efficiency of PSII, leaf gas exchange, growth rate, yield component, yields and harvest index (HI). However, SLA in N22 and KDML105 increased indicating the reduction in leaf thickness compared to the controls. The proportion of chalky grain of rice endosperm increased in all rice, with the highest percentage in IR64, followed by KDML105 and N22. Among cultivars, N22 demonstrated the highest the ability to tolerate and adapt to heat stress due to its adapting in physiological characteristics by maintaining stomatal behavior and transpiration rate after booting heat stress resulting in less effect on photo-assimilation and it also compensated the vegetative part of yield components by increasing the number of tillers per hill resulting in increased SLA and less reduction in CGR, SGR, LGR, LA, LAI and NAR. Moreover, the prolonged phenology of N22 especially from dough grain to PM resulting in an extension of period for filling photo-assimilates to rice grains. As a result, there was less reduction of the reproductive part of yield components, yield and HI and less chalkiness after booting HT. This can suggest that N22 acts as a heat-tolerant rice cultivar at the booting stage (Figure 8).
Rice KDML105 subjected to heat stress at the booting stage demonstrated certain ability to tolerate and adapt to heat stress such as maintaining its stomatal behavior and transpiration rate after booting heat stress which were associated with the ability to maintain leaf characteristics by increasing SLA. The booting HT plants of KDML105 also showed prominently lower reduction in RGR than the other cultivars and the most prolonged phenology at dough grain-PM. The prolonged duration from dough grain to PM allowed longer period for high producing (at dough grain stage) and translocating photo-assimilates to fill the developing grains (both dough grain to PM stages) resulting in moderate reduction of the reproductive part of yield components and yield, and also moderate chalkiness after booting HT. It is therefore suggested that KDML105 is moderately heat sensitive in response to booting HT (Figure 8). Rice IR64 treated with booting HT, on the other hand, presented the most reduction of photosynthetic performance, growth rate, yield components, yield and HI as well as the highest chalkiness of rice endosperm. Although, it abled prolonged phenology at the dough grain-PM. It is suggested that, among three cultivars, IR64 is the most a sensitive when subjected to HT at the booting stage (Figure 8).

Author Contributions

N.C., P.S. and P.P. carried out the experimental work. N.C and A.D. analyzed the data. A.D., W.T., P.B. and P.T. conceptualized the project. A.D. supervised the project. N.C., P.S. and A.D. drafted the manuscript. All authors read, edited and approved the final version of the article.

Funding

This research was funded by a grant from the National Research Council of Thailand (NRCT) through the Senior Research Scholar Project of Piyada Theerakulpisut (project no. NRCT813/2563) and KKU Research and Graduate Affair for funding the Research Program, Khon Kaen University, Thailand (project no. RP66–1–003) was also acknowledged for this research.

Acknowledgments

The authors would like to thank Department of Biotechnology research and development office Thailand, Pathum Thani rice research center Thailand for providing rice seed source (cvs. N22 and IR64) and the scientific instruments were supported by the Department of Biology, Faculty of Science and Department of Agronomy, Faculty of Agriculture, KKU, Thailand.

Conflicts of Interest

The authors declare no conflict of interest. The funders had no role to design in this research study such determination, data analysis, data interpretation, writing manuscript or decision to publish the results.

References

  1. Jagadish, S.K. Heat stress during flowering in cereals-effects and adaptation strategies. New Phytol 2020, 226, 1567–1572. [Google Scholar] [CrossRef]
  2. Lyman, N.B.; Jagadish, K.S.; Nalley, L.L.; Dixon, B.L.; Siebenmorgen, T. Neglecting rice milling yield and quality underestimates economic losses from high-temperature stress. PLoS ONE 2013, 8, e72157. [Google Scholar] [CrossRef] [PubMed]
  3. FAS. Thailand Rice: Recent Dry Conditions after a Promising Start; Optimism Still Remains for this Crop Season; Commodity Intelligence Report, Foreign Agricultural Service, United States Department of Agriculture: Washington, DC, USA, 2021; p. 14. [Google Scholar]
  4. OAE. Agricultural Production Data: Off-Season Rice Varieties—Cultivated Area Harvested Area Productivity and Yield per Rai in 2020; Office of Agricultural Economics: Bangkok, Thailand, 2022. [Google Scholar]
  5. Xu, Y.; Chu, C.; Yao, S. The Impact of High-Temperature Stress on Rice: Challenges and Solutions. Crop J. 2021, 9, 963–976. [Google Scholar] [CrossRef]
  6. Dutta, S.; Mohanty, S.; Tripathy, B. C. Role of Temperature Stress on Chloroplast Biogenesis and Protein Import in Pea. Plant Physiol. 2009, 150, 1050–1061. [Google Scholar] [CrossRef] [PubMed]
  7. Wang, Q.L.; Chen, J.H.; He, N.Y.; Guo, F.Q. Metabolic Reprogramming in Chloroplasts under Heat Stress in Plants. Int. J. Mol. Sci. 2018, 19, 849. [Google Scholar] [CrossRef] [PubMed]
  8. Beena, R.; Vighneswaran, V.; Sindhumole, P.; Narayankutty, M.; Voleti, S. Impact of High Temperature Stress during Reproductive and Grain Filling Stage in Rice. ORYZA- Int. J. Rice 2018, 55, 126. [Google Scholar] [CrossRef]
  9. Thuy, T.; Saitoh, K. Responses of Fourteen Vietnamese Rice (Oryza Sativa L.) Cultivars to High Temperatures during Grain Filling Period under Field Conditions. Agronomy 2017, 7, 57. [Google Scholar] [CrossRef]
  10. Mahmood, A.; Wang, W.; Ali, I.; Zhen, F.; Osman, R.; Liu, B.; Liu, L.; Zhu, Y.; Cao, W.; Tang, L. Individual and Combined Effects of Booting and Flowering High-Temperature Stress on Rice Biomass Accumulation. Plants 2021, 10, 1021. [Google Scholar] [CrossRef]
  11. Bahuguna, R. N.; Solis, C. A.; Shi, W.; Jagadish, K. S. V. Post-Flowering Night Respiration and Altered Sink Activity Account for High Night Temperature-Induced Grain Yield and Quality Loss in Rice (Oryza Sativa L.). Physiol. Plant. 2017, 159, 59–73. [Google Scholar] [CrossRef]
  12. Zhen, F.; Zhou, J.; Mahmood, A.; Wang, W.; Chang, X.; Liu, B.; Liu, L.; Cao, W.; Zhu, Y.; Tang, L. Quantifying the Effects of Short-Term Heat Stress at Booting Stage on Nonstructural Carbohydrates Remobilization in Rice. Crop J. 2020, 8, 194–212. [Google Scholar] [CrossRef]
  13. Morita, S.; Wada, H.; Matsue, Y. Countermeasures for Heat Damage in Rice Grain Quality under Climate Change. Plant Prod. Sci. 2016, 19, 1–11. [Google Scholar] [CrossRef]
  14. Shi, P.; Tang, L.; Wang, L.; Sun, T.; Liu, L.; Cao, W.; Zhu, Y. Post-Heading Heat Stress in Rice of South China during 1981–2010. PLOS ONE 2015, 10, e0130642. [Google Scholar] [CrossRef] [PubMed]
  15. Rani, B.A.; Maragatham, N. Effect of elevated temperature on rice phenology and yield. Indian J. Sci. Technol. 2013, 6, 5095–5097. [Google Scholar]
  16. Sanwong, P.; Sanitchon, J.; Dongsansuk, A.; Jothityangkoon, D. High Temperature Alters Phenology, Seed Development and Yield in Three Rice Varieties. Plants 2023, 12, 666. [Google Scholar] [CrossRef] [PubMed]
  17. Walter, A.; Silk, W. K.; Schurr, U. Environmental Effects on Spatial and Temporal Patterns of Leaf and Root Growth. Annu. Rev. Plant Biol. 2009, 60, 279–304. [Google Scholar] [CrossRef]
  18. Chen, Y.; Zhang, Z.; Tao, F.; Palosuo, T.; Rötter, R. P. Impacts of Heat Stress on Leaf Area Index and Growth Duration of Winter Wheat in the North China Plain. Field Crops Res. 2018, 222, 230–237. [Google Scholar] [CrossRef]
  19. Nagai, T.; Makino, A. Differences Between Rice and Wheat in Temperature Responses of Photosynthesis and Plant Growth. Plant Cell Physiol. 2009, 50, 744–755. [Google Scholar] [CrossRef] [PubMed]
  20. Hurkman, W. J.; Vensel, W. H.; Tanaka, C. K.; Whitehand, L.; Altenbach, S. B. Effect of High Temperature on Albumin and Globulin Accumulation in the Endosperm Proteome of the Developing Wheat Grain. J. Cereal Sci. 2009, 49, 12–23. [Google Scholar] [CrossRef]
  21. Piveta, L. B.; Roma-Burgos, N.; Noldin, J. A.; Viana, V. E.; Oliveira, C. de; Lamego, F. P.; Avila, L. A. de. Molecular and Physiological Responses of Rice and Weedy Rice to Heat and Drought Stress. Agriculture 2020, 11, 9. [Google Scholar] [CrossRef]
  22. Hilty, J.; Muller, B.; Pantin, F.; Leuzinger, S. Plant Growth: The What, the How, and the Why. New Phytol. 2021, 232, 25–41. [Google Scholar] [CrossRef]
  23. Paethaisong, W.; Lontom, W.; Dongsansuk, A. Impact of Short-Term Exposure to Elevated Temperatures on Physiology of Thai Rice (Cv. Riceberry). IOP Conf. Ser. Earth Environ. Sci. 2019, 346, 012083. [Google Scholar] [CrossRef]
  24. Prasertthai, P.; Paethaisong, W.; Theerakulpisut, P.; Dongsansuk, A. High Temperature Alters Leaf Lipid Membrane Composition Associated with Photochemistry of PSII and Membrane Thermostability in Rice Seedlings. Plants 2022, 11, 1454. [Google Scholar] [CrossRef]
  25. 25. Dongsansuk ,A.; Theerakulpisut, P.; Pongdontri, P. Short-term heat exposure effect on PSII efficiency and growth of rice (Oryza sativa L.). Pertanika J Trop Agric Sci. 2017, 40, 621–628.
  26. Pansarakham, P.; Pongdontri, P.; Theerakulpisut, P.; Dongsansuk, A. Effect of Short-Term Heat Exposure on Physiological Traits of Indica Rice at Grain-Filling Stage. Acta Physiol. Plant. 2018, 40, 173. [Google Scholar] [CrossRef]
  27. Prasad, P. V. V.; Boote, K. J.; Allen, L. H.; Sheehy, J. E.; Thomas, J. M. G. Species, Ecotype and Cultivar Differences in Spikelet Fertility and Harvest Index of Rice in Response to High Temperature Stress. Field Crops Res. 2006, 95, (2–3). [Google Scholar] [CrossRef]
  28. Sakata, T.; Takahashi, H.; Nishiyama, I.; Higashitani, A. Effects of High Temperature on the Development of Pollen Mother Cells and Microspores in Barley Hordeum Vulgare L. J. Plant Res. 2000, 113, 395–402. [Google Scholar] [CrossRef]
  29. Abiko, M.; Akibayashi, K.; Sakata, T.; Kimura, M.; Kihara, M.; Itoh, K.; Asamizu, E.; Sato, S.; Takahashi, H.; Higashitani, A. High-Temperature Induction of Male Sterility during Barley (Hordeum Vulgare L.) Anther Development Is Mediated by Transcriptional Inhibition. Sex. Plant Reprod. 2005, 18, 91–100. [Google Scholar] [CrossRef]
  30. Matsui, T.; Omasa, K.; Horie, T. High Temperature-Induced Spikelet Sterility of Japonica Rice at Flowering in Relation to Air Temperature, Humidity and Wind Velocity Conditions. Jpn. J. Crop Sci. 1997, 66, 449–455. [Google Scholar] [CrossRef]
  31. Jeng, T. L.; Tseng, T. H.; Wang, C. S.; Chen, C. L.; Sung, J. M. Starch Biosynthesizing Enzymes in Developing Grains of Rice Cultivar Tainung 67 and Its Sodium Azide-Induced Rice Mutant. Field Crops Res. 2003, 84, 261–269. [Google Scholar] [CrossRef]
  32. Aghamolki, M. T. K.; Yusop, M. K.; Oad, F. C.; Zakikhani, H.; Jaafar, H. Z.; Kharidah, S.; Musa, M. H. Heat Stress Effects on Yield Parameters of Selected Rice Cultivars at Reproductive Growth Stages. 2014. [Google Scholar]
  33. Tao, L.X.; Tan, H.J.; Wang, X.; Cao, L.Y.; Cheng, S.H. Effects of high temperature stress on super hybrid rice Guodao 6 during flowering and filling phases. China J. Rice Sci. 2007, 21, 518–524. [Google Scholar]
  34. Matsui, T.; Omasa, K.; Horie, T. The Difference in Sterility Due to High Temperatures during the Flowering Period among Japonica-Rice Varieties. Plant Prod. Sci. 2001, 4, 90–93. [Google Scholar] [CrossRef]
  35. Fitzgerald, M. A.; McCouch, S. R.; Hall, R. D. Not Just a Grain of Rice: The Quest for Quality. Trends Plant Sci. 2009, 14, 133–139. [Google Scholar] [CrossRef] [PubMed]
  36. Ishimaru, T.; Horigane, A. K.; Ida, M.; Iwasawa, N.; San-oh, Y. A.; Nakazono, M.; Nishizawa, N. K.; Masumura, T.; Kondo, M.; Yoshida, M. Formation of Grain Chalkiness and Changes in Water Distribution in Developing Rice Caryopses Grown under High-Temperature Stress. J. Cereal Sci. 2009, 50, 166–174. [Google Scholar] [CrossRef]
  37. Lang, N. T.; Ha, P. T. T.; Tru, P. C.; Toan, T. B.; Buu, B. C.; Cho, Y.-C. Breeding for Heat Tolerance Rice Based on Marker-Assisted Backcrosing in Vietnam. Plant Breed. Biotechnol. 2015, 3, 274–281. [Google Scholar] [CrossRef]
  38. Coast, O.; Murdoch, A. J.; Ellis, R. H.; Hay, F. R.; Jagadish, K. S. V. Resilience of Rice (O Ryza Spp.) Pollen Germination and Tube Growth to Temperature Stress: Resilience of Rice Pollen to Temperature Stress. Plant Cell Environ. 2016, 39, 26–37. [Google Scholar] [CrossRef] [PubMed]
  39. Alduchov, O. A.; Eskridge, R. E. Improved Magnus Form Approximation of Saturation Vapor Pressure. J. Appl. Meteorol. 1996, 35, 601–609. [Google Scholar] [CrossRef]
  40. Redona, D. Standard Evaluation System (SES) for Rice, 5th ed.; International Rice Research Institute, Los Baños: Laguna, Phillppines, 2013; p. 55. [Google Scholar]
  41. Mcmaster, G. Growing Degree-Days: One Equation, Two Interpretations. Agric. For. Meteorol. 1997, 87, 291–300. [Google Scholar] [CrossRef]
  42. Schreiber, U. Pulse-Amplitude-Modulation (PAM) Fluorometry and Saturation Pulse Method: An Overview. In Chlorophyll a Fluorescence; Papageorgiou, G. C., Govindjee, Eds.; Advances in Photosynthesis and Respiration; Springer Netherlands: Dordrecht, 2004. [Google Scholar] [CrossRef]
  43. Pandey, R.; Paul, V.; Madurima, D.; Meena, M.; Meena, R.C. Plant Growth Analysis. Manual of ICAR Sponsored Training Programme on Physiological Techniques to Analyze the Impact of Climate Change on Crop Plants. , Division of Plant Physiology.; IARI.; New Delhi pp.103–107. 16–25 January. [CrossRef]
  44. Chen, X.; Chen, M.; Lin, G.; Yang, Y.; Yu, X.; Wu, Y.; Xiong, F. Structural Development and Physicochemical Properties of Starch in Caryopsis of Super Rice with Different Types of Panicle. BMC Plant Biol. 2019, 19, 482. [Google Scholar] [CrossRef]
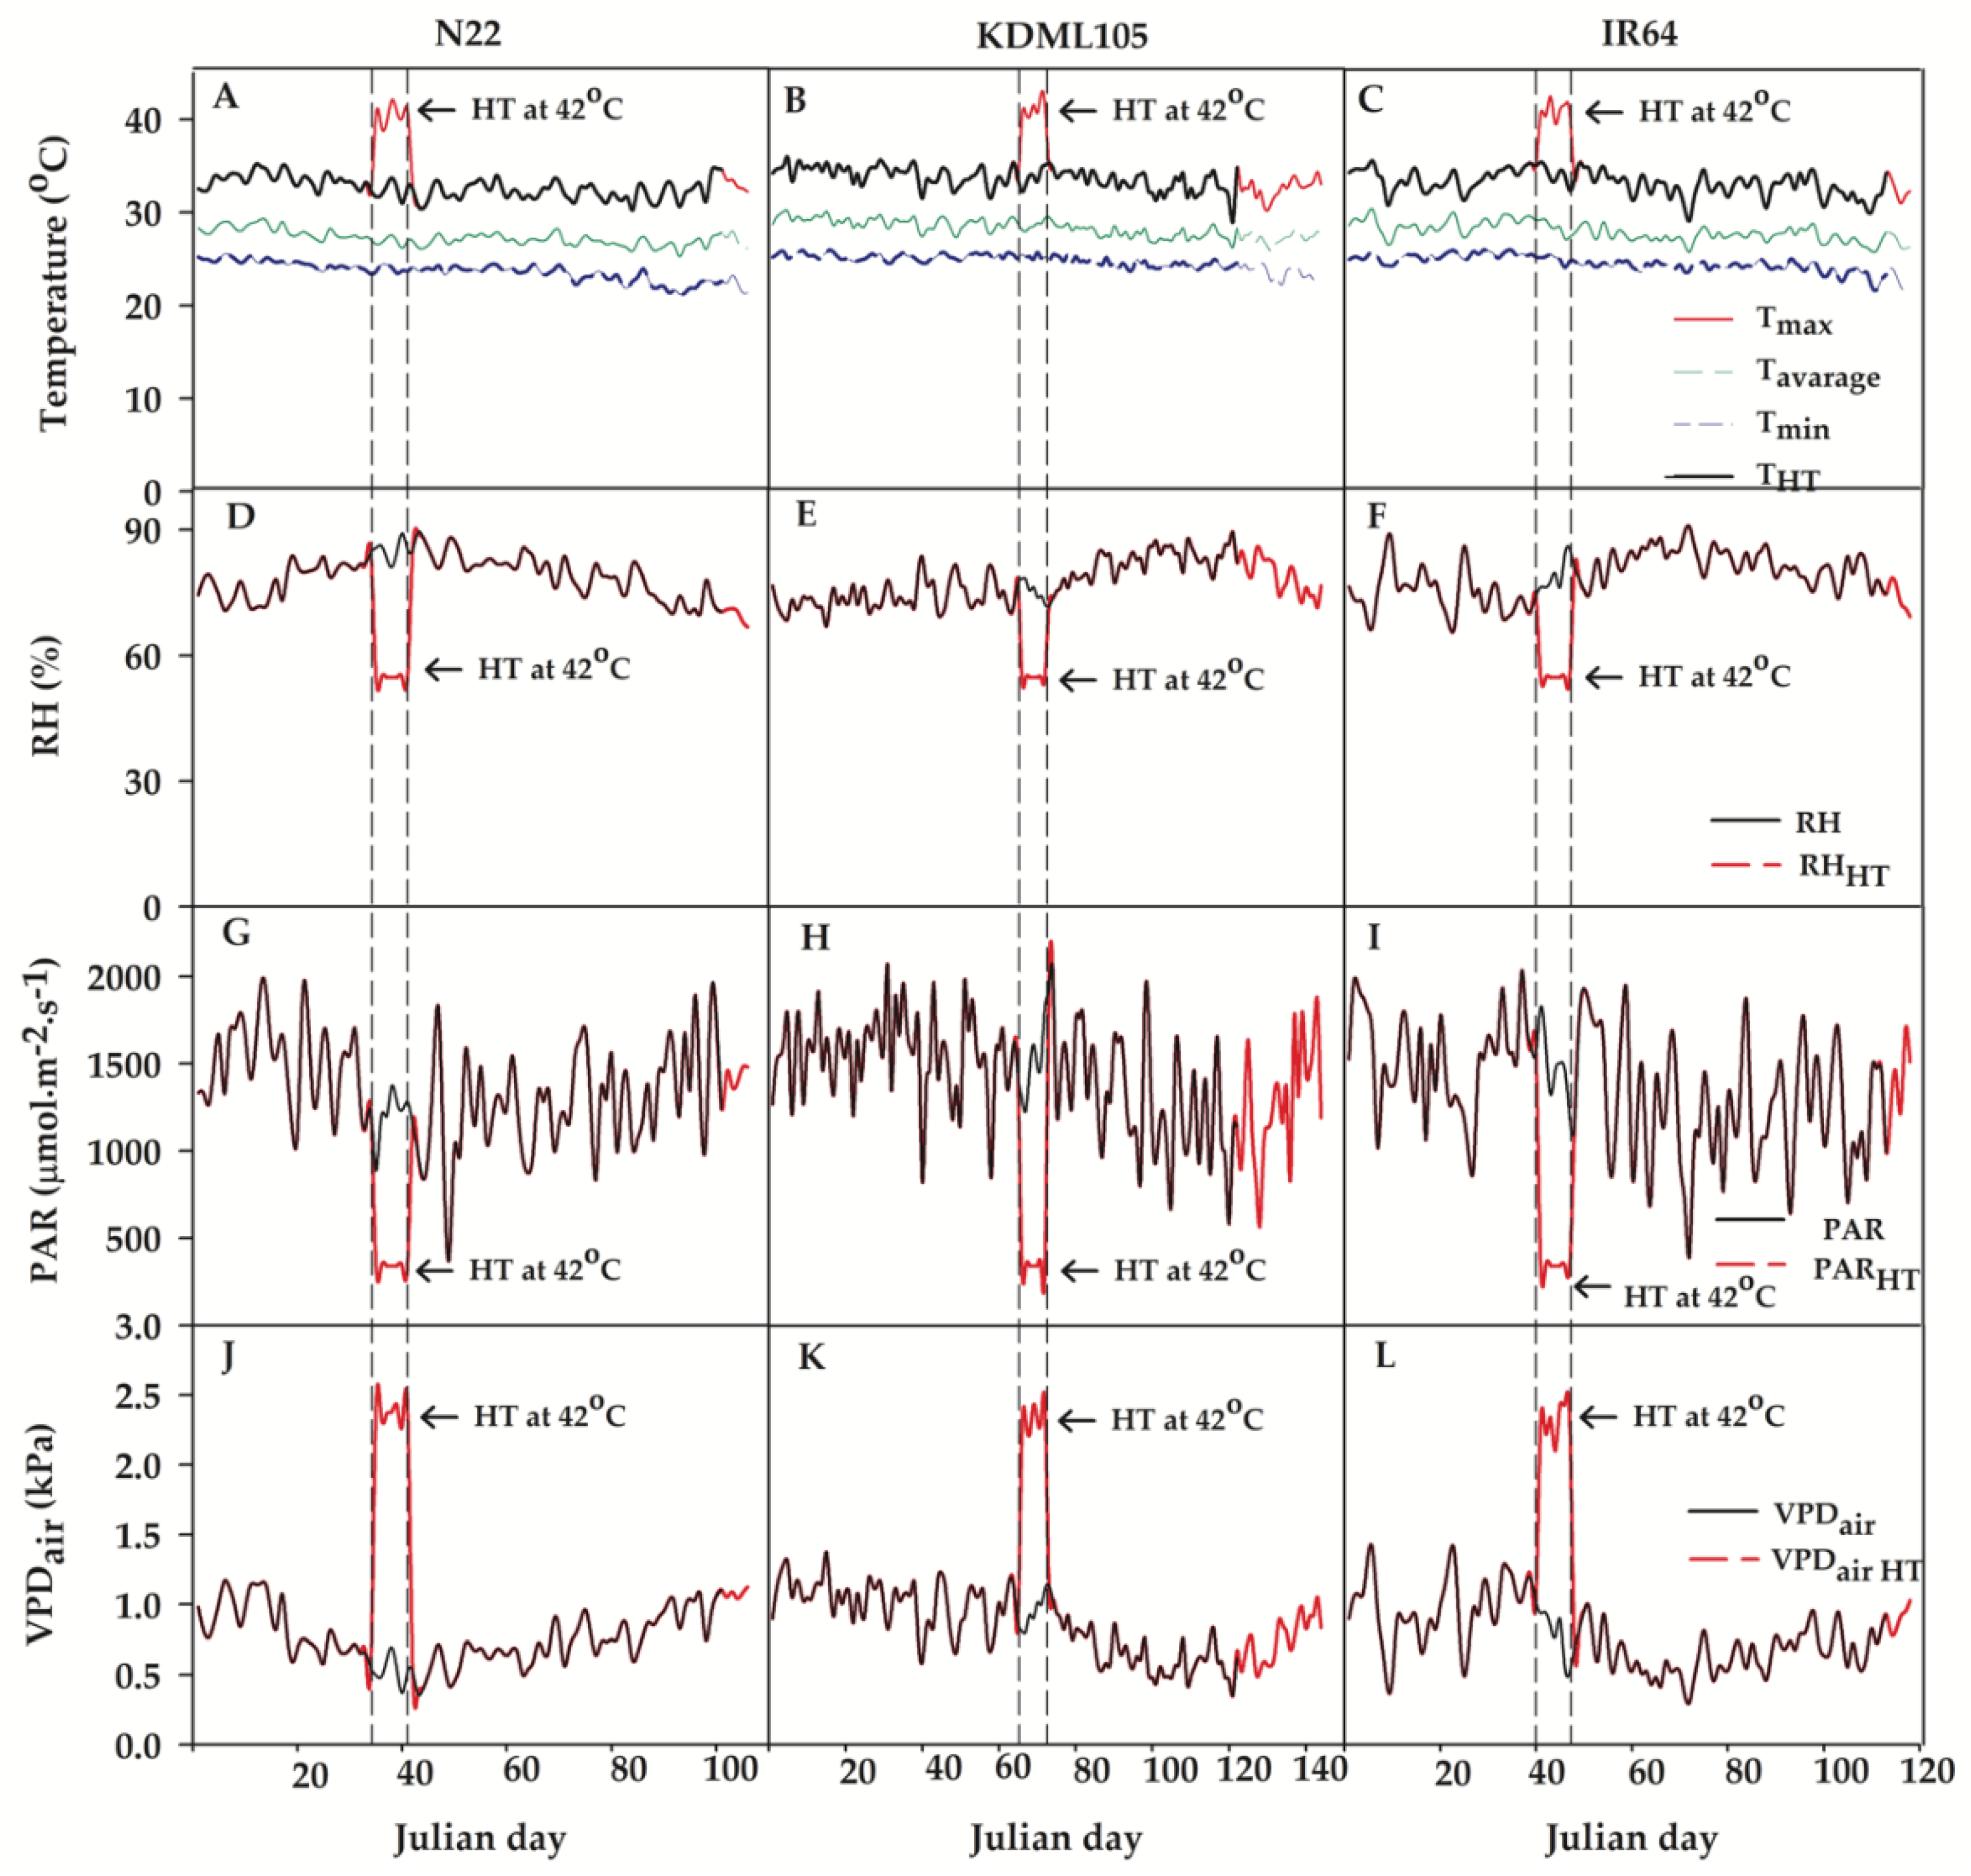
Figure 1. Climate conditions including maximum (Tmax), average (Taverage) and minimum (Tmin) temperature, relative humidity (RH), PAR, and VPDair in surrounding rice cvs. N22 (A, D, G and J) KDML105 (B, E, H and K) and IR64 (C, F, I and L) cultivated in the open greenhouse, Khon Kaen University, Khon Kaen, Thailand from 20th May to 19th November 2021. The column flanked by the vertical dash lines indicated the climatic conditions in the in the growth chamber during the 7 days of heat stress treatment.
Preprints 75682 g001
Figure 2. AGDD under control (A, B and C) and booting heat stress (D, E and F) influences phenology shift of three different rice cultivars (N22, KDML105 and IR64). The effect of GDD under control or booting heat stress on phenology shift in N22 (G), KDML105 (H) and IR64 (I). The comparison of phenology among cultivars in the control (J) and booting heat stress (HT) (K). Asterisk (*) shows significant difference by independent samples t-test at p≤0.05, (means±SE, n = 3–4).
Preprints 75682 g002
Figure 3. Effect of booting heat stress (HT) on maximum quantum yield of PSII efficiency (Fv/Fm) (A, B, C), effective quantum yield of PSII efficiency (∆F/Fm’) (D, E, F), net photosynthetic rate; A (G, H, I), stomatal conductance; gs (J, K, L), and transpiration rate; E (M, N, O) at different developmental stages of N22 (A, D, G, J, M), KDML105 (B, E, H, K, N) and IR64 (C, F, I, L, O). Asterisk (*) shows significant difference between control and booting HT at each growth stage by independent samples t-test at p≤0.05. Different capital and small letters indicate significant difference among different growth stages according to Duncan’s multiple range tests (DMRT) at p≤0.05 for control or booting heat stress (HT), respectively, (means±SE, n = 3–4).
Preprints 75682 g003
Figure 4. Growth performance including CGR, SGR, LGR, and RGR of different rice cultivars after booting heat exposure in N22 (A,D,G,J), KDML105 (B,E,H,K) and IR64 (C,F,I,L). Asterisk (*) indicates significant difference by independent samples t-test at p≤0.05. Different capital and small letters indicate significant difference among different growth stages according to Duncan’s multiple range tests (DMRT) at p≤0.05 for the control and booting heat stress (HT), respectively, (means±SE, n = 3–4).
Preprints 75682 g004
Figure 5. Characteristics of rice leaves including LA, LAI, SLA, and NAR of different rice cultivars after heat exposure at booting stage in N22 (A,D,G,J) KDML105 (B,E,H,K) and IR64 (C,F,I,L). Asterisk (*) indicates significant difference by independent samples t-test at p≤0.05. Different capital and small letters indicate significant difference among different growth stages according to Duncan’s multiple range tests (DMRT).
Preprints 75682 g005
Figure 6. Percentage of chalky grains in endosperm of different rice cultivars. Asterisk (*) indicates significant difference by independent sample t-test at p≤0.05. Different capital and small letters indicate significant difference among different rice cultivars according to Duncan’s multiple range tests (DMRT) at p≤0.05 in each control or heat stress (HT) exposure, respectively, (means±SE, n = 3–4).
Preprints 75682 g006
Figure 7. Pearson’s correlation among phenology, photosynthesis, growth rate, yield components and yields of N22 (A), KDML105 (B) and IR64 (C) treated with booting heat stress. Asterisks (*, **) indicate significant difference by ANOVA at P ≤ 0.05 and 0.01, respectively. Green indicates positive correlation and orange indicates negative correlation.
Preprints 75682 g007
Figure 8. Summary diagram describing the level of tolerance/susceptible to heat stress (at 42°C , 3 h for 7 days at booting stage) based on leaf gas exchange, growth rate, phenology and quality and quantity of yield in three rice cultivars (N22, KDML105 and IR64). .
Preprints 75682 g008
Table 1. Net photosynthetic rate (A), stomatal conductance (gs) and transpiration rate (E) of three rice cultivars (N22, KDML105, and IR64) under control and booting heat stress (HT) (means ± SE, n = 3).
Geno-types Growth stage A gs E
Control HT % change Control HT % change Control HT % change
N22 Booting 27.18±1.02a ND ND 0.127±0.00b ND ND 5.765±0.11a ND ND
heading 22.22±0.56b* 17.79±0.22b -19.90 0.145±0.00ab* 0.119±0.00c -18.33 5.423±0.63a 5.243±0.38a -3.32
Milk grain 22.18±0.88b* 17.54±0.87b -20.92 0.155±0.01a* 0.104±0.00d -33.03 5.703±0.20a* 4.119±0.44b -27.77
Dough grain 25.02±0.72a* 17.76±0.46b -29.02 0.156±0.00a 0.143±0.00a -8.18 5.356±0.19a* 4.197±0.10b -21.64
PM 10.90±0.38c* 8.75±0.23c -19.67 0.084±0.01c 0.083±0.00e -1.22 3.265±0.25b 3.520±0.12b +7.81
KDML105 Booting 25.70±1.03b ND ND 0.512±0.06bc ND ND 4.748±0.18ab ND ND
heading 25.83±1.38b* 19.890±0.73b -23.01 0.613±0.05ab 0.566±0.08a -7.59 5.932±0.39ab 4.356±0.83 -26.56
Milk grain 29.49±0.52a* 26.349±0.89a -10.66 0.736±0.03a 0.529±0.10a -28.12 6.260±1.57a 6.398±1.57 +2.21
Dough grain 26.84±0.10ab 24.853±1.49a -7.41 0.379±0.05cd 0.555±0.08a +46.29 4.927±0.44ab 3.808±0.59 -22.71
PM 16.37±0.07c* 8.891±0.49c -45.72 0.285±0.03d* 0.080±0.01b -71.89 3.574±0.02b 3.957±0.94 +10.72
IR64 Booting 26.12±1.19a ND ND 0.122±0.00c ND ND 5.235±0.03a ND ND
heading 24.65±0.46a* 17.06±0.22b -30.80 0.149±0.00b 0.124±0.01a -16.69 5.971±0.16a 5.277±0.37a -11.62
Milk grain 24.97±0.07a* 17.92±1.58b -28.23 0.155±0.01ab 0.141±0.01a -8.94 5.840±0.52a 5.261±0.37a -9.92
Dough grain 25.97±0.25a* 17.95±0.10b -30.88 0.166±0.00a* 0.139±0.01a -16.28 5.803±0.13a 4.888±0.47a -15.77
PM 12.01±0.75b* 10.32±0.05c -14.07 0.084±0.00d* 0.067±0.00b -20.68 3.709±0.02b* 2.800±0.21b -24.52
Asterisk (*) indicates significant difference between control and HT at p≤0.05 by independendent-samples t-test. Different small letters in the same column indicate significant difference between different growth stages in each rice cultivar at p≤0.05 by ANOVA and DMRT.
Table 2. Yield components and yield of three rice cultivars (N22, KDML105, and IR64) under control and booting heat stress (HT) (means ± SE, n = 3).
Geno–types No.Tiller.Hill–1 No.Seed.Panicle–1 Filled seed.Hill–1 1000 seed DW Yield (kg.rai–1) HI
control heat % change control heat % change control heat % change control heat % change control heat % change control heat % change
N22 21.50±0.29c 23.67±0.88c* +10.23a 103.00±0.58b* 82.00±1.15a -20.38a 715.50±28.57c* 558.50±8.95ab -21.75a 19.35±1.07b* 13.5±0.69b –29.89b 431.44±25.53b* 230.21±6.65c –46.17a 0.31±0.01b* 0.29±0.01a –10.06a
KDML105 38.00±0.58a* 33.00±0.00a –13.12b 103.50±2.06b* 77.00±1.73b –25.58b 1300.6±59.03a* 720.50±79.39a –43.92b 32.38±2.39a* 23.2±0.81a –27.46b 849.44±51.42a* 439.15±5.98a –47.97a 0.39±0.01a* 0.26±0.01b –32.83c
IR64 26.00±1.15b 29.5±0.87b* +14.05a 115.00±0.00a* 74.00±1.15b –35.63c 1123.5±89.26b* 429.33±14.85b –61.70b 23.06±0.71b 23.0±0.40a +0.13a 703.68±44.63a* 252.49±1.76b –65.20b 0.37±0.02a* 0.28±0.00a –24.30b
Means±SE 28.50±2.49 28.72±1.41 +3.72 107.17±2.06 77.67±1.35 –27.20 1064.5±89.26 569.44±48.21 –42.46 24.93±2.09 19.9±1.63 –19.08 670.52±65.57 307.28±33.23 –53.12 0.36±0.01 0.28±0.01 -22.40
Asterisk (*) indicates significant difference between control and HT at p≤0.05 by independendent-samples t-test. Different small letters in the same column indicate significant difference between different rice cultivars at p≤0.05 by ANOVA and DMRT.
Table 3. Temperature, relative humidity (RH) and light intensity control data in the temperature chamber (VRV.Corp.,Ltd., Thailand).
No. Timing
(h)
Temperature
(°C )
Relative humidity (RH)
(%)
Timing
(h)
Light intensity* (µmol.m–2. s–1)
1 00.00–03.00 27 66 06.00–07.00 70
2 03.00–07.00 26 70 07.00–08.00 115
3 07.00–09.00 29 61 08.00–09.00 200
4 09.00–10.00 35 51 09.00–10.00 265
5 10.00–12.00 38 46 10.00–11.00 340
6 12.00–15.00 42 41 11.00–13.00 390
7 15.00–17.00 40 43 13.00–14.00 340
8 17.00–18.00 37 50 14.00–15.00 265
9 18.00–21.00 33 57 15.00–16.00 200
10 21.00–00.00 32 62 16.00–17.00 115
11 17.00–18.00 70
12 18.00–06.00 0
Disclaimer/Publisher’s Note: The statements, opinions and data contained in all publications are solely those of the individual author(s) and contributor(s) and not of MDPI and/or the editor(s). MDPI and/or the editor(s) disclaim responsibility for any injury to people or property resulting from any ideas, methods, instructions or products referred to in the content.
Copyright: This open access article is published under a Creative Commons CC BY 4.0 license, which permit the free download, distribution, and reuse, provided that the author and preprint are cited in any reuse.
Prerpints.org logo

Preprints.org is a free preprint server supported by MDPI in Basel, Switzerland.

Subscribe

© 2024 MDPI (Basel, Switzerland) unless otherwise stated