
Submitted:
06 June 2023
Posted:
06 June 2023
You are already at the latest version
Abstract
We sought to compare native T1 mapping to conventional Late gadolinium enhancement (LGE) and T2-STIR techniques in a cohort of consecutive patients undergoing cardiac MRI (CMR).. CMR was performed in 323 patients, 206 males (64%), mean age 54±8 years and in 27 age- and sex- matched healthy controls. At T2-STIR images myocardial hyperintensity suggesting edema was found in 41 patients (27%). LGE images were positive in 206 patients (64%). T1 mapping was abnormal in 171 (49%). In 206 patients (64%) a matching between LGE and native T1 was found. T1 was abnormal in 32 out of 41 (78%) with edema at T2-STIR. Overall, LGE and/or T2-STIR were abnormal in 209 patients, whereas native T1 in 154(52%). Conventional techniques and T1 mapping were concordant in 208 patients (64%). In 39 patients T1 mapping was positive despite negative conventional techniques (12%). T1 mapping was able in conditions with diffuse myocardial damage as cardiac amyloidosis, scleroderma and Fabry disease (additive role in 42%). On contrast, T1 mapping was less effective in cardiac disease with regional distribution of myocardial damage as myocardial infarction, HCM, myocarditis. In conclusion, conventional LGE/T2-STIR and T1 mapping are complementary techniques and should be used together in every CMR examination.
Keywords:
cardiac magnetic resonance
; T1 mapping
; Late gadolinium enhancement
; T2-STIR
1. Introduction
Cardiovascular Magnetic Resonance (CMR) plays an increasingly crucial role in diagnosing cardiac diseases, serving as the gold standard imaging technique for assessing cardiac function and accurately measuring ventricular volumes and mass. What sets CMR apart is its unique ability to perform soft-tissue characterization [1]. CMR employs various conventional techniques such as T1-fast spin echo (FSE) with/without Fat Saturation, T2-Short-tau-inversion recovery (STIR) pulse sequence, and late gadolinium enhancement (LGE) technique to evaluate myocardial tissue. These techniques are effective in detecting fat infiltration/metaplasia, edema, and fibrosis, respectively. They have proven to be robust and reproducible. The integration of findings from these conventional techniques with morphological and functional features enables comprehensive diagnosis of myocardial diseases.
Certain features obtained by this technique, such as the presence, pattern of presentation, and extent of fibrosis, have been demonstrated to play a significant prognostic role in various cardiac conditions [2]. However, a notable limitation of these conventional techniques, particularly LGE and T2-STIR, is their qualitative or semiquantitative nature, allowing only a comparative analysis (hypointense, isointense, hyperintense) between normal and diseased myocardium.
The T1 mapping technique may overcome these limitations by measuring the intrinsic myocardial T1 relaxation time on a pixel-wise basis [3]. This means that every pixel on a T1 map represents an absolute T1 value, allowing for precise quantification. Abnormalities in myocardial T1, whether they are global or regional, are determined by comparing them to reference values expressed in milliseconds [4]. Consequently, T1 mapping has the potential to detect diffuse structural changes in the myocardium that may not be assessable by other non-invasive techniques, including LGE. This capability makes T1 mapping a valuable tool for identifying and characterizing subtle myocardial alterations that could have gone unnoticed using conventional imaging methods.
Non-contrast myocardial T1, often referred to as "native" T1, is a term used to distinguish it from post-contrast T1. The most important biological determinants of an increase in “native” T1 are edema (increase of tissue water in i.e. acute infarction, inflammation or acute toxic damage), and the increase of interstitial space for fibrosis (infarction, chronic myocarditis, cardiomyopathy etc) or for amyloidotic proteins deposition [5]. On contrast, the two most important causes of low native T1 values are lipid overload (i.e. Anderson-Fabry disease, lipomatous metaplasia) and iron overload [6].
T1 mapping technique may be performed using two different families of pulse sequence: those based on inversion recovery (IR), including the standard Look-Locker sequence, the MOdified Look-Locker Inversion Recovery (MOLLI) sequence, and the Shortened MOLLI (ShMOLLI) sequence; and those, less frequently used, based on a saturation recovery as the saturation recovery single-shot acquisition (SASHA) and the Saturation Pulse Prepared Heart-rate-independent Inversion Recovery (SAPPHIRE) [5]. The MOLLI technique is the most frequently used. It uses a steady state free precession (SSFP) readout that drives the IR to recover more quickly and reaches a steady state that is less than the equilibrium magnetization (M0). The effect of the readout is an apparent recovery time referred to as T1* which is less than the actual longitudinal recovery time, T1. The MOLLI method samples the IR curve at multiple inversion times using single shot imaging spaced at heart beat intervals. Multiple inversions are used with different trigger delays in order to acquire measurements at different inversion times to sample the IR curve more evenly. Recovery periods are needed between the inversions to ensure that samples from the different inversions are from the same recovery curve. The first method for MOLLI described is the 3(3)3(3)5, where number in parenthesis represents the number of heart beats for recovery of magnetization and the others the numbers of images acquired in different heart beats following a single IR pulse. Nowadays the most used approach is the 5(3)3. A number of protocol modifications (as the ShMOLLI technique), have been proposed to shorten the acquisition duration or to improve the accuracy or precision [4].
Post-processing methods play a crucial role in T1 mapping. To begin, the signal intensity of each voxel or group of voxels is measured in every image acquired at different inversion times [7]. These signal intensity values are then plotted against the inversion time, resulting in a curve. In IR-based techniques, the initial part of the curve exhibits a descending pattern until reaching the null point. To transform the curve into a negative exponential curve, this descending portion is inverted by assigning negative values. Next, a mathematical fitting process is applied to the curve. By fitting a mathematical equation to the curve, the T1 value is derived. This equation describes the behavior of the curve and allows for the calculation of T1 relaxation time. Finally, a gray-scale T1 map is generated by assigning a signal value corresponding to the respective T1 value at each voxel or group of voxels [3]. In visualization, these T1 maps are typically presented as parametric color maps, which can be displayed on workstations. The color map allows for a visual representation of T1 values, aiding in the interpretation and identification of variations in tissue characteristics.
T1 Mapping technique has some limitations: 1) the variability due to factors such as heart rate, motion artifacts, arrhythmias and imaging parameters and, mostly magnetic field inhomogeneity; 2) the lack of standardized reference values for myocardial T1 in the myocardium for which each CMR laboratory must create its own reference values; 3) in many cardiac conditions different phenomena may coexist as fibrosis, edema, inflammation, and even opposite phenomena (as fat and fibrosis) that may affect the myocardial T1 relaxation leading to false-positive or false-negative findings; 4) the additional time required for T1 mapping sequences can lead to longer scan durations, by which SCMR position document suggest to acquire only ventricular 3 short axis views for T1 mapping; 5) the differences in acquisition schemes have a direct effect on the range of normal and abnormal T1 with a given technique, which means that absolute T1 values can only be directly compared when they were obtained with the same acquisition scheme at the same field strength using the same post-processing methods [5].
The aim of the present study was to compare the diagnostic role of conventional CMR technique to native T1 mapping in a real-life cohort of non selected consecutive patients undergoing CMR.
2. Materials and Methods
A total of 340 consecutive patients, who underwent CMR for clinically suspect of cardiac diseases, from August 2019 to January 2020, and 27 healthy controls were included in this study. We excluded patients with sub-optimal images. The final population included 323 patients. The study was conducted in accordance with the Declaration of Helsinki, and approved by the Ethics Committee of the Area Vasta Nord-Ovest (protocol code 0016706 of 26/9/2018) Informed consent was obtained from all subjects involved in the study.
2.1. CMR protocol
All CMR exams were performed on a 1.5 T scanner (Artist, GE Healthcare, Milwaukee, Wisconsin) using dedicated cardiac software, a phased-array surface receiver coil and vectorcardiogram triggering. According to the protocols recommended by the Society for Cardiovascular Magnetic Resonance, we acquired cine steady-state free precession (cine-SSFP) images, T1-FSE with and without Fat-saturation, T2-STIR , and LGE at 10 min after gadolinium injection in the short-axis (9-13 images covering the entire LV), 2-chamber, and 4-chamber planes. Short axis cine-SSFP images were acquired immediately after gadolinium injection for hyperaemia assessment. The same protocol was repeated at CMR-II. According to the protocols recommended by the Society for Cardiovascular Magnetic Resonance [8], we acquired T1 mapping sequence using a MOdified Look-Locker Inversion Recovery (MOLLI) method with 5(3)2 protocol where 5 images are acquired in consecutive heart beats after the first IR, then a recovery period of 3 heart beats intervals, and, finally, a new IR is followed by the acquisition of 3 other images.
We obtained three parallel short-axis slices, including the base, mid-¬cavity, and apex of the left ventricle, at the same cardiac phase (end diastole) [8].
2.2. CMR post-processing
All CMR studies were analyzed offline using a workstation with dedicated cardiac software and consensus was obtained among three experienced observers who were blinded to the clinical presentation results. To evaluate the LV global and regional function and calculate the LV mass, the endocardial and epicardial borders were manually drawn in the end-diastolic and end-systolic short-axis cine-SSFP images. Papillary muscles and trabeculations were not included in the myocardium. LV end-diastolic volume (EDV), LV end-systolic volume, EF, and LV mass were determined.
On T2-weighted images, edema was evaluated visually and confirmed as the ratio of signal intensity (SI) between the myocardium and the mean SI of the skeletal muscle was ≥2. The extent, diffuse or focal, and the pattern of distribution of edema, ischemic-like (transmural or subendocardial) or non-ischemic (sub-epicardial, midwall), was evaluated.
LGE was qualitatively evaluated as for edema: the ischemic pattern (subendocardial/transmural, confluent scar in a territory of distribution of one coronary artery) or non-ischemic pattern of distribution (i.e., subepicardial or mid-ventricular enhancement, not limited to a coronary artery territory) was recorded. The presence of LGE was evaluated measured using a previously validated method. Criteria for CMR diagnosis of different cardiac conditions are showed in tables 1 and 2 (9-24).
Absolute T1 values were directly compared with local sex- and age- reference range obtained using the same acquisition scheme with the same MRI machine strength and pulse sequence parameters and the same post-processing method. To measure average myocardial T1 times, epicardial and endocardial contours of LV were manually traced. The average value of all the global LV myocardium was measured. Also, by the visual assessment of the obtained T1 maps, regions of interest (ROIs) were traced in myocardial areas with abnormal native T1 and the respective T1 value measured. In presence of abnormal T1 value, the abnormalities were classified as: 1) increased or decreased native T1; 2) diffuse or focal T1 abnormalities [6].
2.3. Statistical analysis
Values are presented as the mean ± SD or as the median and interquartile range (IQR) for variables with normal and non-normal distributions, respectively. Values with non-normal distribution according to the Kolmogorov-Smirnov test were logarithmically transformed for parametric analysis. Qualitative data are expressed as percentages. Categorical variables were compared using the Chi-square test or Fisher’s exact test when appropriate. Continuous variables were compared by the Student’s independent t-test and ANOVA or by the Wilcoxon non-parametric test when appropriate. A p-value lower than 0.05 was considered statistically significant.
3. Results
The final population included 323 patients, 206 males (64%), mean age 54±18 years. The baseline characteristics are showed in table 3. Briefly, the main indications for CMR were: suspect of arrhythmogenic cardiomyopathy (ARC) in 20% of cases; non-ischemic dilated cardiomyopathy (DCM) in 19%; hypertrophic cardiomyopathy (HCM) in 16%; chest pain without obstructive coronary artery in 14% of patients; other indications (amyloidosis, scleroderma, previous myocardial infarction, pericarditis, LV non compaction etc) in the remaining of cases. We also included 27(8%) of age- and sex- matched healthy controls. As evident in table 4, conventional T2-STIR images, that were acquired in 154 patients, showed myocardial hyperintensity compatible for edema in 41 patients (27%) of patients. Myocardial fat infiltration/metaplasia in T1-FSE with/without Fat Sat was found in 20 patients, all of them having a positive non-ischemic LGE. LGE was positive in 206 (64%) of patients with an ischemic pattern of distribution in 20 (6%), non-ischemic in 183(57%), while a specific LGE pattern for cardiac amyloidosis was found the remaining 3 patients (1%).
At T1 mapping, the average native T1 was 1040±55 msec. 65(20%) showed a global increase of native T1 (mean T1 1232±85 msec), while it was decreased in 11 (3%) patients (mean T1 885±85 msec). A regional increase of native T1 was found in 160 (46%), 52 of them with global increase of T1 values.
3.1. Conventional CMR vs T1 mapping
Among the 41 patients with signs of myocardial edema at T2-STIR, 32(78%) had also increase of regional native T1, then in 9 patients, edema was not associated with a consistent increase of T1. Overall, in 185(57%) patients a matching between T2-STIR and native T1 was found.
T1 was normal in 74 (36%) patients with positive LGE and abnormal in 33 with negative LGE. Overall a perfect matching between these 2 techniques was found in 206 (64%) patients (both positive in 132, both negative in 74 patients). No significant differences were found for the pattern of LGE: native T1 was increased in 118 out of 186 patients (63%) with non-ischemic LGE vs 14 out of 20 (65%) with ischemic pattern (p = 0.81). Native T1 was normal in 2 out of 10 patients without gadolinium injection.
Among the 33 patients with abnormal T1 and negative LGE, only 4 (12%) had edema at T2 STIR images.

Table 1.
Clinical indications and diagnostic features (part 1).
| Clinical Indication | Morphologic features (Cine-SSFP) | Edema/Fat | LGE | Native T1 |
|---|---|---|---|---|
| DCM | LV dilation and dysfunction | Nonspecific pattern |
|
Slight diffuse increase |
| HCM |
|
Midwall edema in hypertrophied segments associated with LGE (40%) | Midwall distribution in hypertrophied segments (55-95%) | Focal increase of T1 only in scar region (55-95%) |
| ARC |
|
Fat infiltration /metaplasia |
|
|
| Myocarditis |
|
Non-ischemic pattern (85-100%) | Non-ischemic pattern (85-100%) | Increased |
| MINOCA |
|
Ischemic-like pattern (100% in acute phase) | Ischemic presentation with potential no-reflow (hypointensity within hyperintense regions) (100%) |
|
| Tako-tsubo | Regional wall motion abnormalities in apical segments (apical ballooning) | Transmural in apical regions (100% in acute phase) | Absent | Increased in apical regions |
LGE, late gadolinium enhancement; DCM, dilated cardiomyopathy; HCM, Hypertrophic cardiomyopathy; ARC, arrhythmogenic cardiomyopathy; MINOCA, myocardial infarction with non-obstructed coronary arteries.
Table 2.
Clinical indications and diagnostic features (part 2).
| Clinical Indication | Morphologic features (Cine-SSFP) | Edema | LGE | Native T1 |
|---|---|---|---|---|
| Scleroderma | Non specific | Diffuse/Focal edema in active inflammation (possible) |
|
Diffuse/Focal increase |
| Amyloidosis |
|
Nonspecific pattern | Specific pattern:
|
Diffuse increase |
| Myocardial infarction |
|
|
Ischemic presentation
|
|
| Fabry disease |
|
Nonspecific pattern |
|
|
| Dystrophy |
|
Nonspecific pattern | Non-ischemic pattern (10-20%) |
|
| Pericarditis |
|
Hyperintensity of pericardial layers in pericarditis (80%) |
|
Unknown |
LGE, late gadolinium enhancement.
Table 3.
functional characteristics.
| Indication | n. | Males | Age | LV EF | LV EDVi | RV EF | RV EDVi |
|---|---|---|---|---|---|---|---|
| DCM | 61 (18.9) | 47 (77) | 59±14 | 43.15±14.58 | 112.56±35.31 | 56.16±11.54 | 78.21±21.39 |
| HCM | 51 (15.8) | 35 (69) | 60±13 | 67.43±11.31 | 73.80±21.64 | 65.29±7.94 | 69.59±21.74 |
| ARC | 63 (19.5) | 43 (68) | 40±17 | 65.08±7.64 | 87.79±16.22 | 60.74±7.38 | 91.79±19.85 |
| Myocarditis | 44 (13.6) | 29 (66) | 50±20 | 61.34±9.04 | 77.86±18.39 | 61.61±5.93 | 76.09±17.55 |
| Scleroderma | 21 (6.5) | 2 (10) | 56±15 | 61.29±16.71 | 76.81±16.97 | 62.38±7.51 | 75.19±16.48 |
| Amyloidosis | 17 (5.3) | 9 (53) | 76±8 | 63.06±14.25 | 70.94±20.64 | 66.76±9.48 | 59.94±12.43 |
| Myocardial infarction (acute/chronic) | 15 (4.6) | 11 (73) | 62±15 | 49.73±16.42 | 89.60±27.13 | 63.80±8.17 | 61.47±14.73 |
| Dystrophy/Miasteny/Mitochondrial | 8 (2.8) | 7 (85) | 41±17 | 62.00±9.51 | 70.67±20.56 | 62.78±9.68 | 65.44±15.62 |
| Pericarditis-Pericardial effusion | 6 (1.9) | 2 (33) | 46±13 | 66.50±10.21 | 80.50±15.14 | 66.67±6.95 | 71.83±13.06 |
| LV Non-compaction | 4 (1.2) | 2 (50) | 39±21 | 65.50±10.63 | 83.25±11.21 | 58.75±7.41 | 87.75±16.32 |
| Systemic sarcoidosis | 3 (0.9) | 1 (33) | 56±9 | 46.67±21.01 | 74.00±3.61 | 38.00±22.61 | 97.00±32.51 |
| Fabry | 1(0.3) | 1(100) | 45 | 65 | 70 | 63 | 72 |
| Pulmonary hypertension | 1 (0.3) | 1 (100) | 58 | 57 | 83 | 49 | 81 |
| Valvular disease | 1 (0.3) | 1 (100) | 77 | 58 | 88 | 70 | 78 |
| Healthy controls | 27 (8.4) | 16 (59) | 51±18 | 67.15±6.73 | 78.44±18.25 | 63.59±7.00 | 78.07±19.48 |
DCM, dilated cardiomyopathy; HCM, Hypertrophic cardiomyopathy; ARC, arrhythmogenic LV, left ventricle; RV, left ventricle; EDVi, end-diastolic volume index; EF, ejection fraction.
3.2. Diagnostic role of T1 mapping
Overall, the CMR findings confirmed the initial suspicion in 149 patients (50%), yielded an alternative diagnosis in 41(14%), were nonspecific (not allowing a definitive diagnosis) in 78(26%) and completely negative in 28(10%) (table 5).
Figure 1.
Concordance between conventional technique and T1 mapping in the whole population.
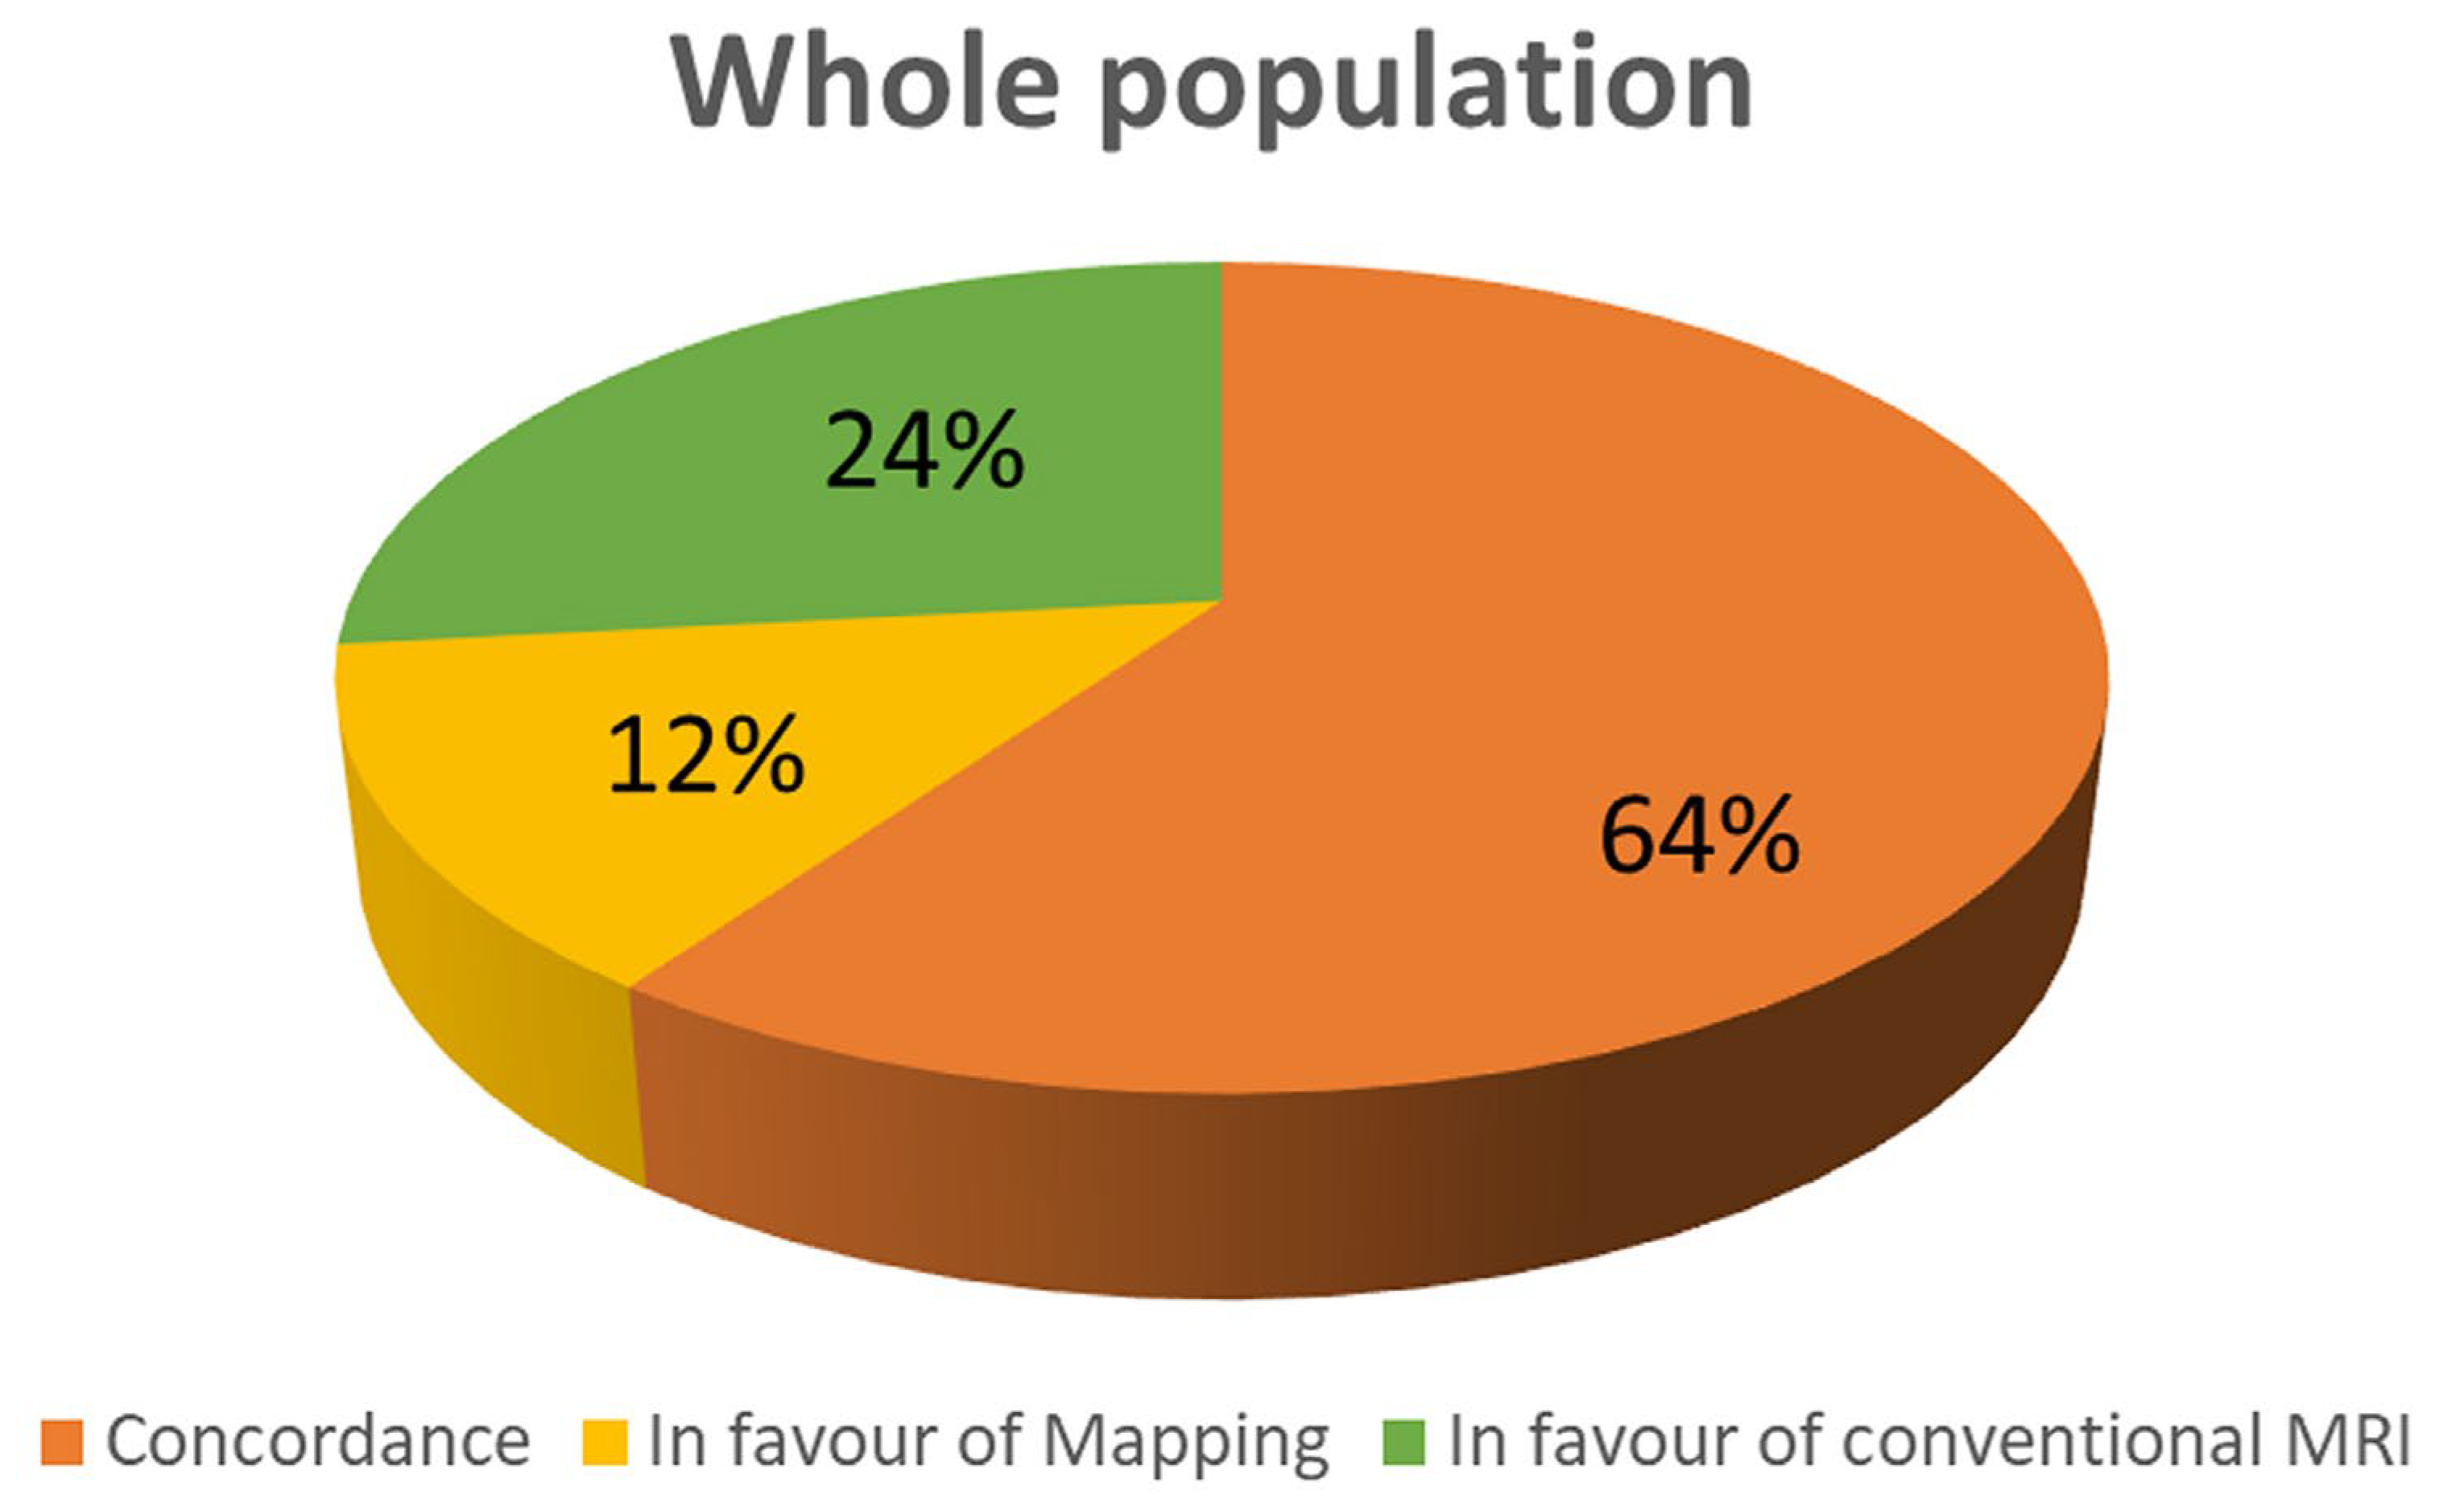
Conventional CMR techniques (LGE and/or T1-FSE and/or T2-STIR) were positive in 209 patients (71%), while native T1 was abnormal in 154(52%) of patients (p<0.0001). As evident in figure 1, mapping and conventional techniques we concordant in 208 patients (64%); in 76 patients (24%) conventional imaging was positive in presence of normal T1 values; in 39 patients T1 values were abnormal despite negative findings in conventional CMR (12%).
Interestingly, in the suspicion of myocarditis conventional techniques a concordance between conventional techniques and T1 mapping was found in 50% of patients, whereas all the remaining patients had positive conventional CMR but negative T1 mapping (figure 3). In patients with myocarditis conventional techniques were more frequently positive than T1 mapping (p<0.0001). Similar results were found in case of myocardial infarction, where a concordance was showed in 79%, whereas positive conventional techniques with negative mapping was in 21%. In both of these two conditions, mapping had no additive role over conventional techniques.
On the contrary, opposite results were found about amyloidosis and scleroderma where native T1 was abnormal in all the patients (figure 2). Particularly abnormal T1 was the only finding in respectively 17% and 47% of patients. T1 mapping was more frequently positive in scleroderma than conventional techniques (p<0.0001).
Figure 2.
Concordance between conventional technique and T1 mapping in different subgroups.
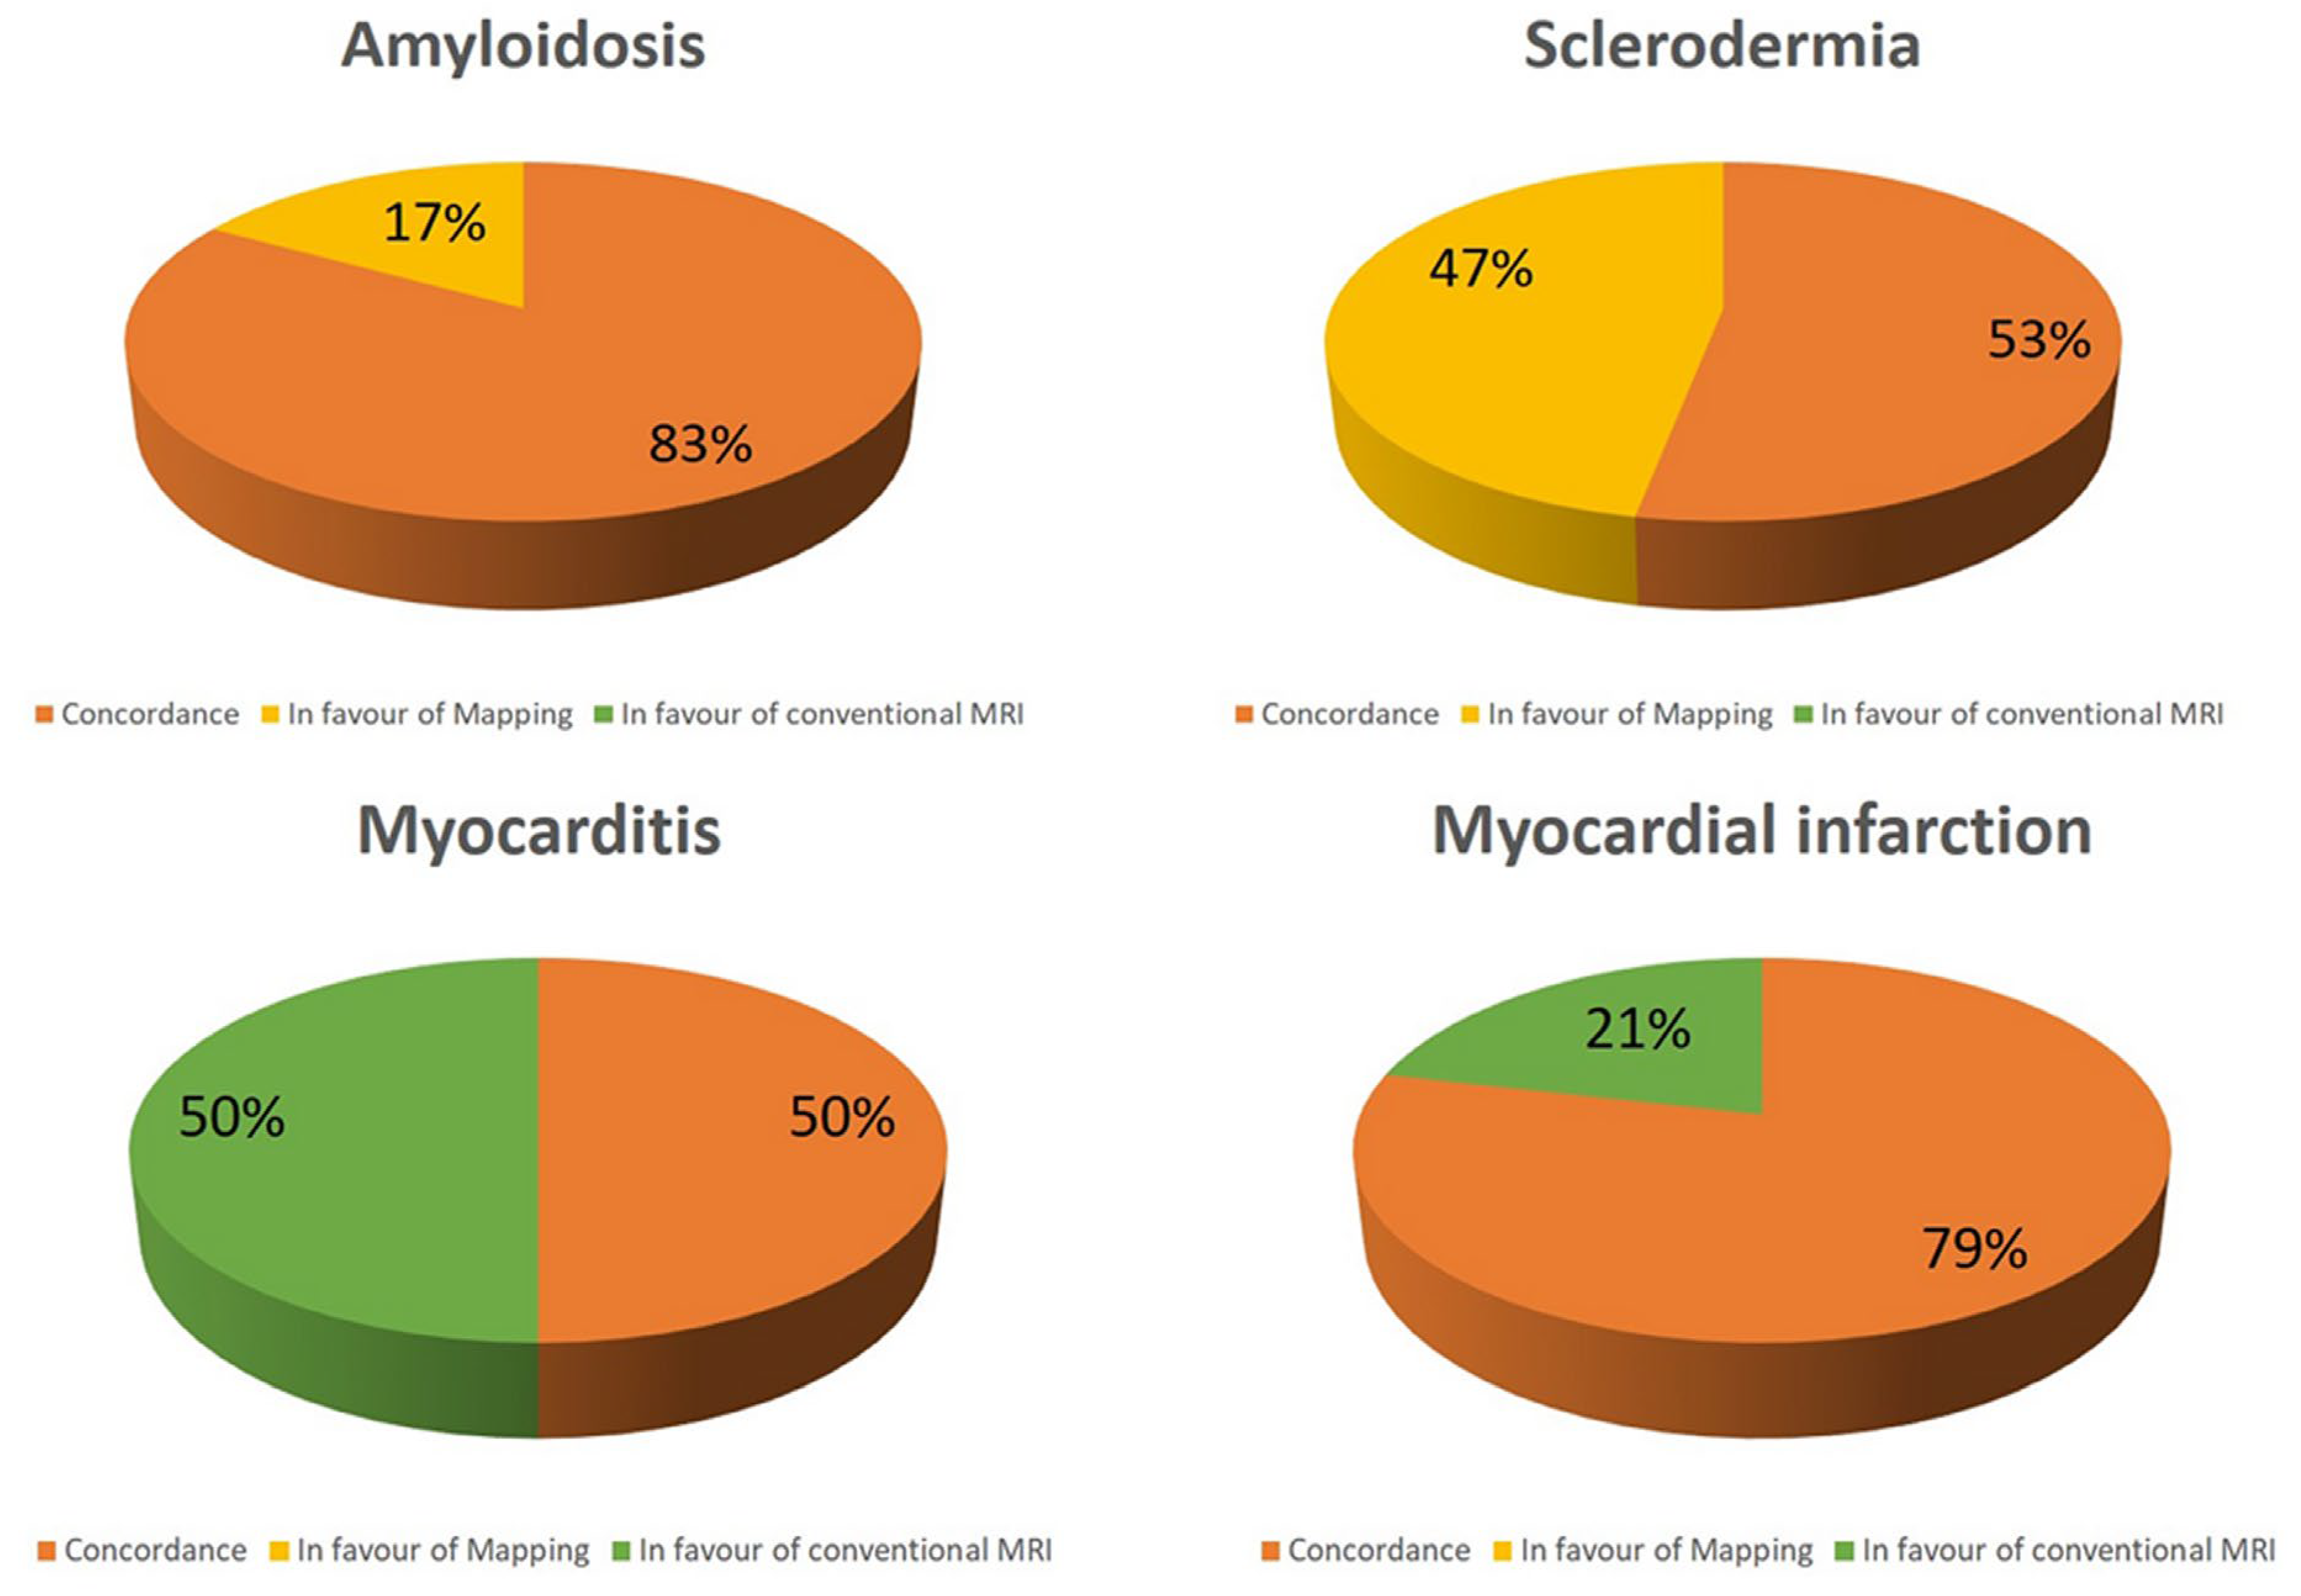
Figure 3.
Concordance between conventional technique and T1 mapping in different subgroups.
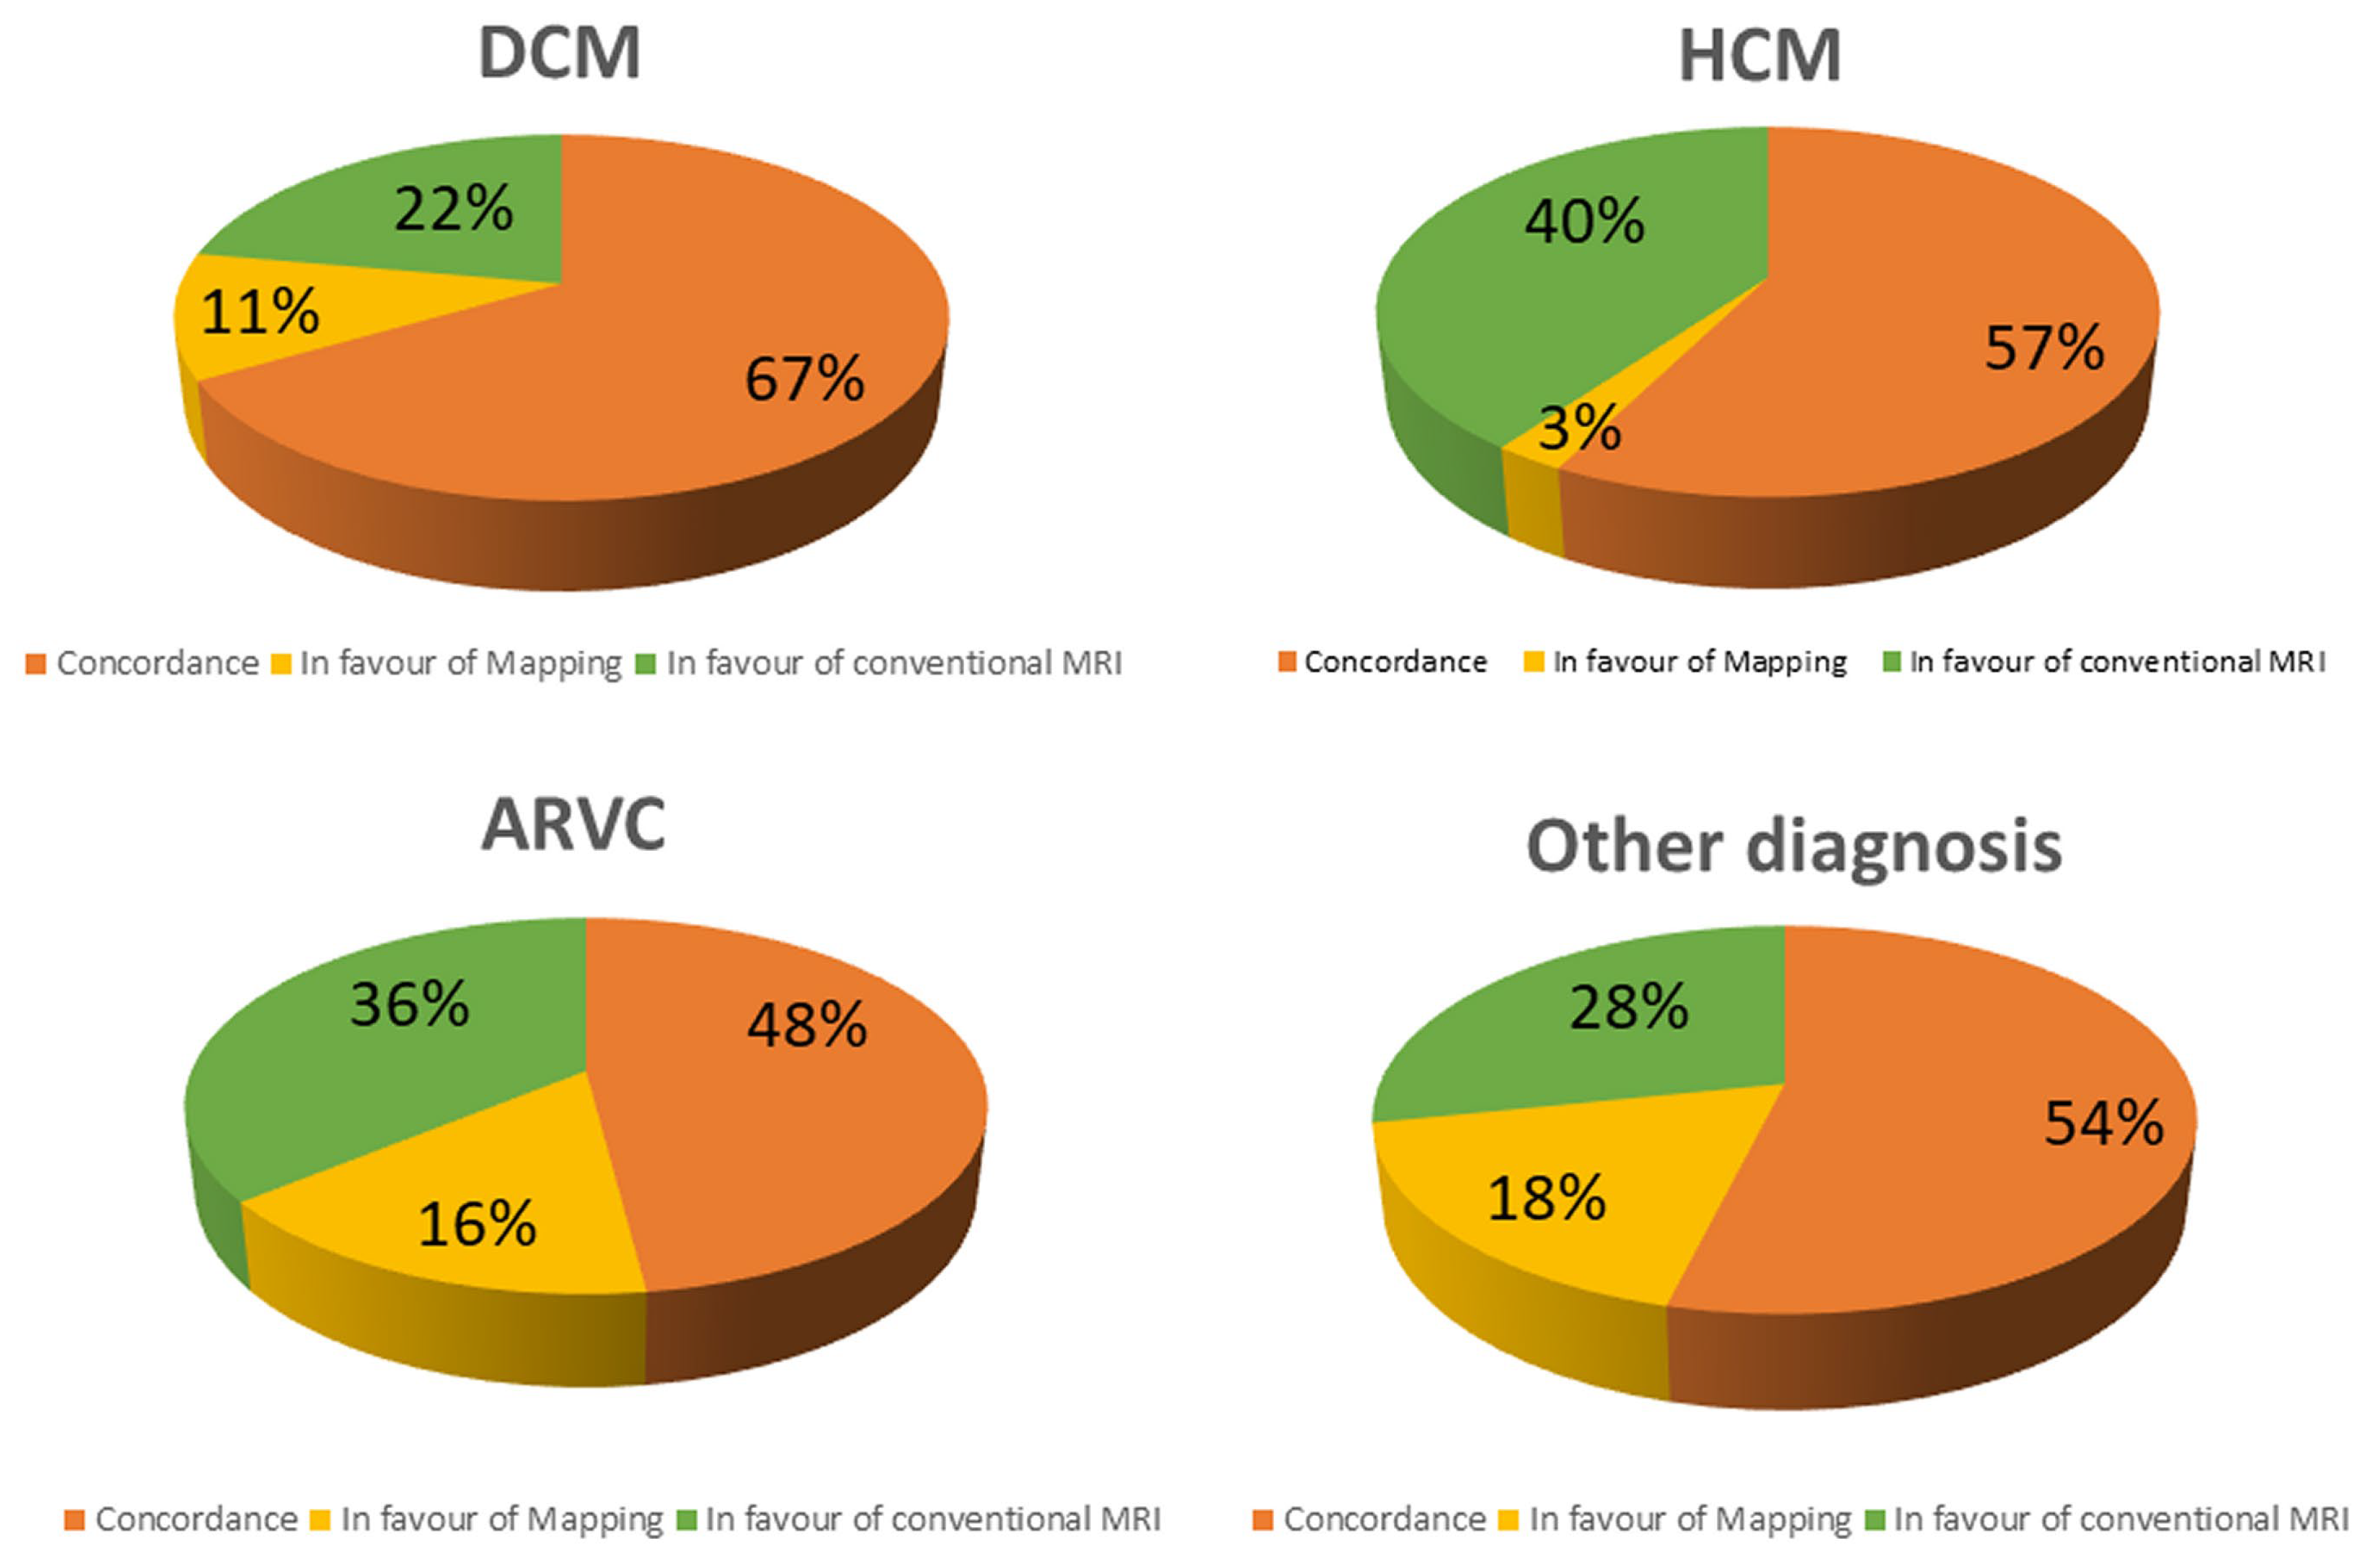
Abnormal T1 mapping was the only CMR abnormality in 11% of DCM, in 3% of HCM, 16% of ARC and in 18% of other conditions (figure 3). On contrast, native T1 was within the range of normality despite a positive LGE and/or T2-STIR in 22% of DCM, 40% of HCM, 36% of ARC and in 28% of other conditions.
In HCM, myocardial abnormalities were more frequently detected using conventional techniques than with T1 mapping (p =0.0006).
3.3. Diffuse vs regional myocardial damage
T1 mapping was more able to give additive information than conventional techniques in cardiac diseases with diffuse myocardial damage as scleroderma, amyloidosis and Fabry disease. In these conditions, T1 mapping was abnormal in 24 out of 24 patients, demonstrating an additive role over the conventional techniques in 10 patients (42%).
On contrast, T1 mapping was less effective in cardiac conditions with a regional\segmental distribution of myocardial damage as myocardial infarction, myocarditis and HCM. In these conditions T1 was abnormal in 52 out of 88 patients (58%) but only in one of them (1%) demonstrated and additive role. Conventional techniques had an additive role in 36 patients (41%).
Explanation of the low effectiveness of T1 mapping in regional myocardial damage could refer to the limited coverage of LV myocardium. Indeed, T1 mapping was acquired in 3 short axis slices, covering an average of 17±4% of LV mass.
Table 4.
CMR findings of conventional sequences and T1 mapping.
| Indication | T2-STIR+ | LGE+ | T1 Regional abnormality | Mean T1 |
|---|---|---|---|---|
| DCM | 1 (1.6) | 44 (73.3) | 37 (60.7%) | 1050±44 |
| HCM | 2 (3.9) | 37 (74) | 19 (37.3%) | 1029±48 |
| ARVC | 2 (3.2) | 31 (50.8) | 19 (30.2%) | 1012±54 |
| Myocarditis | 27 (61.4) | 33 (75.0) | 25 (56.8%) | 1053±65 |
| Scleroderma | 4 (19.0) | 10 (50.0) | 18 (85.7%) | 1092±41 |
| Amyloidosis | 0 | 12 (70.6) | 11 (64.7%) | 1063±78 |
| Myocardial infarction (acute/chronic) | 3 (20.0) | 15 (100) | 11 (73.3%) | 1063±87 |
| Dystrophy/Miasteny/Mitochondrial disease | 0 (0.0) | 6 (66.7) | 6 (66.7%) | 1058±65 |
| Pericarditis-Pericardial effusion | 1 (16.7) | 1 (16.7) | 3 (50.0%) | 1105±102 |
| LV Non-compaction | 0 (0.0) | 4 (100) | 2 (50.0%) | 1059±76 |
| Systemic sarcoidosis | 1 (33.3) | 2 (66.7) | 2 (66.7%) | 1049±33 |
| Fabry | 0 | 1(100) | 1(100) | 827 |
| Pulmonary hypertension | 0 | 1 (100) | 0 (0.0%) | 1026 |
| Valvular disease | 0 | 1 (100) | 0 (0.0%) | 1018 |
| Healthy controls | 0 (0.0) | 9 (40.9) | 7 (25.9%) | 1034±29 |
DCM, dilated cardiomyopathy; HCM, Hypertrophic cardiomyopathy; ARC, arrhythmogenic, LV, left ventricle.
Table 5.
CMR findings divided by the initial suspicion.
| Initial suspicion | Specific findingsN (%) | Alternative diagnosisN (%) | Non-specific findingsN (%) | Negative CMRN (%) |
|---|---|---|---|---|
| DCM | 34 (55.7) | 7 (11.5) | 17 (27.9) | 3 (4.9) |
| HCM | 33 (64.7) | 2 (3.9) | 16 (31,4) | 0 |
| ARVC | 12 (19.0) | 11 (17.5) | 22 (34.9) | 18 (28.6) |
| Myocarditis | 22 (50) | 14 (31.8) | 6 (13.6) | 2 (4.6) |
| Scleroderma | 17 (80.9) | 0 | 3 (14.3) | 1 (4.8) |
| Amyloidosis | 5 (29.4) | 4 (23.5) | 6 (35.3) | 2 (11.8) |
| Myocardial infarction (acute/chronic) | 10 (66.7) | 1 (6.6) | 4 (26.7) | 0 |
| Dystrophy/Miasteny/ Mithocondrial disease | 8 (88.9) | 0 | 0 | 1 (11.1) |
| Pericarditis-Pericardial effusion | 4 (66.6) | 1 (16.7) | 1 (16,7) | 0 |
| LV Non-compaction | 1 (25) | 1 (25) | 2 (50) | 0 |
| Systemic sarcoidosis | 1 (33.3) | 0 | 1 (33.3) | 1 (33.3) |
| Fabry | 1(100) | 0 | 0 | 0 |
| Pulmonary hypertension | 1 (100) | 0 | 0 | 0 |
| Valvular disease | 1 (100) | 0 | 0 | 0 |
| Total | 149 (50.3) | 41 (13.8) | 78 (26.4) | 28 (9.5) |
DCM, dilated cardiomyopathy; HCM, Hypertrophic cardiomyopathy; ARC, arrhythmogenic
4. Discussion
In the present study we evaluated the clinical impact of T1 mapping as additive imaging tool in a cohort of non-selected patients undergoing CMR. The main results may be summarised as follows: 1) Conventional CMR for tissue characterization (LGE, T1-FSE and T2-STIR) and T1 mapping are complementary techniques in most of the cardiac conditions: they provide concordant findings in 64%; 2) native T1 mapping has an additive diagnostic role over conventional techniques in a range of 6-12% of cases; 3) in 24% of cases, conventional CMR techniques detected myocardial abnormalities despite normal native T1; 4) the role of T1 mapping is different in cardiac diseases: we found that T1 mapping is superior than conventional approach in cardiac conditions as amyloidosis, Fabry and scleroderma, characterized by a diffuse myocardial involvement; 5) conventional techniques are superior to mapping for the evaluation of myocardial disease with segmental distribution as myocardial infarction, hypertrophic cardiomyopathy and myocarditis.
T1 mapping is a quantitative CMR technique allowing voxel-wise quantification of myocardial native T1 [4]. Native T1 may be abnormal in different cardiac conditions based on the changes of myocardial content of water, proteins and fat [5]. Water is characterized by the greatest T1 values because of a fast “tumbling” rate of small, rapidly rotating molecules [1]. Then, myocardial T1 is mostly increased in presence of augment of free-water content as in myocardial edema. Myocardial edema may be found in myocarditis, acute/subacute myocardial infarction and in every case of recent myocardial damage [5,8,9]. Indeed, it was described also in hypertrophic cardiomyopathy, in cocaine-induced myocardial damage, in scleroderma and in many other conditions [1,10].
Increased native T1 may also be found in myocardial fibrosis because of augmented water content of interstitial space enlarged by the collagen matrix of scar [4].
Myocardial T1 is also severely increased in amyloid deposition [5,11], whereas it is decreased in presence of intramyocardial fat infiltration or in Fabry disease because of lysosomal sphingolipids accumulation [12,13].
By these premises, T1 mapping and conventional techniques, as LGE and T2-STIR, are overlapping in many cardiac conditions, as confirmed by the results of the present study where the concordance between these techniques is seen in 64% of patients. However, T1 mapping has some advantage over conventional techniques. Being a quantitative technique T1 mapping may allow identification of myocardial disease characterized by a diffuse and homogeneous damage, as evident in early stages of DCM, amyloidosis, Fabry disease and in scleroderma [5,11,12,13,14,15].
In the matter of fact, T1 mapping demonstrated and additive diagnostic role in 12% of patients who presented a negative LGE and T2-STIR but abnormal native T1.
We found that the value of T1 mapping is particularly relevant in some conditions as cardiac amyloidosis where it was positive in 17% more patients than LGE. In cardiac amyloidosis LGE has a very specific pattern, characterized by a diffuse subendocardial enhancement, an early darkening of signal of blood cavity and a null defect of myocardium. The specificity of this pattern is near to 100% but it may be absent in early stage of this disease [11]. Amyloid deposit is associated with a great increase of myocardial native T1 also in early stages. Then, the presence of diffuse increase of native T1, summed to concentric hypertrophy and other morphological signs, as thickening of atrial septal walls and pericardial effusion, and associated to clinical presentation, may allow diagnosis of amyloidosis even in absence of the specific LGE pattern.
Scleroderma is usually associated with edema and microscopic fibrosis (figure 4). Both of them may present with a diffuse, non-regional, distribution. Microscopic fibrosis could be not detected by LGE [5,23]. The identification of diffuse edema, as well, is very challenging using conventional, qualitative, T2-STIR pulse sequence because of lack of comparison with “normal” myocardium. In this setting, native T1 and ECV evaluation could be very useful. Native T1 was abnormal in all the patients with these conditions and an additive role of T1 mapping over conventional techniques was found in 47% of cases of scleroderma. T1 was found positive in a significant higher percentage of cases of scleroderma than LGE\T2-STIR.
Figure 4.
a case of scleroderma with negative LGE and T2-STIR image but with a diffuse increase of myocardial native T1 (normal range of T1 in green).
Figure 4.
a case of scleroderma with negative LGE and T2-STIR image but with a diffuse increase of myocardial native T1 (normal range of T1 in green).
T1 mapping was also instrumental for the diagnosis of the case of Fabry disease where conventional technique where completely normal (figure 5), with only a mild concentric hypertrophy but areas of low T1 were detected. In this case, alpha-galactosidase test confirmed the diagnosis [18,19,20].
Figure 5.
a case of Fabry disease with mild concentric hypertrophy and low T1 (blue region) with negative conventional techniques.
Figure 5.
a case of Fabry disease with mild concentric hypertrophy and low T1 (blue region) with negative conventional techniques.

An advantage of T1 mapping is the absence of contrast injection that is required for LGE technique. The nephrogenic systemic sclerosis, a rare complication of gadolinium-based contrast agents, is associated with severe kidney disease. Contrast injection in patients a severe reduction of glomerular filtration rate is potentially dangerous. The lack of LGE image make CMR less effective in rule-out cardiac disease and this is particularly relevant is subject with ventricular arrhythmias (as frequent PVC) with normal cardiac structure and function. In such conditions, the identification of myocardial fibrosis is very important because the prognosis depends on the presence of a structural myocardial disease [5,16]. T1 mapping may help to rule-out structural disease when LGE is not acquired because of renal condition or in case of refuse of injection by the patients.
On contrast, T1 mapping resulted less effective to identify abnormalities in conditions as myocarditis, small myocardial infarction or in case of non-ischemic fibrosis. Indeed, abnormal native T1 was found in 50% of patients with myocarditis, whereas LGE and/or T2-STIR were positive in all of these patients. Similarly, T1 native was abnormal 71% of acute\chronic myocardial infarction, while LGE was positive in all of these patients and T2-STIR in all of the patients with acute myocardial infarction.
A possible explanation of these findings may be found in some technical aspects of T1 mapping acquisition. T1 mapping images usually don’t cover the entire left ventricle but the SCMR position paper [8] suggest to acquire only 3 short axis views. In the present study we calculated the % of LV mass covered by these 3 short axis slices of T1 mapping and found an average coverage of 17±4% which is a big limitation of this technique particularly in cardiac conditions characterized by regional or focal myocardial damage. For instance, myocardial infarction has obviously a regional distribution which is confined to the vascularization territory of the culprit coronary artery [9]. Also, myocarditis could affect the whole myocardium, but the signs of myocardial damage may be focal or regionally distributed [8]. Thus, the 3-slices approach of T1 mapping may be inaccurate and less effective than other technique for which a complete coverage of LV is usually performed.
Recent modified Lake Louise criteria [24], included T1 and T2 mapping as diagnostic criteria and changed the original criteria by using a 2-out-of-2 approach: to diagnose myocarditis a “T2-based criterion”, as edema at T2-STIR or increased native T2, should be summed to a “T1-based criterion”, as LGE or ECV or increased native T1.
However, results of our study demonstrated that T1 mapping with the 3-short axis approach was not able to detect signal abnormalities associated with myocarditis because in most of cases the signs of myocardial damage were focal. Then, the effectiveness of the new Lake Louise criteria should be assessed by further larger population study.
The regional distribution of LGE and T2-STIR is also seen in HCM where hypertrophy is usually asymmetric and LGE and edema are mostly located in hypertrophic segments [10]. Then, it is not surprising that we found a significant difference in the prevalence of positive LGE and/or T2-STIR and abnormal T1 in HCM.
The main results of the present study were that T1 mapping had and additive diagnostic role in only 12% of patients and was ineffective in 24% of them. To interpret these results, other limitations of T1 mapping should be considered. Indeed, T1 mapping technique is far from being standardized because it is well known that difference of magnetic field shimming, of pulse sequence and parameters, of patient’s heart rate and of the algorithm of the post-processing software could modify the result of this technique.
Our results suggest that a complete CMR protocol cannot exempt anymore from T1 mapping technique. However, T1 mapping cannot substitute conventional approach based on LGE and T2-STIR techniques. T1 mapping could be used as substitute LGE only in presence of contraindication for contrast media.
4.1. Limitations
T1 mapping was acquired using only 3 short axis slice and, as discussed above, this approach intrinsically limited the effectiveness of T1 mapping to identify focal and/or regional myocardial tissue abnormalities. However, this was method indicated by the most recent SCMR consensus document [8].
We did not include T2- T2*- and ECV-mapping in the present study. T2-mapping was not available in our laboratory at the time we started the enrolment and in order to have homogeneous population we decided not to include T2 mapping data in the present study. T2* mapping was used in selected indications as in cardiac hemochromatosis or in the suspicion of hemorrhagic infarction, and we follow these indications and not acquired T2* in all the patients. Finally, ECV mapping required hematocrit obtained the day of CMR, we had this in only a minority of patients (60 patients) and we preferred not to include that data.
Finally, cardiac tumors and congenital heart disease, that are frequent indications for CMR, were not included in our population. However, we aimed to evaluate the effectiveness of T1 mapping in different cardiac diseases based on previous evidences. On contrast, the role of T1 mapping for the evaluation of cardiac tumors and congenital disease is still under evaluation.
5. Conclusions
Conventional CMR techniques and T1 mapping are complementary. Globally, T1 mapping may give additive information in 12% of patient but cannot substitute conventional techniques because it is less effective particularly in conditions presenting with regional or segmental distribution of myocardial damage. This limitation could be overcome by covering the entire myocardium with T1 mapping instead of a 3-short axis approach. However, T1 mapping is more effective than conventional techniques in cardiac conditions with diffuse myocardial damage as in early stage of scleroderma, Fabry disease and cardiac amyloidosis. Results of this study suggest that both conventional and mapping techniques should be acquired in all the patients but with a substantial increase of exam duration.
Author Contributions
Conceptualization, GDA and EN ; methodology, GDA and SM..; formal analysis, CDG.; investigation GDA, SM, MLP, GT, AB and CG; data curation, GDA; writing—original draft preparation, GDA and SM.; writing—review and editing,Rl, LF and DC.; supervision, EN and RL: All authors have read and agreed to the published version of the manuscript.
Funding
This research received no external funding.
Institutional Review Board Statement
The study was conducted in accordance with the Declaration of Helsinki, and ap-proved by the Ethics Committee of the Area Vasta Nord-Ovest (protocol code 0016706 of 26/9/2018.
Informed Consent Statement
Informed consent was obtained from all subjects involved in the study..
Data Availability Statement
he data presented in this study are available on request from the corresponding author.
Conflicts of Interest
The authors declare no conflict of interest.
References
- Haaf, P., Garg, P., Messroghli, D.R. et al. Cardiac T1 Mapping and Extracellular Volume (ECV) in clinical practice: a comprehensive review. J Cardiovasc Magn Reson 18, 89 (2017). [CrossRef]
- Aquaro GD, De Gori C, Faggioni L, Parisella ML, Cioni D, Lencioni R, Neri E. Diagnostic and prognostic role of late gadolinium enhancement in cardiomyopathies. Eur Heart J Suppl. 2023 Apr 26;25(Suppl C):C130-C136. [CrossRef]
- Taylor AJ, Salerno M, Dharmakumar R, Jerosch-Herold M. T1 Mapping: Basic Techniques and Clinical Applications. JACC Cardiovasc Imaging. 2016 Jan;9(1):67-81. [CrossRef]
- Burt JR, Zimmerman SL, Kamel IR, Halushka M, Bluemke DA. Myocardial T1 mapping: techniques and potential applications. Radiographics. 2014 Mar-Apr;34(2):377-95. [CrossRef]
- Kellman, P., Hansen, M.S. T1-mapping in the heart: accuracy and precision. J Cardiovasc Magn Reson 16, 2 (2014). [CrossRef]
- Radenkovic D, Weingärtner S, Ricketts L, Moon JC, Captur G. T1 mapping in cardiac MRI. Heart Fail Rev. 2017;22(4):415-430. [CrossRef]
- Barison A, Del Torto A, Chiappino S, Aquaro GD, Todiere G, Vergaro G, Passino C, Lombardi M, Emdin M, Masci PG. Prognostic significance of myocardial extracellular volume fraction in nonischaemic dilated cardiomyopathy. J Cardiovasc Med (Hagerstown). 2015 Oct;16(10):681-7. [CrossRef]
- Messroghli, D.R., Moon, J.C., Ferreira, V.M. et al. Clinical recommendations for cardiovascular magnetic resonance mapping of T1, T2, T2* and extracellular volume: A consensus statement by the Society for Cardiovascular Magnetic Resonance (SCMR) endorsed by the European Association for Cardiovascular Imaging (EACVI). J Cardiovasc Magn Reson 19, 75 (2017). [CrossRef]
- Ferreira VM, Piechnik SK, Dall'Armellina E, Karamitsos TD, Francis JM, Ntusi N, Holloway C, Choudhury RP, Kardos A, Robson MD, Friedrich MG, Neubauer S. T(1) mapping for the diagnosis of acute myocarditis using CMR: comparison to T2-weighted and late gadolinium enhanced imaging. JACC Cardiovasc Imaging. 2013 Oct;6(10):1048-1058. [CrossRef]
- Garg P, Saunders LC, Swift AJ, Wild JM, Plein S. Role of cardiac T1 mapping and extracellular volume in the assessment of myocardial infarction. Anatol J Cardiol. 2018;19(6):404-411. [CrossRef]
- Xu J, Zhuang B, Sirajuddin A, Li S, Huang J, Yin G, Song L, Jiang Y, Zhao S, Lu M. MRI T1 Mapping in Hypertrophic Cardiomyopathy: Evaluation in Patients Without Late Gadolinium Enhancement and Hemodynamic Obstruction. Radiology. 2020 Feb;294(2):275-286. [CrossRef]
- Quarta G, Aquaro GD, Pedrotti P, Pontone G, Dellegrottaglie S, Iacovoni A, Brambilla P, Pradella S, Todiere G, Rigo F, Bucciarelli-Ducci C, Limongelli G, Roghi A, Olivotto I. Cardiovascular magnetic resonance imaging in hypertrophic cardiomyopathy: the importance of clinical context. Eur Heart J Cardiovasc Imaging. 2018 Jun 1;19(6):601-610. [CrossRef]
- Todiere G, Pisciella L, Barison A, Del Franco A, Zachara E, Piaggi P, Re F, Pingitore A, Emdin M, Lombardi M, Aquaro GD. Abnormal T2-STIR magnetic resonance in hypertrophic cardiomyopathy: a marker of advanced disease and electrical myocardial instability. PLoS One. 2014 Oct 30;9(10):e111366.
- Aquaro GD, Masci P, Formisano F, Barison A, Strata E, Pingitore A, Positano V, Spirito P, Lombardi M. Usefulness of delayed enhancement by magnetic resonance imaging in hypertrophic cardiomyopathy as a marker of disease and its severity. Am J Cardiol. 2010 Feb 1;105(3):392-7.
- Florian A, Masci PG, De Buck S, Aquaro GD, Claus P, Todiere G, Van Cleemput J, Lombardi M, Bogaert J. Geometric assessment of asymmetric septal hypertrophic cardiomyopathy by CMR. JACC Cardiovasc Imaging. 2012 Jul;5(7):702-11. [CrossRef]
- Karamitsos TD, Piechnik SK, Banypersad SM, Fontana M, Ntusi NB, Ferreira VM, Whelan CJ, Myerson SG, Robson MD, Hawkins PN, Neubauer S, Moon JC. Noncontrast T1 mapping for the diagnosis of cardiac amyloidosis. JACC Cardiovasc Imaging. 2013 Apr;6(4):488-97. [CrossRef]
- Aquaro GD, Pugliese NR, Perfetto F, Cappelli F, Barison A, Masci PG, Passino C, Emdin M. Myocardial signal intensity decay after gadolinium injection: a fast and effective method for the diagnosis of cardiac amyloidosis. Int J Cardiovasc Imaging. 2014 Aug;30(6):1105-15.
- Roller FC, Fuest S, Meyer M, Harth S, Gündüz D, Bauer P, Schneider C, Rolfs A, Krombach GA, Tanislav C. Assessment of Cardiac Involvement in Fabry Disease (FD) with Native T1 Mapping. Rofo. 2019 Oct;191(10):932-939. English. [CrossRef]
- Aquaro GD, De Gori C, Faggioni L, Parisella ML, Aringhieri G, Cioni D, Lencioni R, Neri E. Cardiac Magnetic Resonance in Fabry Disease: Morphological, Functional, and Tissue Features. Diagnostics (Basel). 2022 Nov 1;12(11):2652.
- Pica S, Sado DM, Maestrini V, et al. Reproducibility of native myocardial T1 mapping in the assessment of Fabry disease and its role in early detection of cardiac involvement by cardiovascular magnetic resonance. J Cardiovasc Magn Reson. 2014;16(1):99. Published 2014 Dec 5. [CrossRef]
- aus dem Siepen F, Buss SJ, Messroghli D, Andre F, Lossnitzer D, Seitz S, Keller M, Schnabel PA, Giannitsis E, Korosoglou G, Katus HA, Steen H. T1 mapping in dilated cardiomyopathy with cardiac magnetic resonance: quantification of diffuse myocardial fibrosis and comparison with endomyocardial biopsy. Eur Heart J Cardiovasc Imaging. 2015 Feb;16(2):210-6. [CrossRef]
- Minegishi S, Kato S, Takase-Minegishi K, et al. Native T1 time and extracellular volume fraction in differentiation of normal myocardium from non-ischemic dilated and hypertrophic cardiomyopathy myocardium: A systematic review and meta-analysis. Int J Cardiol Heart Vasc. 2019;25:100422. Published 2019 Sep 7. [CrossRef]
- Chaosuwannakit N, Makarawate P. Value of cardiac magnetic resonance imaging in systemic sclerosis. Reumatologia. 2018;56(2):92-98. [CrossRef]
- Ferreira VM, Schulz-Menger J, Holmvang G, Kramer CM, Carbone I, Sechtem U, Kindermann I, Gutberlet M, Cooper LT, Liu P, Friedrich MG. Cardiovascular Magnetic Resonance in Nonischemic Myocardial Inflammation: Expert Recommendations. J Am Coll Cardiol. 2018 Dec 18;72(24):3158-3176. [CrossRef]
Disclaimer/Publisher’s Note: The statements, opinions and data contained in all publications are solely those of the individual author(s) and contributor(s) and not of MDPI and/or the editor(s). MDPI and/or the editor(s) disclaim responsibility for any injury to people or property resulting from any ideas, methods, instructions or products referred to in the content. |
© 2023 by the authors. Licensee MDPI, Basel, Switzerland. This article is an open access article distributed under the terms and conditions of the Creative Commons Attribution (CC BY) license (http://creativecommons.org/licenses/by/4.0/).
Copyright: This open access article is published under a Creative Commons CC BY 4.0 license, which permit the free download, distribution, and reuse, provided that the author and preprint are cited in any reuse.


