Preprint
Review

A Free Space Material Measurement System

Altmetrics

Downloads

1350

Views

172

Comments

0

Submitted:

07 June 2023

Posted:

07 June 2023

You are already at the latest version

Alerts
Abstract
One of the most popular techniques for determining electrical properties of material is the free-space measurement technique. With the potential for new applications requiring efficient, accurate and broadband material measurement systems using higher millimeter-wave and terahertz frequencies, the free-space measurement method has received renewed interest. This is mainly due to its simplicity, favorable properties as a non-destructive method, and it allows transmission and reflection measurements without any physical contact with the sample. This paper reviews and discusses state- of-the-art free space material measurement systems, starting with the different measurement techniques available for material characterization, their important concepts, post-processing in determining their properties, and progress towards expanding their use at higher frequencies. Also, this paper reviews dielectric material characterization using the free space method focusing on their application extension towards the higher frequencies. Besides, the algorithms for conversion methods and usage of lens in free space material measurement system was discussed in this paper. Finally, a future perspective on the outlook of this free space method is presented prior to the conclusion.
Keywords: 
Subject: Engineering  -   Electrical and Electronic Engineering

1. Introduction

Over the past two decades, millimeter wave (mm-wave) and terahertz (THz) technologies have been intensively developed due to its attractive properties in applications such as radio astronomy, military, and medical applications. The increasing demands for mm-wave components and systems created a renewed need for cost-effective test and measurement solutions within this band and beyond. One of the important steps in designing devices operating at these frequencies is to first determine the electrical properties of materials. These values affect the method to design various radio components, as their behavior varies according to frequency. This need arises as most materials are typically characterized up to the microwave bands. Besides that, material characterization can also be applied to determine quality of agricultural and industrial products, and biomedical applications [1,2].
Several measurement techniques have been established to measure dielectric properties in terms of permittivity and permeability at microwave frequencies, such as the free space method, transmission line method, waveguide method, impedance, coaxial probe, and cavity methods [3], [4,5,6,7,8]. Amongst these techniques, the free space measurement technique is popular as it allows the measurement of reflection and transmission measurements without any physical contact with the sample [9]. It is especially suitable for thin flat faced materials, or other materials that can be formed into this shape. In its most conventional form, a free space measurement set up comprises of a vector network analyzer, two horn antennas, sample holder and measurement software. Each horn antenna will be placed as the transmitter and receiver antenna respectively, and the material under test (MUT) will be placed between them [10,11]. To facilitate the process, a software can be integrated into the system to calibrate and automate free space measurements prior to calculating electromagnetic properties of materials. The increasing portability of measurement equipment such as VNAs and the wider application and increasing importance of mm-wave/THz material spectroscopy is foreseen to increase research and commercial interest for this technique.
However, applying the free space technique in the higher frequencies which is from W band (75 GHz) onwards is challenged by the antenna beam growth, as less energy is concentrated on the dielectric slab [12]. To minimize inaccuracies during measurements, a dielectric lens can be used to refocus the beam [13]. Nonetheless, most errors can be eliminated using the Through-Reflect-Line calibration [13], [14]. This paper aims to revisit dielectric material characterization using the free space method focusing on their application extension towards the higher frequencies. First, this paper outlines the properties and types of material measurement techniques, suitable material types / forms and the conversion algorithms for dielectric material characterization [15].
Next, the following sections focus on the aspects of free space measurement technique. Its calibration methods, algorithms, and calculations of dielectric properties, methods to improve measurement accuracy and the need for THz applications is discussed in this paper [16]. Besides, suitable parameter extraction algorithms are crucial. These two factors mainly determine the speed and accuracy of extraction in different measurement techniques. This review innovates away from other similar reviews presented in [17] and [18] by the applications of dielectric measurements in general with considerations of the frequency range and different potential methods. Most importantly, to our best knowledge, this review provides an analysis of possible issues when extending the free space method towards the upper millimeter-wave frequencies (100-300 GHz).

2. Permittivity and Permeability

Electric permittivity, ε, which represents the energy stored in an electric field, is the ratio of permittivity of the material εr to the permittivity of vacuum, εo as in [19]. It also indicates the interaction of a material with electric fields, which is also indicated as the dielectric constant, k   in (1). The real part of permittivity εrʹ is a count of the energy stored in a material. The imaginary part of permittivity, εrʹʹ is the loss factor and determines how lossy a material is in the existence of an external electric field. Magnetic permeability, µ in (2) is the energy stored in a magnetic field and µo is the permeability of free space. Figure 1 shows the electromagnetic field interaction and the relation between permittivity and permeability [19].
ε r = ε ε o
μ r = μ μ o

3. Techniques for Dielectric Properties Measurements

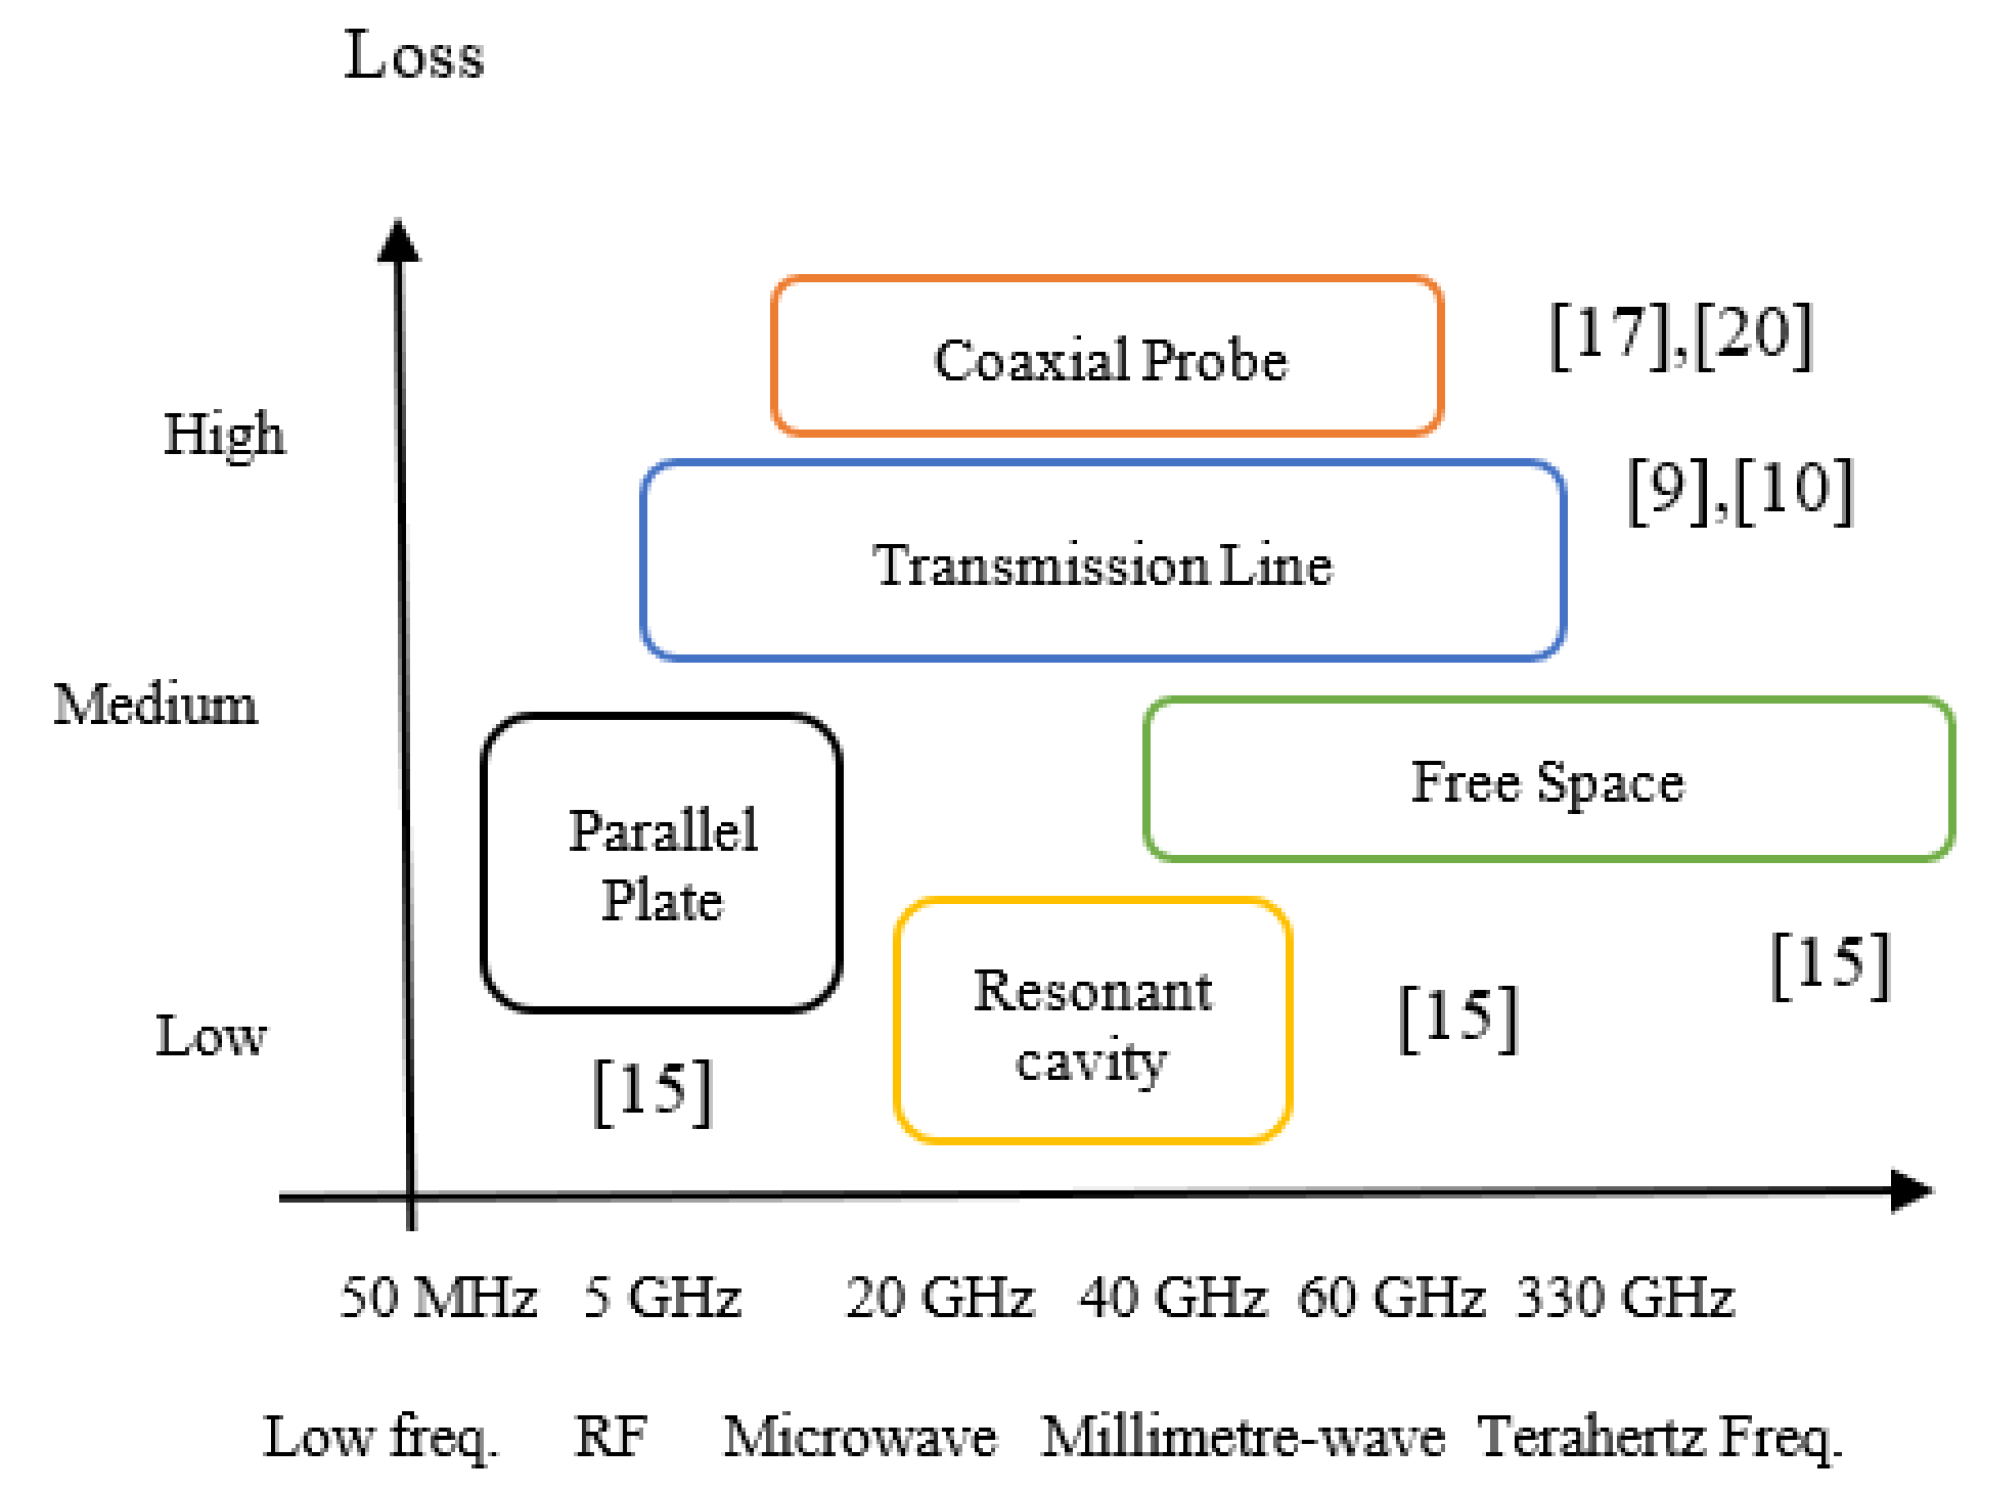
This section will briefly present the available material property measurement techniques and compare them in terms of their suitability for different applications as in [15]. A summary of the well-known material measurement techniques is presented in Figure 2 [15]. Each measurement technique operates in different frequency ranges as each one of them limited to specific frequencies, materials, applications. The free-space measurement technique is mostly applicable for a wide range of frequencies from 5 GHz to 330 GHz. On the other hand, the transmission line measurement technique is applicable from 50 MHz to 60 GHz, whereas the coaxial probe measurement capability ranges from 50 MHz to 40 GHz. The resonant cavity method is typically used to measure materials from 5 GHz to 20 GHz. On the contrary, the parallel plate measurement technique is only applicable at frequencies up to only 50 MHz. Coaxial probe and transmission line methods exhibit rather high losses and is moderate for the parallel plate and free space techniques are moderate. The measurement technique which features the relatively lowest loss is the resonant cavity method.
Table 1 presents the state of the art of material measurement techniques in terms of operating frequencies, types of dielectric properties measured using each technique, types of suitable materials for measurements, level of losses, and measurement conversion techniques as in [21]. The free space measurement technique can measure material permittivity and permeability by extraction and calculation of S-parameters for a wide range of frequencies. The transmission line method has similar capabilities except for the difference is its measurement frequency range. The coaxial probe and parallel plate methods, on the other hand, can extract S11 and thus can only retrieve εr. Finally, the resonant cavity method determines both the permittivity and permeability of a material, and unlike the other measurement techniques, it extracts the quality factor (Q-factor) and the resonant frequency of microwave resonators from their S-parameters.

3.1. Free Space Method

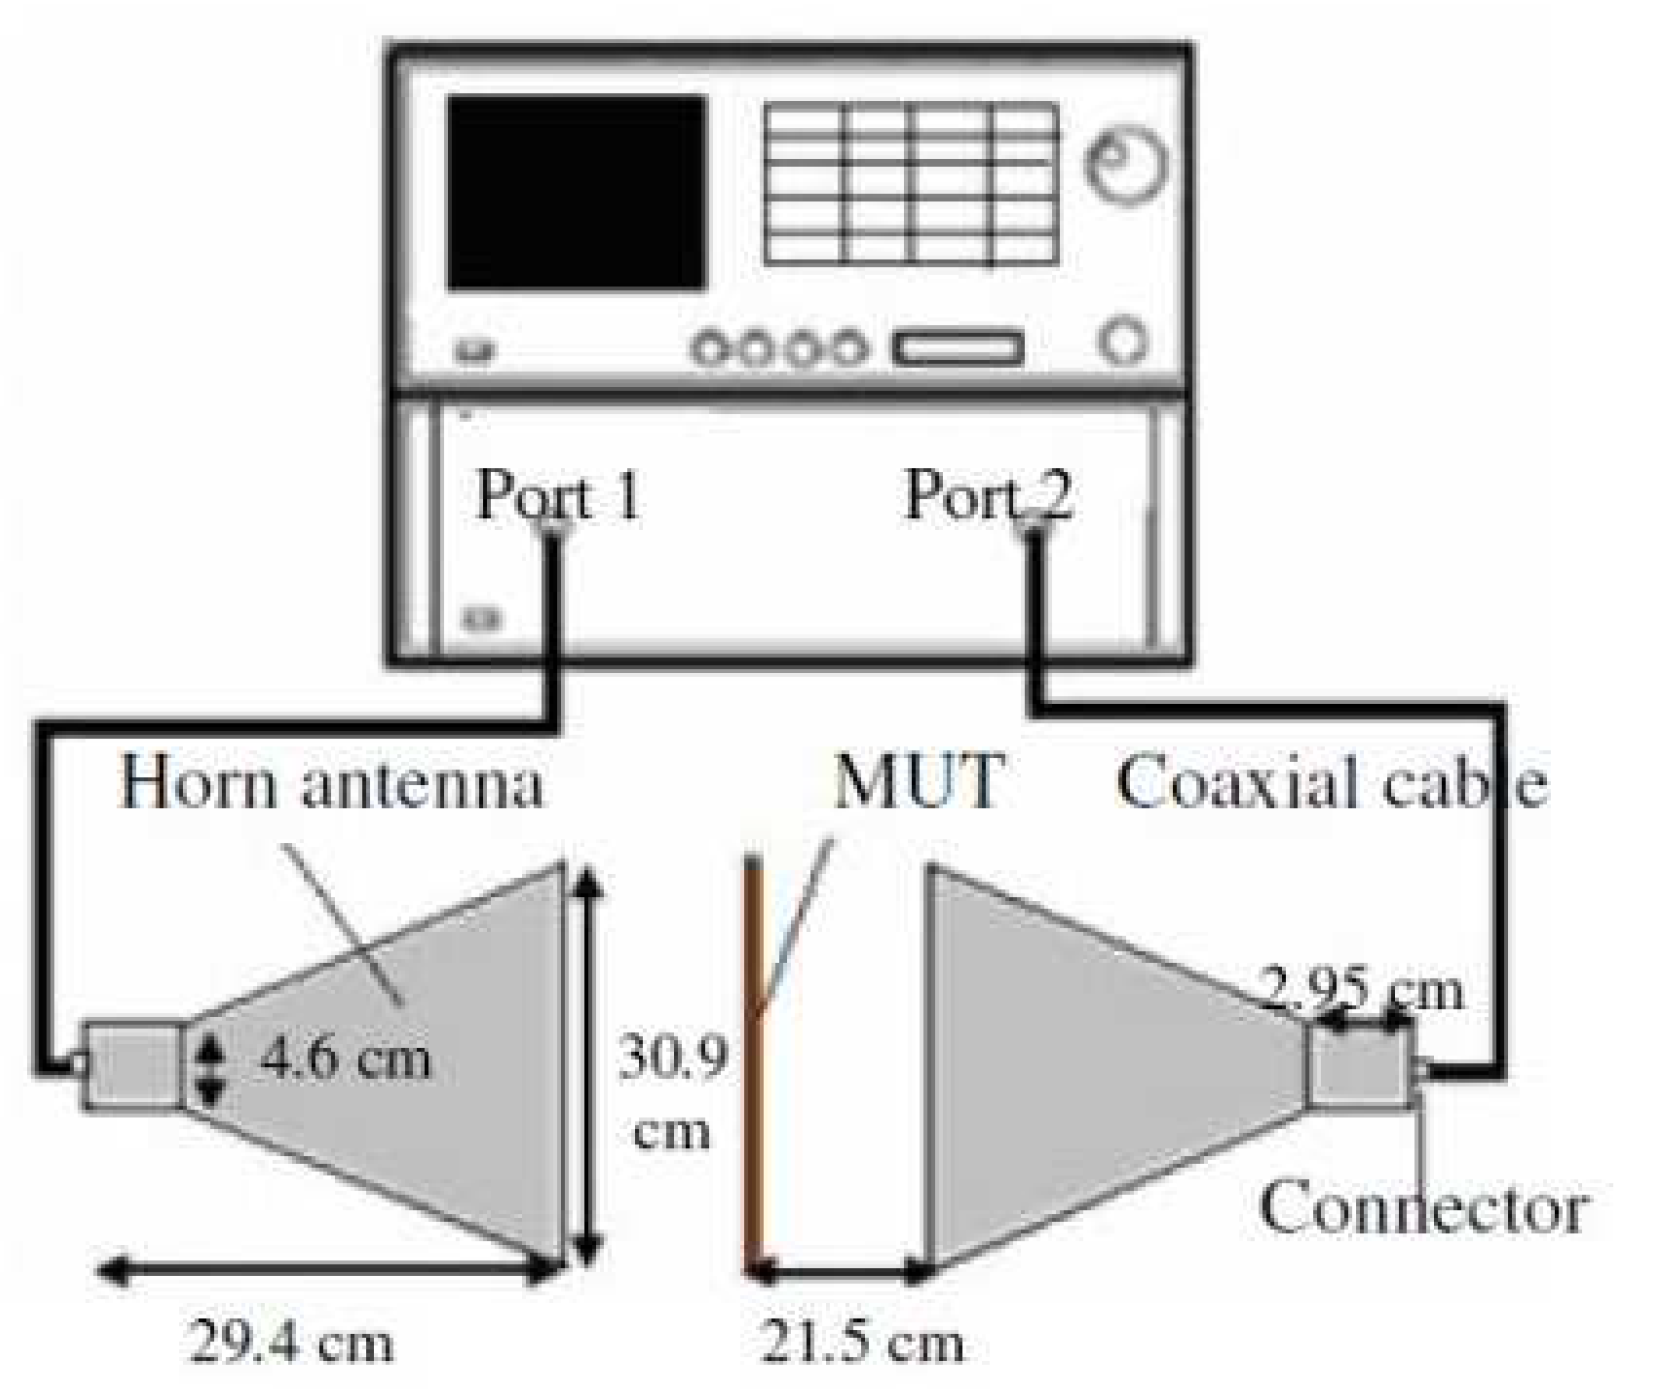
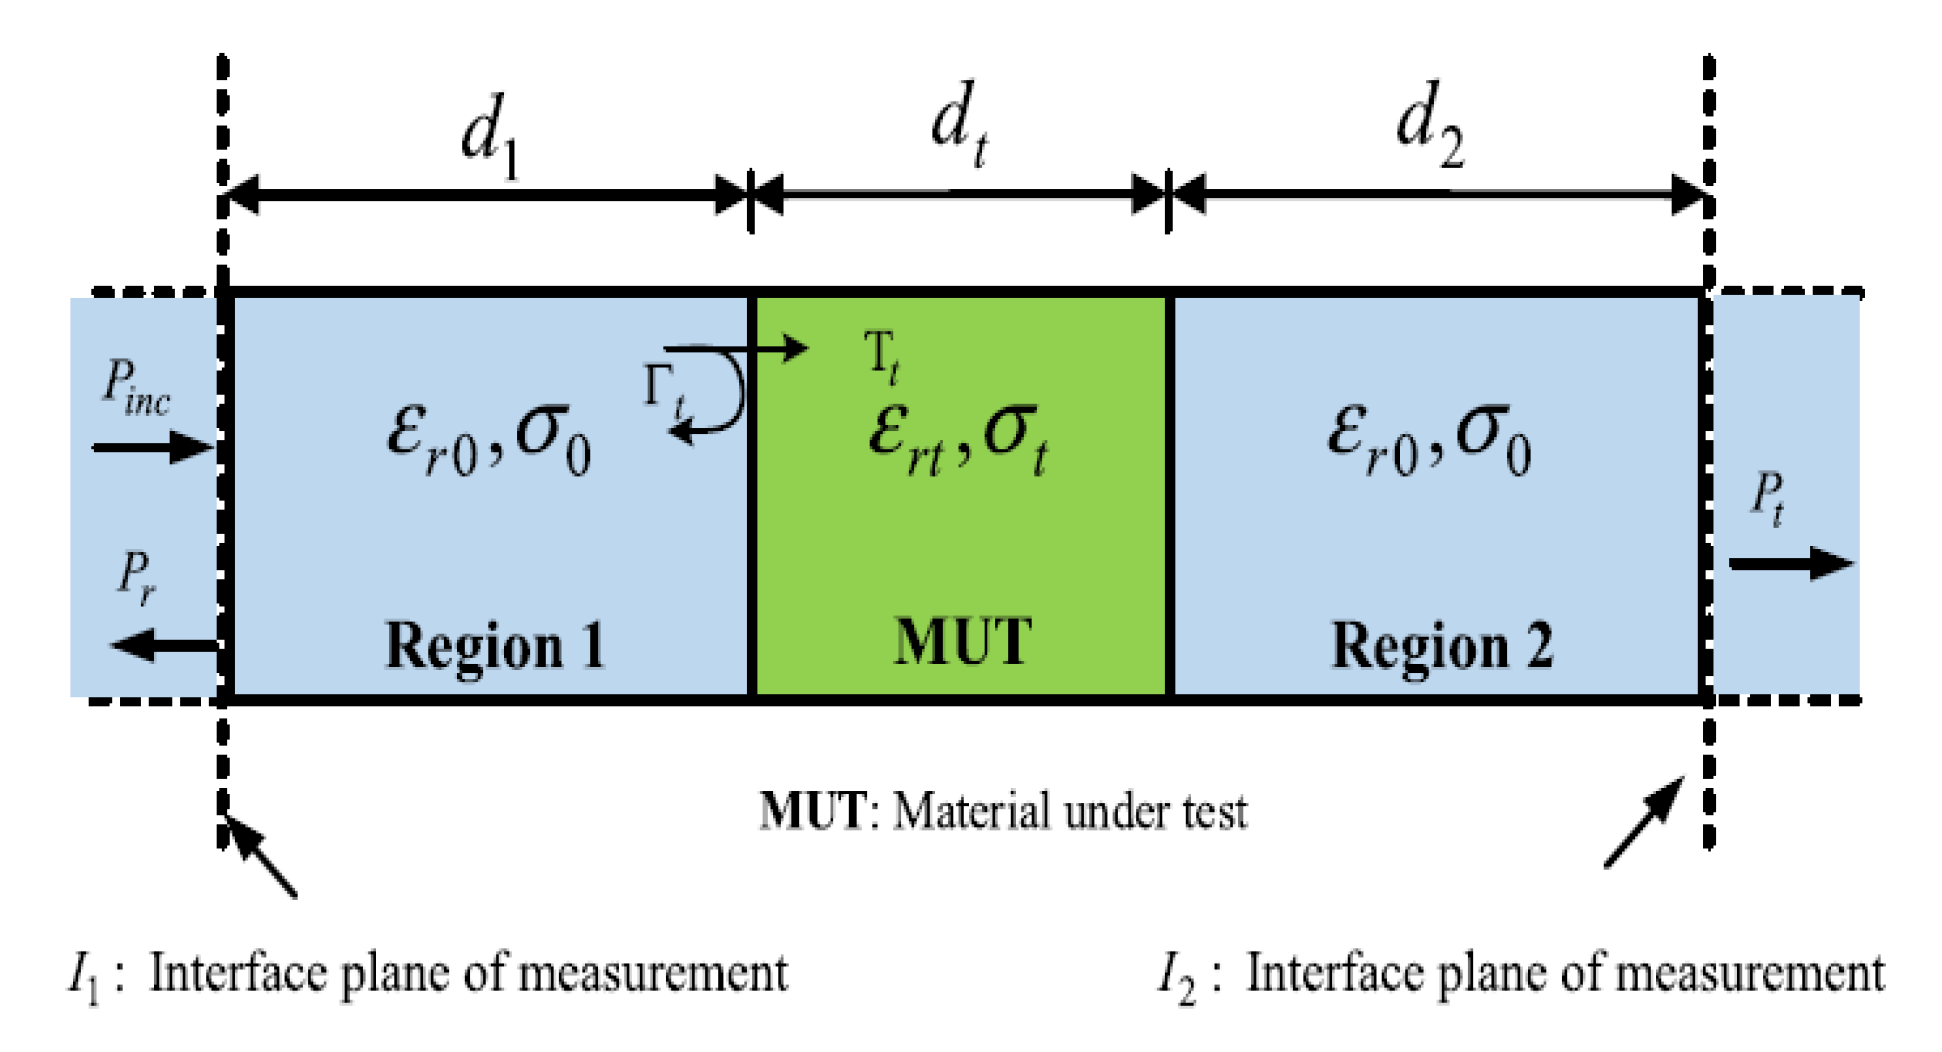
A free-space measurement setup comprises of a vector network analyser (VNA), two horn antennas, sample holder and measurement software. Both horn antennas will be used as the transmitter and receiver and the material under test (MUT) will be placed between them as in [15]. The software automates the relative complex permittivity, εr and relative complex permeability, µr measurements through S-parameters obtained through the VNA. For example, a commercial materials measurement software from Keysight Technologies streamlines the process of measuring εr and µr using a VNA, with its setup shown in Figure 3 [15]. It is applicable in determining dielectric properties of materials in applications, such as agriculture, biomedical, and material engineering.

3.2. Open-ended coaxial probe method

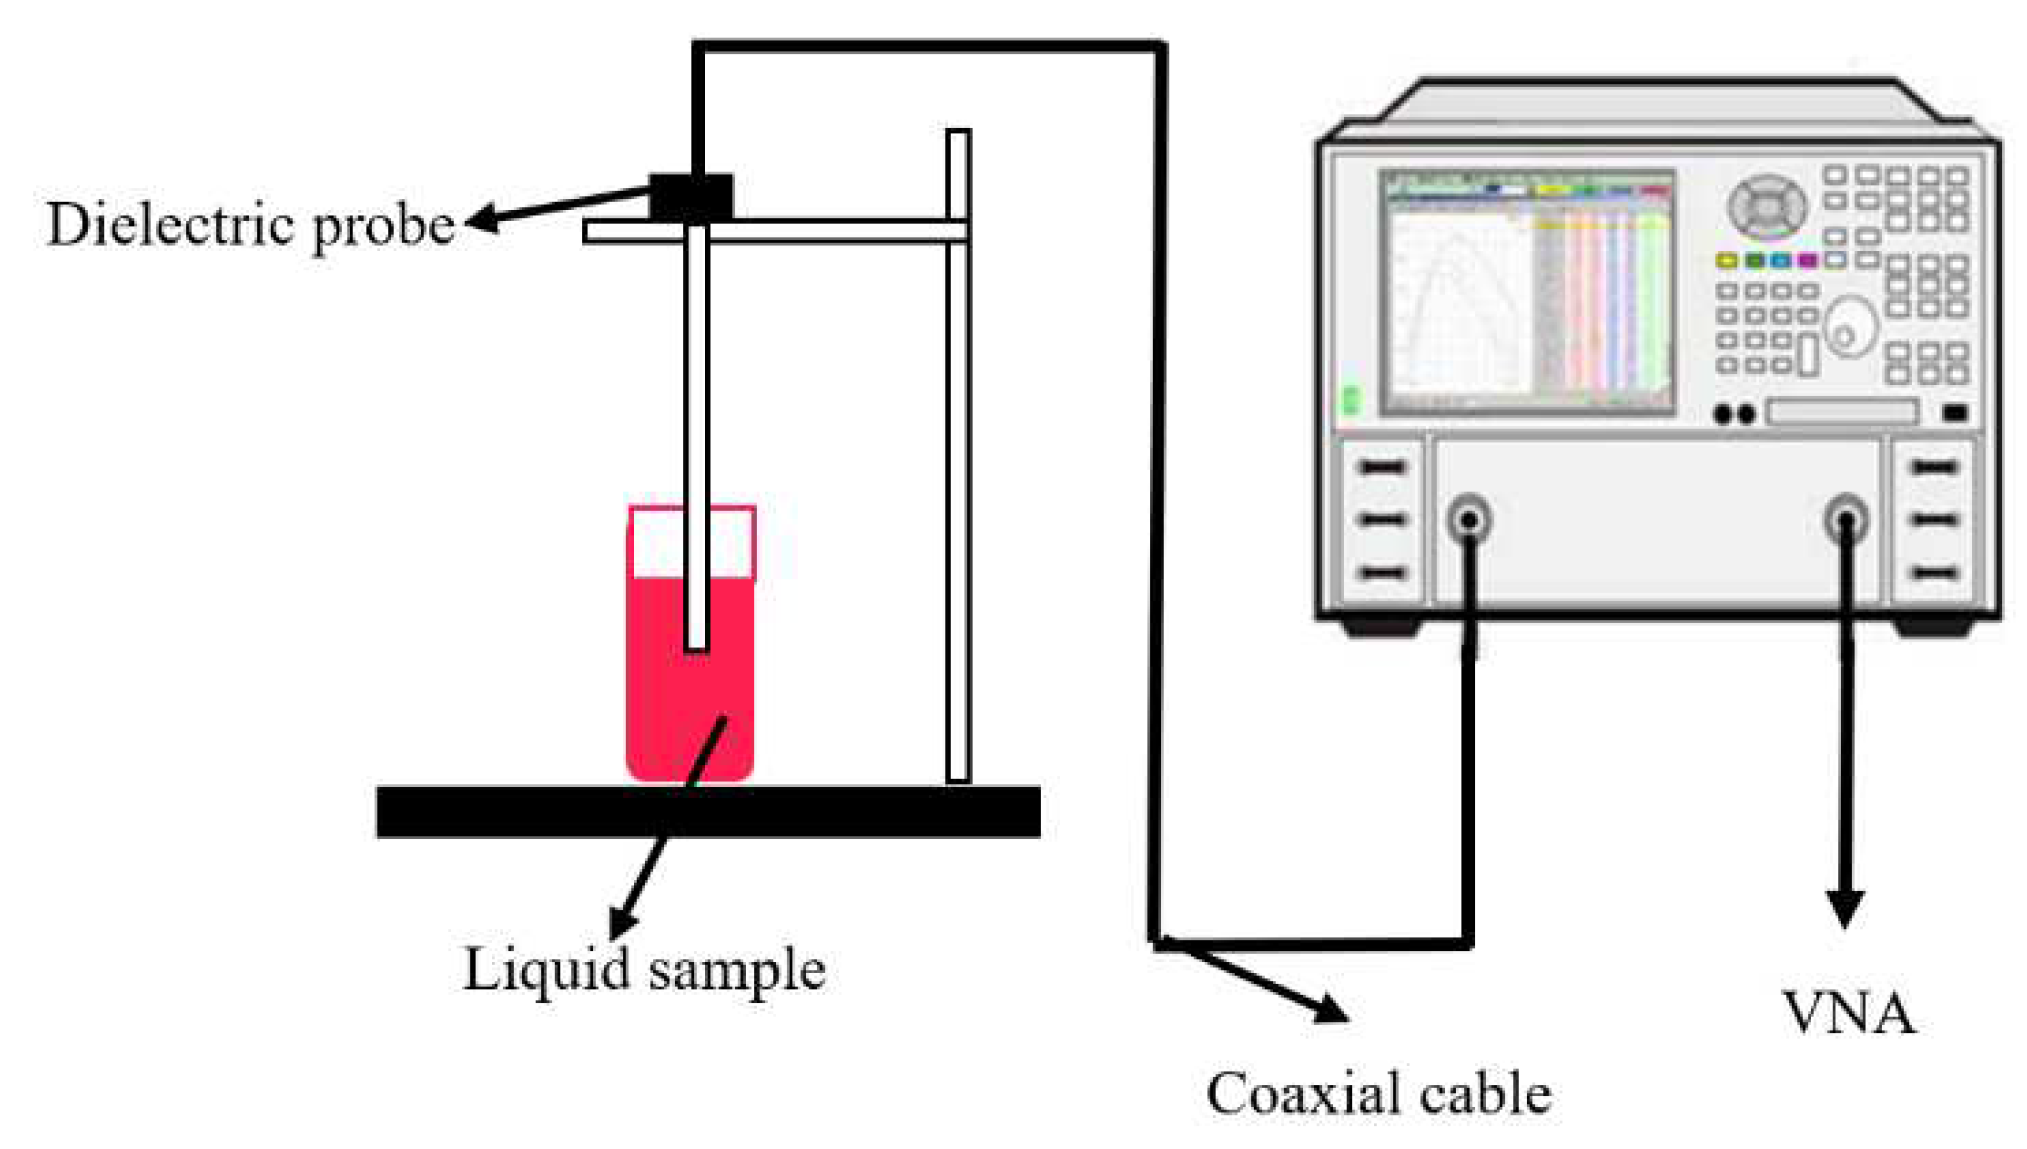
This method uses a coaxial probe which probe aperture is placed into the liquids or semi-solids to determine their permittivity as shown in Figure 4 [15]. The vector network analyzer (VNA) is used to determine the reflection coefficient, Γ then convert the measured Γ into relative complex permittivity, εr. The coaxial probe calibration process involves the open-circuit, short-circuit, and broadband load standards, namely open-short-load (OSL) calibration method. This technique can also be used for dielectric measurement of biological tissues [22]. Figure 4 shows the schematic of the measurement setup for open-ended coaxial probe method which involves the use of the VNA for the determination of dielectric properties from 50 MHz to 50 GHz. The sample preparation is easy for this method as it need no machining of the sample. During measurement, the method may be affected by air gaps.

3.3. Transmission Lines

In this method, a sample is placed in a portion of coaxial line and the measurement is done using a VNA from 50 MHz to 60 GHz. The VNA is first calibrated prior to measurements, and the obtained S-parameters are converted to dielectric properties using conversion methods such as Nicholson Ross Weir (NRW) method or NIST iterative methods. Equations (3) to (9) was solved through an external or internal software program for NRW method as in [15]. The measurement setup is shown in Figure 5 [15]. One of the advantages of this method is, it is able to determine both the permeability and permittivity of the samples. Effects of air gap during measurement is the limitation of this method.
The S-parameters obtained from the functions of the vector network analyser can be calculated using Eq. (3), as follows:
S 11 = Γ ( 1 T 2 ) 1 Γ 2 T 2
S 21 = T ( 1 Γ 2 ) 1 Γ 2 T 2
The reflection coefficient, Γ can then be obtained through Eq. (4) and Eq. (5), where X used to determine the correct roots for the condition of |Γ| < 1.
Γ = X ± X 2 1
X = S 11 2 S 21 2 + 1 2 S 11
The transmission coefficient, T is shown in Eq. (6) while the relative complex permeability, µr is presented in Eq. (7) as:
T = S 11 + S 21 Γ 1 ( S 11 + S 21 Γ )
μ r = 1 + Γ A ( 1 Γ ) [ 1 λ o 2 λ c 2 ]
1 A 2 = [ 1 2 π L ln ( 1 T ) ] 2
Finally, the relative complex permittivity, εr of the material can be determined using (9).
ε r = λ o 2 μ r λ c 2 [ 1 2 π L ln ( 1 T ) ] 2
where λo is the free space wavelength while λc represents the cut-off wavelength. Equations (8) and (9) have an infinite number of roots since the imaginary part of term
n(1/T) is equal to j (Ѳ + 2𝜋n) where n=0, ±1, ±2…, the integer of (L/ λg

3.4. Resonant Cavity Method

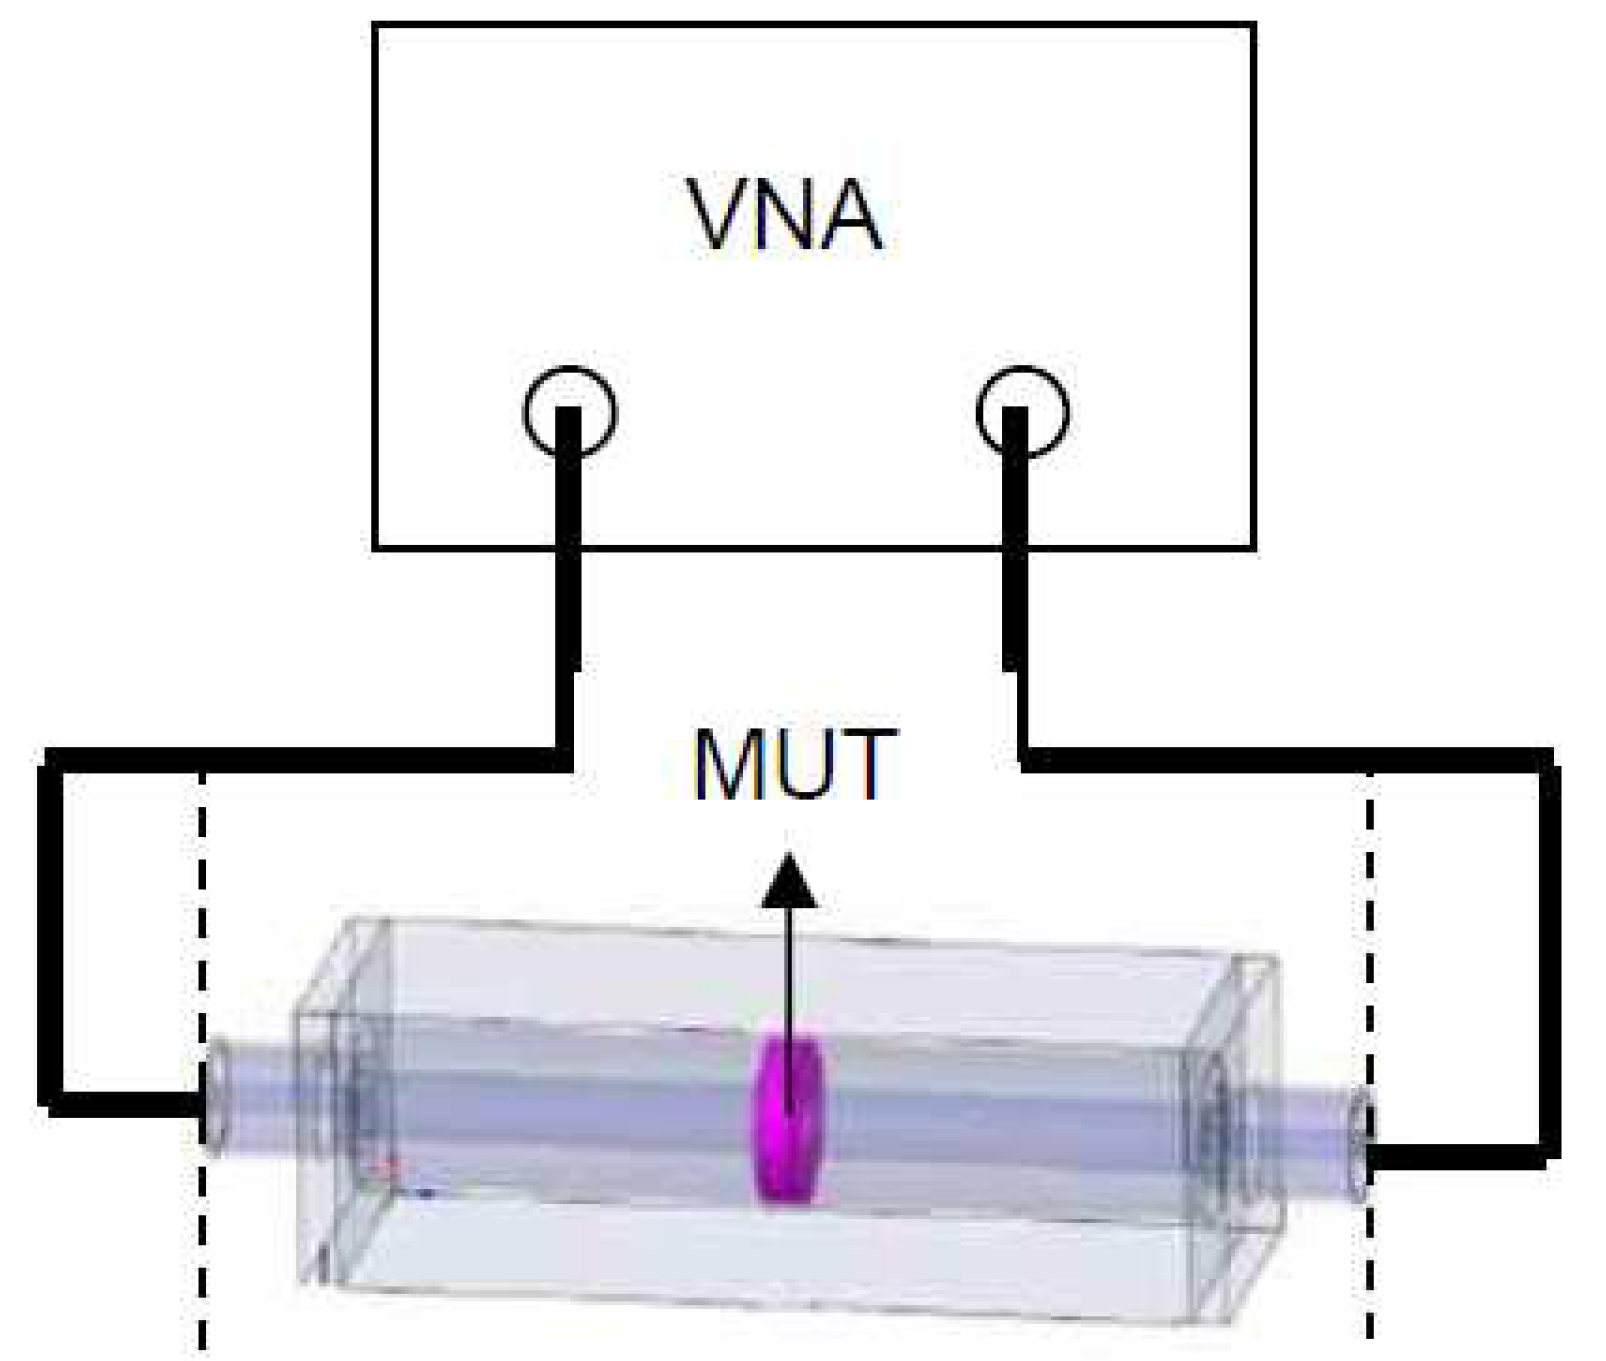
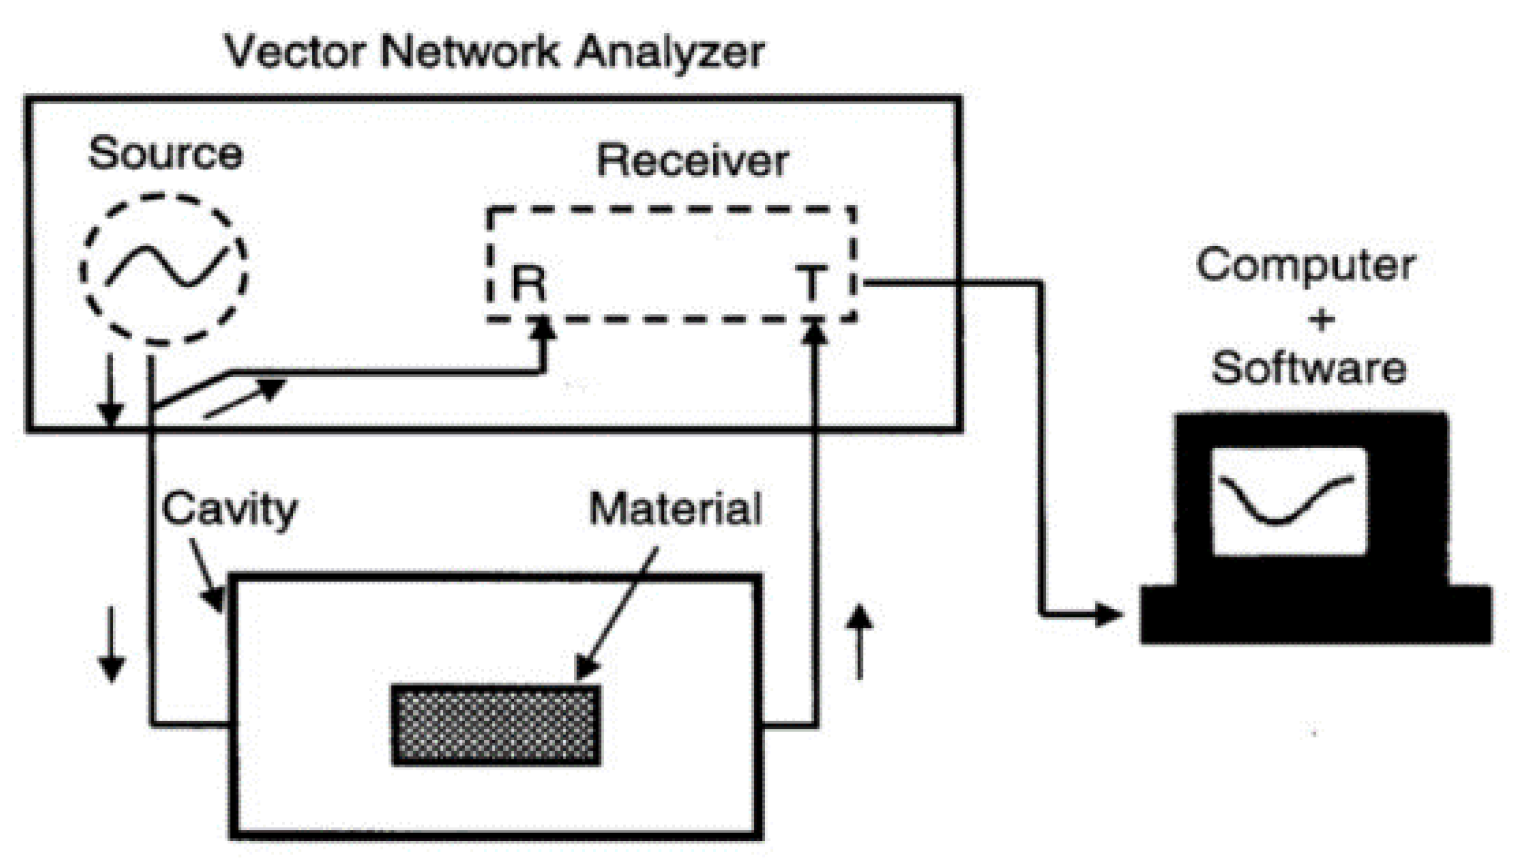
The resonant cavity method is method used to determine material properties of liquids, waveguides and rod-shaped solid materials using cavities which resonates at specific frequencies. Despite its limitation to a single frequency which is a specific frequency, it features improved measurement accuracy. When material samples are placed in the cavity, changes in the field interaction will cause shift in the measured resonance and Q-factor which results in determination of the sample properties. Figure 6 presents the schematic representation of resonant cavity method as in [15].

4. Characterization of Dielectric Materials

This section describes the characterization of dielectric materials and recent studies in determining the dielectric properties of different materials, depending on the chosen measurement technique. Table 2 summarizes the advantages and disadvantages of different measurement techniques.
The work in [23] demonstrated a quasioptical concept using dielectric lenses for free-space measurement system. The various measured samples with different thicknesses indicated dielectric constant, εrʹ which closely resembles their nominal values. However, the loss tangents, tan δ for the same material with different thicknesses are rather different, as tabulated in Table 3 [23]. This is especially evident in low-loss materials such as styrofoam and Teflon. For thinner (250 µm
Teflon samples, there exists a larger difference in nominal and measured tan δ. Moreover, thinner samples which are less than 500 µm are more difficult to measure accurately. Nonetheless, the tan δ for Hostaflon and Kapton are similar to those provided by the manufacturer.
In [24], liquid material measurements were performed using the free-space method to obtain their relative complex permittivity, εr. First, the εr of a liquid container placed between two quartz plates is measured. Then, the S-parameters of this setup filled with liquid samples are assessed, with their obtained εr presented in Table 4 [24].
Next, the use of broadband free-space measurement was reported in [25]. This approach measures two types of samples which are polymethylmethacrylate (PMMA) and polytetrafluorethylene (PTFE) with the antennas placed at different distances (r = 30 cm and r = 48 cm). The average and the standard deviation of the PMMA and PTFE samples for different values of r are summarized in Table 5 [25]. Their results are observed to be compatible when r = 48 cm, especially with the PMMA samples. It is seen that the results for PMMA are more consistent compared to the higher deviations seen in measured PTFE samples. This is due to the structure of the PTFE samples which are not rigid and this may be bent during calibrations.
Next, the dielectric measurement of biological tissues of a mouse’s liver was performed using the open-ended coaxial probe method as in [22]. It is found that the temperature (T), age (A) and time from excision (TFE) affects the dielectric properties, with the uncertainties indicated as µT , µA , and µTFE quantified on liver tissue. Table 6 shows the dielectric data for mouse liver for different measurement scenarios at 900 MHz [22].
Another free-space time domain method in measuring dielectric properties was proposed in [9]. It is known that this method is preferred due to its simple calibration procedure, enabling measurements of permittivity, conductivity and thickness of different samples, as presented in Table 7 [9]. The relative complex permittivity is denoted by εrt and the effective electrical conductivity is denoted by σt. Parameter, dt represents the sample thickness while Δ represents the error analysis done on the selected parameters. Besides determining the effective conductivity of various lossy dielectrics, sensitivity analysis also was performed to optimize measurement accuracy.
Next, the dielectric properties of oil products are compared when assessed based on two methods, namely dielectric probe and cavity resonator techniques in [26]. In the dielectric probe techniques, the probe is immersed in the desired liquid so that no air bubbles forms at the liquid-probe interface. For the cavity resonator technique, the probe was set up so that when it is empty and resonates at 5.5 GHz, the cavity is over-coupled. Results summarized in Table 8 validated the good compatibility between them [26].
This section summarizes the characterization of dielectric materials using different techniques to determine material properties. First, a review of several materials with different thickness (e.g., PTFE, PMMA) determined through free space method is presented. It is also seen that permittivity of liquids can be obtained using this method as well. Besides that, the dielectric measurement of biological tissues of a mouse’s liver was also performed using open-ended coaxial probe method. Dielectric probe and cavity resonator technique also was used to determine the dielectric properties of oil products.

5. Algorithms for Calculation of Material Properties

There exist different conversion methods used to calculate the final properties obtained from free-space measurement systems as in [15]. The choice of suitable conversion method depends heavily on the needed speed and accuracy in determing these dielectric properties [15]. The three main algorithms are:
NRW [15],NIST iterative [15], and New non-iterative [15]
Table 9 shows the algorithms and appropriate conversion methods for different material type measurements [15].

5.1. NRW Method

The permittivity and permeability can be obtained using the Nicolson Ross Weir (NRW) method, which is fast, non-iterative and allows wide frequency band characterization [27]. This method is preferred as it able to perform explicit calculation of both the εr and μr from S-parameters [28]. Figure 7 shows the flowchart of NRW algorithm as in [15]. The measured broadband S-parameters (reflection and transmission coefficients) obtained from a VNA are used to predict the permeability and permittivity of the material under test aided by (7) and (9). The reflection coefficient, Γ, can then be obtained using (4) and the equation for the transmission coefficient, T is shown in (6). The permeability, μr is presented in (7) whereas the permittivity, εr can be solved using (9). Parameters λo is the free space wavelength, while λc represents the cut-off wavelength. Equation (8) have an infinite number of roots since the imaginary part of term ln (1/T) is equal to j (Ѳ + 2𝜋n) where n=0, ±1, ±2…., the integer of (L/λg). One of the methods to determine n is by analysis of group delay. The phase ambiguity can be solved by comparing the measured group delay, τmeas shown in (11) and the calculated group delay, τcal in (10) to find a correct value of n. Equation (12) can be used when n = k.
τ c a l = 1 c 2 f ε r μ r + f 2 1 2 d ( ε r μ r ) d f ε r μ r f 2 c 2 1 λ c 2 L
τ m e a s = 1 / 2 Π d Φ d f
τ c a l τ m e a s = 0
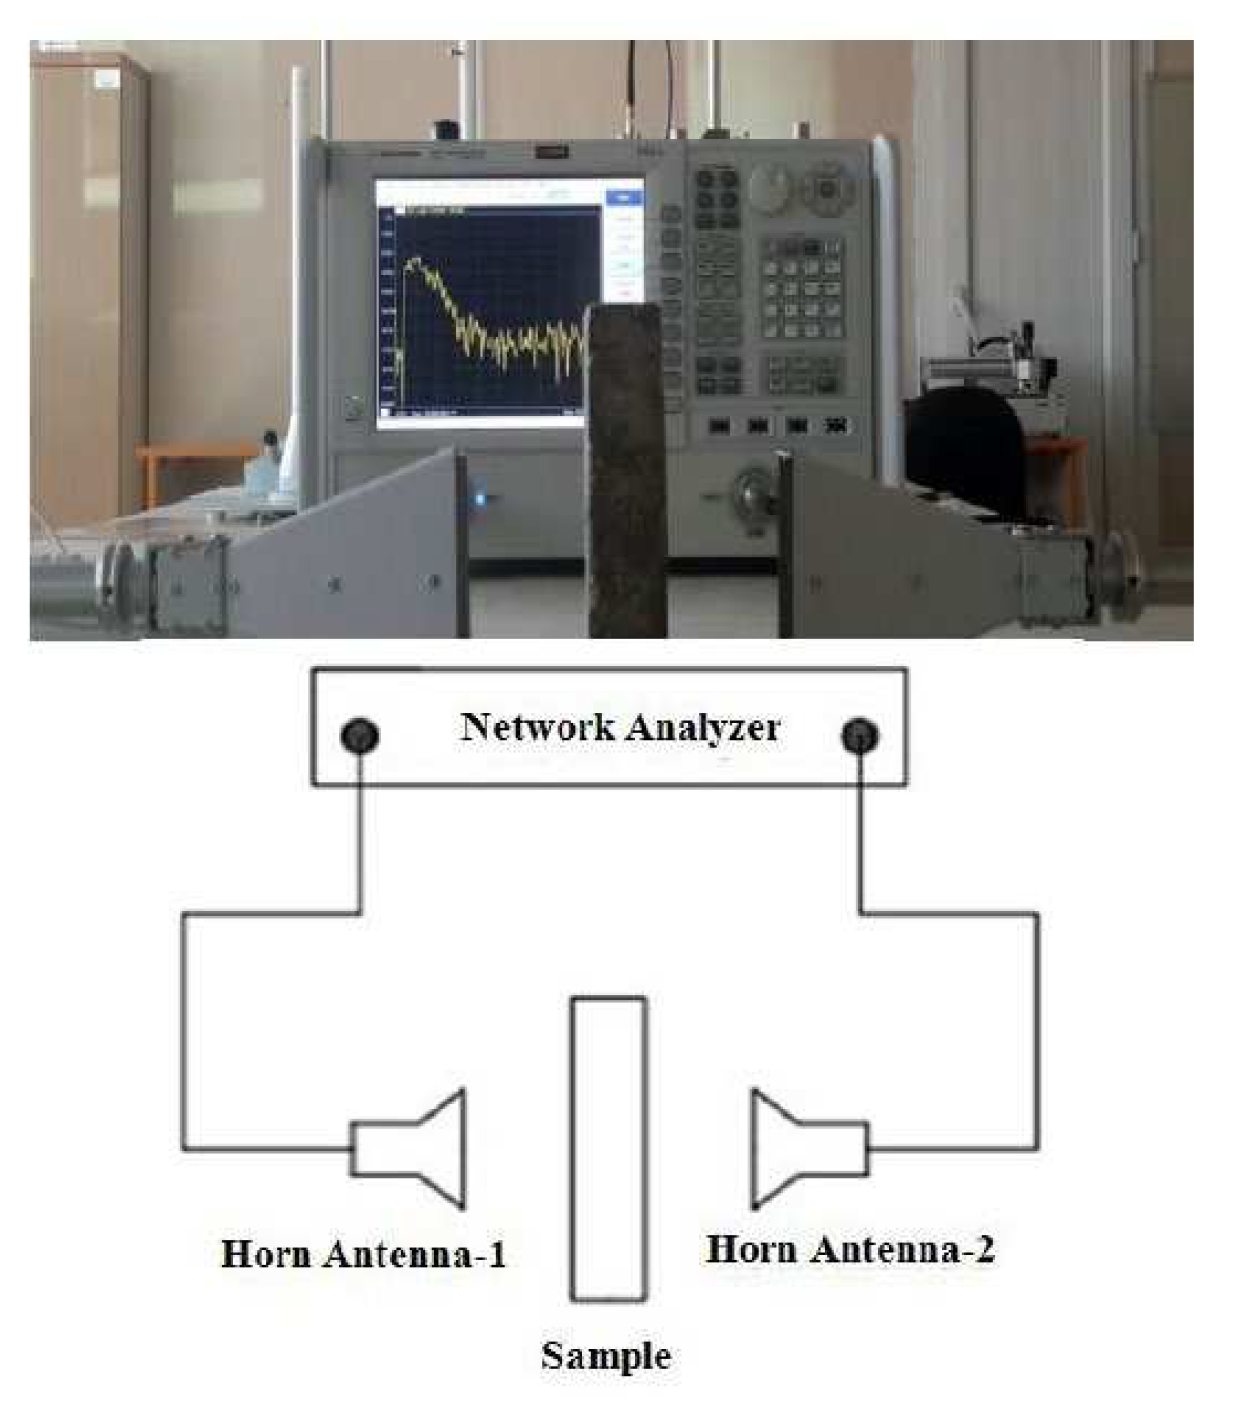
An example of the use of the NRW approach in determining the physical properties of concrete using NRW was performed in [29]. The electrical properties of concretes with different water/cement (w/c) ratios were determined through dielectric constant measurements, and the relationship between their electrical and mechanical properties was studied. It is known that the w/c ratio aids in compressive strength, splitting tensile, abrasion resistance, water absorption and high-pressure water penetration properties of the concrete. The goal of selecting these w/c ratios is to control the compressive strengths of the samples so that the other mechanical and transport parameters can also be controlled. In comparison to concretes with a lower w/c ratio, increasing the water content causes a weaker bond between the cement paste and the aggregates, larger capillary pores, and a more heterogeneous mixture due to segregation. Figure 8 below shows the measurement setup of this study [29].
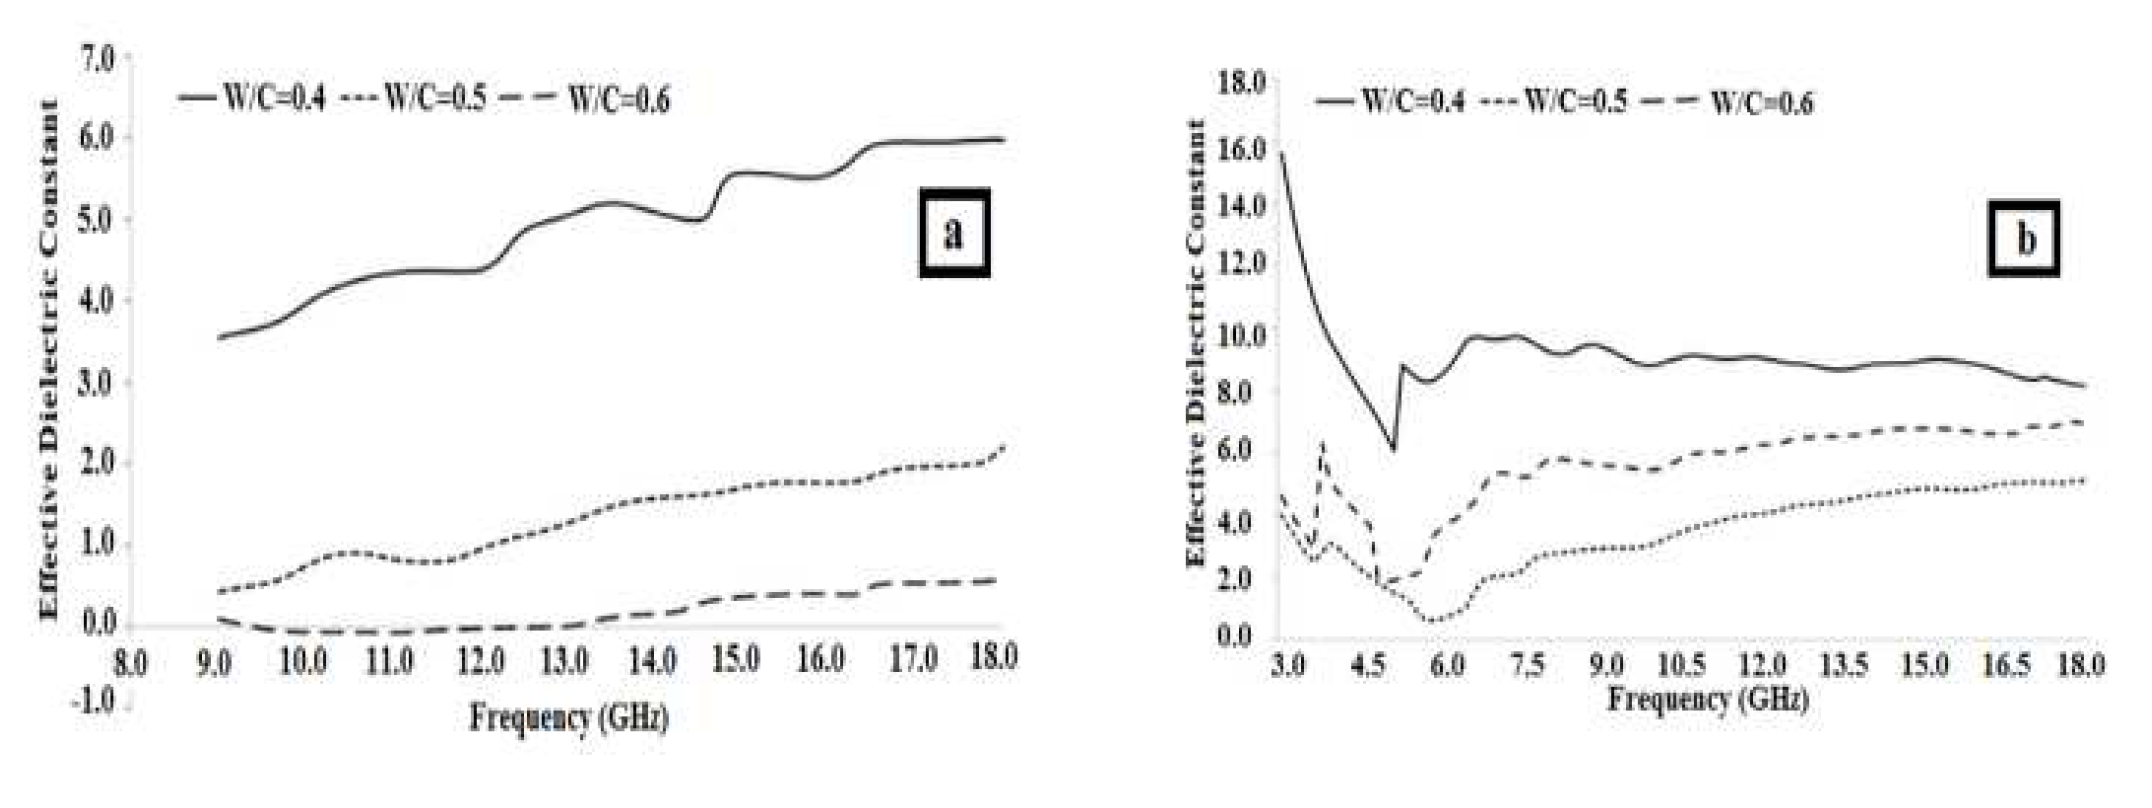
From Figure 9 it can be deduced that the increment of w/c ratio decreases the effective dielectric constant, as they are inversely proportional with each other [29]. Also, the correlation between mechanical properties and w/c could be seen. As a result, the NRW technique can be useful in the characterization of microwave devices/sensors with a constant frequency.
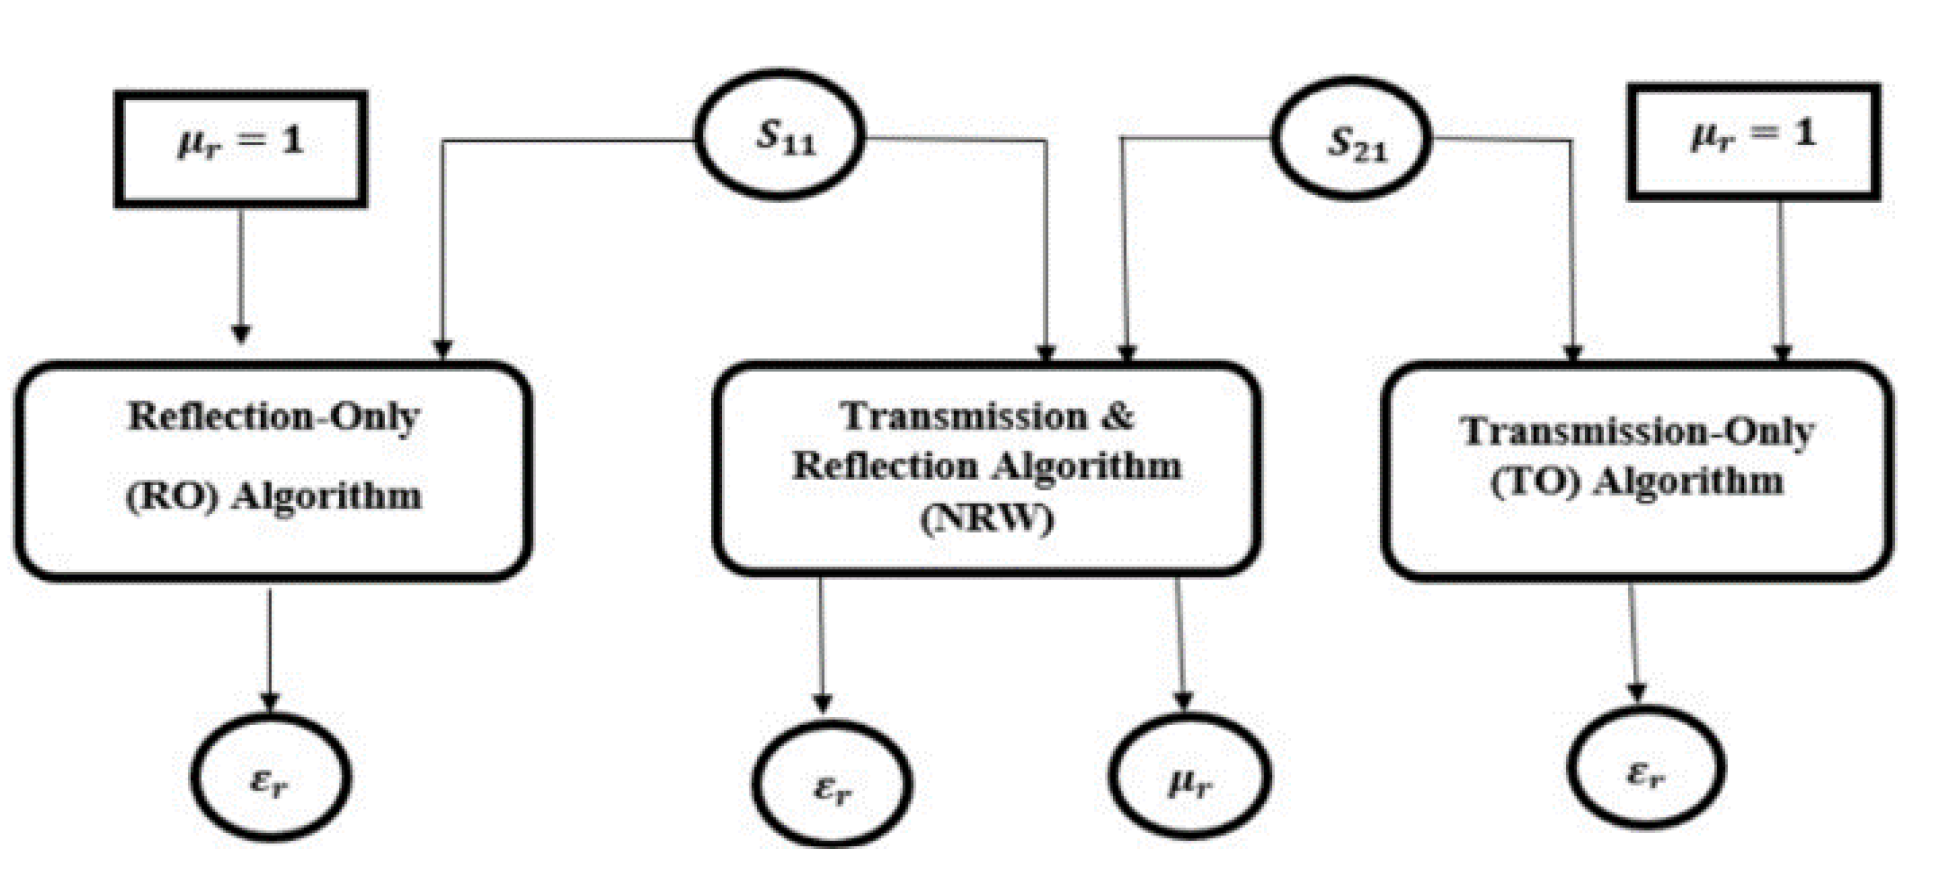
The inaccuracies in measurements of dielectric materials can be solved by using focusing horn or lens antennas and suitable calibration methods as in [25]. Several research on the frequency-by-frequency approach comprises of NRW (Transmission and Reflection Algorithm), TO (Transmission-Only) and RO (Reflection-Only Algorithm) has been proposed, as summarized in Figure 10 [21]. Reflection-Only (RO) algorithm is applicable when S21 is unavailable, whereas the Transmission-Only (TO) algorithm uses only S21
nd is more effective when S11 is more error-prone. Besides that, two necessary techniques in free space measurement are the free space calibration and time-domain gating (TDG). Equations (3a) and (3b) are used in the calculations of the NRW algorithm. S11 and S21 in (3a) and (3b) are the s-parameters that could be obtained using VNAs. Parameter
s determined using the root of a function, F. In equation (13) FR of slab the scattering model is used when S21 is inaccessible. To solve (14) for the RO (Reflection-Only) algorithm, FRO, a permeability of µr =1 is used in (13). On the other hand, in solving (16) for the TO (Transmission-Only) algorithm, FTO , µr =1 is also assumed in (15), which is an equation for the transmission coefficient, FT for the slab scattering model.
F R ( ε r , μ r , σ ) = j ( y 2 1 ) τ 2 y + j ( y 2 + 1 ) τ
F R O = S 11 + ( ε r 1 ) tan ( v ) 2 ε r + j ( ε r + 1 ) tan ( v ) = 0
F T ( ε r , μ r , σ ) = 2 y cos ( w x d c ) [ 2 y + j ( y 2 + 1 ) τ ]
F T O = S 21 [ ε r cos ( v ) + j ε r 4 ( 1 + ε r ) sin ( v ) ] ε r = 0
η = ± ( 1 + S 11 ) 2 S 21 2 ( 1 S 11 ) 2 S 21 2 = η ± j η
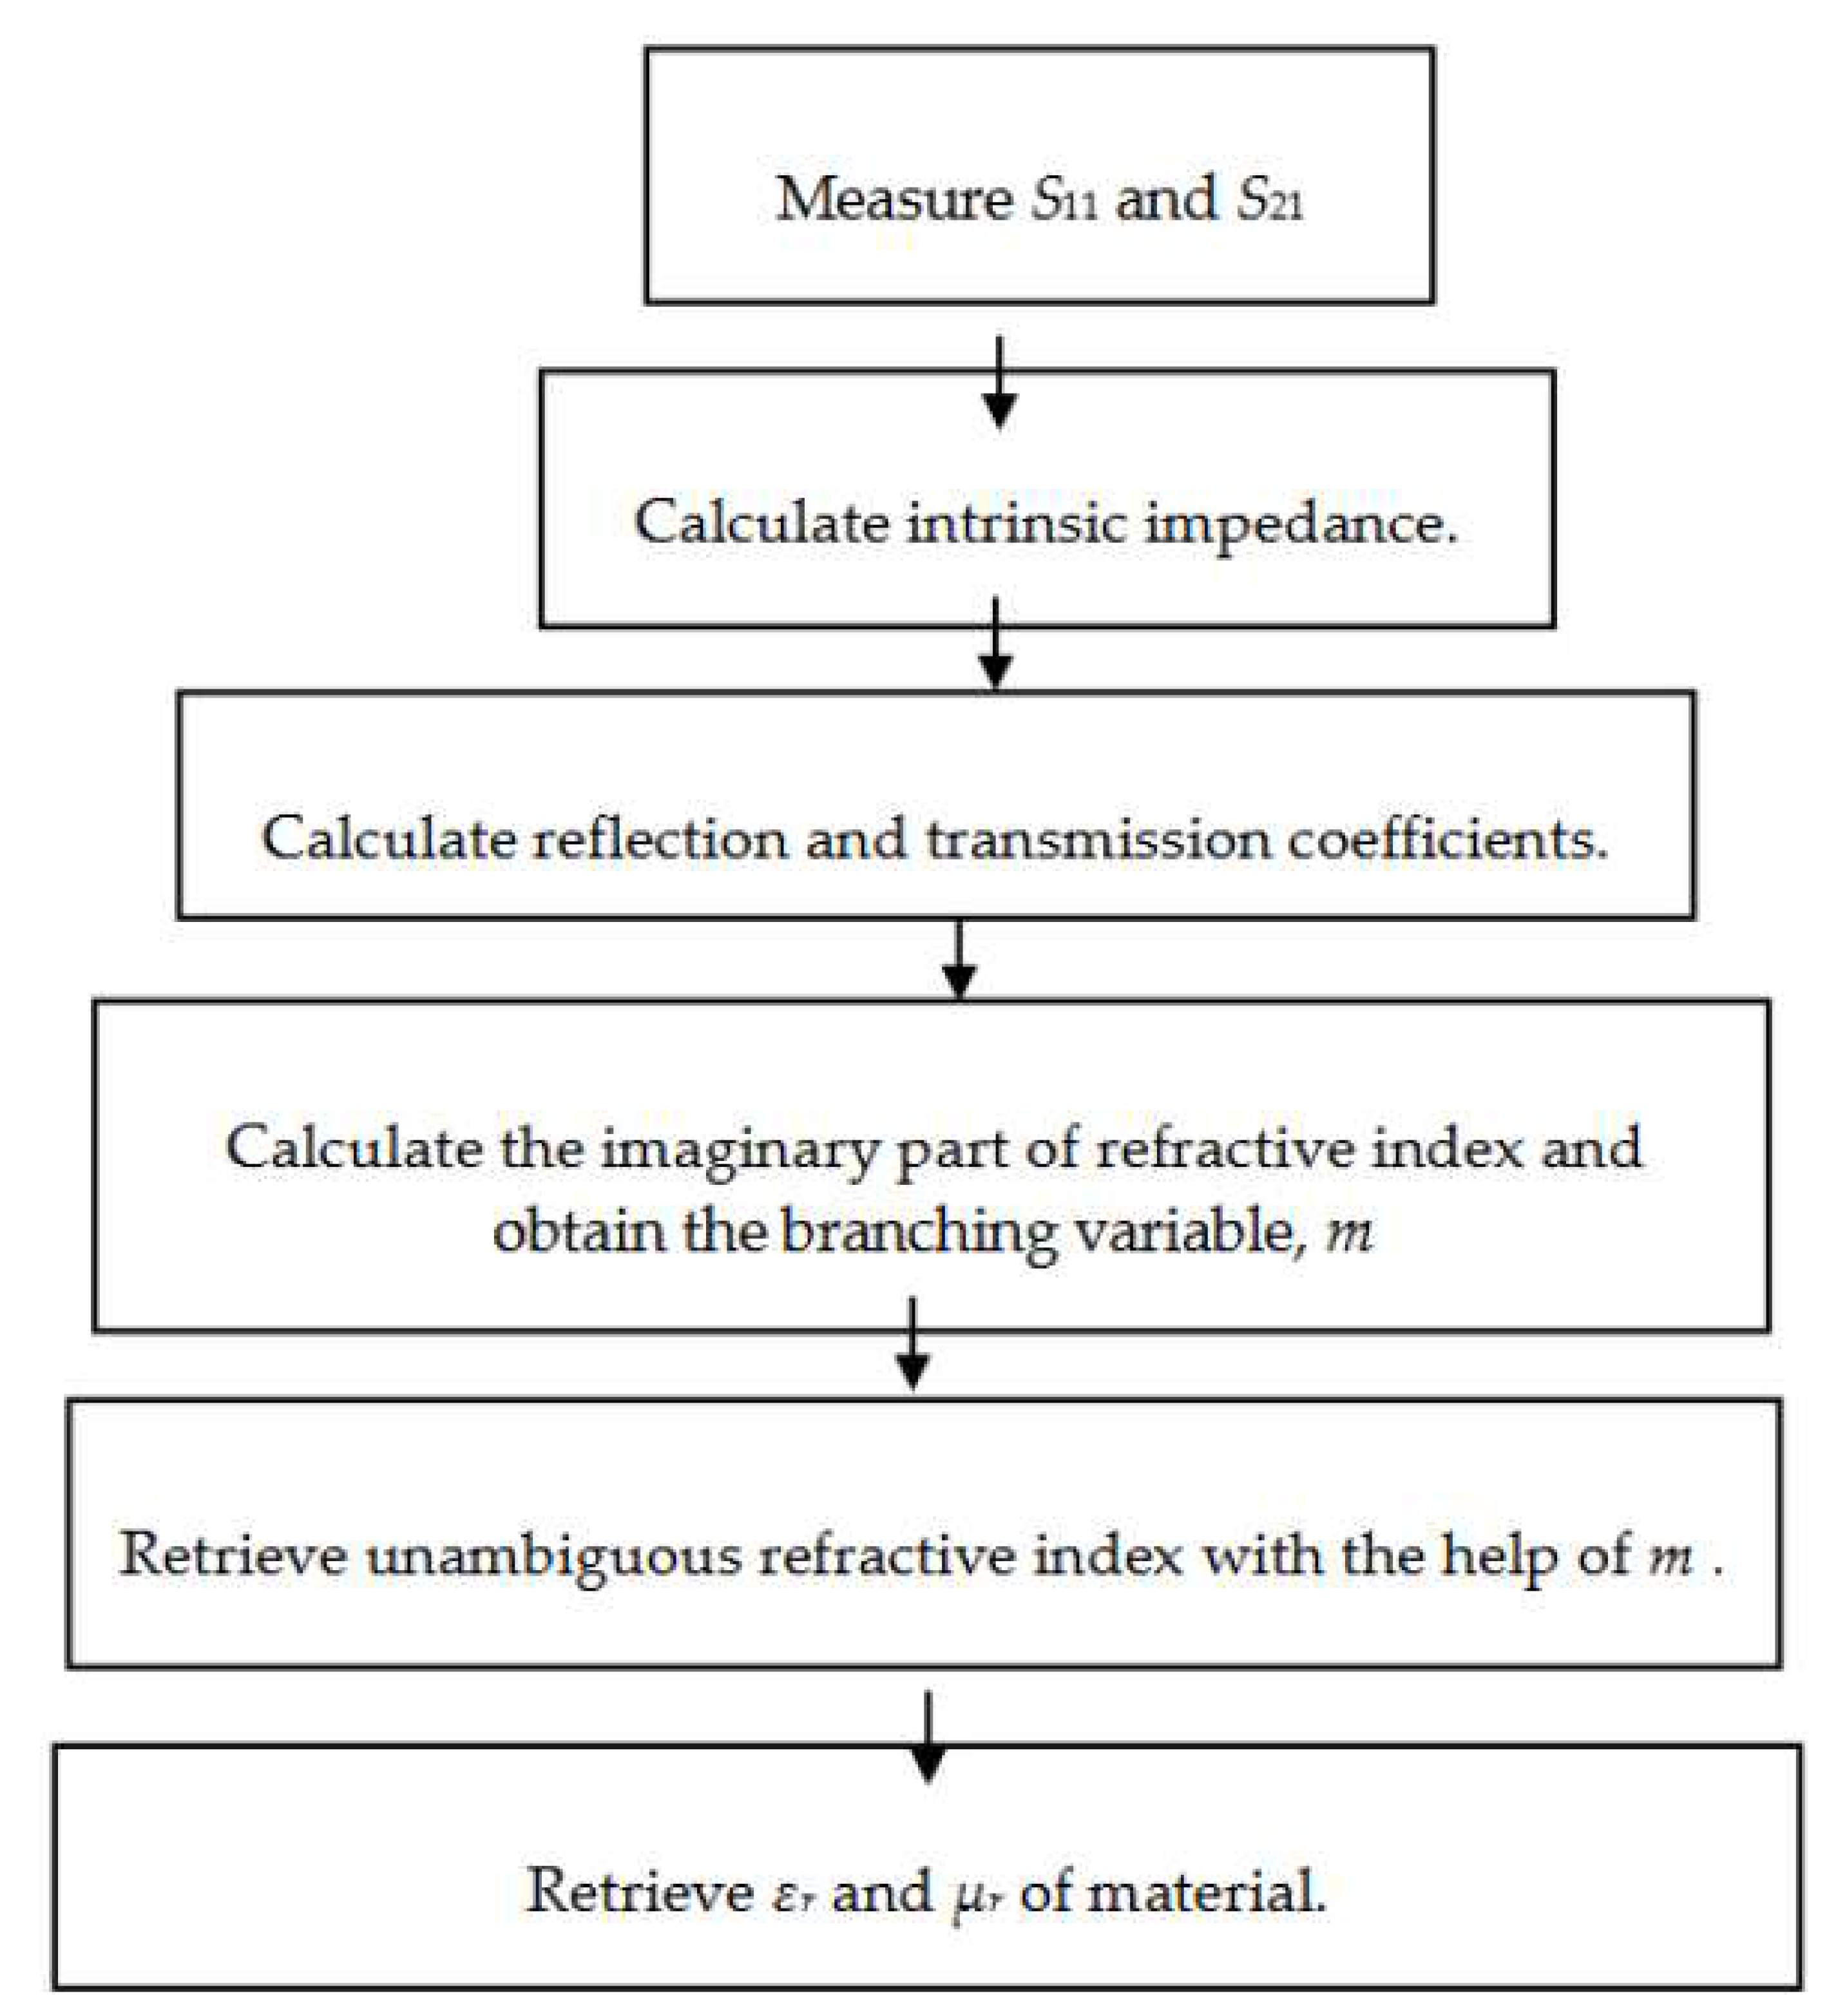
One of the issues that NRW method suffers is the phase ambiguity which is caused by the branching problem of the algorithm. This occurs when −∞≤m≤∞ , where the results obtained are accurate up to the value of m = 0. Beyond that, the phase ambiguities will increase especially for thicker materials. To overcome this, the NRW method has been modified for improved measurement accuracy, especially for nanostructured materials with better accuracy [27]. The intrinsic impedance of the slab, ƞ is extracted directly from the scattering coefficients [27]. Parameter k is the phase constant, d is the thickness of the slab, and n is the refractive index (with ƞʹ and ƞʹʹ its real and imaginary refractive index). Intrinsic impedance which has sign ambiguity in (17) can be solved by allowing Re (n)≥0. In (18), the branching value, m is unknown. From (19), ƞʹʹ can be determined ambiguously without the use of value m, which solves the ambiguity issue in NRW method [27].
η = j ln ( t ) 2 π m k o o d
η ' ' = Im g ( ln ( t ) ) 2 π m k o d
Besides that, the solution for the branching issue in NRW method was addressed in [30]. Another work in [30] proposed a method of permeability and permittivity extraction applicable for any material thicknesses. These issues will be explained in more detail shortly in Figure 11 [30].Another work in [30] proposed a method of permeability and permittivity extraction applicable for any material thicknesses. These issues will be explained in more detail shortly.
5.2.NIST Iterative Method
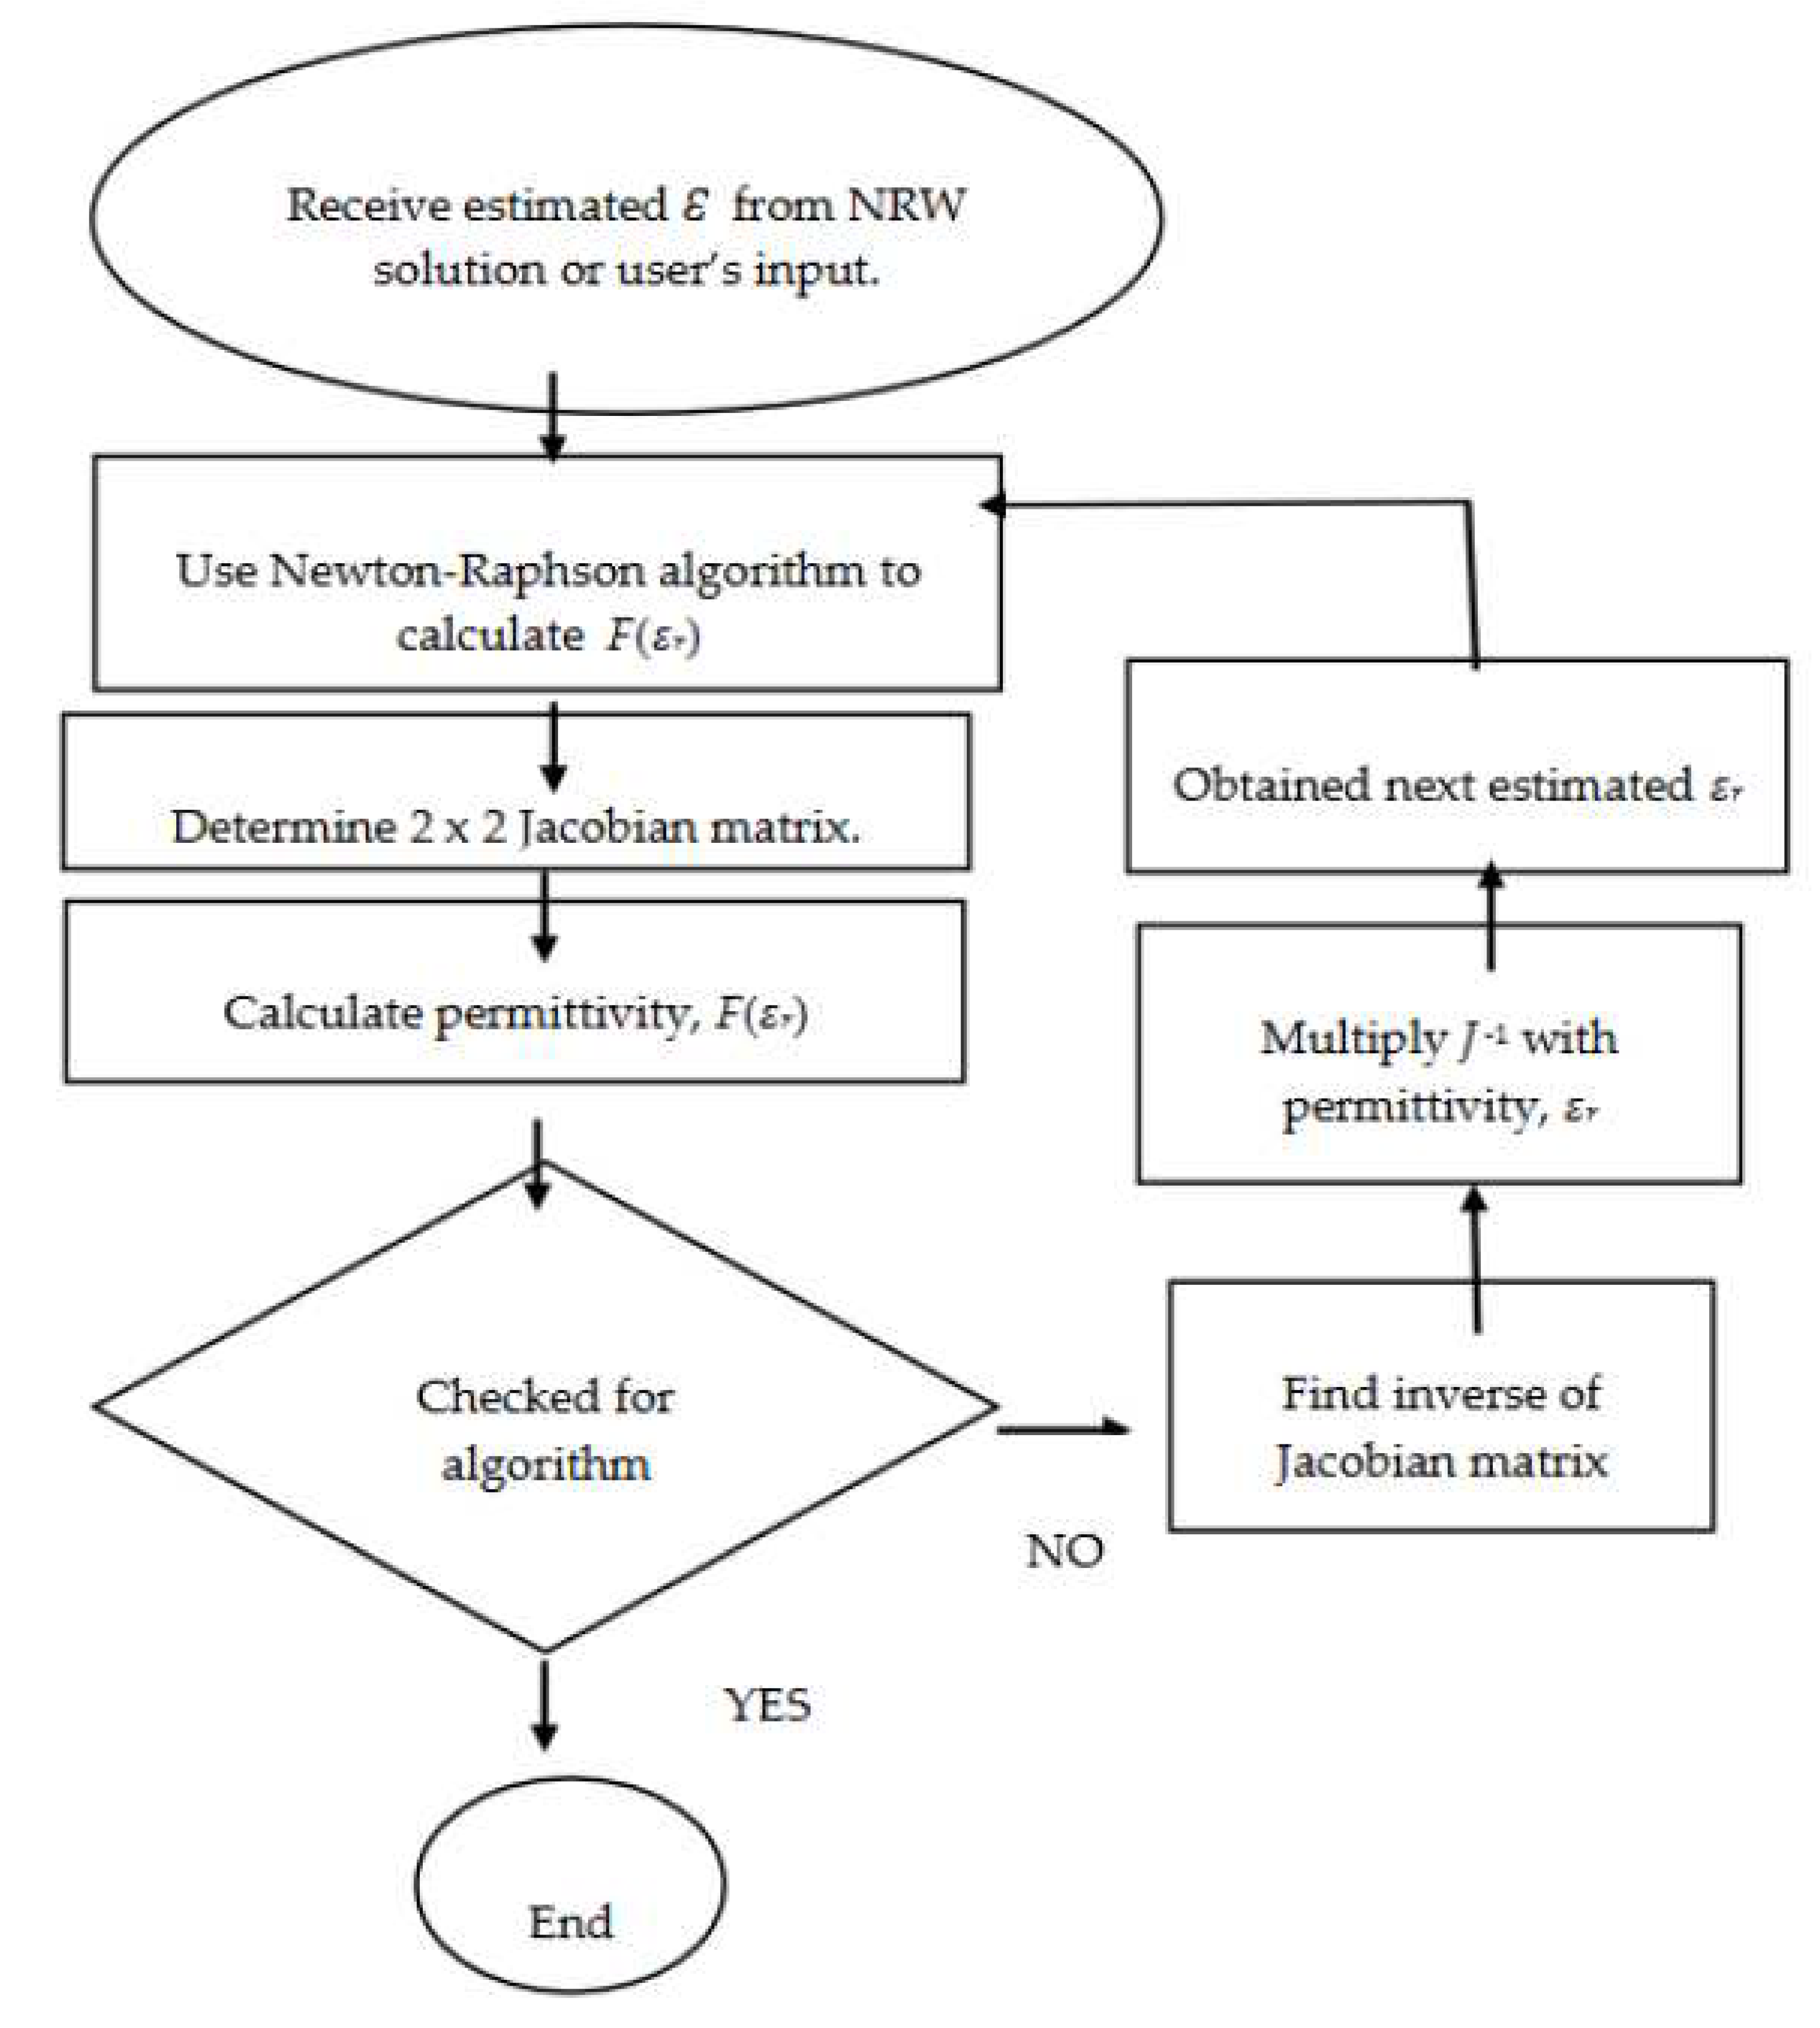
NIST method is another conversion method capable of retrieving permittivity only from s-parameters. It is suitable for characterizing low loss materials and long samples as denoted in [15].Also smooth permittivity results with no divergence could be obtained. Determining permittivity measurement is one of the limitations pf this method. When comparing with the NRW method, NRW method is better as both the permittivity and permeability of materials could be determined by setting the µr = 1. Figure 12 shows the flowchart of NIST iterative method which starts with determining Jacobian matrix, J using Newton-Raphson algorithm, followed by the calculation of permittivity, F(εr) [15].This process is performed using equations (20) to (27), with its transmission coefficient is denoted as T. Then the algorithm convergence is checked. If the algorithm does not converge, the process continues with finding of inverse Jacobian matrix, J-1 through (25). Then the inverse Jacobian matrix is multiplied with the permittivity to obtain next estimated εr, which is denoted by (26) and (27). On the other hand, the process ends with (24) when the algorithm converges.
The propagation constant, γ of material can be expressed as:
γ = j ω 2 μ r ε r c 2 ( 2 π λ c ) 2
where c is the speed of light in free space that can be defined as:
c = 1 ε o μ o
By substituting Eq. (27) into Eq. (26) , an equation with µr =1 obtained as:
γ = j μ o μ r ε o ε r ω 2 ( 2 π λ c ) 2
The reflection coefficient, Γ is then expressed as,
Γ = γ o μ o γ μ γ o μ o + γ μ = ( γ o γ ) / ( γ o γ )
The permittivity then indicated as:
F ( ε r ) = S 21 + S 12 2 ( 1 T 2 Γ 2 ) T ( 1 Γ 2 ) e j γ o ( L a i r L )
When F(εr)=0, the algorithm is considered converged. To determine root by Newton method, Jacobian matrix is then concluded as,
J = f 1 ( ε ' + h , ε ' ' ) f 1 ( ε ' h , ε ' ' ) 2 h f 2 ( ε ' + h , ε ' ' ) f 2 ( ε ' h , ε ' ' ) 2 h f 2 ( ε ' , ε ' ' + h ) f 2 ( ε ' , ε ' ' h ) 2 h f 2 ( ε ' , ε ' ' + h ) f 2 ( ε ' , ε ' ' h ) 2 h
By obtaining the inverse of the Jacobian matrix, small changes in permittivity function are expressed as:
Δ ε r = J 1 ε r
The algorithm can then be terminated oncethe F(εr) is adequately close to zero as follows,
ε r ( n e w ) = ε r + Δ ε r

5.3. New Non-Iterative Method

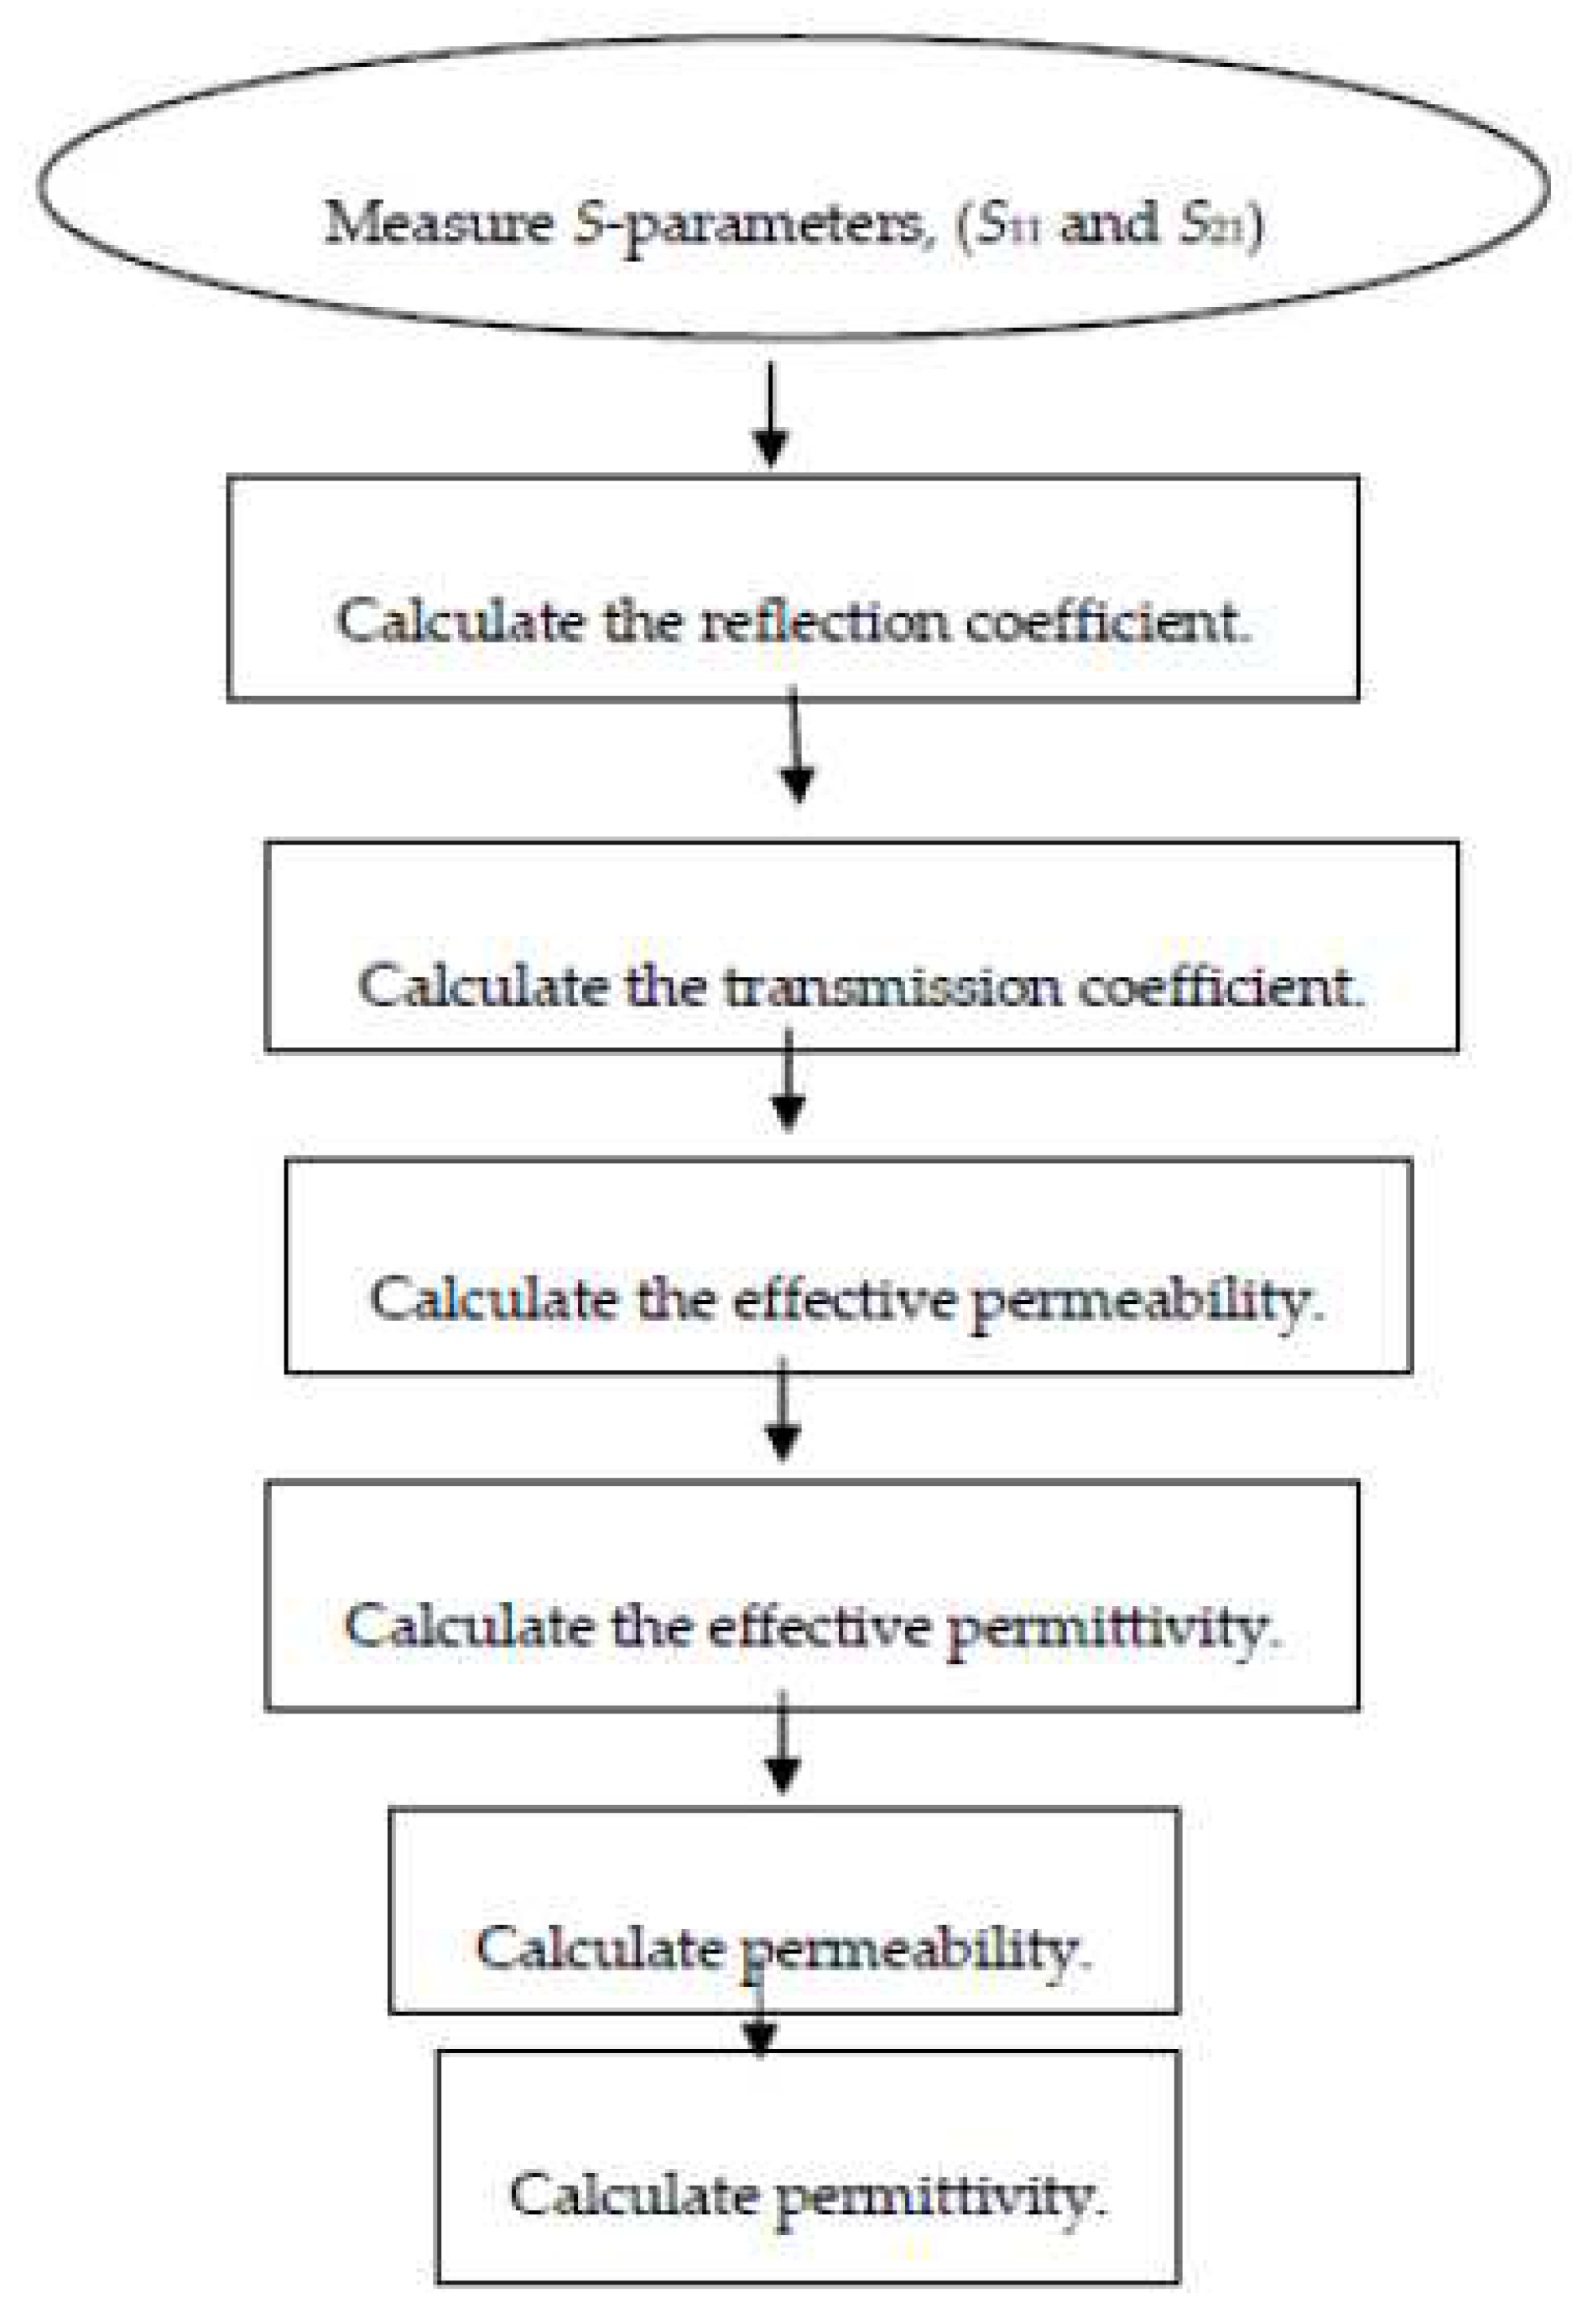
New non-iterative as shown in Figure 13 is quite similar to the NRW method with the special case that it determines the effective electromagnetic parameters which are effective permeability, µeff and effective permittivity, εeff as in equations (28) and (29) as in [15]. This method uses the same equations as the NRW method (4) to (6) to compute the reflection coefficient, Γ
nd transmission coefficient, T. Then, the permeability and permittivity could be determined through (30) and (31). For the new non-iterative method, one of the advantages is that there are no divergences seen in the sample at frequencies corresponding to integer multiples of one-half wavelength when compared to both the NRW and NIST iterative approaches in [15]. Obtaining only the permittivity measurement is one of the limitations of this method. When comparing with the NRW method, NRW method can determine both the permeability and permittivity rather than permittivity only.
The effective permeability can be expressed as
μ e f f = λ o g ( 1 + Γ 1 Γ )
The effective permittivity can be defined as,
ε e f f f = λ o g ( 1 Γ 1 + Γ )
The permeability then indicated as,
μ r = μ e f f f = 1 ( 1 + Γ 1 Γ ) 1 1 λ 0 2 1 λ c 2
The permittivity then expressed as,
ε r = ( 1 λ o 2 λ c 2 ) ε e f f + ( λ o λ c ) 2 ( 1 μ e f f )

6. Improving Measurement Accuracy

From the previous sections and literature, it is found that measurement accuracy of free space measurement systems varies depending on factors such as beam focusing, suitable calibration standards and sensitivity analysis. Horns with dielectric lens aid in focusing more radiation on the sample [25]. Suitable calibration standards aid in error correction techniques [14]. To determine the sensitivity of the proposed method, a detailed parametric analysis of the electrical properties has been performed [9]. Therefore, it is important that simple and efficient solutions are proposed to overcome them. Several main techniques that have been proposed for this purpose are:
  • Beam focusing: Inaccuracies in measurements of dielectric materials can be solved by focusing waves on the samples under measurement using horns with dielectric lens [25].
  • Measurement corrections using calibrations. Suitable calibration standard such as TRL calibration is important in order to get accurate measurement results [14].
  • Sensitivity analysis: to determine the suitability of the proposed technique and to obtain optimum meaesurement accuracy [9].

7. Lenses

Measurement errors in free space measurement systems can be reduced with the use of lenses. Lenses are used to form and maintain the Gaussian beam and to maintain the beam focus on the material under test. The dielectric focusing lenses introduced in front of the horn antenna focuses electromagnetic energy towards certain region on the test sample and decaying it very rapidly towards the edges, thus avoiding diffraction and spill-over effects [31]. The types of lenses used include parabolic [32], plano-hyperbolic [23], and hemispherical lenses [33], and are summarized in Table 10 when applied in different frequency bands. The choice of these lenses in free space measurement systems depends on the MUT, fabrication process and fabrication complexity of the lenses. From Table 10, it is observed that the hemispheric dielectric lens featured the least design and fabrication complexity compared to other lens structures [33]. Hemispheric lenses are widely used in free space measurement systems to optimize impedance matching between the aperture of the rectangular feed and the lens antennas and is applicable in upper millimetre-wave applications in [33].
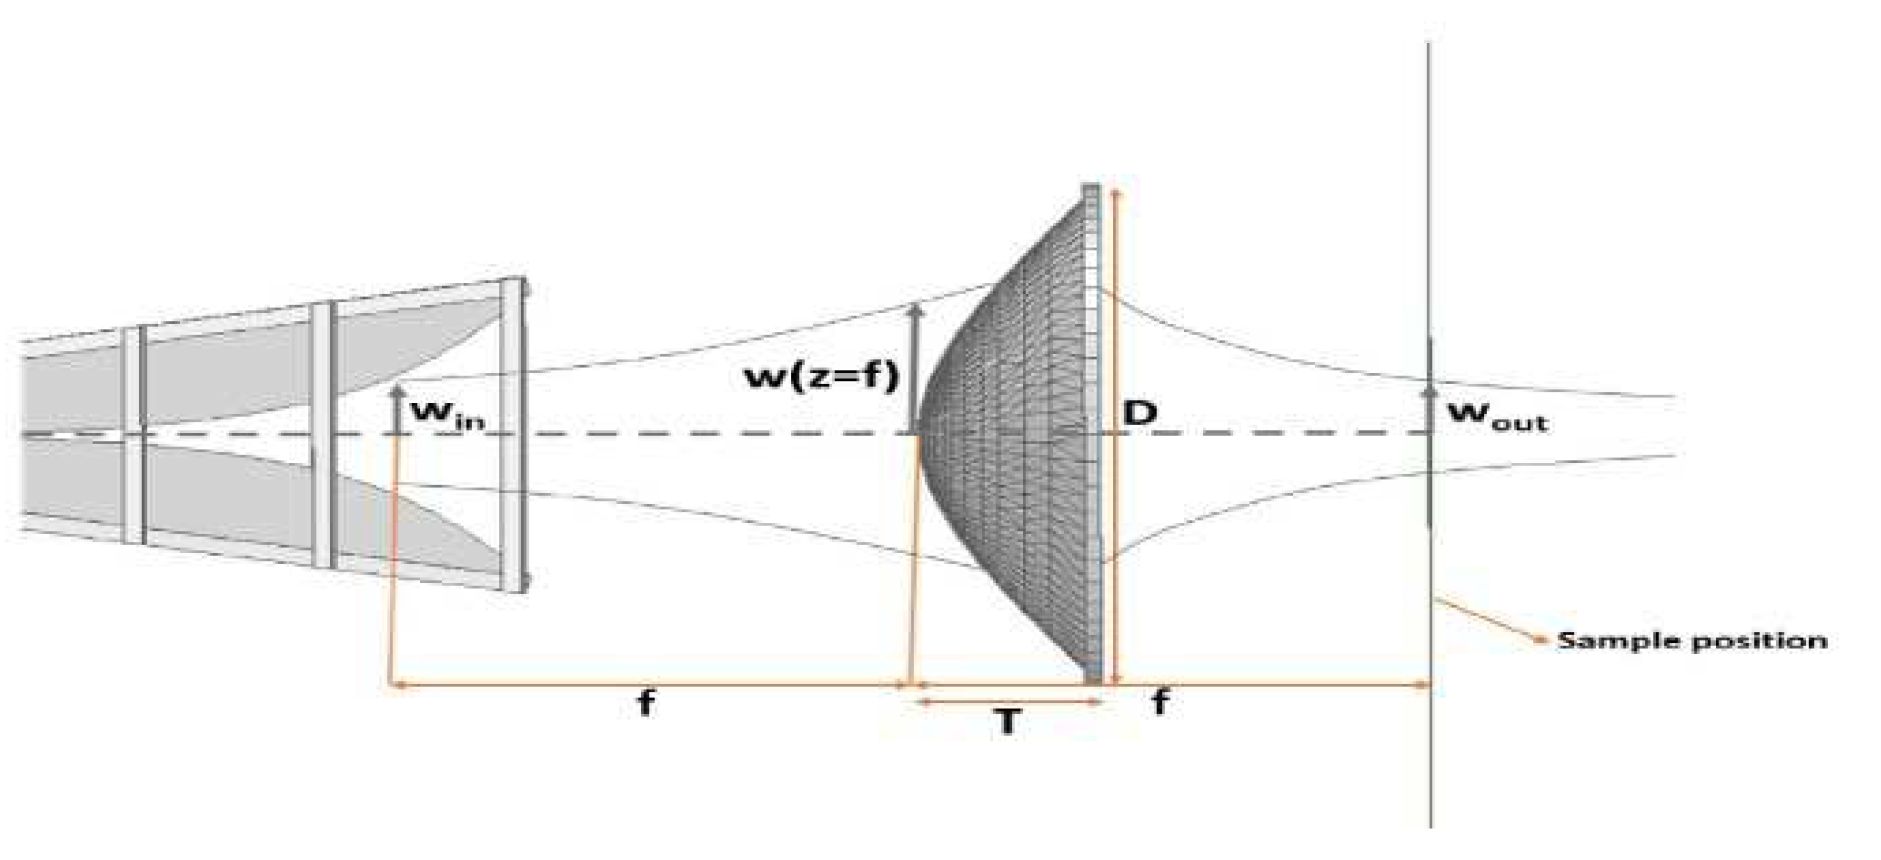
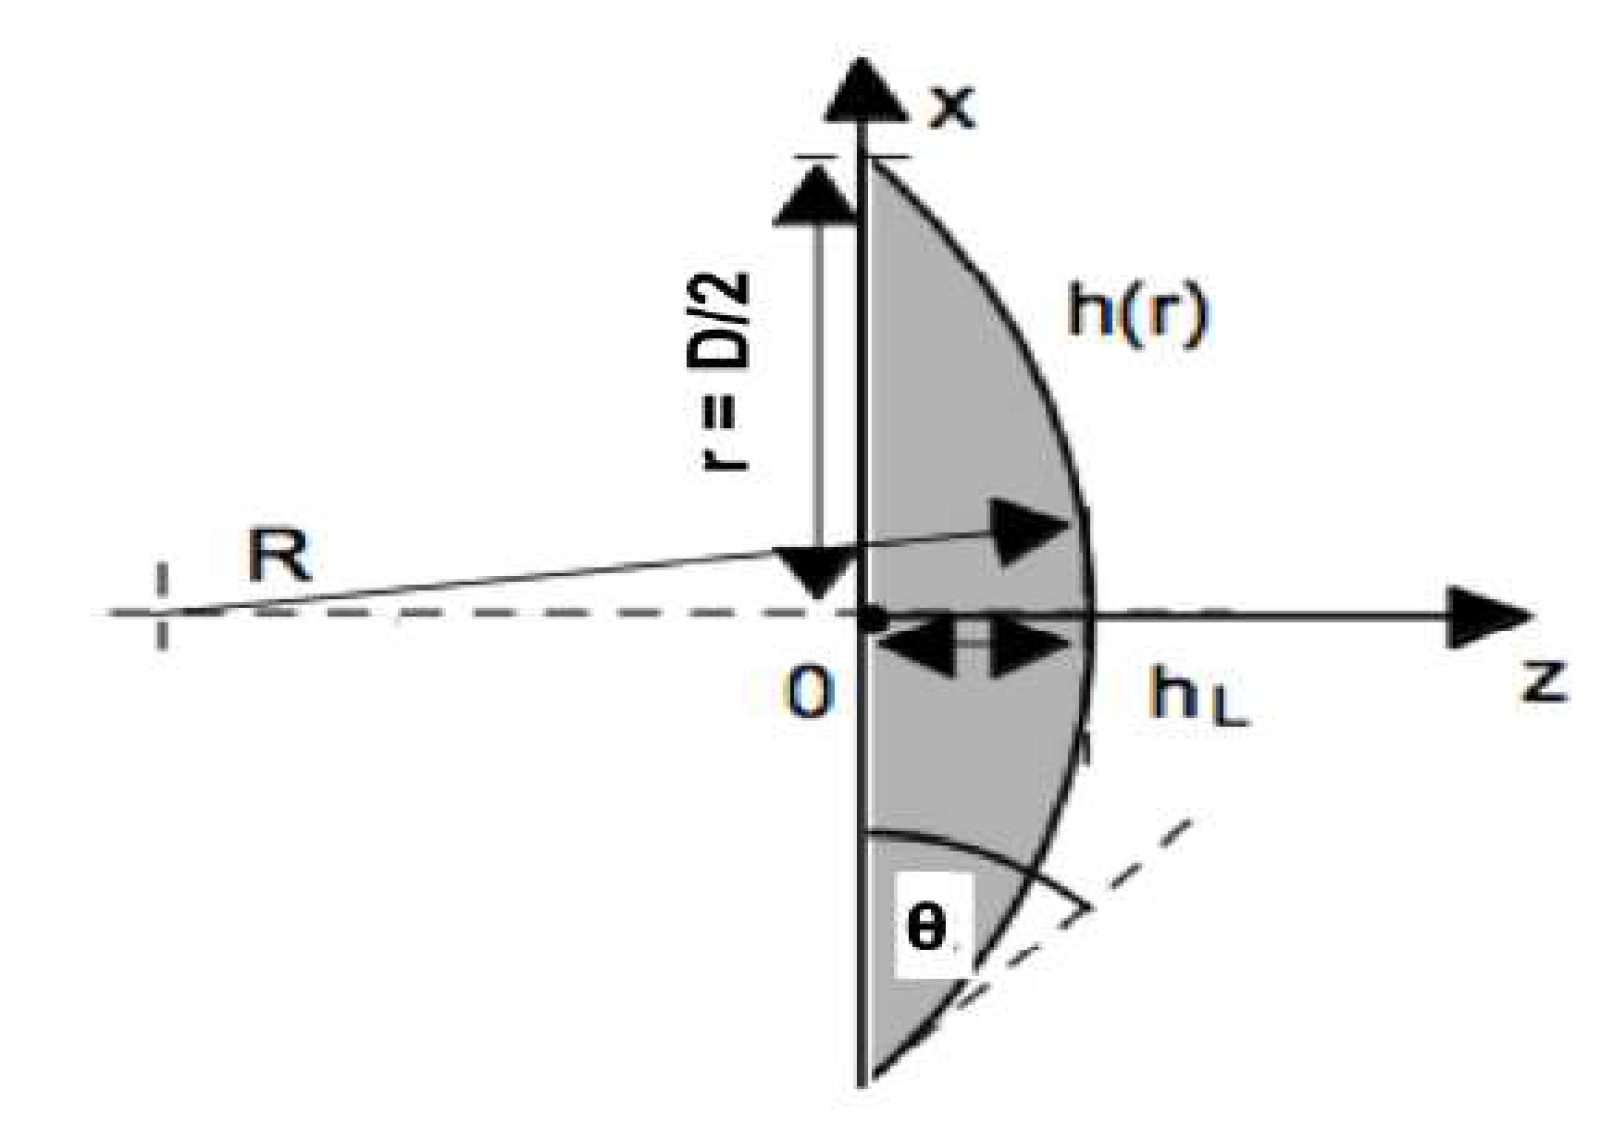
The use of plano-hyperbolic lenses as shown in Figure 14 have been recently reported to decrease attenuation losses in [23]. Such lenses is also preferred due to its thinner properties. An example is the 3D-printed lenses with plano hyperbolic lens integrated with a double ridge horn antenna with reduced errors from diffraction [33]. Calculations of the surface of the plano-hyperbolic lens is presented in (32) using cylindrical coordinates of the hyperbolic face which is r2. The thickness of the lens, T is calculated in (33), where D >4w (w = beam radius) to avoid truncation issues. D is the diameter of the lens and n is the index of refraction.
r 2 = 2 f z ( n 1 ) + z 2 ( n 2 1 )
T = f ( n + 1 ) ( 1 + D 2 ( n + 1 ) 4 f 2 ( n 1 ) 1 )
For the case of plano-convex lens in Figure 15, research performed in [34] indicated that its focal length can be determined using equation (34). Parameter R is the radius of the curvature and f is the focal length. Parameter R is the representation of R1 and R2 . For plano-convex lens,
R2 = ∞ which leads to (35).
1 f = ( n 1 ) ( 1 R 1 1 R 2 )
1 f = ( n 1 ) ( 1 R 1 )
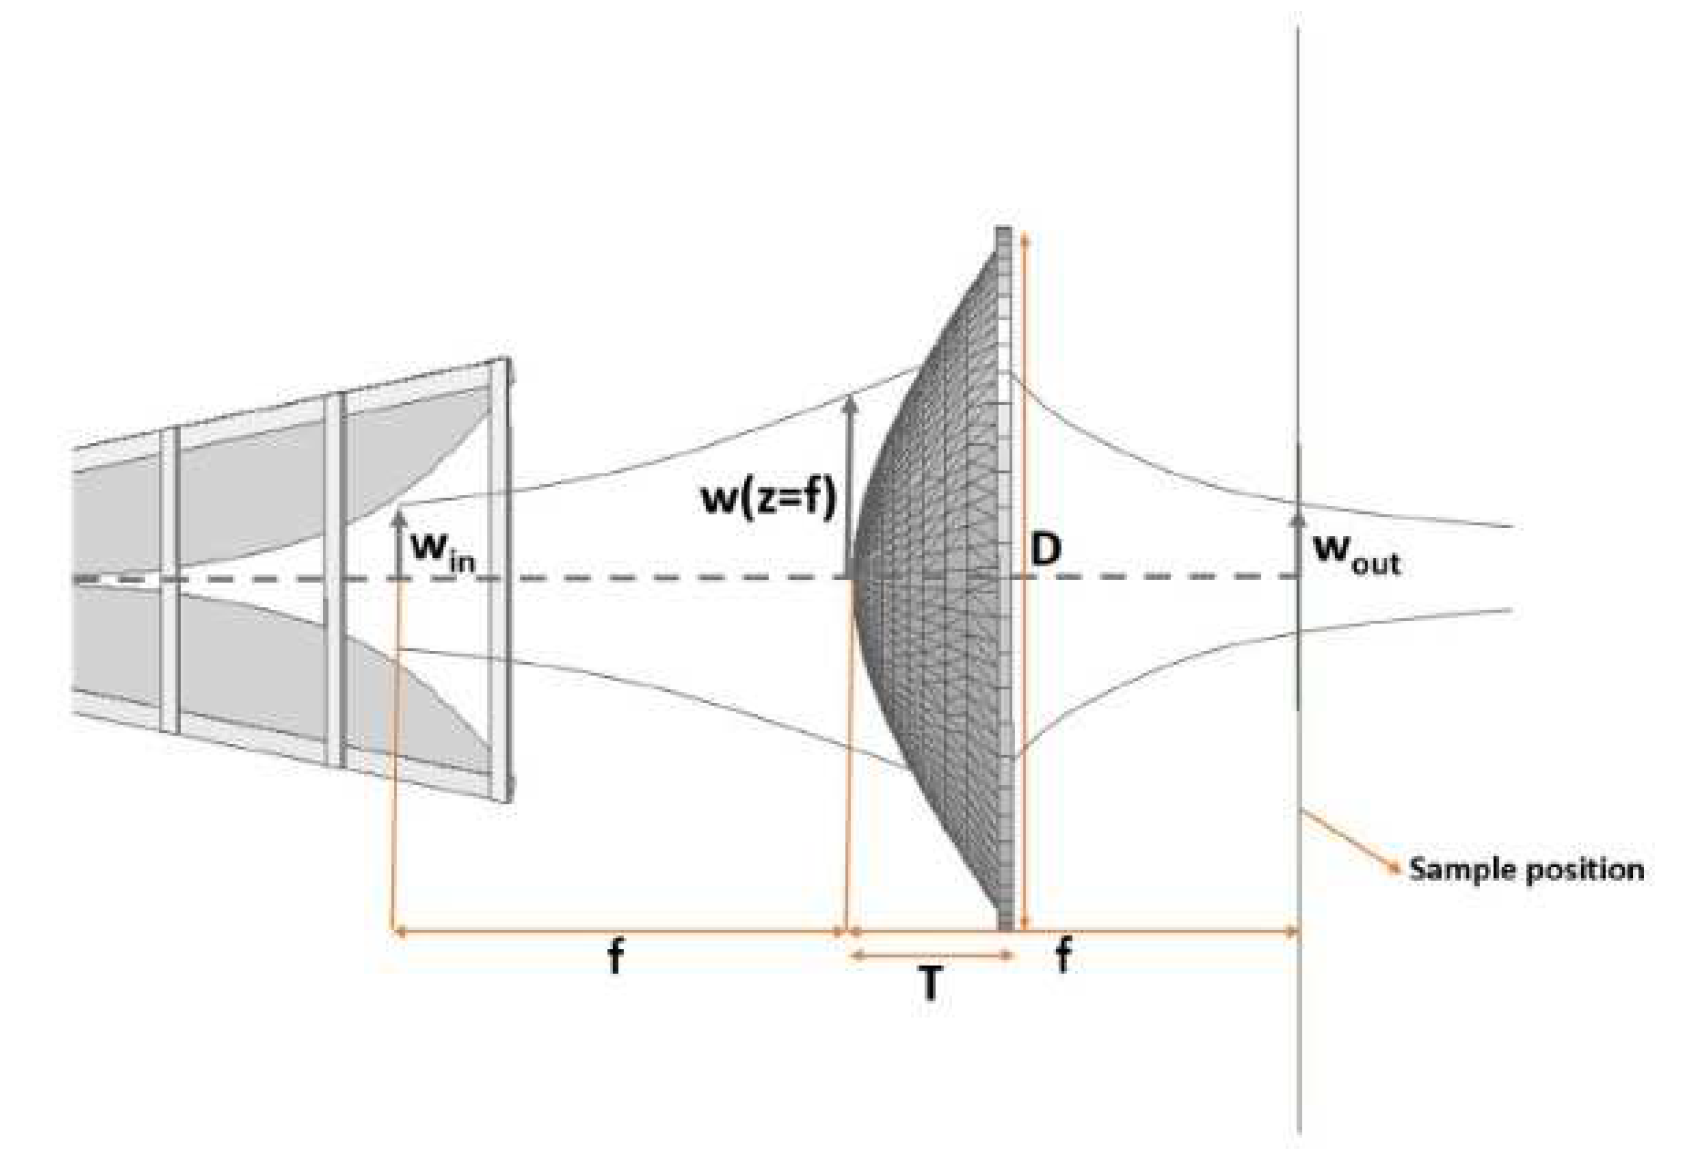
Besides that, the consequences of using quasi-optical lenses in free space measurement system was reported in [32]. By implementing 3-D printed lenses in Figure 16, conversion of spherical waves to plane wave can be performed [32]. Calculations related to the printed lenses are summarized as follows. Parameter ωin is the beam waist radius and Te represents the edge taper.
The relationship between input beam waist radius ωin , ωout, focal length, f can be expressed as,
f = π ω i n ω o u t λ o
The power of the Gaussian beam, Fe that moves through the radius, re is then expressed as,
F e = 1 T e = 1 e ( 2 ( r e ω o u t ) 2 )
The lens diameter, D is then indicated as,
D = 0.3393 T e [ 2 ω ( z = f ) ]
The function of beam radius, ω(z=f) is then expressed as,
ω ( z = f ) = ω i n 1 + ( λ o f π ω i n 2 ) 2
The thickness of the lens, T is demonstrated as,
T = ( 1 ε r + 1 ) ( f 2 + D 2 4 ( ε r + 1 ε r 1 ) f )
The cartesian coordinate representation of quasi-optical lens is then concluded as,
x 2 + y 2 = ( ε r 1 ) z 2 + 2 f ( ε r 1 ) z
Usage of lens allows the wave to undergo retardation and allows the collimation of EM rays.

8. Calibrations

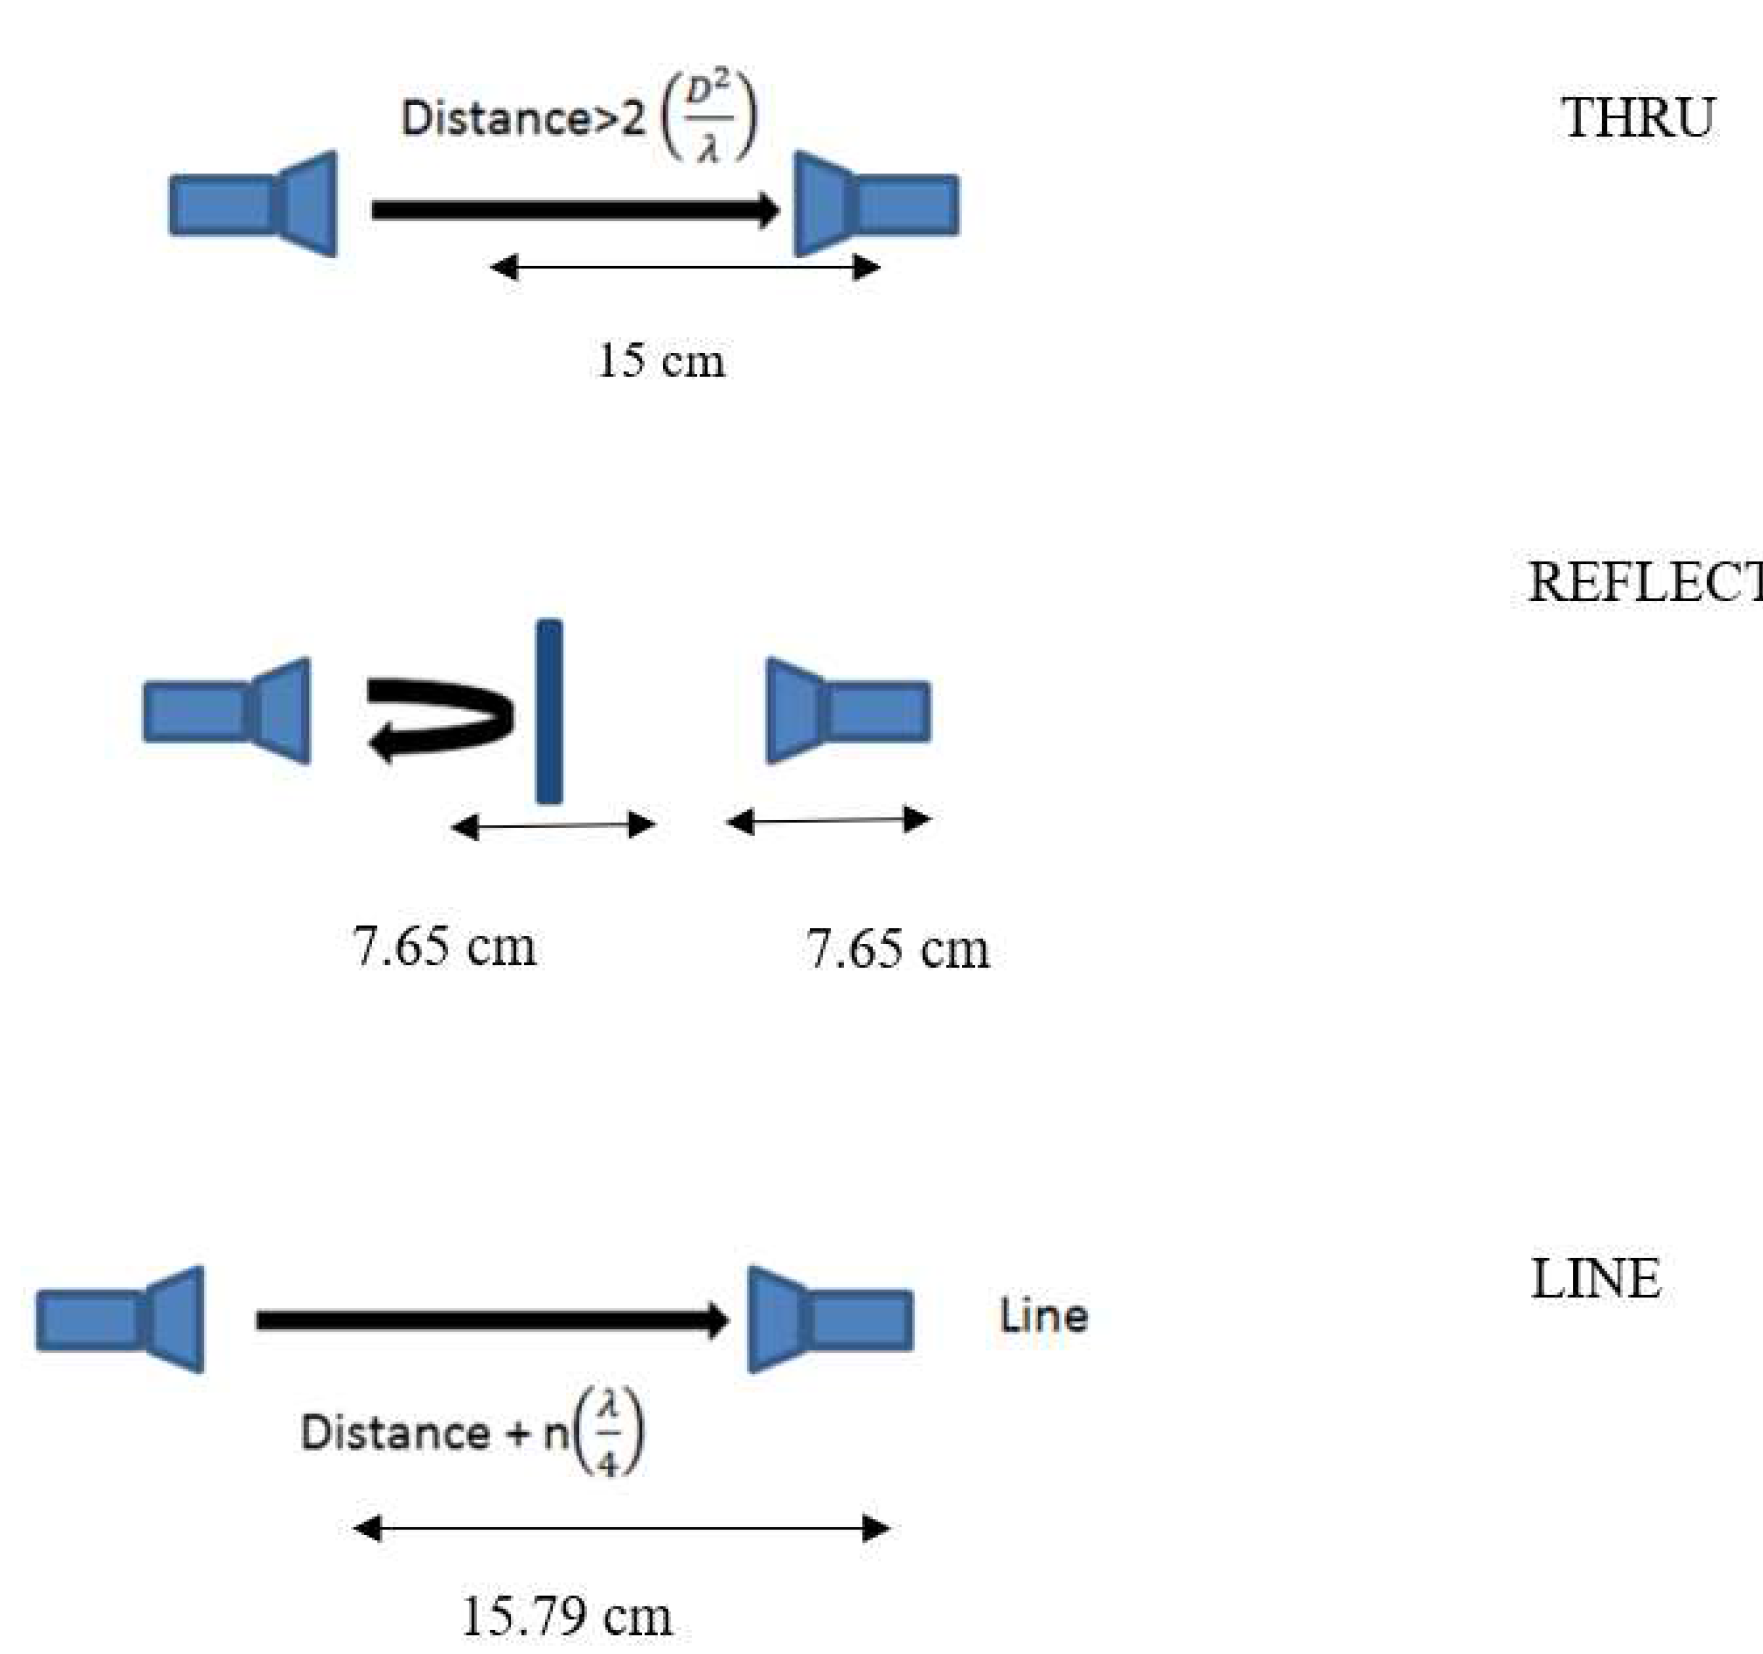
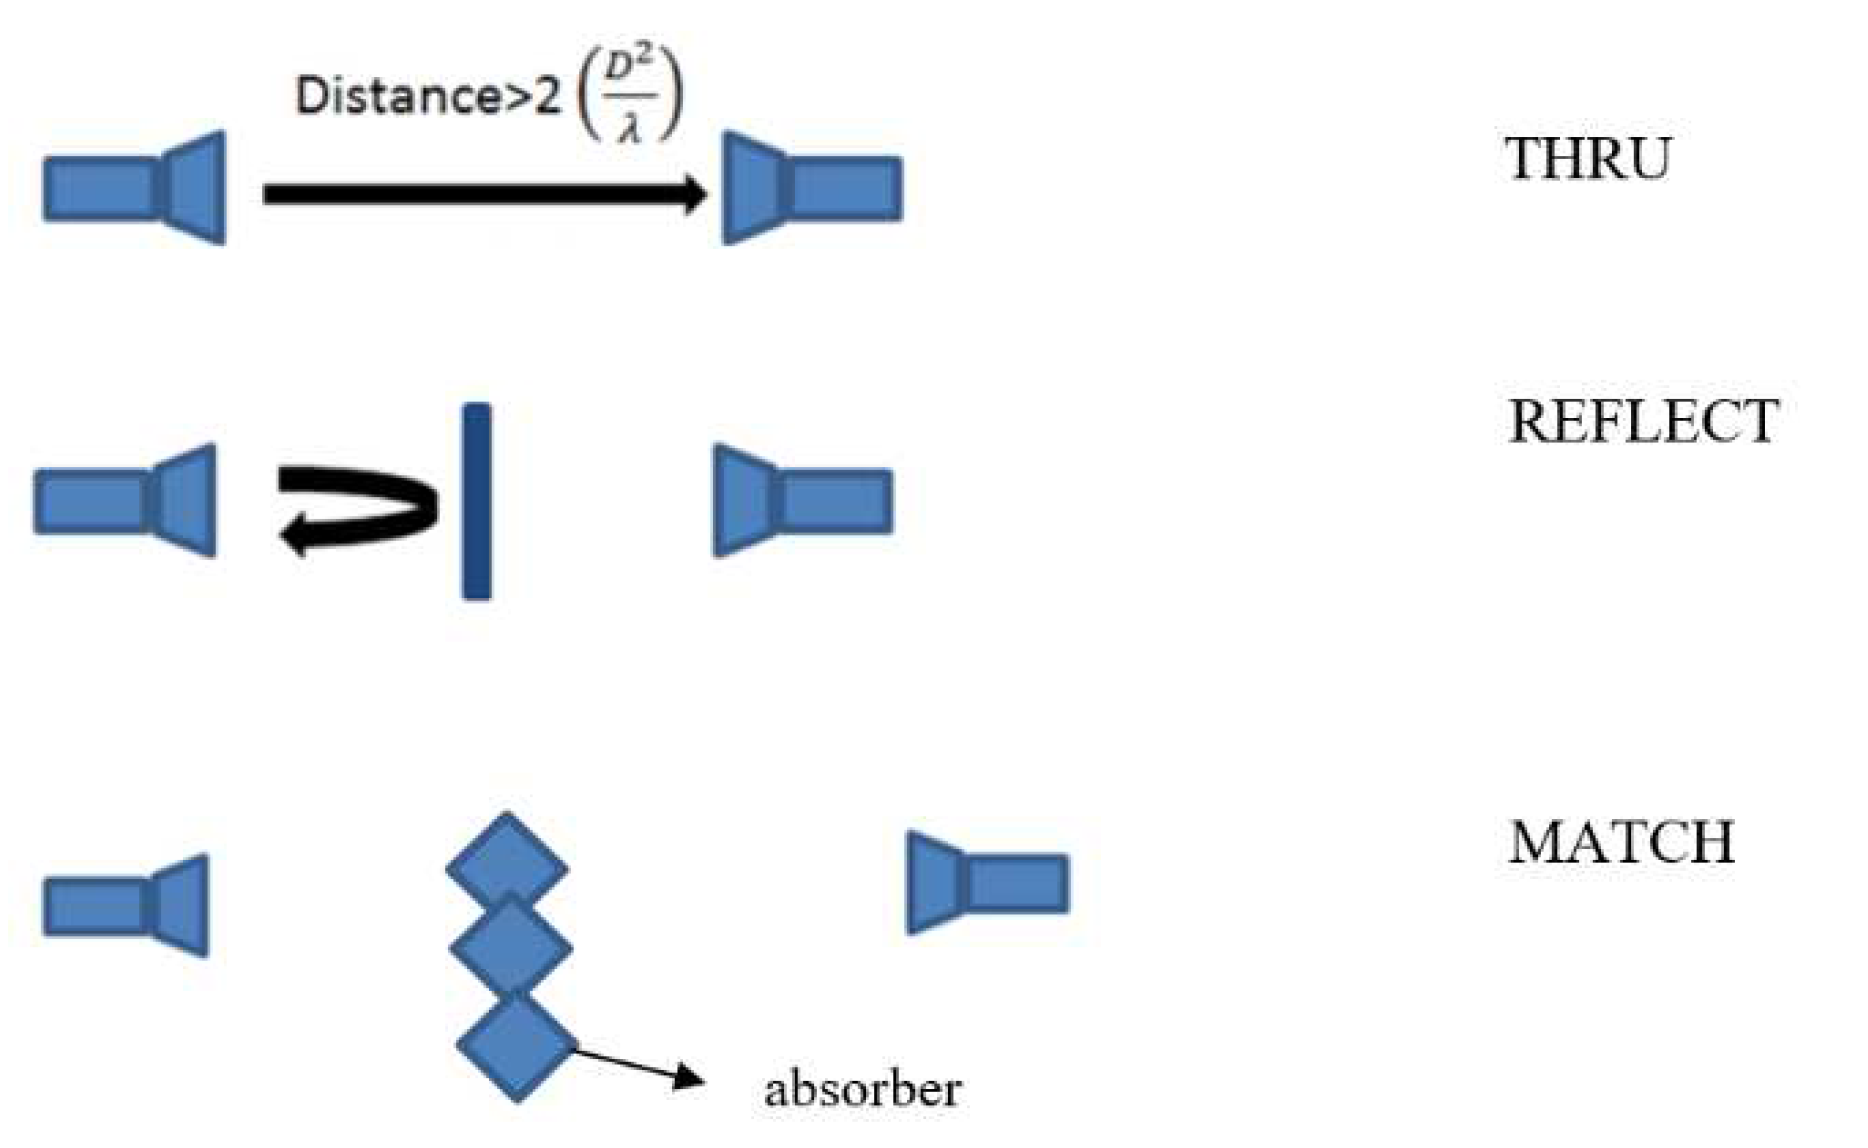
(TRL), Gated Reflect Line (GRL), Thru-Reflect-Match (TRM) [16,20,21]. TRL calibration mostly used as it has high level of accuracy, and its accuracy increases with the quality and repeatability of the TRL standards as in [20]. This method is preferred due to its ease of implementation and better resulting measurement quality . For the TRL calibration, the THRU standard calibration is performed by connecting the transmission lines directly setting up a distance between the horn antennas while the REFLECT standard is performed with metal plate of known thickness in between two horn antennas. For the LINE standard, one of the antennas is moved by a quarter of a wavelength relative to the THRU standard. Accuracy can be improved by using metal plate with same thickness as Material Under Test (MUT) during REFLECT calibration. To verify the calibration accuracy, the reflection coefficient can be measured at both ports using calibration standards in a variety of mechanical lengths. For example, Figure 17 illustrates the process of TRL calibration. For the THRU standard to be achieved, the distance between the antennas would be 15 cm, as shown in Figure 17 [20]. For the REFLECT standard, The transmitter and receiver antenna must be moved backwards to offset the thickness of the MUT, which is 0.3 cm prior being placed to their original positions. Next, for the LINE calibration, one of the antennas must be offset by a quarter of a wavelength, which in this case is 0.79 cm. Upon completion, the antenna is then moved back to its original position. The procedure to perform TRM calibration is similar to the steps in TRL calibration, except that the LINE standard is replaced with the MATCH standard. The MATCH standard calibration is done by placing an absorbing material in between the horn antennas, and only the impedance values need to be collected during this step , as shown in Figure 18.

9. Sensitivity Analysis

Sensitivity analysis is important to determine the suitability of any proposed technique. Optimum accuracy could be achieved through the obtained range of parameters. Detailed parametric analysis can also be performed with respect to electrical properties of materials. Parametric variations are closely analyzed to improve the measurement accuracy. The sensitivity analysis will determine whether the proposed technique is well suited or not for measurement. Before testing the proposed technique's validity against experimental data, it is tested against independent simulation data to closely monitor the accuracy and range of the feasibility of the proposed technique, as shown in Figure 19 [9]. The actual and reconstructed relative permittivity, effective conductivity, and thickness of various standard materials was determined. Besides that, the effectiveness of various lossy dielectrics can be assessed using the proposed technique, and the typical accuracy can be measured as denoted in [9]. Sensitivity analysis also done to find the range of parameter values that will result in the best accuracy [9].

10. Extending Measurements to the Upper Millimetre-Wave Range

Two methods have been mainly proposed to extend material measurements towards the upper millimeter-wave (mmW) range: (i) the time-domain spectroscopy (TDS) method and (ii) the free-space method [34]. The TDS method uses pulse waves that passes through the MUT when measured in the time domain, whereas the free space method uses radio waves the S-parameters while TDS method uses.
In this work, the suitability of measured complex relative permittivity in the THz band was determined by comparing the complex relative permittivity obtained using a VNA with that obtained using TDS [34]. Although aligning the transmitting and receiving antennas is simple with the free-space approach, the measuring frequency is limited by the size of a waveguide. Moreover, despite the wide TDS measurement frequency range, the accuracy of the measurement is lower because the signal-to-noise ratio deteriorates at low frequencies. The positioning of the transmitting and receiving antennas was carefully adjusted to receive the maximum level. TDS alignment is more challenging than free-space alignment using a VNA. TDS method can be used for high frequency in which changes to frequency domain is done through the Fourier transform. The frequency range of the measurement and the measurement precision must both be taken into consideration when choosing a measurement method. The measured complex relative permittivity by VNA and TDS were found to be within the error bar. The 220-330 GHz range was covered by both measurement techniques and both the measurement methods were used to validate the availability of the measured complex relative permittivity.
For the free space method, a systematic study on the measurement of dielectric properties of photopolymer from 220 GHz-320 GHz was performed in [33]. Table 11 shows the dielectric lens antenna parameters reported in this review, whereas Table 12 presents the dimensions of the designed and fabricated dielectric lens antenna [33].
Comparison of the complex relative permittivity values obtained using these two methods were performed on materials such as PPE, PTFE, epoxy composite and cyclo olefin polymer using in [35] from 220 to 330 GHz. For the TDS method, the signal-to-noise ratio becomes poorer in the lower frequency bands below 300 GHz during the measurements as the measurement preciseness is worse at the broadband frequencies. Aligning the VNA during free space calibration is easier compared to when using TDS method when measuring materials of different thicknesses, as shown in [35]. This table also shows the minimum and maximum thickness values for the MUTs used in the TDS methods. The thickness variation of the MUT causes dispersion and influences the accuracy of the complex relative permittivity.
A non-iterative extraction technique used in measuring complex permittivity of materials using the transmission-reflection-based free-space method from 220 to 325 GHz was presented in [36]. However, when the measured S21 is greater than the measurement instrument's threshold level, the proposed method can also be used to extract complex permittivity of lossy materials. The suggested noniterative extraction method for the transmission-reflection-based free-space method at terahertz frequencies is effective in lowering the characterization resonance [36]. Table 14 shows the permittivity values of the MUTs (Teflon, PTFE, Rogers 4350B and air) based on frequencies [36].
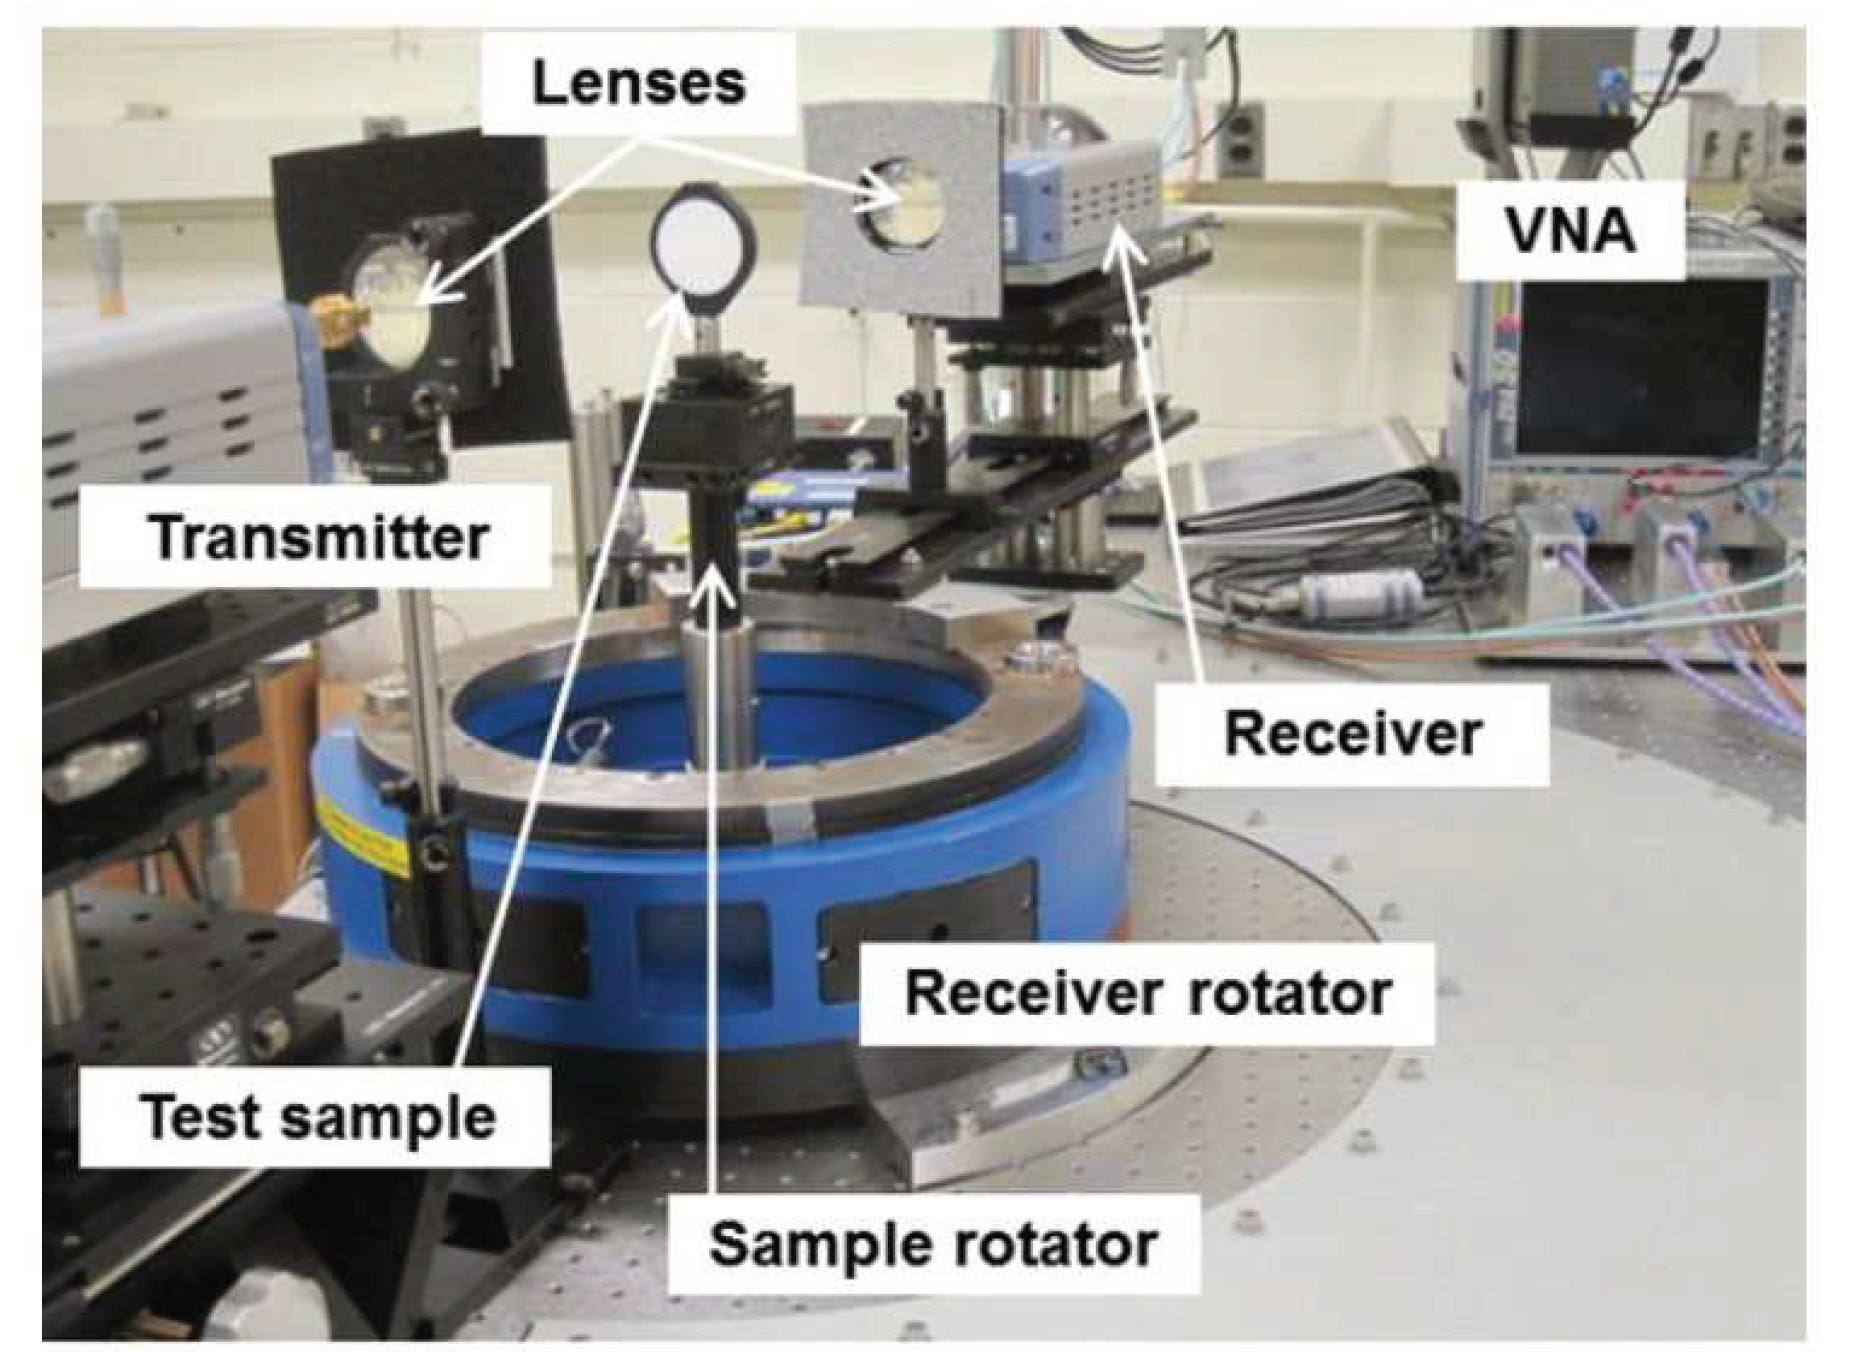
Next, the dielectric properties of low-loss dielectric materials from 220 to 325 GHz was measured in [37]. This was performed through the bidirectional scattering measurement system which comprises of the sample, transmitter, receiver, receiver rotators and VNA, as shown in Figure 20 [37]. The transmitters and receivers consists of frequency up/down converter and antenna. Measurements samples include two-cross linked polystyrene, PTFE and polymethylpentene as shown in Table 15.
As summary, measurements of complex permittivity of materials in the upper mmW range involves two main methods, the free space method based on transmission theorem and the TDS method [33,35]. Besides that, the non-iterative extraction techniques were chosen to lower the resonance needed for free space measurements. Dielectric characterization of low loss materials can also be performed in the upper mmW by implementation of bidirectional scattering measurement system [37]. Finally, important factors in choosing suitable material measurement technique in this band considers the targeted frequency range, suitable extraction techniques and required measurement accuracy.

11. PCBs for mm Waves

Three popular circuit designs are often the foundation of high-frequency PCBs are the grounded coplanar waveguide (GCPW), microstrip, or strapline circuits[38]. Due to skin effects, current density will be narrower in a cross-sectional view at higher frequencies, although the E fields will be denser. For mm Wave circuits to have repeatable, high-quality performance, it is necessary to have well-controlled PCB fabrication processes [39]. For mm Wave circuit fabrication to be successful, variations in copper plating thickness and the final plated-finish applied to copper surfaces might affect the performance of a mm Wave circuit. Additionally, certain PCB fabrication processing effects could have an impact on a material's derived dielectric constant when measured in circuit form. The thickness of the copper plating and its typical variance may be one of these factors. The final plating finish and its variations may have an additional impact. The circuit's design and construction will have a significant impact on these potential effects on circuit performance, which may change the material's extracted dielectric constant value. For the characterization of pure dielectrics, cavity methods are not feasible at higher frequencies. To achieve efficient beam acceleration and reduce power requirements, the RF cavities need to be tuned such that the resonance frequencies are equal to their excitation frequencies. Due to a high-quality factor, the cavities operate in a very narrow bandwidth; hence, any small de-tuning of the cavity’s natural resonance frequency leads to an energy spread at the target. At high frequency waveguide is small, machining should be precise, so the cavity methods are not feasible at higher frequencies. Also, the copper roughness effects can be very important to understand for determining the proper dielectric constant value to use for circuit design and simulation. Copper surface roughness have impact on the extracted material properties as the surface of copper in contact with the sample.

12. Challenges, Current Solutions and Benefits of Free Space Method

During the method selection, parameters like the measured frequency range, the anticipated permittivity value, the desired measurement accuracy, the material's qualities (homogeneous, isotropic), and its form (solid, liquid, and gas), must be considered. The fundamental procedure is to completely determine the dielectric properties, even though the studied material varies depending on where they are applied [40]. This allows for a more accurate measurement to be made once the best measurement technique has been chosen. Because antenna designs and productions are classified based on specific wave lengths, multiple antenna sets are required for wide band measurement, or the measurement must be limited to a specific frequency band for the free space method. As a result, the discrete measurement is a constrain of the FSM method. When it comes to measuring length, FSM is helpful. The transmitted and reflected signals can be measured in seconds after the calibration process is completed. For today's technology, the free space measuring (FSM) method is the most appropriate one when the required frequency range is large. As a result, complex permittivity can be precisely measured across a large frequency range using both sophisticated measuring equipment and the FSM method. The FSM approach allows for the measurement of S-parameters in contactless, non-destructive, high temperature, wide frequency range, various substance forms, and particularly for nonhomogeneous materials.

13. Conclusions

This paper reviews the various methods for high frequency electrical characterization of material properties, which can be done either using the free space method, transmission line method, waveguide method, coaxial probe method, and cavity method. The selection of suitable methods for this purpose are dependent on the material type and thickness, parameter of interest, frequency range and required accuracy. A particular focus of this review is on the measurement of a material's electrical properties, particularly its complex permittivity using the free space measurement method. Several other important considerations for free space material measurements are as follows:
  • Calibration techniques: By choosing suitable calibration standards, measurement errors can be minimized. Several important calibration techniques are the Thru-Reflect-Line (TRL), Gated Reflect Line (GRL), Thru-Reflect-Match (TRM) [20,21,41]. Most material measurement methods use TRL calibration for error corrections due to its satisfactory accuracy and repeatability.
  • Conversion algorithms: The three main algorithms are NRW, NIST iterative and new non-iterative. Generally, NRW algorithm or modified version of NRW algorithm are widely used as the conversion algorithm [24] due to their satisfactory accuracy.
  • Beam focusing for upper mmW measurements: When combined with horn antennas, more radiation can be concentrated MUTs in material measurement system [25]. They include parabolic [32], plano-hyperbolic [23], and hemispherical lenses [33] for beam focusing onto the MUTs.
The free space method is chosen as the focus in this review due to its wide applicability across different material types and thicknesses. More importantly, another factor of this choice is also its potential in characterizing materials up to the upper mmW frequencies. Research in the free space measurement technique can be further developed in the future by considering improved calibration standards, conversion algorithms and measurement techniques to improve measurement accuracy.

Funding

This work was supported in part by the Malaysian Technical Universities’ Network (MTUN) Matching Research Grant awarded by the Ministry of Higher Education of Malaysia (MOHE) (Project No.UniMAP/PPPI/GRN IRPA/MTUN/9002- 00101/9028-00016).

Data Availability Statement

Not applicable.

Acknowledgments

The author would like to acknowledge the support from the Malaysian Technical Universities’ Network (MTUN) Matching Research Grant awarded by the Ministry of Higher Education of Malaysia (MOHE) entitled “A Free Space Material Measurement System” (Project No.UniMAP/PPPI/GRN IRPA/MTUN/9002- 00101/9028-00016). The work of P. J. Soh was supported by the Academy of Finland 6G Flagship under grant 318927.

Conflicts of Interest

The authors declare no conflict of interest.

Abbreviations

The following abbreviations are used in this manuscript:
MUT Material Under Test
VNA Vector Network Analyzer
TRL Through-Reflect-Line
IPG Iron Phosphate Glass
TDS Time-Domain Spectroscopy
GRL Gated Reflect Line
TRM Thru-Reflect-Match
SOL Short Open Load
NRW Nicolson Ross Weir
PMMA Polymethylmethacrylate
PTFE Polytetrafluorethylene
TFE Time From Excision
LIG Lanthanum Iron Garnet
PVDF Polyvinylidene fluoride
W/C Water/Cement
TO Transmission-Only
RO Reflection-Only
TDG Time Domain Gating
RF Radio Frequency

References

  1. Lim, S.;Kim, C.Y;Hong, S. Simultaneous Measurement of Thickness and Permittivity by Means of the Resonant Frequency Fitting of a Microstrip Line Ring Resonator. IEEE Microwave and Wireless Components Letters.2018, 28, 539–541. [CrossRef]
  2. Ab Jabal, S.N; Seok, Y.W; Hoon, W.F. Carbon Composition Carbon Composition, Surface Porosites and Dielectric Properties of Coconut Shell Powder and Coconut Shell Activated Carbon Composites. ARPN Journal of Engineering and Applied Sciences.2016, 11.
  3. . [CrossRef]
  4. Ozturk,T; Tahir Güneşer,M.Measurement Methods and Extraction Techniques to Obtain the Dielectric Properties of Materials,1st ed.; Intech Open:Rijeka,2019;pp.1-27. [CrossRef]
  5. Keysight Technologies Basics of Measuring the Dielectric Properties of Materials Application Note Introduction Industry Applications/Products. Available online: https://www.keysight.com/us/en/assets/7018-01284/application-notes/5989-2589.pdf (accessed on 3 June 2023).
  6. Brinker,K;Dvorsky,M;Tayeb,M;Qaseer,A;Zoughi,R. Review of advances in microwave and millimetre-wave NDT&E: principles and applications. Philophical Transactions of The Royal Society A.2020, 378. [CrossRef]
  7. Krupka,J. Microwave Measurements of Electromagnetic Properties of Materials. Materials 2021. [CrossRef]
  8. Sato,Y;Ogura,N;Yamaguchi,Y;Ju,Y. Development of a sensor for dielectric constant measurements utilizing time-domain measurement with a vector network analyzer. Journal of the International Measurement Confederation.2021,169. [CrossRef]
  9. Akhter,Z; Akhtar,M.J. Free-Space Time Domain Position Insensitive Technique for Simultaneous Measurement of Complex Permittivity and Thickness of Lossy Dielectric Samples.IEEE Transactions on Instrumentation and Measurement.2016,65, 2394–2405. [CrossRef]
  10. Ozturk,T; Morikawa,O; Ünal, İ; Uluer, İ. Comparison of Free Space Measurement Using a Vector Network Analyzer and Low-Cost-Type THz-TDS Measurement Methods Between 75 and 325GHz. Journal of Infrared, Millimeter and Terahertz Waves.2017,38, 1241–1251. [CrossRef]
  11. Semenenko,V.N;Chistyaev,V.A; Politiko,A.A;Baskov,K.M. Test Stand for Measuring the Free-Space Electromagnetic Parameters of Materials over an Ultrawide Range of Microwave Frequencies.Article in measurement techniques.2019,62, 161–166. [CrossRef]
  12. Alqahtani,A.H;Aladadi,Y.T;Alresheedi,M.T.DielectricSlabs-Based Lens for Millimeter-Wave Beamforming. Appl. Sci. 2022,12,638.\. [CrossRef]
  13. Vohra.N;Rodriguez,L.R;Batista,J.S;Shenawee,M.EL. Free-Space Characterization of Radar Absorbing Non-Magnetic Materials in the W-Band. 94th ARFTG Microwave Measurement Symposium (ARFTG).2020. [CrossRef]
  14. Zhang,N;Cheng,J;Gong,P;Hongmei,M.A. A broadband free-space dielectric measurement system. in IEEE MIT-S International Microwave Workshop Series on Advanced Materials and Processess for RF and THz Applications (IMWS-AMP).2015. [CrossRef]
  15. Zva,S;Znb,S. Measurement of Dielectric Material Properties Application Note Products. Available online:https://www.rohde-schwarz.com/us/applications/measurement-of-dielectric-material-properties-application-note_56280-15697.html (accessed on 3 June 2023).
  16. Sivarajan,V. Time-domain thru-reflect-line (TRL) calibration error assessment Time-domain thru-reflect-line (TRL) calibration error asessment and its mitigation and modeling of multilayer printed circuit and its mitigation and modeling of multilayer printed circuitboards (PCB) with complex area fills boards (PCB) with complex area fills. Available online: https://scholarsmine.mst.edu/masters_theses (accessed on May 28 2021).
  17. Seng,S.M;You,K.Y;Esa,F;Mayzan,M.Z.H. Dielectric and Magnetic Properties of Epoxy with Dispersed Iron Phosphate Glass Particles by Microwave Measurement.Journal of Microwaves, Optoelectronics and Electromagnetic Applications.2020,19, 165–176. [CrossRef]
  18. The Evolution of Dielectric Properties Measurement Techniques for Agricultural Products. Available online: https://www.researchgate.net/publication/329811351_The_Evolution_of_Dielectric_Properties_Measurement_Techniques_for_Agricultural_Products (accessed on July 14 2021).
  19. Ozerov,R.P;Vorobyev, A.A. Solid State Physics.2007, 531–579.
  20. Rolfes,I;Schiek,B. Calibration methods for microwave free space measurements.Advances in Radio Science.2004,2,19-25. [CrossRef]
  21. Kang,J.S; Kim,J.H. GSS (Gated-Short-Short) Calibration for Free-space Material Measurements in millimeter-Wave Frequency Band. Antenna Measurement Techniques Association Symposium (AMTA).2019.
  22. La Gioia, A;Porter, E; Merunka, I; Shahzad, A; Salahuddin, S; Jones, M.;O’halloran, M. (2018). Open-Ended Coaxial Probe Technique for Dielectric Measurement of Biological Tissues: Challenges and Common Practices. Diagnostics 2018. [CrossRef]
  23. García-Pérez;Tercero,F; López-Ruiz,S; Vaquero,B;Serna,J,M. Implementation ofa quasioptical system for free-space measurements: Applications to radio astronomy. Loughborough Antennas & Propagation Conference (LAPC 2017).2017,1-5. [CrossRef]
  24. Kang,T.W;Kim,J.H;Lee,D.J;Kang,N.W. Free-space measurement of the complex permittivity of liquid materials at millimeter-wave region. Conference on Precision Electromagnetic Measurements (CPEM 2016).2016. [CrossRef]
  25. Goncalves,F;Pinto,R;Mesquita,R;Silva,E;Brancaccio,A. Free-Space Materials Characterization by Reflection andTransmission Measurements using Frequency-by-Frequency and Multi-Frequency Algorithms.Electronics 2018. [CrossRef]
  26. Mansoori,A;Isleifson,D;Desmond,D;Stern,G. Development of Dielectric Measurement Techniques for Arctic Oil Spill Studies. Antennas and Propagation Society International Symposium.2020, 883–884. [CrossRef]
  27. Wang,J.Y;Tao,J;Severac,L;Mesguich,D;Laurent,C. Microwave Characterization of Nanostructured Material by Modified Nicolson-Ross-Weir Method. 16th InternationalConference on Microwave and High Frequency Heating AMPERE.2017.
  28. You,K.Y;Sim,M.S;Mutadza,H;Esa,F;Chan,Y.L.Free space measurement using explicit, reference-plane and thickness-invariant method for permittivity determination of planar materials. Progress in Electromagnetics Research Symposium.2017,222–228. [CrossRef]
  29. Ozturk,M;Sevim,U;Akgol,O;Unal,E;Karaaslan,M. Determination of Physical Properties of Concrete by Using Microwave Nondestructive Techniques. Applied Computational Electromagnetics Society Journal.2018,33.
  30. Singh,H;Singh Sohi,B;Gupta,A. Thickness invariant parameter retrieval techniques for permittivity and permeability measurement. Journal of Microwave Power and Electromagnetic Energy.2018,52, 215–239. [CrossRef]
  31. Yamaguchi,Y; Sato,Y. Measuring method of complex dielectric constant with monostatic horn antenna in W-band using multiple distance measurements and analysis.Asia-Pacific Conference on Microwave.2017. [CrossRef]
  32. Hajisaeid,E;Dericioglu,A.F;Akyurtlu,A. A 3-D Printed Free-Space Setup for Microwave Dielectric Characterization of Materials.IEEE Transactions on Instrumentation and Measurement.2018,67, 1877–1886. [CrossRef]
  33. Chudpooti,N;Duangrit,N;Akkaraekthalin,P;Robertson,I.D;Somjit,N. 220-320 GHz Hemispherical Lens Antennas Using Digital Light Processed Photopolymers.IEEE Access. 2019,7, 12283–12290. [CrossRef]
  34. Cuper,J;Salski,B;Kopyt,P;Pacewicz,A;Raniszewski. Double-ridged horn antenna operating in 18-40 GHz range. MIKON 2018 - 22nd International Microwave and Radar Conference.2018, 304–307. [CrossRef]
  35. Tosaka,T;Fujii,K;Fukunaga,K;Kasamatsu,A. Development of complex relative permittivity measurement system based on free-space in 220-330-GHz range.IEEE Transactions on Terahertz Science and Technology.2015. [CrossRef]
  36. Yang,C;Ma,K;Ma,J.G. A noniterative and efficient technique to extract complex permittivity of low-loss dielectric materials at terahertz frequencies.IEEE Antennas and Wireless Propagation Letters.2019,10, 1971–1975. [CrossRef]
  37. Kim,S;Novotny,D;Gordon,J;Guerrieri,J. A Thicknessless Method for the Low-Loss Dielectric Characterization from Free-Space Scattering Measurements.2015.
  38. PCB Design and Fabrication Concerns for Millimeter- Wave Circuits. Available online: https://pcdandf.com/pcdesign/index.php/editorial/menu-features/15484-pcb-design-and-fabrication-concerns-for-millimeter-wave-circuits(accessed on May 28 2021).
  39. Hindle,P;Coonrod,J.PCB Fabrication and Material Considerations for the Different Bands of 5G.2018.
  40. Wen,G;Hao,X;Weijun,L;Chao,J;Qiulai,G. Measurement of Dielectric Properties of Materials in Millimeter-Wave Frequency Range. Metrology Science and Technology.2021,65, 14-19. [CrossRef]
  41. Deng,M;Mukherjee,C;Yadav,C;Fregonese,S;Zimmer,T;Quan,W;Arabhavi,M;Bolognesi,C. Design of On-Wafer TRL Calibration Kit for InP Technologies Characterization up to 500 GHz Design of On-Wafer TRL Calibration Kit for InP Technologies Characterization up to 500 GHz.IEEE Transactions on Electron Devices.2020,67, 5441–5447. [CrossRef]
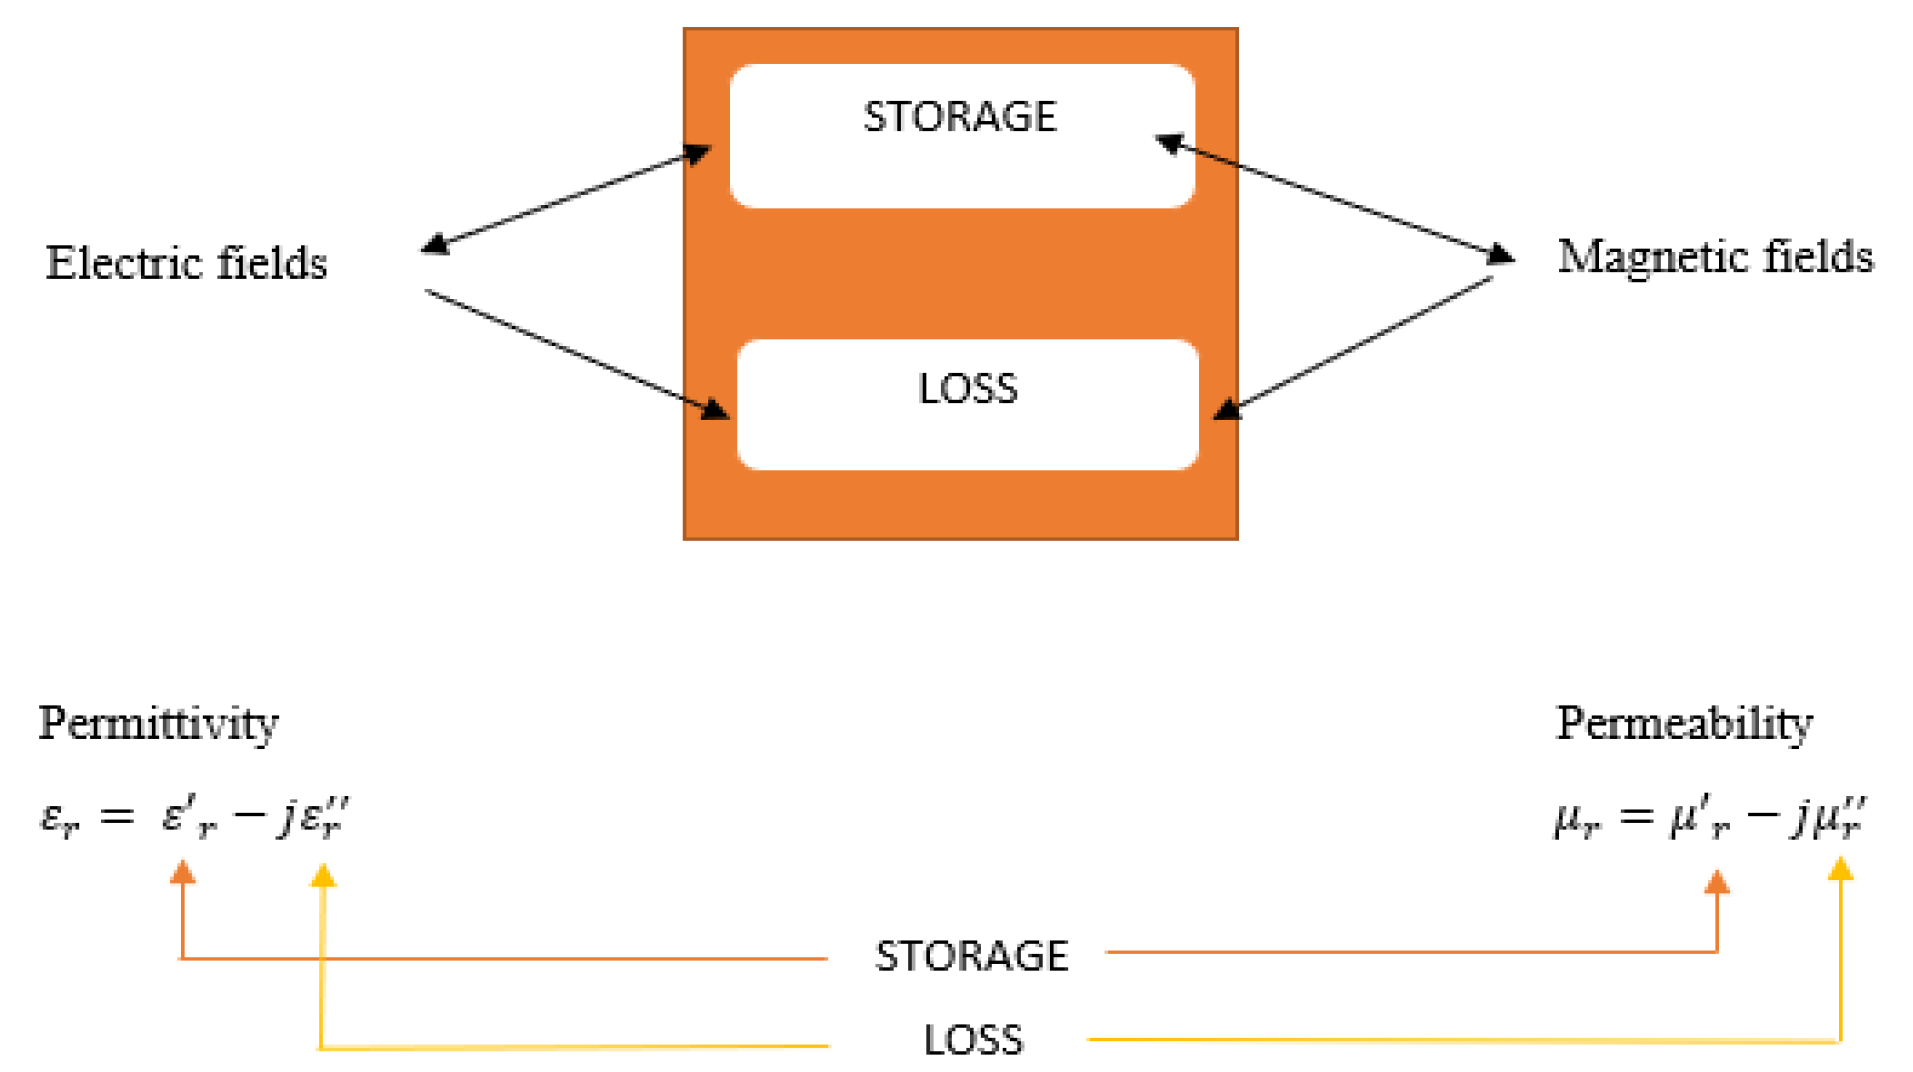
Figure 1. Electromagnetic field interaction and the relation between permittivity and permeability [19].
Preprints 75910 g001
Figure 2. Measurement ranges of various methods.
Preprints 75910 g002
Figure 3. Free-Space method [15].
Preprints 75910 g003
Figure 4. Coaxial probe technique [22].
Preprints 75910 g004
Figure 5. Transmission-Reflection method [15].
Preprints 75910 g005
Figure 6. Resonant method [15].
Preprints 75910 g006
Figure 7. Flowchart of NRW method [15].
Preprints 75910 g007
Figure 8. Measurement setup [29].
Preprints 75910 g008
Figure 9. Effective dielectric constants of cement with various w/c (water/cement) ratios for the: (a) 28th day and (b) 2nd month after casting measurement setup [29].
Preprints 75910 g009
Figure 10. Representations of the different calculation algorithms for free space measurement systems [25].
Preprints 75910 g010
Figure 11. Flowchart of unambiguous retrieval of material properties [30].
Preprints 75910 g011
Figure 12. Flowchart of NIST iterative method algorithm [15].
Preprints 75910 g012
Figure 13. Flowchart of New Non-iterative method algorithm [15].
Preprints 75910 g013
Figure 14. Plano-hyperbolic lens [23].
Preprints 75910 g014
Figure 15. Plano-convex lens [34].
Preprints 75910 g015
Figure 16. 3-D printed lens [32].
Preprints 75910 g016
Figure 17. Sample TRL calibration [20].
Preprints 75910 g017
Figure 18. TRM calibration technique [20].
Preprints 75910 g018
Figure 19. The proposed technique which is the microwave characterization of material [9].
Preprints 75910 g019
Figure 20. Bidirectional Scattering Measurement System [37].
Preprints 75910 g020
Table 1. Comparison of Different Material Measurement Techniques [21].
Measurement techniques Coaxial probe Transmission line Free space Resonant cavity
Operating frequency 50 MHz-50 GHz 50 MHz- 60 GHz 5 GHz-330 GHz 5 GHz-20 GHz
Dielectric properties εr εr , µr εr , µr εr , µr
S-parameters S11 S11, S21 S11, S21 Q-factors
Materials Biological specimens, liquids Waveguide Large solids, liquids Solid materials, liquids, waveguides
Loss High Medium Medium Low
Conversion techniques RFM NRW, NIST iterative NRW, NIST iterative Frequency & Q-factors
Table 2. Measurement Techniques Advantages and Disadvantages [15].
Measurement techniques Advantages Disadvantages
Transmission Line Able to determine both the permeability and permittivity Has the limitation of the air gap effects
Coaxial Probe No machining of sample is needed Influenced by air gaps
Resonant cavity Able to measure very small MUT Restricted to narrow band of frequencies only
Free-space Able to use for high frequency measurement, permits non-destructive measurement Multiple reflections between the sample and the antenna
Table 3. Samples With Different Thicknesses and Loss Tangents [23].
Material, thickness εrʹ tan δ
Typ. Meas. Typ. Meas.
Teflon (PTFE), 5 mm 2.1 2.0406 ~10-4 1.1 × 10⁻⁴
Teflon (PTFE), 250 µm 2.1 1.9942 ~10-4 2.2 × 10⁻²
Styrofoam (XPS), 30 mm 1.04 1.0337 ~10-4 8.4 × 10⁻²
Kapton (PI), 75 µm 3.4 3.2174 ~10-2 1.5 × 10⁻²
Hostaflon, (FEP), 25 µm 2.1 1.7594 ~10-3 1.6 × 10⁻³
Table 4. Complex Permittivity Obtained using Transmission -Reflection Method [24].
Material Under Test (MUT) εrʹ εrʺ
Quartz plate 1 3.882 to 3.874 -0.006 to + 0.013
Quartz plate 2 3.814 to 3.846 +0.011 to – 0.004
Fused quartz 3.75 to 3.82 (±0.06) -
Air in an empty container 0.937 to 1.010 -0.020 to 0.007
Water obtained from laboratory tap 10.030 to 11.949 16.783 to -14.759
Water, 25 ℃ 10.032 to 7.674 17.671 to 12.461
Table 5. Dielectric properties of PTFE and PMMA for different Distances between the samples and antennas [25].
PTFE (NRW)
r εrʹ εrʺ μrʹ μrʺ
48cm 2.04±0.03 0.01± 0.05 0.98±0.02 0.00±0.01
30cm 2.04±0.03 -0.03±0.03 0.99±0.02 0.03±0.02
PTFE (Reflection and Transmission)
r εrʹ εrʺ μrʹ μrʺ
48cm 2.06±0.04 0.03± 0.06 ̶ ̶
30cm 2.08±0.06 -0.06±0.04 ̶ ̶
PMMA (NRW)
r εrʹ εrʺ μrʹ μrʺ48cm 2.61±0.05 -0.02± 0.07 1.00±0.02 0.00±0.01
30cm 2.64±0.07 -0.03±0.04 1.01±0.03 0.01±0.01
PMMA (Reflection) PMMA (Transmission)
r εrʹ εrʺ μrʹ μrʺ48cm 2.62±0.07 -0.03± 0.1 ̶ ̶
30cm 2.66±0.09 -0.06±0.07 ̶ ̶
Table 6. Dielectric Data for mouse liver for different measurement scenarios [22].

Case Scenarios
Uncertainty of dielectric data,µ (%)
µT µTFE µA
Known TFE,
Known age
Unknown T
(Between 18℃ and 25℃)
0.91% N/A N/A
Known T,
Known age,
Unknown TFE (within 3.5 h)
N/A 25% N/A
Known T,
Known TFE,
Unknown age
(Within 70 days old)
N/A N/A 15%
Known T,
Unknown TFE
(within 3.5 h)
Unknown age
(Within 70 days old)
N/A 25% 15%
Known TFE,
Unknown age
(within 70 days old)
Unknown T
(Between 18℃ and 25℃)
0.91% N/A 15%
Table 7. Material properties of different materials [9].
Material Measured Proposed %
εr σt dt εrt σt dt ε r ε r σ t σ t d t d t
Teflon 2.10 2.33e-4 30 2.12 2.67e-4 30.248 0.95 14.5 0.82
Taconic HT (1.5) 2.35 3.26e-3 30 2.34 3.25e-3 30.374 0.42 0.30 1.24
Plexiglass 3.60 2.00e-2 30 3.58 1.99e-2 30.529 0.55 0.50 1.76
FR-4 4.30 5.98e-2 25 4.24 5.91e-2 25.448 1.39 1.17 1.79
CEM 4.40 7.34e-3 25 4.37 7.37e-3 25.377 0.68 0.40 1.50
Arlon-600 6.00 11.6e-3 25 6.02 11.5e-3 25.400 0.33 0.86 1.60
Berlliya 6.50 1.44e-3 25 6.48 1.40e-3 25.450 0.30 2.85 1.80
Table 8. Material Permittivity of different substances [26].
Substance εr
Probe method Resonator method
Air 1.050-j0.0513 ̶
Regular Diesel 2.4826-j0.1235 2.4979-j0.1128
Marine Ship Diesel 2.5207-j0.0891 2.5196-j0.0244
Crude oil (Tundra) 2.6530-j0.1257 2.6615-j0.1350
Table 9. Algorithms and calculations in measurement methods [15].
Materials/ Length/ Magnetic properties Measurement methods Conversion methods Speed Accuracy
Lossy solids,short, non-magnetics TR NRW Fast Medium
Biological specimen, Liquids Coaxial probe RFM Fast Good
High temperature
Solids, large/flat,
non-magnetic
Free-space NRW Fast Good
Low loss solids,
Small,magnetic
Resonant Frequency& Q-factors Slow Good
Table 10. State of the art of the lens structures or different frequencies[33].
Operating Frequency (GHz) 215-240 160-260 320-380 230-310 530-590 220-320
Antenna structure Hemisphere dielectric lens Square diffractive micro-lens array Square grooved-dielectric lens Hemisphere dielectric lens Hemisphere silicon lens Hemisphere dielectric lens
Antenna material ABS N b 5 N 6 microbolometer Teflon Rexolite Silicon M o n o c u r e 3 D R 3582 C
Antenna Design complexity Low High High Low High Low
Fabrication process 3D printing Microfabrication N/A CNC milling Photolithography and deep reactive etching 3D printing
Fabrication complexity Low High High Moderate High Low
Maximum antenna gain( d B i ) 18 N/A 26.1 30 ~23 16.09
Fractional bandwidth (%) ~11 47.62 17.14 30 10.71 37
Table 11. Dielectric Lens Antennas Parameters [33].
Parameter Description Optimum value (mm)
R Lens radius 3.00
L Extension Length 3.00
Fw Fixture width 3.00
FD Fixture diameter 1.70
FL Fixture length 6.40
FT Fixture thickness 2.00
a Matching length 0.86
b Matching width 0.43
m Matching depth 0.20
Table 12. The dimensions of dielectric lens antenna between design values and fabrication values [33].
Parameters Design values (mm) Actual values (mm)
R 3.00 2.96
L 3.00 2.98
FW 3.00 3.00
FP 1.70 1.72
FL 6.40 6.39
FT 2.00 1.98
a 0.86 0.87
b 0.43 0.44
m 0.20 0.22
Table 13. Material thickness of different materials And Minimum and maximum thickness values [35].
Material No. Material Thickness [ m m ]Used for: VNA/TDS
A PPE based resin, T L C 593 0.483 / 0.486
B PPE based resin, T L C 598 0.508 / 0.506
C PTFE/Epoxy composite, M L 620 0.488 / 0.479
D Glass/Epoxy composite, R 1551 0.466 / 0.476
E Glass/Epoxy composite, R 1661 0.486 / 0.487
F C y c l o olefin polymer, Z e o n e x 2.025 /2.005
Material Used for free space VNA Used for TDS
A 0.479mm / 0.488mm 0.484mm / 0.489mm
B 0.504mm / 0.512mm 0.505mm / 0.509mm
C 0.482mm / 0.495mm 0.475mm / 0.481mm
D 0.445mm / 0.480mm 0.471mm / 0.478mm
E 0.468 mm/ 0.495mm 0.471mm / 0.498mm
F 2.001 mm/ 2.046mm 1.998mm / 2.012mm
Table 14. Comparison Of Teflon, PTFE, Rogers 4350B And Air Permittivity Values Based on Literature Studies According to The Frequencies [36].
MUT Frequency (GHz) Ɛ rʹ
Teflon 110 GHz 2.04
850 GHz 2.042
300 GHz 2.0535
300 GHz 2.0442
PTFE 450 GHz 1.99
35 GHz 1.952
300 GHz 1.9523
Rogers 4350B 30 GHz 3.71
300 GHz 3.7692
Air 300 GHz 1.0021
Table 15. Sample Thickness of Different Materials [37].
Incident angle, θ (Deg.) Sample Thickness (mm)
XLPS
sample 1
XLPS
sample 2
PTFE
sample
PMP
sample
0 8.90 9.94 10.71 9.93
10 8.79 9.91 10.42 10.25
20 9.03 10.05 10.03 10.11
30 8.75 9.81 10.03 10.22
Disclaimer/Publisher’s Note: The statements, opinions and data contained in all publications are solely those of the individual author(s) and contributor(s) and not of MDPI and/or the editor(s). MDPI and/or the editor(s) disclaim responsibility for any injury to people or property resulting from any ideas, methods, instructions or products referred to in the content.
Copyright: This open access article is published under a Creative Commons CC BY 4.0 license, which permit the free download, distribution, and reuse, provided that the author and preprint are cited in any reuse.
Prerpints.org logo

Preprints.org is a free preprint server supported by MDPI in Basel, Switzerland.

Subscribe

© 2024 MDPI (Basel, Switzerland) unless otherwise stated