1. Introduction
Biogas use as a source of renewable energy increases over the years and the demand for economically attractive methods for biogas upgrading are of growing interest. Hydrogen sulfide is one of the main contaminants that needs to be removed before the biogas stream enters the CHP due to its corrosive effect. One of the most effective, low cost and easy to maintain methods for H
2S removal is the in-situ biological reduction, implemented either by adding Iron Salts/Oxides or by air dosing to the digester's slurry where biological anaerobic oxidation of H
2S to elemental sulfur and sulfates happens by Thiobacilus bacteria. Adding Iron Salts/Oxides is a very effective practice in reducing high H
2S levels down to 200–100 ppmv, but fails to maintain stable level of H
2S. Most regularly practiced is the use of liquid FeCl
2, while Fe(OH)
3, Fe(OH)
2 and ferrous chloride FeCl
3 can also be involved in their solid form. The method of dosing 3-6% air to biogas ratio can achieve 80–99% H
2S reduction, down to 20–100 ppm H
2S, [
1], while the oxygen content will be 0.5-1.8% per vol.. The second most frequently applied process is this of adsorption, which entails trapping of pollutants on a solid with a high-surface area (activated carbon or crystalline material with high porosity, e.g. zeolites, silica gel, activated alumina), holding the pollutants through physical (weak) attraction forces or
via chemical bonding. Adsorption is one of the most competitive technologies for precision desulfurization because it is simple and effective (>99%). The most competitive adsorbents for H
2S biogas removal are impregnated activated carbons and iron oxides, [
1,
2]. Adsorption systems are typically suitable for flow rates between 10–10,000 m³/h and pollutants concentrations between 0.1–8 g/m
3, [
3,
4]. Impregnated activated carbons are preferably applied when it is necessary to significantly reduce or eliminate the concentration of H
2S. This is because in addition to the physical adsorption, activated carbons provide catalytic sites for oxidation to elemental sulfur and sulfate thus enhancing the removal capacity of H
2S. The activated carbons (ACs) must maintain a content of 20-30% moisture and the required volume of oxygen. When the levels of H
2S in the feed stream are high (>3000 ppmv), the adsorptive and catalytic sites are saturated making necessary the periodic regeneration of the AC adsorbents. Impregnated products usually exhibit enhanced H
2S removal capacity, from a normal 10–20 kg H
2S/(m
3 carbon) for virgin carbon to 120–140 kg H
2S/(m
3 carbon). Cons are that the regeneration of the used in the process ACs is not sustainable and consequently the spent carbon must either be landfilled or re-impregnated, adding up to the logistic cost, [
5].
There is hereby new interest field emerged of using the Biomass, even better the Solid Fibrous Digestate (SFD) to produce the ACs on-site for the desulfurization of the biogas. This way, a waste product (SFD) is transformed to an effective adsorbent that can be used either on site, thus creating a closed loop value chain within the Biogas plant or implemented to other gas separation and wastewater treatment processes, achieving the effective integration between value chains, [
6,
7].
Up to date, activated carbon adsorbents for biogas desulphurization have been prepared and studied using the common raw materials usually involved to yield ACs. Guo J. et al [
8] prepared chemically and physically activated carbons based on palm and coconut shells and investigated the different mechanisms of H
2S adsorption; physisorption, chemisorption and H
2S oxidation depending on the activation agent, using H
2O, CO
2, ΚOH and H
2SO
4 and concluded that chemical activation has better dynamic adsorption performances. Longer breakthrough times as well as prolonged exhaustion times seem to increase the H
2S adsorption capacities. Javier P. et al., [
9], investigated the production of AC from barley straw via physical activation method with CO
2 and steam and concluded that the optimal conditions for the activation stage with CO
2 were at 800 °C and a residence time of 1 h and at 700 °C and a hold time of 1 h when H
2O is the activating agent, [
10,
11,
12]. The maximum BET surface area and micropore volume achieved by carbon dioxide activation were of 789 m
2/g and 0.3268 cm
3/g while for steam activation were 552 m
2/g and 0.2304 cm
3/g, representing an increase on both values of more than 42% for the case of activation with carbon dioxide. Those ACs functionalized with CO
2 presented a well-developed micropore structure compared to the lower degree of microporosity endowed in the steam activated carbons. 2, 3, 6 and 9-ring carbon structured adsorbent surfaces have been investigated by Akhtar Hussain [
13], using parameters such as the planar and non-planar mode and the surface defects. 6-ring with the vacancy centrally located in non-planar mode illustrated the highest steric heat of sorption (q
st) for H
2S while adsorption is performed with significant strength both on non-defected and defected 3-ring model in planar mode. As a general outcome the increase of the size and the structure decreases the q
st and the most suitable configuration for the phenomenon to happen is the central, in a non-planar mode. Further to the investigations on the development of highly efficient and selective for H
2S, activated carbon adsorbents, there are also many studies focusing on the engineering part of the desulphurization process, elaborating either standalone processes or cascades that combine different processes such as adsorption on activated carbons and steel wool and absorption into aqueous solutions of amine, sodium hydroxide and calcium hydroxide, [
14,
15]. The target of these studies is to instigate the overall process with the desired functionality which can be either to enhance the CH
4 content of biogas or to effectively remove H
2S and CO
2. Relevant reported results are presented in
Table 1 concluding to the point that combination of calcium hydroxide (1 Molar) and steel wool (Fe and Zn elements) favors CO
2 and H
2S removal (max -44% and -97% respectively) while combination of sodium hydroxide (1,5 Molar), activated carbon and steel wool favors CH
4% content enhancement (up to +30% max) and CO
2 removal (up to -41% max).
Other parameters for optimization related to the process conditions and it was showed that the biogas inlet pressure had varying effects on the performance depending on the composition of the solvent (absorbent) and the type of adsorbent, whereas the amplification of the biogas feed flow rate had a negative effect on the targets of high CH
4 content and effective CO
2 removal, [
16,
17,
18]. On the contrary H
2S was favored for flow rates up to 10 LPM. While cascades of absorption and adsorption processes offer the flexibility to select amongst a great variety of solvents and adsorbents and to fine tune the conditions towards achieving the required performance, they present also major difficulties related with the need to design and integrate completely different absorber and adsorber columns and the great variety of processes required for the regeneration of solvents and adsorbents along with the different frequency of regeneration. These difficulties are showcased in
Table 2.
Conclusively, the design of cascade processes integrating different solid adsorbents with tailor made gas adsorption and separation capacity seems to be a more feasible solution for applications in biogas desulphurization and upgrading.
In this context, the present study achieves the dual target of developing effective adsorbents from the waste effluent of a biogas plant and further endowing them with enhanced CO
2 separating or H
2S separating capacity. Hence, the developed, in this work, activated carbons can be applied in stand-alone or cascade processes with the targets of desulphurising biogas and enhancing its CH
4 content. Starting from the solid fraction of digestate, pre-treatment and pyrolysis techniques are firstly optimized to achieve high yields of biochar, [
19,
20,
21,
22]. Further, biochar is converted to activated carbon by applying a variety of physical and chemical activation methods with CO
2, H
2O and KOH. Breakthrough experiments in fixed bed columns at different temperatures using real biogas mixtures are performed and the obtained gas uptake and separation performances of the various ACs are scrutinized against their pore structural and surface chemistry properties. Conclusively, the outcome of this work is an optimized workflow that starts from SFD and ends up with a tailor-made adsorbent for either enhanced CO
2 or H
2S separation.
Author Contributions
Conceptualization, G.R., E.K. and T.S.; methodology, G.R., A.L., S.S., and E.K.; software, G.R.; validation, G.R., E.K., A.L. and T.S.; formal analysis, G.P. and G.D.; investigation, A.M. and G.D.; resources, A.M.; data curation, E.C., S.S., G.P.; writing—original draft preparation, E.C., G.R.; writing—review and editing, G.R., T.S. and E.C.; visualization, E.C.; supervision, G.R.; project administration, T.S.; funding acquisition, T.S. All authors have read and agreed to the published version of the manuscript.
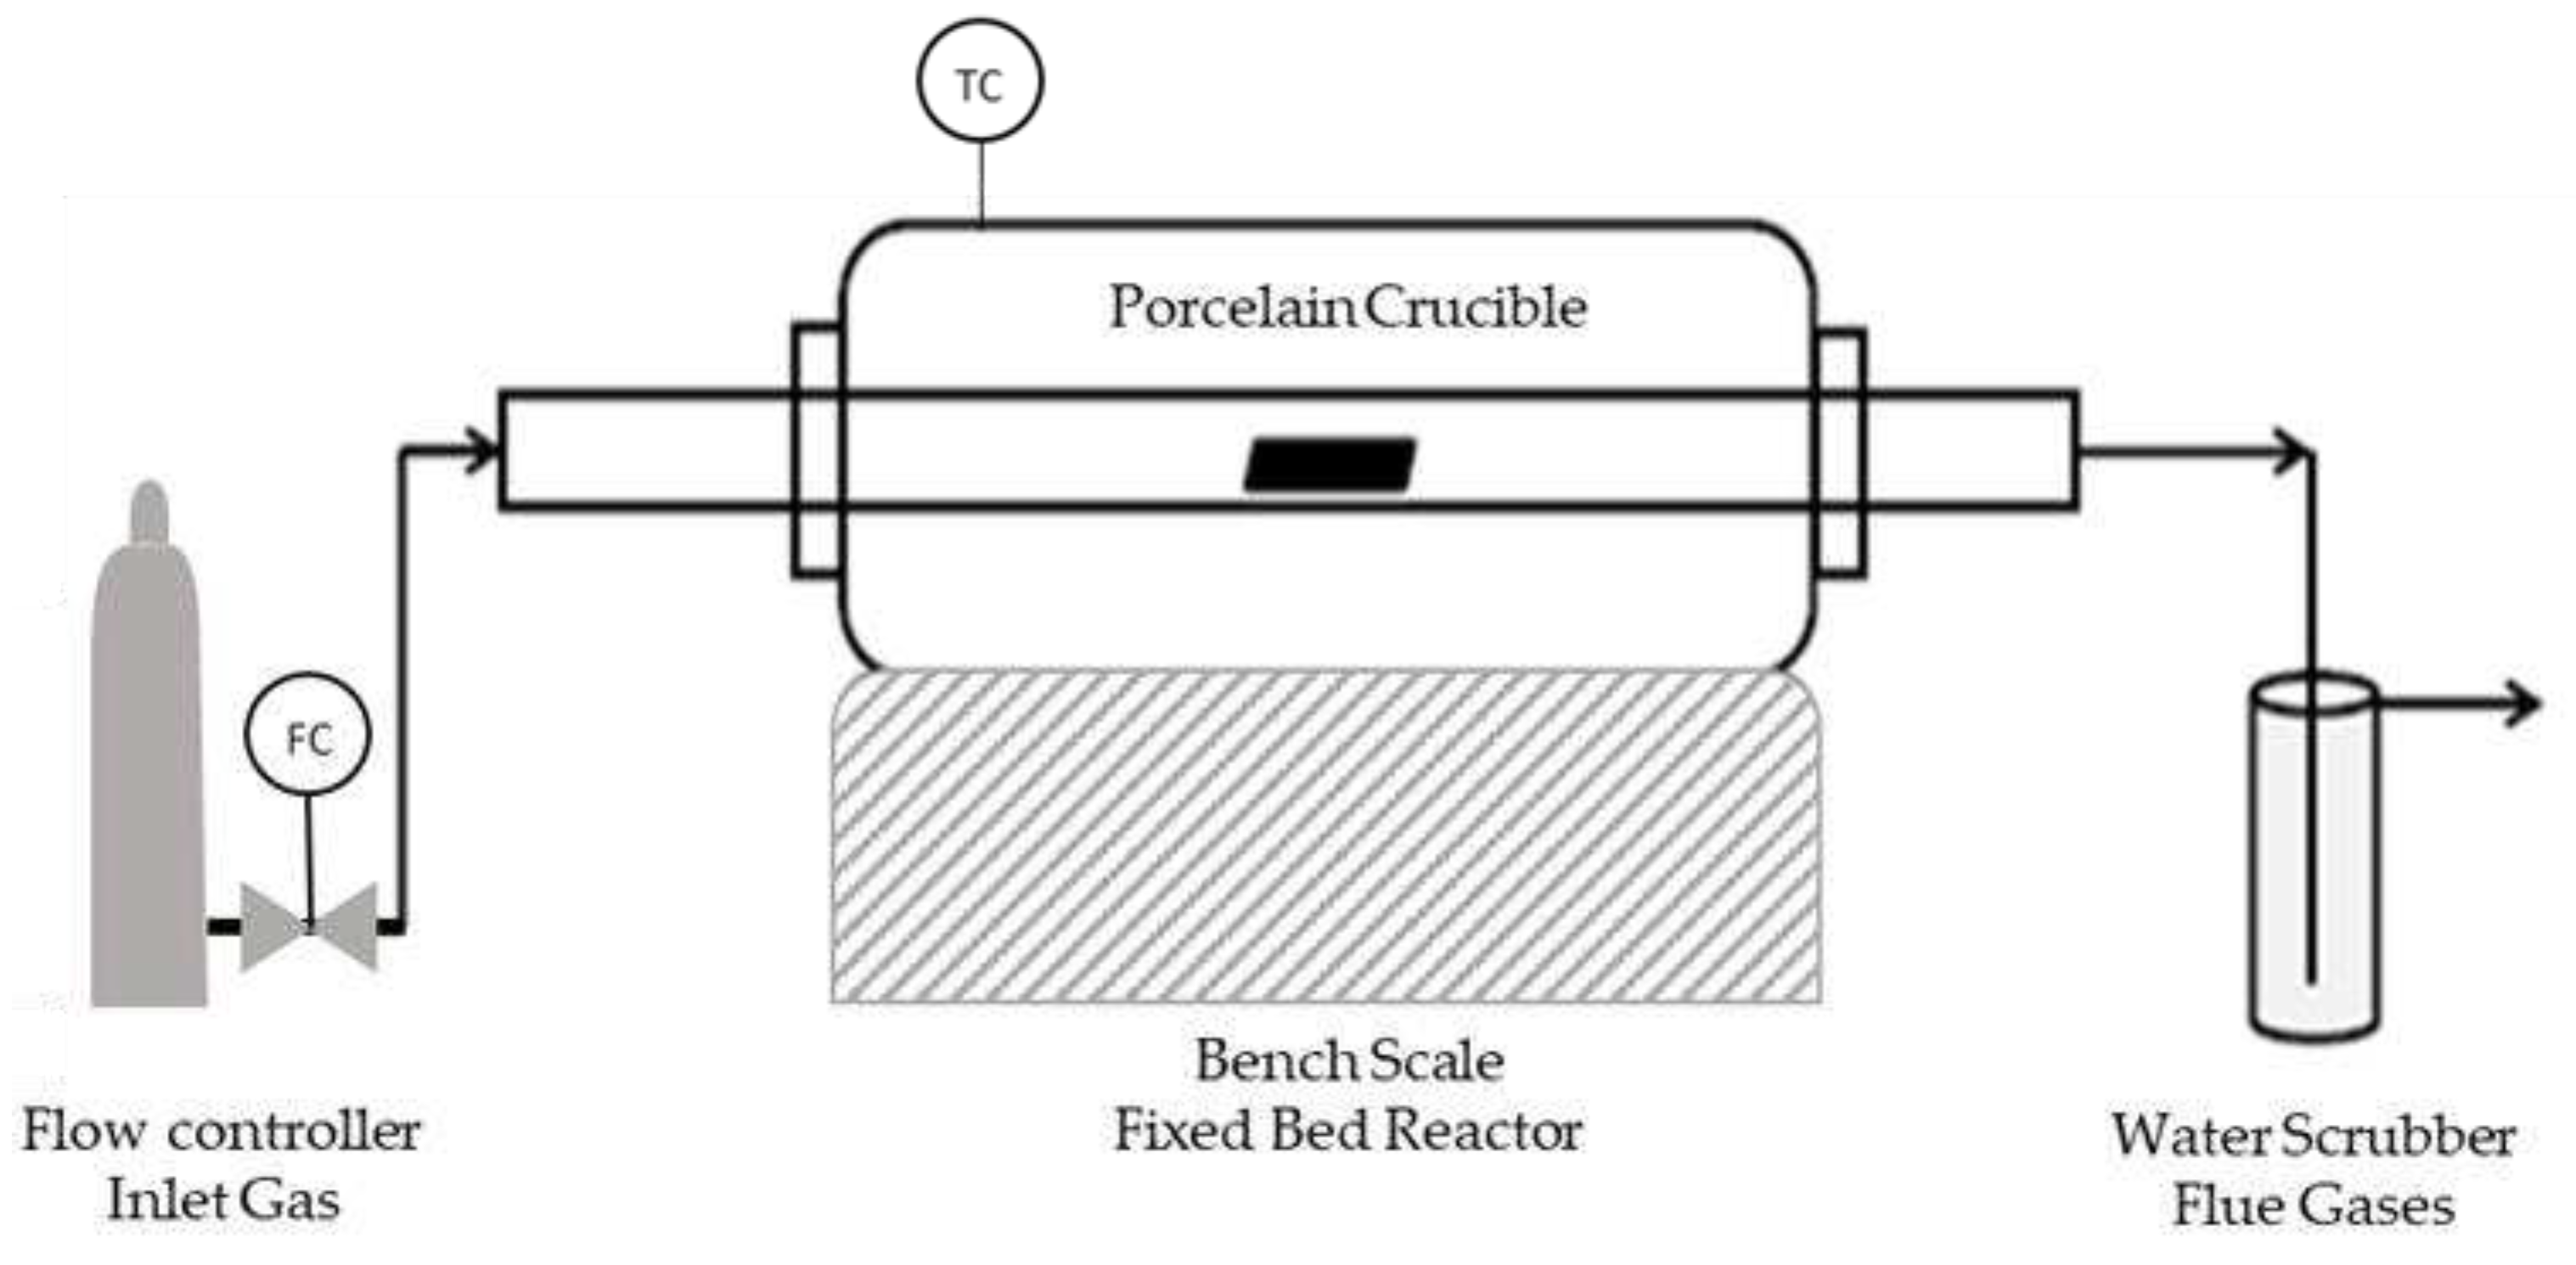
Figure 1.
Pyrolysis Reactor.
Figure 1.
Pyrolysis Reactor.
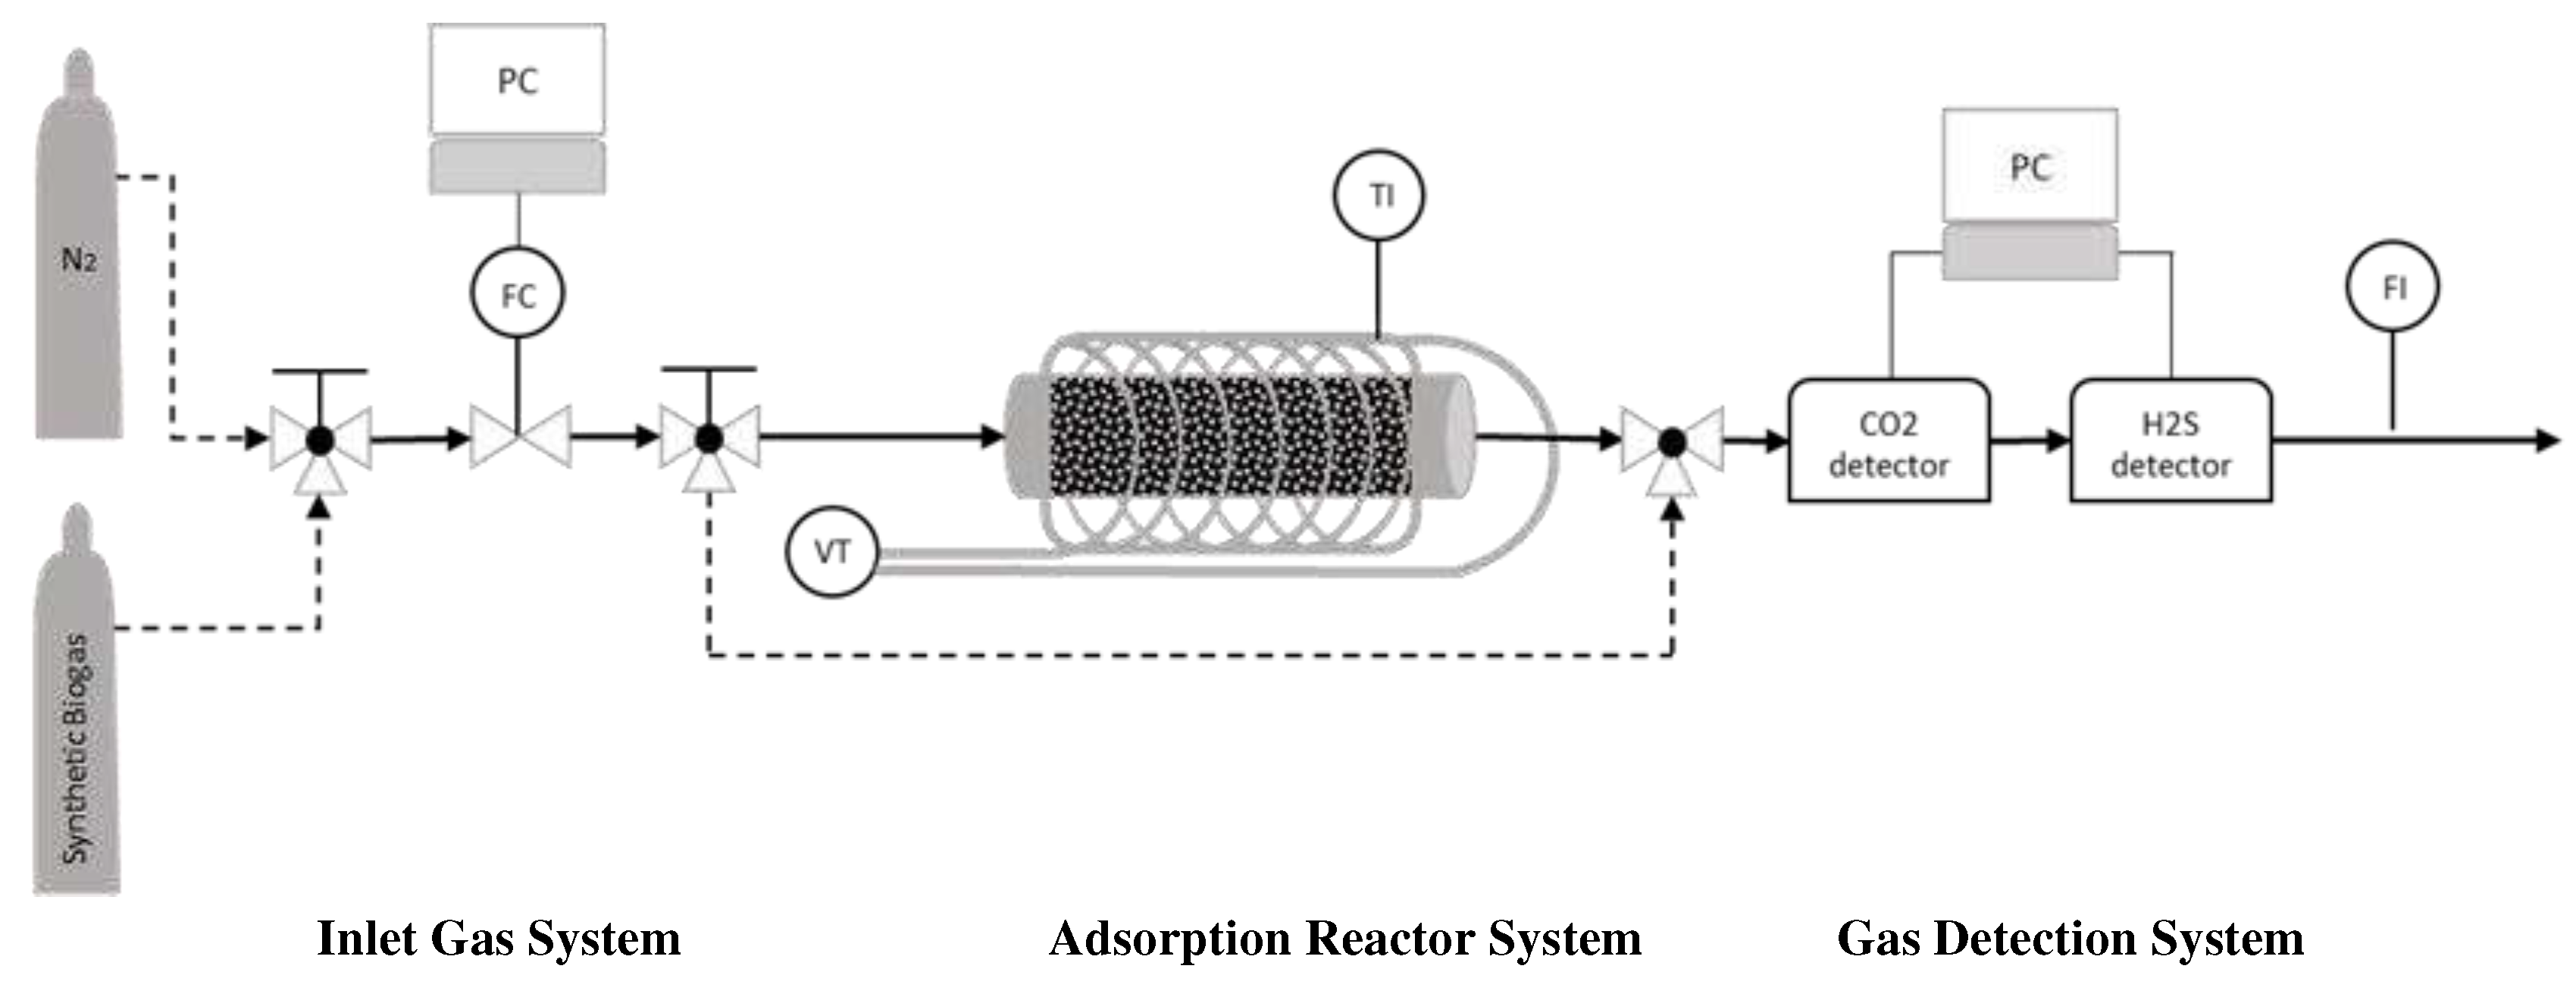
Figure 2.
Adsorption Reactor; FC: Flow Controller, VT: Variac Transformer, TI: Temperature Indicator, FI: Flow Indicator.
Figure 2.
Adsorption Reactor; FC: Flow Controller, VT: Variac Transformer, TI: Temperature Indicator, FI: Flow Indicator.
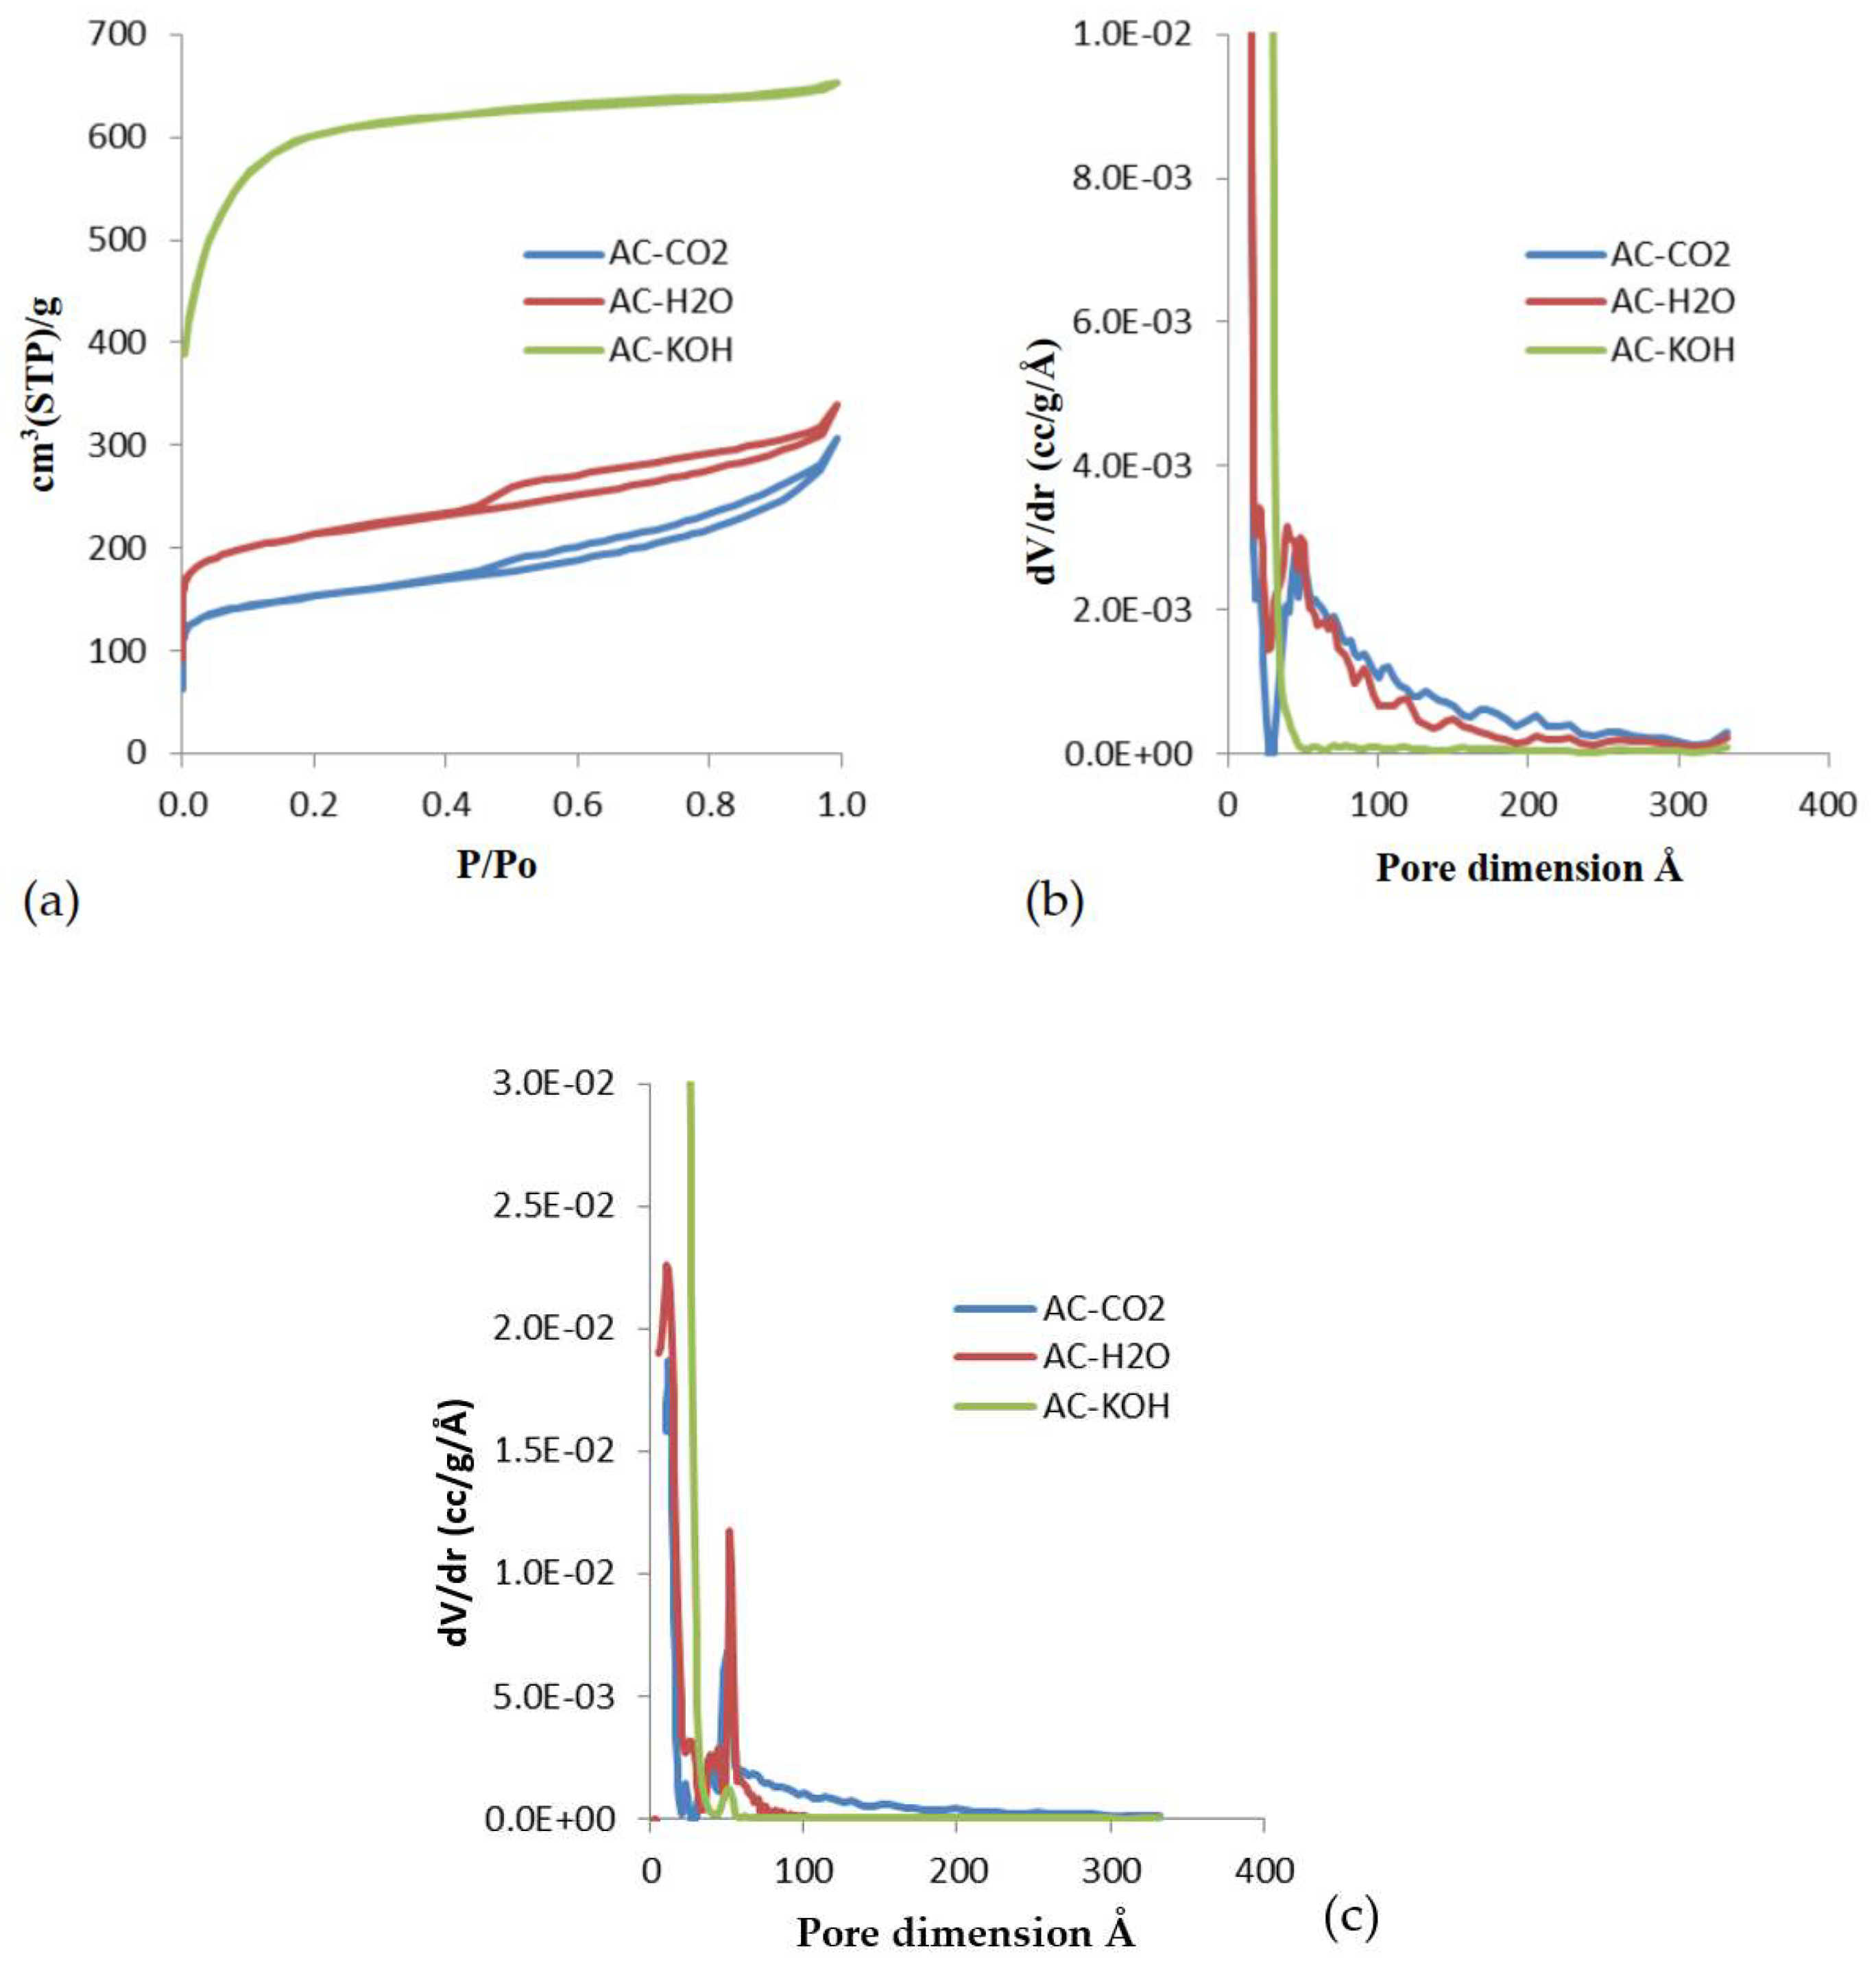
Figure 3.
(a) N2 (77K) adsorption isotherms of porous carbons activated with various methods of physical and chemical activation. (b) QSDFT derived pore size distributions obtained from the adsorption branch of the isotherms. (c) QSDFT derived pore size distributions obtained from the desorption branch of the isotherms.
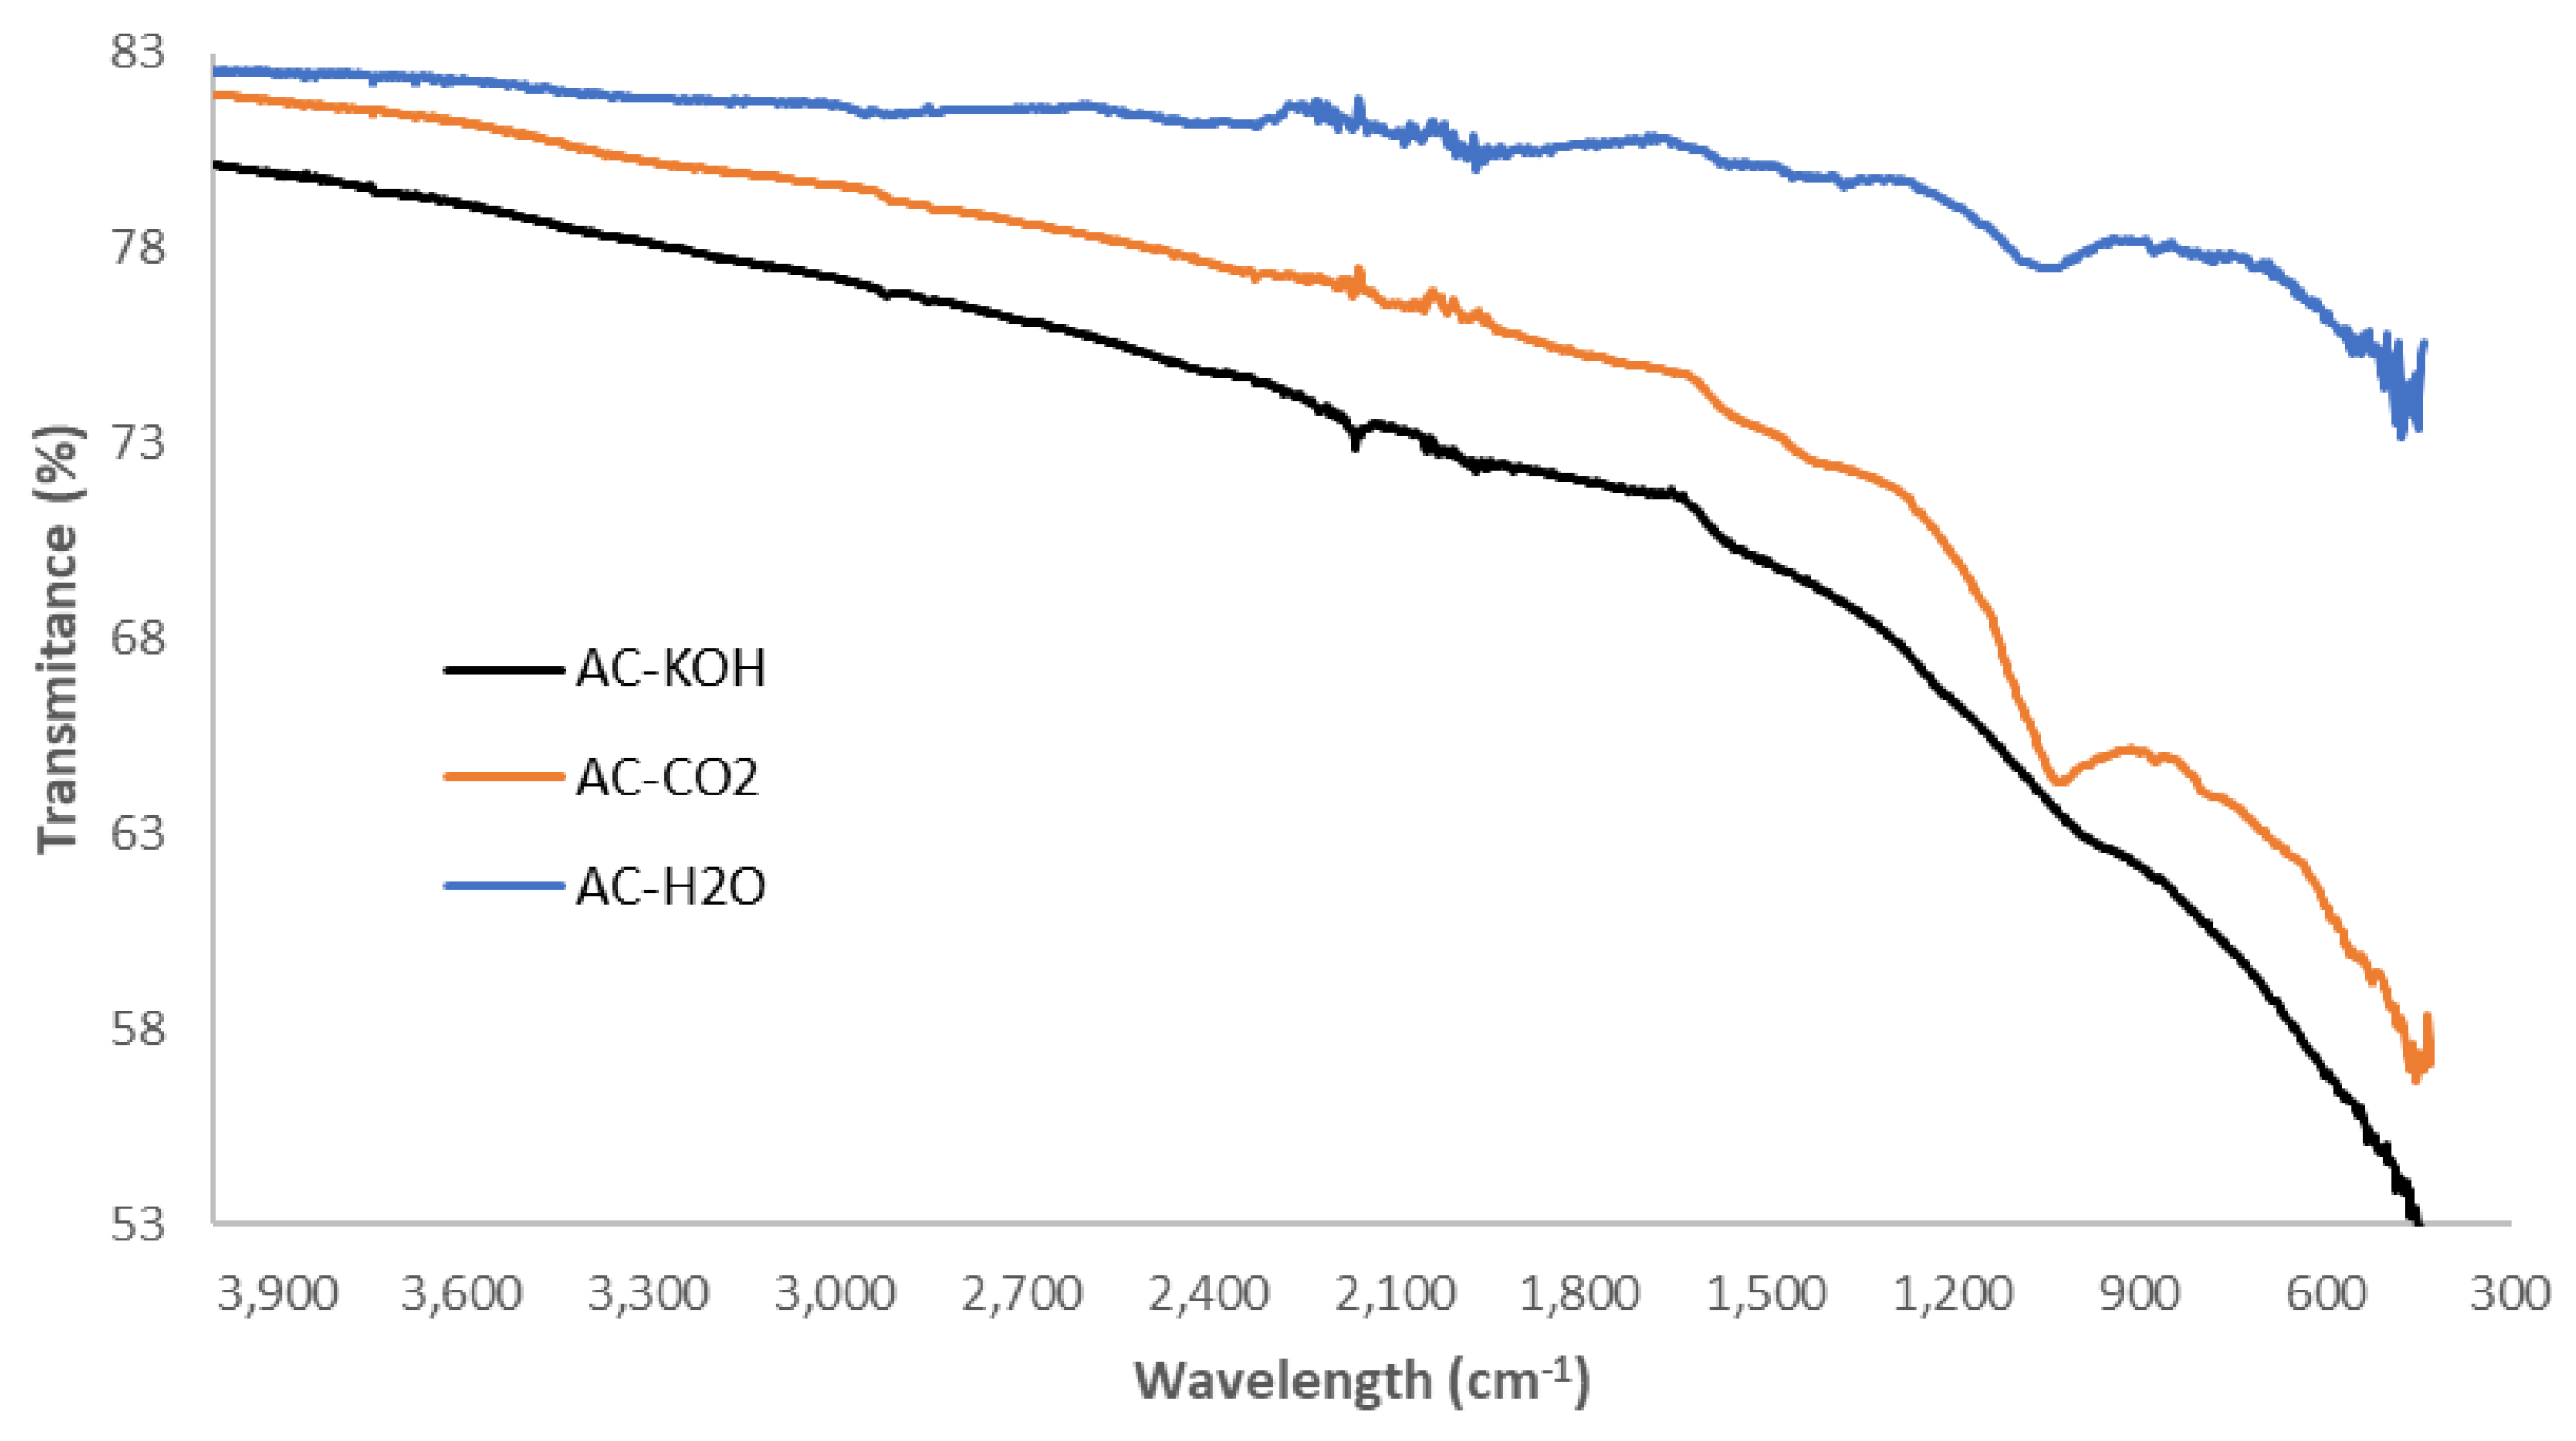
Figure 4.
FTIR spectra of the chemically and physically activated carbons.
Figure 4.
FTIR spectra of the chemically and physically activated carbons.
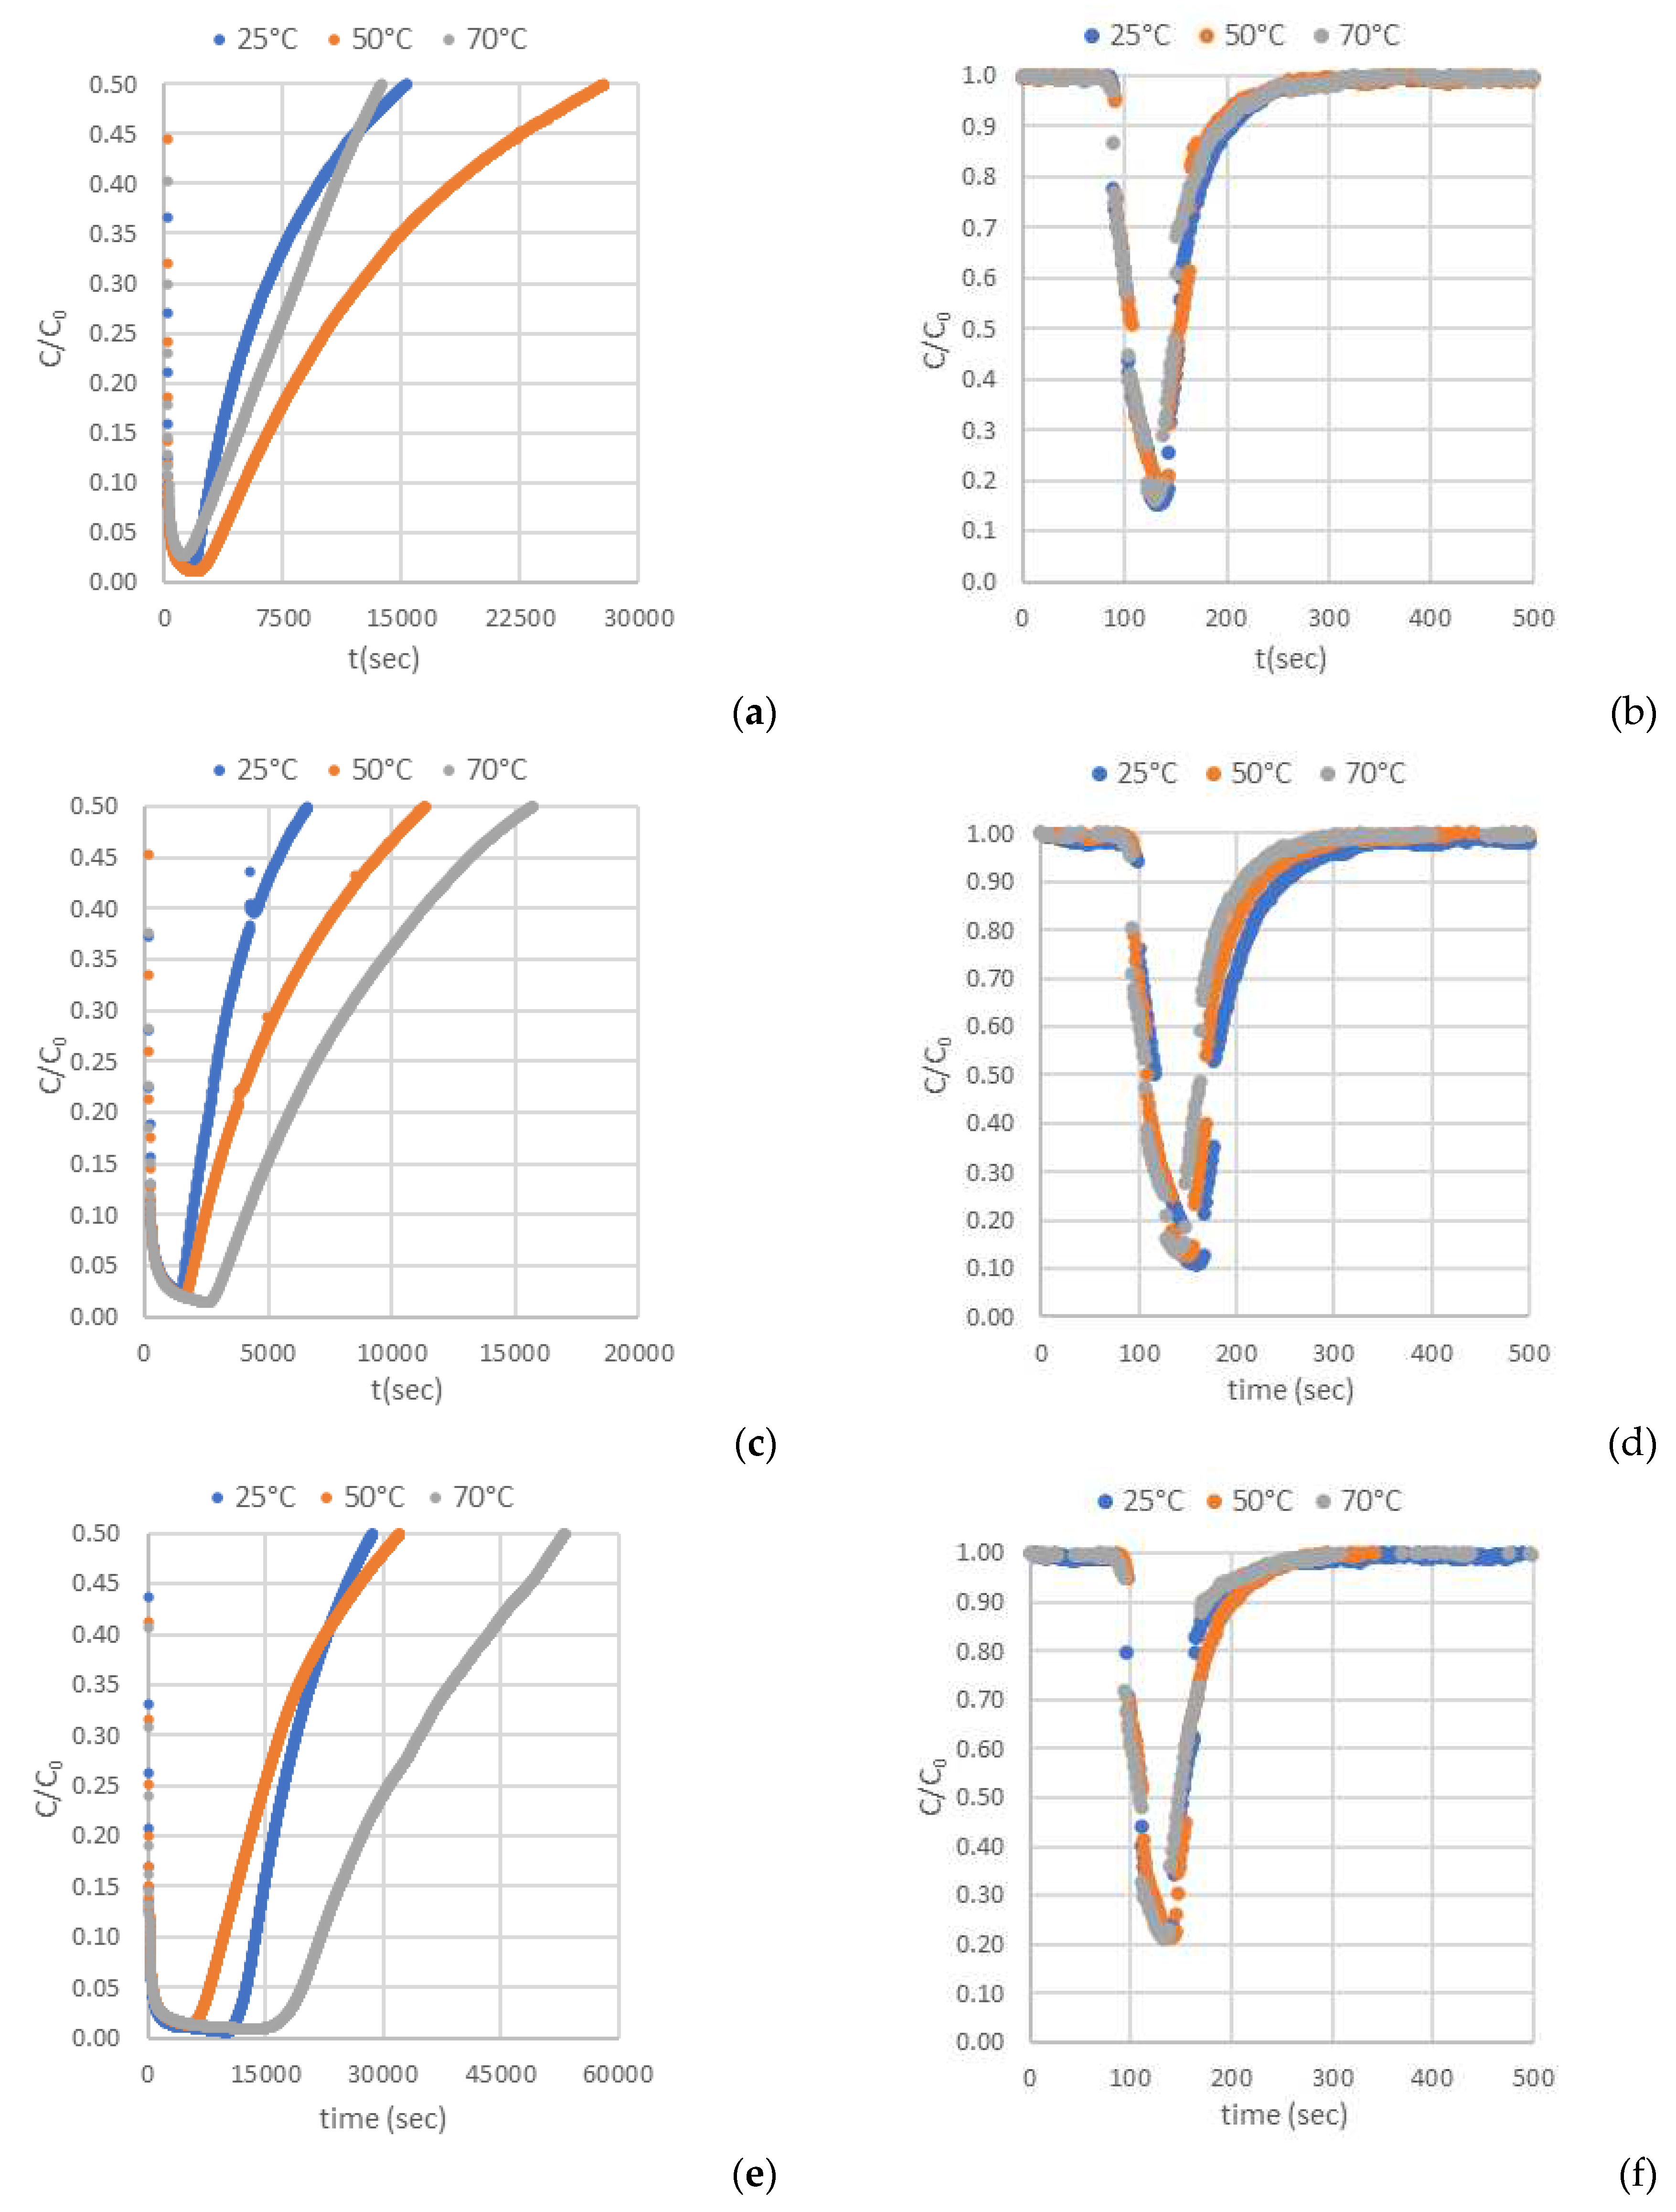
Figure 5.
Breakthrough curves of: (a, b) H2S and CO2 on AC-H2O. (c, d) H2S and CO2 on AC-KOH. (e, f) H2S and CO2 on AC-CO2.
Figure 5.
Breakthrough curves of: (a, b) H2S and CO2 on AC-H2O. (c, d) H2S and CO2 on AC-KOH. (e, f) H2S and CO2 on AC-CO2.
Table 1.
Results obtained from cascade processes that combine adsorption and absorption columns for biogas treatment. Absorbers are filled with 1L of solvent while adsorber columns are filled with 500 g of adsorbent, [
1].
Table 1.
Results obtained from cascade processes that combine adsorption and absorption columns for biogas treatment. Absorbers are filled with 1L of solvent while adsorber columns are filled with 500 g of adsorbent, [
1].
| Gas |
Sodium hydroxide(1.5 Molar)
|
Calcium hydroxide(1 Molar)
|
| + Activated carbon(mass 500 g)
|
+ Steel wool(mass 500 g)
|
| + Steel wool(mass 500 g)
|
|
| |
P: 2.5 cm of Hg |
P: 5 cm of Hg |
P: 2.5 cm of Hg |
P: 7.5 cm of Hg |
| |
Q: 10 LPM |
Q: 2 LPM |
Q: 10 LPM |
Q: 2 LPM |
| CH4
|
+12% |
+30% |
+24% |
+28% |
| CO2
|
-55% |
-41% |
-22% |
-44% |
| H2S |
-97% |
-96% |
-97% |
-97% |
Table 2.
Details of the frequency of regeneration and related data for different reagents, [
1].
Table 2.
Details of the frequency of regeneration and related data for different reagents, [
1].
| Name & chemical formula of the reagent |
Cost of the reagent
($US) |
Concentration of aqueous solution or mass of the adsorbent |
Volume of biogas purified before saturation (m3) |
Cost of chemical for purification ($US/ m3) |
| Monoethanolamine (MEA), C2H7NO
|
6.82 per L |
10% by volume |
165 |
Regeneration by heating |
Sodium hydroxide,
NaOH
|
1.36 per kg |
1.5 Molar |
178 |
0.46 |
| Granular activated carbon, AC
|
0.2 per kg
(limestone) |
mass 100 g |
117 |
0.13 |
Steel wool,
Fe2O3
|
5.46 per kg |
mass 500 g |
207 |
2.64 |
| Calcium hydroxide, Ca(OH)2
|
0.2 per kg |
1 Molar |
Regeneration up to 5 times |
Regeneration by oxidization |
Table 3.
Biochar yield (%wt., dry matter feed) at various pyrolysis temperatures and times.
Table 3.
Biochar yield (%wt., dry matter feed) at various pyrolysis temperatures and times.
| Pyrolysis Temperature |
Pyrolysis Time |
Biochar Yield (%wt., Dry Matter feed) |
| (°C) |
(min) |
BC-SFD |
BC-SFD-washed |
| 600 |
30 |
35.90 |
28.3 |
| 600 |
60 |
35.30 |
28.4 |
| 600 |
120 |
34.50 |
27.4 |
| 700 |
30 |
34.10 |
26.8 |
| 700 |
60 |
34.00 |
26.6 |
| 700 |
120 |
32.70 |
26.5 |
| 800 |
30 |
32.70 |
25.0 |
| 800 |
60 |
32.80 |
24.8 |
| 800 |
120 |
32.10 |
24.5 |
Table 4.
Activated carbon yield (%wt., dry matter feed), with physical activation (H2O) at various activation temperatures, steam flow and activation time.
Table 4.
Activated carbon yield (%wt., dry matter feed), with physical activation (H2O) at various activation temperatures, steam flow and activation time.
| Activation Temperature |
Steam flow |
Activation Time |
Activated Carbon Yield (%wt., Dry Matter feed) |
| (°C) |
(mL/min) |
(min) |
AC-H2O |
| 700 |
1 |
30 |
74.7 |
| 700 |
1 |
60 |
65.0 |
| 700 |
1 |
90 |
57.1 |
| 800 |
1 |
30 |
42.7 |
| 800 |
1 |
45 |
35.8 |
| 800 |
1 |
60 |
31.5 |
| 900 |
1 |
15 |
47.2 |
| 900 |
1 |
30 |
33.0 |
| 900 |
1 |
45 |
23.3 |
Table 5.
Activated carbon yield (%wt., dry matter feed), with chemical activation (KOH) at various activation temperatures, reagent KOH to biochar ratio and activation time.
Table 5.
Activated carbon yield (%wt., dry matter feed), with chemical activation (KOH) at various activation temperatures, reagent KOH to biochar ratio and activation time.
| Activation Temperature |
Ratio KOH/BC |
Activation Time |
Activated Carbon Yield (%wt., Dry Matter feed) |
| (°C) |
|
(min) |
AC-KOH |
| 600 |
4 |
30 |
76.3 |
| 700 |
4 |
30 |
73.7 |
| 800 |
1 |
30 |
69.2 |
| 800 |
2 |
30 |
66.3 |
| 800 |
4 |
30 |
66.1 |
| 800 |
4 |
60 |
49.0 |
| 800 |
4 |
120 |
62.6 |
Table 6.
Experimental conditions of the biogas breakthrough tests.
Table 6.
Experimental conditions of the biogas breakthrough tests.
| Activated carbon |
Reactor temperature (oC) |
Flow characteristics |
|
Qbiogas (mL/min) |
ΔΡbiogas (millibar) |
Density (g/cm3) |
Vaverage (cm/min) |
ηbiogas (poise) |
h (mm) |
| AC-H2O |
25 |
39.75 |
0.0401 |
0.0423 |
219.78 |
9.97E-06 |
1034.54 |
| |
50 |
40.03 |
0.0447 |
0.0445 |
221.33 |
1.10E-05 |
975.78 |
| |
70 |
39.10 |
0.0472 |
0.0449 |
216.18 |
1.19E-05 |
934.02 |
| AC-KOH |
25 |
39.77 |
0.0401 |
0.0423 |
219.89 |
9.97E-06 |
1034.54 |
| |
50 |
39.85 |
0.0445 |
0.0443 |
220.33 |
1.10E-05 |
975.78 |
| |
70 |
39.73 |
0.0480 |
0.0457 |
219.67 |
1.19E-05 |
934.02 |
| AC-CO2
|
25 |
40.12 |
0.0404 |
0.0426 |
221.82 |
9.97E-06 |
1034.54 |
| |
50 |
40.05 |
0.0447 |
0.0445 |
221.44 |
1.10E-05 |
975.78 |
| |
70 |
39.02 |
0.0471 |
0.0448 |
215.74 |
1.19E-05 |
934.02 |
Table 9.
Surface characteristics and porosity of biochar materials derived from the untreated SFD.
Table 9.
Surface characteristics and porosity of biochar materials derived from the untreated SFD.
| Pyrolysis Temperature |
Pyrolysis Time |
BET |
Micropore surface |
External surface |
Micropore Volume |
Total pore Volume |
| (°C) |
(min) |
(m2/g) |
(m2/g) |
(m2/g) |
(cm3/g) |
(cm3/g) |
| 600 |
30 |
18 |
10 |
8 |
0.004 |
0.021 |
| 600 |
60 |
17 |
11 |
6 |
0.004 |
0.019 |
| 600 |
120 |
15 |
7 |
8 |
0.003 |
0.020 |
| 700 |
30 |
43 |
28 |
15 |
0.011 |
0.040 |
| 700 |
60 |
35 |
25 |
10 |
0.010 |
0.035 |
| 700 |
120 |
27 |
16 |
12 |
0.006 |
0.034 |
| 800 |
30 |
38 |
18 |
20 |
0.007 |
0.043 |
| 800 |
60 |
43 |
22 |
21 |
0.009 |
0.056 |
| 800 |
120 |
38 |
20 |
18 |
0.008 |
0.055 |
Table 10.
Surface characteristics and porosity of biochar materials derived from the pretreated SFD.
Table 10.
Surface characteristics and porosity of biochar materials derived from the pretreated SFD.
| Pyrolysis Temperature |
Pyrolysis Time |
BET |
Micropore surface |
External surface |
Micropore Volume |
Total pore Volume |
| (°C) |
(min) |
(m2/g) |
(m2/g) |
(m2/g) |
(cm3/g) |
(cm3/g) |
| 600 |
30 |
279 |
263 |
16 |
0.103 |
0.125 |
| 600 |
60 |
276 |
265 |
13 |
0.103 |
0.129 |
| 600 |
120 |
287 |
268 |
20 |
0.104 |
0.135 |
| 700 |
30 |
291 |
279 |
12 |
0.108 |
0.127 |
| 700 |
60 |
275 |
263 |
12 |
0.102 |
0.122 |
| 700 |
120 |
288 |
278 |
10 |
0.107 |
0.125 |
| 800 |
30 |
363 |
339 |
24 |
0.132 |
0.165 |
| 800 |
60 |
313 |
298 |
15 |
0.115 |
0.138 |
| 800 |
120 |
317 |
292 |
25 |
0.113 |
0.151 |
Table 11.
Surface characteristics and porosity of activated carbons AC-H2O, AC-KOH and AC-CO2 produced by activation of biochar which has been derived from the pretreated SFD.
Table 11.
Surface characteristics and porosity of activated carbons AC-H2O, AC-KOH and AC-CO2 produced by activation of biochar which has been derived from the pretreated SFD.
| Sample |
Means of activation |
BET |
Micropore surface |
External surface |
Micropore Volume |
Total pore Volume |
| (m2/g) |
(m2/g) |
(m2/g) |
(cm3/g) |
(cm3/g) |
| AC-H2O |
H2O |
790 |
644 |
146 |
0.31 |
0.53 |
| AC-CO2
|
CO2
|
568 |
355 |
213 |
0.224 |
0.48 |
| AC-KOH |
KOH |
2272 |
2174 |
98 |
0.89 |
1.011 |
Table 12.
H2S adsorption capacity, molar mass of H2S adsorbed per AC mass, on the activated carbon materials in various temperatures.
Table 12.
H2S adsorption capacity, molar mass of H2S adsorbed per AC mass, on the activated carbon materials in various temperatures.
| Activated carbon |
Adsorption temperature (oC) |
H2S capacity (mmol[H2S]/g) |
| Breakthrough time (C/C0=0,05) 1
|
Reference time C/C0=0,5 1
|
Exhaustion time (C/C0=0,95) 2
|
| AC-H2O |
25 |
0.10 |
0.71 |
2.13 |
| |
50 |
0.09 |
1.22 |
3.26 |
| |
70 |
0.04 |
0.51 |
1.54 |
| AC-KOH |
25 |
0.05 |
0.19 |
0.88 |
| |
50 |
0.05 |
0.31 |
1.42 |
| |
70 |
0.07 |
0.36 |
0.79 |
| AC-CO2
|
25 |
0.75 |
1.83 |
4.70 |
| |
50 |
0.36 |
1.82 |
4.63 |
| |
70 |
0.86 |
3.50 |
7.51 |
Table 13.
H2S adsorption capacity, mass of H2S adsorbed per AC mass, on the activated carbon materials in various temperatures.
Table 13.
H2S adsorption capacity, mass of H2S adsorbed per AC mass, on the activated carbon materials in various temperatures.
| Activated carbon |
Adsorption temperature (oC) |
H2S capacity (g[H2S]/g) |
| Breakthrough time (C/C0=0,05) 1
|
Reference time C/C0=0,5 1
|
Exhaustion time (C/C0=0,95) 2
|
| AC-H2O |
25 |
2.79 |
20.93 |
62.47 |
| |
50 |
2.70 |
35.94 |
95.53 |
| |
70 |
1.20 |
15.02 |
45.13 |
| AC-KOH |
25 |
1.46 |
5.66 |
25.95 |
| |
50 |
1.40 |
9.03 |
41.75 |
| |
70 |
2.12 |
10.47 |
23.23 |
| AC-CO2
|
25 |
22.14 |
53.62 |
137.83 |
| |
50 |
10.62 |
53.44 |
135.65 |
| |
70 |
25.19 |
102.69 |
220.17 |
Table 14.
CO2 adsorption capacity, molar mass of CO2 adsorbed per AC mass, on the activated carbon materials in various temperatures.
Table 14.
CO2 adsorption capacity, molar mass of CO2 adsorbed per AC mass, on the activated carbon materials in various temperatures.
| Activated carbon |
Adsorption temperature (oC) |
CO2 capacity (mmol[CO2]/g) |
| Breakthrough time (C/C0=0,05) 1
|
C/C0=0,5 1
|
Exhaustion time (C/C0=0,95) 1
|
Reference time C/C0=0,5 2
|
| AC-H2O |
25 |
0.08 |
0.19 |
0.30 |
0.30 |
| |
50 |
0.00 |
0.15 |
0.36 |
0.36 |
| |
70 |
0.11 |
0.20 |
0.38 |
0.38 |
| AC-KOH |
25 |
0.21 |
0.62 |
1.17 |
1.17 |
| |
50 |
0.13 |
0.49 |
0.86 |
0.86 |
| |
70 |
0.04 |
0.37 |
0.54 |
0.54 |
| AC-CO2
|
25 |
0.07 |
0.17 |
0.38 |
0.38 |
| |
50 |
0.06 |
0.10 |
0.10 |
0.10 |
| |
70 |
0.05 |
0.11 |
0.12 |
0.12 |
Table 15.
CO2 adsorption capacity, mass of CO2 adsorbed per AC mass, on the activated carbon materials in various temperatures.
Table 15.
CO2 adsorption capacity, mass of CO2 adsorbed per AC mass, on the activated carbon materials in various temperatures.
| Activated carbon |
Adsorption temperature (oC) |
CO2 capacity (g[CO2]/g) |
| Breakthrough time (C/C0=0,05) 1
|
C/C0=0,5 1
|
Exhaustion time (C/C0=0,95) 1
|
Reference time C/C0=0,5 2
|
| AC-H2O |
25 |
1.82 |
4.32 |
6.82 |
6.82 |
| |
50 |
0.00 |
3.41 |
8.18 |
8.18 |
| |
70 |
2.50 |
4.54 |
8.63 |
8.63 |
| AC-KOH |
25 |
4.77 |
14.09 |
26.58 |
26.58 |
| |
50 |
2.95 |
11.13 |
19.54 |
19.54 |
| |
70 |
0.91 |
8.41 |
12.27 |
12.27 |
| AC-CO2
|
25 |
1.59 |
3.86 |
8.63 |
8.63 |
| |
50 |
1.36 |
2.27 |
2.27 |
2.27 |
| |
70 |
1.14 |
2.50 |
2.73 |
2.73 |
Table 16.
Selectivity of H2S over CO2 on the activated carbon materials in various temperatures.
Table 16.
Selectivity of H2S over CO2 on the activated carbon materials in various temperatures.
| Activated carbon |
Reactor temperature (oC) |
Selectivity of H2S |
| Breakthrough time (C/C0=0,05) 1
|
Reference time C/C0=0,5 1
|
Exhaustion time (C/C0=0,95) 2
|
| AC-H2O |
25 |
254 |
1903 |
5680 |
| |
50 |
204 |
2719 |
7227 |
| |
70 |
86 |
1081 |
3248 |
| AC-KOH |
25 |
34 |
132 |
606 |
| |
50 |
45 |
288 |
1331 |
| |
70 |
106 |
525 |
1166 |
| AC-CO2
|
25 |
1573 |
3810 |
9795 |
| |
50 |
2902 |
14606 |
37075 |
| |
70 |
5607 |
22859 |
49010 |
