
You are currently viewing a beta version of our website. If you spot anything unusual, kindly let us know.
Preprint
Article
The Role Of Smart Transport In Urban Planning And The Transition From Traditional To Smart Cities In Developing Countries With Sustainability Requirements
Altmetrics
Downloads
389
Views
111
Comments
0


Abstract
Background: Smart transport plays a crucial role in urban planning and the transition from traditional to smart cities in developing countries with sustainability requirements.Traditional cities in developing countries often suffer from traffic congestion,air pollution, and inadequate public transportation systems,which can impede economic growth and negatively impact the quality of life for residents. Smart transport solutions can address these challenges by providing more efficient, sustainable.Here is a possible business model for an ITS system in a high-potential city in Iran,Based on IoT analysis, Mashhad city in Iran selected as a high-potential city to be changed to a smart city in the transportation sector.In the localization business model,the Uber smart transportation business model as a successful world experience is considered the base model. Methods: Based on the literature review,various criteria and sub-criteria were identified and determined in designing a new localized transportation business model.A questionnaire was prepared and filled with the help of 11 experts,method IAHP technique; Results:The present study showed the possibility of monthly payments for customers,software development, and the addition of luxury cars are among the most important sub-criteria with high weights;Conclusions: Working with transport companies,schools and universities as key partners solves reaching a strong and sustainable smart transportation system.
Keywords:
Subject: Business, Economics and Management - Other
1. Introduction
A land planning process is based on the use of planning tools, which refer to theories and model studies at different levels and administrative scales to define and analyze study areas. Italian law lays the basis for planning, which consists of national and regional laws. Therefore, it is often not sufficient to meet the needs of the territories, since legislation is rigid and generalized, whereas territorial characteristics tend to be determined by geography and politics. As a result, territorial evolution adapts to the social, economic, and historical-cultural demands generated by the process of territorial evolution.[1], In history, cities have either innovated and stayed ahead of the times, or fallen behind and begun to malfunction, with services not keeping pace with the needs of the population. If a community does not embrace progress or take advantage of new technologies, it could be at risk of slowing down its growth and eventually falling behind. This can lead to the community becoming isolated from the rest of the world, thereby diminishing commercial and tourist demand. Smart cities are the result of two different processes: a historical process that has caused stratification in cities, and a technological process that provides smart services to its inhabitants. At present, urban planning is adapting to the changes in territories in order to regulate their effects as they arise, rather than following predetermined norms and regulations [4]. In recent years, a revolution has taken place that has affected the entire world and created a completely new civilization. That has affected all human activities, and with the development of the internet and communication and information technologies, the world has moved towards an intelligent civilization [2,]. Over time, the internet is slowly moving from the internet to the Internet of Things (IoT), affecting everything. In the IoT, everything will be connected, and objects can communicate with each other through different sensors [2]. The growth and development of the IoT in recent years have expanded the scope of data and information [3,61,62]. In the last decade, businesses and incomes without the internet and the IoT have become increasingly difficult. In fact, a company with no specific business plan will fail [5,61]. Therefore, this new science has been supported and considered in countries such as the United States, China, the European Union, Egypt, and Iran. The convergence of massive data, highly efficient networks, social media, low-cost sensors, and a new generation of advanced analytics has opened up countless opportunities for businesses to make the most of them or enter a new market. Find or strengthen their operations in the current market [6]. The IoT is one of these new markets that can offer countless opportunities to businesses in various fields. Big changes are made with small changes. And the IoT could be the source of millions of changes in many areas over the next few years. Looking at the IoT as a source of data production and its impact on information technology infrastructure and the use of advanced methods in data analysis are among the exceptional and important opportunities in this regard [7,8]. In urban planning, interest in smart planning is high in order to holistically integrate choices and decisions that are suitable for complex territorial systems. Smart planning assumes this role of a connection process where ‘there is a scientific approach to urbanization, based on a holistic and rigorous plan of action which shapes the entire city, homogeneously, making it sustainable’ [3]. Moreover, smart planning has the important role of connecting the city’s technological network with territorial resources, in order to let them become part of the heritage of the city [6]. Because of the expansion of machine life and the increase in using mobile phones, the need to use smart transportation in the country is felt more and more. Metropolises such as Mashhad, like most advanced cities in the world, pursue the development of information and communication technology through comprehensive programs as smart cities [9,10]. In Iran, because of the development of cities and increasing population and limitations of energy and economic resources, the use of old systems that have little efficiency, the use of the current approach is not considered correct feedback; For this reason, in transportation, which is one indicator of the development and advanced of cities, it is not possible to control and manage transportation networks in traditional ways, and one of the main components of a smart city is the use of smart systems in transportation.
The paper has a particular interest in the transportation system as a possible example of real smart and integrated development in Mashah city in iran. Because Smart planning, applied to this type of landscape, has a positive influence on the development of the environment, the landscape, infrastructure, mobility, services, energy, research, and innovation [11,12]. This hypothesis is based on the concept that the territories must be planned by the urban planning instruments drawn up in observance with the legal norms, but must be administered with smart planning process. Territories should be governed by strategic plans, which define objectives and implement actions based on priorities and compatibility through a decision-making process, According to the paper, the Importance and necessity should be: Aging of public transport fleets, especially buses, Administered with smart planning processes, Low-cost gasoline for private cars, Governed by strategic plans that choose priority decisions for sustainable development, environmental protection and the prevention of natural risks, Motorcyclists’ aggressive behavior and disobedient behavior towards the law, Businesses is the intelligent transportation, According to the specific business framework, developers can use the IoT as a starting point to create applications. Therefore, the present study seeks a new and developed model for intelligent transportation in Mashhad iran.
2. Literature review
Various researchers have studied measuring and evaluating smart city indicators. They use different methods to determine the criteria and sub-criteria of smart cities and the importance of each criterion. The following table 1 gives information about previously published studies on smart cities.

Table 1.
Some previous studies about smart cities, (Source: Author).
| Researcher | Method | Model | Subject | A most important requirement for smart cities/studied factors |
|---|---|---|---|---|
| Anand et al.[63] | A.H.P. Fuzzy AHP |
DEA: AR-CCR | importance of various criteria for sustainability in smart cities in India, study on sustainable indicators for designing smart cities | Economic prosperity is the most important output |
| Ozkaia and Erdin [64] | ANP (analytical network process) and TOPSIS technique | MCDM | Evaluation of smart and sustainable cities for 44 cases | Most important: Smart living Lowest important: Smart governance |
| Zapolskytė et al.[65] | rank correlation method | MCDA, A.H.P. | Criteria for the smart city mobility system’s evaluation | The following factors were studied: Motor travel and congestion reduction measures; pollution reduction measures; travel safety and accident reduction measures; traffic management tools and services; smart infrastructure measures. |
| Yadav et al. [66] | hybrid Interpretative Structural Modeling (ISM)-Best Worst Method (BWM) (ISM.) | creating a foundation for sustainable smart cities for developing nations like India | The development of sustainable resources, the development of smart buildings, the development of advanced research and development systems, and the development of intelligent transportation systems. | |
| Hajduk [67] | Ordering preferences according to how closely they resemble the ideal solution (TOPSIS) | MCDM | Finding the cities with the most potential for becoming smart cities by studying 66 cities: Multi-Criteria Analysis of Smart Cities on the Example of Polish Cities | The most crucial components of smart cities are urban resistance and transportation efficiency. |
| Ye et al. [74] | MCDM | MCDM for smart city ranking: a case study in China | Among the first-level indicators, digital infrastructure accounts for 46.92%, followed by the digital economy and smart life at 32.48% and 20.60%, respectively. |
|
| Shokouhi et al. [75] | Fuzzy TOPSIS technique | Evaluation of Smart City Criteria in Ahvaz City, Iran | It has been recognized that "stable economies and the ability to transform," "social and ethnic diversity," "crisis management and the ability to organize human resources," "local and regional accessibility," "sustainable resource management," and "individual safety" are all important factors in making a smart city. |
|
| Present study | improved Analytic Hierarchy Process (IAHP) | MCDM | smart transportation in modern urban in developing countries | Transportation companies, Quick and easy access, software development, Schools and universities, License from the Tourism Organization, Monthly payment for regular customers, Software development, and infrastructure |
Moreover, the above table is based on Dashkevych et al. [76]. Systematic 2022 literature review about Criteria for Smart City Identification only the transportation is noticed only in 6 articles between more than 50 studied articles. Although in the same six articles, the transportation issue is not specifically focused on, this case has been examined along with other cases. This shows the lack of attention to the issue of transportation as an important category in the smartening of cities.
After reviewing the present research, it was found that there is no study for developing countries on the subject of evaluating smart city indicators and smart transportation in modern urban planning with the developed IAHP method. Also, newly designed and considered criteria and sub-criteria for analyzing smart transportation in developing countries are another novelty of the present study. Next to all the novelties mentioned earlier, the case study of Mashhad as the second most populated city in Iran makes this study more unique.
It should be noted that not every technology-based business is necessarily a startup, but all startups use the web, mobile, internet, and new technologies in some way to grow.
According to the Statistics Center of Iran, 40 million smartphone users in the country, and about 45 million people use their mobile Internet (Statistics Center of Iran, 2018 https://www.amar.org.ir/). There are more than 300,000 active trucks in the country, of which more than 20% are owned by themselves, and the volume of domestic transportation of goods reaches 381 million tons per year, which is done with 97 million shipments (bill of lading) and the volume of 1.4 million tons of goods. It has also crossed the country’s borders with 980 thousand trips, 144 million tons of imports with 70 thousand trips, and 6.6 million tons of exports with 13 thousand trips. According to estimates, the freight road transport industry in Iran is an industry of 900 thousand billion US Dollars (about a quarter of oil revenue per year), and more than 71% of freight transport in the country is done by trucks and a share of the freight transit market. It can be 3 thousand billion US Dollars. Regarding region and geographical location, Iran is prone to provide services to countries in the region, and there is a surplus of carrying capacity in the country [11].
This paper aims to Assessment of smart city indicators and smart transportation in modern urban planning in developing countries. We conducted this study in Iran, a developing country, especially in the city of Mashhad, as one of the metropolises of this country.
Therefore, there is an opportunity to set up online businesses in the freight market in Iran. Such businesses do not suddenly but gradually affect the current state of the market and the performance of the main factors that make up the freight market. The main reasons for the demand for this type of startup business in Iran are:
A) Productivity in the road transport industry
B) Transparency in the movement of goods
C) Faster access to carrying capacity
D) Expansion of the activity market in neighboring countries
E) Doing things more efficiently, including eliminating traditional methods (multiple phone calls and e-mail and physically exchanging documents and invoices) in moving goods.
In Iran, we are witnessing the emergence of several business models. Companies will support this business if the plan is acceptable and what it seeks to achieve.
Although in recent years we have seen an increase in the startup of many business companies, contrary to the good things that happen to most startups in developed countries, the fate of Iranian business activists is not so successful. Therefore, we can mention the main and structural reasons for the failure of businesses; the purpose of this study is to solve the following problems.
The lack of corporate identification to business models and the increase in business risk is one of the important characteristics of the business that starts a new business. It differs from a normal business with no previous experience and therefore has its own risk. Unfortunately, due to their specific characteristics, they are faced with failure. This situation caused investors to have few willingness to participate. Investors tend to invest in a place with little risk, and the money is not at risk. Like private investors, banks tend not to participate in high-risk capital investments. Banks are unaware of the risks in our banking system and are responsible for them. If the investment fails to fail, the entrepreneur should turn the whole bank’s capital and be responsible for all the project failure costs. These conditions have made it difficult for investors to absorb capital and start work with a serious obstacle. Always attracting investors for business is one of the main problems.
As mentioned, the lack of necessary infrastructure on the internet of objects is often in the information and communication field. Most of the countries started in different countries based on their similarities and differences. One of the requirements for their success is the existence of necessary infrastructures in the field of information processing, especially the internet of objects. Once your business is about to deal with it and is based on its foundation, it is also necessary to set up its infrastructure. High internet penetration, broadband internet with suitable bandwidth, cost of internet use, internet access in all places, and internet access are important infrastructures for promoting online and online mechanisms. Without universal access to the internet, there will be no possibility of development and success. The most important development of our country in the field of infrastructure is information, and significant progress has been made in this field, but still far from the world’s global standards. These conditions can be a major obstacle to success.
The inadequacy of business models to understand what is of particular importance in business is the speed in delivering work. Someone who will take action will also consider another alternative. Many of the shortcomings in the original design show themselves if they are on stage. Therefore, they must put aside their obsession and turn the idea into practice. The business needs to have a business environment. When business is not appropriate in the country, it is impossible to make a quick conclusion. Unfortunately, the business environment in our country does not have appropriate conditions. The inadequacy of business space is one of the main obstacles in shaping our country that can make the success of these businesses impossible or very difficult.
In a simple definition, the weakness of ecosystem transport/ecology is a set of elements in the form of an array of elements in the field of intelligent transportation in which they do not exist. The ecosystem’s components include growth and acceleration centers, capital centers, media, universities, educational centers, related government agencies, and legal systems. In some countries and cities, transportation systems are more successful than others because of the difference in this ecosystem. Looking at the country’s situation, it can be seen that our country has a serious weakness in these cases, and there is no suitable ecosystem for them. These conditions have led to a serious weakness in our country and insufficient space for growth and prosperity. Therefore, this research aims to present a local model for intelligent transportation.
3. Case study
3.1. Case study of Mashhad: A high potential city for localizing smart transportation system
Mashhad is a significant pilgrimage city located in the northeastern Iranian province of Khorasan Razavi. The Imam Reza shrine is visited by millions of pilgrims each year (more than 20 million pilgrims and tourists combined). After Tehran, the country’s capital, it boasts Iran’s second-largest population. In addition to refugees from Iraq and Afghanistan, the city also attracts tourists and pilgrims. There are 6,434,501 people living there (2021 census). The road and railroad networks in Mashhad have been greatly increased thanks to infrastructure development programs. After Tehran Mehrabad Airport and ahead of Tehran’s Imam Khomeini International Airport, the second busiest airport in the nation serves Mashhad. It offers 57 connections with frequent flights to 27 locations in Central Asia, the Middle East, East Asia, and Europe in addition to 30 cities inside of Iran. As the easternmost of Iran’s major cities, Mashhad is a hub for trade with the nations that border Iran to the east and is connected to many other cities by the Urban Railway, Railway, and numerous roads.The large population of Mashhad and the growth of Mashhad city in various aspects, especially in transportation, make it necessary to propose a smart transportation system. Figure 5 shows Mashhad’s Public transportation infrastructure and holy shrines.
Table 2.
Mashhad City in Iran Characteristics, (Source: Author).
| Population | 6,434,501 | millon |
|---|---|---|
| Visitor | 20 million | Every year |
| Density | 9,000 | per km2 |
| Area 351 km2 | Area 351 km2 | Area 351 km2 |
| Elevation | 1050 | m |
| Precipitation | 250 | millimeters |
| Climate | Steppe | climate |
| Coordinates | 36°18′N 59°36′E | - |
3.1.1. Transportation facilities for the public in mashhad
- ⮚
- LRT
- ⮚
- Bus
- ⮚
- Tax
Figure 1.
Mashhad City (Iran) location.
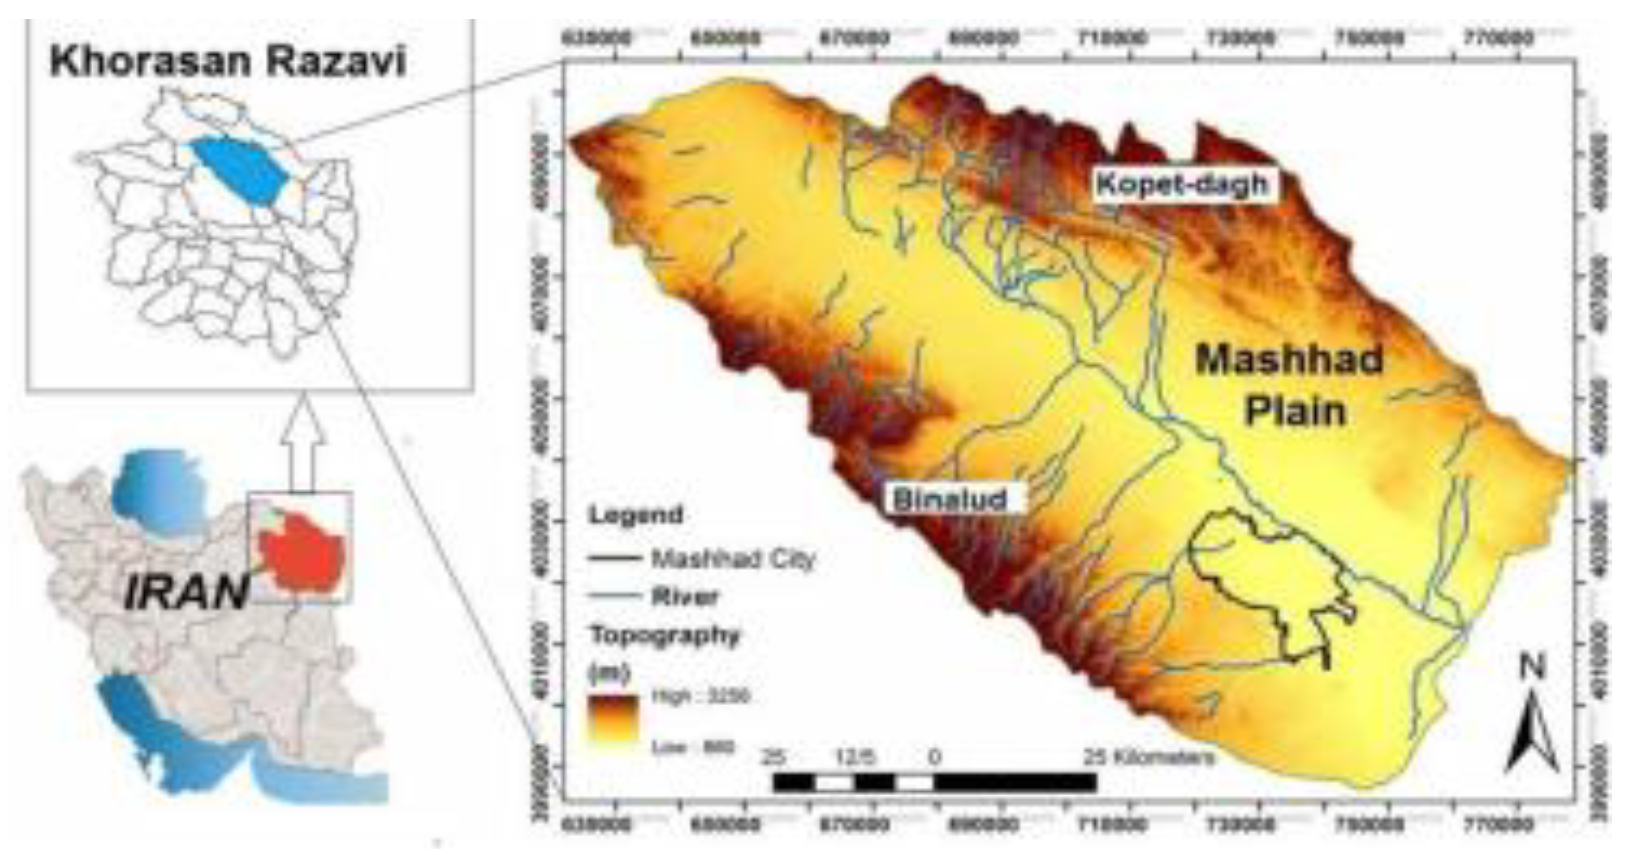
Figure 2.
Transportation Infrastructure city Mashhad(Iran).
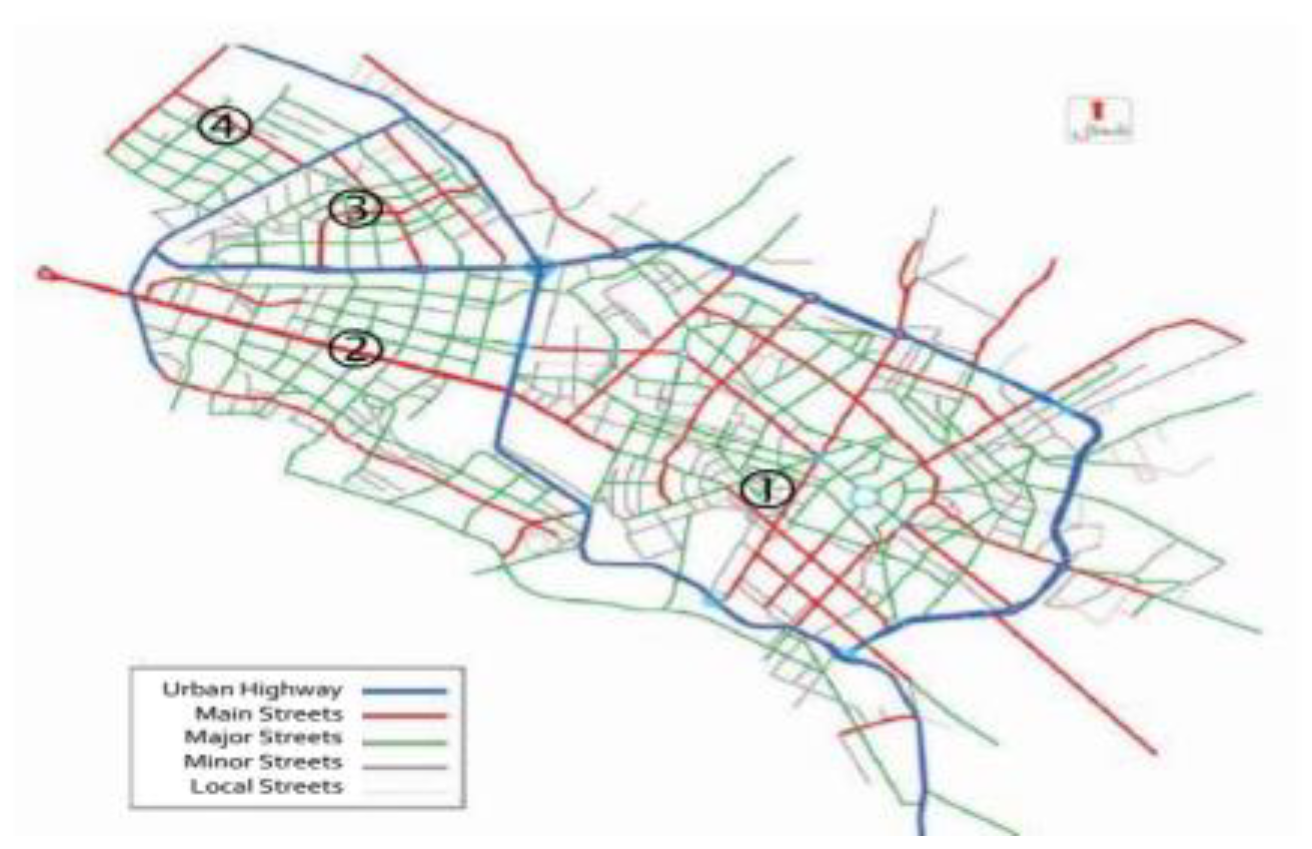
Figure 3.
Mashhad transportation infrastructure (A: LRT lin Map, B: LRT line), (Source: Author).
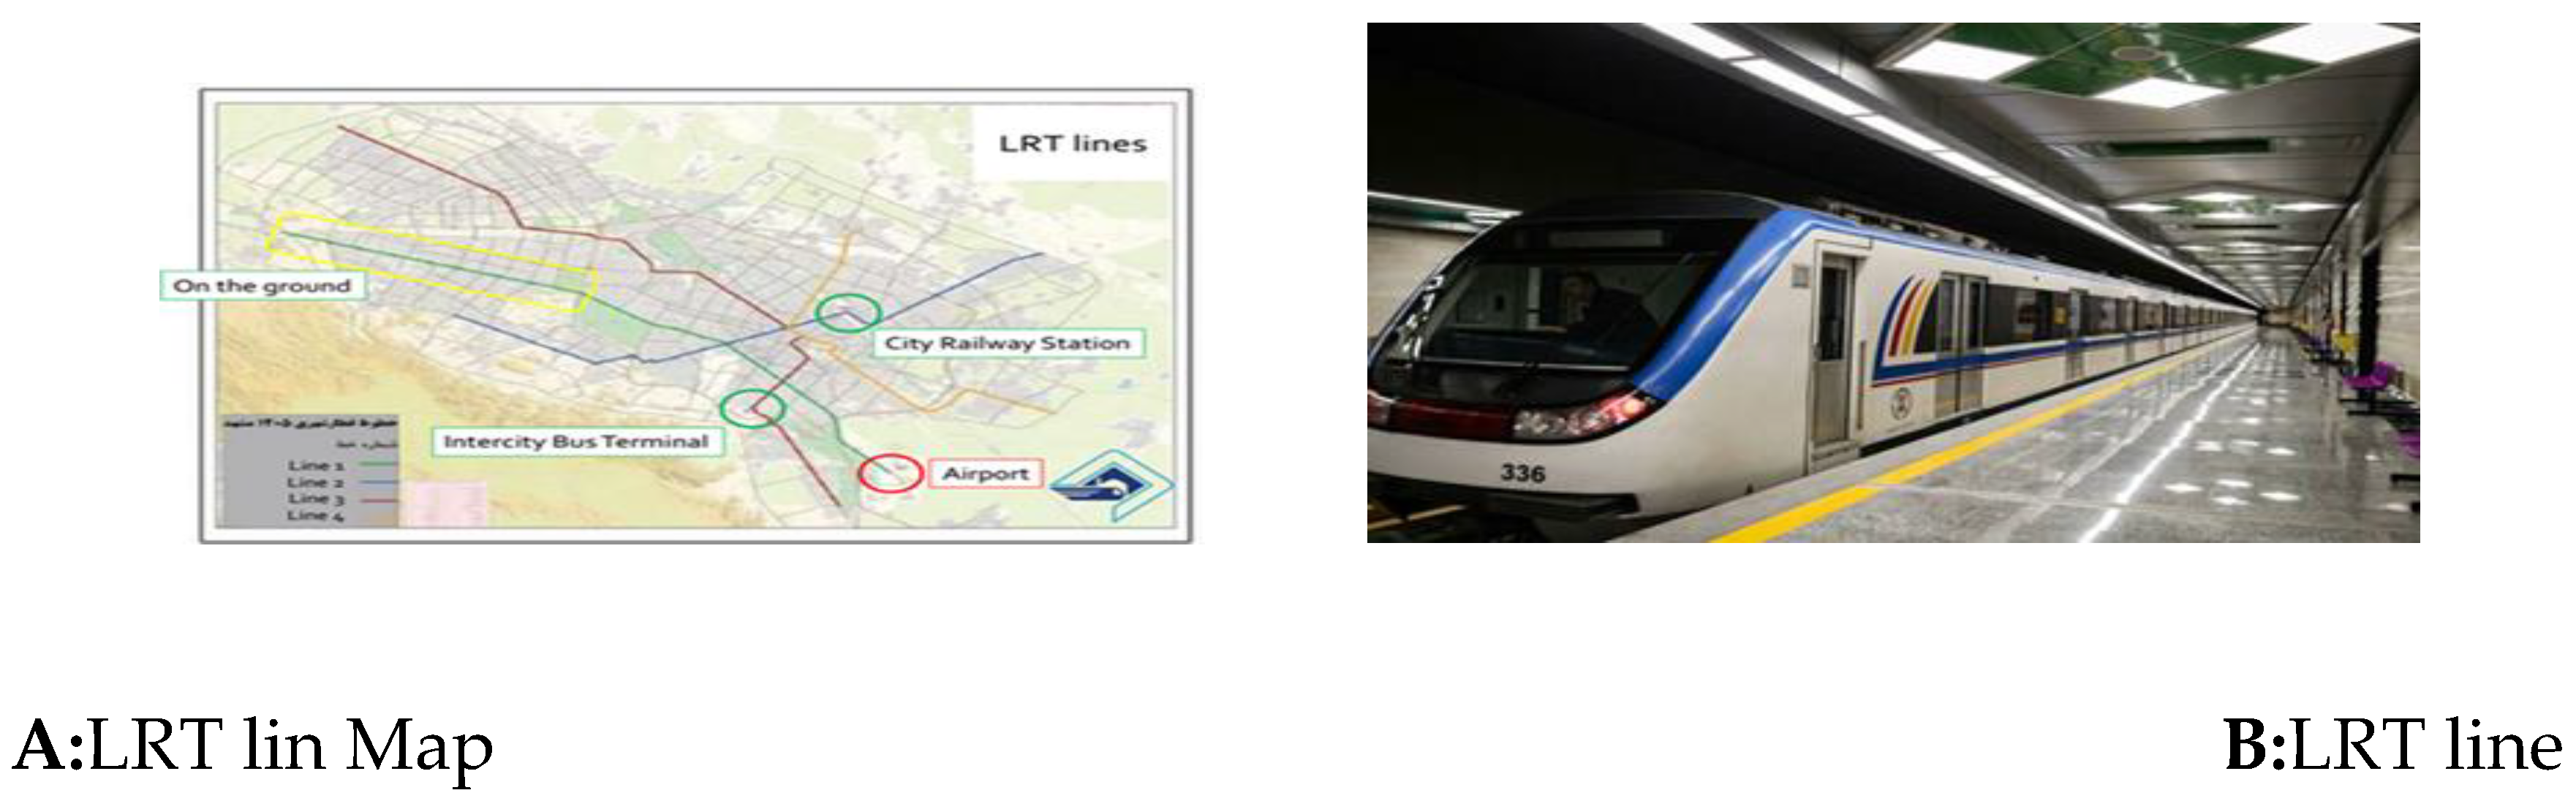
Figure 4.
Iran Mashhad International Airport (C: Airport Location, D: airport), (Source: Author).
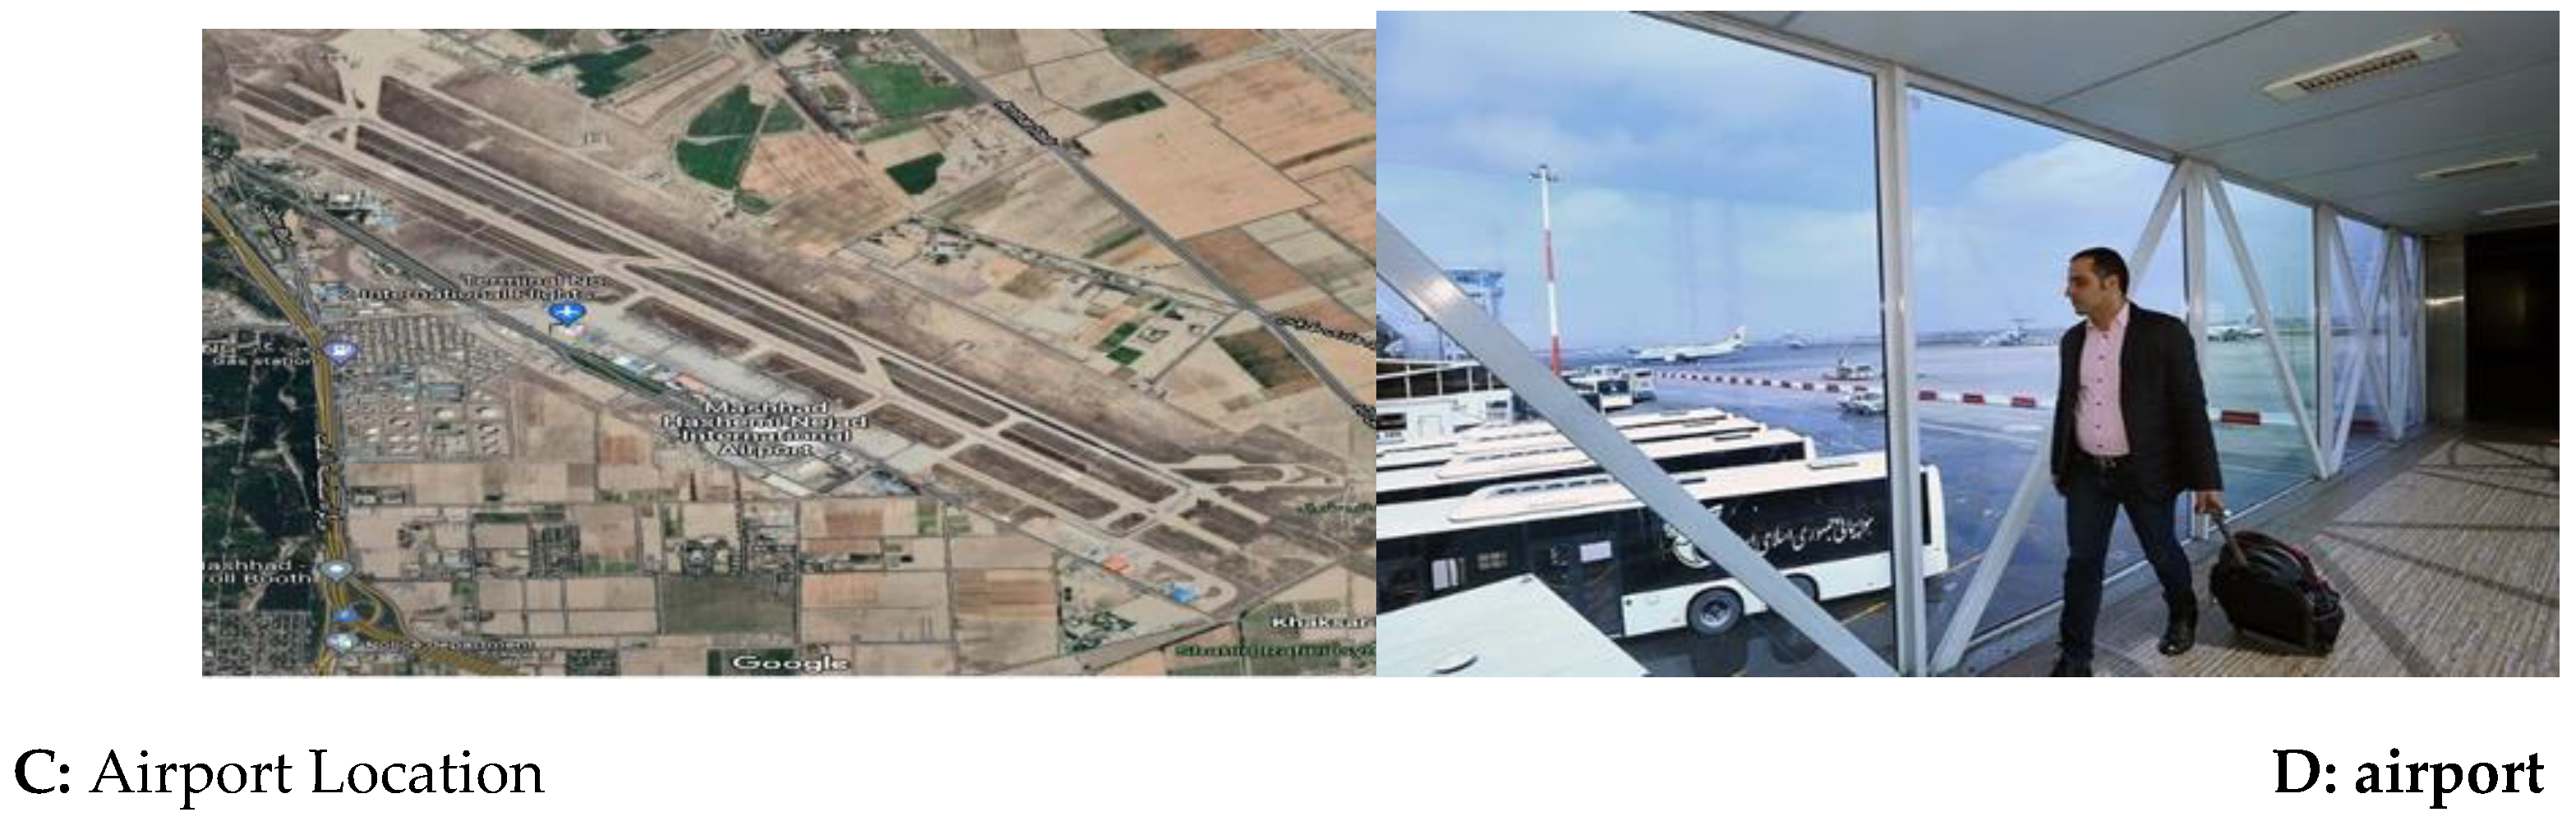
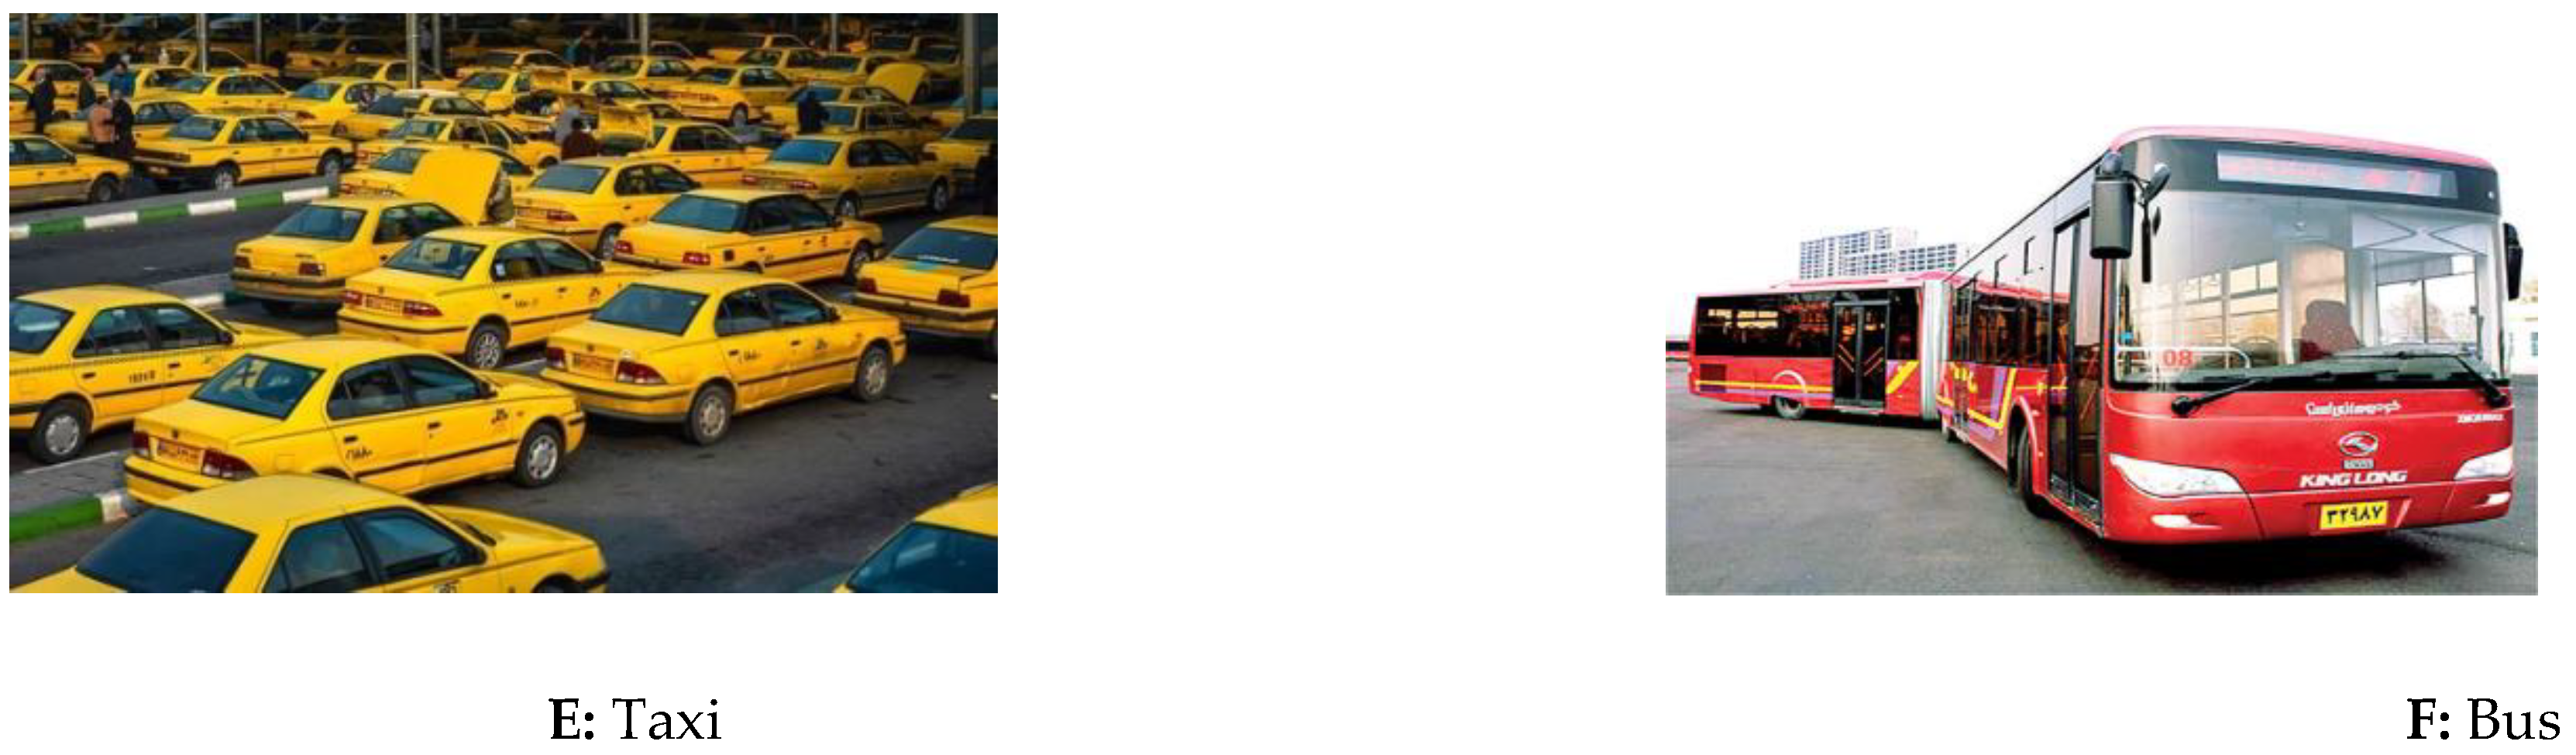
Figure 5.
Mashhad transportation infrastructure (E: Taxi, F: Bus).
3.2. Smart city and transportation
An intelligent transportation system refers to a set of tools, facilities, and specialties, such as traffic engineering concepts, software, hardware, and telecommunication technologies, that are used in a coordinated and integrated manner to improve the efficiency and safety of the transportation system [18].
In recent years, advanced societies have taken advantage of what is now known as IT benefits by creating intelligent transportation systems (ITS) to provide a convenient infrastructure for traffic professionals to access appropriate technologies in traffic planning, navigation, and control [19]. Provided. Assuming that these developments are positive and the current situation, 16 main systems, and more than 160 services have been provided by ITS. In this regard, achieving the goals of transport planners that always increase safety and comfort in travel, reduce costs and adverse environmental effects, reduce energy consumption and unwanted delays during travel and ultimately satisfy passengers and streamline traffic flow and transportation will be quoted. ITS intelligent transportation systems consist of new technologies of electronics, computers, IT, electro mechanics, etc., which play a very important role in the planning of land transportation systems today [20].
Intelligent transportation systems (ITS) use and planning date back to the early 1990s, when developed countries began to study, design, and expand these systems. Due to the development of different land transportation systems and the increase in travel demand at random and supply problems, different branches (ITS) have provided very positive effects in solving transportation challenges for governments [21].
Although smart cities are becoming faster and smarter in their function, they are not fully resilient against the impact of disasters. Khatibi et al. [71,72,73] have conducted valuable and applicable research about the resilience of smart cities. Their studies simultaneously focused on smart and resilient aspects as new city characteristics.
3.3. IoT business models
The use of the IoT in the field of (e-commerce) can have important and positive effects on increasing profitability and starting new and emerging businesses. Dimensions include payment, logistics transportation, financial operations, and warehouse control. The IoT can take over many traditional and manual activities electronically. This technology in e-commerce can affect both the activities of the seller and the producer and the activities of the consumer. Using location and data recognition technologies such as WiFi, GPS, RFID, and low-power Bluetooth can greatly help e-commerce and issues such as supply chain, transportation, and warehousing. For example, in a food factory, the implementation of this technology to manage the warehouse and the inputs and outputs of the warehouse, the condition of the goods, the management of the production date, and the control of the expiration date of the goods can be of great help to the producer. It can also track and collect product information anonymously for post-supply and use it in marketing and sales orientation and decisions [22,23,24].
According to EU Directive 2010/40 / EU ITS, ITs are described as systems that employ information and communication technology for communication with other modes of transportation as well as in the sphere of road transportation, including infrastructure, vehicles, and users. But ITS might apply to any form of transportation. Numerous programs are among its services and goods. Alberta segmented ITS applications into the eight important performance categories listed below in 2014 [25,26]:
Passenger information services (such as travel advice, etc.)
services for traffic management (such as advanced traffic systems, accident detection, management systems, etc.)
public transportation options (for example, information on electronic transport plans, GPS tracking of bus and place transport, etc.)
Operation of commercial vehicles (such as moving vehicles, clearing trucks at vehicle checkpoints and border crossings, etc.)
e. Services for electronic payments (such as electronic toll payment, etc.)
C) Services for emergency management (e.g., improving vehicle emergency response time by fleet tracking, route guidance, and signal pre-purchase, etc.)
Vehicle safety and control systems (such as vehicle technologies, including peripherals, collision avoidance sensor technologies, etc.)
Information storage services (such as traffic safety data collection, archived data management, etc.). ITIF separates ITS applications into five primary categories: Advanced Passenger Information Systems (ATIS), Advanced Transportation Management Systems (ATMs), ITS Shipping Pricing Systems, Advanced Transportation Systems, Public Transportation (APTS), and fully integrated systems (VII and V2V). The list of ITS programs is shown in seven categories in Table 2. (the previous five categories with two additional categories: car business operations and value-added services).
| Classification | Services and applications |
|---|---|
|
Advanced Passenger Information Systems (ATIS) |
Provide real-time traffic information |
| Navigation Guide / Navigation Systems | |
| Parking information | |
| Street weather systems | |
|
Advanced Transportation Management System (ATMs) |
Traffic Centers (TOCs) |
| Adaptive traffic control | |
| Dynamic message signs (or variable message signs) | |
| Measure the ramp | |
|
ITS Shipping Pricing Systems |
Electronic Telephone Collection (ETC.) |
| Canopy Pricing / Electronic Road Pricing (ERP) | |
| Express Cost (HOT.) | |
| Car Passenger Lines (Miles) Travel (VMT.) Expenses | |
| Variable parking costs | |
|
Advanced Public Transportation Systems (APTS) |
Real-time status information for the public transportation system (e.g., bus, subway, rail) |
| Automatic Vehicle Location (AVL) | |
| Electronic rent payment (for example, smart cards) | |
| Car Integration (VII) and Car and Vehicle Integration (V2V) | Collision Avoidance System (CICAS) |
| Smart Compatibility (ISA.) | |
| Commercial car operations | Fleet management |
| Shipping management | |
| Theft recovery | The car is connected |
| Car sharing |
There are numerous obstacles firms must overcome, and they must seek out novel approaches to achieve profitability, value creation, and market share. In this context, innovation in business models can be associated with a new vision for the organization, which is essential for overcoming market challenges and satisfying client needs. This section describes the primary models used in transportation and the necessity to seek out new models to better comprehend transportation business models [31,32].
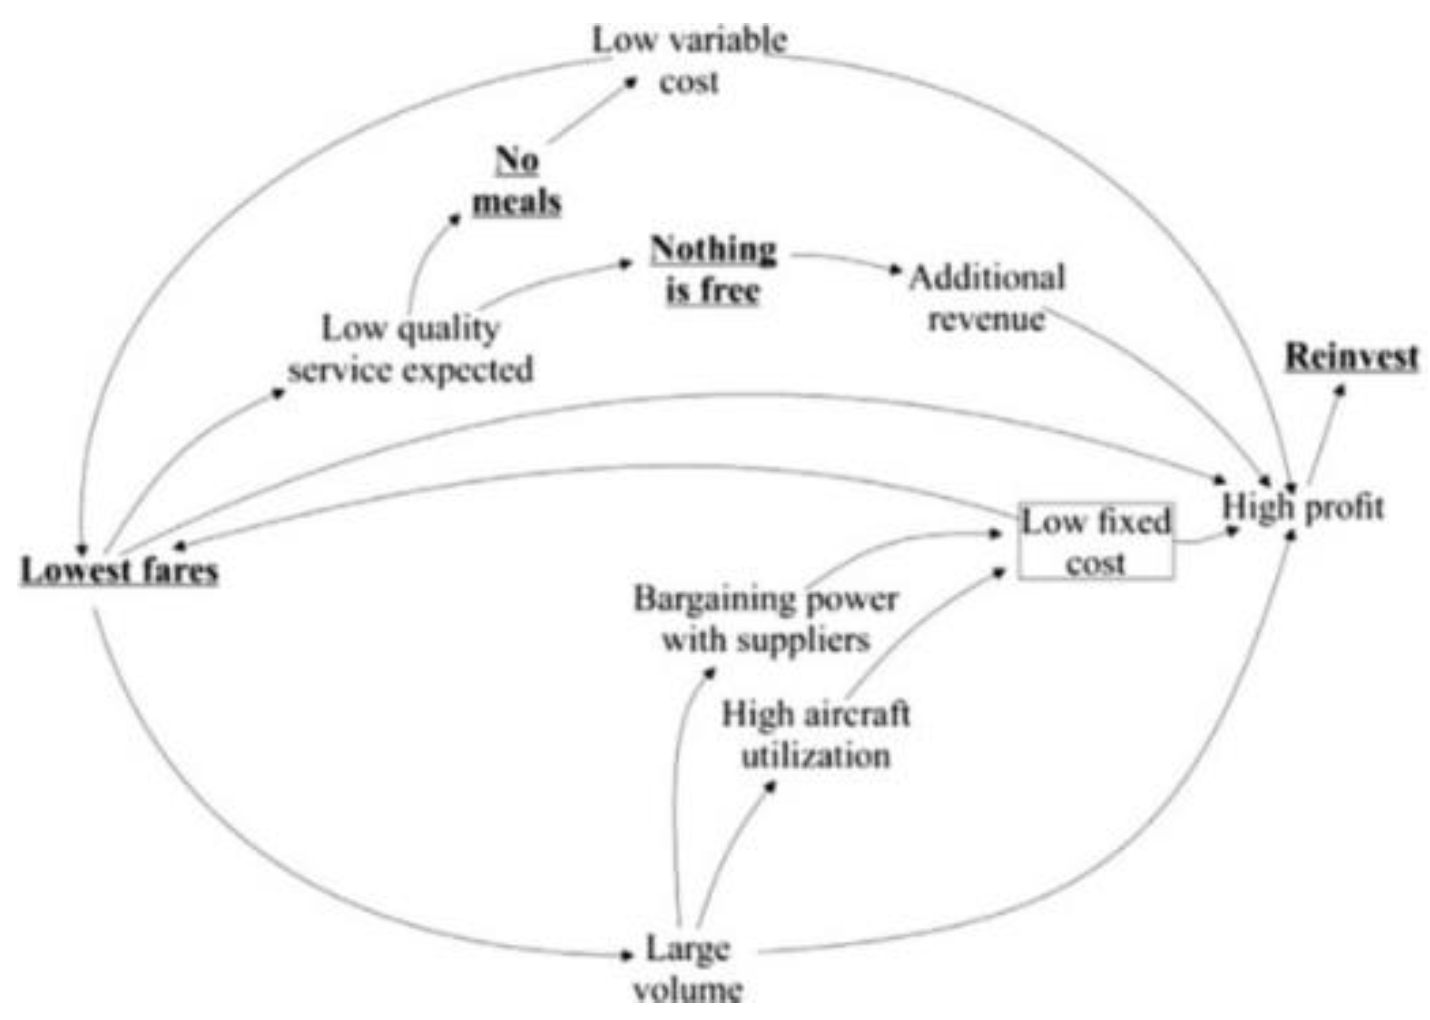
Historically, the fundamental business models utilized by transportation companies were centered on either low-cost or full-service tactics. Models based on a low-cost strategy are distinguished by their value creation, which is characterized by a focus on what is required to represent value to the traveler. The consumer receives a portion of the cost savings, which reduces their purchasing power. This model has been utilized by Southwest Airlines, Ryanair, Virgin Blue, and Air Asia.
Figure 7 is a graphical representation of airline activities, events, and flows based on a low-cost strategy business model.
Figure 7.
A simple overview of the Ryanair business model [33].
Figure 7.
A simple overview of the Ryanair business model [33].
3.3.1. Uber: An IoT based business model
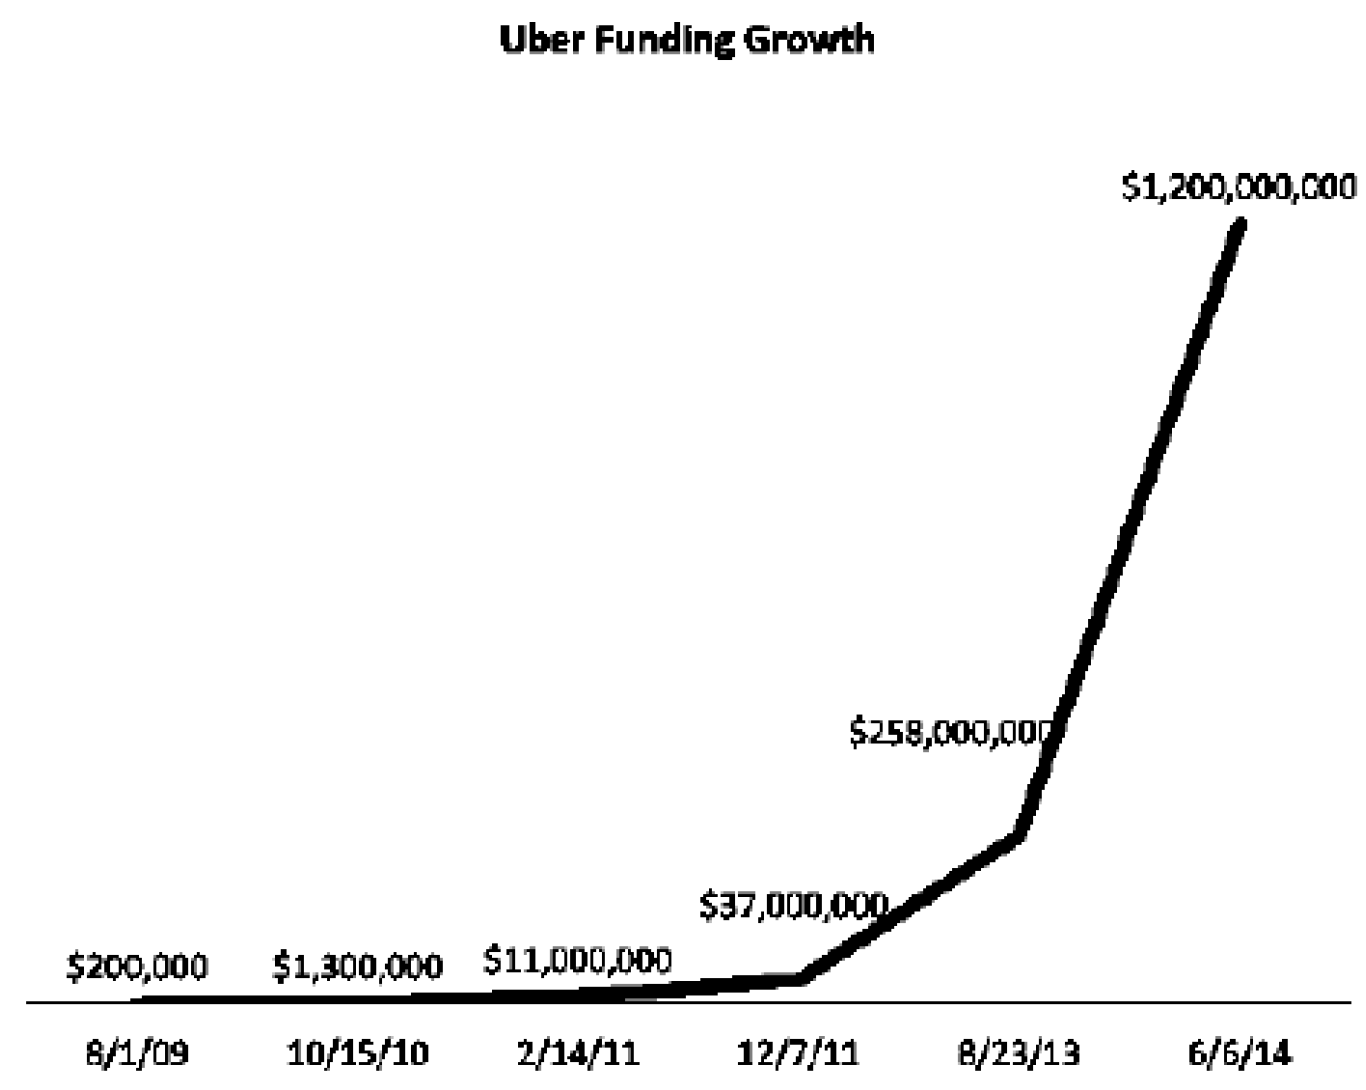
Uber started in 2009 and was launched in San Francisco in 2010. Since then, their growth as a company has been an exponential function (Figure 8). Customers request a ride through the phone app and track the location of their driver. Uber drivers use their own car. The service will be available in August 2016 in 66 countries and 536 cities worldwide. Uber app automatically calculates fare and transfers payment to driver [16].
Figure 8.
Uber stock [16].
Figure 8.
Uber stock [16].
Due to the unprecedented growth of this company all over the world, the business model used by them is always one of the most important models in the world. In this research, first the business model of the company is examined and then the native model for the business model is introduced.
BMC analysis (Business Model Canvas) is an analytical model that explains ideas about how an organization is created, presented, and valued. Using this approach, 9 elements in 9 baskets are displayed in the business model. Using BMC in itself has advantages in analyzing business models that are able to describe the current state of an organization based on consumer segment, value proposition, value proposition, customer relations, revenue stream, critical assets, and they are partners.
3.3.2. Business Model Canvas analysis
In this part, the results of the literature review-based analysis of Uber’s business model are presented.
- A)
- Customer section
Uber is a pioneer in online sharing. The customer section determines the user section provided by Uber. Uber focuses on selecting smartphone users and accessing the Google Playstore / Apple Store to download Uber apps. Uber also plans to select users who want easy transportation and want to move from one place to another. It can be concluded that Uber is aimed at mass market users [16,34,35].
- B)
- Suggested value
Uber is the first online taxi-sharing company in the world to become an online brand known to users and with various value propositions that users can like. Uber offers several value propositions. First, the GPS used in the Uber app is more accurate than others. So drivers can find the user’s location more easily. Second, the exchange rate, which is cheaper than its competitors. The prices charged by Uber are cheap depending on the distance per kilometer and travel time. If there is traffic, it will be in the (driver’s) interest. Third, customer safety is guaranteed by attracting a driver with at least three years of experience in 2012. Fourth, Uber is more flexible because it is not point-to-point, so it is more in line with the wishes of customers who want to have more than one destination [11,12,13,14].
- C)
- Distribution channel
Uber has applications that are used as the core of the shipping business. A rating in the Uber app indicates the driver’s evaluation of their performance, provided by customers who use Uber services. In addition, Uber has accepted credit cards to pay for its services through a credit card login code [14,15,16].
- D)
- Communication with the customer
Uber permits online ordering for shared services, including UberX, Uber Moto, and other in-app shipping options. Uber also accepts credit card payments from users. Utilizing a credit card while driving typically results in a minor reduction for service recipients. Similar to other online taxi-sharing services, Uber needs its users to rate the services of the driving partner using a rating system. Uber’s customer care handles complaints, criticism, and suggestions from users and service partners. During the trip, the user’s safety is totally covered by insurance, preventing the driver from acting negligently [17,18].
- E)
- revenue stream
Uber benefits from partnering with partner organizations through profit sharing. In addition, Uber benefits from a 90:10 service ratio distribution (90% for fellow drivers and 10% for Uber). For using credit cards as a means of payment by users, Uber also receives a small profit from the bank with an undisclosed amount. As well as being an app provider, Uber will benefit from 70% of the number of applications and applications installed by Google and Apple [19,20,21].
- F)
- Main sources
Uber has always tried to attract the right number of drivers. For this purpose, there is a sufficient proportion of the number of customers and drivers, and there are at least a few drivers for each trip; this saves customers time [22,23].
- G)
- Main activities
Uber’s most important activity is attracting customers and drivers because the two-way commission that Uber receives leads to the fact that the more customers and drivers there are, the more Uber revenue increases [24,25].
- H)
- Key partners
- L)
- Cost structure
Uber’s cost structure and revenue plan are such that it has a lot of virtual marketing. To this end, the bulk of Uber’s cost is devoted to three areas of marketing and software development, as well as manpower for 24-hour support at Uber [28].
4. Materials and Methods
4.1. Analysis of the proposed business model
In the localized business model, the SMS section is also included in the customer relationship section because e-mail is less used than SMS in Iran. It is also included in the main activity of software development because, due to the lack of proper infrastructure in Iran, a new update must be added every month to improve the application capabilities and be more up-to-date. In terms of revenue, the commission is similar to that of Uber.
It should be noted that the items listed in red in the table above are the suggested items for localizing Uber’s business model, the operational definition of each of the variables added in table 3.
Table 3.
Operational definition of each of the variables. (Source: Author).
| Criterion | Under the criteria | Definition |
|---|---|---|
| Customer section | Transportation companies |
Transport companies are one of the most important customers for smart Transportation |
| Commercial companies | Commercial companies can make an effective contribution to the development of the market and smart transportation customers | |
| Hotels | Hotels are an important destination for smart transportation due to many customers. | |
| schools | Schools, like hotels, play a key role in smart transportation. | |
| Suggested value | Quick and easy access | Fast and easy access is always one of the most important factors that intelligent transportation should have. |
| Ability to use a car for two customers with the same destination |
A similar value proposition has been implemented by the Tepsi team in Tehran. |
|
| Ability to track and inform the status and position of the shipment |
In situations where the freight transport system is used in intelligent transportation, it is possible to be able to track the status of the shipment. |
|
| Activity at any time |
Smart cities and smart transportation should be active and available at all Times |
|
| Main Activity | software development | Software development is one of the most important components of intelligent transportation |
| Attract motor courier and pickup |
Attract motor courier to increase customer and speed of work in intelli- gent transportation |
|
| Attract the driver of the minibus and van |
Attracting minibus and van drivers to increase customer and speed of work in intelligent transportation |
|
| Attract luxury cars for ceremonies |
Luxury cars have their customers, and attracting these cars is effective in increasing the customer in smart transportation | |
| Key partners | Hotels and government offices |
Hotels Government offices play a crucial role in smart transportation as a business partner due to a large number of staff. |
| Freight terminals |
Freight terminals, as business partners, play a crucial role in intelligent transportation due to a large number of means of transportation. |
|
| Luxury car rental companies |
Luxury car rental companies play a crucial role in smart transportation as a business partner. |
|
| Schools and universities | Schools and universities, as business partners, play a crucial role in intelligent transportation due to a large number of staff. | |
| Main source | Permission from Police |
Obtaining the necessary permits from government departments and police are very important |
| License from the Tourism Organization |
The Tourism Organization also has direct oversight of transportation and tourism, and obtaining a license is required |
|
| Income flow | Monthly payment for regular customers |
By signing a contract, regular customers can pay the desired amount on a the monthly basis to make it easier for them. |
| Freight with a commission of 90 for the driver and 10 for the company |
The company’s commission is determined according to similar companies | |
|
Cost structure Criterion |
Manpower | A significant portion of the costs are spent on manpower wages |
| Software development and infrastructure |
Software development and infrastructure cost a lot. |
3.1.1. Multi-criteria decision method (MCDM)
The literal meaning of the word decision is to sever, and its wider meaning is to determine the intent and intention, as well as to conclude and solve. The definition of decision-making is selecting one solution from multiple options. To date, numerous ideas and strategies have been offered for resolving researchers’ problems. Numerous mathematicians and industry professionals have, however, examined optimization models since the period of the industrialization of the world, and especially after the Second World War. Classical optimization models emphasize the presence of a criterion (or objective function), so the model may be linear, nonlinear, or mixed. In recent decades, however, researchers have focused on multi-criteria models for evaluating complex decisions [36,37].
Multi-criteria decision-making (MCDM) methods are separated into multi-objective decision-making (MODM) and multi-attribute decision-making (MADM) (MADM). The objective of decision-making is to select the optimal alternative or to assess the choice criteria. Each decision-making approach has a distinct objective: weighting the criteria, ranking the possibilities, and evaluating the criteria, respectively [38,39].
Hierarchical process analysis (AHP) is one of the multi-criteria decision models (MCDM) proposed by Saati in 1988 [69] and showed how the relative importance of a set of activities in decision problems could be This process can be used for a wide range of decision areas because it makes it possible to integrate judgments based on intangible qualitative criteria alongside intangible quantitative criteria. Hierarchy is based on the following principles:
1) Drawing a hierarchical tree,2) Formulating and determining priorities, 3) Logical consistency of judgments [35,36,37,38,39]. Hierarchical process analysis is widely used in solving many complex decision-making problems. In the following (table 4), the 9 degrees scale is defined and described for the process of MCDM and IAHP.
AHP is a technique for facilitating decision-making that highlights the significance of a decision-intuitive maker’s judgments and the consistency of evaluating alternative possibilities. The AHP approach is consistent with the behavior of a decision-maker since a decision-maker bases his or her judgments on knowledge and experience, and consequently makes decisions based on this. This approach’s strength is that it consistently organizes tangible and intangible aspects and provides a structured yet relatively straightforward answer to choice difficulties. [69].
This technique, which is one of the MCDM methods, has four basic principles that must always be observed [36,37]:
The principle of inversion: If criterion C1 precedes criterion C2, criterion C2 has priority over n / 1. This principle is always observed in the formation of pairwise comparisons (this principle is known in pairwise comparison matrices in the upper and lower diameters of the main diameter).
The principle of homogeneity: Options and criteria should always be comparable. Including two options in the decision, the model is impossible, one of which is extremely important to the other.
Principle of dependence: In hierarchical models, each level depends on its higher level.
Principle of expectations: Whenever there is a change in the hierarchical model, for example, a criterion is added, all the hierarchical steps must be repeated.
4.1.2. Improved A.H.P. Method
The AHP approach has been widely used in MCDM. Completing a comparison matrix (CM) in AHP is very difficult. This method analyzes the reasons for inconsistent CM in AHP and proposes improved AHP (IAHP) to improve CM compatibility using a sorting and ranking method. In other words, in the traditional AHP method, when the number of criteria increases, even comparisons increase. On the other hand, responding in pairs is time-consuming and tedious for the expert. For example, when we have six criteria, in traditional AHP, 15 pairwise comparisons are formed.
On the other hand, if these pairwise comparisons are not answered correctly, it causes the comparison to be incompatible, and the incompatibility rate is more than 0.1. This problem was solved with the Improve AHP (IAHP) method. The steps of this method are given below [70].
- Determining the set of criteria
The initial scoring of criteria by experts based on a range of 1 to 10 is called discrete ui for each criterion scored. Formation of a pairwise comparison matrix based on equations 1 and 2:
a_ij=max(u_i-u_j.1).if u_i≥u_j
a_ij=1/(u_j-u_i).if u_i<u_j
- Advantages of the IAHP method
This method has the following advantages compared to simple AHP [70]:
1- Compatibility in comparisons: This method with the sorting mode created for the criteria is an always consistent matrix. Simulation studies of this method show that when the number of criteria increases, the weight obtained is in line with The AHP method is typical.
2. The effectiveness of information extraction: Since the IAHP does not need decision-makers to perform the pairwise comparison process, a lot of effort (i.e., manpower costs) can be saved.
3- Convenience in action: Because in this method, even pair comparisons are not made, so the ease of filling in comparisons causes better and more accurate results.
- Results and discussions
First, the weight of 9 main criteria is specified, and then the problem criteria are coded as described in Table 5. These five criteria were paired by 11 experts using the Likert scale. The following table 4 gives detailed information about 11 selected experts, including work experience, job category, educational certificate, age, and gender. The questionnaire was sent to the experts, and answers were collected by the researcher who worked in the field of architecture and specialized in the Internet of Things.
Table 4.
Coding of problem criteria. (Source: Author).
| Criteria | Code |
|---|---|
| Customer relationship | 1 |
| Suggested value | 2 |
| Main Activity | 3 |
| Key partners | 4 |
| Distribution channels | 5 |
| Main source | 6 |
| Income flow | 7 |
| Cost structure | 8 |
| Customer section | 9 |
Table 5.
Detailed information about eleven experts. (Source: Author).
| No. | work experience | Job Category | Educational certificate | age | gender |
|---|---|---|---|---|---|
| 1 | 24 | Urban Management | Bachelor | 50 | Man |
| 2 | 9 | architecture | Bachelor | 53 | Man |
| 3 | 20 | IT management | Diploma | 43 | Man |
| 4 | 19 | architecture | Master’s | 51 | Man |
| 5 | 19 | Green space expert | Bachelor | 45 | Man |
| 6 | 19 | architecture | Bachelor | 39 | Female |
| 7 | 19 | Urban Management | PHD | 42 | Man |
| 8 | 19 | Urban Management | Bachelor | 40 | Man |
| 9 | 19 | architecture | Bachelor | 42 | Man |
| 10 | 18 | IT management | Bachelor | 45 | Man |
| 11 | 16 | architecture | Bachelor | 35 | Female |
Then their opinions were averaged. After determining the weight of the criteria, components, and sub-criteria, the matrix comparison pair of experts’ opinions for the components has been calculated in Table 6.
Table 6.
Pair comparison of criteria. (Source: Author).
| 1 | 2 | 3 | 4 | 5 | 6 | 7 | 8 | 9 | |
|---|---|---|---|---|---|---|---|---|---|
| 1 | 1 | 1.619 | 3.57 | 3.4 | 3.66 | 2.83 | 6.75 | 5.23 | 1.23 |
| 2 | 0.617665 | 1 | 2 | 2.66 | 4.75 | 2 | 3.5 | 6 | 6 |
| 3 | 0.280112 | 0.5 | 1 | 4.66 | 2.6 | 4.25 | 6.8 | 5.23 | 1.92 |
| 4 | 0.294118 | 0.37594 | 0.214592 | 1 | 3.8 | 2.06 | 3.4 | 1.28 | 1.33 |
| 5 | 0.273224 | 0.210526 | 0.384615 | 0.263158 | 1 | 2.66 | 2.5 | 3.1 | 2.33 |
| 6 | 0.353357 | 0.442478 | 0.235294 | 0.485437 | 0.37594 | 1 | 3.28 | 1.33 | 1.26 |
| 7 | 0.148148 | 0.285714 | 0.147059 | 0.294118 | 0.4 | 0.304878 | 1 | 1.375 | 2.66 |
| 8 | 0.191205 | 0.16 | 0.191205 | 0.78125 | 0.322581 | 0.75188 | 0.727273 | 1 | 3.66 |
| 9 | 0.813008 | 0.166667 | 0.520833 | 0.75188 | 0.429185 | 0.793651 | 0.37594 | 0.326158 | 1 |
After normalizing the data, the sum of each row is calculated. The line sum of each component is the weight of that component. The incompatibility rate has been calculated through expert choice 11 software. Using the geometric mean and steps of the AHP method, the weighting of the problem components is done as shown in Table 7.
Table 7.
Community matrix of experts’ opinions and weight of criteria. (Source: Author).
| 1 | 2 | 3 | 4 | 5 | 6 | 7 | 8 | 9 | weight | |
|---|---|---|---|---|---|---|---|---|---|---|
| 1 | 0.251836 | 0.340103 | 0.432015 | 0.237831 | 0.211101 | 0.167353 | 0.238236 | 0.208191 | 0.059146 | 0.238424 |
| 2 | 0.15555 | 0.21007 | 0.242025 | 0.186068 | 0.273969 | 0.133645 | 0.12353 | 0.248794 | 0.288517 | 0.206908 |
| 3 | 0.070542 | 0.105035 | 0.121013 | 0.325969 | 0.149962 | 0.251325 | 0.240001 | 0.208191 | 0.092325 | 0.173818 |
| 4 | 0.074069 | 0.078974 | 0.025968 | 0.06995 | 0.219175 | 0.121818 | 0.120001 | 0.050953 | 0.063955 | 0.091652 |
| 5 | 0.068808 | 0.044225 | 0.046543 | 0.018408 | 0.057678 | 0.1573 | 0.088236 | 0.123402 | 0.112041 | 0.079627 |
| 6 | 0.088988 | 0.092951 | 0.028474 | 0.033957 | 0.021683 | 0.059135 | 0.115765 | 0.052943 | 0.060589 | 0.061609 |
| 7 | 0.037309 | 0.06002 | 0.017796 | 0.020574 | 0.023071 | 0.018029 | 0.035294 | 0.054735 | 0.127909 | 0.04386 |
| 8 | 0.048152 | 0.033611 | 0.023138 | 0.054649 | 0.018606 | 0.044463 | 0.025669 | 0.039807 | 0.147432 | 0.048392 |
| 9 | 0.204745 | 0.035012 | 0.063027 | 0.052594 | 0.024754 | 0.046933 | 0.013269 | 0.012983 | 0.048086 | 0.055711 |
| incompatibility rate | 0.0614 | |||||||||
It is clear that the least important and the least important component is the criterion of cost structure, and the two criteria of value proposition and customer relationship are of great importance.
This native model is similar to the internet and online taxis. The main product of this indigenous model is the provision of online intercity transportation services; To request a car through this application, passengers, after specifying the travel route and travel options, selecting the type of service, and viewing the cost of travel, request a car. This application automatically connects passengers with the nearest driver and sends the passenger position to the driver. The driver approves it if he wishes; Passengers can also see the position of their driver. The above issue has been examined separately for each of the nine sections.
- Customer section
In this part of the Native Business Model, we identify who our customers are. We are not looking for a specific customer but for common features between customers. We need to know the characteristics of customers who choose our company from different services. Attention to customer characteristics is more important than product features because it greatly impacts product design or the type of service provided. The weight of this section is 0.055711, which indicates that it has less priority than others.
- Communication with clients
In this section, we determine the type of customer relationship. What is the customer’s role in our business, how can you be involved in the customer’s decisions, and to what extent should this help? What communication methods do you use to track your customers’ problems? In this section, questions such as the type of feedback, information, and after-sales service should be answered. Our type of business is very influential in how we interact with customers. For example, consider a driver who performs regular, weekly, and monthly service work in a hotel or office, in which case the driver is in close contact with the customer and the company’s support, and every customer contact and contact is related to his previous purchase. The situation requires the person in contact with the customers to be fully involved with their problems and to know their purchase history and problems. This criterion, with a weight of 0.238424, is of the highest importance.
- Distribution channels
What methods and techniques do you use to deliver your product or service to customers? Does the customer order through online services? Is it possible to access our services through the application? Should the customer come to our store, or should we go to the customer? Communication, distribution, and sales channels are the be- interface tween the company and its customers. Channels are points of contact with customers and play an important role in the customer experience. The weight of this criterion is 0.079.
- Revenue flow
In this section, the method or methods of revenue generation of the company are specified. Everything a business does is to make more money. If the business has several ways of generating revenue, a list of methods should be pro- vided in this section along with the figures. The income method of this business canvas is based on the commission of passenger transportation and finding a customer for the driver. The weight of this criterion is 0.043.
5.1 Suggested Value and Discussions
What is the most important value that this business can offer to customers? Why should a customer prefer this business canvas to others? In other words, what does the customer pay you for?
What makes the product or service of this business environment look more distinctive and attractive than other products? Each value proposition consists of a package of products or services that meet the needs of a specific segment of customers and thus create value for those customers. Values may be qualitative or quantitative. The weight of this criterion is 0.206.
- Key resources
This section lists the most important resources we need to achieve business goals. To know the key elements in the resource sector, is it enough to remove that resource to see if it is possible to achieve a business environment without it? These main sources can be the expenses for advertising, employees’ salaries, required facilities in the company’s office, etc. The weight of this criterion is 0.061.
The book The Creative Business Model Canvas [40] divides the main resources needed in the business model canvas into four main categories: financial resources, human resources, physical resources, intellectual resources, and intangible assets.
Financial resources: Perhaps the first question to be considered when starting a business is how much money is needed. When writing a business model canvas, the required financial resources should be specified in numbers [41].
- Human resources
Every business needs different human resources according to its field of work. This business environment requires accountability experts and several certified public accountants [42,43,44]. The clearer the type of skills required, the better the staff will be recruited, the better it will be in the future to find out what part of the company has met the needs of the company and the more transparent their achievements.
- Physical resources
Office costs, servers and electronic equipment such as computers and telephones, office costs, machinery, and so on.
Intellectual resources and intangible assets: Some very important business resources are not visible or physical. These resources are not quantifiable at first glance, but they play a constructive role. Such as the brand, specialized knowledge, licenses, and licenses required for the activity [45].
- Key activities
Some activities of a business have a vital and key role in advancing the goals of that business [46], these activities constitute the main nature of the business, and their elimination means the elimination of the business. In this section, the main business activities to create the value proposition of the business canvas should be listed [47,48]. For example, for a restaurant business model canvas, branding and advertising are key activities [49], and for a proposed business canvas model [50], customer marketing and attracting the driver of minibusses and luxury cars, etc., are key activities [51]. The weight of this criterion is 0.173.
- Key partners
In the Key Partners section, we talk about networking with other businesses. Obviously, for the growth and development of our business, we do not need to do everything ourselves and have all the units within our business. In addition to high costs, these conditions require a lot of time, energy, and space that many businesses can handle. It does not come. In this situation, businesses need to connect. The weight of this criterion is 0.091. For example, an online store network its business requires networking with advertising agencies and does not need to be an agency owner. However, in the bank’s business model, financial institutions and financial and credit companies are important business partners [52,53,54,55,56]. In the proposed business boom model, key partners such as hotels, schools, universities, etc., are [57].
- Cost structure
The cost structure is one of the most important parts of any business model canvas that calculates the share of each of the various business costs in total costs [58,59,60]. For example, we may have two different brands of shoes, in one of which the costs related to the production of the product are considered more than the costs related to advertising, and in the other, vice versa.
In the proposed business canvas model, marketing and software development are the cost structure’s main components. The weight of this criterion is 0.048. In table 8, the weight of each of the main criteria and sub-criteria is determined.
Table 8.
Weight of the sub-criteria of the problem. (Source: Author).
| Criterion | Under the criteria | Weight | Incompatibility rate |
|---|---|---|---|
|
Customer section |
Transportation companies | 0.437257 |
0.0674 |
| Commercial companies | 0.299587 | ||
| Hotels | 0.15754 | ||
| Schools | 0.105616 | ||
|
Suggested value |
Quick and easy access | 0.368421 |
0.0146 |
| Ability to use a car for two customers with the same Destination |
0.105263 | ||
| Ability to track and inform the status and position of the shipment |
0.263158 | ||
| Activity at any time | 0.263158 | ||
|
Main Activity |
software development |
0.347826 |
0.0632 |
| Attract motor courier and pickup | 0.217391 | ||
| Attract the driver of the minibus and van | 0.130435 | ||
| Attract luxury cars for ceremonies | 0.304348 | ||
|
Key partners |
Hotels and government offices | 0.117647 |
0.0514 |
| Freight terminals | 0.176471 | ||
| Luxury car rental companies | 0.294118 | ||
| Schools and universities | 0.411765 | ||
| main source | Permission from Police | 0.466667 | 0.0248 |
| License from the Tourism Organization | 0.533333 | ||
|
Income flow |
The monthly payment for regular customers | 0.75 |
0.0179 |
| Freight with a commission of 90 for the driver and 10 for the company |
0.25 | ||
| Cost structure | Manpower | 0.4 | 0.0421 |
| Software development and infrastructure | 0.6 |
As it is known, the inconsistency rate in all cases is below 0.1, which indicates the compatibility of the questionnaire and the lack of answers by experts.
6. Conclusions
The evaluation of smart transport in urban planning is becoming increasingly important as cities around the world seek to become more sustainable, efficient, and livable. Developing countries, in particular, face unique challenges in their transition to smart cities, but also have the opportunity to leapfrog traditional infrastructure and adopt cutting-edge technologies.
Smart transport refers to the use of technology to improve the efficiency, safety, and sustainability of transportation systems. This can involve a range of measures, including the use of intelligent traffic management systems, real-time data analysis, and the integration of various modes of transport (e.g. public transit, cycling, and walking). In developing countries, smart transport can play a crucial role in addressing a range of urban challenges, including traffic congestion, air pollution, and inadequate public transport. By leveraging technology to optimize transportation systems, cities can reduce the time and cost of travel, improve accessibility, and enhance safety for all users.
Overall, the evaluation of smart transport in urban planning is critical for the transition from traditional to smart cities in developing countries. While there are a number of challenges to overcome, the potential benefits of smart transport are significant and can contribute to more sustainable, livable, and equitable cities. Iran is a country with a rapidly growing urban population and a significant need for modern, efficient, and sustainable transportation systems. Intelligent transportation systems (ITS) can play a crucial role in meeting this need by leveraging technology to improve the efficiency, safety, and sustainability of transportation systems. Here is a possible business model for an ITS system in a high-potential city in Iran:
1. Identify the target market: The first step is to identify the target market for the ITS system. This could include public transport operators, private transport companies, logistics and delivery companies, and individual vehicle owners.
2. Define the scope of the system: The next step is to define the scope of the ITS system. This could include a range of features, such as real-time traffic monitoring, intelligent traffic management, and integrated payment systems.
3. Develop the technology platform: The third step is to develop the technology platform for the ITS system. This may require partnerships with technology companies and expertise in areas such as data analytics, software development, and hardware integration.
4. Develop revenue streams: There are several potential revenue streams for an ITS system in Iran. These include:
- Subscription fees for access to the ITS system
- Transaction fees for payment processing
- Advertising revenue from targeted advertising on the ITS platform
- Data sales to third-party companies for analysis and insights.
5. Partner with government and private sector stakeholders: To ensure the success of the ITS system, it is important to partner with government and private sector stakeholders.This could include working with local transport authorities to integrate the ITS system with existing transport infrastructure, partnering with private transport companies to provide access to the system, and collaborating with universities and research institutions to develop and test new features.
6. Develop a marketing strategy: Developing a marketing strategy is crucial to promote the ITS system and attract users. This may include targeted advertising campaigns, partnerships with local media outlets, and outreach to community groups and stakeholders.
7. Ensure regulatory compliance: It is important to ensure that the ITS system complies with all relevant regulations and standards in Iran. This may require working closely with local authorities to obtain necessary permits and approvals.
Overall, an ITS system in a high-potential city in Iran could offer significant benefits to users and stakeholders, while also creating a profitable business opportunity. However, success will depend on careful planning, investment, and collaboration between various stakeholders.
A localized business model for a smart transportation system in Mashhad, a populated city in Iran, was proposed in the present study. After the literature review, identification of criteria and sub-criteria, and experts’ comments, the prioritization of criteria and sub-criterions was made by applying MCDM and IAHP methods to find the most important ones. According to the weighting results, below highlights can be mentioned:
1-Among 4 sub-criterions in the customer section criteria, the transportation companies, with the weight of 0.437257, were more important than other customers like commercial companies, hotels, and schools.
2- Among four sub-criterions of suggested value criteria, quick and easy access to smart transportation systems is more important than the others. However, the three other sub-criteria achieved acceptable weights and are not to be ignored in the way of having a successful smart transportation system.
3- Analyzing the 3rd main criteria shows that software development and attracting luxury cars are among the main activities that need to be tracked.
4- Schools and universities achieved the highest weights among all potential key partners, with a weight of 0.41175.
Also, licenses from the Tourism Organization, Monthly payments for regular customers, and Software development and infrastructure are three other important sub-criteria with a high weight of importance. These three can be nominated as the most important sub-criteria among all studied. In addition to improving transportation, smart cities also incorporate sustainability into their planning and design. This includes prioritizing energy efficiency, reducing greenhouse gas emissions, and incorporating green spaces into urban areas to improve air quality and promote a healthier environment for residents.To successfully transition to a smart city, developing countries must address the challenges of inadequate infrastructure, limited resources, and technological barriers. This requires collaboration between government, private sector, and civil society organizations to develop a comprehensive strategy that addresses the needs of all stakeholders.
Overall, the role of smart transport in urban planning and the transition to smart cities in developing countries with sustainability requirements is critical for achieving economic growth, improving quality of life, and promoting environmental sustainability. By investing in smart transport solutions and prioritizing sustainability, developing countries can create more livable and resilient cities for their residents.
Recommendation
- –
- For smart transportation, demand management methods and redesigning streets cross sections are used to change priorities (from private cars to public transport and active modes).
- –
- Maintaining the quality of the intelligent transportation systems and making them more attractive to the private sector
- –
- Information services for intelligent public transportation that are accurate and reliable
- –
- Benefit from increased integration of public intelligent transportation and bike travel in the city.
- –
- Balance efforts on different aspects of intelligent transportation.
Author Contributions
SK conceived of the presented idea. N.SH, SH.M, MS, SF, SG,SK, RG developed the theory and performed the computations. SK verified the analytical methods SK drafted the manuscript with input from all authors N.SH, SH.M, M.S, SF, SG, SK, RG supervised and edited the final version. All authors discussed the results and contributed to the final.
Funding
Not applicable’ for that section.
Acknowledgments
This research did not receive any specific grant from funding agencies in the public, commercial, or not-for-profit sectors.
Conflicts of Interest
The authors declare that they have no known competing financial interests or personal relationships that could have appeared to influence the work reported in this paper.
Availability of data and material
The data presented in this study are available upon reasonable request.
References
- Batty, M., Axhausen, K. W., Giannotti, F., Pozdnoukhov, A., Bazzani, A., Wachowicz, M., ... & Portugali, Y. (2012). Smart cities of the future. The European Physical Journal Special Topics, 214(1), 481-518.
- Ahvenniemi, H., Huovila, A., Pinto-Seppä, I., & Airaksinen, M. (2017). What are the differences between sustainable and smart cities?. Cities, 60, 234-245. [CrossRef]
- Zanella, A., Bui, N., Castellani, A., Vangelista, L., & Zorzi, M. (2014). Internet of things for smart cities. IEEE Internet of Things journal, 1(1), 22-32.
- Mehmood, Y., Ahmad, F., Yaqoob, I., Adnane, A., Imran, M., & Guizani, S. (2017). Internet-of-things-based smart cities: Recent advances and challenges. IEEE Communications Magazine, 55(9), 16-24. [CrossRef]
- Mohanty, S. P., Choppali, U., & Kougianos, E. (2016). Everything you wanted to know about smart cities: The internet of things is the backbone. IEEE Consumer Electronics Magazine, 5(3), 60-70. [CrossRef]
- Talari, S., Shafie-Khah, M., Siano, P., Loia, V., Tommasetti, A., & Catalão, J. P. (2017). A review of smart cities based on the internet of things concept. Energies, 10(4), 421.
- Perera, C., Zaslavsky, A., Christen, P., & Georgakopoulos, D. (2014). Sensing as a service model for smart cities supported by internet of things. Transactions on emerging telecommunications technologies, 25(1), 81-93. [CrossRef]
- Harmon, R. R., Castro-Leon, E. G., & Bhide, S. (2015, August). Smart cities and the Internet of Things. In 2015 Portland International Conference on Management of Engineering and Technology (PICMET) (pp. 485-494). IEEE.
- Alavi, A. H., Jiao, P., Buttlar, W. G., & Lajnef, N. (2018). Internet of Things-enabled smart cities: State-of-the-art and future trends. Measurement, 129, 589-606. [CrossRef]
- Qian, Y., Wu, D., Bao, W., & Lorenz, P. (2019). The internet of things for smart cities: Technologies and applications. IEEE Network, 33(2), 4-5. [CrossRef]
- Shokouhi, M. A., Naghibirokni, S. N., Alizadeh, H., & Ahmadi, A. (2016). Evaluation of smart city criteria in ahvaz city, Iran. Iran University of Science & Technology, 26(2), 141-149.
- Zantalis, F., Koulouras, G., Karabetsos, S., & Kandris, D. (2019). A review of machine learning and IoT in smart transportation. Future Internet, 11(4), 94. [CrossRef]
- Kelley, S. B., Lane, B. W., Stanley, B. W., Kane, K., Nielsen, E., & Strachan, S. (2020). Smart transportation for all? A typology of recent US smart transportation projects in midsized cities. Annals of the American Association of Geographers, 110(2), 547-558. [CrossRef]
- Jan, B., Farman, H., Khan, M., Talha, M., & Din, I. U. (2019). Designing a smart transportation system: An internet of things and big data approach. IEEE Wireless Communications, 26(4), 73-79. [CrossRef]
- Rathore, M. M., Ahmad, A., Paul, A., & Jeon, G. (2015, November). Efficient graph-oriented smart transportation using internet of things generated big data. In 2015 11th International Conference on Signal-Image Technology & Internet-Based Systems (SITIS) (pp. 512-519). IEEE.
- Cramer, J., & Krueger, A. B. (2016). Disruptive change in the taxi business: The case of Uber. American Economic Review, 106(5), 177-82.
- Azgomi, H. F., & Jamshidi, M. (2018, November). A brief survey on smart community and smart transportation. In 2018 IEEE 30th International Conference on Tools with Artificial Intelligence (ICTAI) (pp. 932-939). IEEE.
- Karami, Z., & Kashef, R. (2020). Smart transportation planning: Data, models, and algorithms. Transportation Engineering, 2, 100013. [CrossRef]
- Zichichi, M., Ferretti, S., & D’Angelo, G. (2020, January). A distributed ledger based infrastructure for smart transportation system and social good. In 2020 IEEE 17th Annual Consumer Communications & Networking Conference (CCNC) (pp. 1-6). IEEE.
- Babar, M., & Arif, F. (2019). Real-time data processing scheme using big data analytics in internet of things based smart transportation environment. Journal of Ambient Intelligence and Humanized Computing, 10(10), 4167-4177. [CrossRef]
- Lingli, J. (2015, December). Smart city, smart transportation: recommendations of the logistics platform construction. In 2015 International Conference on Intelligent Transportation, Big Data and Smart City (pp. 729-732). IEEE.
- Bacciu, D., Carta, A., Gnesi, S., & Semini, L. (2017). An experience in using machine learning for short-term predictions in smart transportation systems. Journal of Logical and Algebraic Methods in Programming, 87, 52-66. [CrossRef]
- Wang, Y., Ram, S., Currim, F., Dantas, E., & Sabóia, L. A. (2016, September). A big data approach for smart transportation management on bus network. In 2016 IEEE international smart cities conference (ISC2) (pp. 1-6). IEEE.
- Singh, D., Singh, M., Singh, I., & Lee, H. J. (2015, July). Secure and reliable cloud networks for smart transportation services. In 2015 17th International Conference on Advanced Communication Technology (ICACT) (pp. 358-362). IEEE.
- Balbin, P. P. F., Barker, J. C., Leung, C. K., Tran, M., Wall, R. P., & Cuzzocrea, A. (2020). Predictive analytics on open big data for supporting smart transportation services. Procedia computer science, 176, 3009-3018. [CrossRef]
- Kumar, A., Rajalakshmi, K., Jain, S., Nayyar, A., & Abouhawwash, M. (2020). A novel heuristic simulation-optimization method for critical infrastructure in smart transportation systems. International Journal of Communication Systems, 33(11), e4397. [CrossRef]
- Shukla, S. N., & Champaneria, T. A. (2017, February). Survey of various data collection ways for smart transportation domain of smart city. In 2017 international conference on i-smac (iot in social, mobile, analytics and cloud)(i-smac) (pp. 681-685). IEEE.
- Howard, A. J., Lee, T., Mahar, S., Intrevado, P., & Woodbridge, D. M. K. (2018, June). Distributed data analytics framework for smart transportation. In 2018 IEEE 20th International Conference on High Performance Computing and Communications; IEEE 16th International Conference on Smart City; IEEE 4th International Conference on Data Science and Systems (HPCC/SmartCity/DSS) (pp. 1374-1380). IEEE.
- Zhang, Y., Zhang, G., Fierro, R., & Yang, Y. (2018). Force-driven traffic simulation for a future connected autonomous vehicle-enabled smart transportation system. IEEE Transactions on Intelligent Transportation Systems, 19(7), 2221-2233. [CrossRef]
- Dabiri, S., & Heaslip, K. (2018). Transport-domain applications of widely used data sources in the smart transportation: A survey. arXiv preprint arXiv:1803.10902.
- An, C., & Wu, C. (2020). Traffic big data assisted V2X communications toward smart transportation. Wireless Networks, 26(3), 1601-1610. [CrossRef]
- Ayoub, W., Ellatif Samhat, A., Mroue, M., Joumaa, H., Nouvel, F., & Prévotet, J. C. (2020). Technology selection for iot-based smart transportation systems. In Vehicular ad-hoc networks for smart cities (pp. 19-29). Springer, Singapore.
- Oswald, K. F. (2016). A brief history of smart transportation infrastructure. Transfers, 6(3), 123-129. [CrossRef]
- Xu, H., Lin, J., & Yu, W. (2017). Smart transportation systems: architecture, enabling technologies, and open issues. In Secure and Trustworthy Transportation Cyber-Physical Systems (pp. 23-49). Springer, Singapore.
- Nikabadi, M. S., & Razavian, S. B. (2020). A hesitant fuzzy model for ranking maintenance strategies in small and medium-sized enterprises. International Journal of Productivity and Quality Management, 29(4), 558-592. [CrossRef]
- Younesi Heravi, M., Yeganeh, A., & Razavian, S. B. (2022). Using fuzzy approach in determining critical parameters for optimum safety functions in mega projects (case study: Iran’s construction industry). In Frontiers in Nature-Inspired Industrial Optimization (pp. 183-200). Springer, Singapore.
- Yeganeh, A., Younesi Heravi, M., Razavian, S. B., Behzadian, K., & Shariatmadar, H. (2021). Applying a new systematic fuzzy FMEA technique for risk management in light steel frame systems. Journal of Asian Architecture and Building Engineering, 1-22. [CrossRef]
- Bagheri, R., Borouji, Z., Razavian, S. B., Keshvari, M. M., Sharifi, F., & Sharifi, S. (2021). Implementation of MCDM-Based Integrated Approach to Identifying the Uncertainty Factors on the Constructional Project. Mathematical Problems in Engineering, 2021. [CrossRef]
- Shafiei Nikabadi, M., & Razaviyan, S. B. (2018). Identification and ranking of effective indicators on the loyalty of the charities in Iranian charities using Fuzzy Delphi and Structural Interpretative Equation. Quarterly Journal of Socio-Cultural Development Studies, 6(3), 59-79.
- Carter, M., & Carter, C. (2020). The Creative Business Model Canvas. Social Enterprise Journal. [CrossRef]
- Aranda-Usón, A., Portillo-Tarragona, P., Marín-Vinuesa, L. M. & Scarpellini, S. Financial resources for the circular economy: A perspective from businesses. Sustainability (Switzerland) 11, (2019). [CrossRef]
- Stone, R. J. Human Resource Management : Personnel Human Resource Management. Harvard Business Review 13, 6–21 (2019).
- Molina-Azorin, J. F., López-Gamero, M. D., Tarí, J. J., Pereira-Moliner, J. & Pertusa-Ortega, E. M. Environmental management, human resource management and green human resource management: A literature review. Administrative Sciences 11, (2021). [CrossRef]
- Ahammad, M. F., Glaister, K. W. & Gomes, E. Strategic agility and human resource management. Human Resource Management Review 30, (2020). [CrossRef]
- Jha, S. B., Babiceanu, R. F. & Seker, R. Formal modeling of cyber-physical resource scheduling in IIoT cloud environments. Journal of Intelligent Manufacturing 31, 1149–1164 (2020). [CrossRef]
- Santos, F. M. (2012). A Positive Theory of Social Entrepreneurship. Journal of Business Ethics, 111(3), 335–351. https://doi.org/10.1007/s10551-012-1413-4. [CrossRef]
- Veleva, V. & Bodkin, G. Corporate-entrepreneur collaborations to advance a circular economy. Journal of Cleaner Production 188, 20–37 (2018). [CrossRef]
- .Österblom, H., Jouffray, J. B., Folke, C. & Rockström, J. Emergence of a global science–business initiative for ocean stewardship. Proceedings of the National Academy of Sciences of the United States of America 114, 9038–9043 (2017).
- Indrawan, M. I., Nasution, M. D. T. P., Adil, E. & Rossanty, Y. A Business Model Canvas: Traditional Restaurant “Melayu” in North Sumatra, Indonesia. Business Management and Strategy 7, 102 (2016).
- Sparviero, S. The Case for a Socially Oriented Business Model Canvas: The Social Enterprise Model Canvas. Journal of Social Entrepreneurship 10, 232–251 (2019). [CrossRef]
- Joyce, A. & Paquin, R. L. The triple layered business model canvas: A tool to design more sustainable business models. Journal of Cleaner Production 135, 1474–1486 (2016). [CrossRef]
- Kumar, M. A Study on Cooperative Banks in Himachal Pradesh with Special References to Lending Practices. International Journal of Research in Advent Technology 7, 15–24 (2019). [CrossRef]
- Stefanelli, V., Boscia, V. & Toma, P. Does knowledge translation drive spin-offs away from the “valley of death”? A nonparametric analysis to support a banking perspective. Management Decision 58, 1985–2009 (2020). [CrossRef]
- Mărăcine, V., Voican, O. & Scarlat, E. The Digital Transformation and Disruption in Banks’ Business Models under the Impact of FinTech and BigTech. Proceedings of the International Conference on Business Excellence 14, 294–305 (2020). [CrossRef]
- Cornée, S., Kalmi, P. & Szafarz, A. The Business Model of Social Banks. Kyklos 73, 196–226 (2020). [CrossRef]
- Köhler, M. Which banks are more risky? The impact of business models on bank stability. Journal of Financial Stability 16, 195– 212 (2015). [CrossRef]
- Fernandez-Antolin, M. M., Del-Río, J. M., Del Ama Gonzalo, F. & Gonzalez-Lezcano, R. A. The relationship between the use of building performance simulation tools by recent graduate architects and the deficiencies in architectural education. Energies 13, (2020). [CrossRef]
- Radionova, N., Breus, S., Denysenko, M., Khaustova, Ye. & Matiukh, A. CRITERIAL APPROACH TO ANALYSIS OF THE COST MANAGEMENT SYSTEM OF BUSINESS STRUCTURES. Financial and credit activity: problems of theory and practice 1, 190–202 (2021). [CrossRef]
- Schröder, M., Falk, B. & Schmitt, R. Evaluation of cost structures of additive manufacturing processes using a new business model. in Procedia CIRP 30, 311–316 (Elsevier B.V., 2015). [CrossRef]
- .Fontanesi, J. M., Flesher, D. S., De Guire, M., Lieberthal, A. & Holcomb, K. The cost of doing business: Cost structure of electronic immunization registries. Health Services Research 37, 1291–1307 (2002). [CrossRef]
- Hassan, R. J., Zeebaree, S. R., Ameen, S. Y., Kak, S. F., Sadeeq, M. A., Ageed, Z. S., ... & Salih, A. A. (2021). State of art survey for iot effects on smart city technology: challenges, opportunities, and solutions. Asian Journal of Research in Computer Science, 22, 32-48. [CrossRef]
- Gavrilović, N., & Mishra, A. (2021). Software architecture of the internet of things (IoT) for smart city, healthcare and agriculture: analysis and improvement directions. Journal of Ambient Intelligence and Humanized Computing, 12(1), 1315-1336. [CrossRef]
- Anand, A., Rufuss, D. D. W., Rajkumar, V., & Suganthi, L. (2017). Evaluation of sustainability indicators in smart cities for India using MCDM approach. Energy Procedia, 141, 211-215. [CrossRef]
- Ozkaya, G., & Erdin, C. (2020). Evaluation of smart and sustainable cities through a hybrid MCDM approach based on ANP and TOPSIS technique. Heliyon, 6(10), e05052. [CrossRef]
- Zapolskytė, S., Burinskienė, M., & Trepanier, M. (2020). Evaluation criteria of smart city mobility system using MCDM method. The Baltic journal of road and bridge engineering, 15(4), 196-224. [CrossRef]
- Yadav, G., Mangla, S. K., Luthra, S., & Rai, D. P. (2019). Developing a sustainable smart city framework for developing economies: An Indian context. Sustainable Cities and Society, 47, 101462. [CrossRef]
- Hajduk, S. (2021). Multi-Criteria Analysis of Smart Cities on the Example of the Polish Cities. Resources, 10(5), 44. [CrossRef]
- Yenkar, P. P., & Sawarkar, S. D. (2022). A novel ensemble approach based on MCC and MCDM methods for prioritizing tweets mentioning urban issues in smart city. Kybernetes. [CrossRef]
- Saaty, T. L. (1988). What is the analytic hierarchy process? In Mathematical models for decision support (pp. 109-121). Springer, Berlin, Heidelberg.
- Li, F., Phoon, K. K., Du, X., & Zhang, M. (2013). Improved AHP method and its application in risk identification. Journal of Construction Engineering and Management, 139(3), 312-320. [CrossRef]
- Gonella, F. (2019). The smart narrative of a smart city. Frontiers in Sustainable Cities, 1, 9. [CrossRef]
- An, S., Kim, S., & Kim, S. (2020). Necessity of the Needs Map in the Service Design for Smart Cities. Frontiers in Psychology, 11, 202.
- Foley, R. W., Nadjari, S., Eshirow, J., Adekunle, R., & Codjoe, P. (2022). Towards Digital Segregation? Problematizing the Haves and Have Nots in the Smart City. Front. Sustain. Cities, 4, 706670. [CrossRef]
- Ye, F., Chen, Y., Li, L., Li, Y., & Yin, Y. (2022). Multi-criteria decision-making models for smart city ranking: Evidence from the Pearl River Delta region, China. Cities, 128, 103793. [CrossRef]
- Shokouhi, M. A., Naghibirokni, S. N., Alizadeh, H., & Ahmadi, A. (2016). Evaluation of smart city criteria in ahvaz city, Iran. Iran University of Science & Technology, 26(2), 141-149.
- Dashkevych, O., & Portnov, B. A. (2022). Criteria for Smart City Identification: A Systematic Literature Review. Sustainability, 14(8), 4448. [CrossRef]
Disclaimer/Publisher’s Note: The statements, opinions and data contained in all publications are solely those of the individual author(s) and contributor(s) and not of MDPI and/or the editor(s). MDPI and/or the editor(s) disclaim responsibility for any injury to people or property resulting from any ideas, methods, instructions or products referred to in the content. |
© 2023 by the authors. Licensee MDPI, Basel, Switzerland. This article is an open access article distributed under the terms and conditions of the Creative Commons Attribution (CC BY) license (http://creativecommons.org/licenses/by/4.0/).
Copyright: This open access article is published under a Creative Commons CC BY 4.0 license, which permit the free download, distribution, and reuse, provided that the author and preprint are cited in any reuse.
Submitted:
08 June 2023
Posted:
08 June 2023
You are already at the latest version
Alerts
Submitted:
08 June 2023
Posted:
08 June 2023
You are already at the latest version
Alerts
Abstract
Background: Smart transport plays a crucial role in urban planning and the transition from traditional to smart cities in developing countries with sustainability requirements.Traditional cities in developing countries often suffer from traffic congestion,air pollution, and inadequate public transportation systems,which can impede economic growth and negatively impact the quality of life for residents. Smart transport solutions can address these challenges by providing more efficient, sustainable.Here is a possible business model for an ITS system in a high-potential city in Iran,Based on IoT analysis, Mashhad city in Iran selected as a high-potential city to be changed to a smart city in the transportation sector.In the localization business model,the Uber smart transportation business model as a successful world experience is considered the base model. Methods: Based on the literature review,various criteria and sub-criteria were identified and determined in designing a new localized transportation business model.A questionnaire was prepared and filled with the help of 11 experts,method IAHP technique; Results:The present study showed the possibility of monthly payments for customers,software development, and the addition of luxury cars are among the most important sub-criteria with high weights;Conclusions: Working with transport companies,schools and universities as key partners solves reaching a strong and sustainable smart transportation system.
Keywords:
Subject: Business, Economics and Management - Other
1. Introduction
A land planning process is based on the use of planning tools, which refer to theories and model studies at different levels and administrative scales to define and analyze study areas. Italian law lays the basis for planning, which consists of national and regional laws. Therefore, it is often not sufficient to meet the needs of the territories, since legislation is rigid and generalized, whereas territorial characteristics tend to be determined by geography and politics. As a result, territorial evolution adapts to the social, economic, and historical-cultural demands generated by the process of territorial evolution.[1], In history, cities have either innovated and stayed ahead of the times, or fallen behind and begun to malfunction, with services not keeping pace with the needs of the population. If a community does not embrace progress or take advantage of new technologies, it could be at risk of slowing down its growth and eventually falling behind. This can lead to the community becoming isolated from the rest of the world, thereby diminishing commercial and tourist demand. Smart cities are the result of two different processes: a historical process that has caused stratification in cities, and a technological process that provides smart services to its inhabitants. At present, urban planning is adapting to the changes in territories in order to regulate their effects as they arise, rather than following predetermined norms and regulations [4]. In recent years, a revolution has taken place that has affected the entire world and created a completely new civilization. That has affected all human activities, and with the development of the internet and communication and information technologies, the world has moved towards an intelligent civilization [2,]. Over time, the internet is slowly moving from the internet to the Internet of Things (IoT), affecting everything. In the IoT, everything will be connected, and objects can communicate with each other through different sensors [2]. The growth and development of the IoT in recent years have expanded the scope of data and information [3,61,62]. In the last decade, businesses and incomes without the internet and the IoT have become increasingly difficult. In fact, a company with no specific business plan will fail [5,61]. Therefore, this new science has been supported and considered in countries such as the United States, China, the European Union, Egypt, and Iran. The convergence of massive data, highly efficient networks, social media, low-cost sensors, and a new generation of advanced analytics has opened up countless opportunities for businesses to make the most of them or enter a new market. Find or strengthen their operations in the current market [6]. The IoT is one of these new markets that can offer countless opportunities to businesses in various fields. Big changes are made with small changes. And the IoT could be the source of millions of changes in many areas over the next few years. Looking at the IoT as a source of data production and its impact on information technology infrastructure and the use of advanced methods in data analysis are among the exceptional and important opportunities in this regard [7,8]. In urban planning, interest in smart planning is high in order to holistically integrate choices and decisions that are suitable for complex territorial systems. Smart planning assumes this role of a connection process where ‘there is a scientific approach to urbanization, based on a holistic and rigorous plan of action which shapes the entire city, homogeneously, making it sustainable’ [3]. Moreover, smart planning has the important role of connecting the city’s technological network with territorial resources, in order to let them become part of the heritage of the city [6]. Because of the expansion of machine life and the increase in using mobile phones, the need to use smart transportation in the country is felt more and more. Metropolises such as Mashhad, like most advanced cities in the world, pursue the development of information and communication technology through comprehensive programs as smart cities [9,10]. In Iran, because of the development of cities and increasing population and limitations of energy and economic resources, the use of old systems that have little efficiency, the use of the current approach is not considered correct feedback; For this reason, in transportation, which is one indicator of the development and advanced of cities, it is not possible to control and manage transportation networks in traditional ways, and one of the main components of a smart city is the use of smart systems in transportation.
The paper has a particular interest in the transportation system as a possible example of real smart and integrated development in Mashah city in iran. Because Smart planning, applied to this type of landscape, has a positive influence on the development of the environment, the landscape, infrastructure, mobility, services, energy, research, and innovation [11,12]. This hypothesis is based on the concept that the territories must be planned by the urban planning instruments drawn up in observance with the legal norms, but must be administered with smart planning process. Territories should be governed by strategic plans, which define objectives and implement actions based on priorities and compatibility through a decision-making process, According to the paper, the Importance and necessity should be: Aging of public transport fleets, especially buses, Administered with smart planning processes, Low-cost gasoline for private cars, Governed by strategic plans that choose priority decisions for sustainable development, environmental protection and the prevention of natural risks, Motorcyclists’ aggressive behavior and disobedient behavior towards the law, Businesses is the intelligent transportation, According to the specific business framework, developers can use the IoT as a starting point to create applications. Therefore, the present study seeks a new and developed model for intelligent transportation in Mashhad iran.
2. Literature review
Various researchers have studied measuring and evaluating smart city indicators. They use different methods to determine the criteria and sub-criteria of smart cities and the importance of each criterion. The following table 1 gives information about previously published studies on smart cities.
Table 1.
Some previous studies about smart cities, (Source: Author).
| Researcher | Method | Model | Subject | A most important requirement for smart cities/studied factors |
|---|---|---|---|---|
| Anand et al.[63] | A.H.P. Fuzzy AHP |
DEA: AR-CCR | importance of various criteria for sustainability in smart cities in India, study on sustainable indicators for designing smart cities | Economic prosperity is the most important output |
| Ozkaia and Erdin [64] | ANP (analytical network process) and TOPSIS technique | MCDM | Evaluation of smart and sustainable cities for 44 cases | Most important: Smart living Lowest important: Smart governance |
| Zapolskytė et al.[65] | rank correlation method | MCDA, A.H.P. | Criteria for the smart city mobility system’s evaluation | The following factors were studied: Motor travel and congestion reduction measures; pollution reduction measures; travel safety and accident reduction measures; traffic management tools and services; smart infrastructure measures. |
| Yadav et al. [66] | hybrid Interpretative Structural Modeling (ISM)-Best Worst Method (BWM) (ISM.) | creating a foundation for sustainable smart cities for developing nations like India | The development of sustainable resources, the development of smart buildings, the development of advanced research and development systems, and the development of intelligent transportation systems. | |
| Hajduk [67] | Ordering preferences according to how closely they resemble the ideal solution (TOPSIS) | MCDM | Finding the cities with the most potential for becoming smart cities by studying 66 cities: Multi-Criteria Analysis of Smart Cities on the Example of Polish Cities | The most crucial components of smart cities are urban resistance and transportation efficiency. |
| Ye et al. [74] | MCDM | MCDM for smart city ranking: a case study in China | Among the first-level indicators, digital infrastructure accounts for 46.92%, followed by the digital economy and smart life at 32.48% and 20.60%, respectively. |
|
| Shokouhi et al. [75] | Fuzzy TOPSIS technique | Evaluation of Smart City Criteria in Ahvaz City, Iran | It has been recognized that "stable economies and the ability to transform," "social and ethnic diversity," "crisis management and the ability to organize human resources," "local and regional accessibility," "sustainable resource management," and "individual safety" are all important factors in making a smart city. |
|
| Present study | improved Analytic Hierarchy Process (IAHP) | MCDM | smart transportation in modern urban in developing countries | Transportation companies, Quick and easy access, software development, Schools and universities, License from the Tourism Organization, Monthly payment for regular customers, Software development, and infrastructure |
Moreover, the above table is based on Dashkevych et al. [76]. Systematic 2022 literature review about Criteria for Smart City Identification only the transportation is noticed only in 6 articles between more than 50 studied articles. Although in the same six articles, the transportation issue is not specifically focused on, this case has been examined along with other cases. This shows the lack of attention to the issue of transportation as an important category in the smartening of cities.
After reviewing the present research, it was found that there is no study for developing countries on the subject of evaluating smart city indicators and smart transportation in modern urban planning with the developed IAHP method. Also, newly designed and considered criteria and sub-criteria for analyzing smart transportation in developing countries are another novelty of the present study. Next to all the novelties mentioned earlier, the case study of Mashhad as the second most populated city in Iran makes this study more unique.
It should be noted that not every technology-based business is necessarily a startup, but all startups use the web, mobile, internet, and new technologies in some way to grow.
According to the Statistics Center of Iran, 40 million smartphone users in the country, and about 45 million people use their mobile Internet (Statistics Center of Iran, 2018 https://www.amar.org.ir/). There are more than 300,000 active trucks in the country, of which more than 20% are owned by themselves, and the volume of domestic transportation of goods reaches 381 million tons per year, which is done with 97 million shipments (bill of lading) and the volume of 1.4 million tons of goods. It has also crossed the country’s borders with 980 thousand trips, 144 million tons of imports with 70 thousand trips, and 6.6 million tons of exports with 13 thousand trips. According to estimates, the freight road transport industry in Iran is an industry of 900 thousand billion US Dollars (about a quarter of oil revenue per year), and more than 71% of freight transport in the country is done by trucks and a share of the freight transit market. It can be 3 thousand billion US Dollars. Regarding region and geographical location, Iran is prone to provide services to countries in the region, and there is a surplus of carrying capacity in the country [11].
This paper aims to Assessment of smart city indicators and smart transportation in modern urban planning in developing countries. We conducted this study in Iran, a developing country, especially in the city of Mashhad, as one of the metropolises of this country.
Therefore, there is an opportunity to set up online businesses in the freight market in Iran. Such businesses do not suddenly but gradually affect the current state of the market and the performance of the main factors that make up the freight market. The main reasons for the demand for this type of startup business in Iran are:
A) Productivity in the road transport industry
B) Transparency in the movement of goods
C) Faster access to carrying capacity
D) Expansion of the activity market in neighboring countries
E) Doing things more efficiently, including eliminating traditional methods (multiple phone calls and e-mail and physically exchanging documents and invoices) in moving goods.
In Iran, we are witnessing the emergence of several business models. Companies will support this business if the plan is acceptable and what it seeks to achieve.
Although in recent years we have seen an increase in the startup of many business companies, contrary to the good things that happen to most startups in developed countries, the fate of Iranian business activists is not so successful. Therefore, we can mention the main and structural reasons for the failure of businesses; the purpose of this study is to solve the following problems.
The lack of corporate identification to business models and the increase in business risk is one of the important characteristics of the business that starts a new business. It differs from a normal business with no previous experience and therefore has its own risk. Unfortunately, due to their specific characteristics, they are faced with failure. This situation caused investors to have few willingness to participate. Investors tend to invest in a place with little risk, and the money is not at risk. Like private investors, banks tend not to participate in high-risk capital investments. Banks are unaware of the risks in our banking system and are responsible for them. If the investment fails to fail, the entrepreneur should turn the whole bank’s capital and be responsible for all the project failure costs. These conditions have made it difficult for investors to absorb capital and start work with a serious obstacle. Always attracting investors for business is one of the main problems.
As mentioned, the lack of necessary infrastructure on the internet of objects is often in the information and communication field. Most of the countries started in different countries based on their similarities and differences. One of the requirements for their success is the existence of necessary infrastructures in the field of information processing, especially the internet of objects. Once your business is about to deal with it and is based on its foundation, it is also necessary to set up its infrastructure. High internet penetration, broadband internet with suitable bandwidth, cost of internet use, internet access in all places, and internet access are important infrastructures for promoting online and online mechanisms. Without universal access to the internet, there will be no possibility of development and success. The most important development of our country in the field of infrastructure is information, and significant progress has been made in this field, but still far from the world’s global standards. These conditions can be a major obstacle to success.
The inadequacy of business models to understand what is of particular importance in business is the speed in delivering work. Someone who will take action will also consider another alternative. Many of the shortcomings in the original design show themselves if they are on stage. Therefore, they must put aside their obsession and turn the idea into practice. The business needs to have a business environment. When business is not appropriate in the country, it is impossible to make a quick conclusion. Unfortunately, the business environment in our country does not have appropriate conditions. The inadequacy of business space is one of the main obstacles in shaping our country that can make the success of these businesses impossible or very difficult.
In a simple definition, the weakness of ecosystem transport/ecology is a set of elements in the form of an array of elements in the field of intelligent transportation in which they do not exist. The ecosystem’s components include growth and acceleration centers, capital centers, media, universities, educational centers, related government agencies, and legal systems. In some countries and cities, transportation systems are more successful than others because of the difference in this ecosystem. Looking at the country’s situation, it can be seen that our country has a serious weakness in these cases, and there is no suitable ecosystem for them. These conditions have led to a serious weakness in our country and insufficient space for growth and prosperity. Therefore, this research aims to present a local model for intelligent transportation.
3. Case study
3.1. Case study of Mashhad: A high potential city for localizing smart transportation system
Mashhad is a significant pilgrimage city located in the northeastern Iranian province of Khorasan Razavi. The Imam Reza shrine is visited by millions of pilgrims each year (more than 20 million pilgrims and tourists combined). After Tehran, the country’s capital, it boasts Iran’s second-largest population. In addition to refugees from Iraq and Afghanistan, the city also attracts tourists and pilgrims. There are 6,434,501 people living there (2021 census). The road and railroad networks in Mashhad have been greatly increased thanks to infrastructure development programs. After Tehran Mehrabad Airport and ahead of Tehran’s Imam Khomeini International Airport, the second busiest airport in the nation serves Mashhad. It offers 57 connections with frequent flights to 27 locations in Central Asia, the Middle East, East Asia, and Europe in addition to 30 cities inside of Iran. As the easternmost of Iran’s major cities, Mashhad is a hub for trade with the nations that border Iran to the east and is connected to many other cities by the Urban Railway, Railway, and numerous roads.The large population of Mashhad and the growth of Mashhad city in various aspects, especially in transportation, make it necessary to propose a smart transportation system. Figure 5 shows Mashhad’s Public transportation infrastructure and holy shrines.
Table 2.
Mashhad City in Iran Characteristics, (Source: Author).
| Population | 6,434,501 | millon |
|---|---|---|
| Visitor | 20 million | Every year |
| Density | 9,000 | per km2 |
| Area 351 km2 | Area 351 km2 | Area 351 km2 |
| Elevation | 1050 | m |
| Precipitation | 250 | millimeters |
| Climate | Steppe | climate |
| Coordinates | 36°18′N 59°36′E | - |
3.1.1. Transportation facilities for the public in mashhad
- ⮚
- LRT
- ⮚
- Bus
- ⮚
- Tax
Figure 1.
Mashhad City (Iran) location.
Figure 2.
Transportation Infrastructure city Mashhad(Iran).
Figure 3.
Mashhad transportation infrastructure (A: LRT lin Map, B: LRT line), (Source: Author).
Figure 4.
Iran Mashhad International Airport (C: Airport Location, D: airport), (Source: Author).
Figure 5.
Mashhad transportation infrastructure (E: Taxi, F: Bus).
3.2. Smart city and transportation
An intelligent transportation system refers to a set of tools, facilities, and specialties, such as traffic engineering concepts, software, hardware, and telecommunication technologies, that are used in a coordinated and integrated manner to improve the efficiency and safety of the transportation system [18].
In recent years, advanced societies have taken advantage of what is now known as IT benefits by creating intelligent transportation systems (ITS) to provide a convenient infrastructure for traffic professionals to access appropriate technologies in traffic planning, navigation, and control [19]. Provided. Assuming that these developments are positive and the current situation, 16 main systems, and more than 160 services have been provided by ITS. In this regard, achieving the goals of transport planners that always increase safety and comfort in travel, reduce costs and adverse environmental effects, reduce energy consumption and unwanted delays during travel and ultimately satisfy passengers and streamline traffic flow and transportation will be quoted. ITS intelligent transportation systems consist of new technologies of electronics, computers, IT, electro mechanics, etc., which play a very important role in the planning of land transportation systems today [20].
Intelligent transportation systems (ITS) use and planning date back to the early 1990s, when developed countries began to study, design, and expand these systems. Due to the development of different land transportation systems and the increase in travel demand at random and supply problems, different branches (ITS) have provided very positive effects in solving transportation challenges for governments [21].
Although smart cities are becoming faster and smarter in their function, they are not fully resilient against the impact of disasters. Khatibi et al. [71,72,73] have conducted valuable and applicable research about the resilience of smart cities. Their studies simultaneously focused on smart and resilient aspects as new city characteristics.
3.3. IoT business models
The use of the IoT in the field of (e-commerce) can have important and positive effects on increasing profitability and starting new and emerging businesses. Dimensions include payment, logistics transportation, financial operations, and warehouse control. The IoT can take over many traditional and manual activities electronically. This technology in e-commerce can affect both the activities of the seller and the producer and the activities of the consumer. Using location and data recognition technologies such as WiFi, GPS, RFID, and low-power Bluetooth can greatly help e-commerce and issues such as supply chain, transportation, and warehousing. For example, in a food factory, the implementation of this technology to manage the warehouse and the inputs and outputs of the warehouse, the condition of the goods, the management of the production date, and the control of the expiration date of the goods can be of great help to the producer. It can also track and collect product information anonymously for post-supply and use it in marketing and sales orientation and decisions [22,23,24].
According to EU Directive 2010/40 / EU ITS, ITs are described as systems that employ information and communication technology for communication with other modes of transportation as well as in the sphere of road transportation, including infrastructure, vehicles, and users. But ITS might apply to any form of transportation. Numerous programs are among its services and goods. Alberta segmented ITS applications into the eight important performance categories listed below in 2014 [25,26]:
Passenger information services (such as travel advice, etc.)
services for traffic management (such as advanced traffic systems, accident detection, management systems, etc.)
public transportation options (for example, information on electronic transport plans, GPS tracking of bus and place transport, etc.)
Operation of commercial vehicles (such as moving vehicles, clearing trucks at vehicle checkpoints and border crossings, etc.)
e. Services for electronic payments (such as electronic toll payment, etc.)
C) Services for emergency management (e.g., improving vehicle emergency response time by fleet tracking, route guidance, and signal pre-purchase, etc.)
Vehicle safety and control systems (such as vehicle technologies, including peripherals, collision avoidance sensor technologies, etc.)
Information storage services (such as traffic safety data collection, archived data management, etc.). ITIF separates ITS applications into five primary categories: Advanced Passenger Information Systems (ATIS), Advanced Transportation Management Systems (ATMs), ITS Shipping Pricing Systems, Advanced Transportation Systems, Public Transportation (APTS), and fully integrated systems (VII and V2V). The list of ITS programs is shown in seven categories in Table 2. (the previous five categories with two additional categories: car business operations and value-added services).
| Classification | Services and applications |
|---|---|
|
Advanced Passenger Information Systems (ATIS) |
Provide real-time traffic information |
| Navigation Guide / Navigation Systems | |
| Parking information | |
| Street weather systems | |
|
Advanced Transportation Management System (ATMs) |
Traffic Centers (TOCs) |
| Adaptive traffic control | |
| Dynamic message signs (or variable message signs) | |
| Measure the ramp | |
|
ITS Shipping Pricing Systems |
Electronic Telephone Collection (ETC.) |
| Canopy Pricing / Electronic Road Pricing (ERP) | |
| Express Cost (HOT.) | |
| Car Passenger Lines (Miles) Travel (VMT.) Expenses | |
| Variable parking costs | |
|
Advanced Public Transportation Systems (APTS) |
Real-time status information for the public transportation system (e.g., bus, subway, rail) |
| Automatic Vehicle Location (AVL) | |
| Electronic rent payment (for example, smart cards) | |
| Car Integration (VII) and Car and Vehicle Integration (V2V) | Collision Avoidance System (CICAS) |
| Smart Compatibility (ISA.) | |
| Commercial car operations | Fleet management |
| Shipping management | |
| Theft recovery | The car is connected |
| Car sharing |
There are numerous obstacles firms must overcome, and they must seek out novel approaches to achieve profitability, value creation, and market share. In this context, innovation in business models can be associated with a new vision for the organization, which is essential for overcoming market challenges and satisfying client needs. This section describes the primary models used in transportation and the necessity to seek out new models to better comprehend transportation business models [31,32].
Historically, the fundamental business models utilized by transportation companies were centered on either low-cost or full-service tactics. Models based on a low-cost strategy are distinguished by their value creation, which is characterized by a focus on what is required to represent value to the traveler. The consumer receives a portion of the cost savings, which reduces their purchasing power. This model has been utilized by Southwest Airlines, Ryanair, Virgin Blue, and Air Asia.
Figure 7 is a graphical representation of airline activities, events, and flows based on a low-cost strategy business model.
Figure 7.
A simple overview of the Ryanair business model [33].
Figure 7.
A simple overview of the Ryanair business model [33].
3.3.1. Uber: An IoT based business model
Uber started in 2009 and was launched in San Francisco in 2010. Since then, their growth as a company has been an exponential function (Figure 8). Customers request a ride through the phone app and track the location of their driver. Uber drivers use their own car. The service will be available in August 2016 in 66 countries and 536 cities worldwide. Uber app automatically calculates fare and transfers payment to driver [16].
Figure 8.
Uber stock [16].
Figure 8.
Uber stock [16].
Due to the unprecedented growth of this company all over the world, the business model used by them is always one of the most important models in the world. In this research, first the business model of the company is examined and then the native model for the business model is introduced.
BMC analysis (Business Model Canvas) is an analytical model that explains ideas about how an organization is created, presented, and valued. Using this approach, 9 elements in 9 baskets are displayed in the business model. Using BMC in itself has advantages in analyzing business models that are able to describe the current state of an organization based on consumer segment, value proposition, value proposition, customer relations, revenue stream, critical assets, and they are partners.
3.3.2. Business Model Canvas analysis
In this part, the results of the literature review-based analysis of Uber’s business model are presented.
- A)
- Customer section
Uber is a pioneer in online sharing. The customer section determines the user section provided by Uber. Uber focuses on selecting smartphone users and accessing the Google Playstore / Apple Store to download Uber apps. Uber also plans to select users who want easy transportation and want to move from one place to another. It can be concluded that Uber is aimed at mass market users [16,34,35].
- B)
- Suggested value
Uber is the first online taxi-sharing company in the world to become an online brand known to users and with various value propositions that users can like. Uber offers several value propositions. First, the GPS used in the Uber app is more accurate than others. So drivers can find the user’s location more easily. Second, the exchange rate, which is cheaper than its competitors. The prices charged by Uber are cheap depending on the distance per kilometer and travel time. If there is traffic, it will be in the (driver’s) interest. Third, customer safety is guaranteed by attracting a driver with at least three years of experience in 2012. Fourth, Uber is more flexible because it is not point-to-point, so it is more in line with the wishes of customers who want to have more than one destination [11,12,13,14].
- C)
- Distribution channel
Uber has applications that are used as the core of the shipping business. A rating in the Uber app indicates the driver’s evaluation of their performance, provided by customers who use Uber services. In addition, Uber has accepted credit cards to pay for its services through a credit card login code [14,15,16].
- D)
- Communication with the customer
Uber permits online ordering for shared services, including UberX, Uber Moto, and other in-app shipping options. Uber also accepts credit card payments from users. Utilizing a credit card while driving typically results in a minor reduction for service recipients. Similar to other online taxi-sharing services, Uber needs its users to rate the services of the driving partner using a rating system. Uber’s customer care handles complaints, criticism, and suggestions from users and service partners. During the trip, the user’s safety is totally covered by insurance, preventing the driver from acting negligently [17,18].
- E)
- revenue stream
Uber benefits from partnering with partner organizations through profit sharing. In addition, Uber benefits from a 90:10 service ratio distribution (90% for fellow drivers and 10% for Uber). For using credit cards as a means of payment by users, Uber also receives a small profit from the bank with an undisclosed amount. As well as being an app provider, Uber will benefit from 70% of the number of applications and applications installed by Google and Apple [19,20,21].
- F)
- Main sources
Uber has always tried to attract the right number of drivers. For this purpose, there is a sufficient proportion of the number of customers and drivers, and there are at least a few drivers for each trip; this saves customers time [22,23].
- G)
- Main activities
Uber’s most important activity is attracting customers and drivers because the two-way commission that Uber receives leads to the fact that the more customers and drivers there are, the more Uber revenue increases [24,25].
- H)
- Key partners
- L)
- Cost structure
Uber’s cost structure and revenue plan are such that it has a lot of virtual marketing. To this end, the bulk of Uber’s cost is devoted to three areas of marketing and software development, as well as manpower for 24-hour support at Uber [28].
4. Materials and Methods
4.1. Analysis of the proposed business model
In the localized business model, the SMS section is also included in the customer relationship section because e-mail is less used than SMS in Iran. It is also included in the main activity of software development because, due to the lack of proper infrastructure in Iran, a new update must be added every month to improve the application capabilities and be more up-to-date. In terms of revenue, the commission is similar to that of Uber.
It should be noted that the items listed in red in the table above are the suggested items for localizing Uber’s business model, the operational definition of each of the variables added in table 3.
Table 3.
Operational definition of each of the variables. (Source: Author).
| Criterion | Under the criteria | Definition |
|---|---|---|
| Customer section | Transportation companies |
Transport companies are one of the most important customers for smart Transportation |
| Commercial companies | Commercial companies can make an effective contribution to the development of the market and smart transportation customers | |
| Hotels | Hotels are an important destination for smart transportation due to many customers. | |
| schools | Schools, like hotels, play a key role in smart transportation. | |
| Suggested value | Quick and easy access | Fast and easy access is always one of the most important factors that intelligent transportation should have. |
| Ability to use a car for two customers with the same destination |
A similar value proposition has been implemented by the Tepsi team in Tehran. |
|
| Ability to track and inform the status and position of the shipment |
In situations where the freight transport system is used in intelligent transportation, it is possible to be able to track the status of the shipment. |
|
| Activity at any time |
Smart cities and smart transportation should be active and available at all Times |
|
| Main Activity | software development | Software development is one of the most important components of intelligent transportation |
| Attract motor courier and pickup |
Attract motor courier to increase customer and speed of work in intelli- gent transportation |
|
| Attract the driver of the minibus and van |
Attracting minibus and van drivers to increase customer and speed of work in intelligent transportation |
|
| Attract luxury cars for ceremonies |
Luxury cars have their customers, and attracting these cars is effective in increasing the customer in smart transportation | |
| Key partners | Hotels and government offices |
Hotels Government offices play a crucial role in smart transportation as a business partner due to a large number of staff. |
| Freight terminals |
Freight terminals, as business partners, play a crucial role in intelligent transportation due to a large number of means of transportation. |
|
| Luxury car rental companies |
Luxury car rental companies play a crucial role in smart transportation as a business partner. |
|
| Schools and universities | Schools and universities, as business partners, play a crucial role in intelligent transportation due to a large number of staff. | |
| Main source | Permission from Police |
Obtaining the necessary permits from government departments and police are very important |
| License from the Tourism Organization |
The Tourism Organization also has direct oversight of transportation and tourism, and obtaining a license is required |
|
| Income flow | Monthly payment for regular customers |
By signing a contract, regular customers can pay the desired amount on a the monthly basis to make it easier for them. |
| Freight with a commission of 90 for the driver and 10 for the company |
The company’s commission is determined according to similar companies | |
|
Cost structure Criterion |
Manpower | A significant portion of the costs are spent on manpower wages |
| Software development and infrastructure |
Software development and infrastructure cost a lot. |
3.1.1. Multi-criteria decision method (MCDM)
The literal meaning of the word decision is to sever, and its wider meaning is to determine the intent and intention, as well as to conclude and solve. The definition of decision-making is selecting one solution from multiple options. To date, numerous ideas and strategies have been offered for resolving researchers’ problems. Numerous mathematicians and industry professionals have, however, examined optimization models since the period of the industrialization of the world, and especially after the Second World War. Classical optimization models emphasize the presence of a criterion (or objective function), so the model may be linear, nonlinear, or mixed. In recent decades, however, researchers have focused on multi-criteria models for evaluating complex decisions [36,37].
Multi-criteria decision-making (MCDM) methods are separated into multi-objective decision-making (MODM) and multi-attribute decision-making (MADM) (MADM). The objective of decision-making is to select the optimal alternative or to assess the choice criteria. Each decision-making approach has a distinct objective: weighting the criteria, ranking the possibilities, and evaluating the criteria, respectively [38,39].
Hierarchical process analysis (AHP) is one of the multi-criteria decision models (MCDM) proposed by Saati in 1988 [69] and showed how the relative importance of a set of activities in decision problems could be This process can be used for a wide range of decision areas because it makes it possible to integrate judgments based on intangible qualitative criteria alongside intangible quantitative criteria. Hierarchy is based on the following principles:
1) Drawing a hierarchical tree,2) Formulating and determining priorities, 3) Logical consistency of judgments [35,36,37,38,39]. Hierarchical process analysis is widely used in solving many complex decision-making problems. In the following (table 4), the 9 degrees scale is defined and described for the process of MCDM and IAHP.
AHP is a technique for facilitating decision-making that highlights the significance of a decision-intuitive maker’s judgments and the consistency of evaluating alternative possibilities. The AHP approach is consistent with the behavior of a decision-maker since a decision-maker bases his or her judgments on knowledge and experience, and consequently makes decisions based on this. This approach’s strength is that it consistently organizes tangible and intangible aspects and provides a structured yet relatively straightforward answer to choice difficulties. [69].
This technique, which is one of the MCDM methods, has four basic principles that must always be observed [36,37]:
The principle of inversion: If criterion C1 precedes criterion C2, criterion C2 has priority over n / 1. This principle is always observed in the formation of pairwise comparisons (this principle is known in pairwise comparison matrices in the upper and lower diameters of the main diameter).
The principle of homogeneity: Options and criteria should always be comparable. Including two options in the decision, the model is impossible, one of which is extremely important to the other.
Principle of dependence: In hierarchical models, each level depends on its higher level.
Principle of expectations: Whenever there is a change in the hierarchical model, for example, a criterion is added, all the hierarchical steps must be repeated.
4.1.2. Improved A.H.P. Method
The AHP approach has been widely used in MCDM. Completing a comparison matrix (CM) in AHP is very difficult. This method analyzes the reasons for inconsistent CM in AHP and proposes improved AHP (IAHP) to improve CM compatibility using a sorting and ranking method. In other words, in the traditional AHP method, when the number of criteria increases, even comparisons increase. On the other hand, responding in pairs is time-consuming and tedious for the expert. For example, when we have six criteria, in traditional AHP, 15 pairwise comparisons are formed.
On the other hand, if these pairwise comparisons are not answered correctly, it causes the comparison to be incompatible, and the incompatibility rate is more than 0.1. This problem was solved with the Improve AHP (IAHP) method. The steps of this method are given below [70].
- Determining the set of criteria
The initial scoring of criteria by experts based on a range of 1 to 10 is called discrete ui for each criterion scored. Formation of a pairwise comparison matrix based on equations 1 and 2:
a_ij=max(u_i-u_j.1).if u_i≥u_j
a_ij=1/(u_j-u_i).if u_i<u_j
- Advantages of the IAHP method
This method has the following advantages compared to simple AHP [70]:
1- Compatibility in comparisons: This method with the sorting mode created for the criteria is an always consistent matrix. Simulation studies of this method show that when the number of criteria increases, the weight obtained is in line with The AHP method is typical.
2. The effectiveness of information extraction: Since the IAHP does not need decision-makers to perform the pairwise comparison process, a lot of effort (i.e., manpower costs) can be saved.
3- Convenience in action: Because in this method, even pair comparisons are not made, so the ease of filling in comparisons causes better and more accurate results.
- Results and discussions
First, the weight of 9 main criteria is specified, and then the problem criteria are coded as described in Table 5. These five criteria were paired by 11 experts using the Likert scale. The following table 4 gives detailed information about 11 selected experts, including work experience, job category, educational certificate, age, and gender. The questionnaire was sent to the experts, and answers were collected by the researcher who worked in the field of architecture and specialized in the Internet of Things.
Table 4.
Coding of problem criteria. (Source: Author).
| Criteria | Code |
|---|---|
| Customer relationship | 1 |
| Suggested value | 2 |
| Main Activity | 3 |
| Key partners | 4 |
| Distribution channels | 5 |
| Main source | 6 |
| Income flow | 7 |
| Cost structure | 8 |
| Customer section | 9 |
Table 5.
Detailed information about eleven experts. (Source: Author).
| No. | work experience | Job Category | Educational certificate | age | gender |
|---|---|---|---|---|---|
| 1 | 24 | Urban Management | Bachelor | 50 | Man |
| 2 | 9 | architecture | Bachelor | 53 | Man |
| 3 | 20 | IT management | Diploma | 43 | Man |
| 4 | 19 | architecture | Master’s | 51 | Man |
| 5 | 19 | Green space expert | Bachelor | 45 | Man |
| 6 | 19 | architecture | Bachelor | 39 | Female |
| 7 | 19 | Urban Management | PHD | 42 | Man |
| 8 | 19 | Urban Management | Bachelor | 40 | Man |
| 9 | 19 | architecture | Bachelor | 42 | Man |
| 10 | 18 | IT management | Bachelor | 45 | Man |
| 11 | 16 | architecture | Bachelor | 35 | Female |
Then their opinions were averaged. After determining the weight of the criteria, components, and sub-criteria, the matrix comparison pair of experts’ opinions for the components has been calculated in Table 6.
Table 6.
Pair comparison of criteria. (Source: Author).
| 1 | 2 | 3 | 4 | 5 | 6 | 7 | 8 | 9 | |
|---|---|---|---|---|---|---|---|---|---|
| 1 | 1 | 1.619 | 3.57 | 3.4 | 3.66 | 2.83 | 6.75 | 5.23 | 1.23 |
| 2 | 0.617665 | 1 | 2 | 2.66 | 4.75 | 2 | 3.5 | 6 | 6 |
| 3 | 0.280112 | 0.5 | 1 | 4.66 | 2.6 | 4.25 | 6.8 | 5.23 | 1.92 |
| 4 | 0.294118 | 0.37594 | 0.214592 | 1 | 3.8 | 2.06 | 3.4 | 1.28 | 1.33 |
| 5 | 0.273224 | 0.210526 | 0.384615 | 0.263158 | 1 | 2.66 | 2.5 | 3.1 | 2.33 |
| 6 | 0.353357 | 0.442478 | 0.235294 | 0.485437 | 0.37594 | 1 | 3.28 | 1.33 | 1.26 |
| 7 | 0.148148 | 0.285714 | 0.147059 | 0.294118 | 0.4 | 0.304878 | 1 | 1.375 | 2.66 |
| 8 | 0.191205 | 0.16 | 0.191205 | 0.78125 | 0.322581 | 0.75188 | 0.727273 | 1 | 3.66 |
| 9 | 0.813008 | 0.166667 | 0.520833 | 0.75188 | 0.429185 | 0.793651 | 0.37594 | 0.326158 | 1 |
After normalizing the data, the sum of each row is calculated. The line sum of each component is the weight of that component. The incompatibility rate has been calculated through expert choice 11 software. Using the geometric mean and steps of the AHP method, the weighting of the problem components is done as shown in Table 7.
Table 7.
Community matrix of experts’ opinions and weight of criteria. (Source: Author).
| 1 | 2 | 3 | 4 | 5 | 6 | 7 | 8 | 9 | weight | |
|---|---|---|---|---|---|---|---|---|---|---|
| 1 | 0.251836 | 0.340103 | 0.432015 | 0.237831 | 0.211101 | 0.167353 | 0.238236 | 0.208191 | 0.059146 | 0.238424 |
| 2 | 0.15555 | 0.21007 | 0.242025 | 0.186068 | 0.273969 | 0.133645 | 0.12353 | 0.248794 | 0.288517 | 0.206908 |
| 3 | 0.070542 | 0.105035 | 0.121013 | 0.325969 | 0.149962 | 0.251325 | 0.240001 | 0.208191 | 0.092325 | 0.173818 |
| 4 | 0.074069 | 0.078974 | 0.025968 | 0.06995 | 0.219175 | 0.121818 | 0.120001 | 0.050953 | 0.063955 | 0.091652 |
| 5 | 0.068808 | 0.044225 | 0.046543 | 0.018408 | 0.057678 | 0.1573 | 0.088236 | 0.123402 | 0.112041 | 0.079627 |
| 6 | 0.088988 | 0.092951 | 0.028474 | 0.033957 | 0.021683 | 0.059135 | 0.115765 | 0.052943 | 0.060589 | 0.061609 |
| 7 | 0.037309 | 0.06002 | 0.017796 | 0.020574 | 0.023071 | 0.018029 | 0.035294 | 0.054735 | 0.127909 | 0.04386 |
| 8 | 0.048152 | 0.033611 | 0.023138 | 0.054649 | 0.018606 | 0.044463 | 0.025669 | 0.039807 | 0.147432 | 0.048392 |
| 9 | 0.204745 | 0.035012 | 0.063027 | 0.052594 | 0.024754 | 0.046933 | 0.013269 | 0.012983 | 0.048086 | 0.055711 |
| incompatibility rate | 0.0614 | |||||||||
It is clear that the least important and the least important component is the criterion of cost structure, and the two criteria of value proposition and customer relationship are of great importance.
This native model is similar to the internet and online taxis. The main product of this indigenous model is the provision of online intercity transportation services; To request a car through this application, passengers, after specifying the travel route and travel options, selecting the type of service, and viewing the cost of travel, request a car. This application automatically connects passengers with the nearest driver and sends the passenger position to the driver. The driver approves it if he wishes; Passengers can also see the position of their driver. The above issue has been examined separately for each of the nine sections.
- Customer section
In this part of the Native Business Model, we identify who our customers are. We are not looking for a specific customer but for common features between customers. We need to know the characteristics of customers who choose our company from different services. Attention to customer characteristics is more important than product features because it greatly impacts product design or the type of service provided. The weight of this section is 0.055711, which indicates that it has less priority than others.
- Communication with clients
In this section, we determine the type of customer relationship. What is the customer’s role in our business, how can you be involved in the customer’s decisions, and to what extent should this help? What communication methods do you use to track your customers’ problems? In this section, questions such as the type of feedback, information, and after-sales service should be answered. Our type of business is very influential in how we interact with customers. For example, consider a driver who performs regular, weekly, and monthly service work in a hotel or office, in which case the driver is in close contact with the customer and the company’s support, and every customer contact and contact is related to his previous purchase. The situation requires the person in contact with the customers to be fully involved with their problems and to know their purchase history and problems. This criterion, with a weight of 0.238424, is of the highest importance.
- Distribution channels
What methods and techniques do you use to deliver your product or service to customers? Does the customer order through online services? Is it possible to access our services through the application? Should the customer come to our store, or should we go to the customer? Communication, distribution, and sales channels are the be- interface tween the company and its customers. Channels are points of contact with customers and play an important role in the customer experience. The weight of this criterion is 0.079.
- Revenue flow
In this section, the method or methods of revenue generation of the company are specified. Everything a business does is to make more money. If the business has several ways of generating revenue, a list of methods should be pro- vided in this section along with the figures. The income method of this business canvas is based on the commission of passenger transportation and finding a customer for the driver. The weight of this criterion is 0.043.
5.1 Suggested Value and Discussions
What is the most important value that this business can offer to customers? Why should a customer prefer this business canvas to others? In other words, what does the customer pay you for?
What makes the product or service of this business environment look more distinctive and attractive than other products? Each value proposition consists of a package of products or services that meet the needs of a specific segment of customers and thus create value for those customers. Values may be qualitative or quantitative. The weight of this criterion is 0.206.
- Key resources
This section lists the most important resources we need to achieve business goals. To know the key elements in the resource sector, is it enough to remove that resource to see if it is possible to achieve a business environment without it? These main sources can be the expenses for advertising, employees’ salaries, required facilities in the company’s office, etc. The weight of this criterion is 0.061.
The book The Creative Business Model Canvas [40] divides the main resources needed in the business model canvas into four main categories: financial resources, human resources, physical resources, intellectual resources, and intangible assets.
Financial resources: Perhaps the first question to be considered when starting a business is how much money is needed. When writing a business model canvas, the required financial resources should be specified in numbers [41].
- Human resources
Every business needs different human resources according to its field of work. This business environment requires accountability experts and several certified public accountants [42,43,44]. The clearer the type of skills required, the better the staff will be recruited, the better it will be in the future to find out what part of the company has met the needs of the company and the more transparent their achievements.
- Physical resources
Office costs, servers and electronic equipment such as computers and telephones, office costs, machinery, and so on.
Intellectual resources and intangible assets: Some very important business resources are not visible or physical. These resources are not quantifiable at first glance, but they play a constructive role. Such as the brand, specialized knowledge, licenses, and licenses required for the activity [45].
- Key activities
Some activities of a business have a vital and key role in advancing the goals of that business [46], these activities constitute the main nature of the business, and their elimination means the elimination of the business. In this section, the main business activities to create the value proposition of the business canvas should be listed [47,48]. For example, for a restaurant business model canvas, branding and advertising are key activities [49], and for a proposed business canvas model [50], customer marketing and attracting the driver of minibusses and luxury cars, etc., are key activities [51]. The weight of this criterion is 0.173.
- Key partners
In the Key Partners section, we talk about networking with other businesses. Obviously, for the growth and development of our business, we do not need to do everything ourselves and have all the units within our business. In addition to high costs, these conditions require a lot of time, energy, and space that many businesses can handle. It does not come. In this situation, businesses need to connect. The weight of this criterion is 0.091. For example, an online store network its business requires networking with advertising agencies and does not need to be an agency owner. However, in the bank’s business model, financial institutions and financial and credit companies are important business partners [52,53,54,55,56]. In the proposed business boom model, key partners such as hotels, schools, universities, etc., are [57].
- Cost structure
The cost structure is one of the most important parts of any business model canvas that calculates the share of each of the various business costs in total costs [58,59,60]. For example, we may have two different brands of shoes, in one of which the costs related to the production of the product are considered more than the costs related to advertising, and in the other, vice versa.
In the proposed business canvas model, marketing and software development are the cost structure’s main components. The weight of this criterion is 0.048. In table 8, the weight of each of the main criteria and sub-criteria is determined.
Table 8.
Weight of the sub-criteria of the problem. (Source: Author).
| Criterion | Under the criteria | Weight | Incompatibility rate |
|---|---|---|---|
|
Customer section |
Transportation companies | 0.437257 |
0.0674 |
| Commercial companies | 0.299587 | ||
| Hotels | 0.15754 | ||
| Schools | 0.105616 | ||
|
Suggested value |
Quick and easy access | 0.368421 |
0.0146 |
| Ability to use a car for two customers with the same Destination |
0.105263 | ||
| Ability to track and inform the status and position of the shipment |
0.263158 | ||
| Activity at any time | 0.263158 | ||
|
Main Activity |
software development |
0.347826 |
0.0632 |
| Attract motor courier and pickup | 0.217391 | ||
| Attract the driver of the minibus and van | 0.130435 | ||
| Attract luxury cars for ceremonies | 0.304348 | ||
|
Key partners |
Hotels and government offices | 0.117647 |
0.0514 |
| Freight terminals | 0.176471 | ||
| Luxury car rental companies | 0.294118 | ||
| Schools and universities | 0.411765 | ||
| main source | Permission from Police | 0.466667 | 0.0248 |
| License from the Tourism Organization | 0.533333 | ||
|
Income flow |
The monthly payment for regular customers | 0.75 |
0.0179 |
| Freight with a commission of 90 for the driver and 10 for the company |
0.25 | ||
| Cost structure | Manpower | 0.4 | 0.0421 |
| Software development and infrastructure | 0.6 |
As it is known, the inconsistency rate in all cases is below 0.1, which indicates the compatibility of the questionnaire and the lack of answers by experts.
6. Conclusions
The evaluation of smart transport in urban planning is becoming increasingly important as cities around the world seek to become more sustainable, efficient, and livable. Developing countries, in particular, face unique challenges in their transition to smart cities, but also have the opportunity to leapfrog traditional infrastructure and adopt cutting-edge technologies.
Smart transport refers to the use of technology to improve the efficiency, safety, and sustainability of transportation systems. This can involve a range of measures, including the use of intelligent traffic management systems, real-time data analysis, and the integration of various modes of transport (e.g. public transit, cycling, and walking). In developing countries, smart transport can play a crucial role in addressing a range of urban challenges, including traffic congestion, air pollution, and inadequate public transport. By leveraging technology to optimize transportation systems, cities can reduce the time and cost of travel, improve accessibility, and enhance safety for all users.
Overall, the evaluation of smart transport in urban planning is critical for the transition from traditional to smart cities in developing countries. While there are a number of challenges to overcome, the potential benefits of smart transport are significant and can contribute to more sustainable, livable, and equitable cities. Iran is a country with a rapidly growing urban population and a significant need for modern, efficient, and sustainable transportation systems. Intelligent transportation systems (ITS) can play a crucial role in meeting this need by leveraging technology to improve the efficiency, safety, and sustainability of transportation systems. Here is a possible business model for an ITS system in a high-potential city in Iran:
1. Identify the target market: The first step is to identify the target market for the ITS system. This could include public transport operators, private transport companies, logistics and delivery companies, and individual vehicle owners.
2. Define the scope of the system: The next step is to define the scope of the ITS system. This could include a range of features, such as real-time traffic monitoring, intelligent traffic management, and integrated payment systems.
3. Develop the technology platform: The third step is to develop the technology platform for the ITS system. This may require partnerships with technology companies and expertise in areas such as data analytics, software development, and hardware integration.
4. Develop revenue streams: There are several potential revenue streams for an ITS system in Iran. These include:
- Subscription fees for access to the ITS system
- Transaction fees for payment processing
- Advertising revenue from targeted advertising on the ITS platform
- Data sales to third-party companies for analysis and insights.
5. Partner with government and private sector stakeholders: To ensure the success of the ITS system, it is important to partner with government and private sector stakeholders.This could include working with local transport authorities to integrate the ITS system with existing transport infrastructure, partnering with private transport companies to provide access to the system, and collaborating with universities and research institutions to develop and test new features.
6. Develop a marketing strategy: Developing a marketing strategy is crucial to promote the ITS system and attract users. This may include targeted advertising campaigns, partnerships with local media outlets, and outreach to community groups and stakeholders.
7. Ensure regulatory compliance: It is important to ensure that the ITS system complies with all relevant regulations and standards in Iran. This may require working closely with local authorities to obtain necessary permits and approvals.
Overall, an ITS system in a high-potential city in Iran could offer significant benefits to users and stakeholders, while also creating a profitable business opportunity. However, success will depend on careful planning, investment, and collaboration between various stakeholders.
A localized business model for a smart transportation system in Mashhad, a populated city in Iran, was proposed in the present study. After the literature review, identification of criteria and sub-criteria, and experts’ comments, the prioritization of criteria and sub-criterions was made by applying MCDM and IAHP methods to find the most important ones. According to the weighting results, below highlights can be mentioned:
1-Among 4 sub-criterions in the customer section criteria, the transportation companies, with the weight of 0.437257, were more important than other customers like commercial companies, hotels, and schools.
2- Among four sub-criterions of suggested value criteria, quick and easy access to smart transportation systems is more important than the others. However, the three other sub-criteria achieved acceptable weights and are not to be ignored in the way of having a successful smart transportation system.
3- Analyzing the 3rd main criteria shows that software development and attracting luxury cars are among the main activities that need to be tracked.
4- Schools and universities achieved the highest weights among all potential key partners, with a weight of 0.41175.
Also, licenses from the Tourism Organization, Monthly payments for regular customers, and Software development and infrastructure are three other important sub-criteria with a high weight of importance. These three can be nominated as the most important sub-criteria among all studied. In addition to improving transportation, smart cities also incorporate sustainability into their planning and design. This includes prioritizing energy efficiency, reducing greenhouse gas emissions, and incorporating green spaces into urban areas to improve air quality and promote a healthier environment for residents.To successfully transition to a smart city, developing countries must address the challenges of inadequate infrastructure, limited resources, and technological barriers. This requires collaboration between government, private sector, and civil society organizations to develop a comprehensive strategy that addresses the needs of all stakeholders.
Overall, the role of smart transport in urban planning and the transition to smart cities in developing countries with sustainability requirements is critical for achieving economic growth, improving quality of life, and promoting environmental sustainability. By investing in smart transport solutions and prioritizing sustainability, developing countries can create more livable and resilient cities for their residents.
Recommendation
- –
- For smart transportation, demand management methods and redesigning streets cross sections are used to change priorities (from private cars to public transport and active modes).
- –
- Maintaining the quality of the intelligent transportation systems and making them more attractive to the private sector
- –
- Information services for intelligent public transportation that are accurate and reliable
- –
- Benefit from increased integration of public intelligent transportation and bike travel in the city.
- –
- Balance efforts on different aspects of intelligent transportation.
Author Contributions
SK conceived of the presented idea. N.SH, SH.M, MS, SF, SG,SK, RG developed the theory and performed the computations. SK verified the analytical methods SK drafted the manuscript with input from all authors N.SH, SH.M, M.S, SF, SG, SK, RG supervised and edited the final version. All authors discussed the results and contributed to the final.
Funding
Not applicable’ for that section.
Acknowledgments
This research did not receive any specific grant from funding agencies in the public, commercial, or not-for-profit sectors.
Conflicts of Interest
The authors declare that they have no known competing financial interests or personal relationships that could have appeared to influence the work reported in this paper.
Availability of data and material
The data presented in this study are available upon reasonable request.
References
- Batty, M., Axhausen, K. W., Giannotti, F., Pozdnoukhov, A., Bazzani, A., Wachowicz, M., ... & Portugali, Y. (2012). Smart cities of the future. The European Physical Journal Special Topics, 214(1), 481-518.
- Ahvenniemi, H., Huovila, A., Pinto-Seppä, I., & Airaksinen, M. (2017). What are the differences between sustainable and smart cities?. Cities, 60, 234-245. [CrossRef]
- Zanella, A., Bui, N., Castellani, A., Vangelista, L., & Zorzi, M. (2014). Internet of things for smart cities. IEEE Internet of Things journal, 1(1), 22-32.
- Mehmood, Y., Ahmad, F., Yaqoob, I., Adnane, A., Imran, M., & Guizani, S. (2017). Internet-of-things-based smart cities: Recent advances and challenges. IEEE Communications Magazine, 55(9), 16-24. [CrossRef]
- Mohanty, S. P., Choppali, U., & Kougianos, E. (2016). Everything you wanted to know about smart cities: The internet of things is the backbone. IEEE Consumer Electronics Magazine, 5(3), 60-70. [CrossRef]
- Talari, S., Shafie-Khah, M., Siano, P., Loia, V., Tommasetti, A., & Catalão, J. P. (2017). A review of smart cities based on the internet of things concept. Energies, 10(4), 421.
- Perera, C., Zaslavsky, A., Christen, P., & Georgakopoulos, D. (2014). Sensing as a service model for smart cities supported by internet of things. Transactions on emerging telecommunications technologies, 25(1), 81-93. [CrossRef]
- Harmon, R. R., Castro-Leon, E. G., & Bhide, S. (2015, August). Smart cities and the Internet of Things. In 2015 Portland International Conference on Management of Engineering and Technology (PICMET) (pp. 485-494). IEEE.
- Alavi, A. H., Jiao, P., Buttlar, W. G., & Lajnef, N. (2018). Internet of Things-enabled smart cities: State-of-the-art and future trends. Measurement, 129, 589-606. [CrossRef]
- Qian, Y., Wu, D., Bao, W., & Lorenz, P. (2019). The internet of things for smart cities: Technologies and applications. IEEE Network, 33(2), 4-5. [CrossRef]
- Shokouhi, M. A., Naghibirokni, S. N., Alizadeh, H., & Ahmadi, A. (2016). Evaluation of smart city criteria in ahvaz city, Iran. Iran University of Science & Technology, 26(2), 141-149.
- Zantalis, F., Koulouras, G., Karabetsos, S., & Kandris, D. (2019). A review of machine learning and IoT in smart transportation. Future Internet, 11(4), 94. [CrossRef]
- Kelley, S. B., Lane, B. W., Stanley, B. W., Kane, K., Nielsen, E., & Strachan, S. (2020). Smart transportation for all? A typology of recent US smart transportation projects in midsized cities. Annals of the American Association of Geographers, 110(2), 547-558. [CrossRef]
- Jan, B., Farman, H., Khan, M., Talha, M., & Din, I. U. (2019). Designing a smart transportation system: An internet of things and big data approach. IEEE Wireless Communications, 26(4), 73-79. [CrossRef]
- Rathore, M. M., Ahmad, A., Paul, A., & Jeon, G. (2015, November). Efficient graph-oriented smart transportation using internet of things generated big data. In 2015 11th International Conference on Signal-Image Technology & Internet-Based Systems (SITIS) (pp. 512-519). IEEE.
- Cramer, J., & Krueger, A. B. (2016). Disruptive change in the taxi business: The case of Uber. American Economic Review, 106(5), 177-82.
- Azgomi, H. F., & Jamshidi, M. (2018, November). A brief survey on smart community and smart transportation. In 2018 IEEE 30th International Conference on Tools with Artificial Intelligence (ICTAI) (pp. 932-939). IEEE.
- Karami, Z., & Kashef, R. (2020). Smart transportation planning: Data, models, and algorithms. Transportation Engineering, 2, 100013. [CrossRef]
- Zichichi, M., Ferretti, S., & D’Angelo, G. (2020, January). A distributed ledger based infrastructure for smart transportation system and social good. In 2020 IEEE 17th Annual Consumer Communications & Networking Conference (CCNC) (pp. 1-6). IEEE.
- Babar, M., & Arif, F. (2019). Real-time data processing scheme using big data analytics in internet of things based smart transportation environment. Journal of Ambient Intelligence and Humanized Computing, 10(10), 4167-4177. [CrossRef]
- Lingli, J. (2015, December). Smart city, smart transportation: recommendations of the logistics platform construction. In 2015 International Conference on Intelligent Transportation, Big Data and Smart City (pp. 729-732). IEEE.
- Bacciu, D., Carta, A., Gnesi, S., & Semini, L. (2017). An experience in using machine learning for short-term predictions in smart transportation systems. Journal of Logical and Algebraic Methods in Programming, 87, 52-66. [CrossRef]
- Wang, Y., Ram, S., Currim, F., Dantas, E., & Sabóia, L. A. (2016, September). A big data approach for smart transportation management on bus network. In 2016 IEEE international smart cities conference (ISC2) (pp. 1-6). IEEE.
- Singh, D., Singh, M., Singh, I., & Lee, H. J. (2015, July). Secure and reliable cloud networks for smart transportation services. In 2015 17th International Conference on Advanced Communication Technology (ICACT) (pp. 358-362). IEEE.
- Balbin, P. P. F., Barker, J. C., Leung, C. K., Tran, M., Wall, R. P., & Cuzzocrea, A. (2020). Predictive analytics on open big data for supporting smart transportation services. Procedia computer science, 176, 3009-3018. [CrossRef]
- Kumar, A., Rajalakshmi, K., Jain, S., Nayyar, A., & Abouhawwash, M. (2020). A novel heuristic simulation-optimization method for critical infrastructure in smart transportation systems. International Journal of Communication Systems, 33(11), e4397. [CrossRef]
- Shukla, S. N., & Champaneria, T. A. (2017, February). Survey of various data collection ways for smart transportation domain of smart city. In 2017 international conference on i-smac (iot in social, mobile, analytics and cloud)(i-smac) (pp. 681-685). IEEE.
- Howard, A. J., Lee, T., Mahar, S., Intrevado, P., & Woodbridge, D. M. K. (2018, June). Distributed data analytics framework for smart transportation. In 2018 IEEE 20th International Conference on High Performance Computing and Communications; IEEE 16th International Conference on Smart City; IEEE 4th International Conference on Data Science and Systems (HPCC/SmartCity/DSS) (pp. 1374-1380). IEEE.
- Zhang, Y., Zhang, G., Fierro, R., & Yang, Y. (2018). Force-driven traffic simulation for a future connected autonomous vehicle-enabled smart transportation system. IEEE Transactions on Intelligent Transportation Systems, 19(7), 2221-2233. [CrossRef]
- Dabiri, S., & Heaslip, K. (2018). Transport-domain applications of widely used data sources in the smart transportation: A survey. arXiv preprint arXiv:1803.10902.
- An, C., & Wu, C. (2020). Traffic big data assisted V2X communications toward smart transportation. Wireless Networks, 26(3), 1601-1610. [CrossRef]
- Ayoub, W., Ellatif Samhat, A., Mroue, M., Joumaa, H., Nouvel, F., & Prévotet, J. C. (2020). Technology selection for iot-based smart transportation systems. In Vehicular ad-hoc networks for smart cities (pp. 19-29). Springer, Singapore.
- Oswald, K. F. (2016). A brief history of smart transportation infrastructure. Transfers, 6(3), 123-129. [CrossRef]
- Xu, H., Lin, J., & Yu, W. (2017). Smart transportation systems: architecture, enabling technologies, and open issues. In Secure and Trustworthy Transportation Cyber-Physical Systems (pp. 23-49). Springer, Singapore.
- Nikabadi, M. S., & Razavian, S. B. (2020). A hesitant fuzzy model for ranking maintenance strategies in small and medium-sized enterprises. International Journal of Productivity and Quality Management, 29(4), 558-592. [CrossRef]
- Younesi Heravi, M., Yeganeh, A., & Razavian, S. B. (2022). Using fuzzy approach in determining critical parameters for optimum safety functions in mega projects (case study: Iran’s construction industry). In Frontiers in Nature-Inspired Industrial Optimization (pp. 183-200). Springer, Singapore.
- Yeganeh, A., Younesi Heravi, M., Razavian, S. B., Behzadian, K., & Shariatmadar, H. (2021). Applying a new systematic fuzzy FMEA technique for risk management in light steel frame systems. Journal of Asian Architecture and Building Engineering, 1-22. [CrossRef]
- Bagheri, R., Borouji, Z., Razavian, S. B., Keshvari, M. M., Sharifi, F., & Sharifi, S. (2021). Implementation of MCDM-Based Integrated Approach to Identifying the Uncertainty Factors on the Constructional Project. Mathematical Problems in Engineering, 2021. [CrossRef]
- Shafiei Nikabadi, M., & Razaviyan, S. B. (2018). Identification and ranking of effective indicators on the loyalty of the charities in Iranian charities using Fuzzy Delphi and Structural Interpretative Equation. Quarterly Journal of Socio-Cultural Development Studies, 6(3), 59-79.
- Carter, M., & Carter, C. (2020). The Creative Business Model Canvas. Social Enterprise Journal. [CrossRef]
- Aranda-Usón, A., Portillo-Tarragona, P., Marín-Vinuesa, L. M. & Scarpellini, S. Financial resources for the circular economy: A perspective from businesses. Sustainability (Switzerland) 11, (2019). [CrossRef]
- Stone, R. J. Human Resource Management : Personnel Human Resource Management. Harvard Business Review 13, 6–21 (2019).
- Molina-Azorin, J. F., López-Gamero, M. D., Tarí, J. J., Pereira-Moliner, J. & Pertusa-Ortega, E. M. Environmental management, human resource management and green human resource management: A literature review. Administrative Sciences 11, (2021). [CrossRef]
- Ahammad, M. F., Glaister, K. W. & Gomes, E. Strategic agility and human resource management. Human Resource Management Review 30, (2020). [CrossRef]
- Jha, S. B., Babiceanu, R. F. & Seker, R. Formal modeling of cyber-physical resource scheduling in IIoT cloud environments. Journal of Intelligent Manufacturing 31, 1149–1164 (2020). [CrossRef]
- Santos, F. M. (2012). A Positive Theory of Social Entrepreneurship. Journal of Business Ethics, 111(3), 335–351. https://doi.org/10.1007/s10551-012-1413-4. [CrossRef]
- Veleva, V. & Bodkin, G. Corporate-entrepreneur collaborations to advance a circular economy. Journal of Cleaner Production 188, 20–37 (2018). [CrossRef]
- .Österblom, H., Jouffray, J. B., Folke, C. & Rockström, J. Emergence of a global science–business initiative for ocean stewardship. Proceedings of the National Academy of Sciences of the United States of America 114, 9038–9043 (2017).
- Indrawan, M. I., Nasution, M. D. T. P., Adil, E. & Rossanty, Y. A Business Model Canvas: Traditional Restaurant “Melayu” in North Sumatra, Indonesia. Business Management and Strategy 7, 102 (2016).
- Sparviero, S. The Case for a Socially Oriented Business Model Canvas: The Social Enterprise Model Canvas. Journal of Social Entrepreneurship 10, 232–251 (2019). [CrossRef]
- Joyce, A. & Paquin, R. L. The triple layered business model canvas: A tool to design more sustainable business models. Journal of Cleaner Production 135, 1474–1486 (2016). [CrossRef]
- Kumar, M. A Study on Cooperative Banks in Himachal Pradesh with Special References to Lending Practices. International Journal of Research in Advent Technology 7, 15–24 (2019). [CrossRef]
- Stefanelli, V., Boscia, V. & Toma, P. Does knowledge translation drive spin-offs away from the “valley of death”? A nonparametric analysis to support a banking perspective. Management Decision 58, 1985–2009 (2020). [CrossRef]
- Mărăcine, V., Voican, O. & Scarlat, E. The Digital Transformation and Disruption in Banks’ Business Models under the Impact of FinTech and BigTech. Proceedings of the International Conference on Business Excellence 14, 294–305 (2020). [CrossRef]
- Cornée, S., Kalmi, P. & Szafarz, A. The Business Model of Social Banks. Kyklos 73, 196–226 (2020). [CrossRef]
- Köhler, M. Which banks are more risky? The impact of business models on bank stability. Journal of Financial Stability 16, 195– 212 (2015). [CrossRef]
- Fernandez-Antolin, M. M., Del-Río, J. M., Del Ama Gonzalo, F. & Gonzalez-Lezcano, R. A. The relationship between the use of building performance simulation tools by recent graduate architects and the deficiencies in architectural education. Energies 13, (2020). [CrossRef]
- Radionova, N., Breus, S., Denysenko, M., Khaustova, Ye. & Matiukh, A. CRITERIAL APPROACH TO ANALYSIS OF THE COST MANAGEMENT SYSTEM OF BUSINESS STRUCTURES. Financial and credit activity: problems of theory and practice 1, 190–202 (2021). [CrossRef]
- Schröder, M., Falk, B. & Schmitt, R. Evaluation of cost structures of additive manufacturing processes using a new business model. in Procedia CIRP 30, 311–316 (Elsevier B.V., 2015). [CrossRef]
- .Fontanesi, J. M., Flesher, D. S., De Guire, M., Lieberthal, A. & Holcomb, K. The cost of doing business: Cost structure of electronic immunization registries. Health Services Research 37, 1291–1307 (2002). [CrossRef]
- Hassan, R. J., Zeebaree, S. R., Ameen, S. Y., Kak, S. F., Sadeeq, M. A., Ageed, Z. S., ... & Salih, A. A. (2021). State of art survey for iot effects on smart city technology: challenges, opportunities, and solutions. Asian Journal of Research in Computer Science, 22, 32-48. [CrossRef]
- Gavrilović, N., & Mishra, A. (2021). Software architecture of the internet of things (IoT) for smart city, healthcare and agriculture: analysis and improvement directions. Journal of Ambient Intelligence and Humanized Computing, 12(1), 1315-1336. [CrossRef]
- Anand, A., Rufuss, D. D. W., Rajkumar, V., & Suganthi, L. (2017). Evaluation of sustainability indicators in smart cities for India using MCDM approach. Energy Procedia, 141, 211-215. [CrossRef]
- Ozkaya, G., & Erdin, C. (2020). Evaluation of smart and sustainable cities through a hybrid MCDM approach based on ANP and TOPSIS technique. Heliyon, 6(10), e05052. [CrossRef]
- Zapolskytė, S., Burinskienė, M., & Trepanier, M. (2020). Evaluation criteria of smart city mobility system using MCDM method. The Baltic journal of road and bridge engineering, 15(4), 196-224. [CrossRef]
- Yadav, G., Mangla, S. K., Luthra, S., & Rai, D. P. (2019). Developing a sustainable smart city framework for developing economies: An Indian context. Sustainable Cities and Society, 47, 101462. [CrossRef]
- Hajduk, S. (2021). Multi-Criteria Analysis of Smart Cities on the Example of the Polish Cities. Resources, 10(5), 44. [CrossRef]
- Yenkar, P. P., & Sawarkar, S. D. (2022). A novel ensemble approach based on MCC and MCDM methods for prioritizing tweets mentioning urban issues in smart city. Kybernetes. [CrossRef]
- Saaty, T. L. (1988). What is the analytic hierarchy process? In Mathematical models for decision support (pp. 109-121). Springer, Berlin, Heidelberg.
- Li, F., Phoon, K. K., Du, X., & Zhang, M. (2013). Improved AHP method and its application in risk identification. Journal of Construction Engineering and Management, 139(3), 312-320. [CrossRef]
- Gonella, F. (2019). The smart narrative of a smart city. Frontiers in Sustainable Cities, 1, 9. [CrossRef]
- An, S., Kim, S., & Kim, S. (2020). Necessity of the Needs Map in the Service Design for Smart Cities. Frontiers in Psychology, 11, 202.
- Foley, R. W., Nadjari, S., Eshirow, J., Adekunle, R., & Codjoe, P. (2022). Towards Digital Segregation? Problematizing the Haves and Have Nots in the Smart City. Front. Sustain. Cities, 4, 706670. [CrossRef]
- Ye, F., Chen, Y., Li, L., Li, Y., & Yin, Y. (2022). Multi-criteria decision-making models for smart city ranking: Evidence from the Pearl River Delta region, China. Cities, 128, 103793. [CrossRef]
- Shokouhi, M. A., Naghibirokni, S. N., Alizadeh, H., & Ahmadi, A. (2016). Evaluation of smart city criteria in ahvaz city, Iran. Iran University of Science & Technology, 26(2), 141-149.
- Dashkevych, O., & Portnov, B. A. (2022). Criteria for Smart City Identification: A Systematic Literature Review. Sustainability, 14(8), 4448. [CrossRef]
Disclaimer/Publisher’s Note: The statements, opinions and data contained in all publications are solely those of the individual author(s) and contributor(s) and not of MDPI and/or the editor(s). MDPI and/or the editor(s) disclaim responsibility for any injury to people or property resulting from any ideas, methods, instructions or products referred to in the content. |
© 2023 by the authors. Licensee MDPI, Basel, Switzerland. This article is an open access article distributed under the terms and conditions of the Creative Commons Attribution (CC BY) license (http://creativecommons.org/licenses/by/4.0/).
Copyright: This open access article is published under a Creative Commons CC BY 4.0 license, which permit the free download, distribution, and reuse, provided that the author and preprint are cited in any reuse.
Sustainable Mobility as a Service: Supply Analysis and Test Cases
Corrado Rindone
Information,
2022
An Assessment Framework for the Transformation of Mobility 4.0 in Smart Cities
Hakan Inac
et al.
Systems,
2021
Exploring the Key Priority Development Projects of Smart Transportation for Sustainability: Using Kano Model
Ming-Tsang Lu
et al.
Sustainability,
2022


MDPI Initiatives
Important Links
© 2024 MDPI (Basel, Switzerland) unless otherwise stated