Preprint
Article

Electrochemical Promotion of CO2 Hydrogenation Using Rh Catalysts Supported on O2- Conducting Solid Electrolyte

Altmetrics

Downloads

104

Views

27

Comments

0

A peer-reviewed article of this preprint also exists.

Submitted:

08 June 2023

Posted:

09 June 2023

You are already at the latest version

Alerts
Abstract
Electrochemical Promotion was used to modify the activity and selectivity of a Rh catalyst-electrode in the CO2 hydrogenation reaction. The experiments were carried out in a temperature range of 350-430οC at ambient pressure and at different CO2 to H2 gas feeding ratios (1:2 to 4:1). The only reaction products observed were CO and CH4, both under open and closed-circuit conditions. The CH4 formation rate was found to increase with both positive and negative potential or current application. The CO formation rate followed the opposite trend. The selectivity to CH4 increased under high values of hydrogen partial pressure and decreased at high pressures of CO2. The results demonstrate how Electrochemical Promotion can be used to finely tune activity and selectivity for a reaction of high technical and environmental importance.
Keywords: 
Subject: Engineering  -   Chemical Engineering

1. Introduction

Carbon dioxide (CO2) is the most abundant greenhouse gas in our atmosphere with its concentration drastically increasing over time due to anthropogenic activities, most crucially the extensive use of fossil fuels for transport and power generation purposes. The ever-increasing CO2 emissions in the atmosphere has led gradually to climate change, which is strongly associated with global warming, extreme weather conditions and other major environmental threats [1,2,3,4]. In this regard, it is of foremost importance to minimise globally the use of fossil fuels and to develop accordingly the necessary technologies for capturing and utilizing CO2 to produce fuels, bulk chemicals, and value-added products. It is widely accepted that CO2 hydrogenation may offer a relatively economic and effective way of controlling and making use of the CO2 excess atmospheric levels [5,6,7].
Most studies of the catalytic hydrogenation of CO2 have been performed in fixed-bed reactors using mainly metal catalysts (e.g., Rh, Pd, Ru, Cu, Fe, Co, Ni, Au, Ag) supported over a wide range of metal oxides (e.g., Nb2O3, ZrO2, Al2O3, SiO2) [8,9,10,11,12,13,14,15,16,17,18,19,20,21,22,23,24,25,26,27,28,29,30,31,32,33,34,35,36,37] and utilizing high pressures (5–70 atm) [12,13,14,15,17,24,25,26,27,28,30], which shifts the thermodynamic equilibrium towards methanol and light hydrocarbon production. Under atmospheric pressure, CO2 can be reduced by hydrogen to form methane (Sabatier reaction) and/or carbon monoxide (reverse water gas shift, RWGS, reaction), according to the following equations:
C O 2 + H 2 C O + H 2 O ,     Δ H = 41.5   k J m o l 1   ( R W G S   r e a c t i o n )
C O 2 + 4 H 2 C H 4 + 2 H 2 O ,   Δ H = 165   k J m o l 1 ( S a b a t i e r   r e a c t i o n )
The RWGS reaction is endothermic and is thermodynamically favoured at high operating temperatures. Contrary to this, the Sabatier reaction leads to the formation of methane, which is an exothermic reaction and is favoured at low operation temperatures. However, the low operation temperatures limit the activity and the kinetics of the reactions as well. It is therefore essential to develop active and selective low temperature catalytic processes, operating at high CO2 to H2 feed ratios and atmospheric pressure.
The Electrochemical Promotion of CO2 hydrogenation has been studied in recent years over different catalytic films including noble and non-noble metals (Ru [7,38,39,40,41,42,43,44,45,46,47,48,49] and Rh [50,51], and Ni, Co, Fe [52,53,54,55,56,57], respectively) supported on a variety of solid electrolytes including yttria-stabilized-zirconia (YSZ, an O2− conductor [7,38,39,43,48,49,50,51,52,56,57]), H+ conductors [40,46,53,54] and alkali ion conductors like Na-β″-Al2O3 [39,41]. Under open circuit conditions, the non-promoted catalytic reaction takes place on the catalyst-working electrode. Application of a potential or current, between the catalyst film (working electrode) and a counter electrode leads to changes of the conversion rate and product selectivity [58,59,60,61,62,63,64,65,66]. These non-Faradaic changes are evoked by the formation of an effective double layer due to the migration of promoting species (e.g., O2- in the case of YSZ) migrating from the solid electrolyte to the metal-gas interface [58,67,68].
The CO2 hydrogenation reaction on Rh catalyst-electrodes deposited on YSZ has been rarely investigated and mainly under conditions of excess of hydrogen (regarding eq. (1)) and cathodic polarizations. The study of the reaction in a single chamber reactor by Bebelis et al. [50] led to CO and CH4 formation at temperatures of 346–477oC. It was found that the rate of CH4 formation is enhanced with positive potentials (electrophobic behaviour) while the rate of CO formation is enhanced with negative potentials (electrophilic behaviour). The maximum selectivity to CH4 was up to 35%. Using a monolithic electropromoted reactor (MEPR) [51], the reaction of CO2 hydrogenation was studied on 22 thin Rh/YSZ/Pt plate cells at temperatures between 220–380oC. The only products observed were again CO and CH4. The rates of both reactions were significantly affected during polarization, while the selectivity to CH4 remained always below 12%.
The pronounced catalytic activity of Rh-based catalysts, supported on O2- conductors, under electropromoted conditions has been associated in earlier studies with the decomposition of the rhodium oxide to metallic rhodium which is more active especially under oxidation reaction conditions [67,69]
In the present study, the electrochemical promotion of CO2 hydrogenation reaction was studied over a Rh catalyst-electrode deposited on an O2- solid electrolyte conductor, YSZ, at atmospheric pressure, and for the first time in a continuous single pellet flow reactor. The main scopes were in contrast to earlier studies, to perform CO2 hydrogenation at a lower temperature range of 350 to 430oC and at different CO2 to H2 cofeeding ratios.

2. Results and Discussion

2.1. Hydrogenation Activity Measurements

The steady state CO2 conversion as a function of temperature for different CO2 to H2 ratios was first investigated. The results displayed in Figure 1 show that the conversion of CO2 increases with increasing temperature reaching a maximum of 17.6% under reaction conditions of CO2 to H2 feeding ratio of 1:2. Under conditions of CO2 to H2 of 1:1 the conversion drops to 12 % and is smallest with 6 % and 2 % at CO2 to H2 ratios of 2:1 and 4:1, respectively.
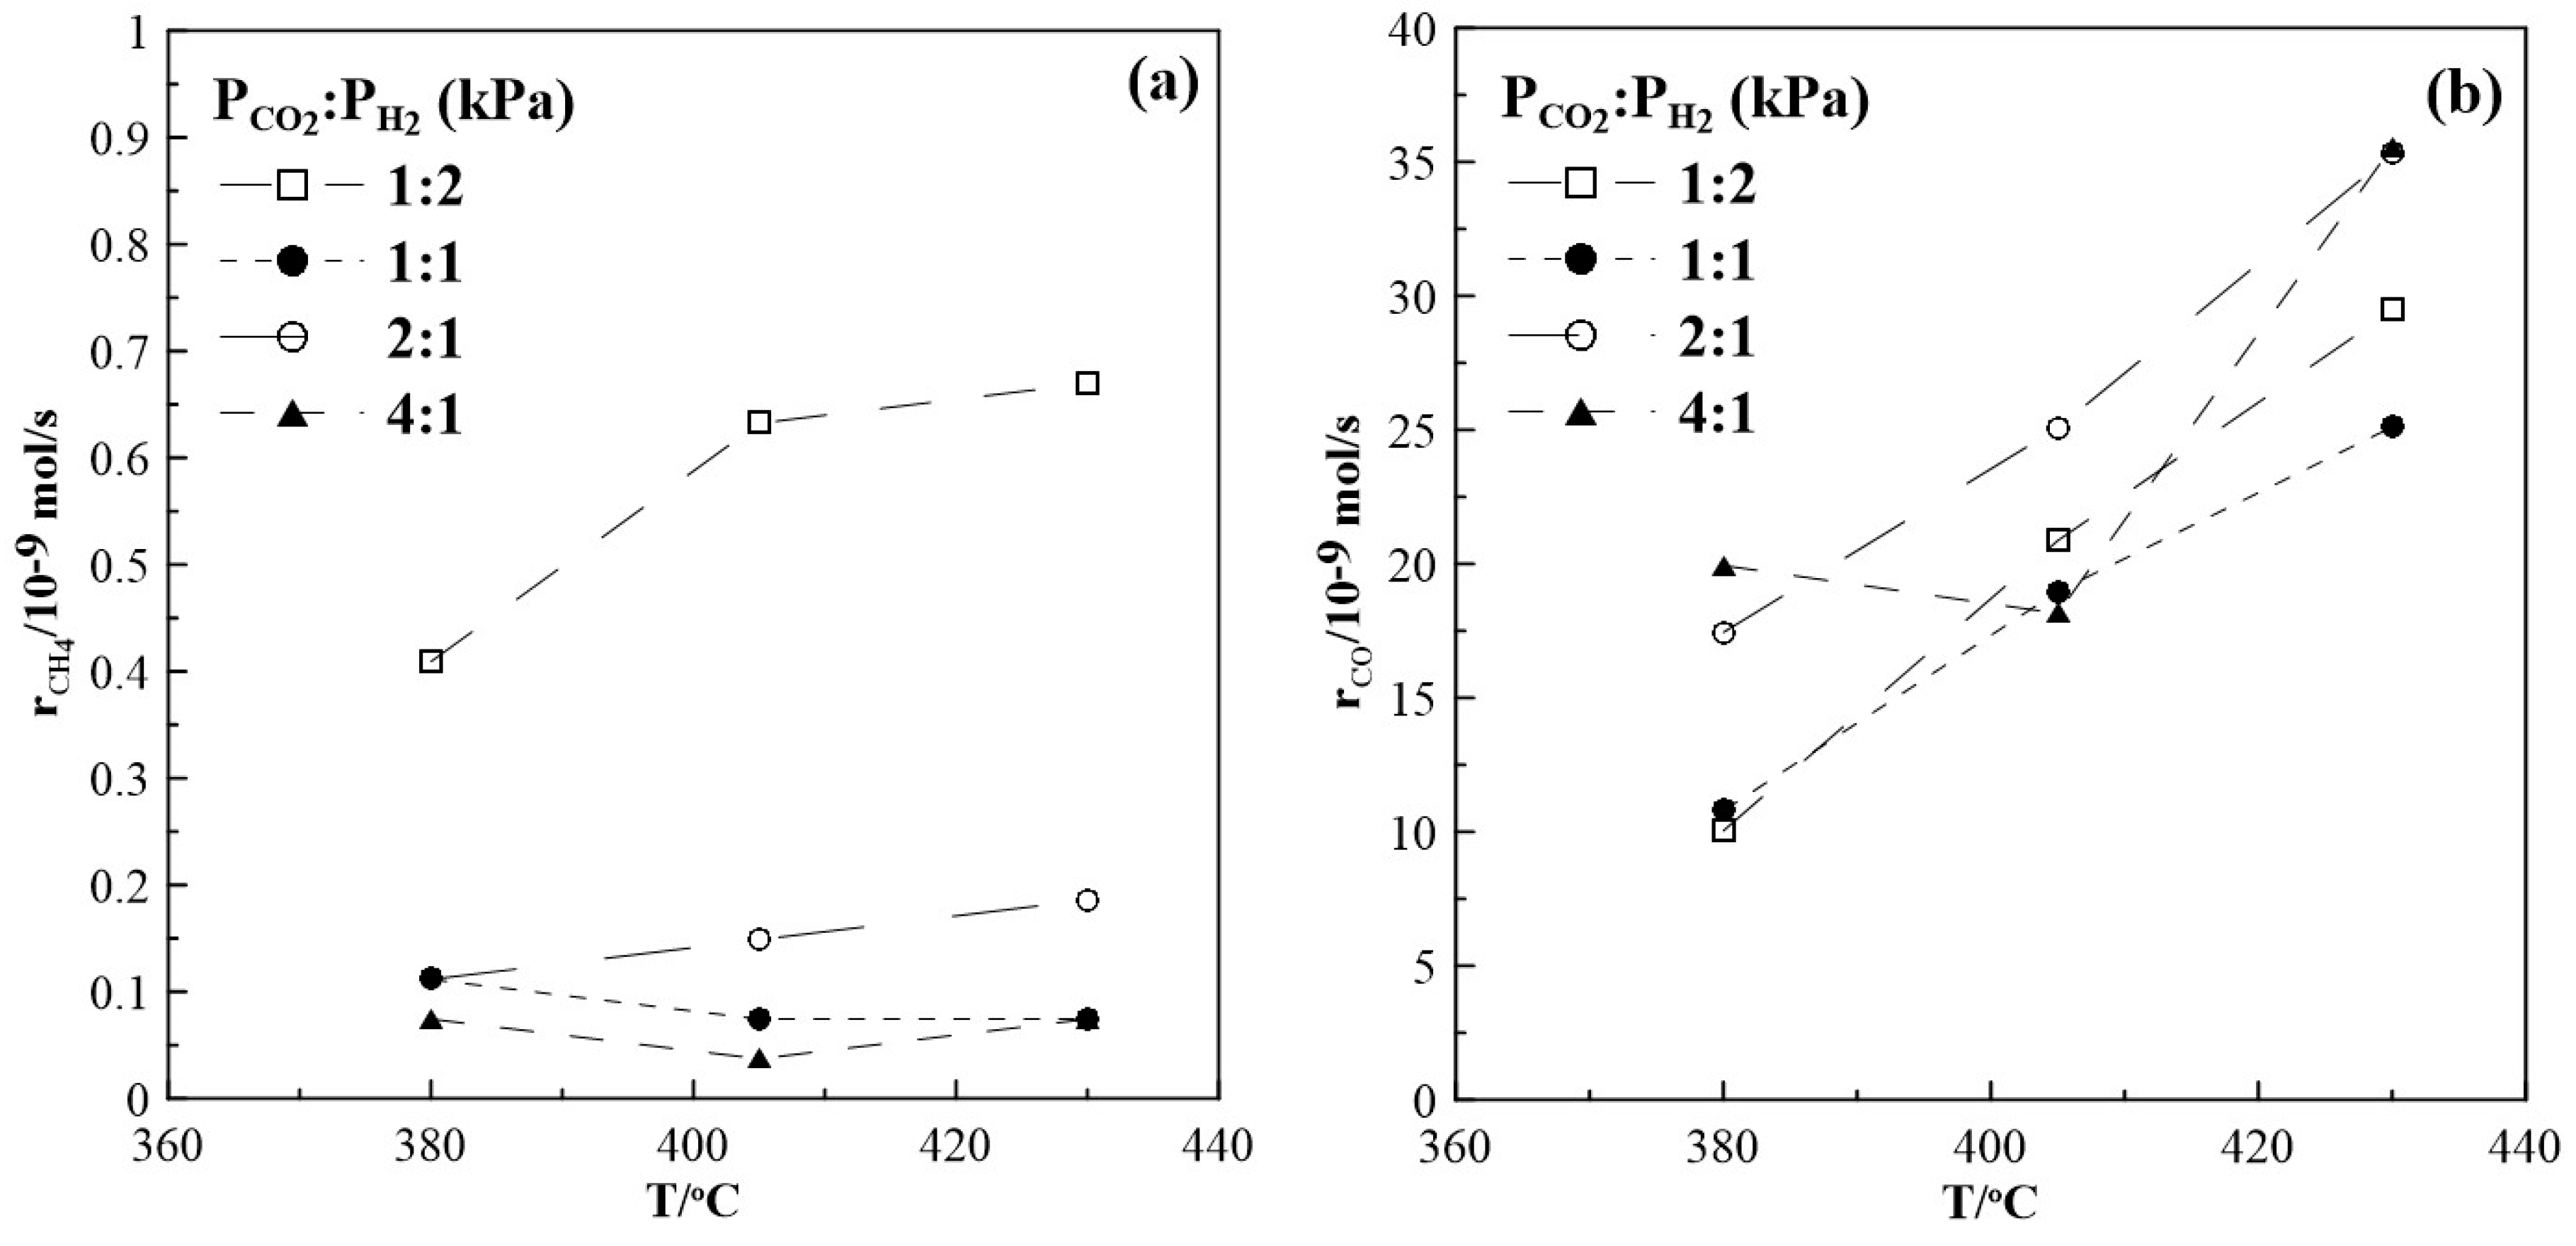
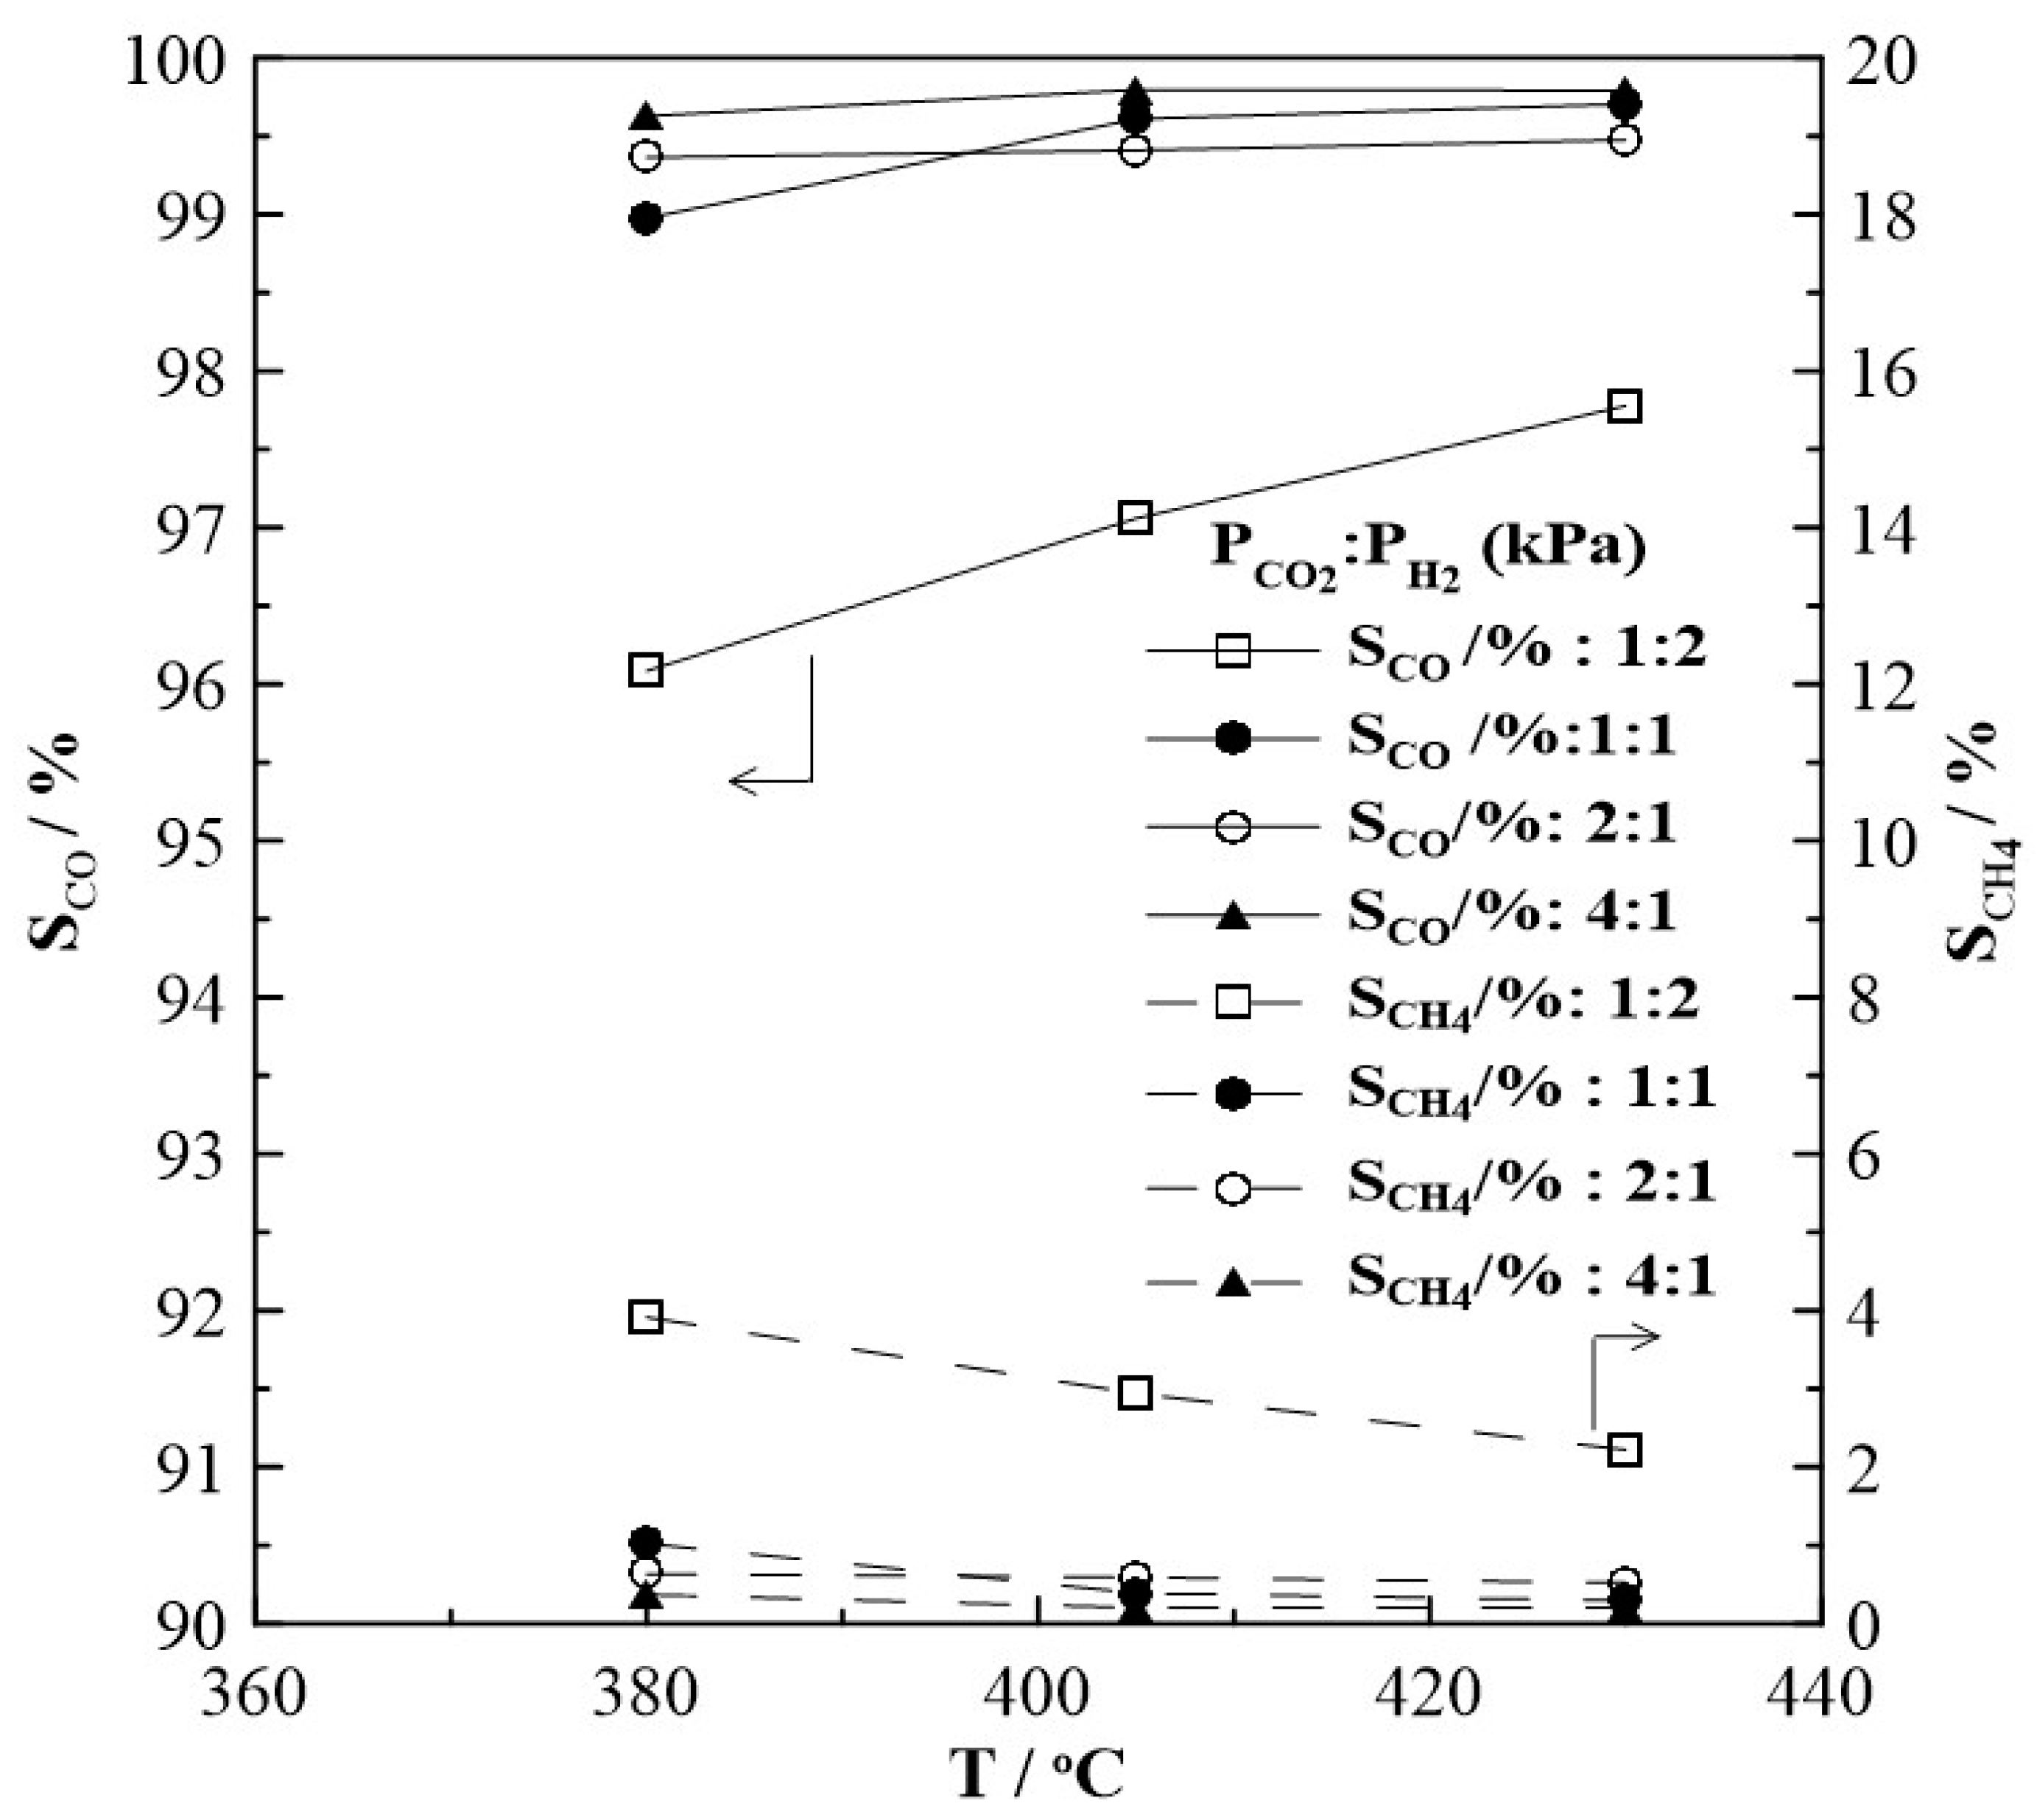
Figure 2 shows the CH4 and CO production rates at steady state as a function of temperature. The rate of the methanation reaction was found to be highest for a gas feed ratio of CO2 to H2 of 1:2. With increasing CO2 partial pressure in the reaction mixture, i.e., a CO2 to H2 ratio of 1:1, 2:1 and 4:1 the observed CH4 formation rate is very low and almost independent of temperature. Figure 2b suggests that the RWGS reaction prevails over the Sabatier reaction. Moreover, as shown in Figure 3, CO appears to be the main product under all feeding CO2 to H2 ratios of this study and its selectivity is higher than 96%, while CH4 selectivity is smaller than 4%. The reaction rate values of the RWGS reaction are more than one order of magnitude higher than those of the methanation one.
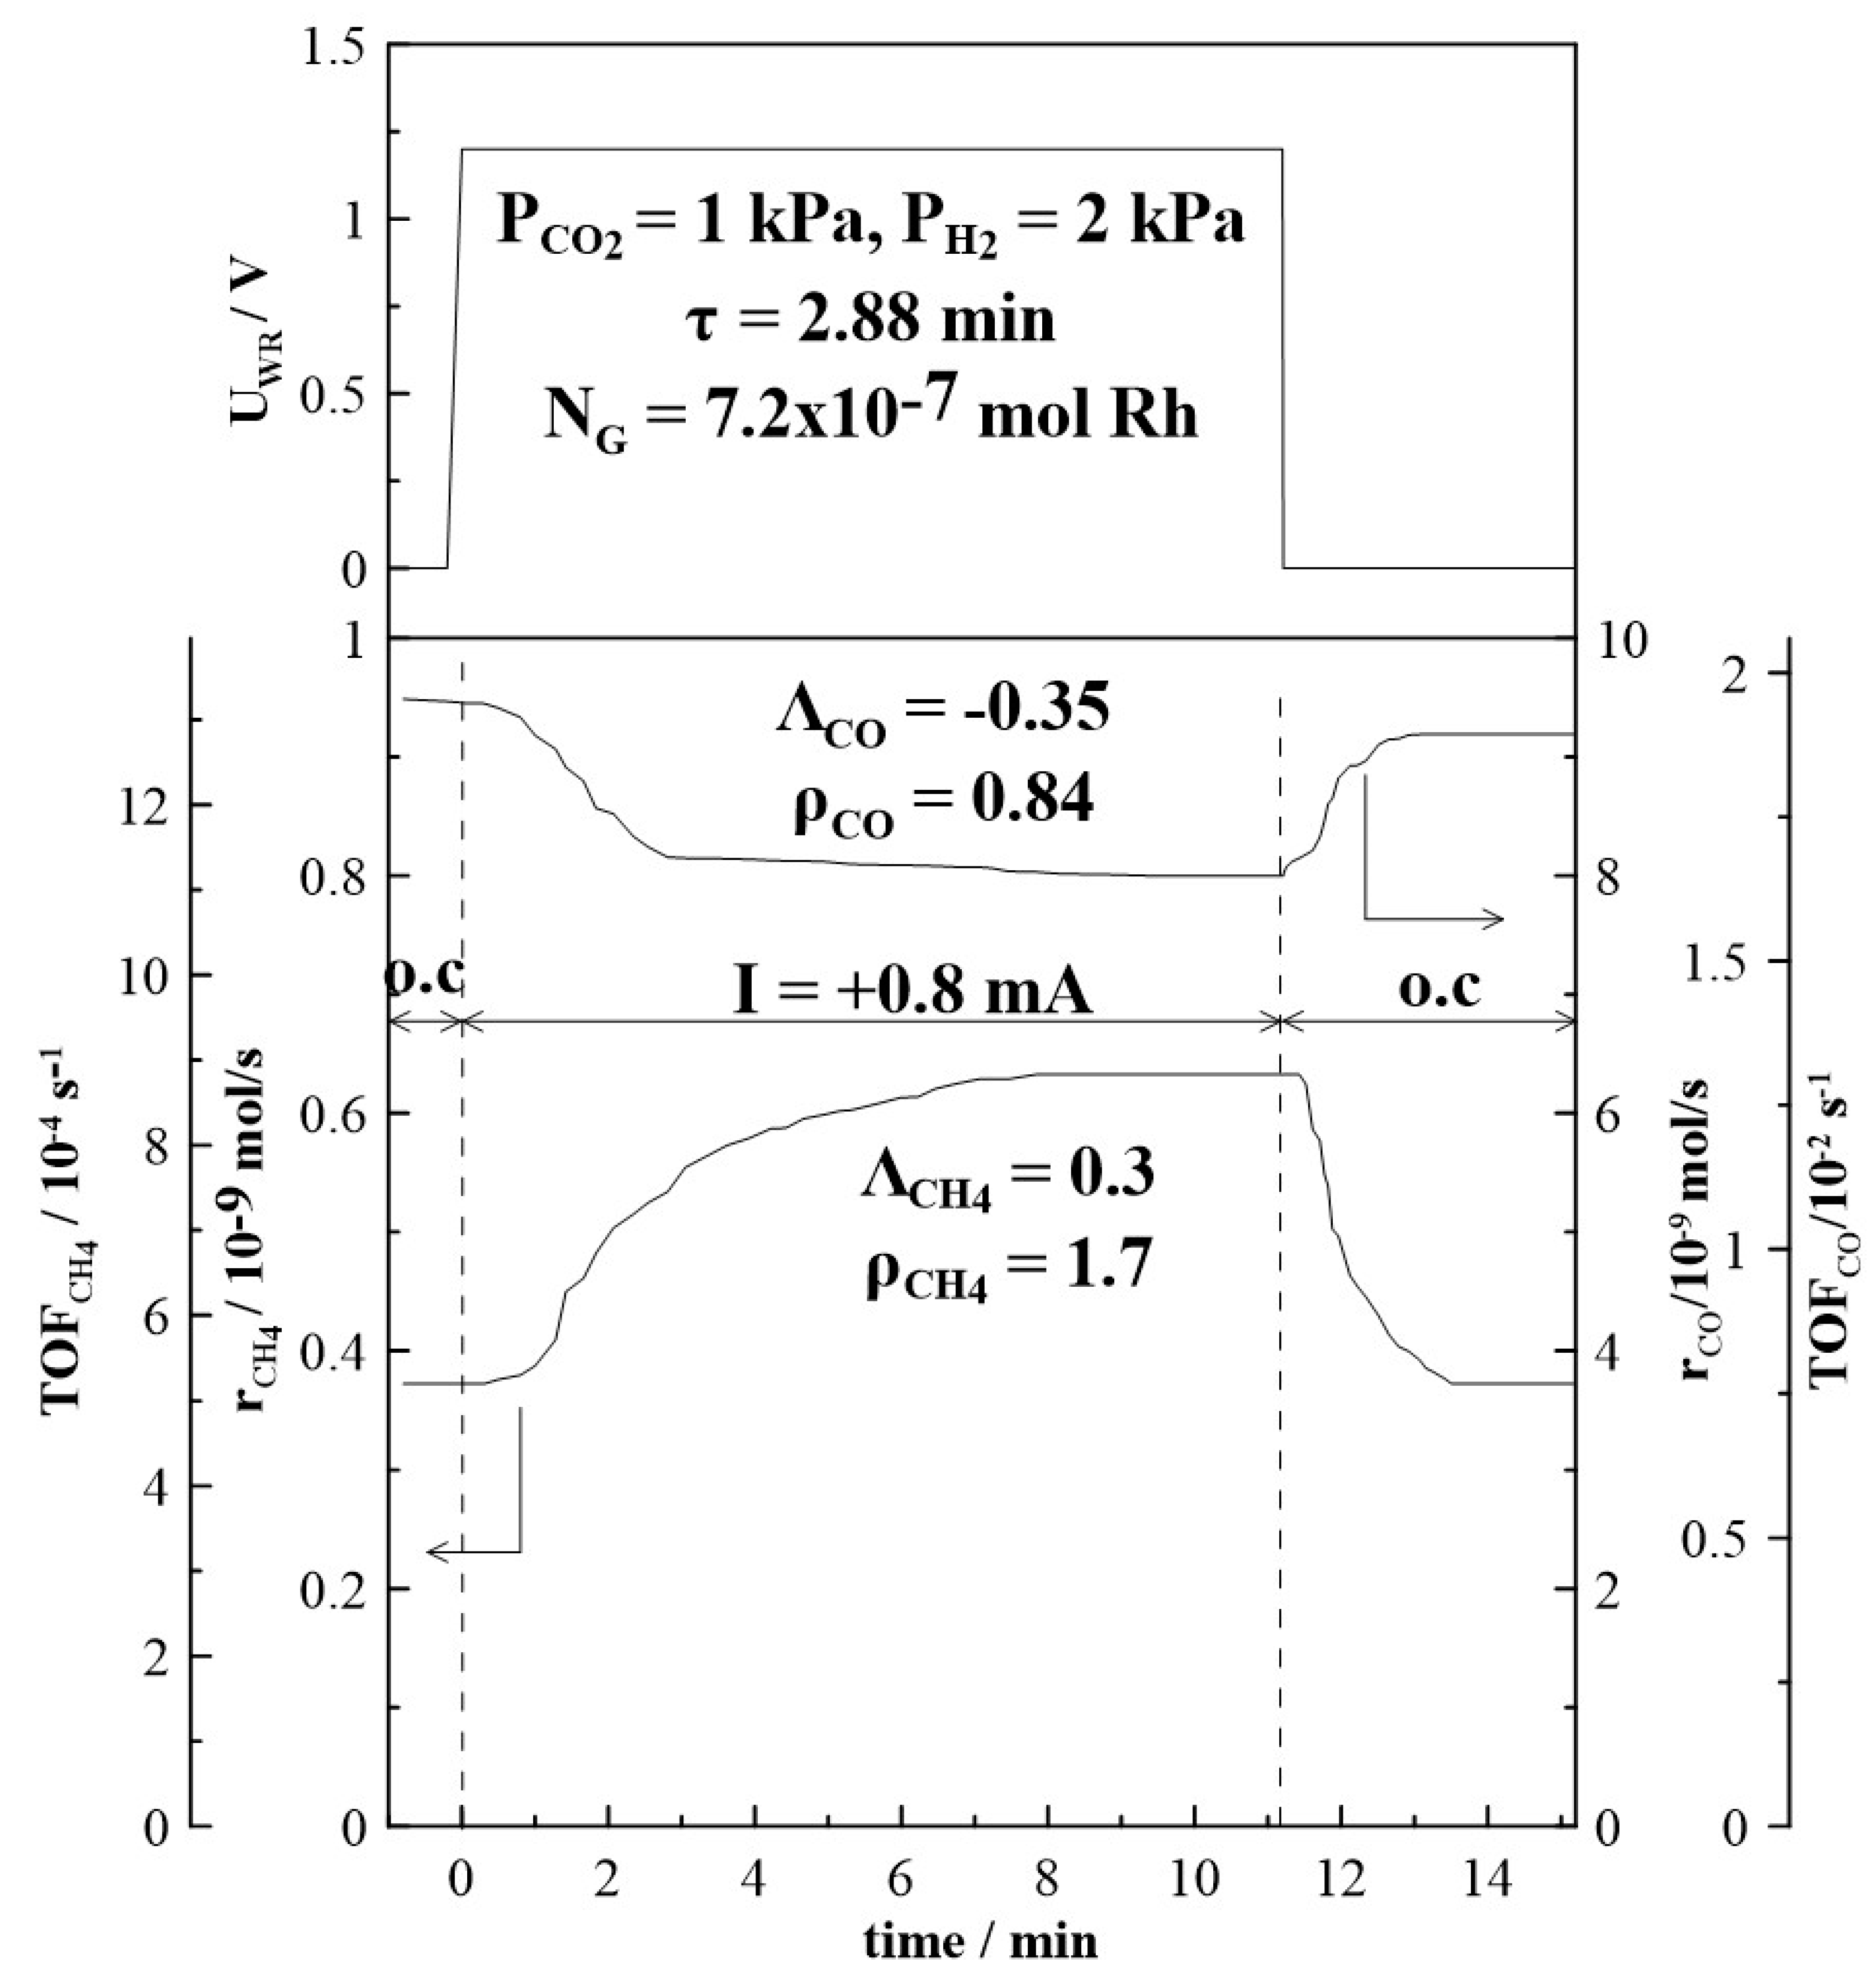
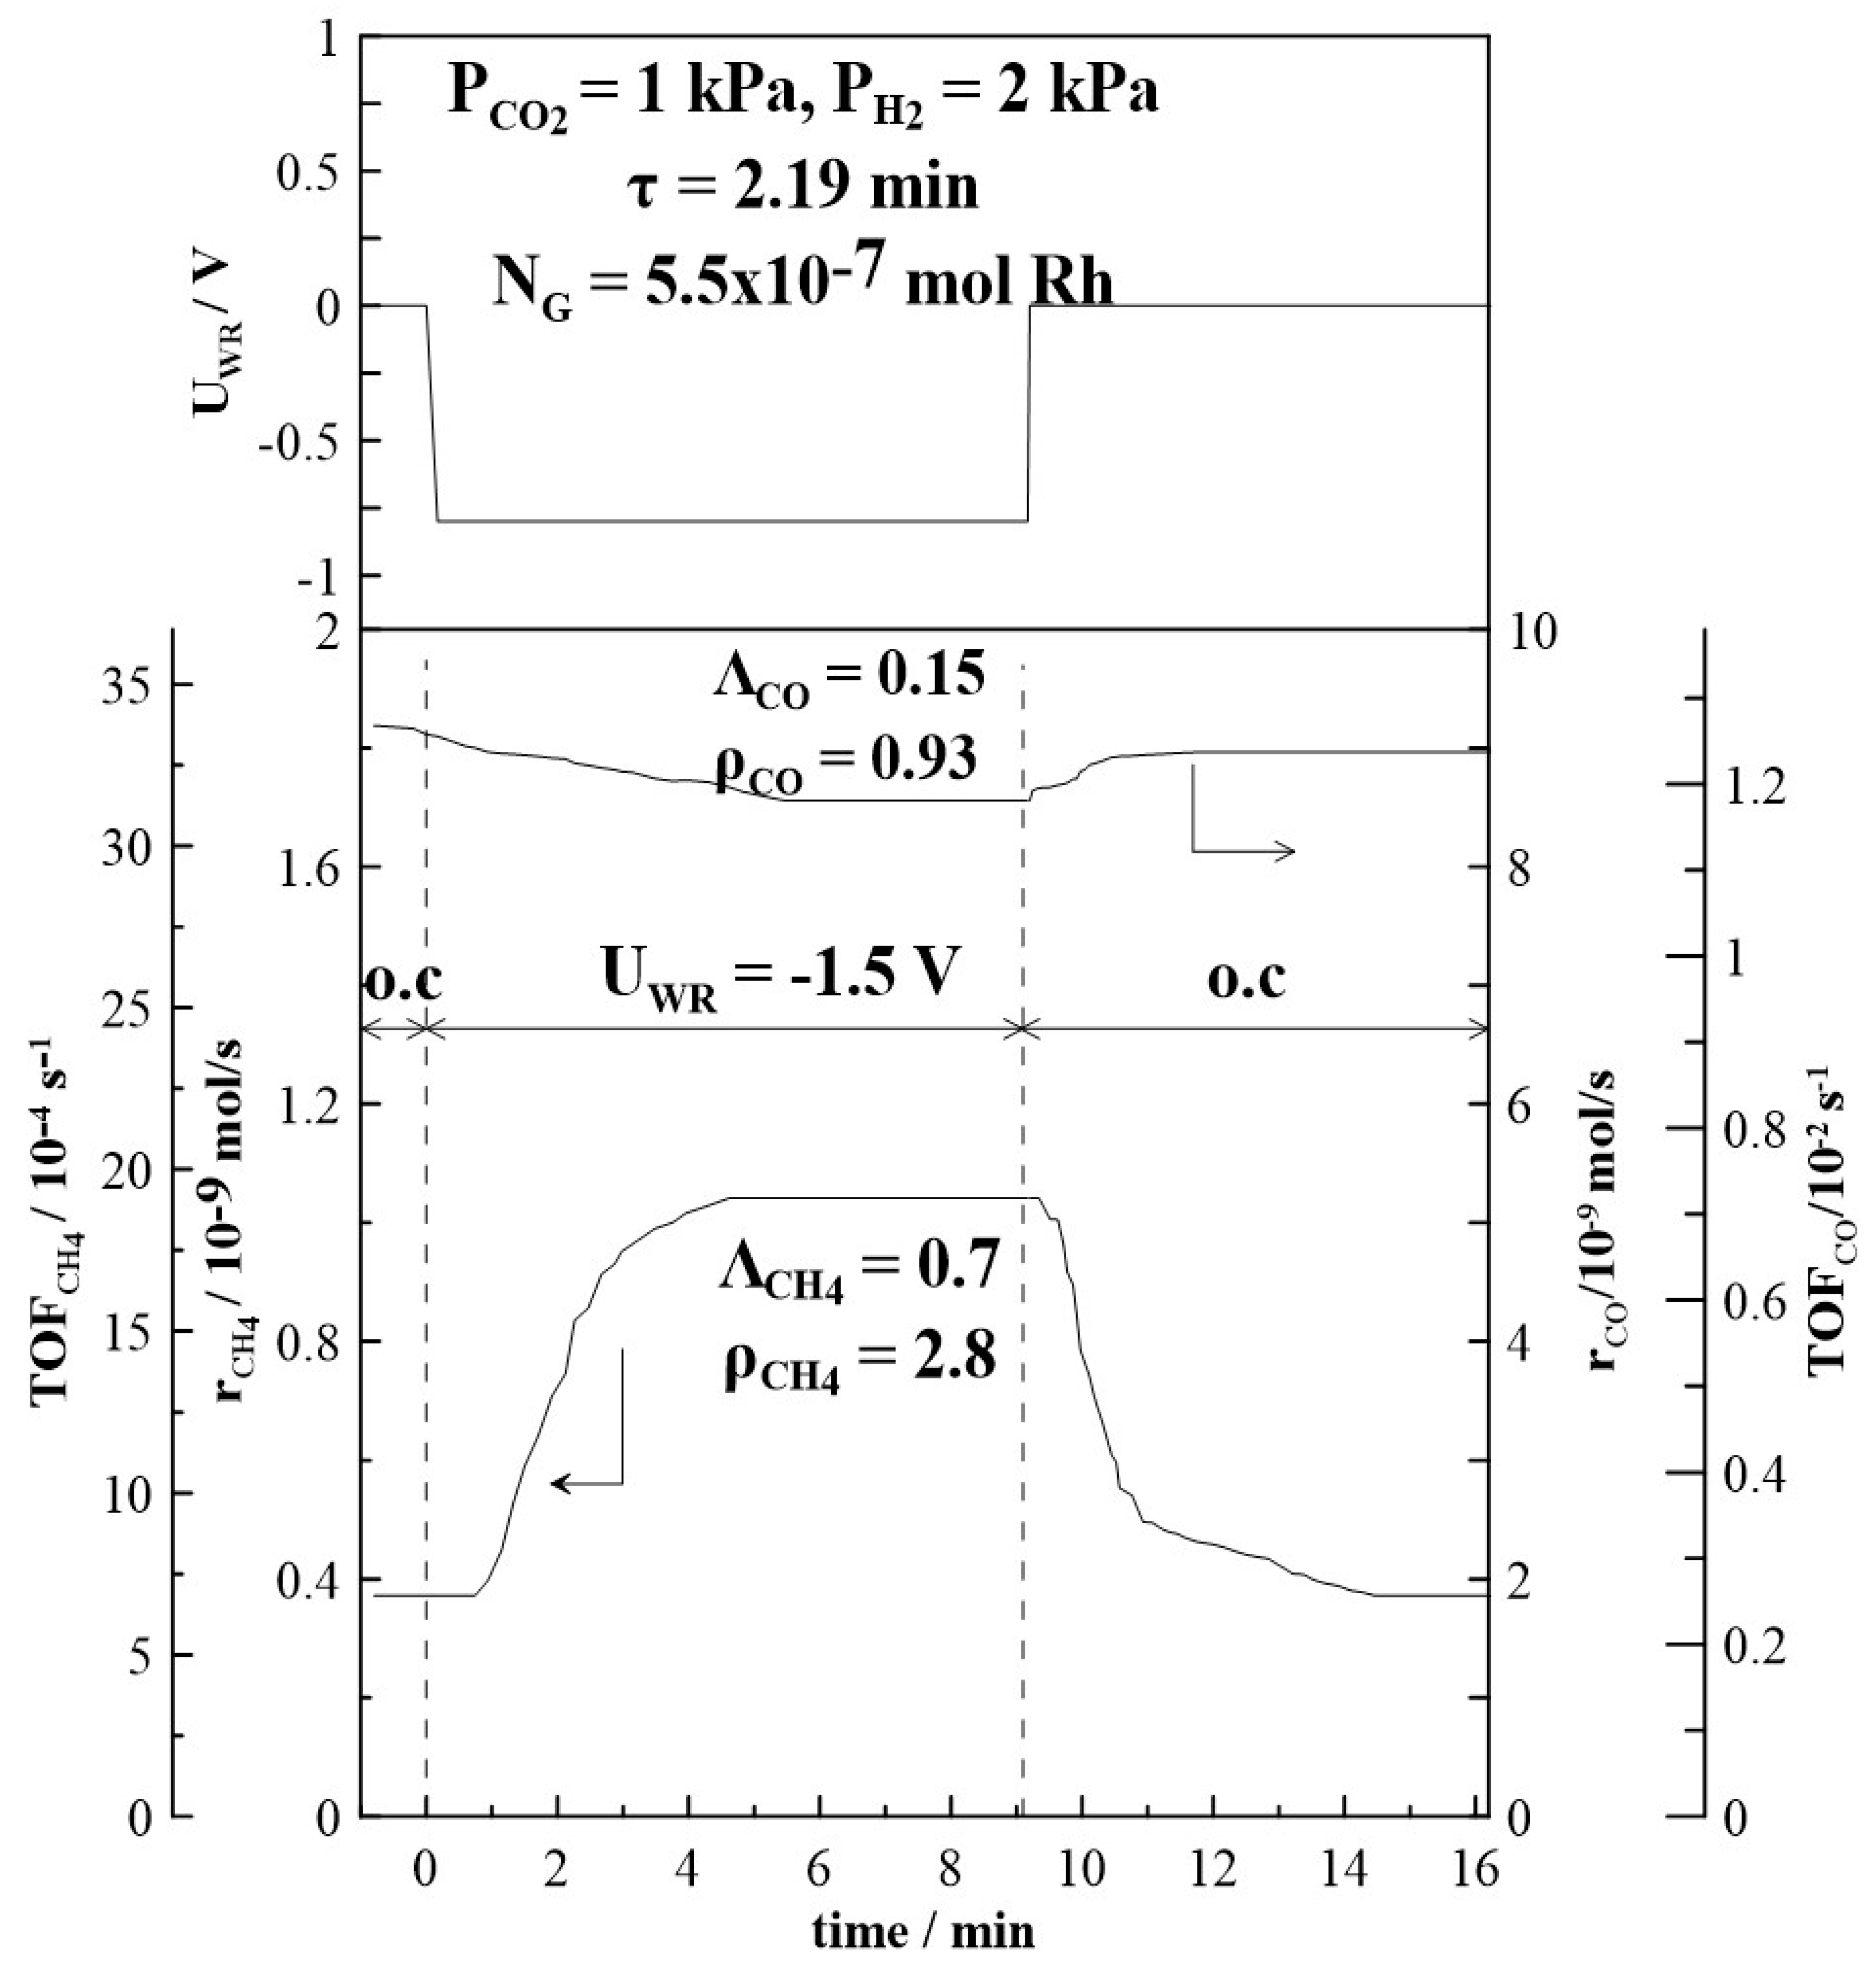
Figure 4 and Figure 5 depict the transient effect of constant applied positive (Figure 4) and negative (Figure 5) current on the catalytic rate and turnover frequency (TOF) for the formation of CH4 and CO at a CO2 to H2 ratio of 1:2 at 380oC. Initially, as presented in Figure 4, at t < 0, the circuit is open and the steady-state formation rates of CH4 and of CO are equal to 0.38 x10⁻⁹ mols-1 and 9.2 x10⁻⁹ mols-1 respectively. At t = 0, a constant anodic current (I = + 0.8 mA) is applied between the catalyst and counter electrode, which causes an applied potential of UWR = +1.2 V. Oxygen ions, O2-, are transferred from the YSZ support to the Rh catalyst-electrode at a rate of I/2F equal to approximately 10-3 s-1. The rate of CH4 increases and approaches a new steady state value (rCH4 = 0.62 x10⁻⁹ mols-1). This increase of the CH4 catalytic rate (Δr = 0.24 x 10⁻⁹ mols-1) is 1.7 times greater than the initial rate achieved under open circuit conditions. The CO formation rate decreases under anodic current application to 8.0 x 10⁻⁹ mols-1, resulting in a rate enhancement value of ρ = 0.84. After current interruption, the CH4 rate of formation returns to its initial open circuit value (reversible behaviour), while the CO formation rate returns only to a value above the initial open circuit rate (non-reversible behaviour). A very similar trend is observed under cathodic current application, as shown in Figure 5. The decrease in CO formation rate is less pronounced with a rate enhancement ratio, ρ, (see Equation (5) in Section 3.3) equal to 0.94. After current interruption, the rate does not return to its initial open circuit value. Under cathodic current application, CH4 formation rate is increased and a rate enhancement ρ-value of 2.7 is estimated.
The time constant, τ, given in both Figure 4 and Figure 5, is defined as the time required for the rate increase Δr to reach 63% of its new steady state value during a galvanostatic transient [70]. When an O2- ion conductor is used, the magnitude of τ can be generally predicted by
τ 2 F N G I
where NG (mol) is the reactive oxygen uptake on the metal catalyst. The time constant τ expresses the time required to form a monolayer of Oδ- on the metal surface, while NG expresses, approximately, the surface mols of metal, here Rh. The average active catalyst surface area, NG, which is equal to 7.62 x 10⁻⁷ mol Rh, has been calculated based on 6 galvanostatic transients. The estimated value of NG agrees well with the values found in previous studies of Rh catalyst-electrodes supported on YSZ [50,51,67,71]. The average NG value obtained was used to calculate turnover frequencies (TOFs) for CH4 and CO formation. TOFs for CH4 formation are found to be small and in the order of 10-4 s-1, which is in good agreement with literature data [21].
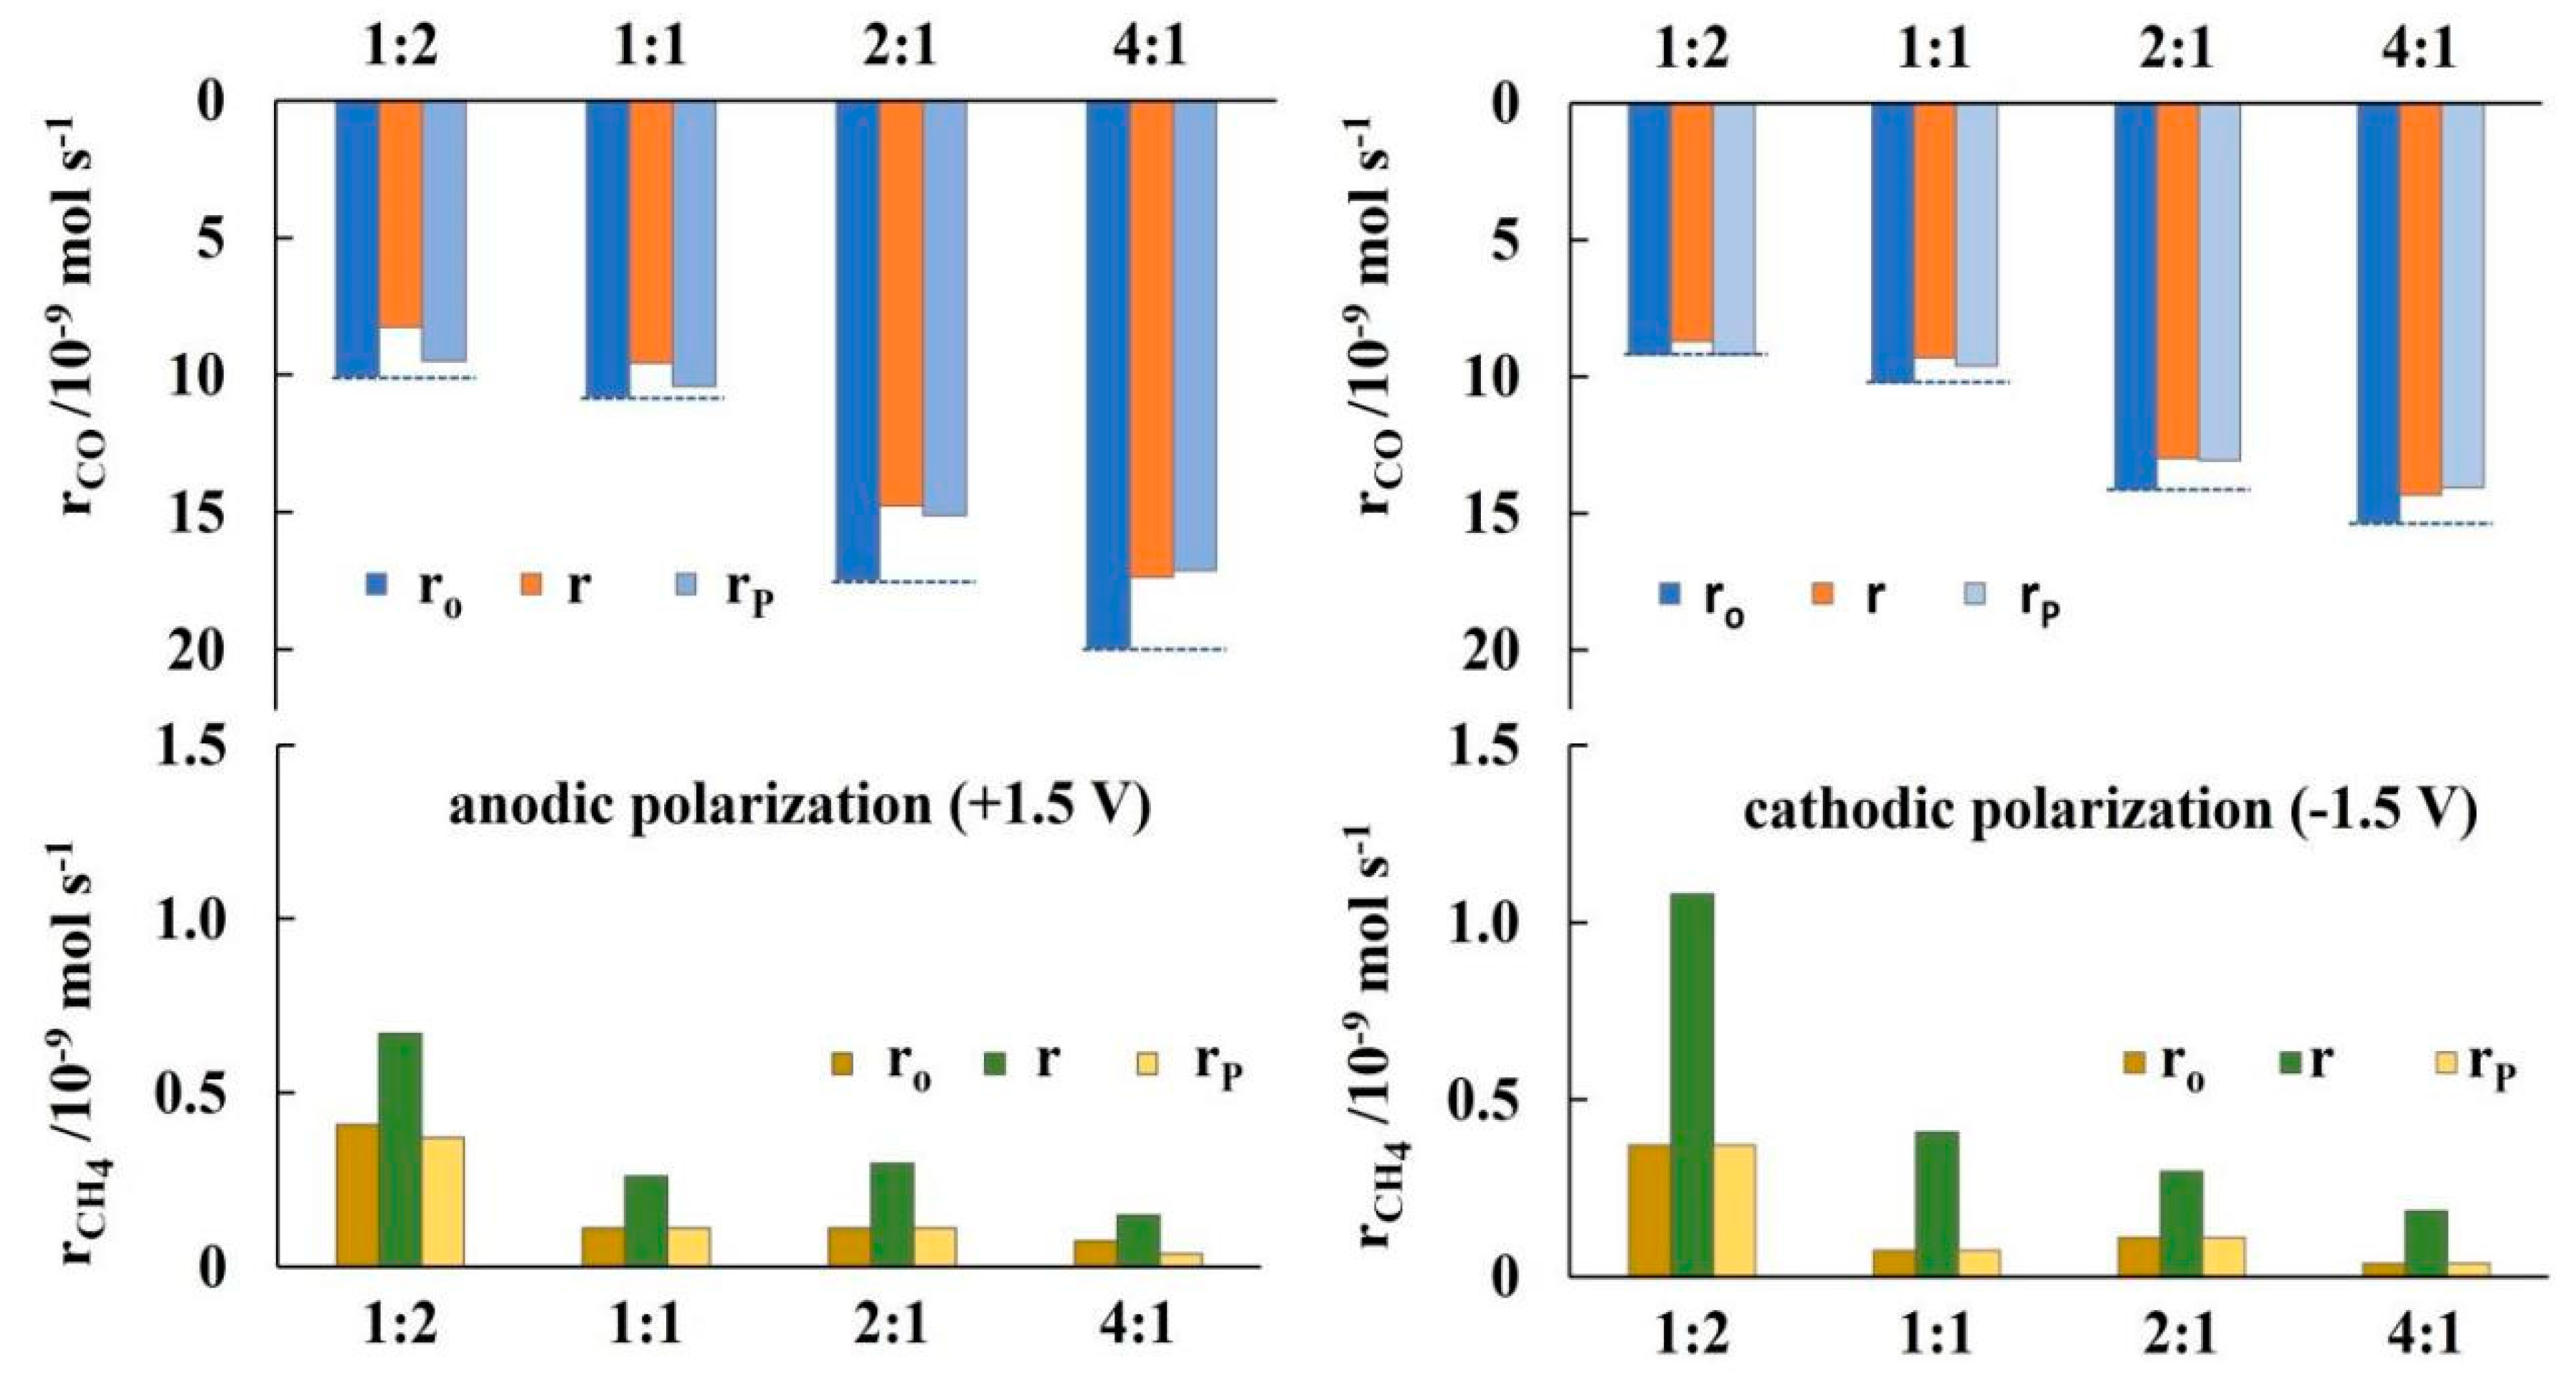
The non-reversible behaviour of CO formation has been further investigated by repeated current and/or potential application, which have generally shown, that upon current an/or potential interruption the rate of CO formation does not return to its initial open circuit value. Figure 6 summarises the results for potentiostatic transient operation at different CO2 to H2 feed ratios. The bottom part of the figure shows that the increase in CH4 formation rate under anodic and cathodic polarization (+ and -1.5 V), which is more pronounced at high H2 to CO2 feeding ratios, is reversible. However, the CO formation rate, as shown in the top part of Figure 6, exhibits a “permanent”, non-reversible NEMCA behaviour [69,70]. The guide (dotted) lines, clearly show, that this non-reversible effect of current and/or potential application is more pronounced at higher CO2 to H2 feed ratios.
The “permanent” rate enhancement ratio γ, was defined for the first time by Comninellis et al. [70] as
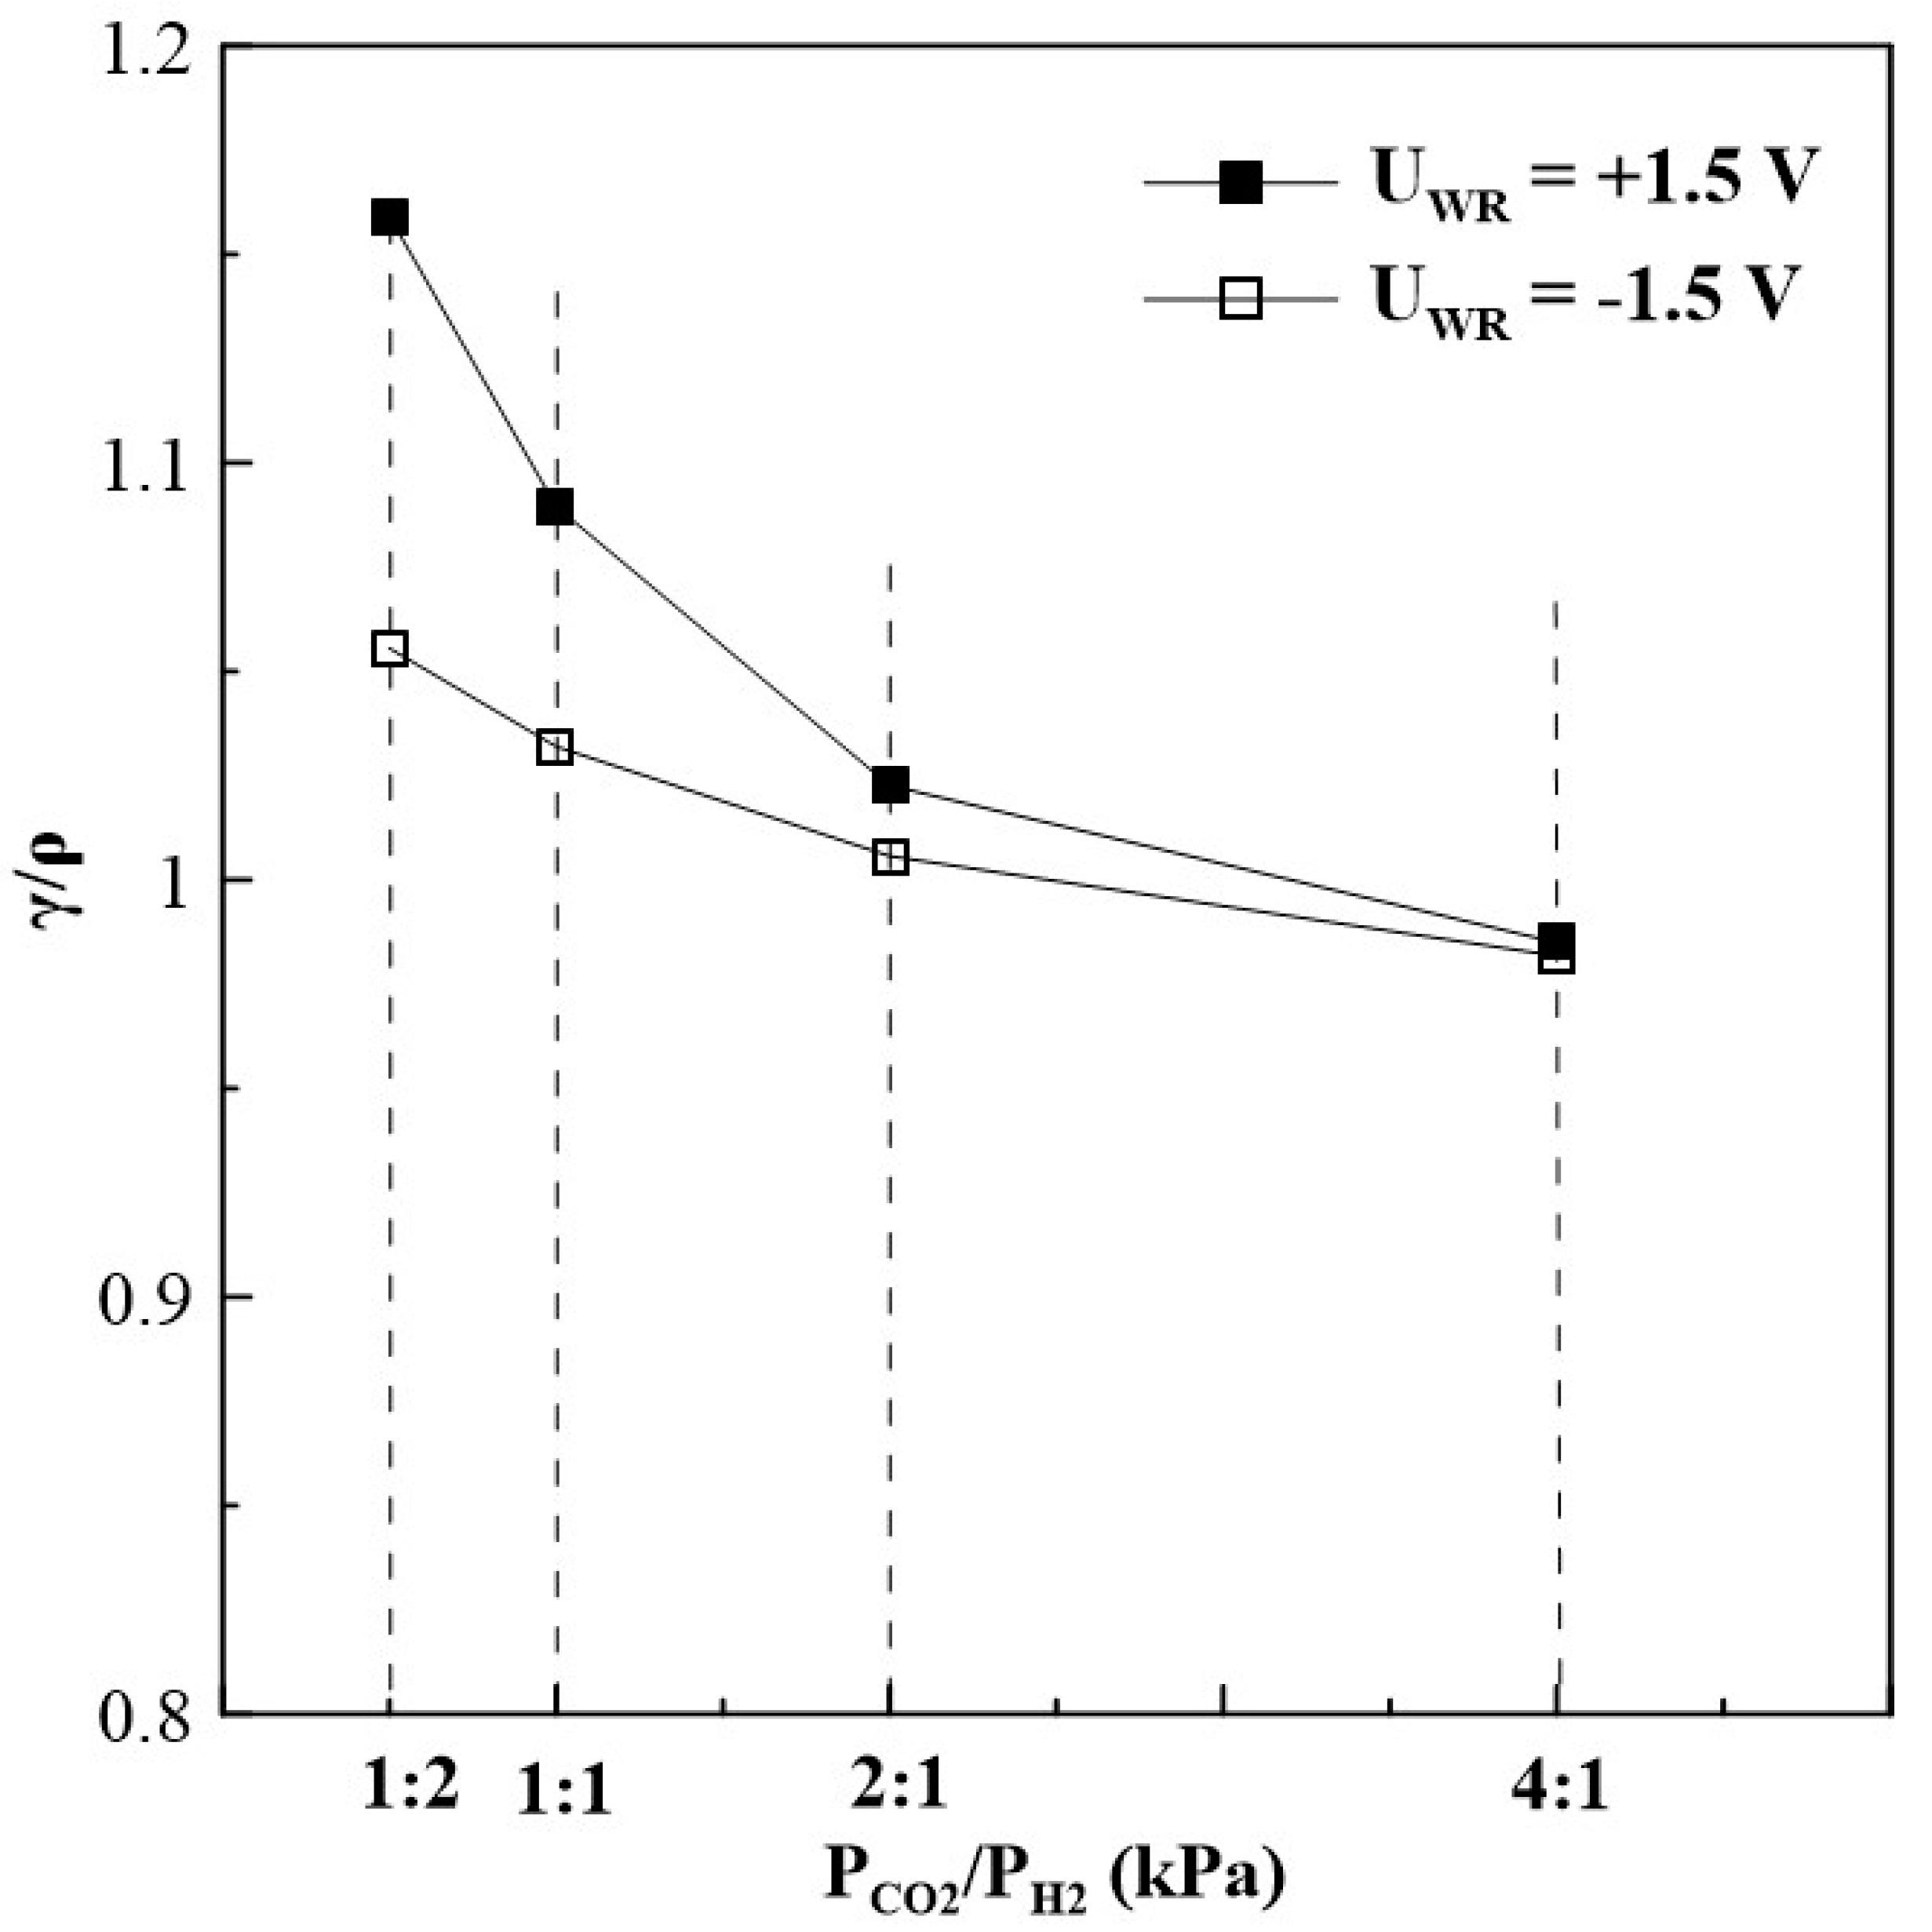
γ = r p / r o
where r p is the “permanent” promoted catalytic rate after current or potential interruption, and r o is the unpromoted rate (i.e., the open-circuit catalytic rate). Figure 7 displays the non-reversibility magnitude of CO formation for different gas feed ratios. Under reaction conditions of a CO2 to H2 ratio of 1:2, the γ/ρ ratio is higher than 1, expressing, that the CO formation rate observed under potential application partially returns to its initial open circuit value. However, γ/ρ ratio equals to 1 for a reaction mixture with a CO2 to H2 ratio of 4:1 and a significant “permanent” NEMCA behaviour is observed.
In the general case of an oxidation reaction on catalysts deposited on O2− conductors, like YSZ, the ionic species migrating in the solid electrolyte is participating in the electrochemical reaction leading to distinct values of apparent Faradaic efficiency, |Λ| > 1 (see Equations (6)–(8), Section 3.3). In the present case however, in which oxygen is not a reactant, any positive current or positive potential-induced catalytic rate change denotes electrochemical promotion, even when |Λ| < 1 [38]
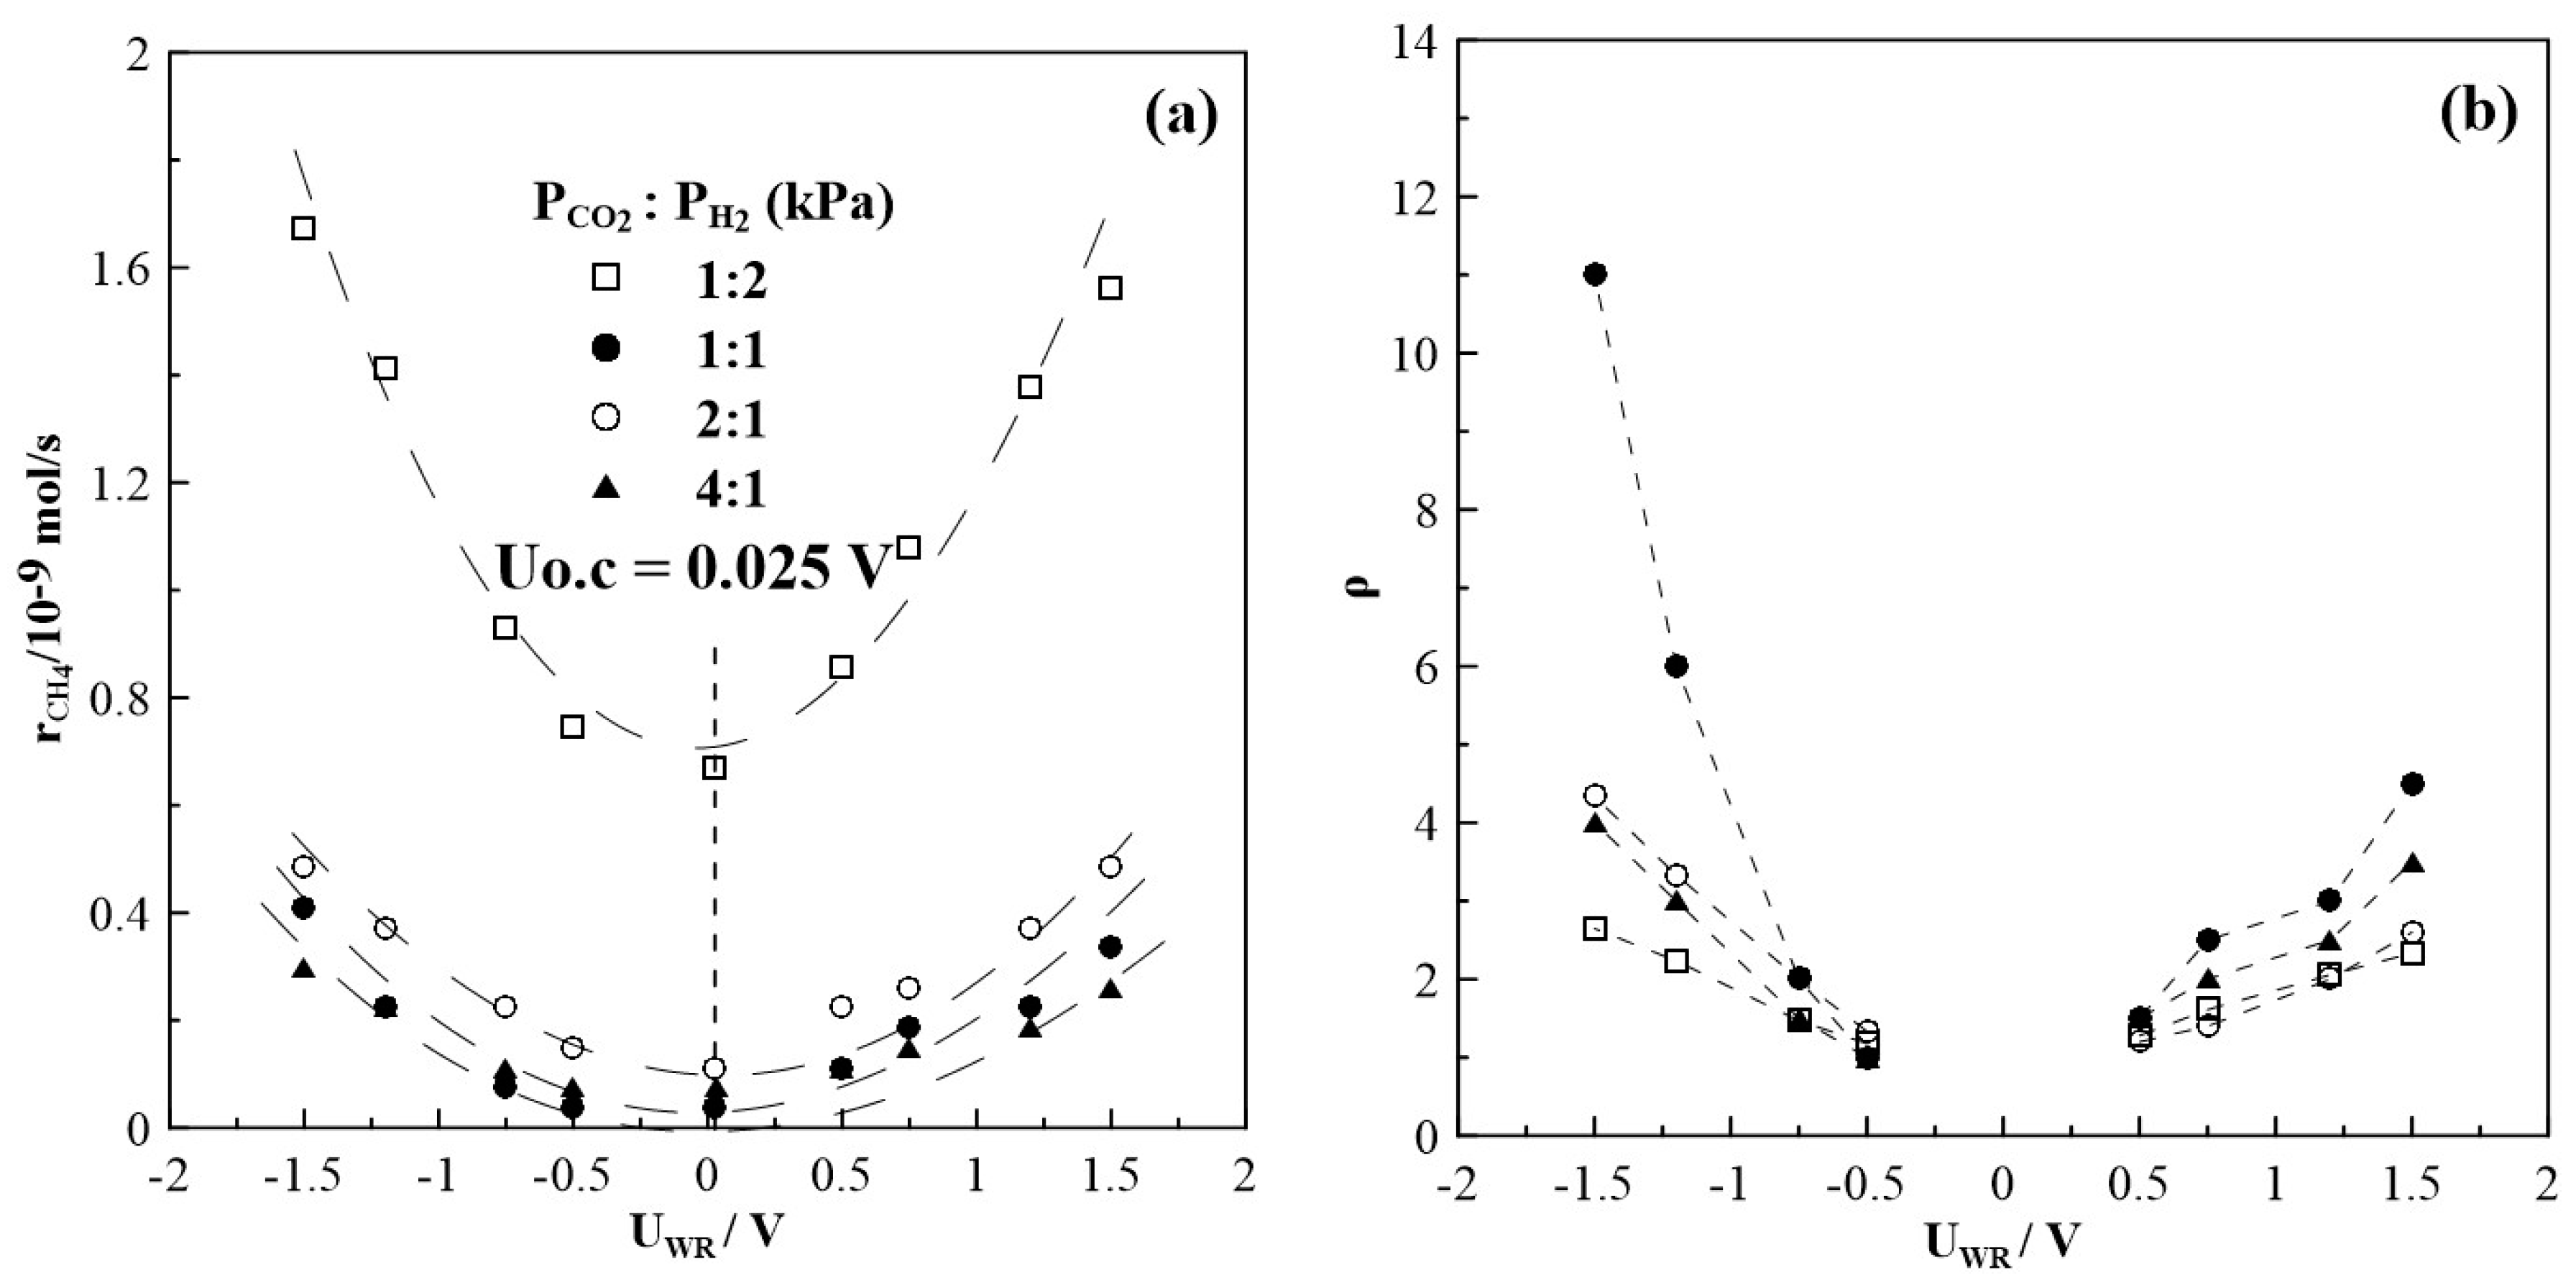
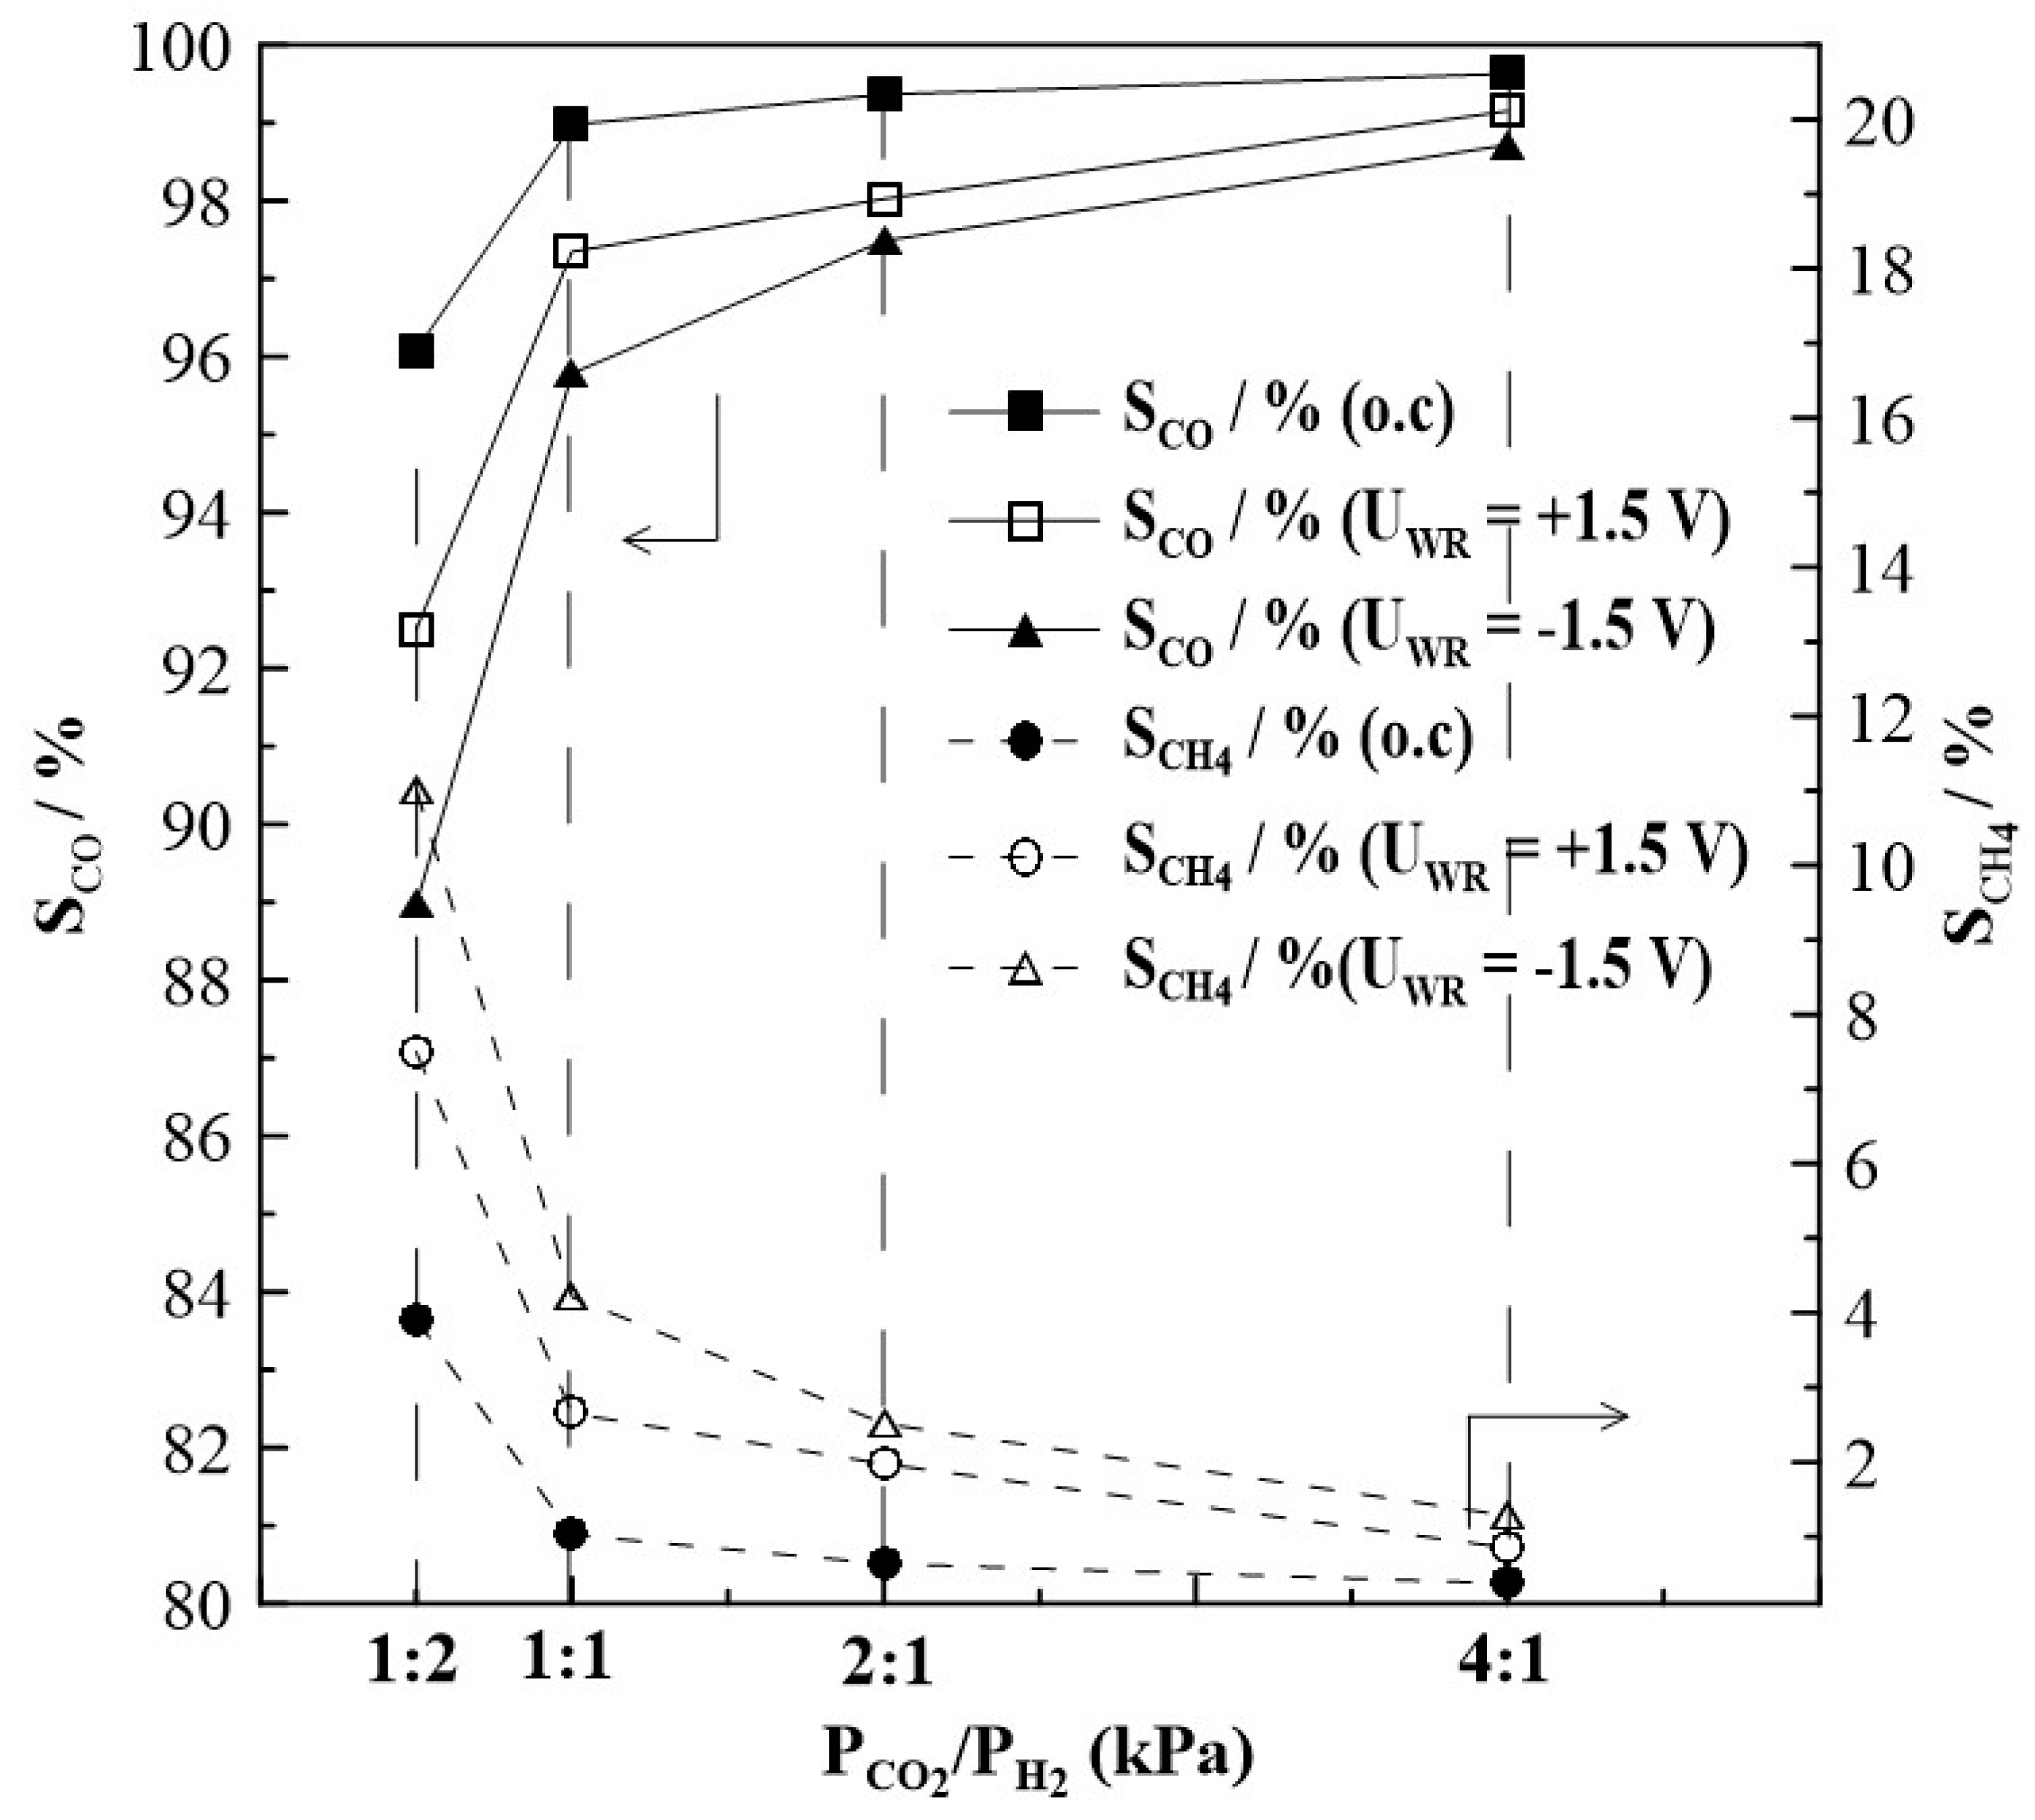
Figure 8 summarizes the results of steady state potential application on the rate of CH4 formation at T = 430oC, for which the highest rate enhancement ratio, ρ has been found. The observed currents (not shown in Figure 5) do not depend on gas feed conditions, that means they are almost equal at a given potential and do not depend on the CO2 to H2 ratios. This observation is one of the very first hints that the overall oxidation state of the film, remains relatively unchanged during the course of the reaction. The rate of CH4 production displays an inverted volcano type behavior i.e., it increases with increasing and decreasing catalyst potential as shown in Figure 8a. Maximum changes in the CH4 rate are observed under reaction conditions of a CO2 to H2 ratio of 1:2, but the highest rate enhancement ratios are achieved at conditions of CO2:H2=1:1 with ρ reaching values of up to 11. If the partial pressure of CO2 is further increased, i.e., CO2 to H2 ratios of 2:1 and 4:1, methane formation is found to be small with values below 0.6 10-9 mols-1. Despite this, however, methane formation can be electrochemically promoted with ρ-values of up to 5. Product selectivity towards CH4 is electrochemically promoted under anodic and cathodic polarization; and it is highest under reaction conditions of a CO2 to H2 ratio of 1:2, but does not exceed 10%, as seen in Figure 9.

2.2. Catalyst Characterization

The morphology and chemical state of the Rh/YSZ film was assessed with XRD (X-ray diffraction), SEM (Scanning Electron Microscopy) and XPS (X-ray Photoelectron Spectroscopy). The characterization studies were carried out on two different samples, designated as fresh and used, which correspond to the freshly reduced (i.e., after treatment in 15% H2 in He) and a post experiment (i.e., after exposure to different CO2: H2 gas feed compositions) Rh/YSZ catalyst-electrode, respectively.
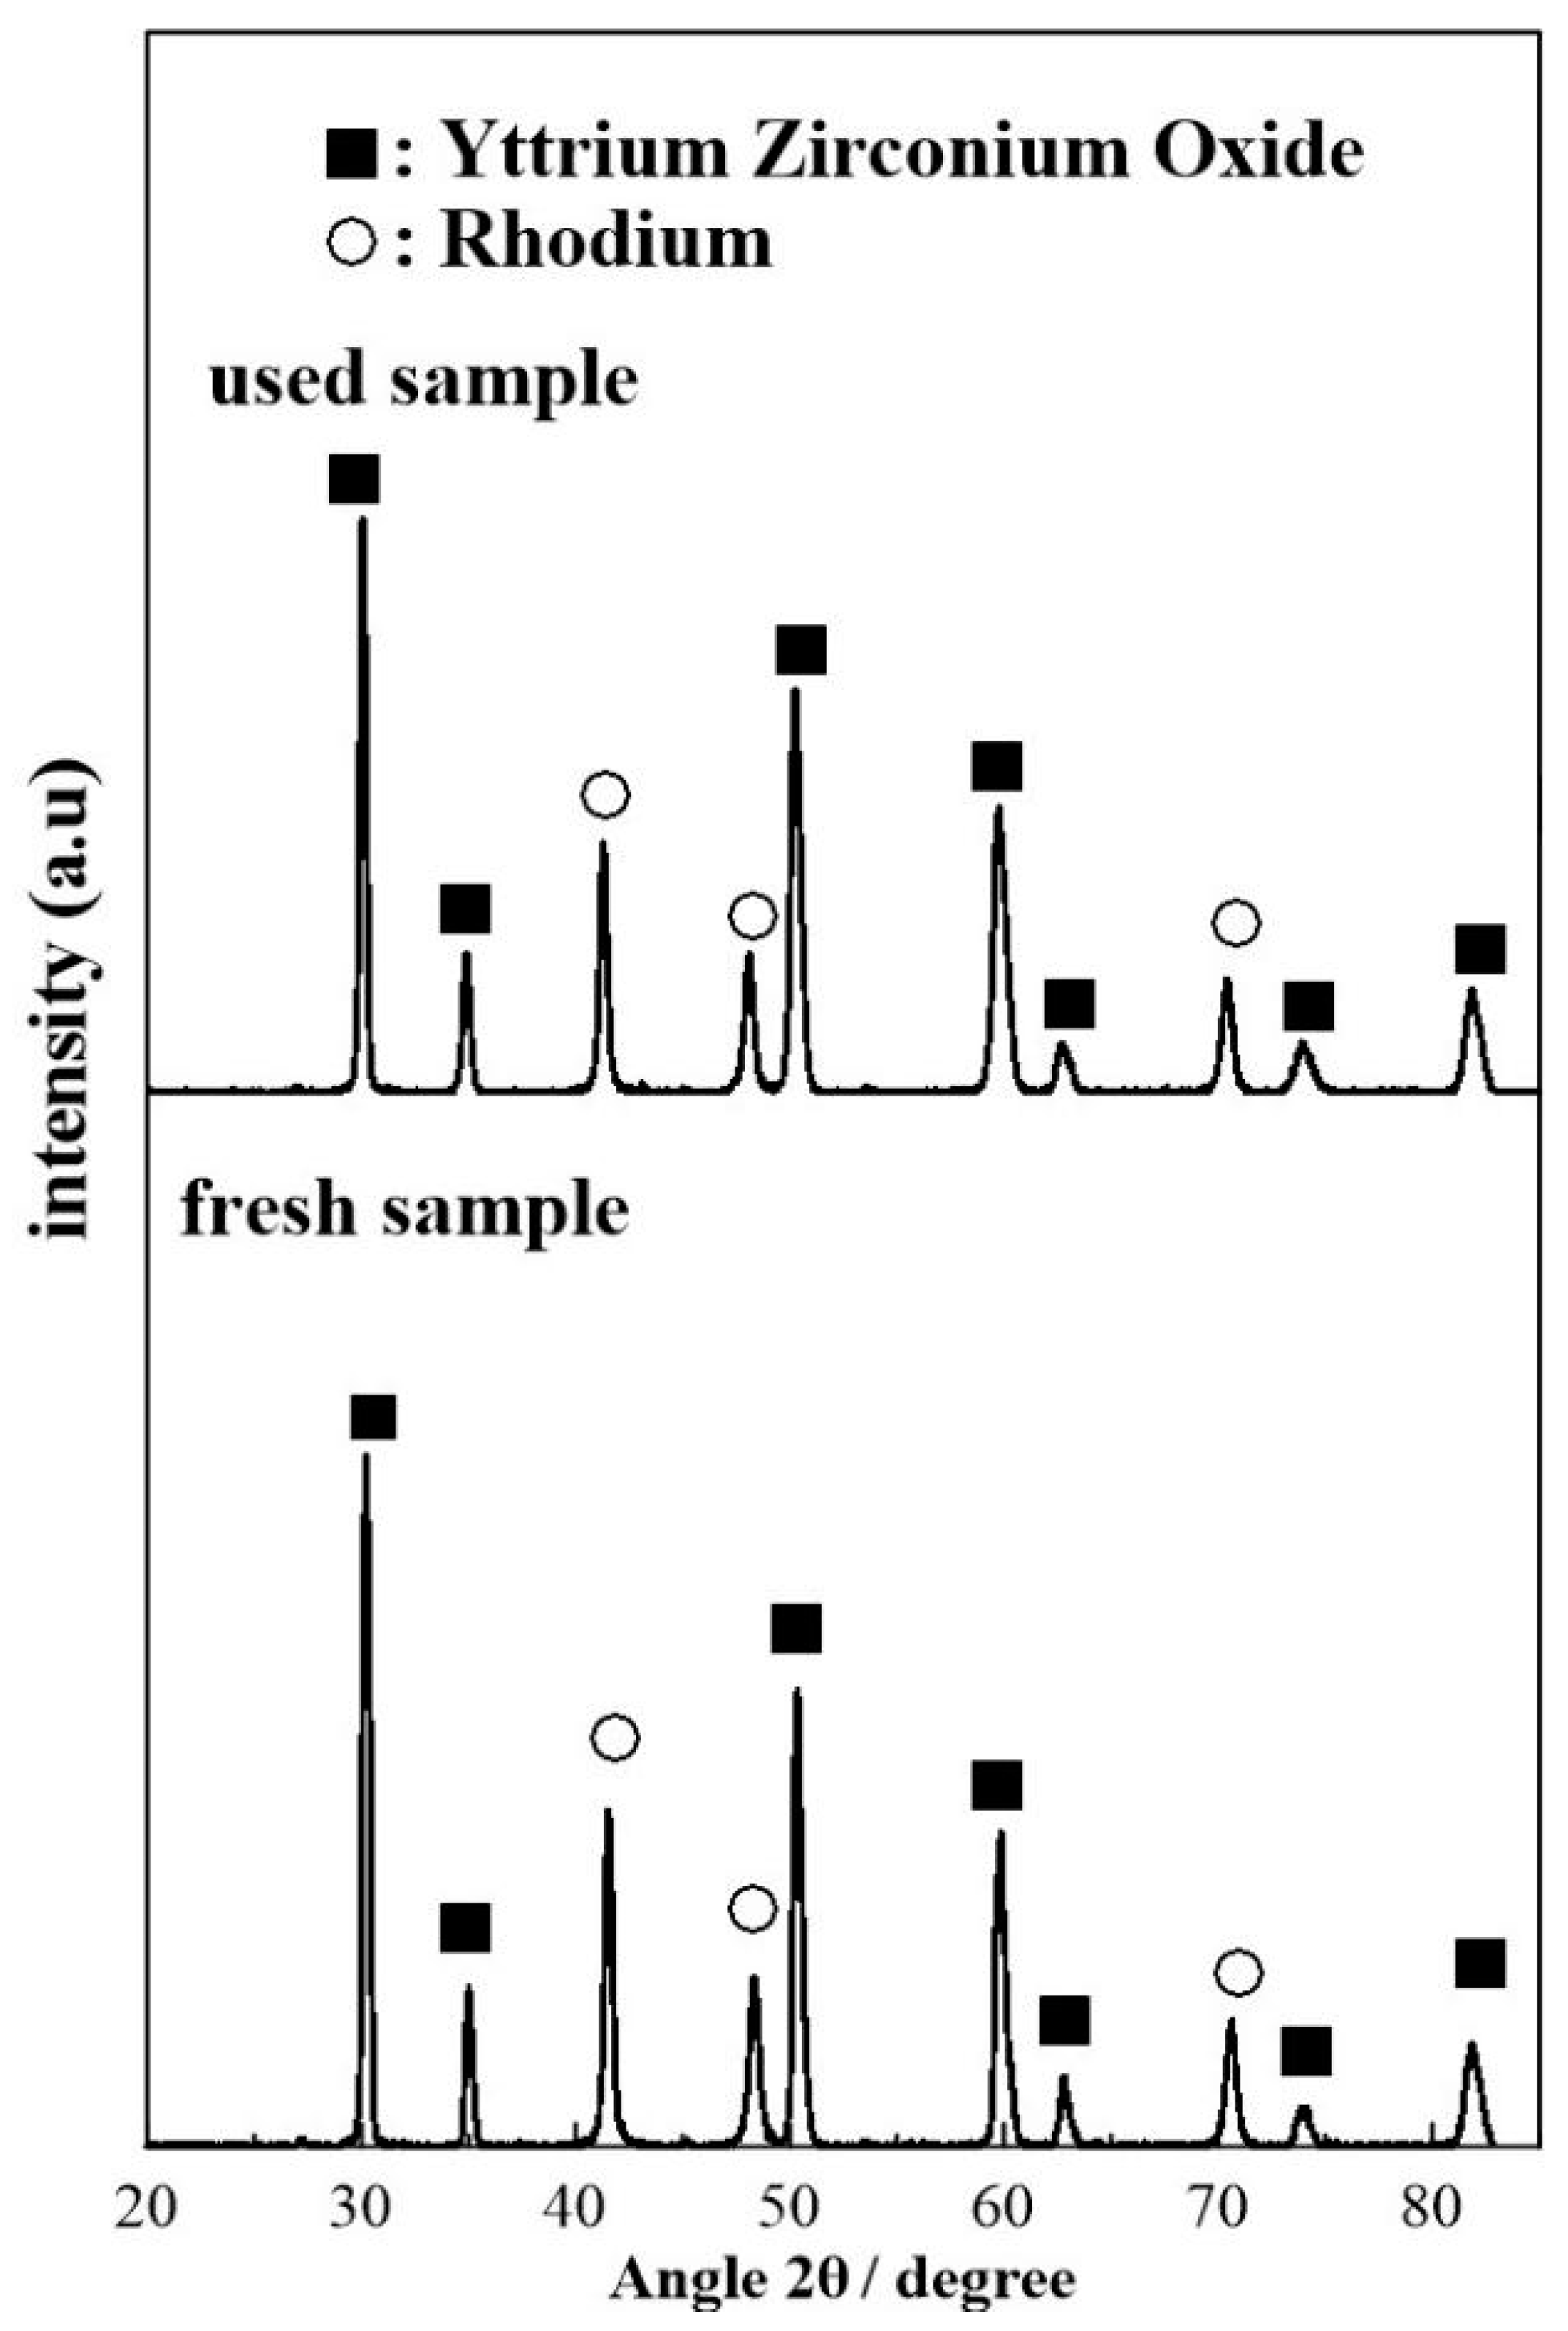
The diffractograms displayed in Figure 10 and show no major differences in the phase distribution of the fresh and used sample. More specifically both diffractograms show clear reflections at 2θ = 30.3°, 35.0°, 50.4°, 59.9°, 62.9°,74.1° and 81.9° which correspond to the (111), (200), (220), (311), (222), (400), (331) planes of YSZ [74,75]. In addition, both diffractograms show clear reflections at 41.5°, 48.4°, and 70.7° which correspond to the (111), (200), and (220) phases Rh particles in their metallic (Rh0) state [73]. No reflections corresponding to RhO2 or Rh2O3 were detected in the XRD measurements suggesting that the chemical state of the Rh film is mostly metallic before and after use.
The mean Rh crystallite size of the fresh and used samples were calculated by means of the Scherrer equation [74] by assuming a spherical crystallite shape and averaging the crystalline domain diameter obtained for the (111), (200) and (220) reflections. The size of the Rh crystallites in the fresh sample (19.9 ± 0.8 nm) was found to be slightly smaller as compared to the used sample (24 ± 1 nm) which suggests that some degree of crystallite size increase during the course of the electrocatalytic reaction due to agglomeration.
Previous XRD studies on Rh/YSZ systems have shown that after reduction and prior to experimental measurements the metallic phase of Rh is mainly present in the sample with only tracers of metal oxides being detectable [75]. Using metalorganic paste (Engelhard 8826) as a precursor, Jimenez et al. reported rhodium crystallite sizes equal to 58.5 ± 0.3 nm, calculated by the XRD patterns of the reduced sample [75]. The observed size variation and the Rh0: Rh oxide ratio was attributed to the different conditions of calcination and reduction conditions of the working Rh-catalyst electrode.
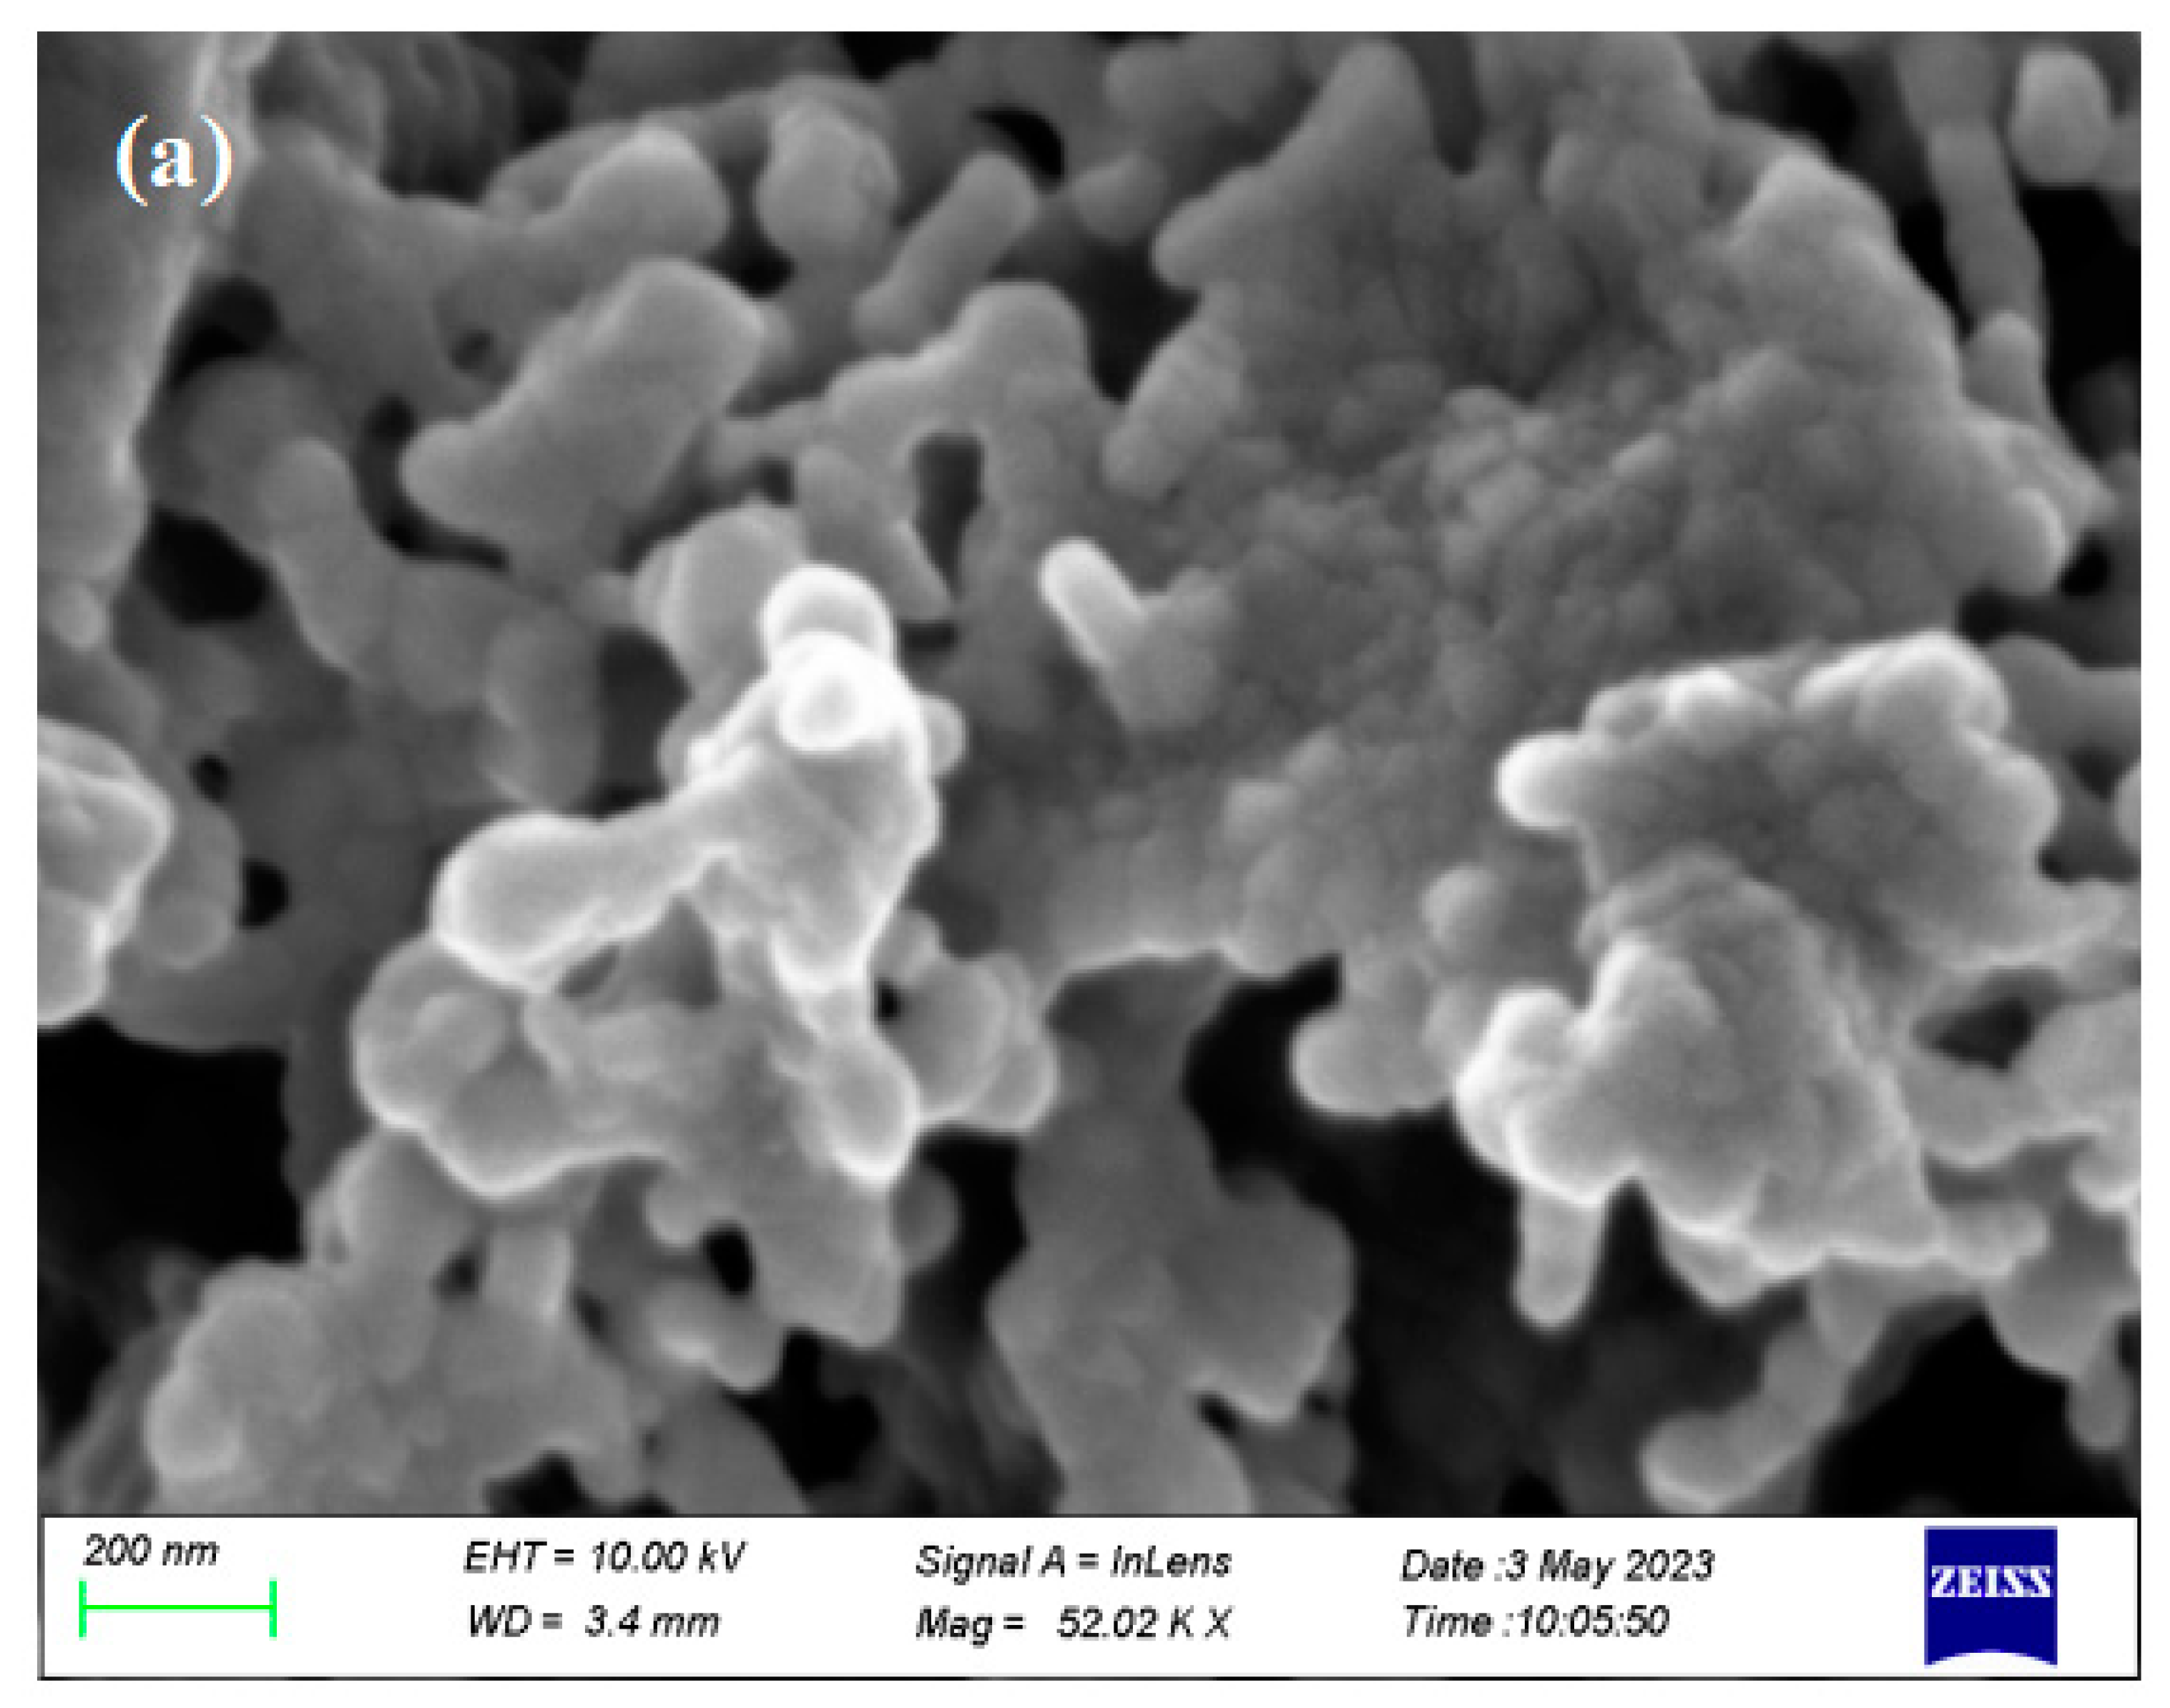
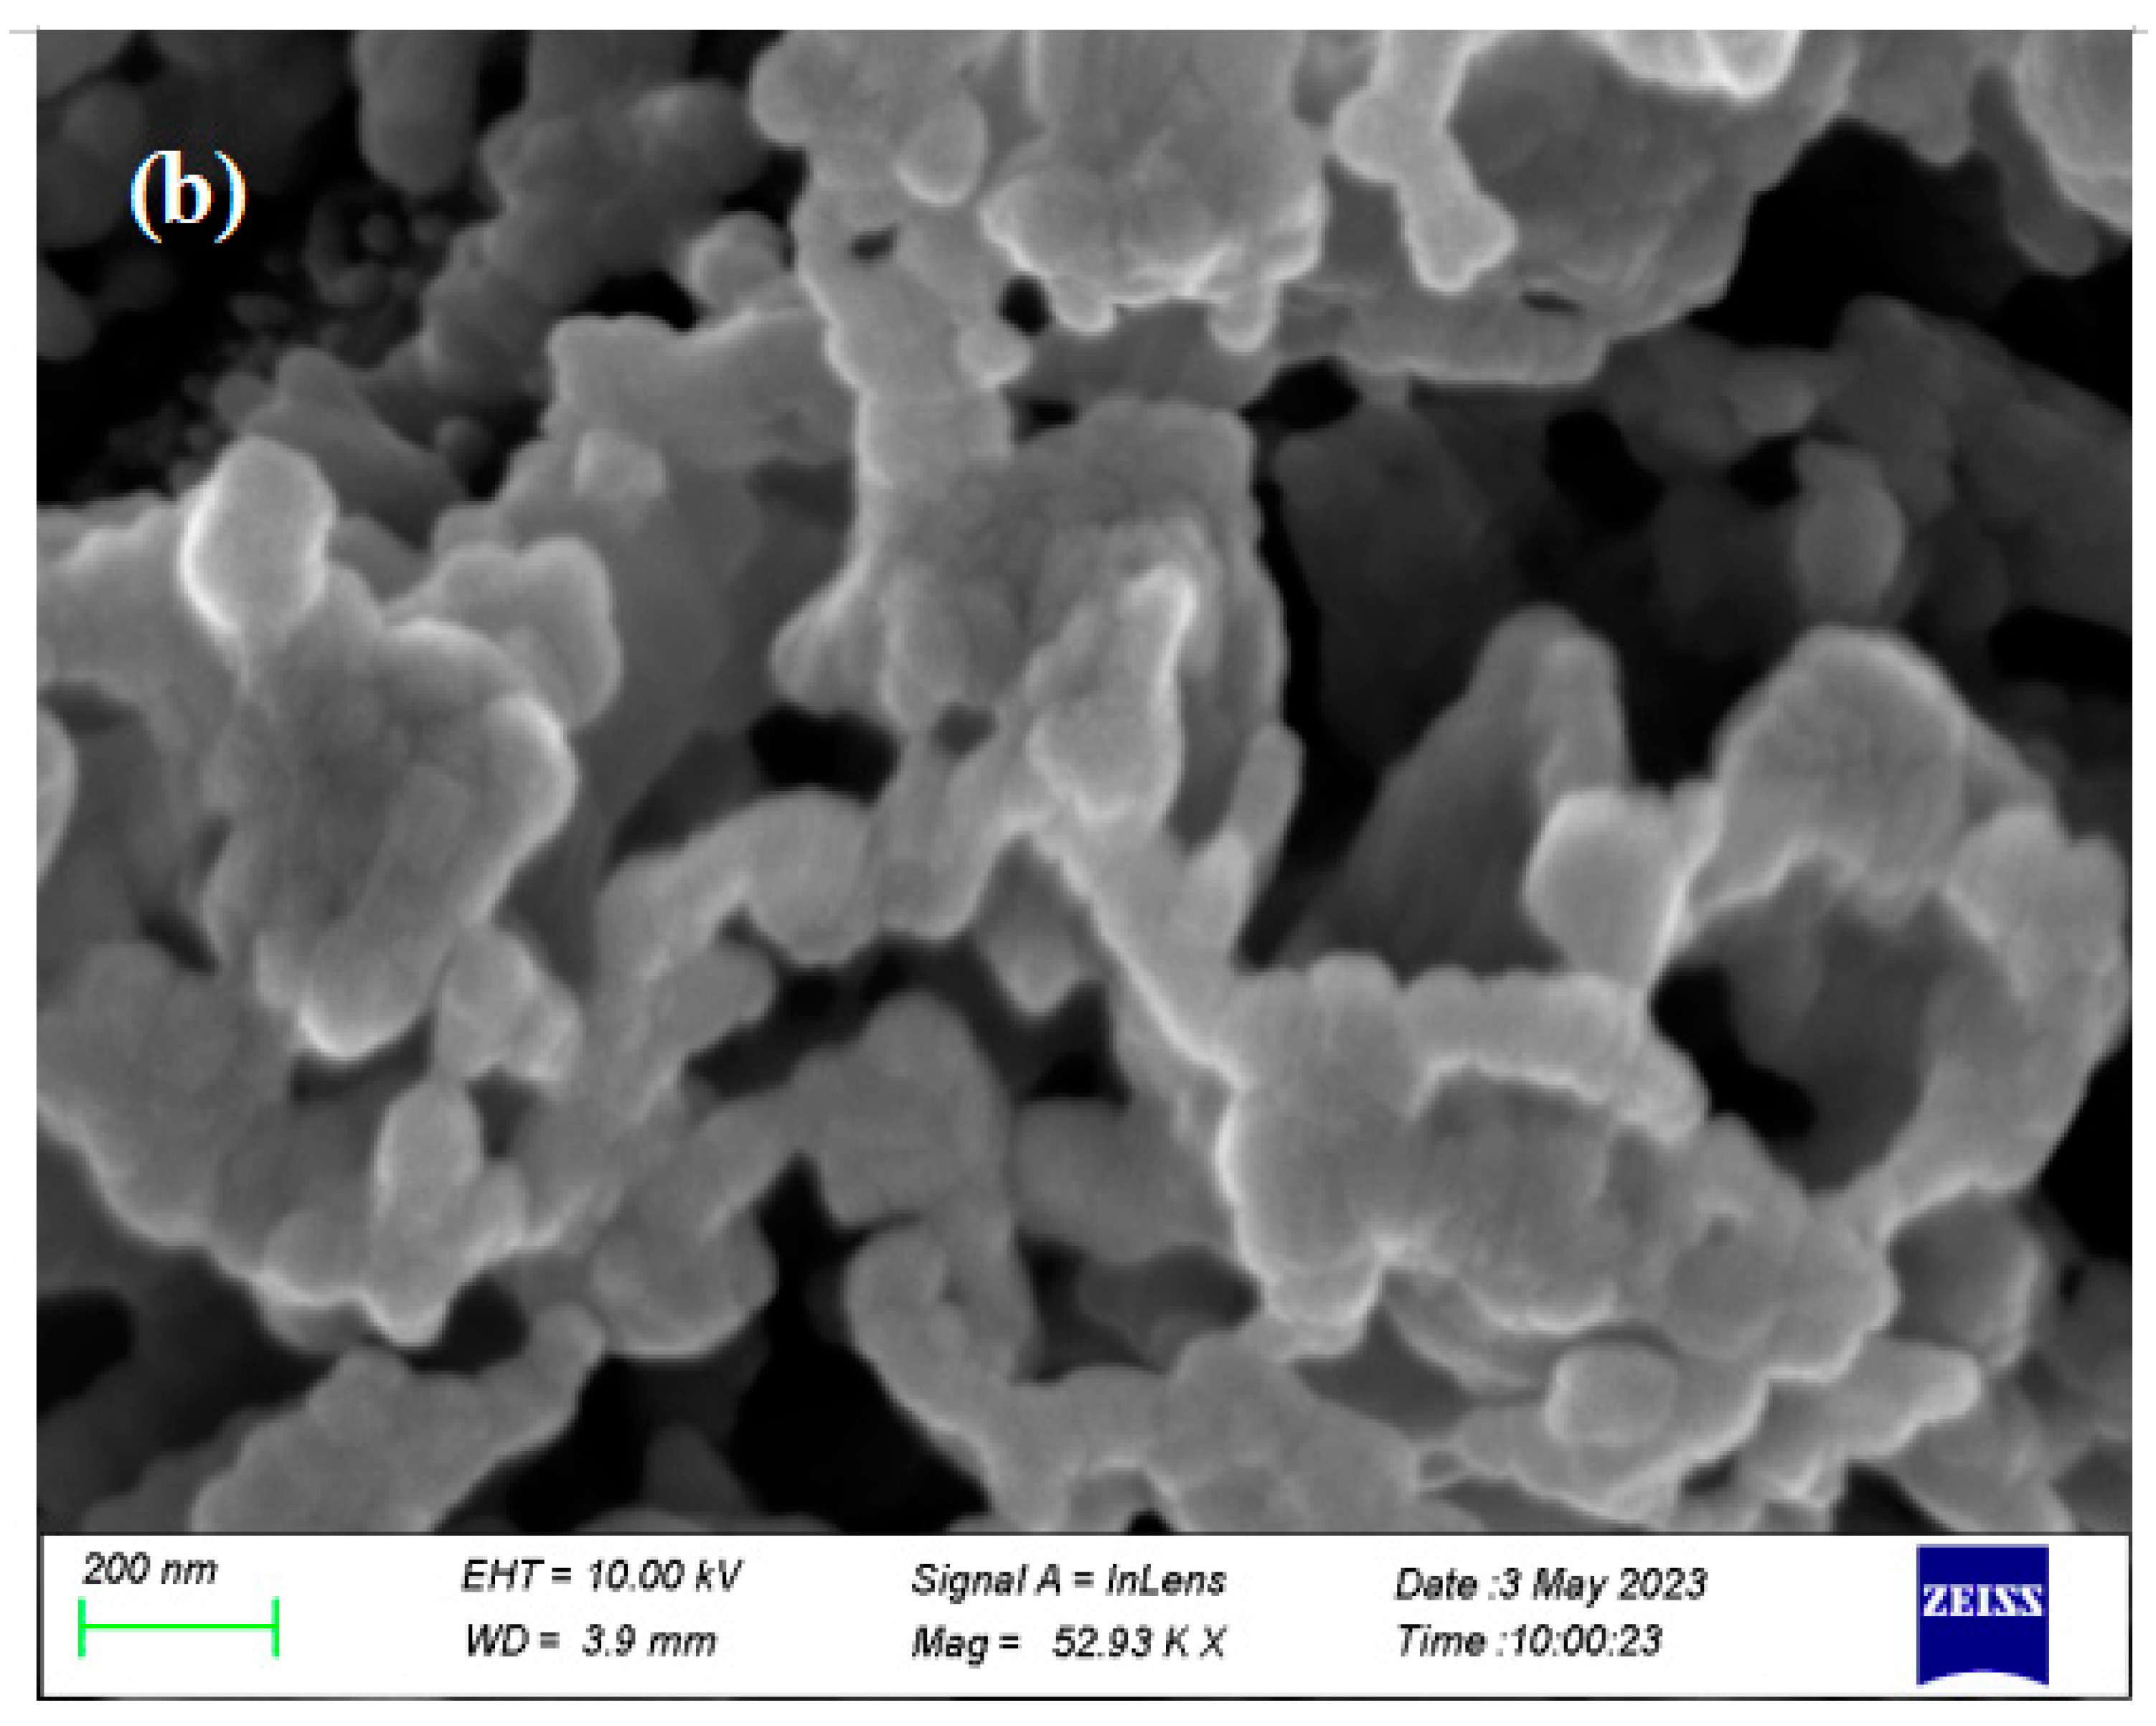
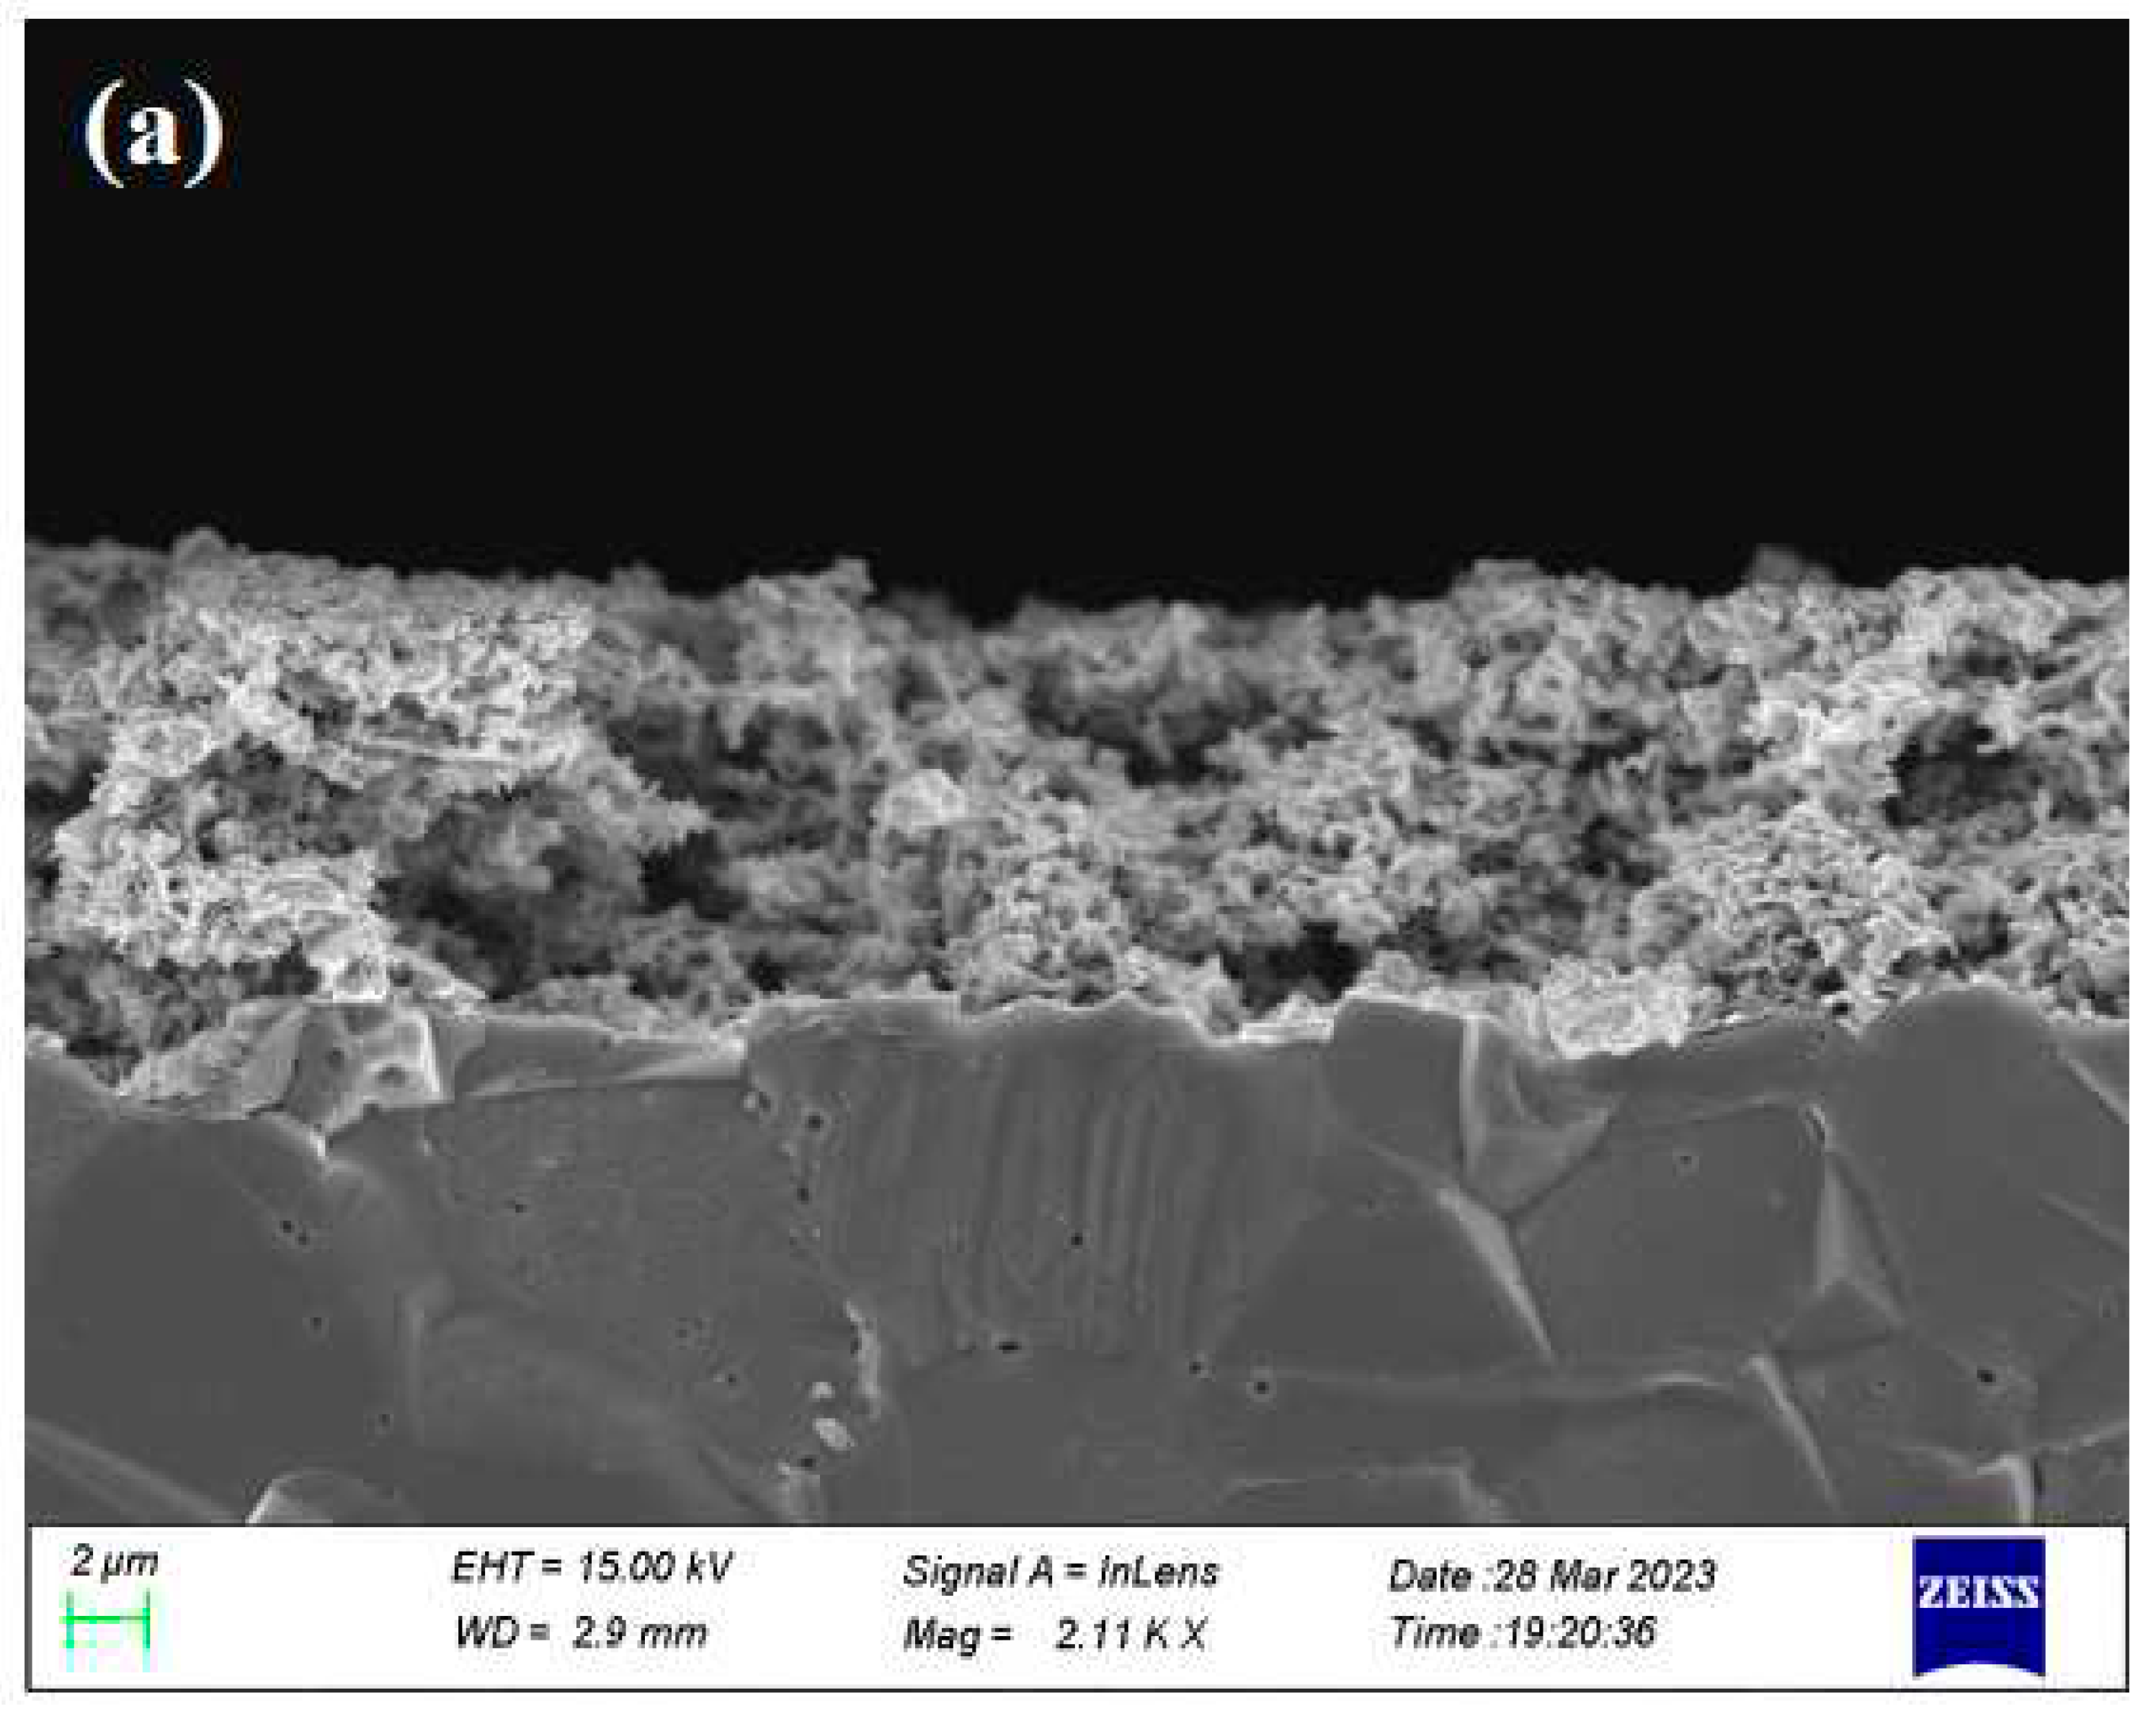
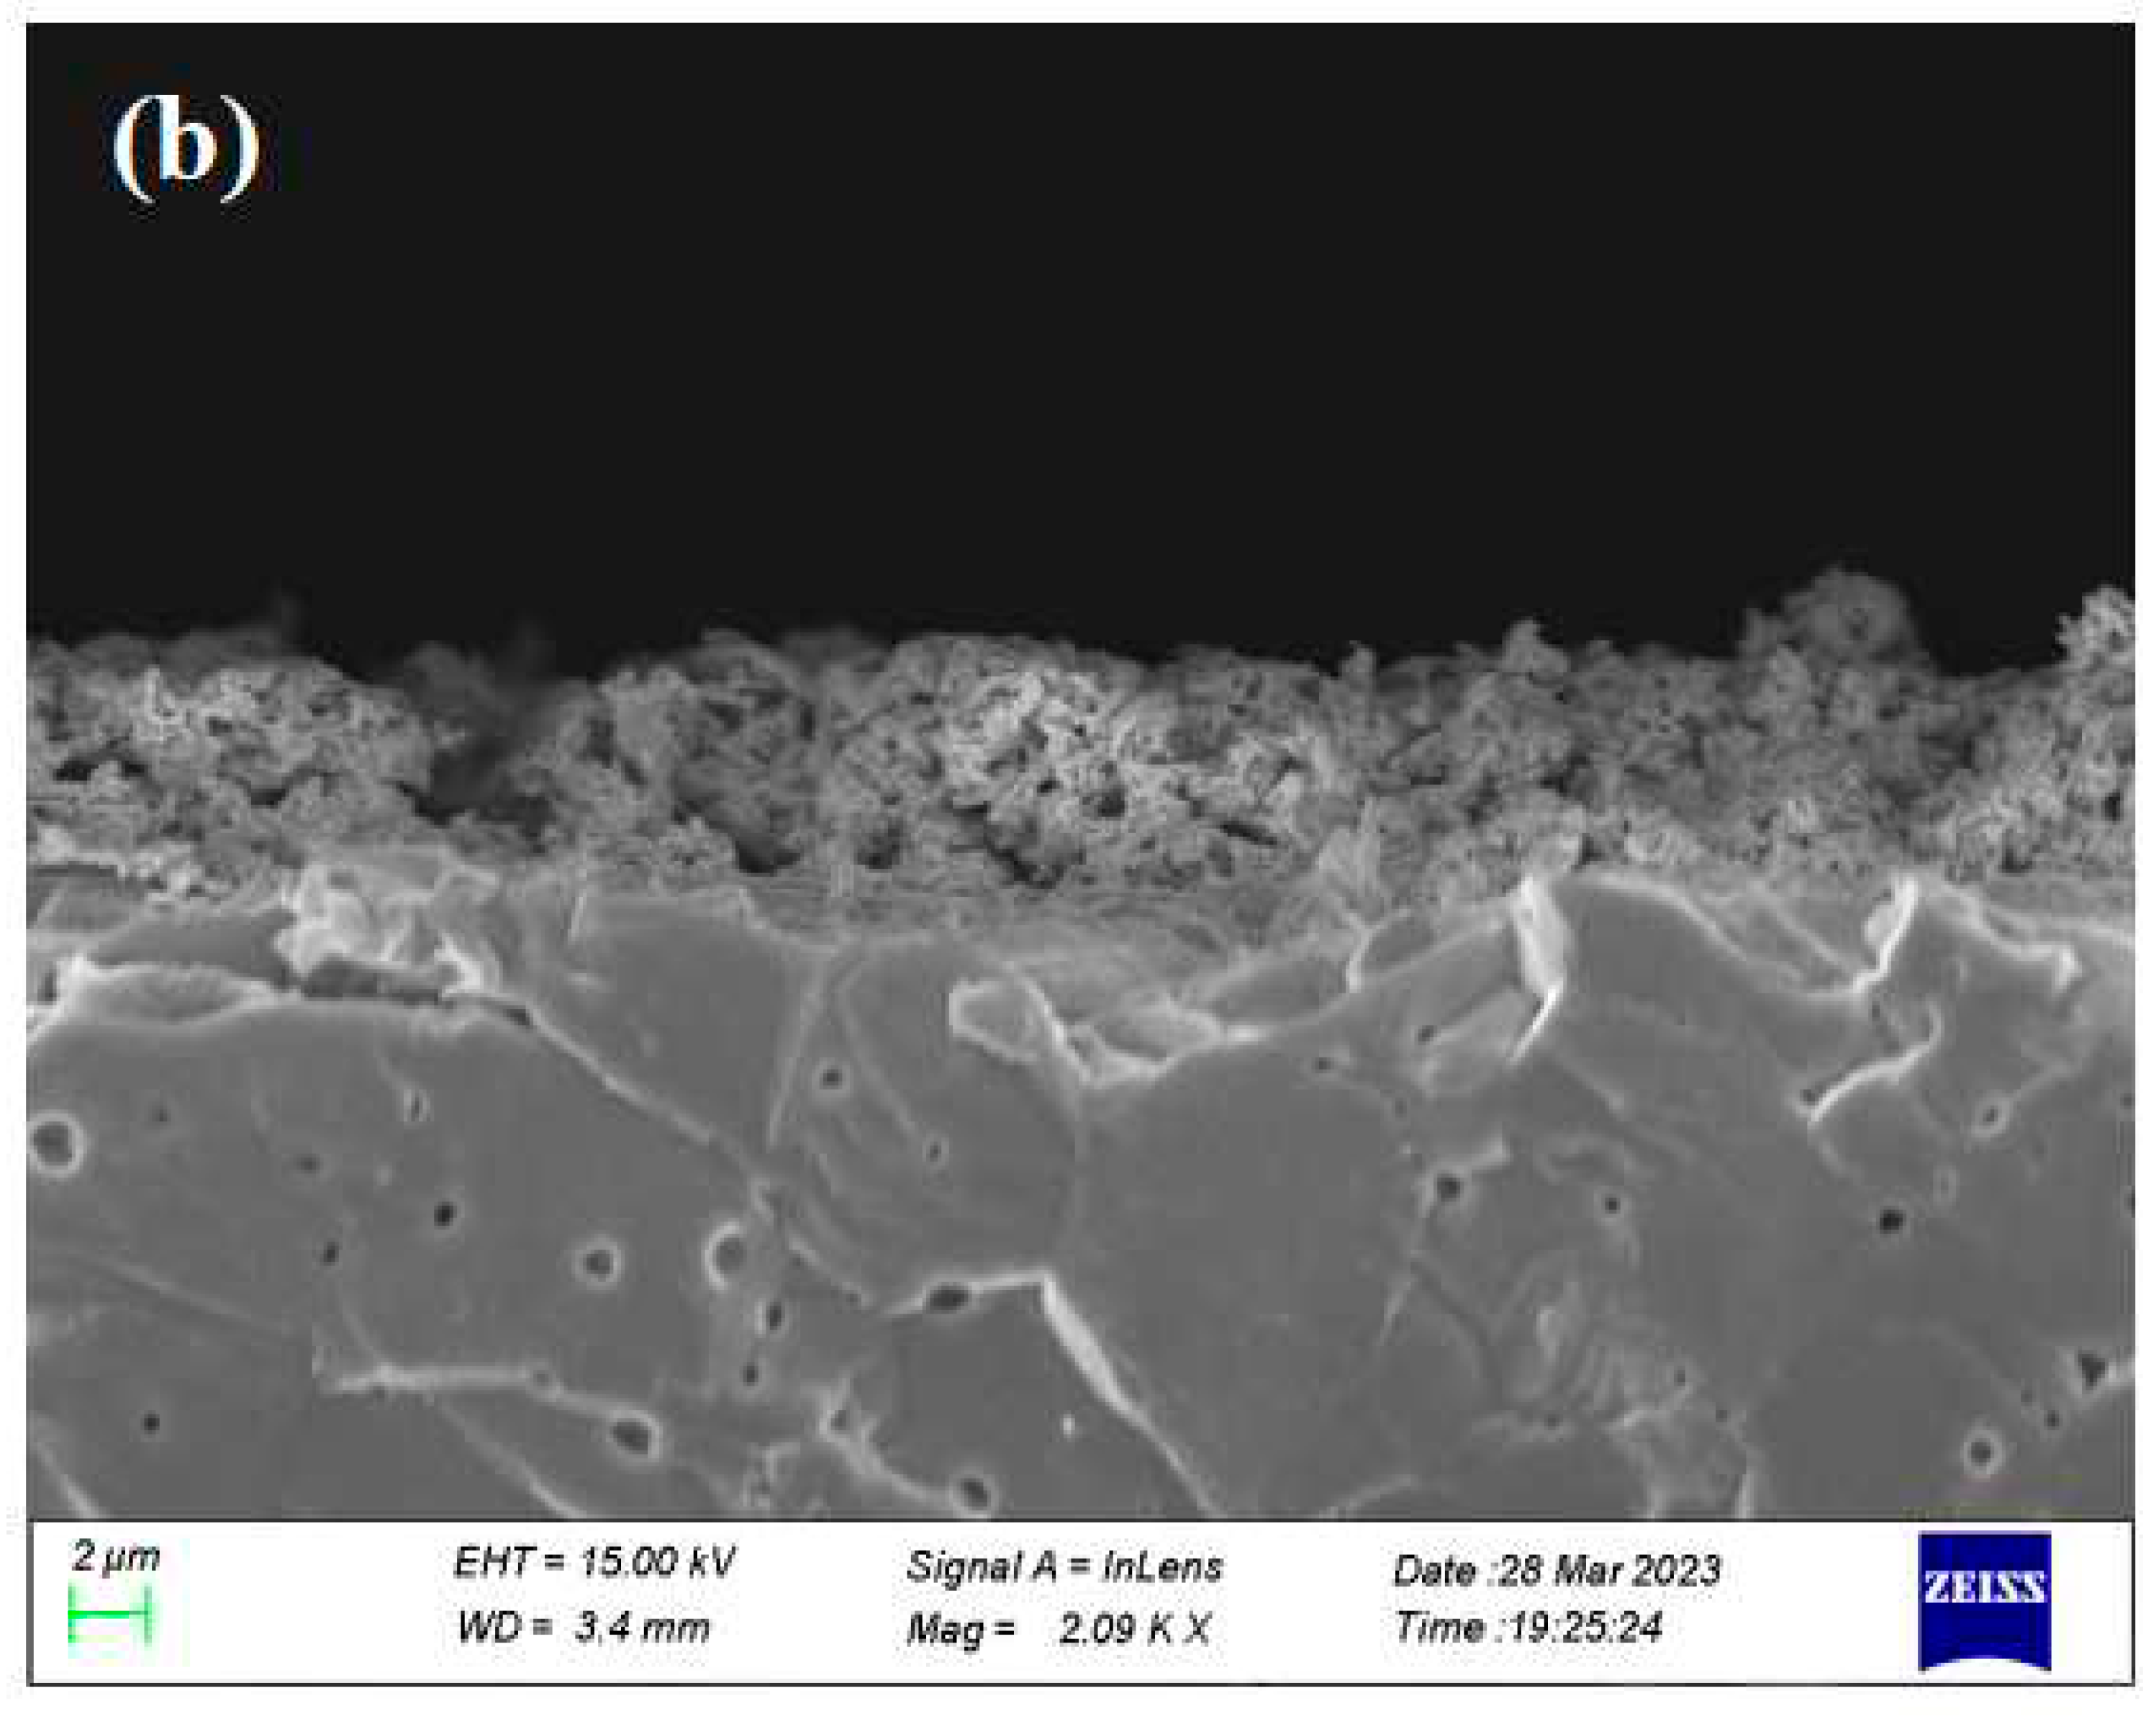
Top view and cross section SEM images of the fresh and used catalyst-film are shown in Figure 11 and Figure 12, respectively. Overall, the sample preparation method followed in this work has led to a continuous rhodium film, sufficiently porous which facilitates the efficient access of both reactants and products on the Rh active sites, and well attached to the YSZ support to ensure an electrochemically active interface. The apparent average particle size is estimated to be 40 nm, which is roughly twice the crystallite size calculated from the XRD spectra. It is worth mentioning here that particle size estimation from the SEM images is limited by the resolution of the instrument. Both the morphology and structure of the Rh film appears to be unchanged comparing the images from the sample prior experiment and after exposing it to reaction conditions. The thickness of the catalyst film was estimated from the cross section micrograph and was found to be in the range of 6.5-10 μm, which is a common thickness for films prepared by applying metalorganic pastes [59].
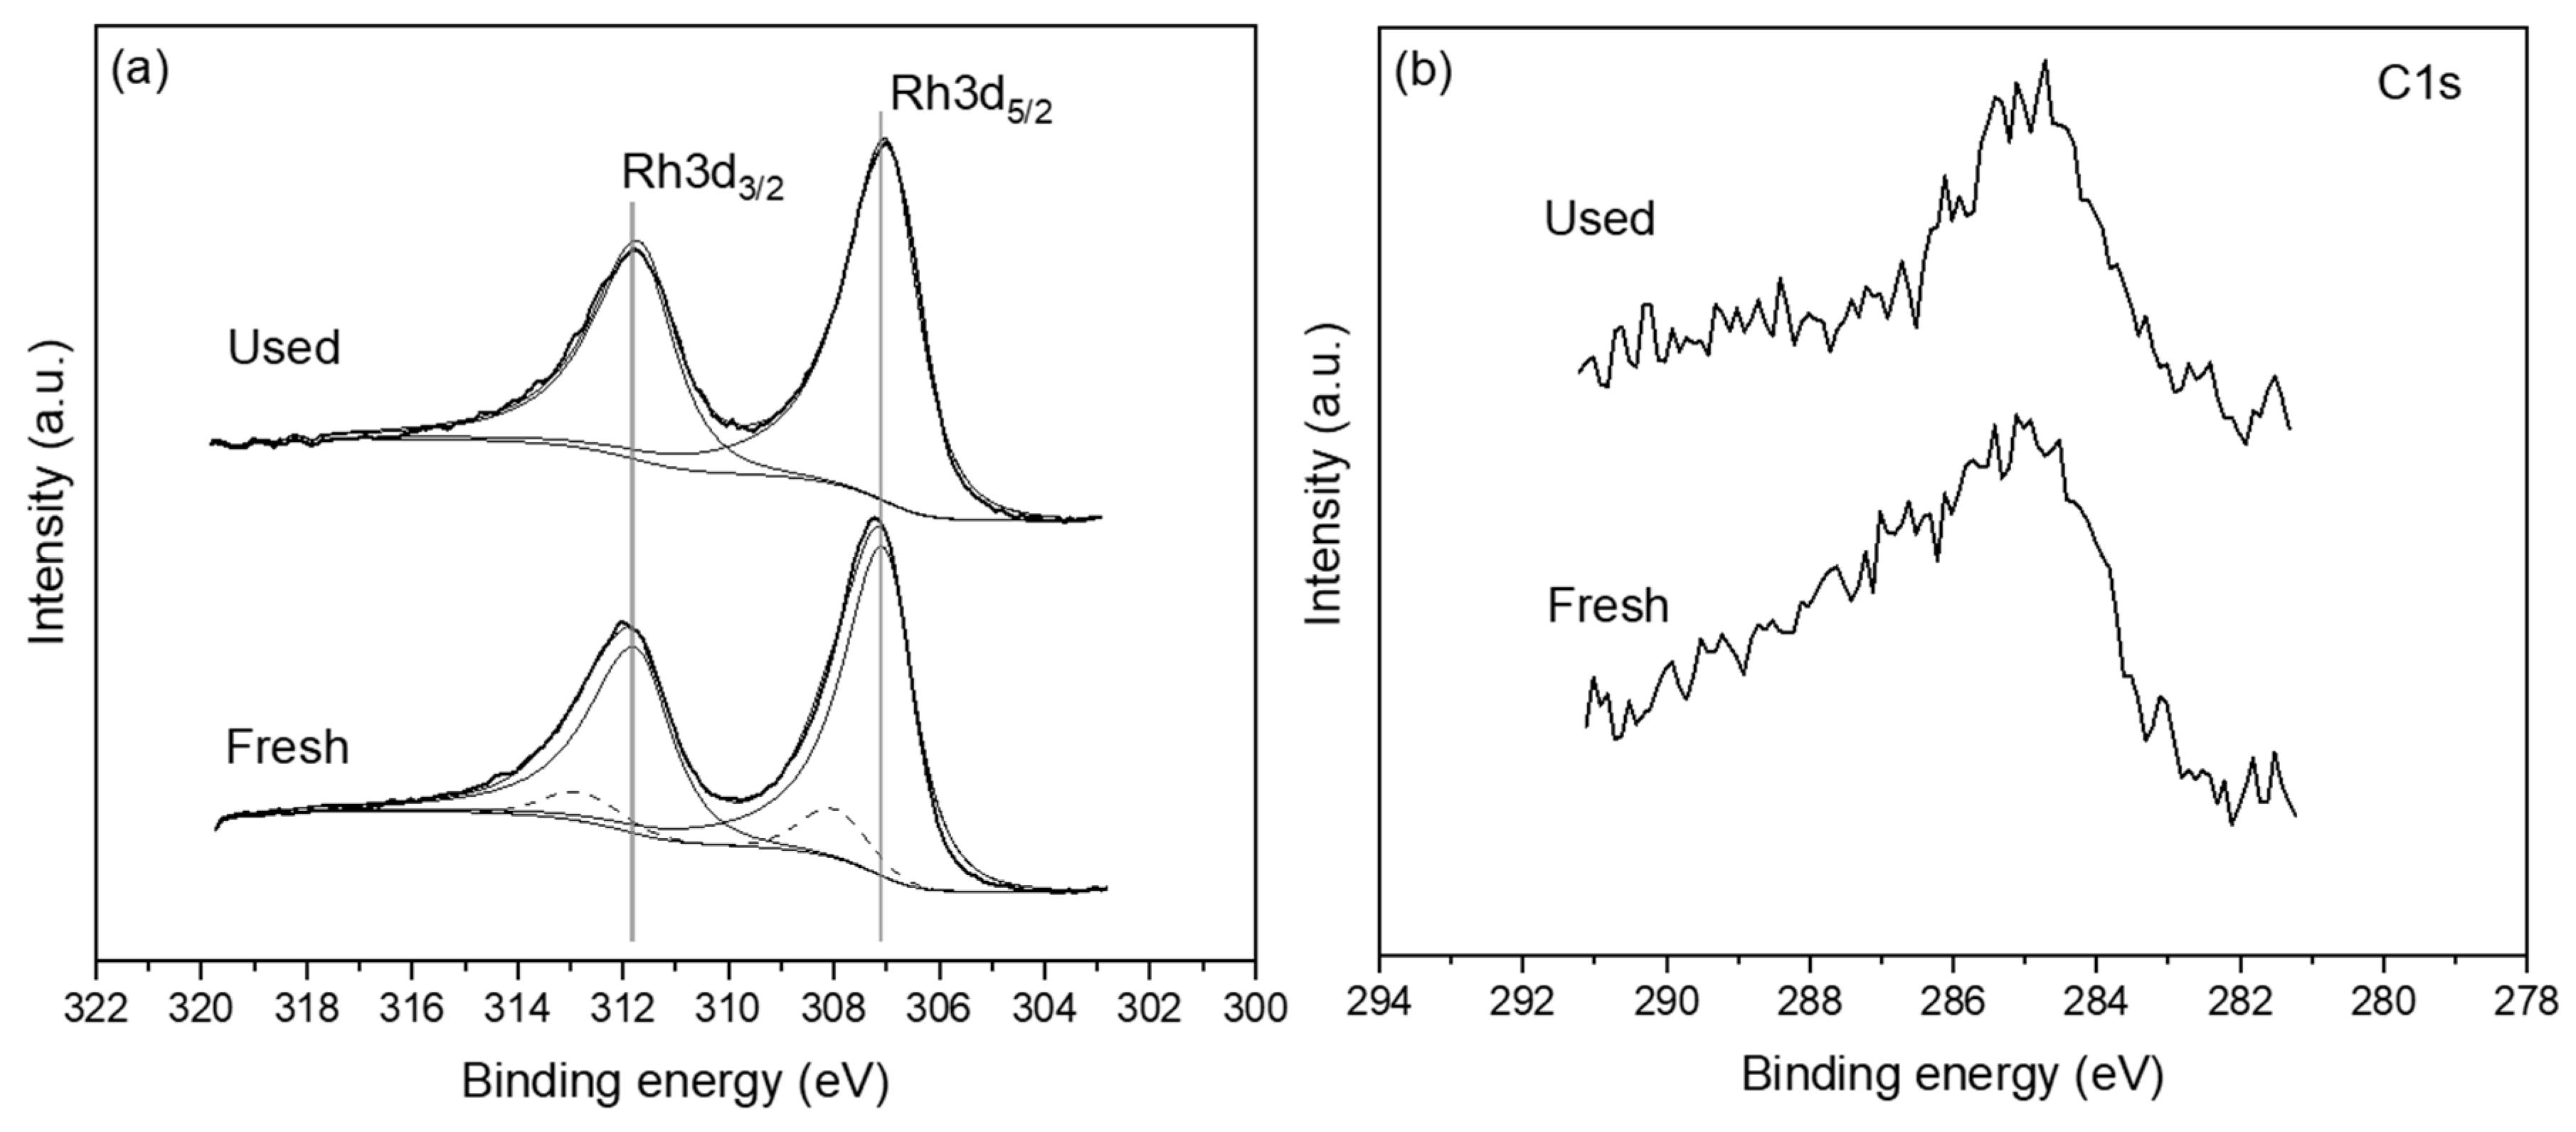
Figure 13a shows the Rh 3d spectra of the freshly reduced and post reaction (used) sample. The Rh 3d5/2 peak of the fresh sample is centred at approximately 307.2 eV which indicates that the Rh catalyst film is mostly in the metallic state, without excluding of course the possibility of some minor Rh oxide quantities being also present [76]. The post reaction data suggest that the surface chemical state of the Rh electrocatalyst film has not changed significantly. A rather small shift of ~0.2 eV towards lower binding energy is observed suggesting that a minor oxide component may be present in the fresh sample which has been reduced after reaction leading to the apparent shift. To clarify this point the raw Rh3d spectra were deconvoluted using an asymmetric peak shape for the metallic state and Gaussian-Lorentzian peak shape for the oxidized state. Figure 13a shows that the metallic Rh3d5/2 component (solid line) is centred at ~307 eV while the oxidized Rh3d5/2 component (dashed line) is centred at ~308 eV. The ratio of metallic Rh to oxidised Rh is 1:9 confirming that Rh film is nearly metallic both before and after reaction. It is worth noting here that the post reaction spectra have been acquired after testing the catalyst under reaction conditions of CO2 to H2 of 1:4. The XPS results are in close agreement with the XRD data presented above (Figure 10) with the two techniques suggesting the absence of any substantial quantity of Rh oxide on the surface or bulk of the Rh film. Minor quantities of carbon was present on both the fresh and used samples (Figure 13b). More crucially, the amount of carbon was not found to increase in the post reaction sample, which indicates that there is no carbon deposition on the catalyst surface during the reaction, especially under feed conditions of PCO2:PH2 ratios of 4:1.

3. Experimental

3.1. Catalyst Preparation

A disc of 8% mol Y2O3-stabilized ZrO2 (YSZ), with 17 mm diameter and 1.5 mm thickness, respectively was utilized as solid electrolyte. Gold (Au) reference and counter electrodes were deposited on one side of the electrolyte, using Au paste (Metalor A1118) and calcination at 450oC for 30 minutes following a sintering at 700oC for 1 h, with a heating rate of 10 oCmin-1.
The working electrode (Rh catalyst-electrode) was deposited on the opposite side of the YSZ solid electrolyte by application of thin coatings of Engelhard 8826 Rh paste. Calcination was carried out in air at 550oC for 3 h with a heating rate of 10 oCmin-1. Prior electrochemical experiments, the Rh catalyst-electrode was reduced at 440oC for 2 h under a flow of 15% H2 in He. The total mass of the Rh catalyst-electrode was 1.8 mg.

3.2. Reactor Operation

The electrocatalytic experiments were carried out in a continuous single pellet flow reactor, which has been discussed previously [59]. The feed gas composition and total flow rates were controlled by a set of electronic flow meters (Brooks). Reactants were certified standards of 5% CO2 in He and 15% H2 in He. Pure He (99.999%) was fed to further adjust the total flow rate and the inlet gas composition at the desired values. Electrochemical experiments were performed at ambient pressure. Feed reactant partial pressure was varied between 1 to 4 kPa CO2 and 1 to 7 kPa H2.
The concentrations of reactants and products were analysed with an IR CO2-CO-CH4 gas analyser (Futzi Electric ZRE). Constant currents and potentials were applied using an AMEL 2053 galvanostat-potensiostat. CO2, CO and CH4 were further analyzed by gas chromatography (Gas Chromatographer, Shimadzu 2014) with TCD and FID detectors, using a Porapak QS packed column.
Blank experiments have been carried out to confirm the non-catalytic behaviour of the Au counter and reference electrodes under open and closed-circuit conditions. For this purpose, an electrochemical cell of the type Au/YSZ/Au (replacing the Rh working electrode with Au) was investigated under reaction conditions of this study (T = 400oC, FT = 100 cm3 min-1 and different H2 to CO2 gas feeding ratios). The obtained CO formation rate on Au was small with values of rCO < 10-9 mols-1 and it was not affected by potential application. CH4 formation on Au was not observed.

3.3. Electrochemical Promotion Parameters Computation

Figure 14 shows a schematic representation of the (Rh|YSZ|Au) electrochemical cell under (a) open circuit and (b) closed circuit conditions. WE corresponds to the working electrode (Rh deposited catalytic active film), CE to the counter and RE to the reference electrodes both made out of Au in order to be catalytically inactive. All three electrodes are deposited on yttria-stabilized zirconia (YSZ) which serves as a solid O2- ion conductor at operating temperatures of 380 to 430oC. Under open circuit conditions (i.e., no current passing through the cell), H2 and CO2 are co-fed over the conductive catalyst film leading to the formation of CO and CH4, expressed by the unpromoted catalytic rate, ro. Under, for example, anodic polarization, the application of a positive potential between the counter and working electrode, O2– ions from the solid electrolyte are migrating to the catalyst-film forming at the metal gas interface an effective double layer, that alters the catalytic activity, and leading to the electropromoted rate, r.
The non-Faradaic behavior is defined by two basic parameters, the rate enhancement ratio, ρ,
ρ = r r o
where r is the electropromoted catalytic rate under polarization and ro is the unpromoted rate (i.e., the open-circuit catalytic rate). The apparent Faradaic efficiency, Λ , defined from:
Λ = Δ r I / n F
where Δ r is the current- or potential-induced observed change in catalytic rate ( Δ r = r     r o ), I is the applied current, n is the number of exchanged electrons and F is Faraday’s constant.
In this study, where CH4 and CO were the only products of the CO2 hydrogenation reaction, the Faradaic efficiency for each formation reaction can be defined from the follow equations:
Λ C O = 2 Δ r C O ( i n m o l s ) I / F
Λ C H 4 = 8 Δ r C H 4   ( i n m o l s ) I / F

3.4. Catalyst Characterization

Wide-angle X-ray diffraction (XRD) patterns were recorder using a Bruker D8 Advance system equipped with Cu-Ka radiation (λ= 1.5418 Å). The voltage and lamp current were adjusted to 40 kV and 40 mA, respectively. The angle range 2θ was 20o-90o and scan speed was 0.3 s/step.
High resolution field-emission scanning electron microscopy (FE-SEM) was employed using a Zeiss SUPRA 35VP system operating at 10–15 kV voltage range.
Ex situ X-ray Photoelectron Spectroscopy (XPS) measurements of the fresh Rh catalyst sample (after H2 reduction) and post experiment sample were carried out in an ultrahigh-vacuum (UHV) system described in detail elsewhere [56]. Measurements were carried out using non-monochromatic AlKα radiation (1486.6 eV) and a Leybold LH EA11 energy analyzer which was operated at a constant pass energy (100 eV). The analyzed sample area was a 2 × 5 mm2 rectangle. All spectra were corrected for charge transfer using the C1s peak at 284.8 eV for adventitious carbon.

4. Conclusions

In this work, the electrochemical promotion of CO2 hydrogenation was studied over a Rh/YSZ electrode in a continuous single pellet flow reactor for PCO2/PH2 gas feed mixtures ranging from 1:2 to 4:1. Despite the large body of literature on the use of Rh/YSZ electrodes for other reactions like NO reduction and ethylene oxidation under various experimental set-ups, CO2 hydrogenation has been rarely investigated on Rh/YSZ using laboratory reactors. There are only a couple of references discussing data under reaction conditions of a narrow CO2 to H2 ratio of 1-1.5 or 1:1.8 and cathodic polarizations. The results of the present study show that potential or current application can strongly affect the CO2 hydrogenation reaction, both in regard to the catalytic rates obtained but also selectivity to reactions products. In the temperature range of 350 to 430oC, under atmospheric total pressure and with a total flowrate of FT = 50 cm3min-1 the only products found were CH4 and CO. Increasing or decreasing the catalyst potential by up to 1.5 V leads to an inverted volcano type behavior of the methanation rate (the formation rate increases with anodic and cathodic polarization), while the rate of CO production follows a volcano type behavior (the formation rate decreases with anodic and cathodic polarization). The observed trends are confirmed by kinetic measurements and agree with the rules governing the EPOC phenomenon as described in bibliography.
The observed rate changes were non-faradaic and after current interruption, the catalytic rate of CH4 formation returned to its initial open circuit value, demonstrating the reversibility of the phenomenon. However, the CO formation rate, exhibited a partial non- reversible behaviour which is more pronounced under a gas feed composition of CO2 to H2 ratio of 4:1., i.e., in excess of CO2. Permanent EPOC behaviour was discussed in view of the stabilization of the Rh metallic phase under anodic polarization. Our preliminary XPS studies show, that for pre- and post reaction samples mainly the Rh metal phase is present, even after exposing the Rh film to higher CO2 to H2 ratios. This confirms, that at a first glance, the partially permanent EPOC behaviour in our case is due to the electrochemically induced stabilization of the Rh metallic phase.

Acknowledgments

NK thanks the National Scholarship Foundation (IKY) for financial support through the Program code: 5113934. Authors are thankful to Dr. Panagiota Natsi for XRD patterns, and FORTH ICE-HT for SEM images.

References

  1. Kinney, P.L. Interactions of Climate Change, Air Pollution, and Human Health. Curr Environ Health Rep 2018, 5, 179–186. [Google Scholar] [CrossRef]
  2. Berry, H.L.; Waite, T.D.; Dear, K.B.G.; Capon, A.G.; Murray, V. The Case for Systems Thinking about Climate Change and Mental Health. Nat Clim Chang 2018, 8, 282–290. [Google Scholar] [CrossRef]
  3. Kattel, S.; Liu, P.; Chen, J.G. Tuning Selectivity of CO2 Hydrogenation Reactions at the Metal/Oxide Interface. J Am Chem Soc 2017, 139, 9739–9754. [Google Scholar] [CrossRef]
  4. Knutson, T.R.; Tuleya, R.E. Impact of CO2-Induced Warming on Simulated Hurricane Intensity and Precipitation: Sensitivity to the Choice of Climate Model and Convective Parameterization; J. of Climate 2004, 17/18, 3477-3495.
  5. Schwiderowski, P.; Ruland, H.; Muhler, M. Current Developments in CO2 Hydrogenation towards Methanol: A Review Related to Industrial Application. Curr Opin Green Sustain Chem 2022, 38. [Google Scholar] [CrossRef]
  6. Xu, D.; Wang, Y.; Ding, M.; Hong, X.; Liu, G.; Tsang, S.C.E. Advances in Higher Alcohol Synthesis from CO2 Hydrogenation. Chem 2021, 7, 849–881. [Google Scholar] [CrossRef]
  7. Chatzilias, C.; Martino, E.; Zagoraios, D.; Kyriakou, G.; Katsaounis, A. Electrochemical Promotion of Catalysis for CO2 Valorization. In: Vernoux, P., Vayenas, C.G. (eds) Recent Advances in Electrochemical Promotion of Catalysis. Modern Aspects of Electrochemistry, 2022, Vol 61, Springer, Cham.
  8. Nozaki, F.; Sodesawa, T.; Satoh, S.; Kimura, K. Hydrogenation of Carbon Dioxide into Light Hydrocarbons at Atmospheric Pressure over Rh/Nb205 or Cu/Si02-Rh/Nb205. J Catal 1987, 104, 339–346. [Google Scholar] [CrossRef]
  9. Solymosi, F.; Pasztor, M. Analysis of the R-Spectral Behavior of Adsorbed CO Formed in H2 + CO2 Surface Interaction over Supported Rhodium. J Catal 1987, 104, 312–322. [Google Scholar] [CrossRef]
  10. Lapidus, A.L.; Gaidai, N.A.; Nekrasov, N. V.; Tishkova, L.A.; Agafonov, Y.A.; Myshenkova, T.N. The Mechanism of Carbon Dioxide Hydrogenation on Copper and Nickel Catalysts. Petroleum Chemistry 2007, 47, 91–98. [Google Scholar] [CrossRef]
  11. Borodko, Y.; Somorjai, G.A. Catalytic Hydrogenation of Carbon Oxides-a 10-Year Perspective; 1999, 186, 1–2, 355-362.
  12. Kusama, H.; Kitamura Bando, K.; Okabe, K.; Arakawa, H. Effect of Metal Loading on CO 2 Hydrogenation Reactivity over Rh/SiO 2 Catalysts. Appl Catal 2000, 197, 255–268. [Google Scholar] [CrossRef]
  13. Gasser, D.; Baiker, A. Hydrogenation of Carbon Dioxide over Copper-Zirconia Catalysts Prepared by In-Situ Activation of Amorphous Copper-Zirconium Alloy; Appl Catal 1989, 48, 279–294.
  14. Amenomiya, Y. Methanol synthesis from CO+H2. II Copper-based binary and ternary catalysts. Appl Catal 1987, 30, 57–68.
  15. Sahibzada, M.; Chadwick, D.; Metcalfe, I.S. Hydrogenation of Carbon Dioxide to Methanol over Palladium-Promoted Cu/ZnO/A1203 Catalysts. Catalysis Today 1996, 29, 367–372. [Google Scholar] [CrossRef]
  16. Solymosi, F.; Erdhelyi, A.; Bansagi, T. Methanation of CO, on Supported Rhodium Catalyst. J Catal 1981, 68, 371–382. [Google Scholar] [CrossRef]
  17. Yang, R.; Zhang, Y.; Tsubaki, N. Dual Catalysis Mechanism of Alcohol Solvent and Cu Catalyst for a New Methanol Synthesis Method. Catal Commun 2005, 6, 275–279. [Google Scholar] [CrossRef]
  18. Schild, C.; Wokaun, A.; Baiker, A. On the Mechanism of CO and CO2 Hydrogenation Reactions on Zirconia-Supported Catalysts: A Diffuse Reflectance FTIR Study Part II. Surface Species on Copper/Zirconia Catalysts: Implications for Methanol Synthesis Selectivity. J Mol Catal 1990, 63, 243–254. [Google Scholar] [CrossRef]
  19. Vannice, M.A. The Catalytic Synthesis of Hydrocarbons from HJCO Mixtures over the Group VIII Metals I. The Specific Activities and Product Distributions of Supported Metals. J Catal 1975, 31, 449–461. [Google Scholar] [CrossRef]
  20. Araki, R.; Ponec, V. Methanation of Carbon Monoxide on Nickel and Nickel-Copper Alloys. J Catal 1976, 44, 439–448. [Google Scholar] [CrossRef]
  21. Panagiotopoulou, P.; Kondarides, D.I.; Verykios, X.E. Selective Methanation of CO over Supported Noble Metal Catalysts: Effects of the Nature of the Metallic Phase on Catalytic Performance. Appl Catal A Gen 2008, 344, 45–54. [Google Scholar] [CrossRef]
  22. Henderson, A.; Worley, S.D.; Peebles, D.E. An Infrared Study of the Hydrogenation of Carbon Dioxide on Supported Rhodium Catalys An inverse spillover effect. J. Phys. Chem. 1985, 89, 392–394. [Google Scholar] [CrossRef]
  23. Solymosi, F.; Tombacz, I.; Koszta, J. Effects of Variation of Electric Properties of TiOp Support on Hydrogenation of CO and CO2 over Rh Catalysts. J. Catal. 1985, 95, 578–586. [Google Scholar] [CrossRef]
  24. Brown Bourzutschky, J.A.; Homs, N.; Bell, A.A.T. Hydrogenation of 002 and 002/00 Mixtures over Copper-Containing Catalysts. J Catal 1990, 124, 73–85. [Google Scholar] [CrossRef]
  25. Chanchlani, K.G.; Hudgins, R.R.; Silveston, P.L. Methanol Synthesis from H2, CO, and 002 over Cu/ZnO Catalysts. J Catal 1992, 136, 59–75. [Google Scholar] [CrossRef]
  26. Nitta, Y.; Suwata, O.; Ikeda, Y.; Okamoto, Y.; Imanaka, T. Copper-Zirconia Catalysts for Methanol Synthesis from Carbon Dioxide: Effect of ZnO Addition to Cu-ZrO2 Catalysts. Catal Lett 1994, 26, 345–354. [Google Scholar] [CrossRef]
  27. Arena, F.; Italiano, G.; Barbera, K.; Bordiga, S.; Bonura, G.; Spadaro, L.; Frusteri, F. Solid-State Interactions, Adsorption Sites and Functionality of Cu-ZnO/ZrO2 Catalysts in the CO2 Hydrogenation to CH3OH. Appl Catal A Gen 2008, 350, 16–23. [Google Scholar] [CrossRef]
  28. Reubroycharoen, P.; Vitidsant, T.; Yoneyama, Y.; Tsubaki, N. Development of a New Low-Temperature Methanol Synthesis Process. Catal Today 2004, 89, 447–454. [Google Scholar] [CrossRef]
  29. Hori, Y.; Wakebe, H.; Tsukamoto, T.; Koga, O. Adsorption of CO Accompanied with Simultaneous Charge Transfer on Copper Single Crystal Electrodes Related with Electrochemical Reduction of CO2 to Hydrocarbons. Surface Science 1995, 335, 258–260. [Google Scholar] [CrossRef]
  30. Ando, H.; Xu, Q.; Fujiwara, M.; Matsumura, Y.; Tanaka, M.; Souma, Y. Hydrocarbon Synthesis from CO 2 over Fe±Cu Catal Tod 1998, 45, 229–234.
  31. Trovarelli, A.; Mustazza, C.; Dolcetti, G.; Kagpar, J.; Graziani, M. Carbon dioxide hydrogenation on rhodium supported on transition metal oxides. Effect of reduction temperature on product distribution. Appl Catal 1990, 65, 129–142. [Google Scholar] [CrossRef]
  32. Marwood, M.; Doepper, R.; Renken, A. In-Situ Surface and Gas Phase Analysis for Kinetic Studies under Transient Conditions:The Catalytic Hydrogenation of CO2. Appl Catal 1997, 151, 223–246. [Google Scholar] [CrossRef]
  33. Falconer, J.L. and Zagli, A.E. Adsorption and Methanation of Carbon Dioxide on a Nickel/Silica Catalyst. J Catal 1980, 62, 280–285. [Google Scholar] [CrossRef]
  34. 34. Biloen,’, P.; Helle, J.N.; Van Den Berg, F.G.A.; Sachtler, W.M.H. On the Activity of Fischer-Tropsch and Methanation Catalysts: A Study Utilizing Isotopic Transients. J Catal 1983, 81, 450–463. [CrossRef]
  35. Coenen, J.W.E.; Van Nisselrooy, P.F.M.T.; De Croon, M.H.J.M.; Dooren, P.F.H.A. Van; Van Meerten, R.Z.C. The dynamics of methanation of carbon modoxide on Nickel catalysts. Appl Catal 1986, 25, 1–8. [Google Scholar] [CrossRef]
  36. Zheng, Y.; Zhang, J.; Ma, Z.; Zhang, G.; Zhang, H.; Fu, X.; Ma, Y.; Liu, F.; Liu, M.; Huang, H. Seeded Growth of Gold–Copper Janus Nanostructures as a Tandem Catalyst for Efficient Electroreduction of CO2 to C2+ Products. Small 2022, 18, 2201695. [Google Scholar] [CrossRef]
  37. Zhong, Y.; Kong, X.; Song, Z.; Liu, Y.; Peng, L.; Zhang, L.; Luo, X.; Zeng, J.; Geng, Z. Adjusting Local CO Confinement in Porous-Shell Ag@Cu Catalysts for Enhancing C-C Coupling toward CO2Eletroreduction. Nano Lett 2022, 22, 2554–2560. [Google Scholar] [CrossRef]
  38. Theleritis, D.; Souentie, S.; Siokou, A.; Katsaounis, A.; Vayenas, C.G. Hydrogenation of CO 2 over Ru/YSZ Electropromoted Catalysts. ACS Catal 2012, 2, 770–780. [Google Scholar] [CrossRef]
  39. Theleritis, D.; Makri, M.; Souentie, S.; Caravaca, A.; Katsaounis, A.; Vayenas, C.G. Comparative Study of the Electrochemical Promotion of CO2 Hydrogenation over Ru-Supported Catalysts Using Electronegative and Electropositive Promoters. ChemElectroChem 2014, 1. [Google Scholar] [CrossRef]
  40. Kalaitzidou, I.; Katsaounis, A.; Norby, T.; Vayenas, C.G. Electrochemical Promotion of the Hydrogenation of CO2 on Ru Deposited on a BZY Proton Conductor. J Catal 2015, 331, 98–109. [Google Scholar] [CrossRef]
  41. Makri, M.; Katsaounis, A.; Vayenas, C.G. Electrochemical Promotion of CO2 Hydrogenation on Ru Catalyst-Electrodes Supported on a K-Β″-Al2O3 Solid Electrolyte. Electrochim Acta 2015, 179, 556–564. [Google Scholar] [CrossRef]
  42. Kalaitzidou, I.; Makri, M.; Theleritis, D.; Katsaounis, A.; Vayenas, C.G. Comparative Study of the Electrochemical Promotion of CO2 Hydrogenation on Ru Using Na+, K+, H+ and O2- Conducting Solid Electrolytes. Surf Sci 2016, 646, 194–203. [Google Scholar] [CrossRef]
  43. Makri, M.; Symillidis, A.; Grigoriou, D.; Katsaounis, A.; Vayenas, C.G. Electrochemical Promotion of CO 2 Reduction on a Dispersed Ru/YSZ Catalyst Supported on YSZ Solid Electrolyte; 2018, 5, 27617–27625.
  44. Panaritis, C.; Michel, C.; Couillard, M.; Baranova, E.A.; Steinmann, S.N. Elucidating the Role of Electrochemical Polarization on the Selectivity of the CO2 Hydrogenation Reaction over Ru. Electrochim Acta 2020, 350, 136405. [Google Scholar] [CrossRef]
  45. Panaritis, C.; Zgheib, J.; Ebrahim, S.A.H.; Couillard, M.; Baranova, E.A. Electrochemical In-Situ Activation of Fe-Oxide Nanowires for the Reverse Water Gas Shift Reaction. Appl Catal B 2020, 269, 118826. [Google Scholar] [CrossRef]
  46. Zagoraios, D.; Panaritis, C.; Krassakopoulou, A.; Baranova, E.A.; Katsaounis, A.; Vayenas, C.G. Electrochemical Promotion of Ru Nanoparticles Deposited on a Proton Conductor Electrolyte during CO2 Hydrogenation. Appl Catal B 2020, 276, 119148. [Google Scholar] [CrossRef]
  47. Chatzilias, C.; Martino, E.; Vayenas, C.G.; Kyriakou, G.; Katsaounis, A. A Low Temperature SOFC as a Self-Promoted Reactor for CO2 Catalytic Hydrogenation. Appl Catal B 2022, 317, 121778. [Google Scholar] [CrossRef]
  48. Chatzilias, C.; Martino, E.; Tsatsos, S.; Kyriakou, G.; Katsaounis, A.; Vayenas, C.G. Kinetic Study of CO2 Hydrogenation on Ru/ YSZ Catalyst Using a Monolithic Electropromoted Reactor (MEPR). Chemical Engineering Journal 2022, 430, 132967. [Google Scholar] [CrossRef]
  49. Chatzilias, C.; Martino, E.; Katsaounis, A.; Vayenas, C.G. Electrochemical Promotion of CO2 Hydrogenation in a Monolithic Electrochemically Promoted Reactor (MEPR). Appl Catal B 2021, 284, 119695. [Google Scholar] [CrossRef]
  50. Bebelis, S.; Karasali, H.; Vayenas, C.G. Electrochemical Promotion of CO2 Hydrogenation on Rh/YSZ Electrodes. J Appl Electrochem 2008, 38, 1127–1133. [Google Scholar] [CrossRef]
  51. Papaioannou, E.I.; Souentie, S.; Hammad, A.; Vayenas, C.G. Electrochemical Promotion of the CO2 Hydrogenation Reaction Using Thin Rh, Pt and Cu Films in a Monolithic Reactor at Atmospheric Pressure. Catal Today 2009, 146, 336–344. [Google Scholar] [CrossRef]
  52. Jiménez, V.; Jiménez-Borja, C.; Sánchez, P.; Romero, A.; Papaioannou, E.I.; Theleritis, D.; Souentie, S.; Brosda, S.; Valverde, J.L. Electrochemical Promotion of the Co2 Hydrogenation Reaction on Composite Ni or Ru Impregnated Carbon Nanofiber Catalyst-Electrodes Deposited on YSZ. Appl Catal B 2011, 107, 210–220. [Google Scholar] [CrossRef]
  53. Kotsiras, A.; Kalaitzidou, I.; Grigoriou, D.; Symillidis, A.; Makri, M.; Katsaounis, A.; Vayenas, C.G. Electrochemical Promotion of Nanodispersed Ru-Co Catalysts for the Hydrogenation of CO2. Appl Catal B 2018, 232, 60–68. [Google Scholar] [CrossRef]
  54. Grigoriou, D.; Zagoraios, D.; Katsaounis, A.; Vayenas, C.G. The Role of the Promoting Ionic Species in Electrochemical Promotion and in Metal-Support Interactions. Catal Today 2021, 363, 122–127. [Google Scholar] [CrossRef]
  55. Panaritis, C.; Zgheib, J.; Ebrahim, S.A.H.; Couillard, M.; Baranova, E.A. Electrochemical In-Situ Activation of Fe-Oxide Nanowires for the Reverse Water Gas Shift Reaction. Appl Catal B 2020, 269. [Google Scholar] [CrossRef]
  56. Zagoraios, D.; Tsatsos, S.; Kennou, S.; Vayenas, C.G.; Kyriakou, G.; Katsaounis, A. Tuning the RWGS Reaction via EPOC and in Situ Electro-Oxidation of Cobalt Nanoparticles. ACS Catal 2020, 14916–14927. [Google Scholar] [CrossRef]
  57. Zagoraios, D.; Kokkinou, N.; Kyriakou, G.; Katsaounis, A. Electrochemical Control of the RWGS Reaction over Ni Nanoparticles Deposited on Yttria Stabilized Zirconia. Catal Sci Technol 2022, 12, 1869–1879. [Google Scholar] [CrossRef]
  58. Nicole, J.; Comninellis, C.; Tsiplakides, D.; Pliangos, C.; Verykios, X.E.; Vayenas, C.G. Electrochemical Promotion and Metal-Support Interactions. J Catal 2001, 204, 23–34. [Google Scholar] [CrossRef]
  59. Janek, J. C.G. Vayenas, S. Bebelis, C. Pliangos, S. Brosda, D. Tsiplakides: Electrochemical Activation of Catalysis: Promotion, Electrochemical Promotion, and Metal-Support Interaction. Journal of Solid State Electrochemistry 2002, 7, 60–61. [Google Scholar] [CrossRef]
  60. Stoukides, M.; Vayenas, C.G. The Effect of Electrochemical Oxygen Pumping on the Rate and Selectivity of Ethylene Oxidation on Polycrystalline Silver. J Catal 1981, 70, 137–146. [Google Scholar] [CrossRef]
  61. Vayenas, C.G.; Koutsodontis, C.G. Non-Faradaic Electrochemical Activation of Catalysis. Journal of Chemical Physics 2008, 128, 182506. [Google Scholar] [CrossRef]
  62. Vayenas, C.G.; Bebelis, S.; Ladas, S. Dependence of Catalytic Rates on Catalyst Work Function. Nature 1990, 343, 625–627. [Google Scholar] [CrossRef]
  63. Bebelis, S.; Vayenas’, C.G. Non-Faradaic Electrochemical Modification of Catalytic Activity 1. The Case of Ethylene Oxidation on Pt; 1989, 118, 125–146.
  64. Vayenas, C.G.; Bebelis, S.; Despotopoulou, M. Non-Faradaic Electrochemical Modification of Catalytic Activity 4. The Use of Β″-Al2O3 as the Solid Electrolyte. J Catal 1991, 128, 415–435. [Google Scholar] [CrossRef]
  65. Ladas, S.; Bebelis, S.; Vayenas, C.G. Work Function Measurements on Catalyst Films Subject to in Situ Electrochemical Promotion. Surf Sci 1991, 251–252, 251–252. [Google Scholar]
  66. Neophytides, S.G.; Tsiplakides, D.; Stonehart, P.; Jaksic, M.M.; Vayenas, C.G. Electrochemical Enhancement of a Catalytic Reaction in Aqueous Solution. Nature 1994, 370, 45–47. [Google Scholar] [CrossRef]
  67. Pliangos, C.; Raptis, C.; Badas, T.; Tsiplakides, D.; Vayenas, C.G. Electrochemical Promotion of a Classically Promoted Rh Catalyst for the Reduction of NO. Electrochimica Acta 2000, 46, 331–339. [Google Scholar] [CrossRef]
  68. Vernoux, P.; Gaillard, F.; Bultel, L.; Siebert, E.; Primet, M. Electrochemical Promotion of Propane and Propene Oxidation on Pt/YSZ. J Catal 2002, 208, 412–421. [Google Scholar] [CrossRef]
  69. Katsaounis, A.; Teschner, D.; Zafeiratos, S. The Effect of Polarization and Reaction Mixture on the Rh/YSZ Oxidation State During Ethylene Oxidation Studied by Near Ambient Pressure XPS. Top Catal 2018, 61, 2142–2151. [Google Scholar] [CrossRef]
  70. C.G.Vayenas; S.Bebelis; C.Pliangos; S.Brosda; D.Tsiplakides Electrochemical Activation of Catalysis Promotion, Electrochemical Promotion, and Metal-Support Interactions. Springer New York, NY 2002.
  71. Constantinou, I.; Archonta, D.; Brosda, S.; Lepage, M.; Sakamoto, Y.; Vayenas, C.G. Electrochemical Promotion of NO Reduction by C3H6 on Rh Catalyst-Electrode Films Supported on YSZ and on Dispersed Rh/YSZ Catalysts. J Catal 2007, 251, 400–409. [Google Scholar] [CrossRef]
  72. Souentie, S.; Xia, C.; Falgairette, C.; Li, Y.D.; Comninellis, C. Investigation of the “Permanent” Electrochemical Promotion of Catalysis (P-EPOC) by Electrochemical Mass Spectrometry (EMS) Measurements. Electrochem commun 2010, 12, 323–326. [Google Scholar] [CrossRef]
  73. Falgairette, C.; Jaccoud, A.; Fóti, G.; Comninellis, C. The Phenomenon of “Permanent” Electrochemical Promotion of Catalysis (P-EPOC). J Appl Electrochem 2008, 38, 1075–1082. [Google Scholar] [CrossRef]
  74. Kokka, A.; Petala, A.; Panagiotopoulou, P. Support Effects on the Activity of Ni Catalysts for the Propane Steam Reforming Reaction. Nanomaterials 2021, 11. [Google Scholar] [CrossRef]
  75. Yentekakis, I. V.; Goula, G.; Panagiotopoulou, P.; Kampouri, S.; Taylor, M.J.; Kyriakou, G.; Lambert, R.M. Stabilization of Catalyst Particles against Sintering on Oxide Supports with High Oxygen Ion Lability Exemplified by Ir-Catalyzed Decomposition of N2O. Appl Catal B 2016, 192, 357–364. [Google Scholar] [CrossRef]
  76. Hamdy, M.S.; Alhanash, A.M.; Benaissa, M.; Alsalme, A.; Alharthi, F.A.; Al-Zaqri, N. Rhodium Nanoparticles Incorporated Mesoporous Silica as an Active Catalyst for Cyclohexene Hydrogenation under Ambient Conditions. Catalysts 2020, 10. [Google Scholar] [CrossRef]
  77. Holzwarth, U.; Gibson, N. The Scherrer Equation versus the “Debye-Scherrer Equation. ” Nat Nanotechnol 2011, 6, 534. [Google Scholar] [CrossRef] [PubMed]
  78. Jiménez-Borja, C.; De Lucas-Consuegra, A.; Sapountzi, F.; Dorado, F.; Katsaounis, A.; Valverde, J.L. Oscillatory Behavior of Rh/YSZ under Electropromoted Conditions. Chem Phys Lett 2012, 519–520, 89–92. [Google Scholar] [CrossRef]
  79. Blomberg, S.; Lundgren, E.; Westerström, R.; Erdogan, E.; Martin, N.M.; Mikkelsen, A.; Andersen, J.N.; Mittendorfer, F.; Gustafson, J. Structure of the Rh2O3(0001) Surface. Surf Sci 2012, 606, 1416–1421. [Google Scholar] [CrossRef]
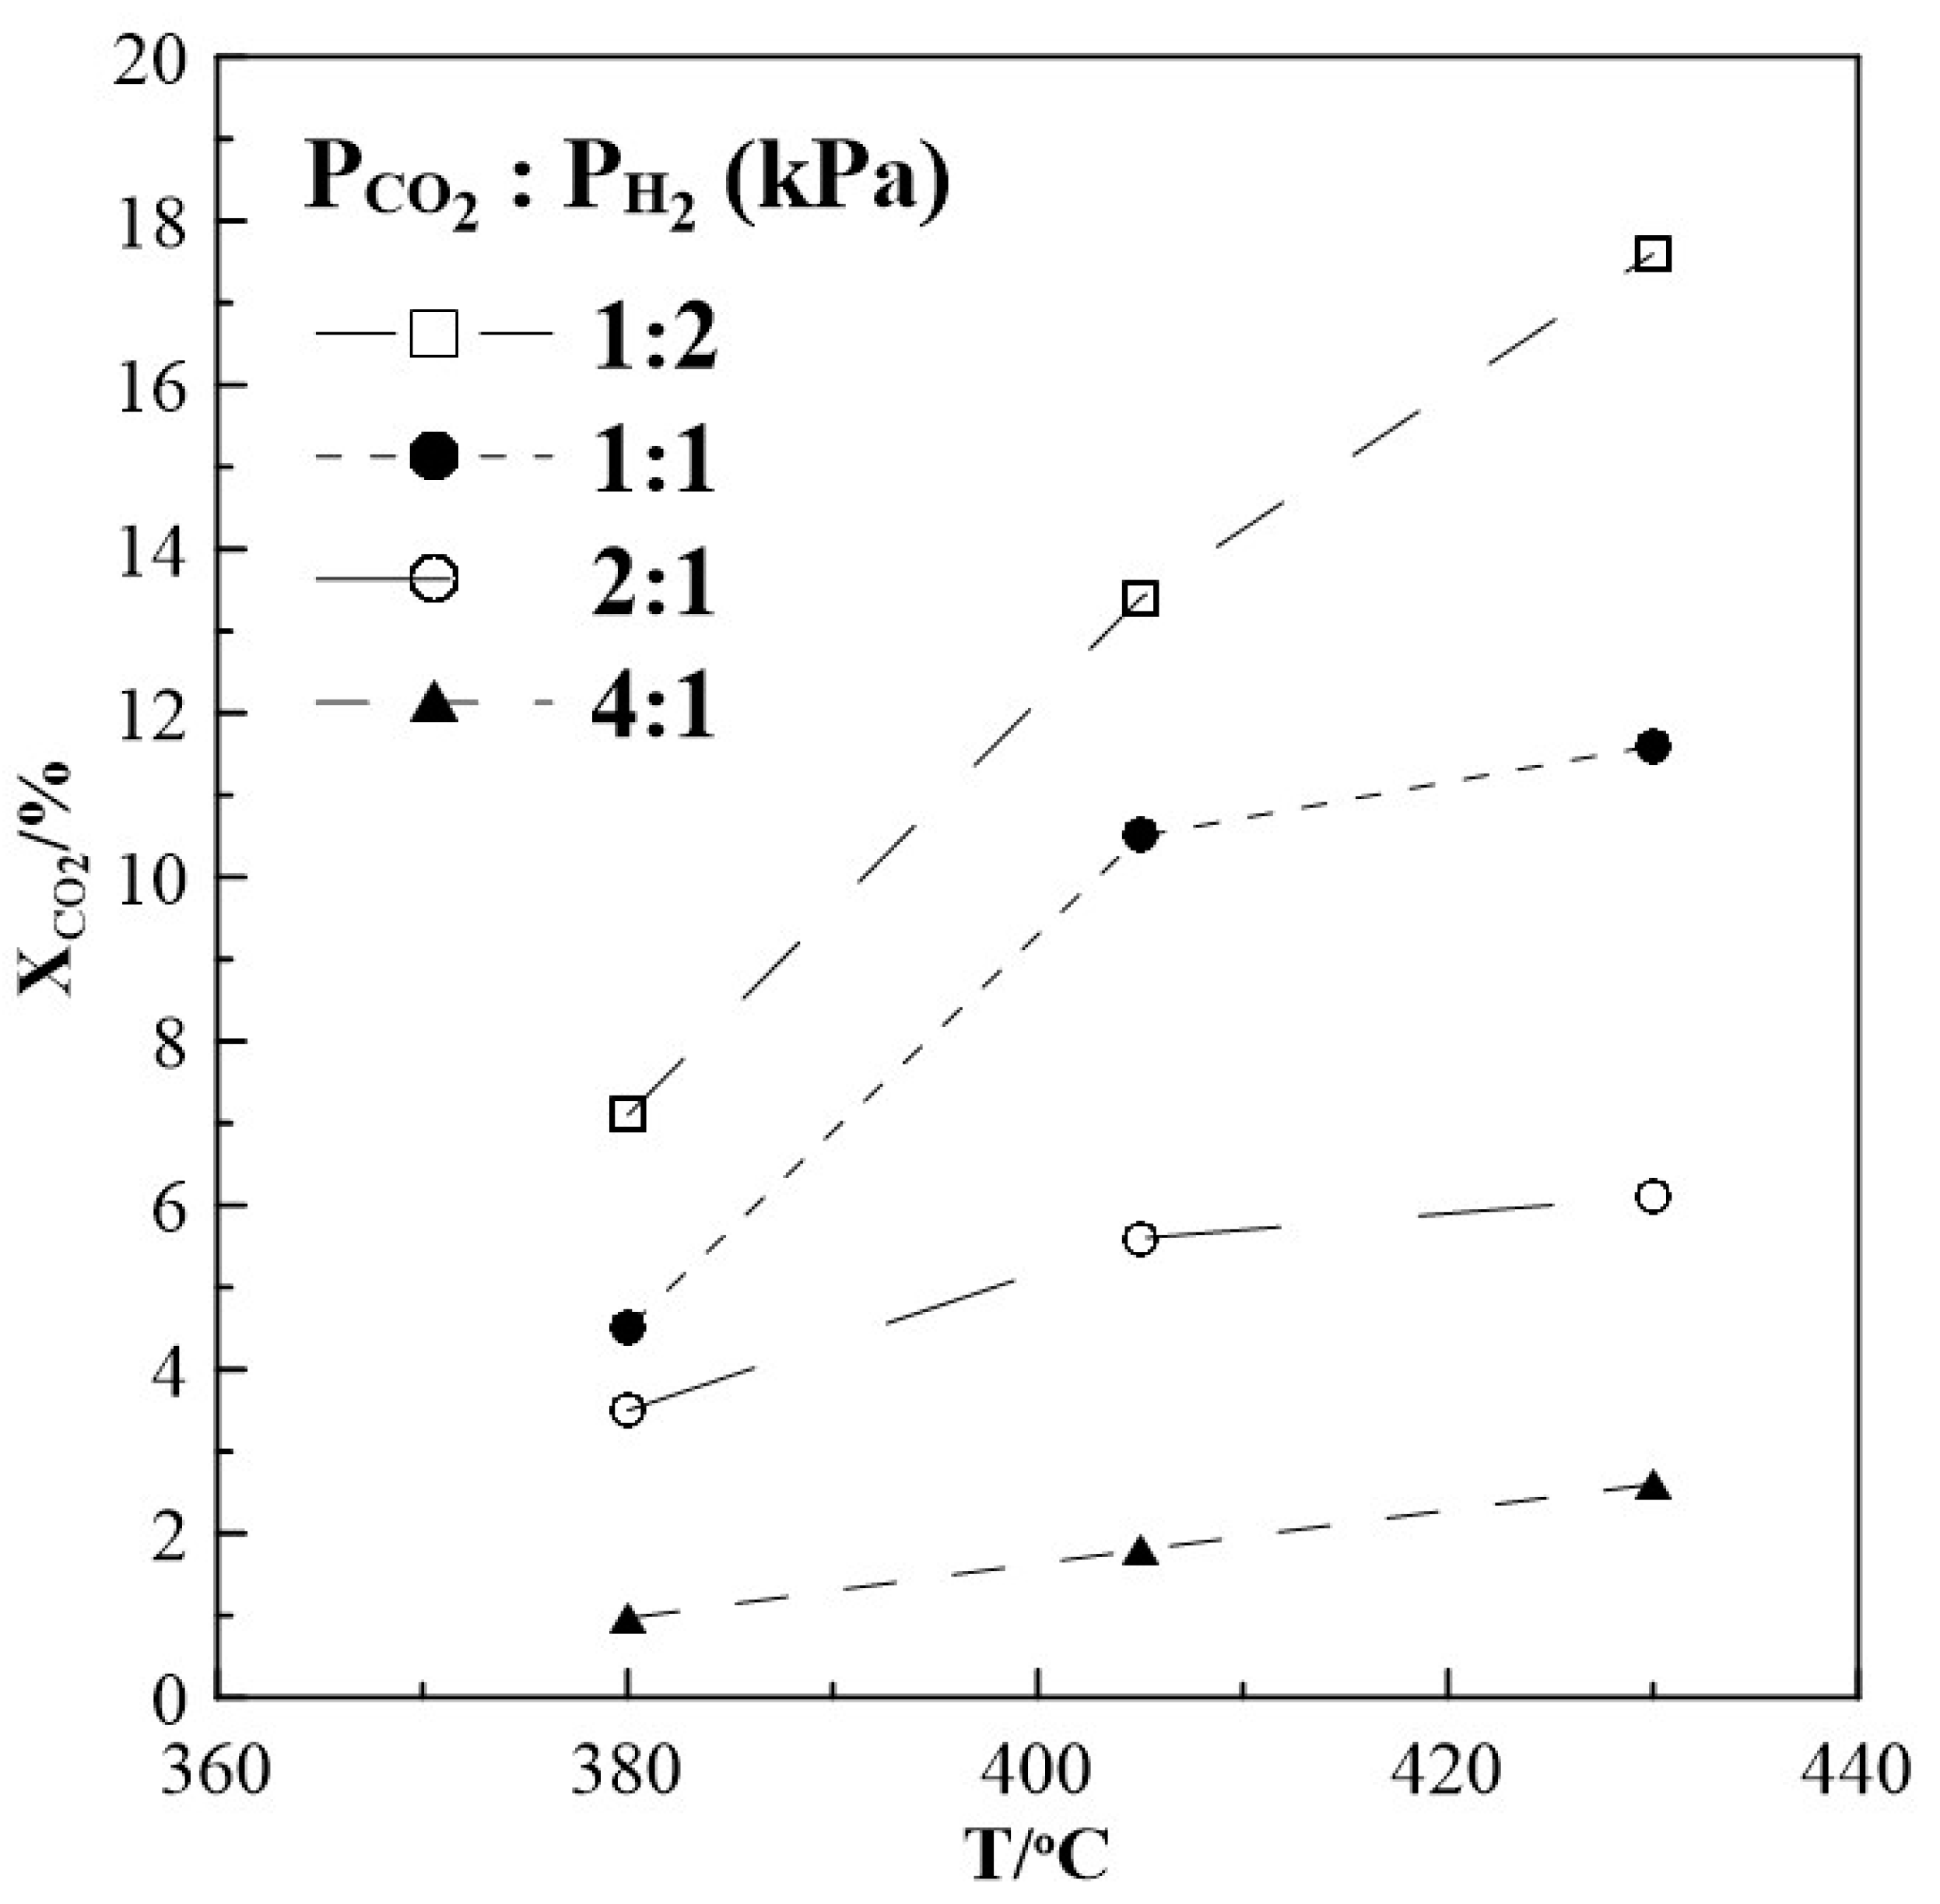
Figure 1. Steady state effect of temperature on CO2 conversion. Different gas feeding ratios of CO2 to H2. FT= 50 cm3min-1.
Preprints 76125 g001
Figure 2. Steady state effect of temperature on (a) CH4 formation rate and (b) CO formation rate. Different gas feeding ratios of CO2 to H2. FT= 50 cm3min-1.
Preprints 76125 g002
Figure 3. Steady state effect of temperature on the selectivity to CO and CH4 formation under open circuit conditions and at different gas feeding ratios of CO2 to H2. FT= 50 cm3min-1.
Preprints 76125 g003
Figure 4. Transient effect of constant applied current (I = + 0.8 mA), on the formation rate of CH4 and CO at T = 380oC and CO2 to H2 ratio of 1:2. FT= 50 cm3min-1.
Preprints 76125 g004
Figure 5. Transient effect of constant applied current (I = - 0.8 mA) on the formation rate of CH4 and CO at T = 380oC and CO2 to H2 ratio of 1:2.
Preprints 76125 g005
Figure 6. Transient effect of constant applied potential (left +1.5 V, right -1.5 V) on the formation rates of CH4 and CO at T = 380oC and at different ratios of CO2 to H2. Dotted lines in the sketch for the CO formation rates point guidance for the non-reversible behaviour of the open circuit rate after potential interruption, for details see text. FT= 50 cm3min-1. ro is the formation rate under open circuit conditions, r is the formation rate under potentiostatic polarization, and rp corresponds to the formation rate after potential interruption.
Preprints 76125 g006
Figure 7. Ratio of “permanent” rate enhancement γ to rate enhancement ρ for CO formation at different gas feeding ratios, T=380oC.
Preprints 76125 g007
Figure 8. Steady state effect of potential on (a) CH4 formation rate and (b) the corresponding rate enhancement ratio, T = 430oC, different gas feeding ratios, FT=50 cm3min-1.
Preprints 76125 g008
Figure 9. Steady state effect of gas feeding ratios of CO2 to H2 on the selectivity to CO and CH4 formation on Rh catalyst under open and closed-circuit conditions, T=380οC.
Preprints 76125 g009
Figure 10. XRD patterns of the freshly reduced and used (after exposing to experimental operating conditions) sample.
Preprints 76125 g010
Figure 11. SEM micrographs of Rh/YSZ from top view (a) fresh sample and (b) used sample.
Preprints 76125 g011aPreprints 76125 g011b
Figure 12. SEM micrographs of Rh/YSZ from cross section (a) fresh sample and (b) used sample.
Preprints 76125 g012aPreprints 76125 g012b
Figure 13. XPS measurements of the freshly reduced and post reaction used catalyst sample. (a) Rh 3d and (b) C 1s regions.
Preprints 76125 g013
Figure 14. Schematic presentation of the electrochemical cell under (a) open and (b) closed circuit conditions, WE corresponds to the working electrode, CE to counter, and RE to reference electrode.
Preprints 76125 g014
Disclaimer/Publisher’s Note: The statements, opinions and data contained in all publications are solely those of the individual author(s) and contributor(s) and not of MDPI and/or the editor(s). MDPI and/or the editor(s) disclaim responsibility for any injury to people or property resulting from any ideas, methods, instructions or products referred to in the content.
Copyright: This open access article is published under a Creative Commons CC BY 4.0 license, which permit the free download, distribution, and reuse, provided that the author and preprint are cited in any reuse.
Prerpints.org logo

Preprints.org is a free preprint server supported by MDPI in Basel, Switzerland.

Subscribe

© 2024 MDPI (Basel, Switzerland) unless otherwise stated