1. Introduction
To promote global energy transformation, the United Nations has made SDG 7 "Affordable and Clean Energy" one of the 17 goals of the United Nations 2030 Agenda for Sustainable Development. The main types of household energy consumption are fuelwood, straw, coal, electricity, biomass such as leaves and grass, biogas and liquefied petroleum gas. According to the World Bank's 'State of Global Cooking Energy' report, the world is making slow progress towards securing access to clean cooking, a key component of sustainable development Goal 7. By 2021, 2.8 billion people worldwide will still be using traditional polluting fuels and technologies for cooking, costing the world more than
$2.4 trillion annually, including impacts on health (
$1.4 trillion), climate (
$0.2 trillion) and women (
$0.8 trillion in lost productivity)[
1]. A growing literature examines household cooking energy [
2,
3,
4,
5]. Depending on the region/country studied and the current social context, various studies have highlighted different domestic and individual characteristics that influence cooking fuel decisions[
6]. It has been found that rural households in India rely heavily on traditional biofuels, with more than 75% of rural households using wood as their primary cooking fuel[
7], and that factors such as income and energy convenience influence the energy source chosen for household cooking activities[
8], and in China, the proportion of daily hours spent by residents using electricity and natural gas for cooking activities is on the rise, with a national average of approximately 70% in 2017[
9].
Energy utilization significantly impacts the environment and climate, where non-clean energy utilization not only emits large amounts of carbon dioxide but also produces harmful gases such as sulfur oxides and nitrogen oxides. There are still 2.6 billion people who use wood, charcoal, dung, and coal for cooking and heating, which leads to more than 4 million premature deaths each year due to indoor air pollution[
10]. Household energy consumption is an important component of the country's energy demand, usually referring to all types of energy consumed in daily life, including energy consumed for lighting, cooking, heating, hot water, household appliances, etc.[
11].Energy demand in developing countries tends to be suppressed and there is a significant gap between urban and rural household energy consumption[
12,
13,
14]. Therefore, it is important to investigate energy equity in developing countries to meet the basic needs of human survival and to promote distributional equity in social progress[
15]. At present, China's household energy expenditure is significantly uneven, with urban households generally having lower energy inequality than rural households, but along with the implementation of China's comprehensive energy transition policy and the deepening of urban-rural integration in recent years, the problem of household energy inequality between urban and rural areas has improved significantly[
16]. Most of China's rural household energy consumption is mainly based on the direct combustion of traditional biomass such as straw and firewood, which not only leads to low energy use efficiency but also leads to a large number of environmental pollution problems[
17]. The single rural energy structure and unreasonable consumption patterns have led to a great waste of rural energy, and although renewable energy sources such as solar energy and biogas are developing rapidly, they account for a very low proportion of rural domestic energy consumption[
18]. In addition, the energy consumption level and structure of rural households in each region have obvious differences and regional characteristics[
19], and their energy consumption choices are influenced not only by economic factors such as household income, fuel prices and collection costs but also by cultural factors such as cooking habits, female migrants[
20] and education levels, as well as external complex influences such as government policies on clean energy subsidies.
There is an extensive literature examining household energy consumption in China, with certain studies focusing only on rural or urban areas[
21,
22,
23], while others consider the overall[
24,
25,
26]. At present, there are fewer quantitative studies of fixed-point surveys at the farm household level, and mostly for Beijing, Tianjin, Hebei, Northeast, Southeast and other regions of the actual household research data analysis of rural household living energy consumption structure[
27,
28,
29]. The existing surveys, studies and statistics on energy types and their utilization methods only carry out statistics and analysis on energy types, total utilization and industry distribution from a macro perspective. At present, based on the earth's big data, such as remote sensing images, etc., regional scientific quantitative projection is still blank.
To deeply understand the current situation of residents' energy consumption and the use of energy structure, and to make an effective projection on regional basis by using big earth data, this study takes the residents' use of clean cooking fuel as the research object, and the research scope is determined for the provinces south of Yangtze River in China Based on big earth data combined with the use of stratified random sampling method, questionnaires are conducted for urban residents and rural residents respectively, to understand the urban and rural residents' cooking energy consumption in production and life, to lay the foundation for suitable energy structure adjustment in China.
2. Materials and Methods
2.1. Study Area
The study area is located in the south of the Yangtze River in China, which is usually south of the Qinling-Huaihe-Line, east of the East China Sea and south of the South China Sea, and is located in the eastern monsoon region of China, roughly including most of Jiangsu, most of Anhui, Zhejiang, Shanghai, Hubei, Hunan, Jiangxi, Fujian, most of Yunnan, Guizhou, eastern Sichuan, Chongqing, Guangxi, Guangdong, Hainan, Hong Kong, Macau, Taiwan, southern Shaanxi, southernmost Gansu, and the southernmost part of Henan. Among them, Hong Kong and Macao are cities, Shaanxi, Gansu and Henan south of the Yangtze River is a small area, so the article mainly considers Jiangsu, Anhui, Zhejiang, Shanghai, Hubei, Hunan, Jiangxi, Fujian, Yunnan, Guizhou, Sichuan, Chongqing, Guangxi, Guangdong, Hainan, Taiwan, a total of sixteen provinces.
2.2. Data Sources
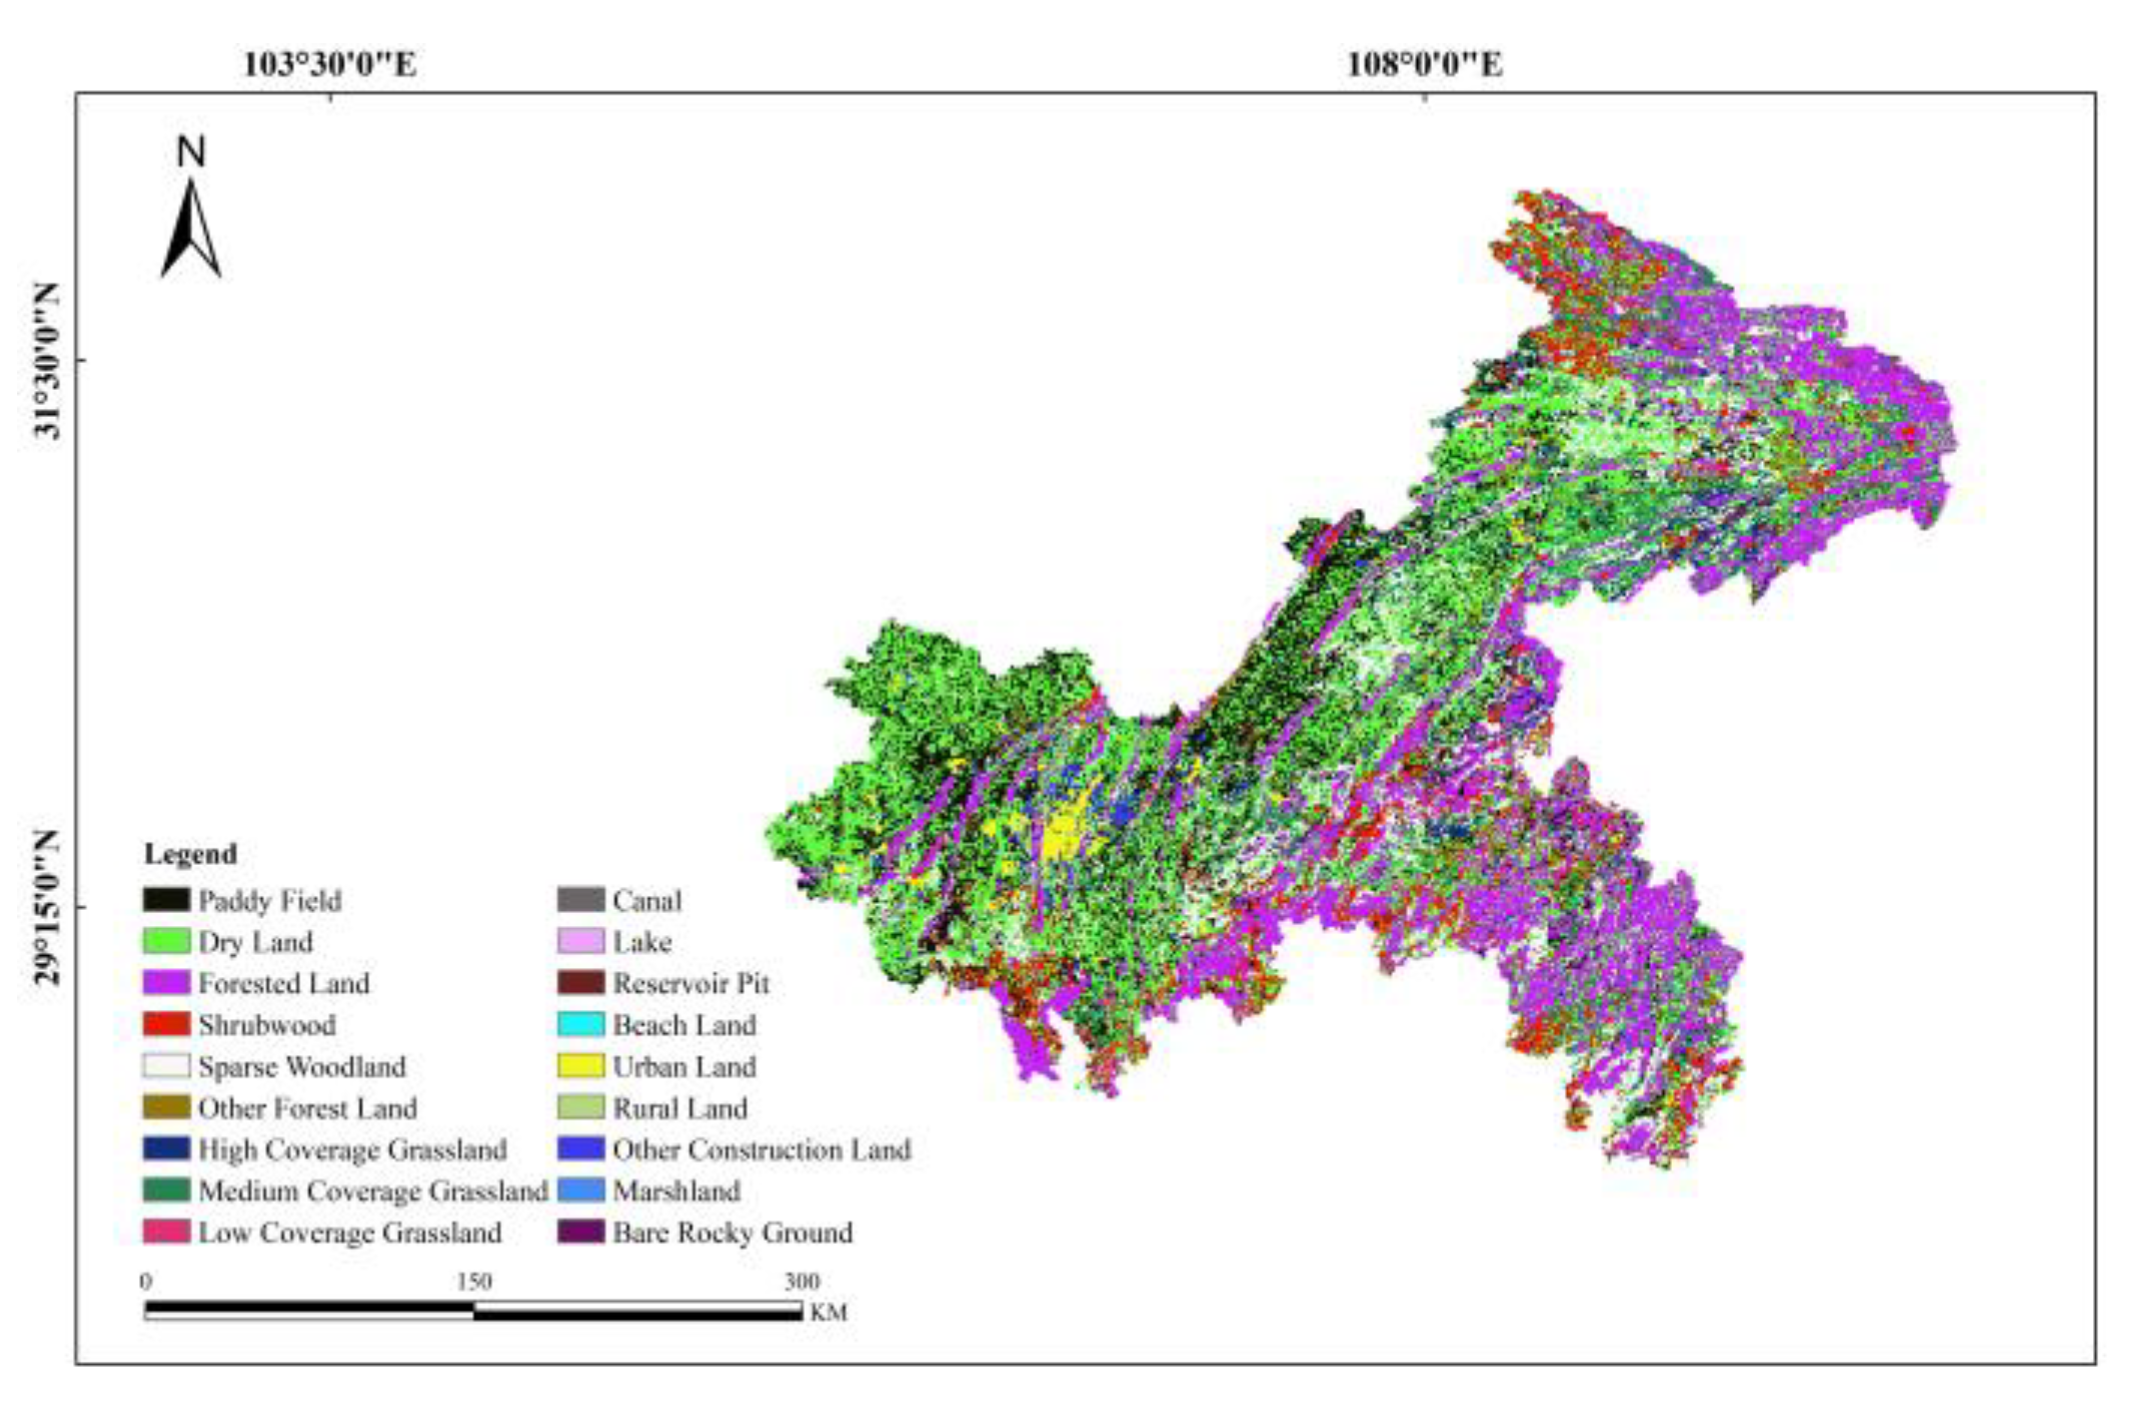
The data used in this paper mainly include the administrative district vector data, land use data (as shown in
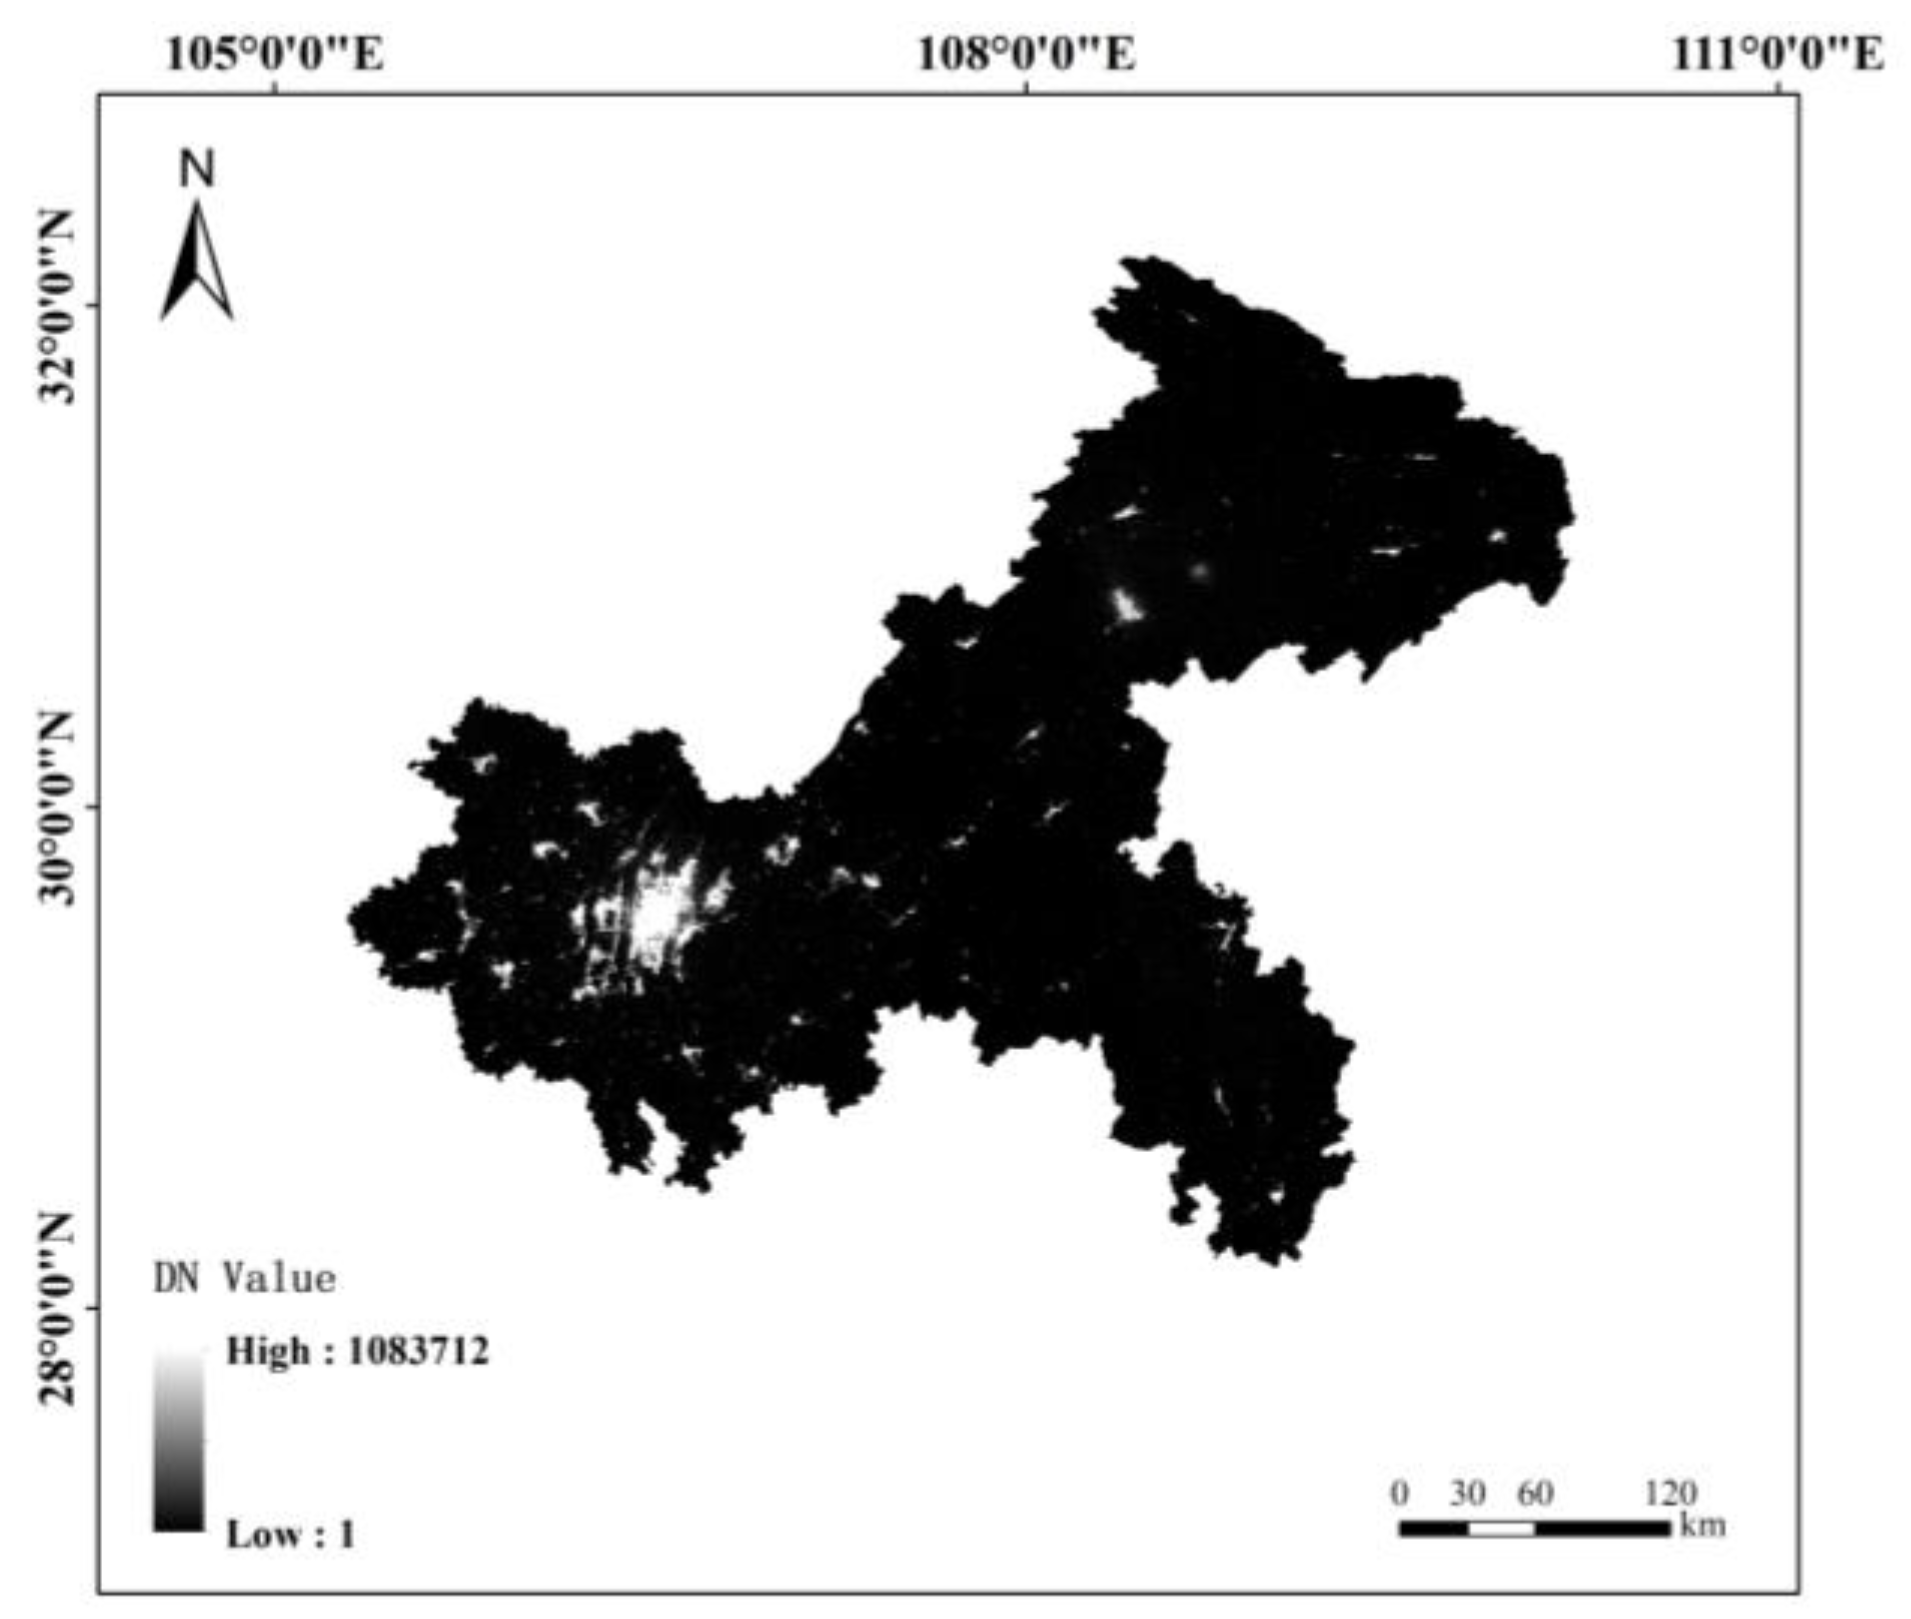
Figure 1), " LJ1-01" nighttime light remote sensing image (as shown in
Figure 2), per capita GDP data of provinces/cities and counties, Internet data (Internet map, place names), field survey sampling data and agricultural census data (as shown in
Table 1).
2.3. Technical Route and Method
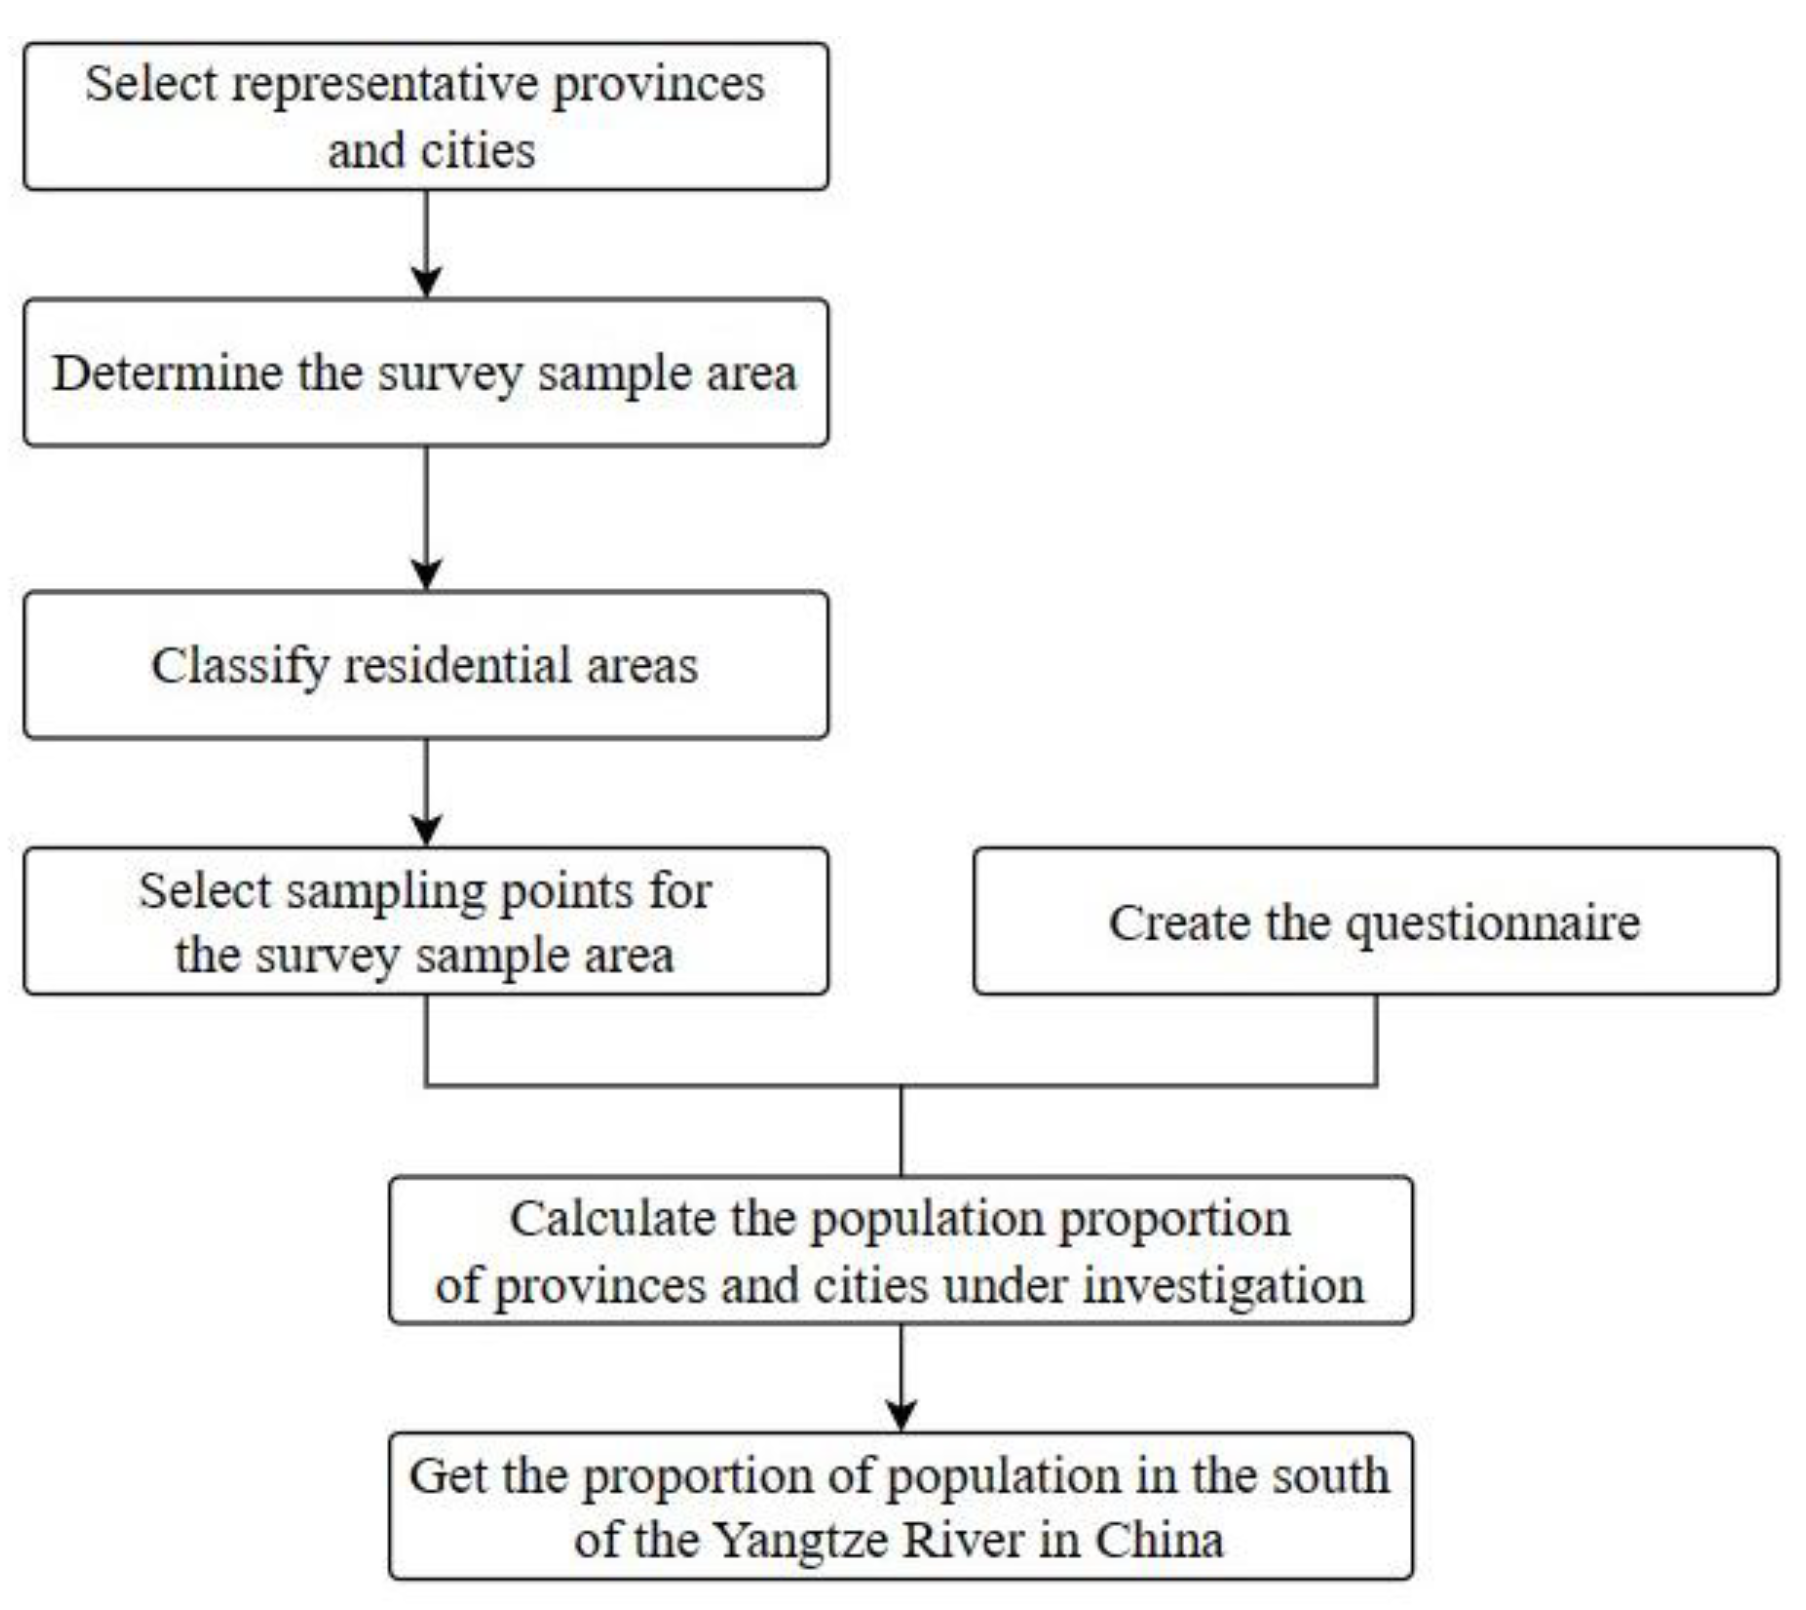
Based on the big data of the earth (including administrative division vector map, GDP, nighttime light remote sensing image, land use data, etc.), this paper uses the methods of spatial analysis, questionnaire survey and statistical analysis, and takes "representative province/city selection - survey sample area determination - residential area type division - sampling point" as the main line to scientifically analyze and calculate the proportion of the population in the south of the Yangtze River in China relying on clean cooking fuel and technology. This paper adopts the idea of "pyramid" stratification to project the population proportion. The technical route is shown in
Figure 3.
2.3.1. Selection of Representative Provinces and Cities
According to the composition of farmers using various cooking and heating fuels in various regions in 2016 (from the bulletin of the third national agricultural census), the provinces with similar energy consumption ratios were divided into two groups. One province was selected for the questionnaire, and the results of the other province were calculated according to the energy consumption ratio. This paper selects Yunnan, Chongqing, Anhui, Guizhou, Jiangsu, Guangdong, Fujian and Jiangxi for questionnaire survey, and other provinces and cities are calculated by using a similar percentage of energy consumption.
2.3.2. Estimation of Survey Sample Area Based on Multi-source Data
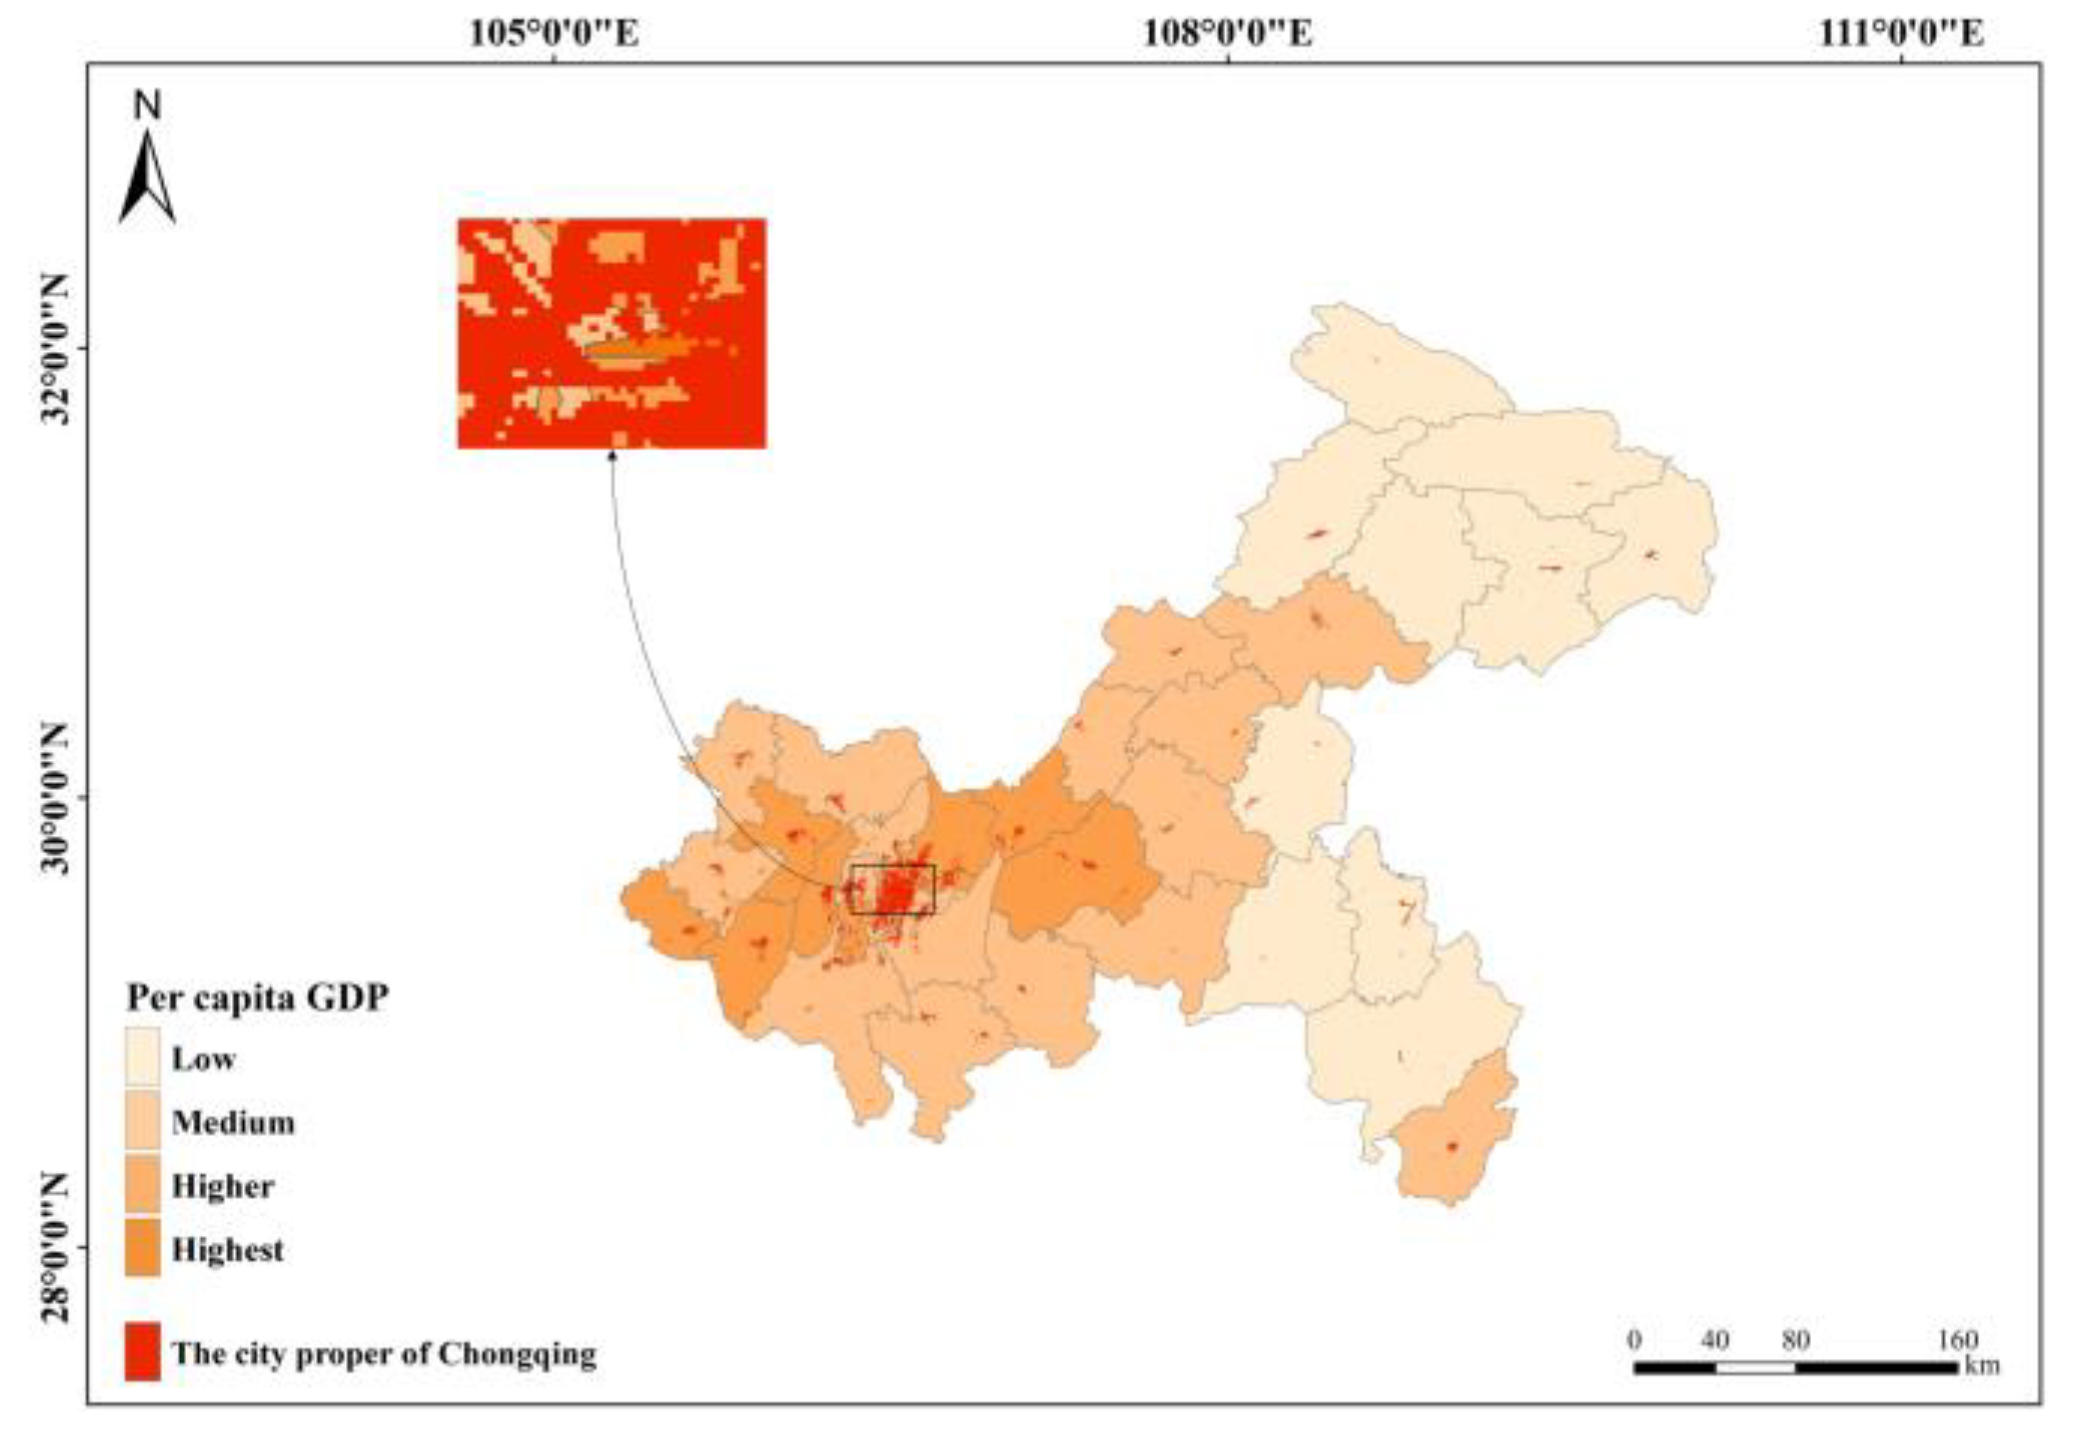
(1) Determine the survey sample area. Taking the district and county administrative maps of the survey provinces and cities as units, the survey provinces and cities were divided into four levels, namely highest, higher, medium and low, and each survey sample area was formed according to the level range (the highest level was not included in the sampling scope). In the survey sample areas formed by the higher, middle and lower levels, the proportion of urban land and rural land in each survey sample area to the whole survey province and city was counted by using GIS software. Combined with the actual number of sampling points, the survey sample areas were determined according to the order of the percentage.
(2) Classify the type of residential area. Based on the nighttime remote sensing data, land use data and administrative division map, etc., the GIS software is used to obtain the light index. Combining the rural settlements in the land use data, the urban residential areas and rural residential areas have been classified.
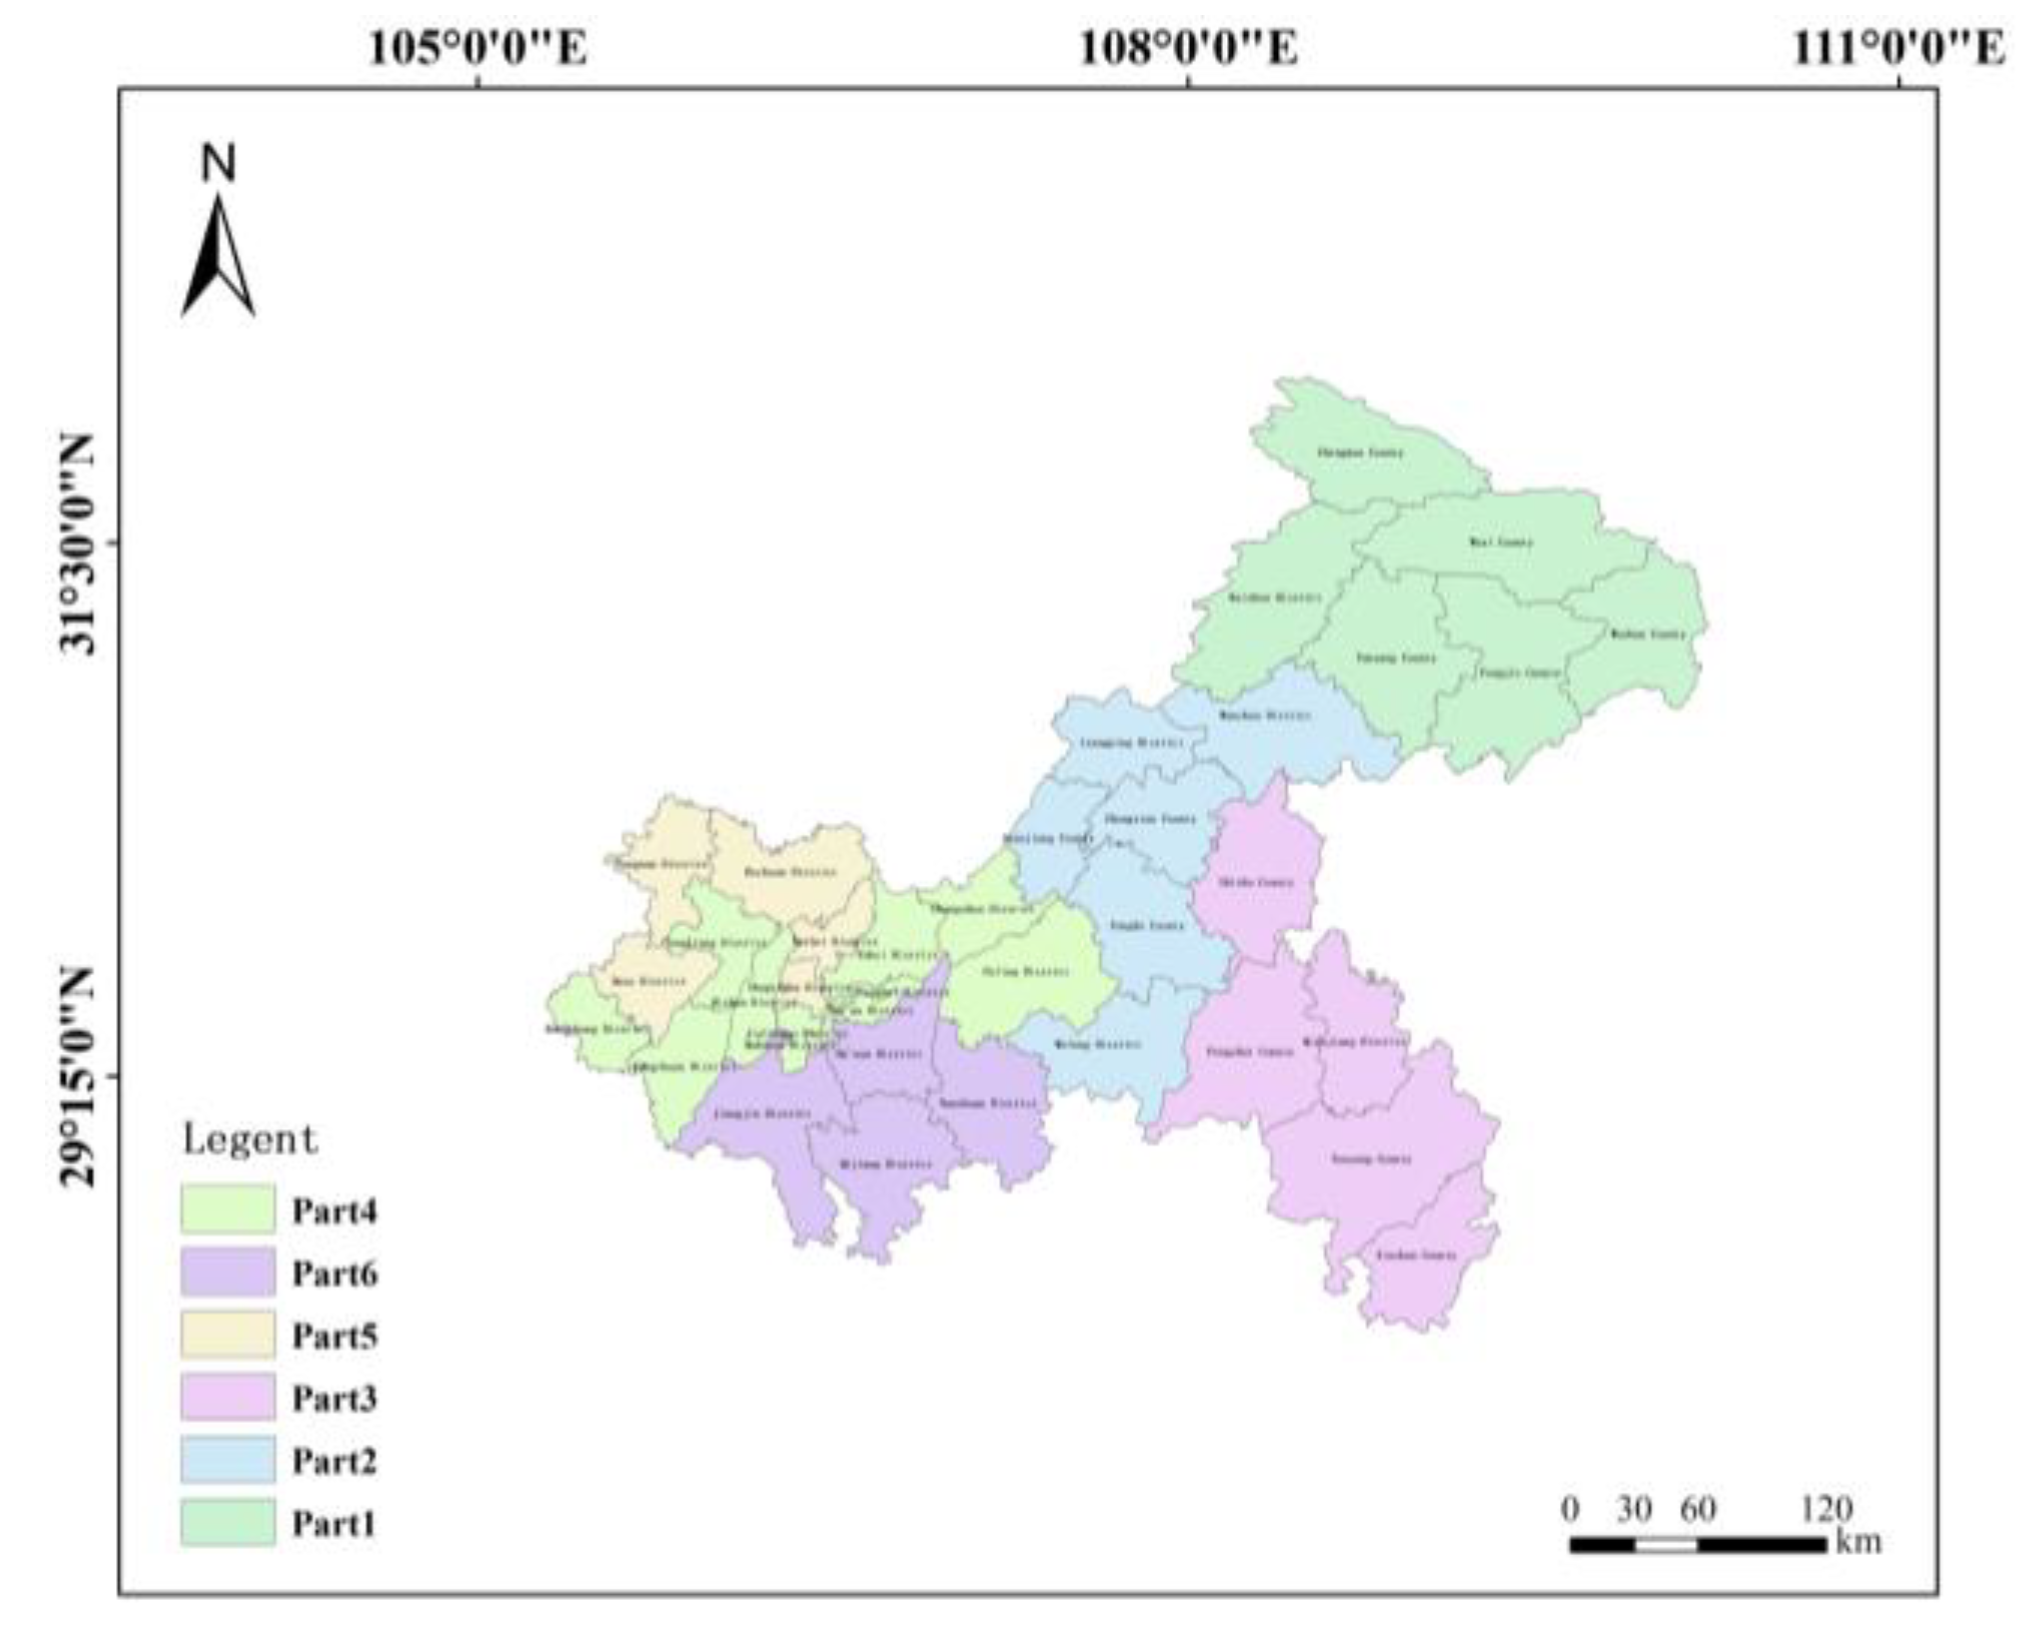
(3) Select sampling points for the survey sample area. According to the GDP classification, geographical location and other factors, the survey provinces were grouped into N regions (as shown in
Figure 5), and the number of urban raster points and rural raster points in each group was calculated and summed, and the top three regions in terms of urban raster points and rural raster points were selected as the survey sample areas for the field questionnaire survey (by default, the proportion of the population using clean cooking fuels in urban settlements is 100%). Therefore, there are 6 sample areas in each province and city, including 3 urban areas and 3 rural areas.
(4) Count survey samples. All valid questionnaires from urban and rural survey areas were counted, invalid questionnaires were excluded, and the proportion of residents relying on clean cooking fuels and technologies Bi and Ci were calculated for each sample (Bi represents the proportion of population using clean cooking fuels and technologies in urban areas, Ci represents the proportion of population using clean cooking fuels and technologies in rural areas, and i represents the number of samples).
(5) Estimate the population proportions of the survey provinces and cities. The proportions Di and Ei (Di and Ei are the proportions of urban and rural residents using clean cooking fuels and technologies after the weighted average of the samples) are the proportions of the population relying on clean cooking energy and technologies in the surveyed provinces and municipalities, based on the proportions Bi and Ci.
(6) Obtain the proportion of population in the region south of the Yangtze River. Using a combination of indicators such as GDP per capita and population density, the proportion of the population in the region south of the Yangtze River in China that relies on clean cooking energy and technology is projected.
Take Chongqing city as an example, using the GDP per capita data to classify the districts and counties in Chongqing city, the city proper of Chongqing is eliminated according to the nighttime light remote sensing data, as shown in
Figure 4. The districts and counties with similar geographic location and the same grade are divided into a group, and are grouped to get the Chongqing regional grouping map (
Figure 5).
Figure 4.
GDP hierarchical map superimposed with nighttime light remote sensing data.
Figure 4.
GDP hierarchical map superimposed with nighttime light remote sensing data.
Figure 5.
Regional grouping map of Chongqing.
Figure 5.
Regional grouping map of Chongqing.
2.3.3. Questionnaire Investigation
According to the economic conditions, terrain characteristics, national policies on new energy construction and living habits of the surveyed provinces and cities, we develop questionnaires to focus on energy accessibility and resident income levels to help analyze the results later. Statistics on residents' intentions and needs provide ideas for the promotion of new energy in the future. One county was randomly selected within the survey sampling area and three sampling sites were randomly selected within the selected county for the urban land area and three sampling sites for the rural land area to conduct field questionnaires (by default, the percentage of the population in the urban residential area for using clean cooking fuels was 100%).
Taking residential households as the unit and cooking energy consumption as the core, the survey mainly covers annual household income, population, the energy consumption of coal, electricity, gas and firewood in the cooking process and energy policy issues. A total of 958 valid samples were obtained, including 106 questionnaires from Jiangxi, 72 questionnaires from Guangdong, 131 questionnaires from Anhui, 128 questionnaires from Chongqing, 169 questionnaires from Yunnan, 108 questionnaires from Guizhou, 146 questionnaires from Fujian, and 98 questionnaires from Jiangsu.
2.3.4. Sample Statistics
After completing the questionnaire survey of 8 provinces and cities, the questionnaire of each sample area is sorted into the format of
Table 2, where the figure represents the annual consumption amount of this energy. Use formula (1) ~ (2) to calculate the proportion of population relying on clean cooking fuel and technology in each sample area. The formula for calculating the proportion of clean cooking energy per household is:
The calculation formula of the population proportion of clean cooking energy in the sample area is:
After calculating the proportion data of three cities and towns in a province and city respectively, multiply them by their respective weights and add them, where the weight is equal to the number of grids in the region/the number of grids in the selected three regions, we can get the proportion of the population of the urban land in the province and city relying on clean cooking fuel and technology. Similarly, we can get the proportion of rural villages.
3. Results and Discussion
3.1. Calculation Result
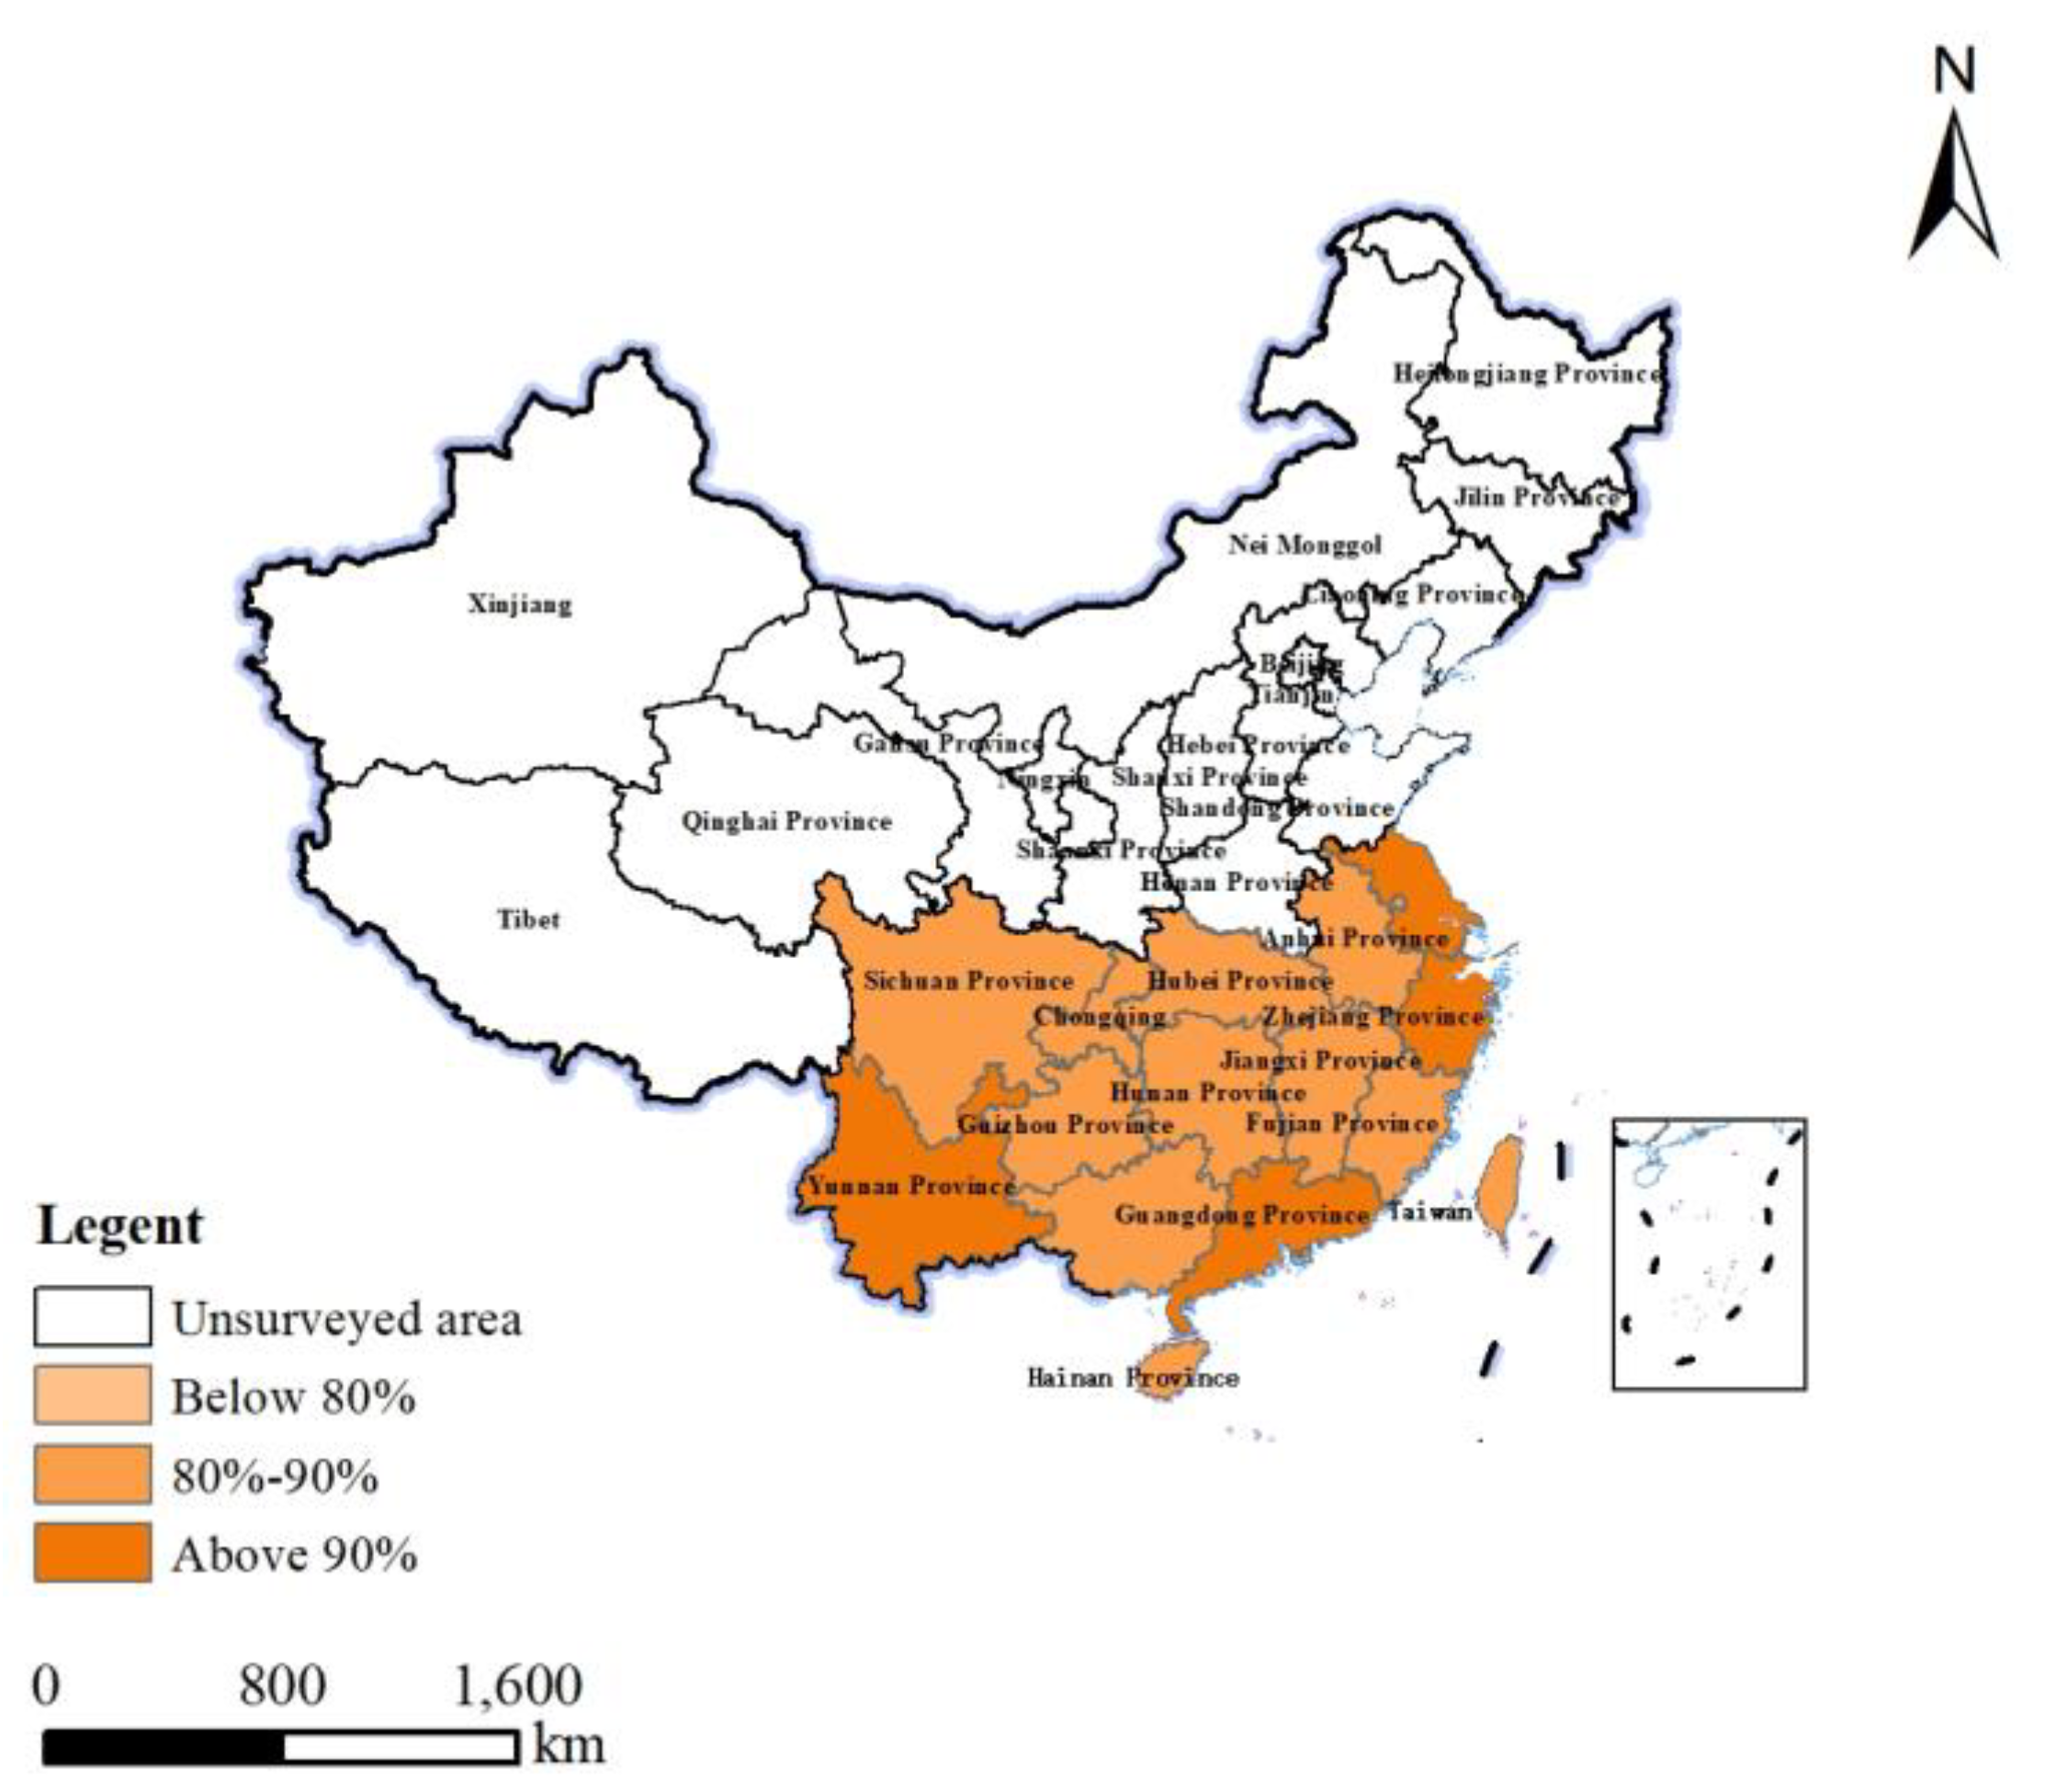
In this paper, the use of big data of the earth and the use of weights before the sample area calculation are added to the traditional questionnaire survey and statistical analysis methods, so that the calculation results are not only scientific at the macro level, but also improve the continuity at the micro level. Therefore, the survey results are more effective. The percentage of the population using clean cooking energy and technologies in the south of the Yangtze River in China is 88.25%, with 89.81% in urban areas and 79.87% in rural areas.
Figure 6.
The proportion of the population using clean cooking energy and technology in the south of the Yangtze River in China.
Figure 6.
The proportion of the population using clean cooking energy and technology in the south of the Yangtze River in China.
3.2. Holistic Analysis
The results of the survey are presented in a bar chart to show the results more directly.
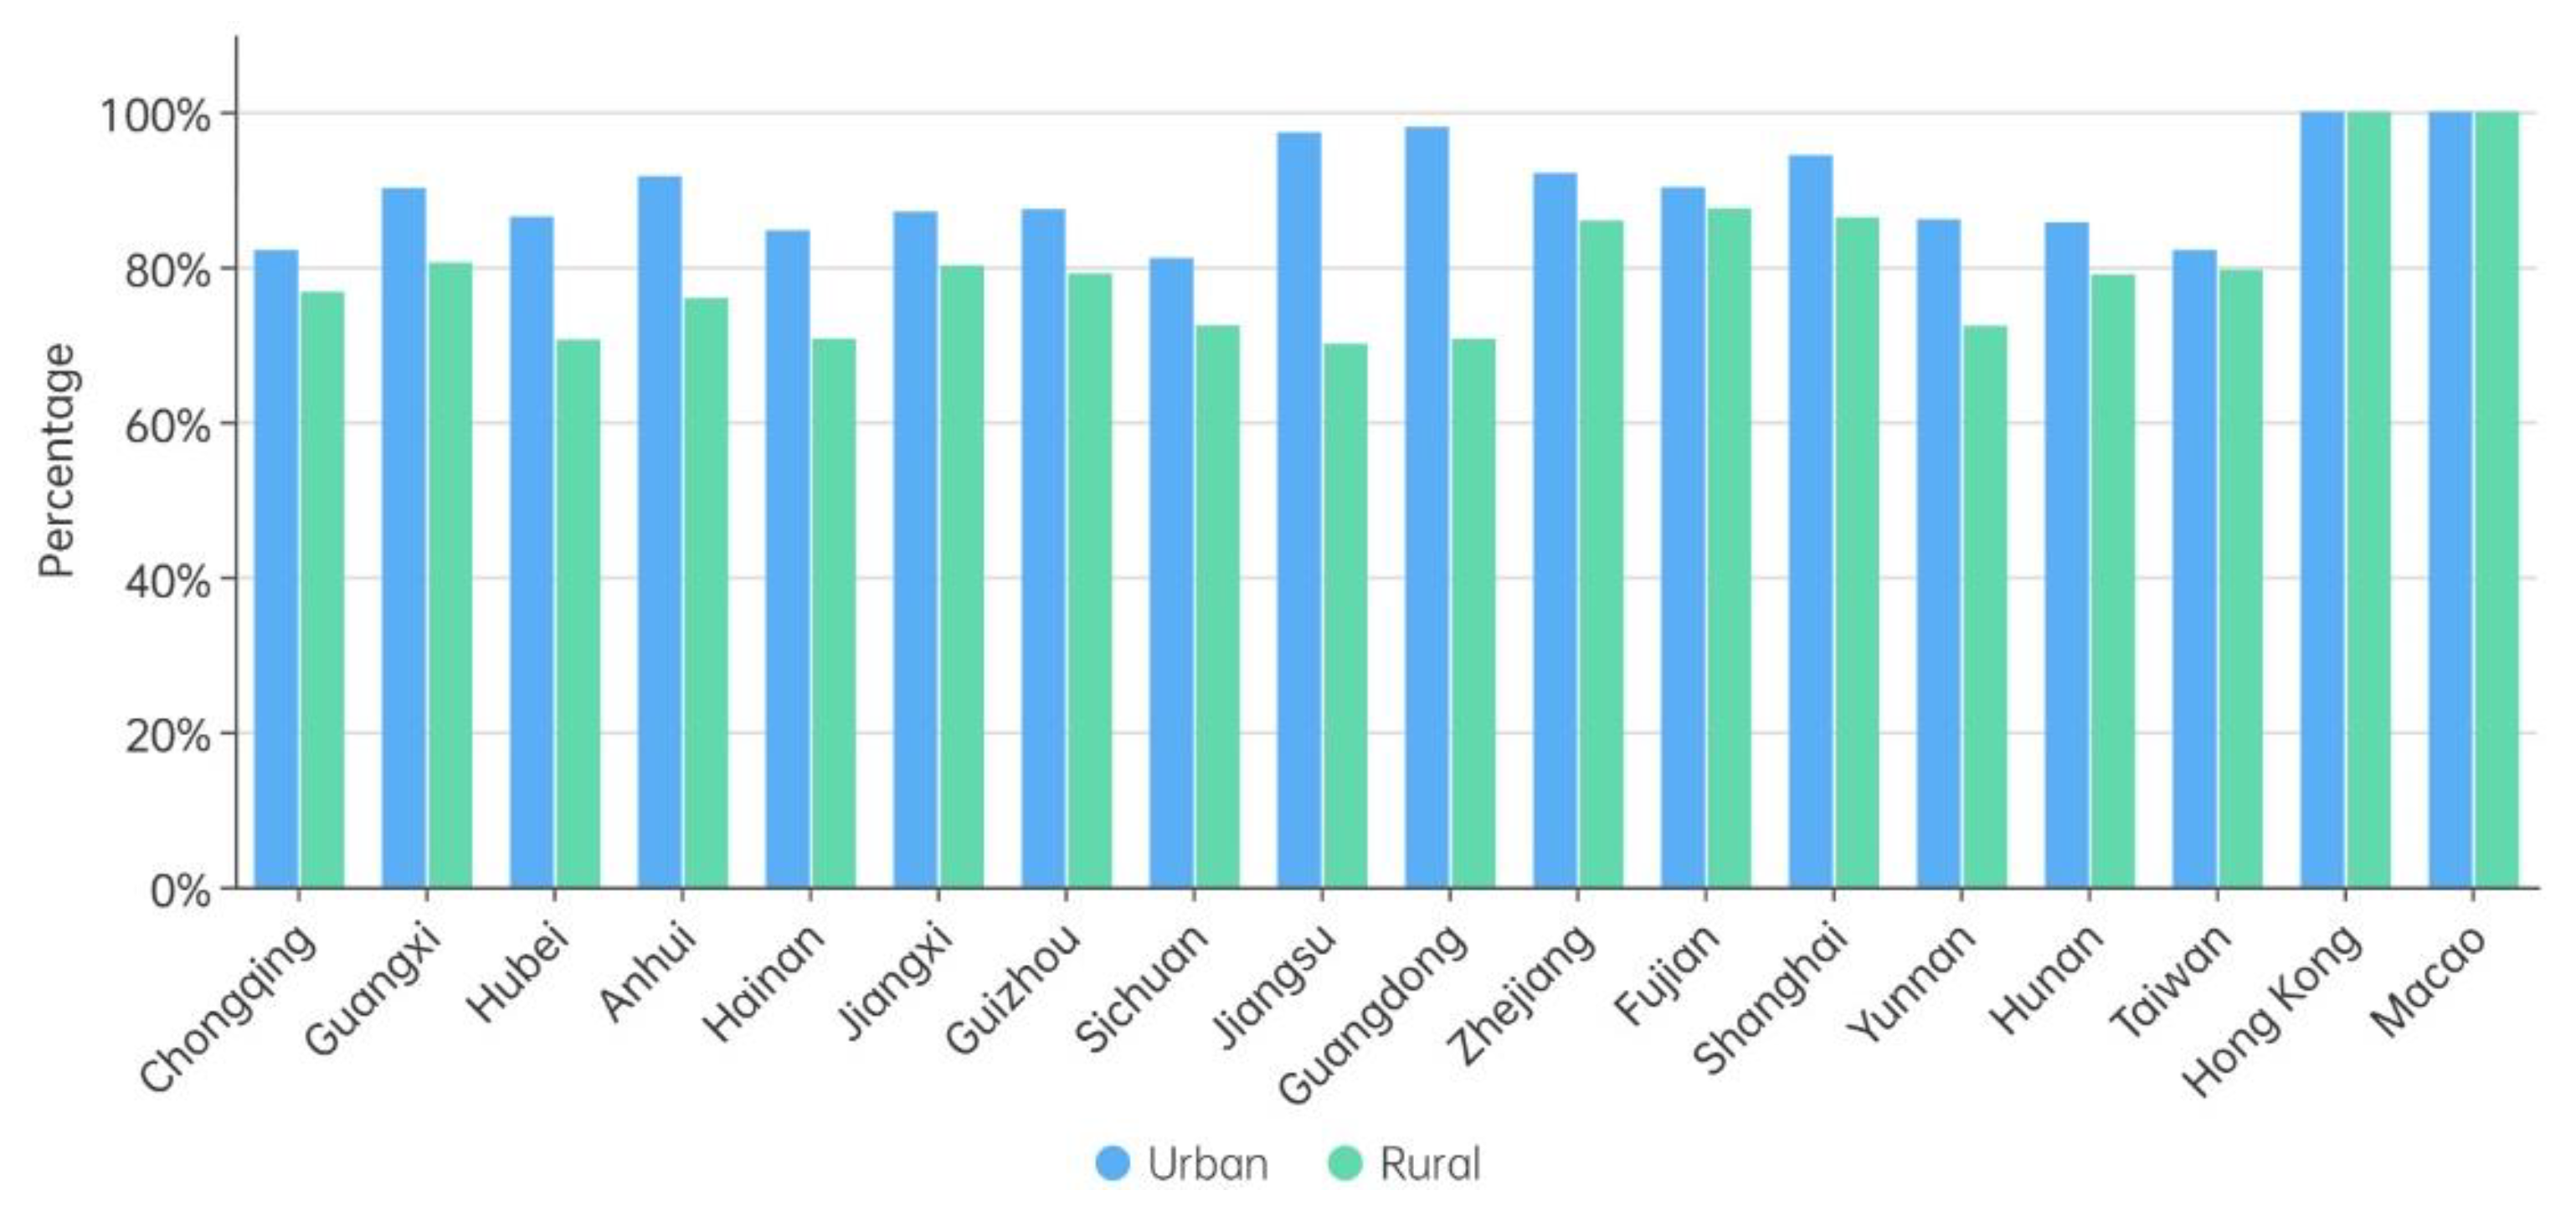
Figure 7 shows the histogram of the proportion of clean cooking fuels and technologies used in each province. As can be seen, the proportion of people using clean cooking fuels and technologies is higher in urban areas than in rural areas within the same province.
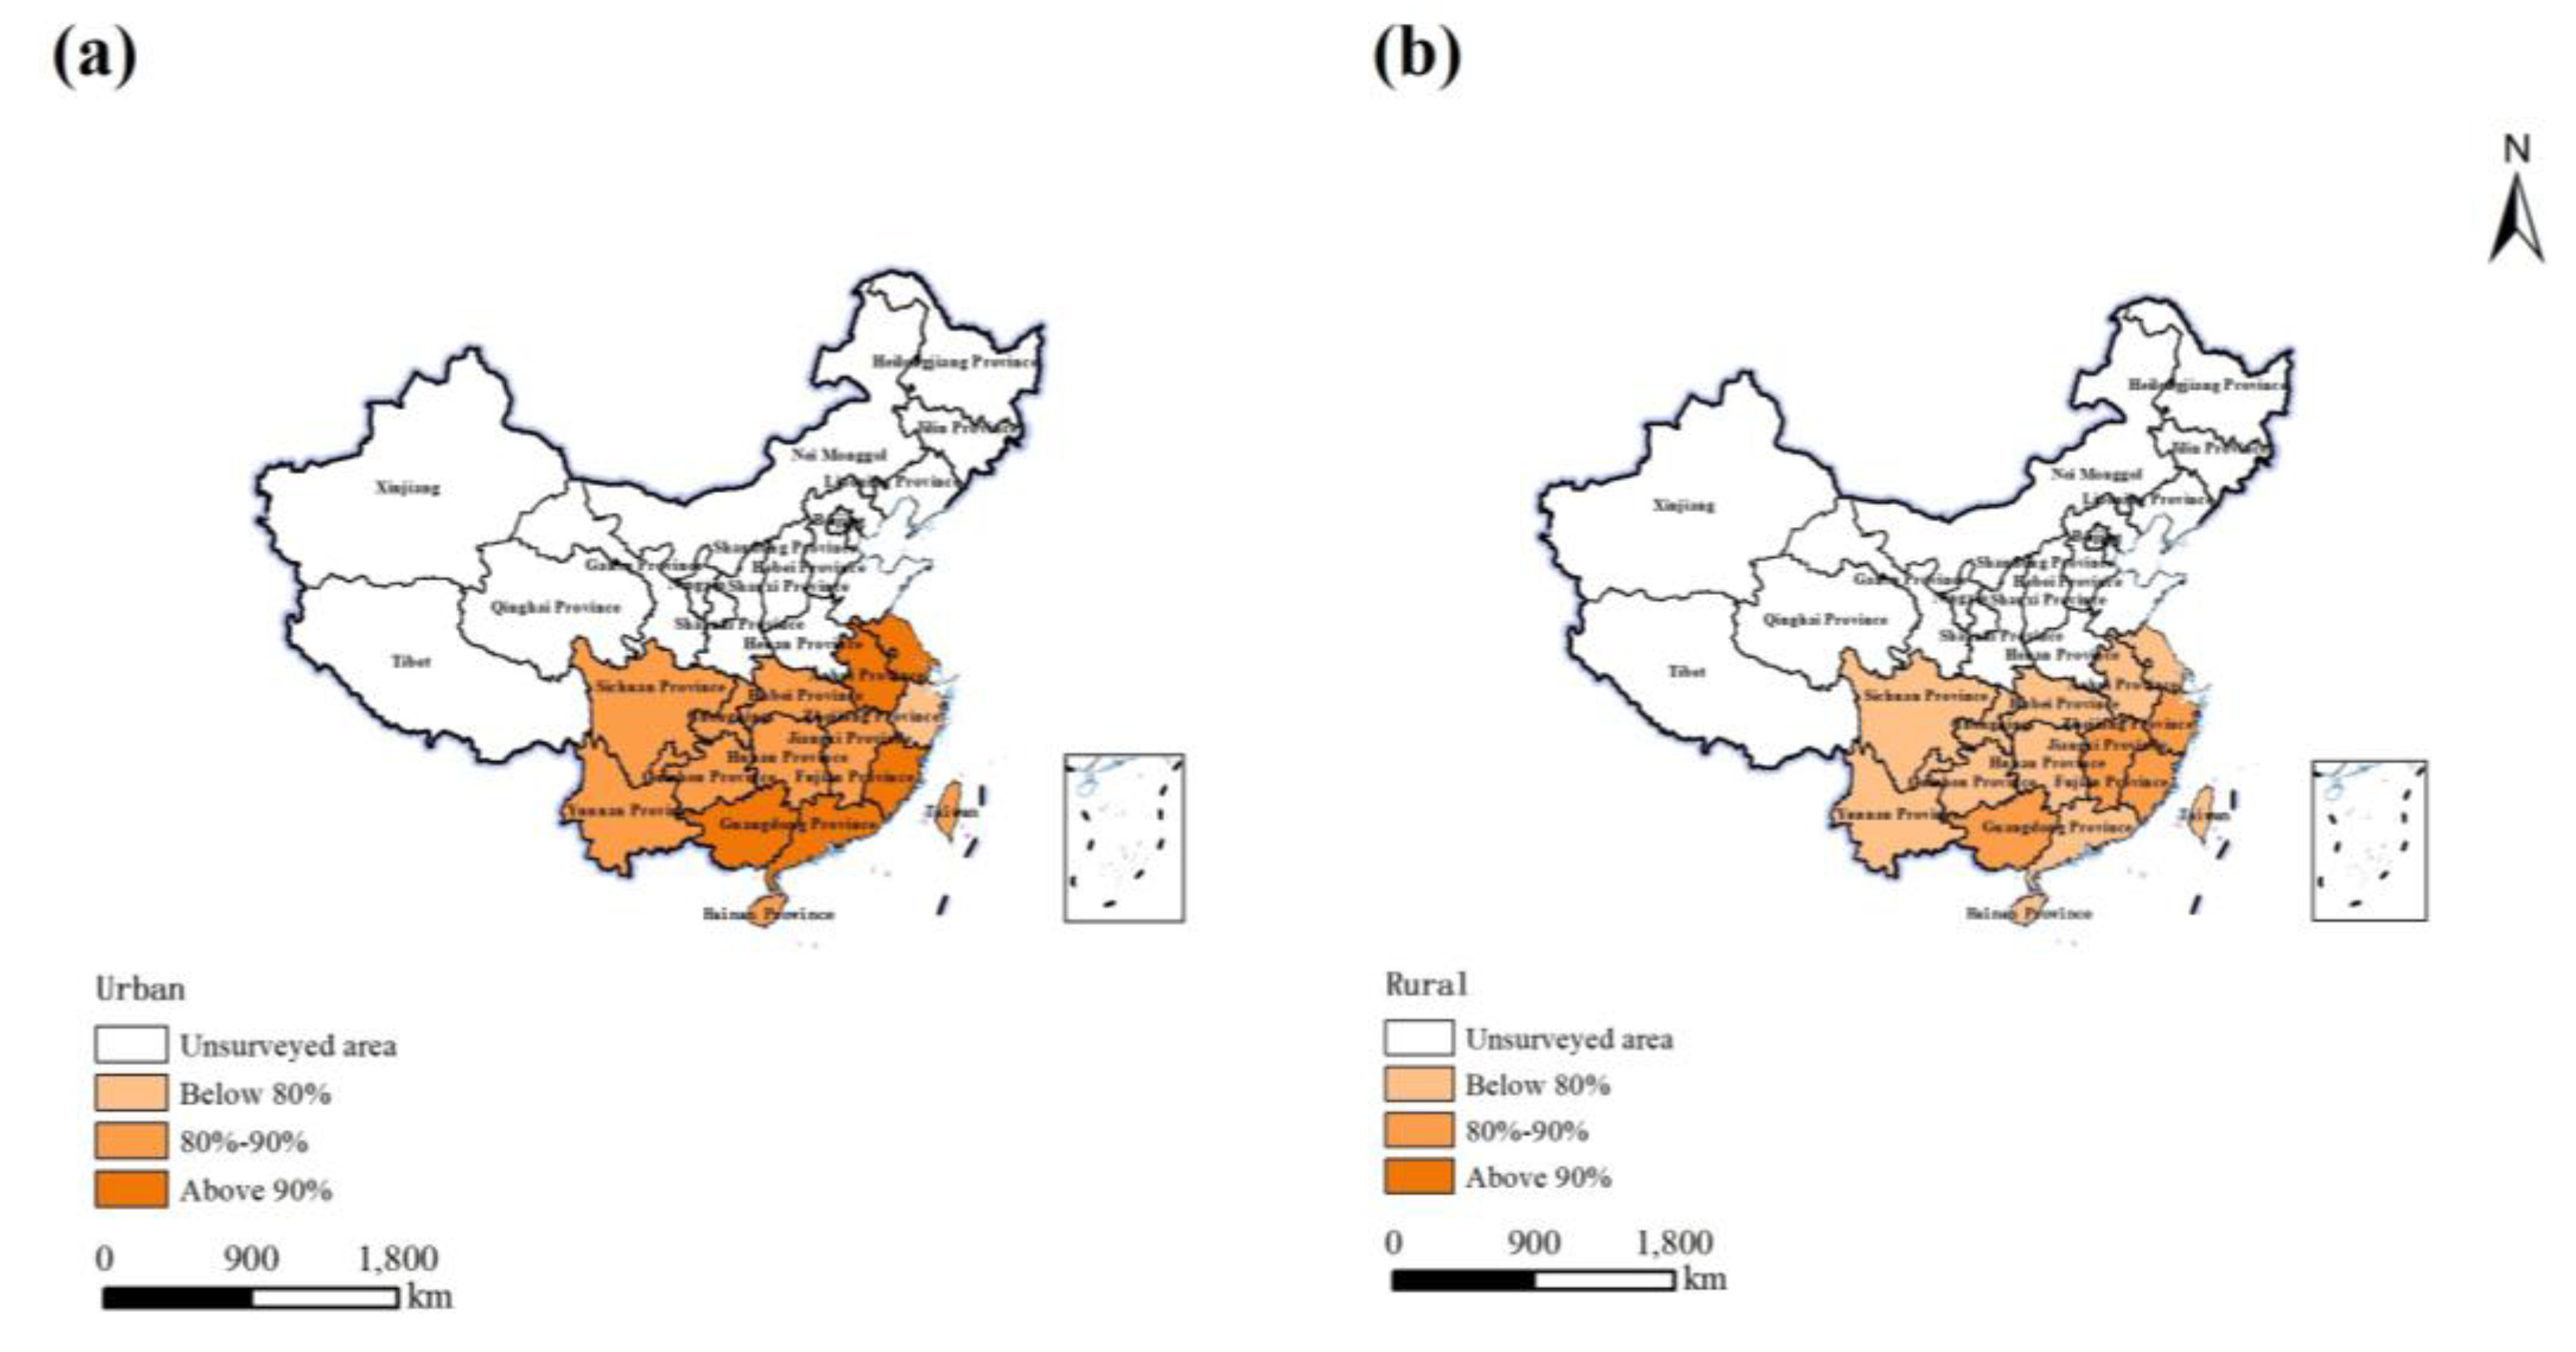
Figure 8 shows a graded color chart of the proportion of the population relying on clean cooking fuels and utilization technologies in urban and rural areas south of the Yangtze River. It can be found that in the more economically developed coastal provinces, the proportion in urban area is significantly higher than that in the interior, so we infer that the proportion of the population using clean cooking energy is related to various factors such as geographic location, income and the degree of economic development of the cities.
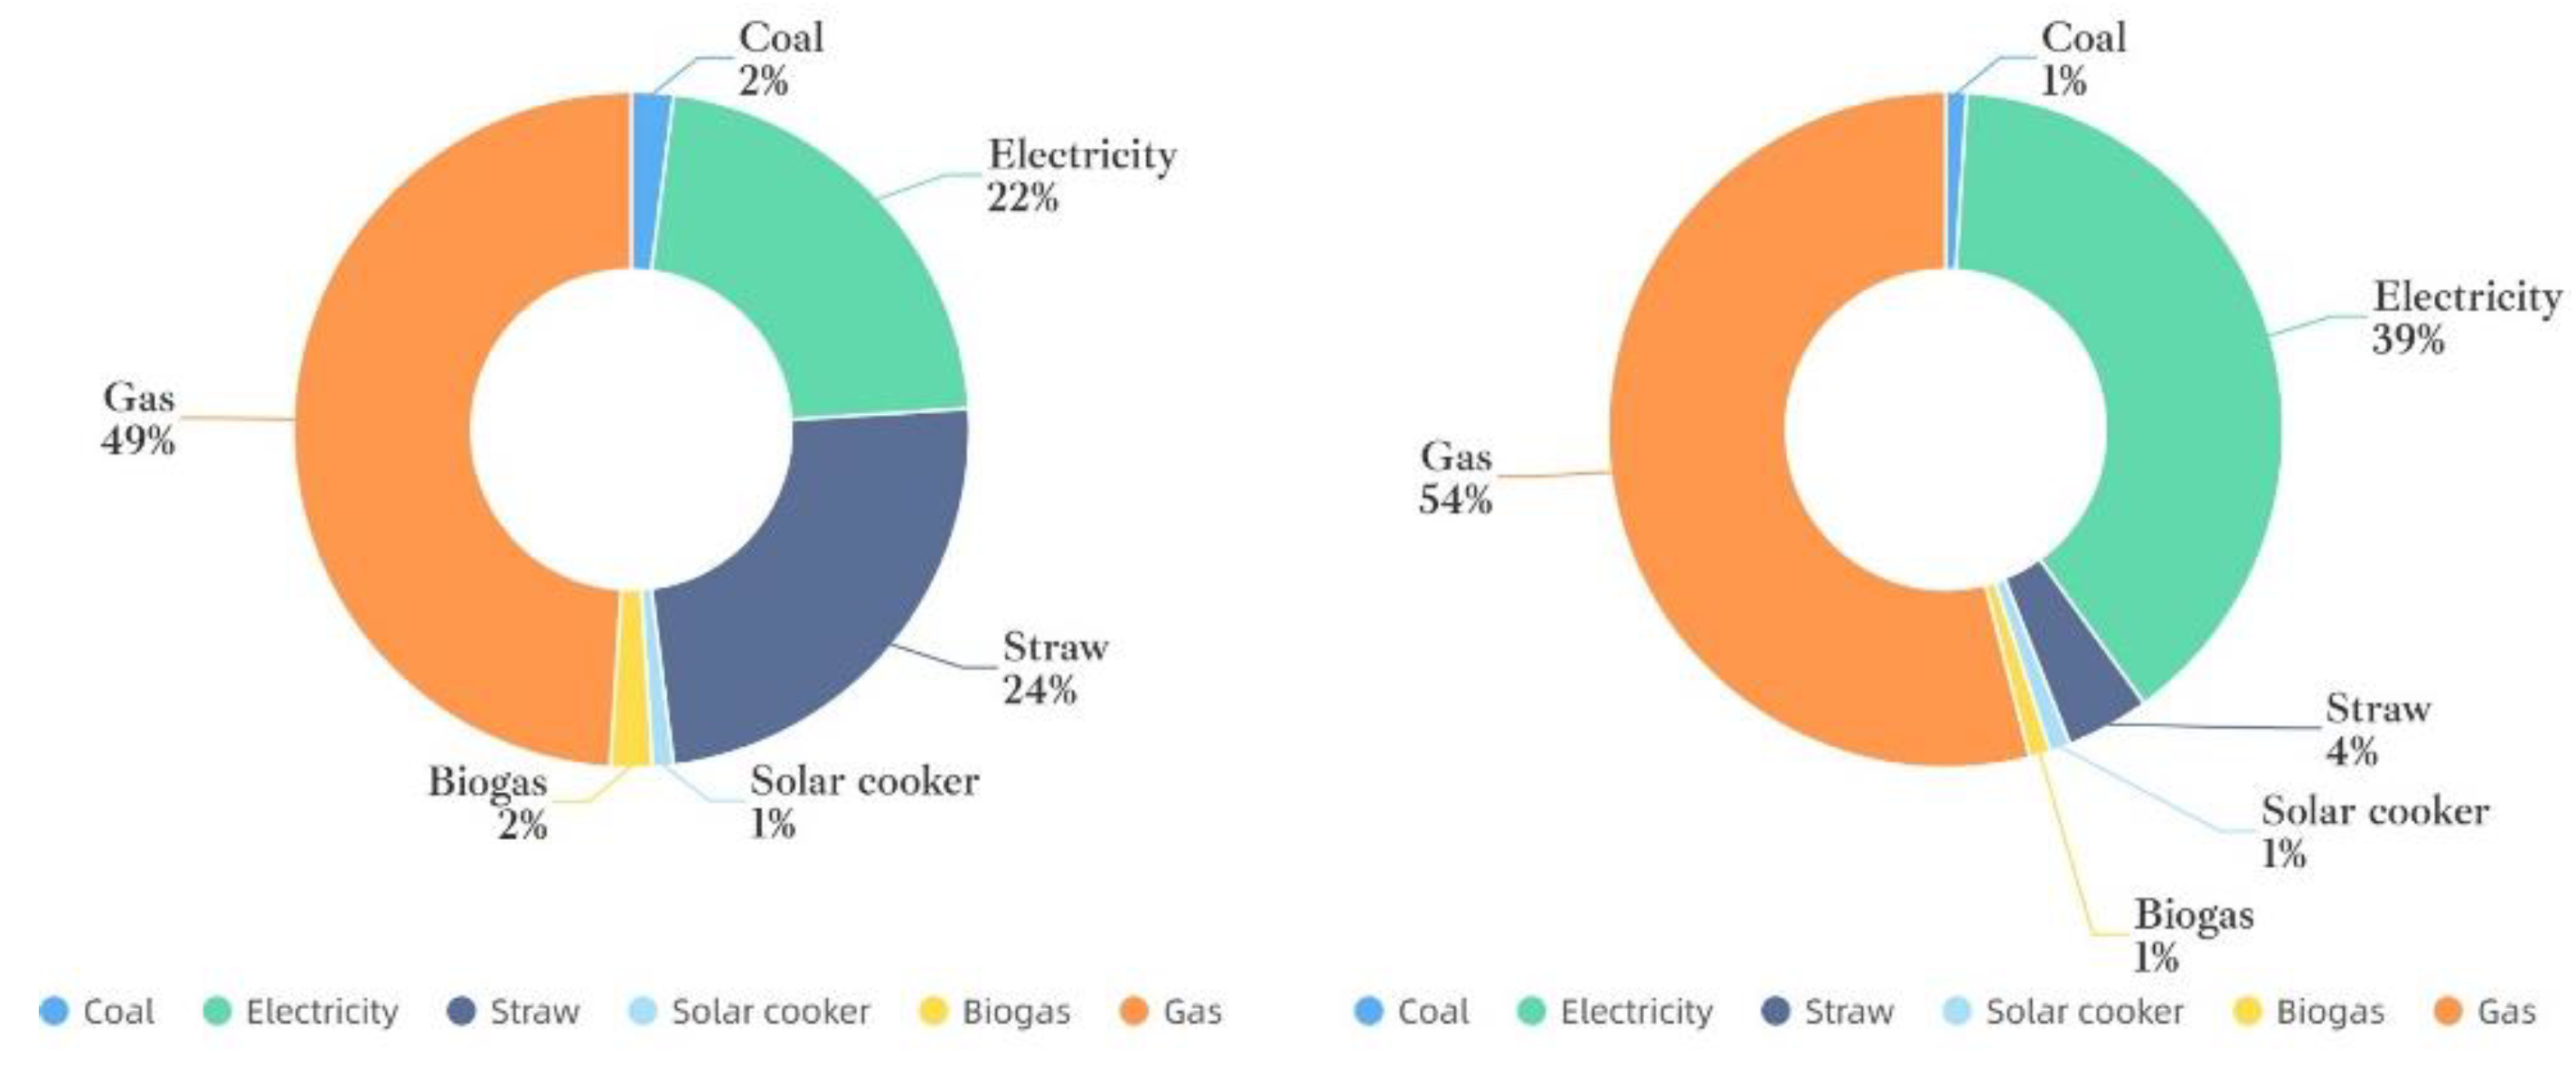
Since there is a phenomenon of "multiple energy sources" in household cooking energy consumption, we first analyze the main cooking energy sources (the most consumed energy sources in cooking activities). There are seven main types of cooking energy sources in this survey, including coal, straw, electricity, gas (LPG, natural gas, etc.), biogas, solar cookers, and others. The main cooking energy structure of households in the south of Yangtze River in China was obtained by counting and calculating the questionnaires. We found that gas and electricity are the main sources of cooking energy in households, with the highest percentage of households using gas (46%) and electricity (37%). 14% of households using non-clean energy sources such as coal or straw as the main source of cooking energy. In the case of developing countries, there are still spatial differences in household energy consumption, and the uneven and insufficient development of energy markets profoundly affects energy equality between urban and rural areas [
30,
31,
32,
33,
34]. Therefore, we counted the main cooking energy sources of urban and rural households separately and obtained the difference in energy consumption structure between urban and rural households, as shown in
Figure 9. The results show that the proportion of gas and electricity in the cooking energy of urban and rural households is higher than that of other energy sources, but the proportion of gas and electricity in the cooking energy of urban households is significantly higher than that of rural households. The housing infrastructure in urban areas is relatively complete, and most areas are equipped with natural gas pipelines, so more urban households choose to use natural gas for daily cooking activities than rural households. In rural areas where natural gas pipelines are not available, liquefied petroleum gas (LPG) is the main source of cooking energy as a convenient source of cooking energy. Electricity is used by 39% and 22% of households in urban and rural areas respectively, and this part of daily cooking activities includes the use of electric rice cookers and induction cookers. In rural areas, biomass energy sources such as crop straw and firewood are more readily available, so rural households rely more on straw than electricity for cooking activities, with 24% of this energy use. The use rate of coal and biogas in household cooking activities is low at 1%. In general, urban and rural households rely on clean energy sources such as gas and electricity for cooking activities, and the improvement of the cooking energy structure in rural households requires a further reduction in the use rate of firewood and straw.
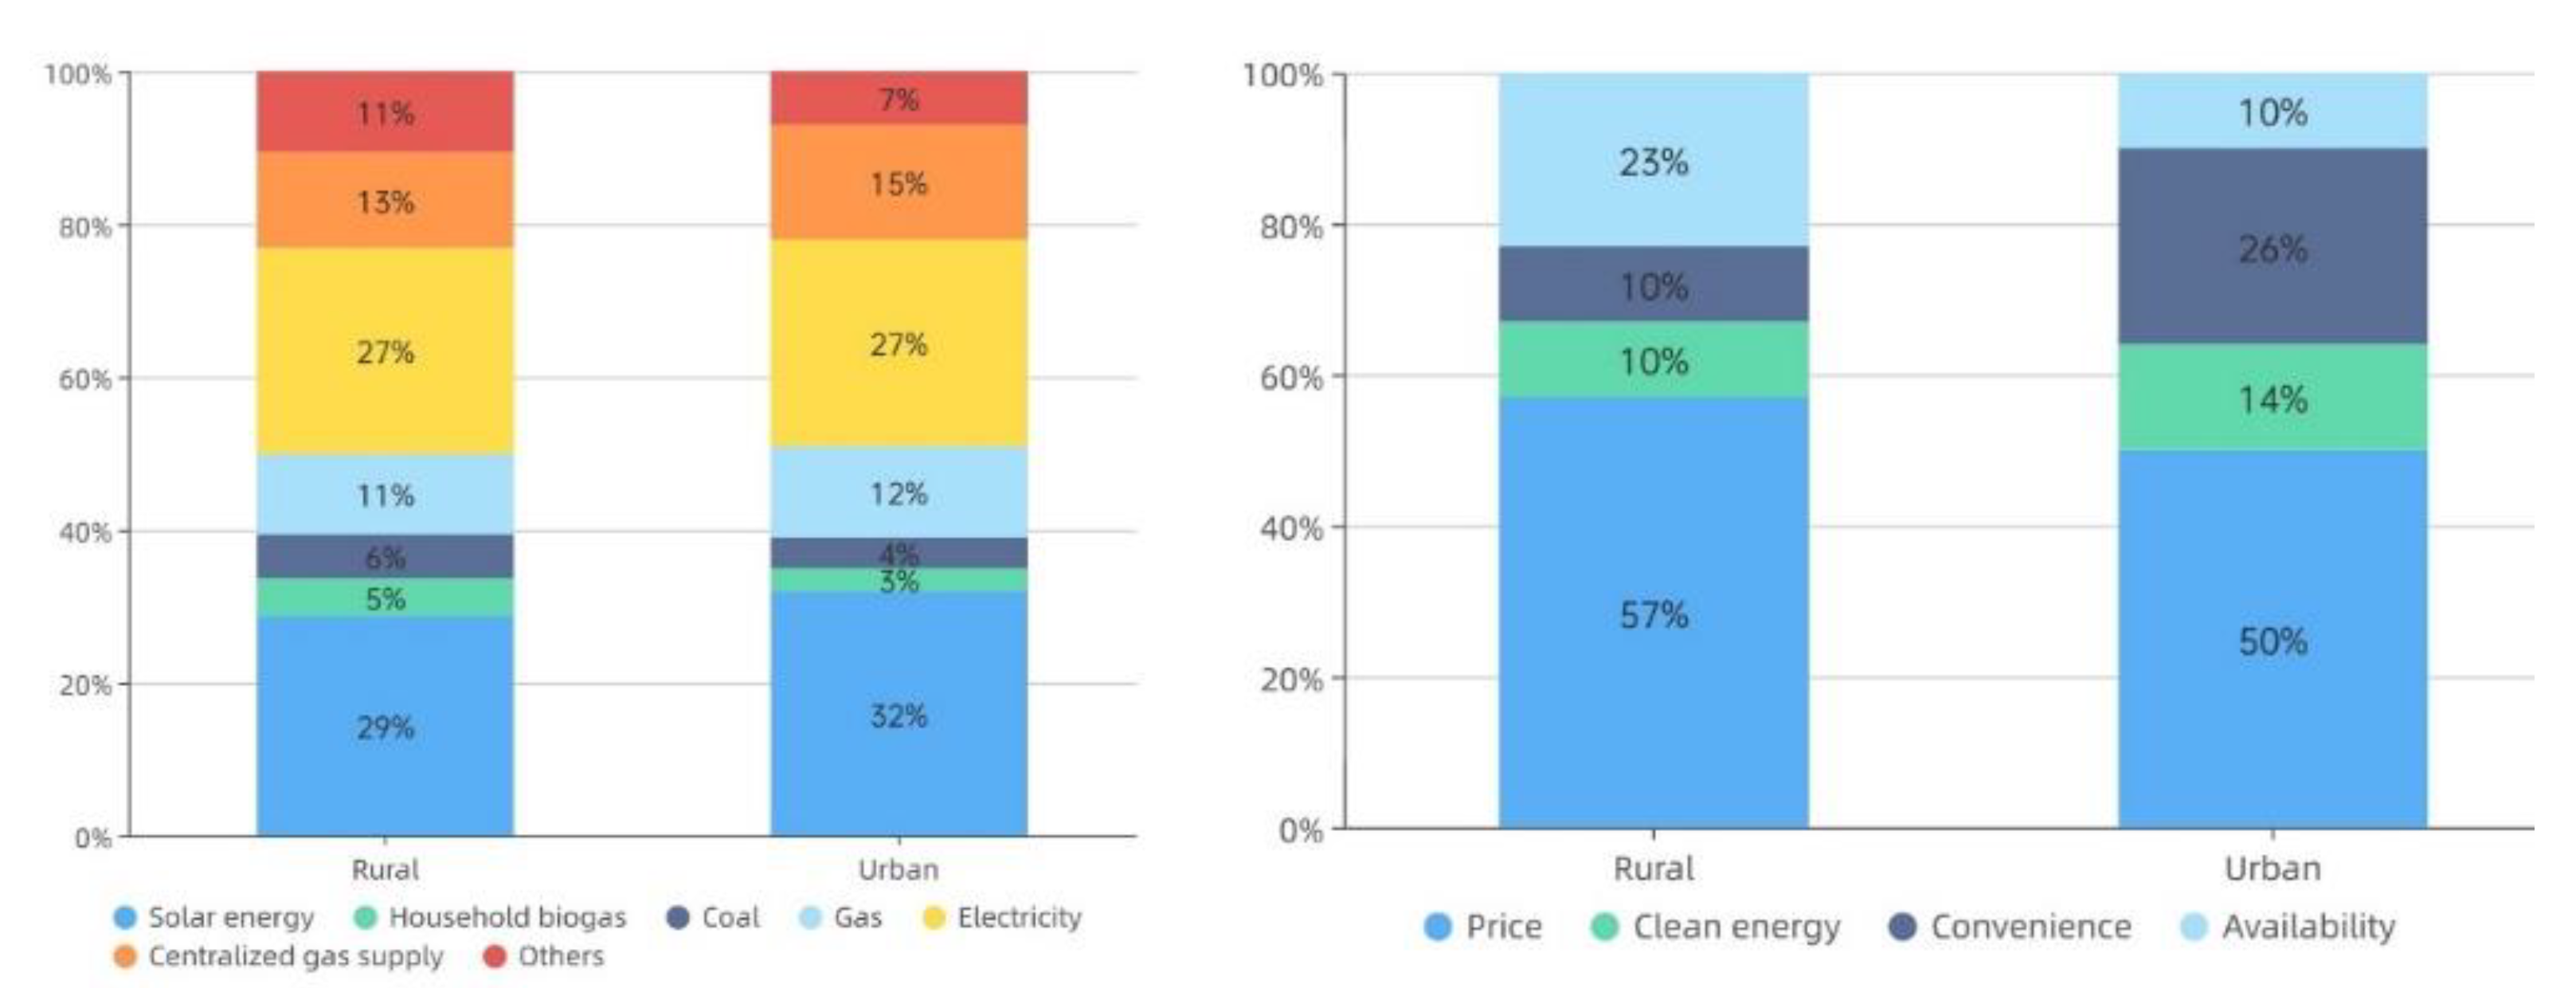
We analyzed the energy use preference of the residents in the survey questionnaire, as shown in
Figure 10. From the figure, we found that both rural and urban residents prefer to use electricity and solar energy for cooking. When rural residents ranked the energy use of their lives, 57% of them gave priority to saving money, while only 10% of them placed the use of clean energy in the first place. It can be seen that most rural residents place more emphasis on affordability when choosing cooking energy. In addition, some residents mentioned that there are sometimes power outages in rural areas, during which they are unable to use appliances and thus choose to use non-clean cooking fuels such as straw and firewood. These may be the reasons for the relatively low percentage of the rural population relying on clean energy for cooking.
When urban residents ranked the basis of energy use, 50% of them gave priority to saving money, but at the same time, 26% of them placed convenience in the first place, which is 16 percentage points higher than the 10% of rural residents. Compared to rural residents, the majority of urban residents prioritize saving money as their first consideration, while also considering the convenience of energy use. Therefore, although coal and gas (mainly LPG) have price advantages, urban residents tend to give preference to clean energy such as natural gas, which is already popular in urban area as a cooking fuel. The greater availability and ease of use of clean energy and technologies in urban areas may be an important reason for the relatively high proportion of people relying on clean cooking energy in towns and cities.
3.3. Analysis of rural cooking energy use
At present, rural areas in some regions of China are still dominated by traditional energy supply, and the quality of bulk coal used in rural areas is poor, with high ash and sulfur content, and the clean use of modern energy needs to be further improved; the energy consumption level has been hovering at a low level for a long time, and the gap with urban areas is increasing, with large differences in different provinces and regions[
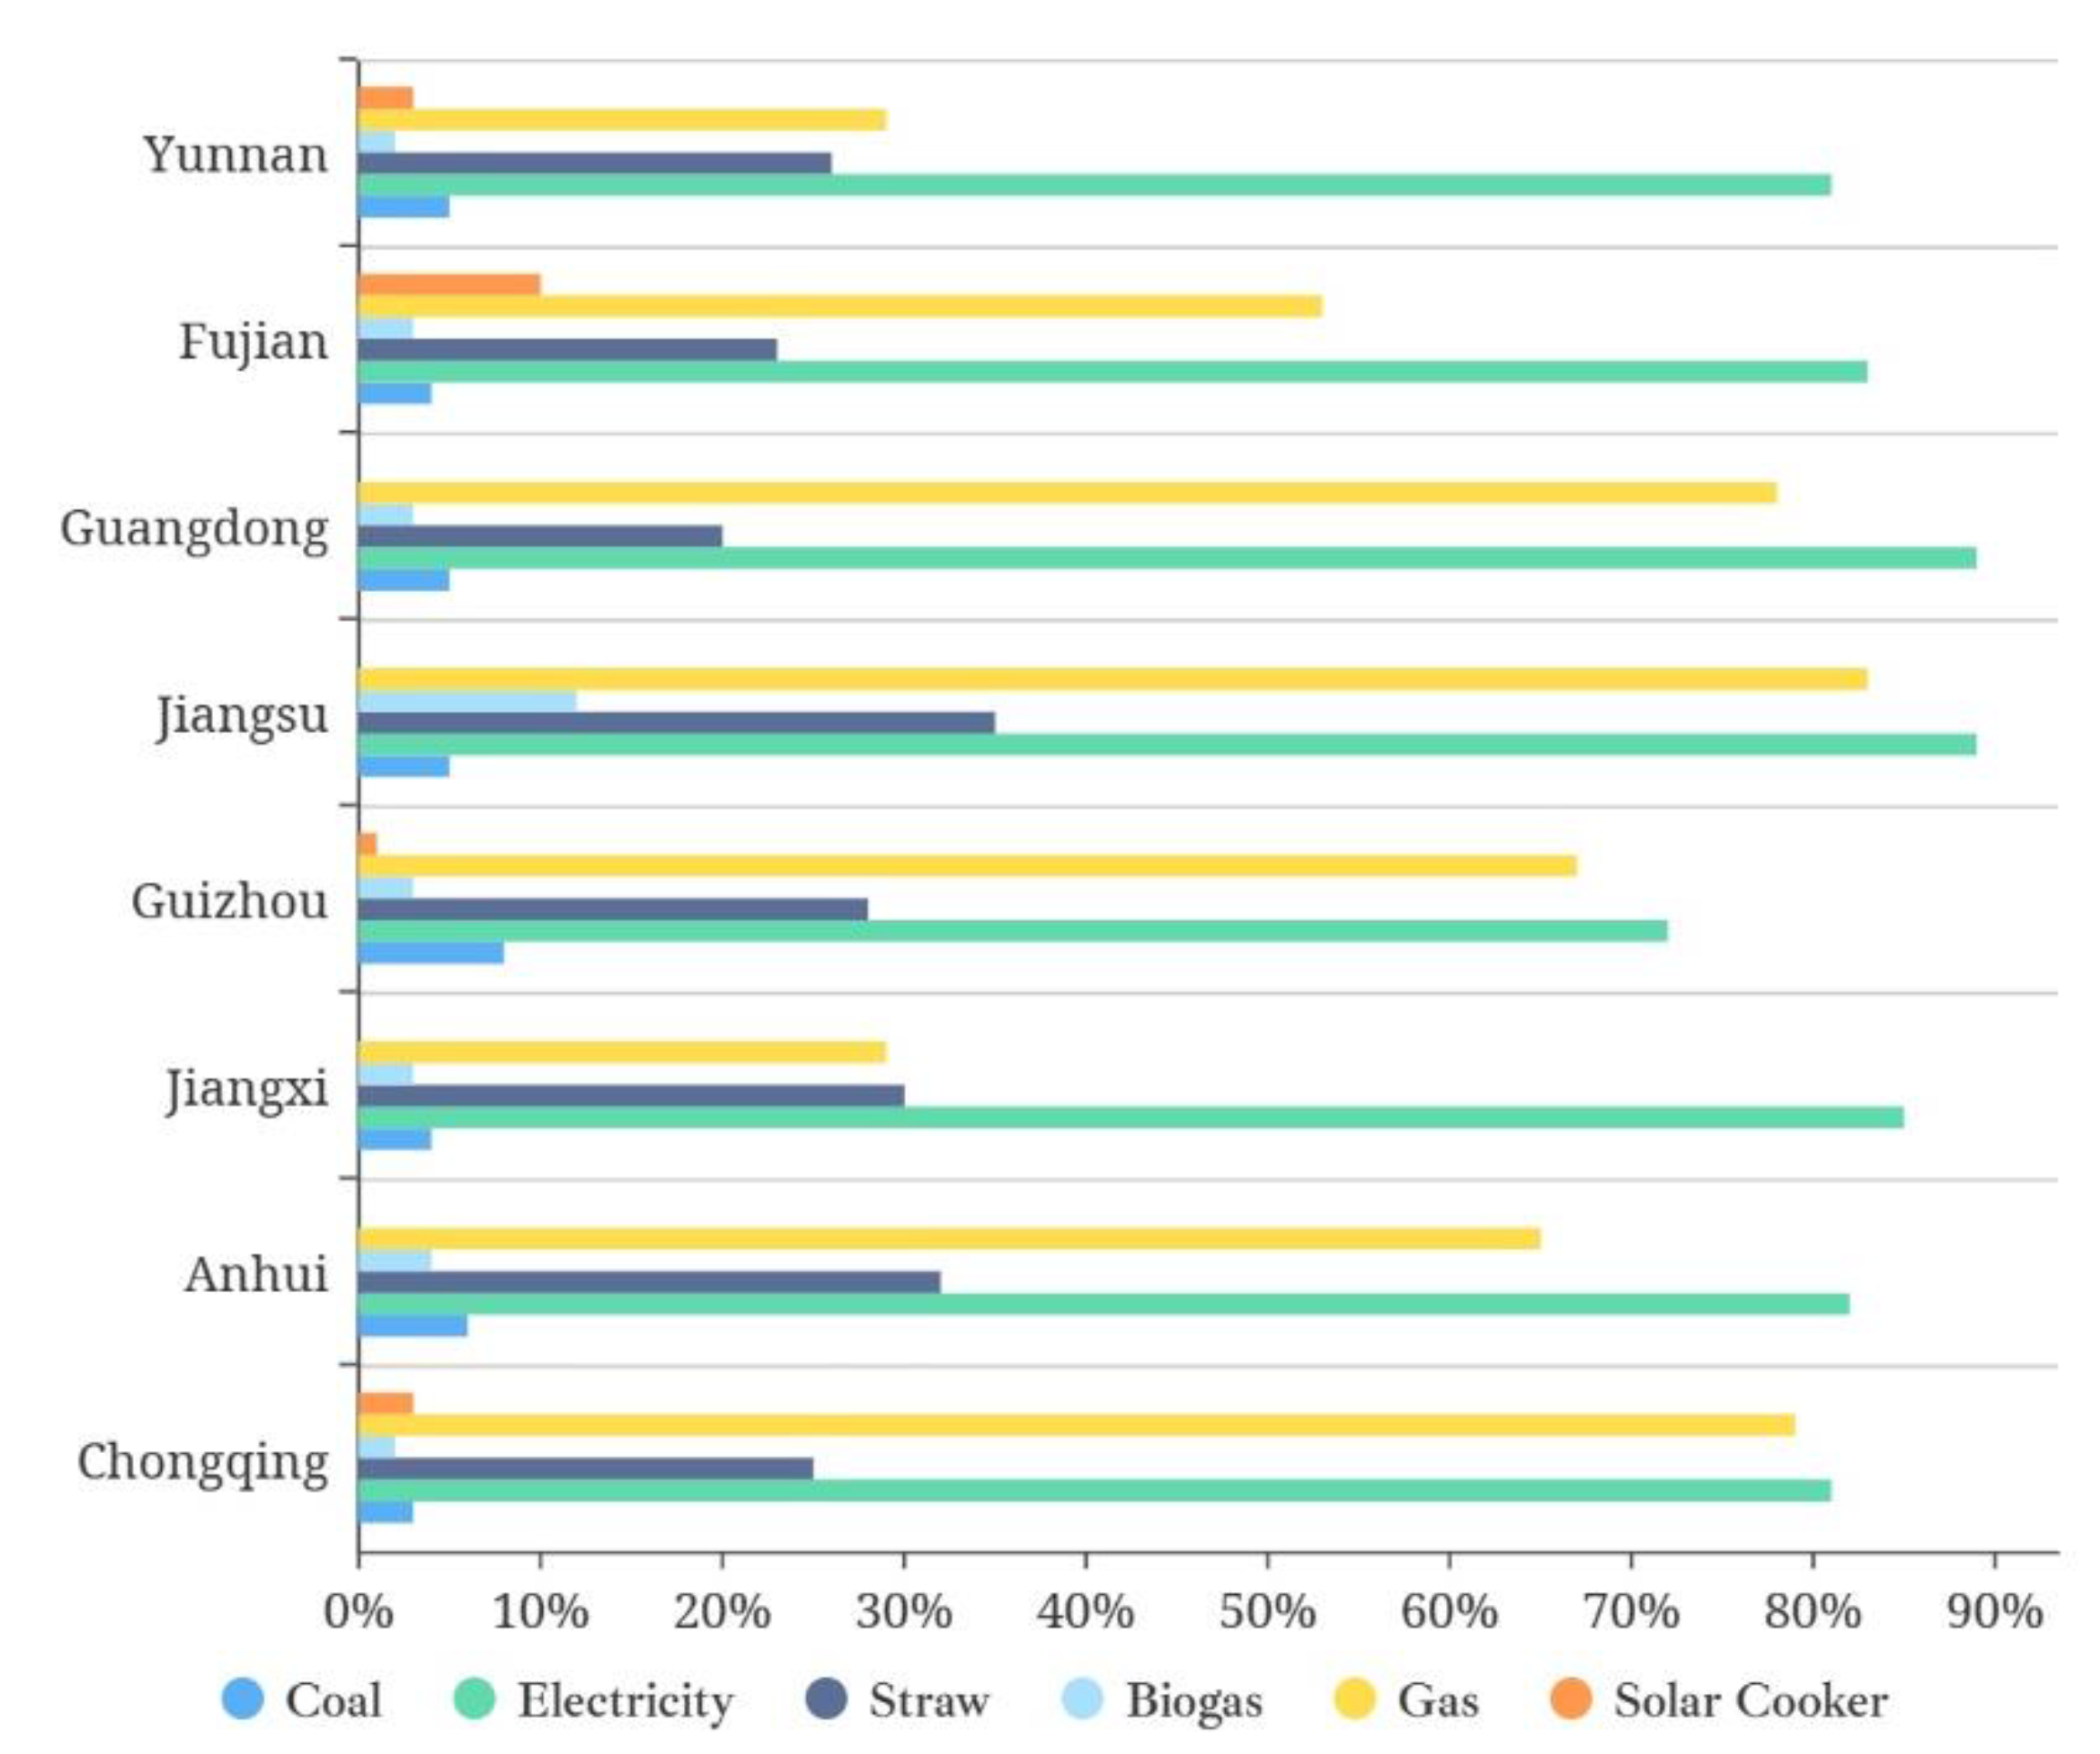
35], so it is necessary to further analyze the energy use in rural cooking. Statistics on the use of various types of energy in each household in the sample provinces and cities, as shown in
Figure 11, reveal that the rural households that use gas and electricity in their cooking activities account for the largest proportion, followed by straw.
3.3.1. Coal
In recent years, China's energy business has achieved historical achievements from scratch to rapid development, from "coal-based" to "clean and diversified" development. Therefore, the proportion of using coal for cooking in each sample province is low. The highest proportion in the survey sample area is Guizhou Province (8%), followed by Anhui Province (6%), and the lowest is Chongqing City, with only 3%. The demand for coal among rural residents in China shows spatial differences. On the other hand, it also indicates that the coal consumption of rural residents in each province shows certain regional characteristics. The difference in resource endowment may be the reason for the large difference in cooking energy consumption between regions. From the regional distribution of coal industry chain producers in China, the midstream producers of the coal industry chain are mainly distributed in Shanxi, Guizhou and Inner Mongolia regions. The availability of resources directly determines the level of demand of the residents, and therefore Guizhou has the highest proportion of coal in rural areas for cooking activities.
3.3.2. Electricity
For the past few years, the Chinese government has attached importance to environmental pollution control and low-carbon development, and has increased support for renewable energy. 100% electricity penetration has been achieved in China by the end of 2015. Overall, the proportion of cooking with electricity (electric rice cooker, induction cooker, etc.) has reached over 70% in all regions, but there are certain spatial differences. The level of household income is an important influencing factor, and the questionnaire shows that most households with an annual income of less than 50,000 yuan will not choose electricity for daily cooking activities. Therefore, the proportion of electric energy consumption is higher in provinces with generally higher economic levels, such as the more developed coastal areas of Jiangsu and Guangdong, where the proportion of using electric energy as cooking energy is as high as 89%, while the lowest proportion of relying on electric energy for cooking is 72% in the relatively underdeveloped western part of the economy.
3.3.3. Straw
The pattern of straw energy consumption in China is consistent with the distribution of crops. Due to the geographical environment and climatic conditions, the distribution of crop straw resources in China is generally characterized by a stepped distribution of "high in the east and low in the west, high in the north and low in the south" [
36]. China's straw resources are mainly concentrated in Northeast China, North China and the middle and lower reaches of the Yangtze River, accounting for 20.7%, 24.6% and 22.3% of the country's total straw resources respectively, and most of these regions belong to the key development zones of China's straw resources[
37]. Survey data show that Jiangsu, Anhui and Jiangxi provinces, which belong to the middle and lower reaches of the Yangtze River, have the highest proportion of using straw for cooking activities, at 35%, 32% and 30% respectively. The average annual temperature of the middle and lower reaches of the Yangtze River is 14-18℃, and it is an important base for grain, oil and cotton production in China. It is also the most abundant water resource area in China, where crops can be ripe twice a year, the area south of the Yangtze River can develop a triple cropping system with double-season rice crops, so the amount of straw resources in the region is very large, and local farmers are used to using straw as the main fuel to meet their cooking needs.
3.3.4. Biogas
From the results of this survey, it can be found that the proportion of using biogas for cooking in the south of Yangtze River in China is small, except for Jiangsu which is 12%, other provinces and cities are below 5%. In the late 1950s, China vigorously promoted biogas energy and carried out large-scale construction of biogas for rural households, but the construction of biogas soon fell back due to the limitations of backward technology, regional differences and sector imbalance[
38]. At present, the effect of rural biogas projects in China is not ideal. The survey results show that the utilization rate of rural biogas digesters is about 61.4%. The main reasons include inadequate management of biogas digesters, increased cost of building biogas digesters, low rate of mechanization[
39] and hard-to-solve faults, etc. There are many phenomena of abandoning biogas digesters, and the enthusiasm of farmers to use biogas digesters is low. The number of household biogas additions nationwide has been decreasing year after year, and the number of household biogas scraps has been increasing year by year. In 2017, In 2017, more than twice as many household biogas wastes were reported nationally as in 2016, reaching more than 1.5 million households in 2018. With a large number of household biogas reaching its normal service life, and the impact of policies such as village integration, ecological migration, poverty alleviation and relocation, farming structure adjustment, and delineation of no-farming zones, the total amount of China’s biogas production will probably continue to decrease in the next decade[
40].
3.3.5. Gas
The gas in this questionnaire includes liquefied petroleum gas, natural gas, and coal gas. In early 2021, the Central Document No. 1 on rural revitalization was officially released. When it comes to the construction of public infrastructure in the rural areas, it specifically mentions promoting gas to the countryside by supporting the construction of safe and reliable rural gas storage tank stations and micro-pipeline network gas supply systems. According to data from the China Urban and Rural Construction Statistical Yearbook, China's rural gas penetration rate increased from 19.8% in 2013 to 28.6% in 2018, an increase of 8.8%, including a faster growth rate of 6.1% from 2016 to 2018. However, nationally, due to economic conditions, pipeline network facilities and other factors, the current level of rural gas development is still low, with penetration rates much lower than those in cities and towns, and there are obvious regional differences. Jiangsu and Guangdong use gas for cooking are over 75%, and the energy used for cooking in rural households in coastal areas has been electric and gasified, while Yunnan is less than 30%. According to the data, the village gas penetration rate in China was 82.28% in 2019, among which the village gas penetration rates in Jiangsu and Guangdong were higher, at 83.28% and 63.16%, respectively, so the proportion of using gas for cooking in the region was also higher.
4. Conclusions
Based on the big data of the Earth, this paper successfully calculates the proportion of the population in the south of the Yangtze River relying on clean cooking fuel and utilization technology by combining spatial analysis, questionnaire survey and statistical analysis. As a new technical solution and its application, the relevant conclusions and summary of the article are as follows:
(1) Firstly, this paper uses the administrative division vector data, land use data, "LJ1-01" nighttime light remote sensing image and other big data of the earth in data selection. Secondly, in the sampling survey, the impact of different factors on the survey area is considered to increase the weight of the results. From the final result, the proportion of population relying on clean cooking fuel and utilization technology in Guizhou Province is far lower than that in Guangdong Province, which is in line with the current situation of inter-provincial economic development. Therefore, this paper takes into account the lack of data continuity at the micro level while using the Earth's big data to quantify regional science, and the results are more reliable.
(2) According to the survey and calculation, the percentage of the population using clean cooking energy and technologies in the south of the Yangtze River in China is 88.25%, with 89.81% in urban areas and 79.87% in rural areas. Based on the statistics, we found that the proportion of people using clean cooking fuels and technologies is generally higher in urban areas than in rural areas, as rural households prioritize affordability when choosing cooking fuels, while urban households also consider the convenience of energy use. The more developed the economy and the higher the per capita income, the higher the proportion of the population using clean cooking fuels. This suggests that the proportion of the population using clean cooking energy is related to various factors, such as geographical location, the economic development of the city and the income of the population.
Due to the limitation of time and data, the study area of this paper only includes the south of the Yangtze River in China. Later, the investigation and calculation will be carried out in the north of the Yangtze River, so as to obtain the results of the proportion of people who rely on clean cooking fuel and utilization technology in the country, thus providing a scientific data basis for the relevant policies and plans of China's carbon peaking and carbon neutrality goals[
31].
Author Contributions
J.P., Y.Y. and Z.G. designed the research. Y.Y., Z.G. and Y.L. provided experimental assistance. J.P., Y.Y. and Z.G. analyzed the data. Y.Y. and Z.G. wrote and edited the manuscript. J.P. and Y.Y. corrected the manuscript. M.W. and H.Z. provided questionnaire suggestions. All authors have read and agreed to the published version of the manuscript.
Funding
Please add: This research was funded by Strategic Priority Research Program of the Chinese Academy of Science, grant number XDA19090131; Key R&D Program of Ningxia Autonomous Region: Ecological environment monitoring and platform development of ecological barrier protection system for Helan Mountain, grant number 2022CMG02014; Combined postgraduate training base construction project in Chongqing, grant number JDLHPYJD2019004.
Institutional Review Board Statement
Not applicable.
Informed Consent Statement
Not applicable.
Data Availability Statement
Not applicable.
Acknowledgments
The authors would like to thank the teachers and students for their help with questionnaire collection and also gratefully acknowledge the residents participating in the questionnaire survey.
Conflicts of Interest
The authors declare no conflict of interest.
References
- IEA (2021), Global Energy Review 2021, IEA, Paris.
- Jana, C.; Bhattacharya, S.C. Sustainable Cooking Energy Options for Rural Poor People in India: An Empirical Study. Environ Dev Sustain 2017, 19, 921–937. [Google Scholar] [CrossRef]
- Saha, A.; Razzak, Md.A.; Khan, M.R. Electric Cooking Diary in Bangladesh: Energy Requirement, Cost of Cooking Fuel, Prospects, and Challenges. Energies 2021, 14, 6910. [Google Scholar] [CrossRef]
- Bisu, D.Y.; Kuhe, A.; Iortyer, H.A. Urban Household Cooking Energy Choice: An Example of Bauchi Metropolis, Nigeria. Energ Sustain Soc 2016, 6, 15. [Google Scholar] [CrossRef]
- Ankrah Twumasi, M.; Jiang, Y.; Addai, B.; Asante, D.; Liu, D.; Ding, Z. Determinants of Household Choice of Cooking Energy and the Effect of Clean Cooking Energy Consumption on Household Members’ Health Status: The Case of Rural Ghana. Sustainable Production and Consumption 2021, 28, 484–495. [Google Scholar] [CrossRef]
- Pandey, V.L.; Chaubal, A. Comprehending Household Cooking Energy Choice in Rural India. Biomass and Bioenergy 2011, 35, 4724–4731. [Google Scholar] [CrossRef]
- DeFries, R.; Pandey, D. Urbanization, the Energy Ladder and Forest Transitions in India’s Emerging Economy. Land Use Policy 2010, 27, 130–138. [Google Scholar] [CrossRef]
- Amoah, S.T. Determinants of Household’s Choice of Cooking Energy in a Global South City. Energy and Buildings 2019, 196, 103–111. [Google Scholar] [CrossRef]
- Shen, G.; Xiong, R.; Tian, Y.; Luo, Z.; Jiangtulu, B.; Meng, W.; Du, W.; Meng, J.; Chen, Y.; Xue, B.; et al. Substantial Transition to Clean Household Energy Mix in Rural China. National Science Review 2022, 9, nwac050. [Google Scholar] [CrossRef]
- IEA (2017), Energy Access Outlook 2017, IEA, Paris.
- Hu, S.; Yan, D.; Guo, S.; Cui, Y.; Dong, B. A Survey on Energy Consumption and Energy Usage Behavior of Households and Residential Building in Urban China. Energy and Buildings 2017, 148, 366–378. [Google Scholar] [CrossRef]
- Khandker, S.R.; Barnes, D.F.; Samad, H.A. Are the Energy Poor Also Income Poor? Evidence from India. Energy Policy 2012, 47, 1–12. [Google Scholar] [CrossRef]
- Zhong, H.; Feng, K.; Sun, L.; Cheng, L.; Hubacek, K. Household Carbon and Energy Inequality in Latin American and Caribbean Countries. Journal of Environmental Management 2020, 273, 110979. [Google Scholar] [CrossRef]
- Nguyen, T.T.; Nguyen, T.-T.; Hoang, V.-N.; Wilson, C.; Managi, S. Energy Transition, Poverty and Inequality in Vietnam. Energy Policy 2019, 132, 536–548. [Google Scholar] [CrossRef]
- Guruswamy L. Energy justice and sustainable development. Colorado Journal of International Environmental Law and Policy, 2010, 21(2): 231-275.
- Ma, S. Energy Consumption Inequality Decrease with Energy Consumption Increase: Evidence from Rural China at Micro Scale. Energy Policy 2021. [Google Scholar] [CrossRef]
- Xiaohua, W.; Chonglan, D.; Xiaoyan, H.; Weiming, W.; Xiaoping, J.; Shangyun, J. The Influence of Using Biogas Digesters on Family Energy Consumption and Its Economic Benefit in Rural Areas—Comparative Study between Lianshui and Guichi in China. Renewable and Sustainable Energy Reviews 2007, 11, 1018–1024. [Google Scholar] [CrossRef]
- Wang, R.; Jiang, Z. Energy Consumption in China’s Rural Areas: A Study Based on the Village Energy Survey. Journal of Cleaner Production 2017, 143, 452–461. [Google Scholar] [CrossRef]
- Fan, J.; Ran, A.; Li, X. A Study on the Factors Affecting China’s Direct Household Carbon Emission and Comparison of Regional Differences. Sustainability 2019, 11, 4919. [Google Scholar] [CrossRef]
- Hou, B.-D.; Tang, X.; Ma, C.; Liu, L.; Wei, Y.-M.; Liao, H. Cooking Fuel Choice in Rural China: Results from Microdata. Journal of Cleaner Production 2017, 142, 538–547. [Google Scholar] [CrossRef]
- Zhang, J.; Teng, F.; Zhou, S. The Structural Changes and Determinants of Household Energy Choices and Energy Consumption in Urban China: Addressing the Role of Building Type. Energy Policy 2020, 139, 111314. [Google Scholar] [CrossRef]
- Mao, S.; Qiu, S.; Li, T.; Tang, M.; Deng, H.; Zheng, H. Using Characteristic Energy to Study Rural Ethnic Minorities’ Household Energy Consumption and Its Impact Factors in Chongqing, China. Sustainability 2020, 12, 6898. [Google Scholar] [CrossRef]
- Li, Q.; Hu, J.; Yu, B. Spatiotemporal Patterns and Influencing Mechanism of Urban Residential Energy Consumption in China. Energies 2021, 14, 3864. [Google Scholar] [CrossRef]
- Shi, X.; Yu, J.; Cheong, T.S. Convergence and Distribution Dynamics of Energy Consumption among China’s Households. Energy Policy 2020, 142, 111496. [Google Scholar] [CrossRef]
- Zheng, X.; Wei, C.; Qin, P.; Guo, J.; Yu, Y.; Song, F.; Chen, Z. Characteristics of Residential Energy Consumption in China: Findings from a Household Survey. Energy Policy 2014, 75, 126–135. [Google Scholar] [CrossRef]
- Zhang, H.; Lahr, M. Households’ Energy Consumption Change in China: A Multi-Regional Perspective. Sustainability 2018, 10, 2486. [Google Scholar] [CrossRef]
- Xiaohua, W.; Kunquan, L.; Hua, L.; Di, B.; Jingru, L. Research on China’s Rural Household Energy Consumption -- Household Investigation of Typical Counties in 8 Economic Zones. Renewable and Sustainable Energy Reviews 2017, 68, 28–32. [Google Scholar] [CrossRef]
- Huang, J.; Li, W.; Guo, L.; Hu, X.; Hall, J.W. Renewable Energy and Household Economy in Rural China. Renewable Energy 2020, 155, 669–676. [Google Scholar] [CrossRef]
- Ma, X.; Wang, M.; Chen, D.; Li, C. Energy Choice in Rural Household Cooking and Heating: Influencing Factors and Transformation Patterns. Environ Sci Pollut Res 2021, 28, 36727–36741. [Google Scholar] [CrossRef]
- Phoumin, H.; Kimura, F. Cambodia’s Energy Poverty and Its Effects on Social Wellbeing: Empirical Evidence and Policy Implications. Energy Policy 2019, 132, 283–289. [Google Scholar] [CrossRef]
- 2018.
- Nord, M.; Kantor, L.S. Seasonal Variation in Food Insecurity Is Associated with Heating and Cooling Costs among Low-Income Elderly Americans. The Journal of Nutrition 2006, 136, 2939–2944. [Google Scholar] [CrossRef] [PubMed]
- Eichelberger, L.P. Living in Utility Scarcity: Energy and Water Insecurity in Northwest Alaska. Am J Public Health 2010, 100, 1010–1018. [Google Scholar] [CrossRef]
- Reddy A. Energy and Social Issues//World Energy Council and UNEP. Energy and the Challenge of Sustainability. New York, 2000.
- Wu, S.; Zheng, X.; You, C.; Wei, C. Household Energy Consumption in Rural China: Historical Development, Present Pattern and Policy Implication. Journal of Cleaner Production 2019, 211, 981–991. [Google Scholar] [CrossRef]
- Ming, C.; Li, Z.; Yi, T. Analysis and evaluation on energy utilization of main crop straw resources in China. Transactions of the CSAE, 2008,24(12):291-296.(in Chinese with English abstract).
- Hong, C.; Zong, Y.; Li, Z.; Hai, M.; Jiu, W.; Li, H.; Yan, Y.; Ji, J.; Teng X.; Yun, W. Distribution of crop straw resources and its industrial system and utilization path in China. Transactions of the Chinese Society of Agricultural Engineering (Transactions of the CSAE), 2019, 35(22): 132-140. (in Chinese with English abstract). [CrossRef]
- Giwa, A.S.; Ali, N.; Ahmad, I.; Asif, M.; Guo, R.-B.; Li, F.-L.; Lu, M. Prospects of China’s Biogas: Fundamentals, Challenges and Considerations. Energy Reports 2020, 6, 2973–2987. [Google Scholar] [CrossRef]
- Jiang, X.; Sommer, S.G.; Christensen, K.V. A Review of the Biogas Industry in China. Energy Policy 2011, 39, 6073–6081. [Google Scholar] [CrossRef]
- Gu, L.; Zhang, Y.-X.; Wang, J.-Z.; Chen, G.; Battye, H. Where Is the Future of China’s Biogas? Review, Forecast, and Policy Implications. Pet. Sci. 2016, 13, 604–624. [Google Scholar] [CrossRef]
|
Disclaimer/Publisher’s Note: The statements, opinions and data contained in all publications are solely those of the individual author(s) and contributor(s) and not of MDPI and/or the editor(s). MDPI and/or the editor(s) disclaim responsibility for any injury to people or property resulting from any ideas, methods, instructions or products referred to in the content. |
© 2023 by the authors. Licensee MDPI, Basel, Switzerland. This article is an open access article distributed under the terms and conditions of the Creative Commons Attribution (CC BY) license (http://creativecommons.org/licenses/by/4.0/).
