1. Introduction
Solid dosage forms are the most commonly used formulations for oral medications. They are simple to design and develop due to the availability of the active and non-active components of pharmaceutical products as solid materials. Additionally, solid dose forms pose fewer stability issues; most drugs are accessible in tablet or capsule form[
1]. However, combining different active ingredients in the same dosage form can result in numerous physicochemical, pharmacokinetic, and pharmacodynamic interactions[
2]. Therefore, the manufacturing of novel forms of fixed-dose combinations (FDCs) is increasing due to efforts to overcome active substance incompatibility or to obtain different drug release profiles in the same dosage form[
3]. The fixed-dose combination finished pharmaceutical product (FDC-FPP) can be defined as a "finished pharmaceutical product that contains two or more active ingredients" [
4]. Several approaches exist for developing and manufacturing fixed-dose combination tablets, including direct mixing and wet or dry granulation. To separate the active ingredients, one intra-granular, and the other extra-granular are prepared as a multilayer tablet[
3,
5]. One of its advantages is the possibility of manufacturing a stable fixed-dose combination in the same dosage form.
The World Health Organization (WHO) has adopted guidelines for registering fixed-dose combination medicinal products, including the following four scenarios [
6]: Scenario 1. The FDC-FPP is a generic product of an existing reference FDC-FPP product that contains the same active ingredients in equal quantities. Scenario 2. The FDC-FPP contains the same active ingredients and doses as the established regimen of single-entity products, and the dosage regimen is the same. Scenario 3 The FDC-FPP combines active ingredients of established safety and efficacy but have not previously been used in combination for this indication. Alternatively, the new FDC-FPP comprises a combination for which safety and efficacy have been established but that will be used in a different dosage regimen. Scenario 4. The new FDC-FPP contains one or more new chemical entities.
Rivaroxaban is an antithrombotic drug that directly inhibits factor Xa. It has been approved in numerous countries for thromboprophylaxis after elective hip or knee arthroplasty[
7,
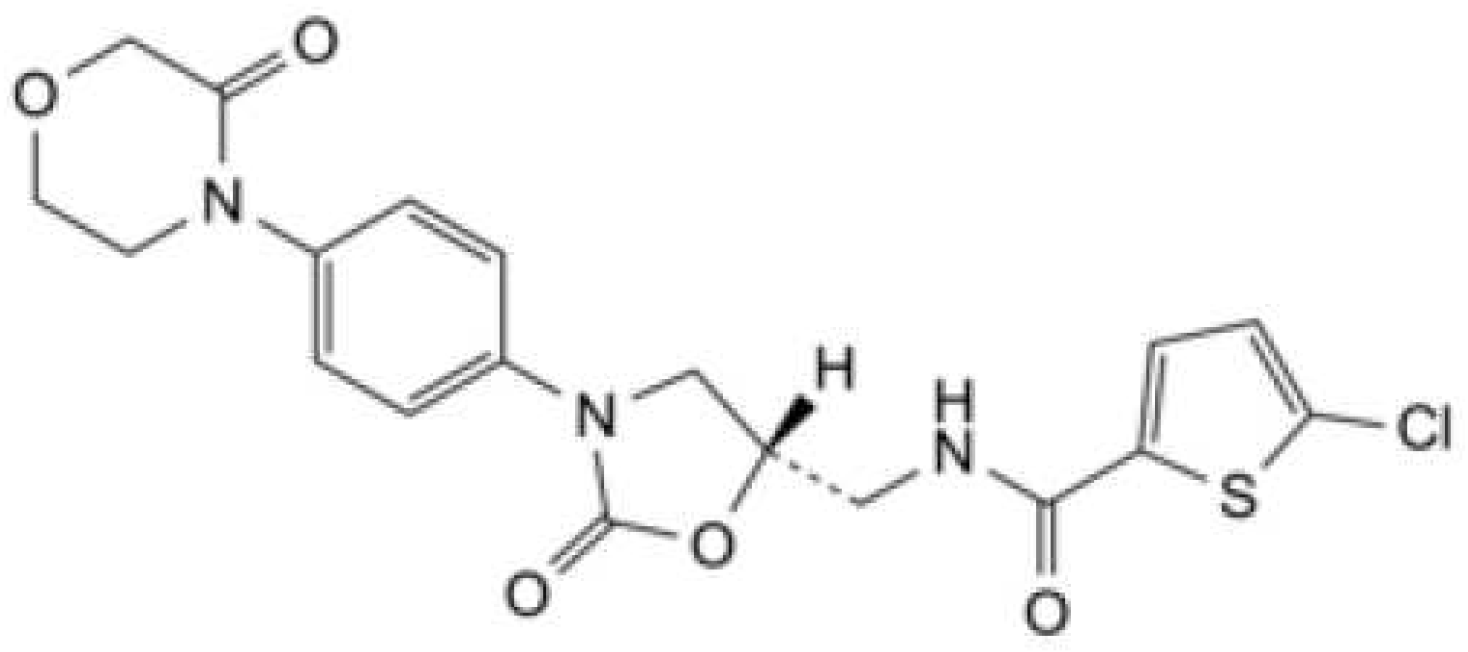
8]. Rivaroxaban is classified as a class II substance in the Biopharmaceutics Classification System (BCS), is practically insoluble in water, its absorption site is the proximal small intestine, its Tmax is 2-4 hours, its oral bioavailability is 80-100 %, and its chemical structure is shown in
Figure 1 [
9,
10].
Aspirin, also known as acetylsalicylic acid (ASA), is a non-steroidal anti-inflammatory (NSAID). ASA is also indicated to prevent blood clots, stroke, and myocardial infarction by reducing platelet aggregation[
11,
12,
13]. ASA is a highly soluble and permeable drug belonging to BCS Class I[
14]. Its chemical structure is shown in
Figure 2[
13].
Rivaroxaban, 2.5 mg in combination with ASA (a daily dose of 75 - 100 mg), is recommended for the prevention of atherothrombotic events in adult patients following an acute coronary syndrome (ACS) with elevated cardiac biomarkers, as well as for the prevention of atherothrombotic events in adult patients with coronary artery disease (CAD) or symptomatic peripheral artery disease (PAD) at high risk of ischemic events[
9,
15,
16]. Furthermore, when compared to aspirin alone, adding rivaroxaban lowers the risk of major vascular events in patients with symptomatic lower extremity peripheral artery disease[
17].
There is no fixed-combination drug containing Rivaroxaban and Aspirin, which offers a simple dosage schedule that improves patient compliance and treatment outcomes.
The recommended dose is Rivaroxaban 2.5 mg twice daily, whereas aspirin is also taken daily in 75 - 100 mg doses. Aspirin tablets are available in the market as 80 mg tablets, and when taken in combinations, the patient has to take Rivaroxaban 2.5 mg tablet twice and a single dose of Aspirin; this may confuse and increase the chance of forgetting the Aspirin dose or having doubt about taking the Aspirin dose, especially in elderly patients or patients suffering from multiple disorders.
Considering that aspirin has antiplatelet activity with a daily dose of 37.5 mg(12), the chosen fixed-dose tablets of rivaroxaban (2.5 mg) and aspirin (50 mg) were set to be taken twice daily and to provide 100 mg aspirin daily as the recommended dose[
17,
18].
The fixed-dose combination of ASA and Rivaroxaban tablet follows WHO scenario 3 as both active ingredients have well-established safety and efficacy and have different doses of aspirin. Therefore, this study aimed to create a fixed-dose combination pill of rivaroxaban (2.5 mg) and aspirin (50 mg). In addition, to develop and validate an HPLC analytical method for quantifying both active ingredients.
2. Materials and Methods
2.1. Materials
All ingredients and reagents used in this research were of pharmaceutical and analytical grades. Jerusalem Pharmaceuticals, Ramallah, Palestine, donated all materials, which included: rivaroxaban (Megafine Pharma (P)Ltd), aspirin (Hebei Jingye Medical Technology Ltd), croscarmellose sodium (Dupont nutrition IE Corck), sodium lauryl sulfate (BTC Europ GmbH), hypromellose E5 (Zhongbao chemicals co Ltd), microcrystalline cellulose PH-101 and PH-112 (JRS Pharma), lactose anhydrous (DFE Pharma), lactose monohydrate (Meggle GmbH), colloidal silicon dioxide (Evonik Resource Efficiency GmbH), stearic acid (Emery Olechemicals ), Methanol AR, Ortho-phosphoric acid and Acetonitrile AR (Sigma-Aldrich),
2.2. Instrumentation
DIONEX Ultimate 3000 was used for method development and validation. In addition, the HPLC was equipped with a Diode Array detector, Phenomenex C18 (150cm × 4.6 mm, 5µm) column, automatic injector, and a computer equipped with the analysis software Chromeleon Version: 7.2, Analytical balances types AS 60/220 R2, Dissolution Tester, and Tablet Press.
2.3. Compatibility Study
A compatibility study is a used to indicate possible interactions that may occur during product shelf-life between drug product components. Therefore, the excipients used in this research were chosen based on the excipients identified in reference products as listed in their summary of product characteristics [
19,
20]. As a consequence, rivaroxaban was investigated in combination with maize starch, colloidal silicon dioxide, and stearic acid, whereas aspirin was studied in combination with lactose, hydroxypropyl methylcellulose (Methocel E5), and sodium lauryl sulfate. Samples of binary mixtures with a ratio (1:1) were prepared and kept at ambient temperature and at 40°C/75% R.H. in either open or closed vials. The samples were prepared by taking approximately 200 mg of the material/mixture into a 15-ml Glass Vial Type I, with Rubber Closure, and closed with an Aluminum Cap. Samples were tested for visual description initially and after one month, and the worst-case samples (40°C/75%RH opened) after one month were tested for possible unknown individual impurities using the developed HPLC method. (Supplementary Material, Table A1).
2.4. Formulation Development
Several empirical formulae with various excipient proportions and manufacturing processes, such as direct compression and wet granulation, were used during the preformulation stage. Initially, a simple direct compression trial following geometrical mixing to enhance uniformity was conducted, and modifications in the formula and procedure were conducted based on physical and chemical test results and dissolution behavior assisted by dissolution profiles.
Table 1 and
Table 2 illustrate the direct-mixing and wet-granulation formulation trials, respectively. For direct mixing formulae, all ingredients were mixed geometrically, while for the wet granulation formulae, the wetting agent (Sodium Lauryl Sulfate) and binder (Hypromellose) were dissolved in the granulation solvent (isopropyl alcohol), Aspirin was added intra-granular in formula F5 while it was added extra-granular in formula F4. Moreover, a risk assessment of drug substance attributes was conducted to assess the effect of each attribute on the drug product critical quality attributes (CQAs). The supplementary materials (Tables A2–A6) summarize the assessment's findings. Tablets from the accepted formulation were blistered in aluminum foil and stored for three months in a climate chamber at 25 ±2°C/60 ±5% R.H. for stability assessment.
2.5. Dissolution Method Development
A semi-automated system was used to study the dissolution profile of both active ingredients from the tablets using a paddle-stirrer apparatus. Acetate buffer pH 4.5 (900 mL) was selected based on Aspirin tablets and Rivaroxaban tablets B.P. monographs. These conditions produce a sink condition for both active substances. The medium was degassed by heating, followed by vacuum filtration. The dissolving vessels were kept at 37 ± 0.5 ºC and covered to prevent evaporation. The test samples were collected at predetermined intervals (5, 10, 15, 30, and 45 min) and immediately filtered using nylon membrane disc filters, 0.45 µm. A validated HPLC-UV technique was used to determine the amount of drug released at each time point. The cumulative percentage of drug released was plotted against time to acquire the release profile and to calculate the in vitro dissolution data (n = 6). The dissolution characteristics of the aspirin and rivaroxaban tablets were evaluated using the similarity factor (f2).
2.6. Chromatographic Conditions
The mobile phase was prepared by mixing 300 mL acetonitrile with 700 mL phosphoric acid (0.1%). The mobile phase was filtered through 0.45 µ nylon membrane filters and degassed by sonication for 10 minutes prior to use. The analysis was performed using a DIONEX Ultimate 3000 HPLC instrument. The analysis used an analytical column Phenomenex C18 (150cm × 4.6 mm, 5µm). The chromatographic conditions were run as follows: detection wavelength: 240 nm, flow rate: 1.5 ml/min, ambient column temperature, and injection volume 25 µL.
2.7. Solutions Preparation
The solution preparation diluent was mobile phase acetonitrile: phosphoric acid 0.1% (30:70).
2.7.1. Stock Standard Solution of Rivaroxaban (0.05 mg/ml Rivaroxaban)
Rivaroxaban (5 mg) was carefully weighed, transferred to a 100-ml volumetric flask, dissolved with diluent, completed to volume with diluent, and mixed.
2.7.2. Stock Standard Solution of Aspirin (1 mg/ml aspirin)
Aspirin (100 mg) was carefully weighed, transferred to a 100-ml volumetric flask, dissolved with diluent, completed to volume with diluent, and mixed.
2.7.3. Nominal Standard Solution (0.005 mg/ml Rivaroxaban and 0.1mg/ml Aspirin)
5ml of each standard stock solution was transferred to a 50-ml volumetric flask and diluted to the final volume with diluent.
2.7.4. Nominal Sample Solution (0.005 mg/ml Rivaroxaban and 0.1mg/ml aspirin)
Ten tablets milled to fine powder, equivalent to the weight of two tablets, were transferred to a 100-ml volumetric flask, dissolved with diluent, completed to volume with diluent, and mixed. 5 ml of this solution was diluted to 50 ml with the diluent, then filtered using 0.45 µ membrane filters.
2.7.5. Stock Placebo Preparation
The weight of the placebo mixture was equivalent to two tablets and was transferred to a 100-ml volumetric flask, diluted with diluent, and mixed.
2.7.6. Nominal Placebo Preparation
5 ml of stock placebo solution was transferred to a 50-ml volumetric flask and diluted to the final volume with diluent.
2.8. Method Validation
The analytical method was validated following the ICH and FDA guidelines for validating analytical procedures[
21,
22]. The validation of the analytical methods addresses the following aspects: accuracy, precision, specificity, durability, and linearity range.
2.8.1. Linearity Range
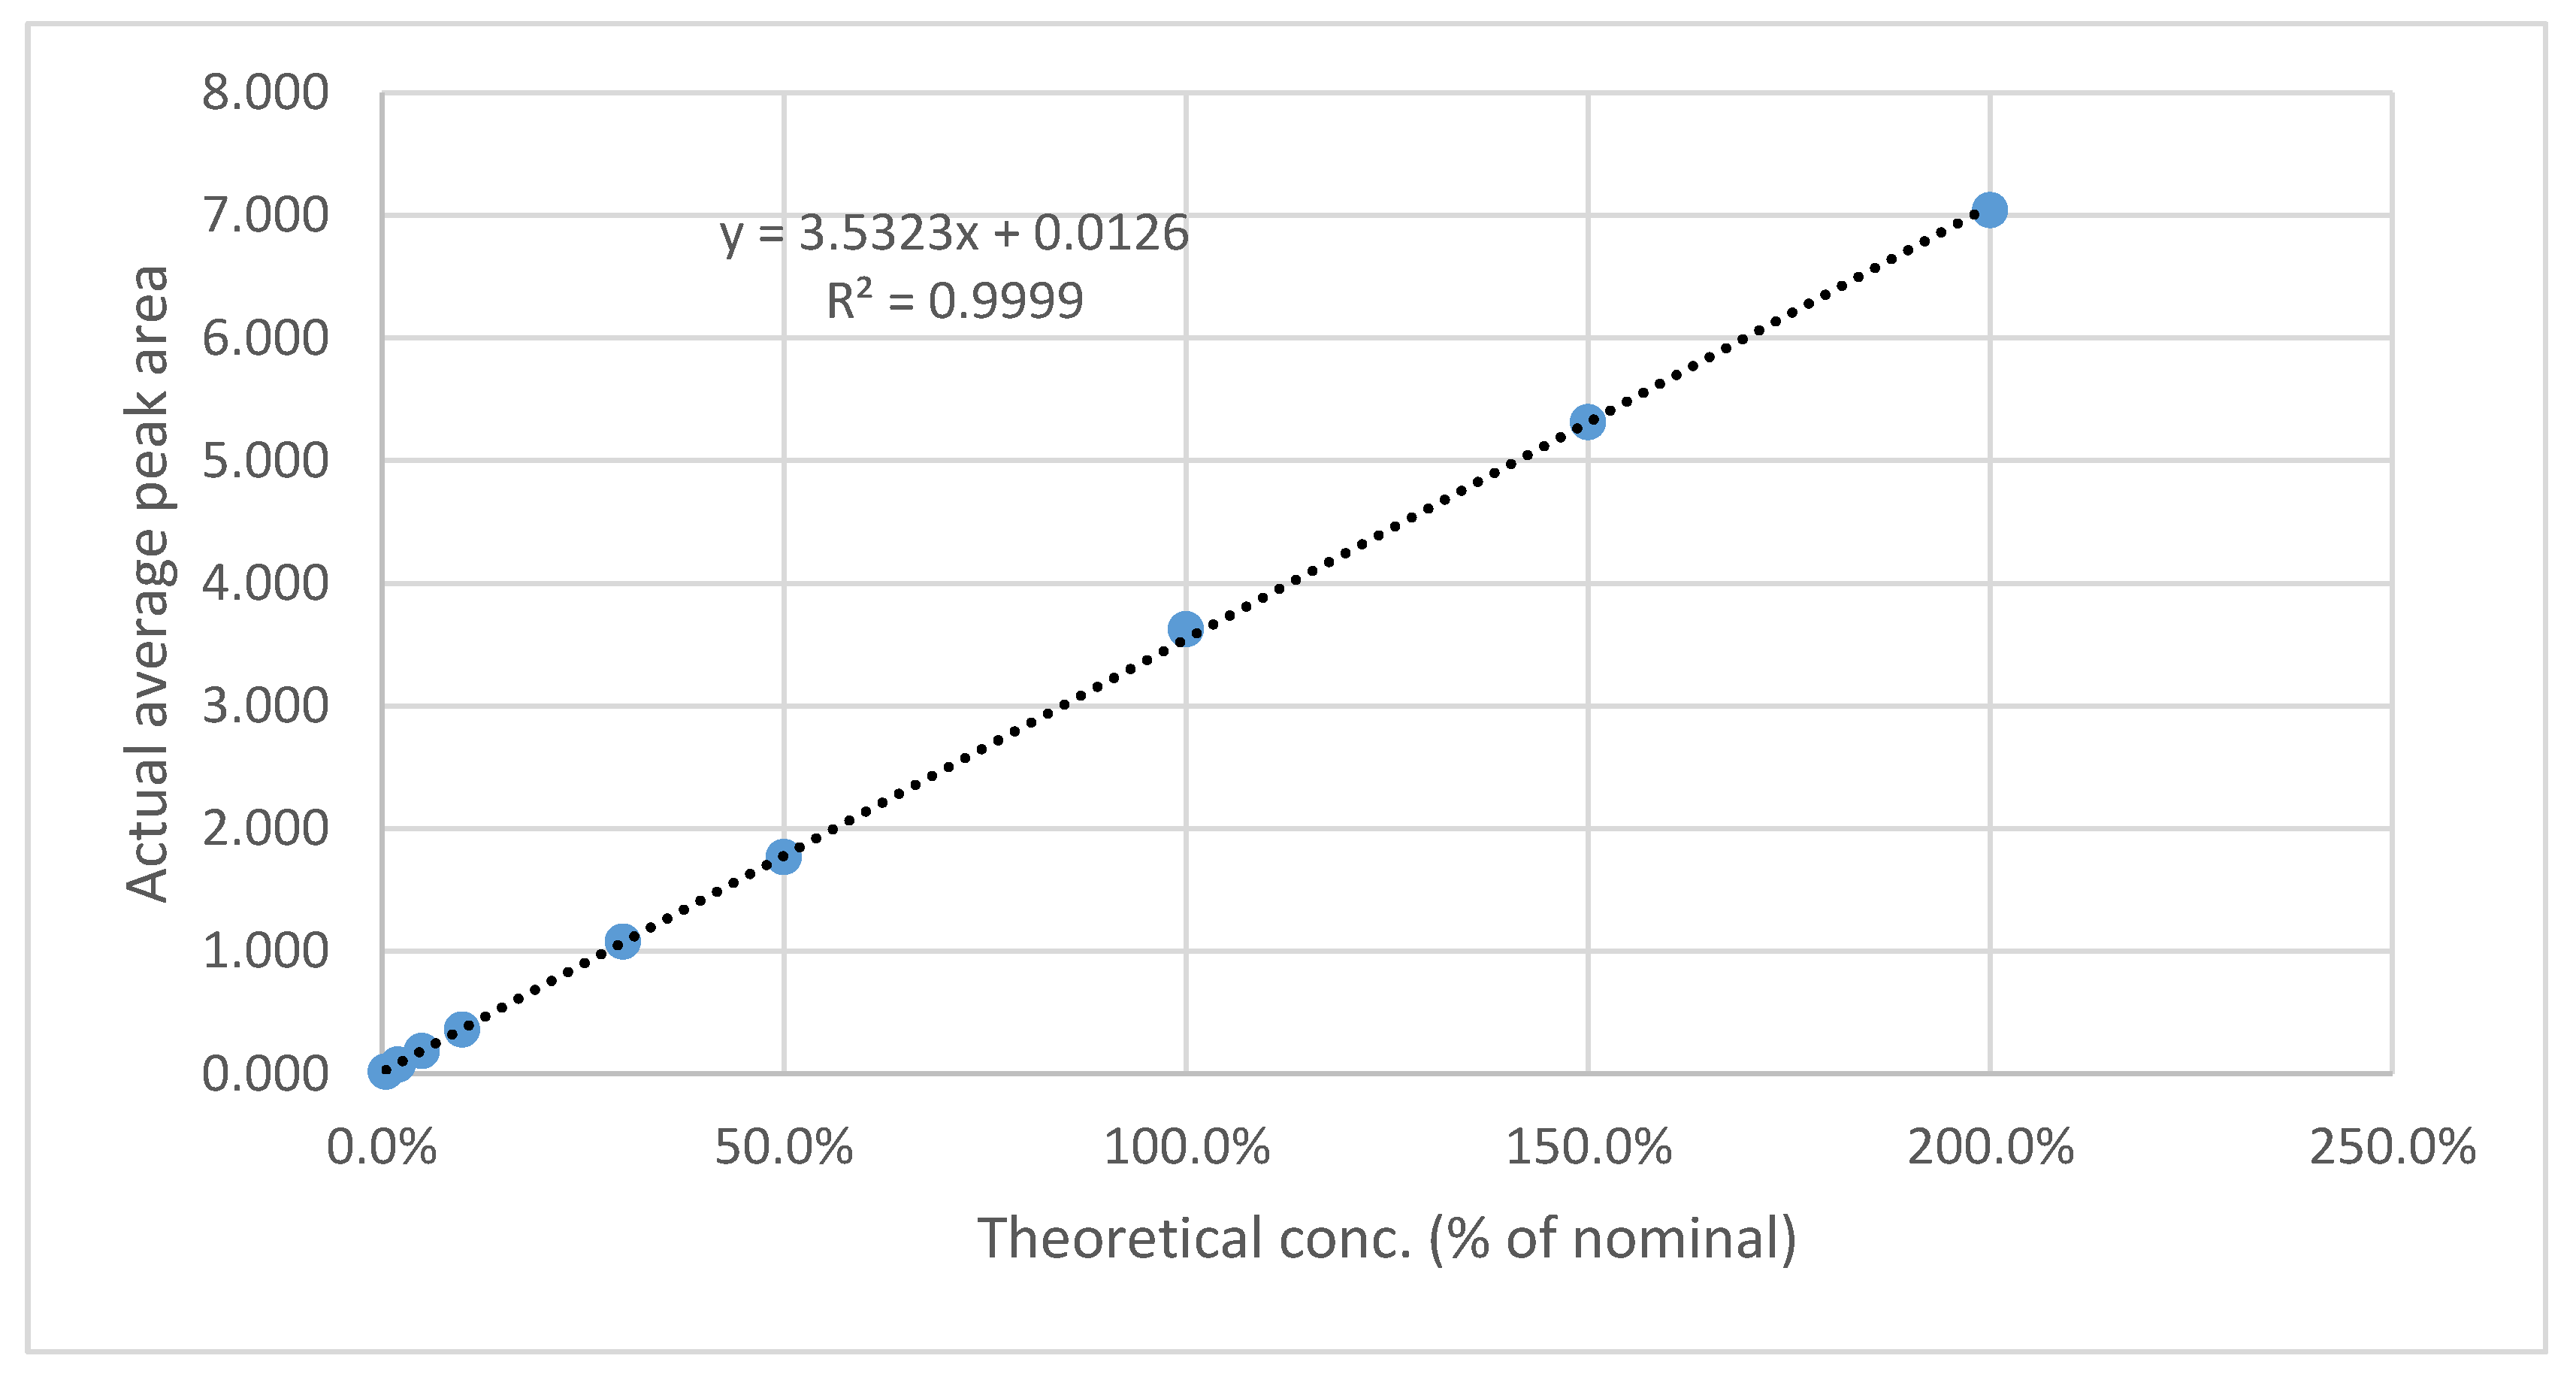
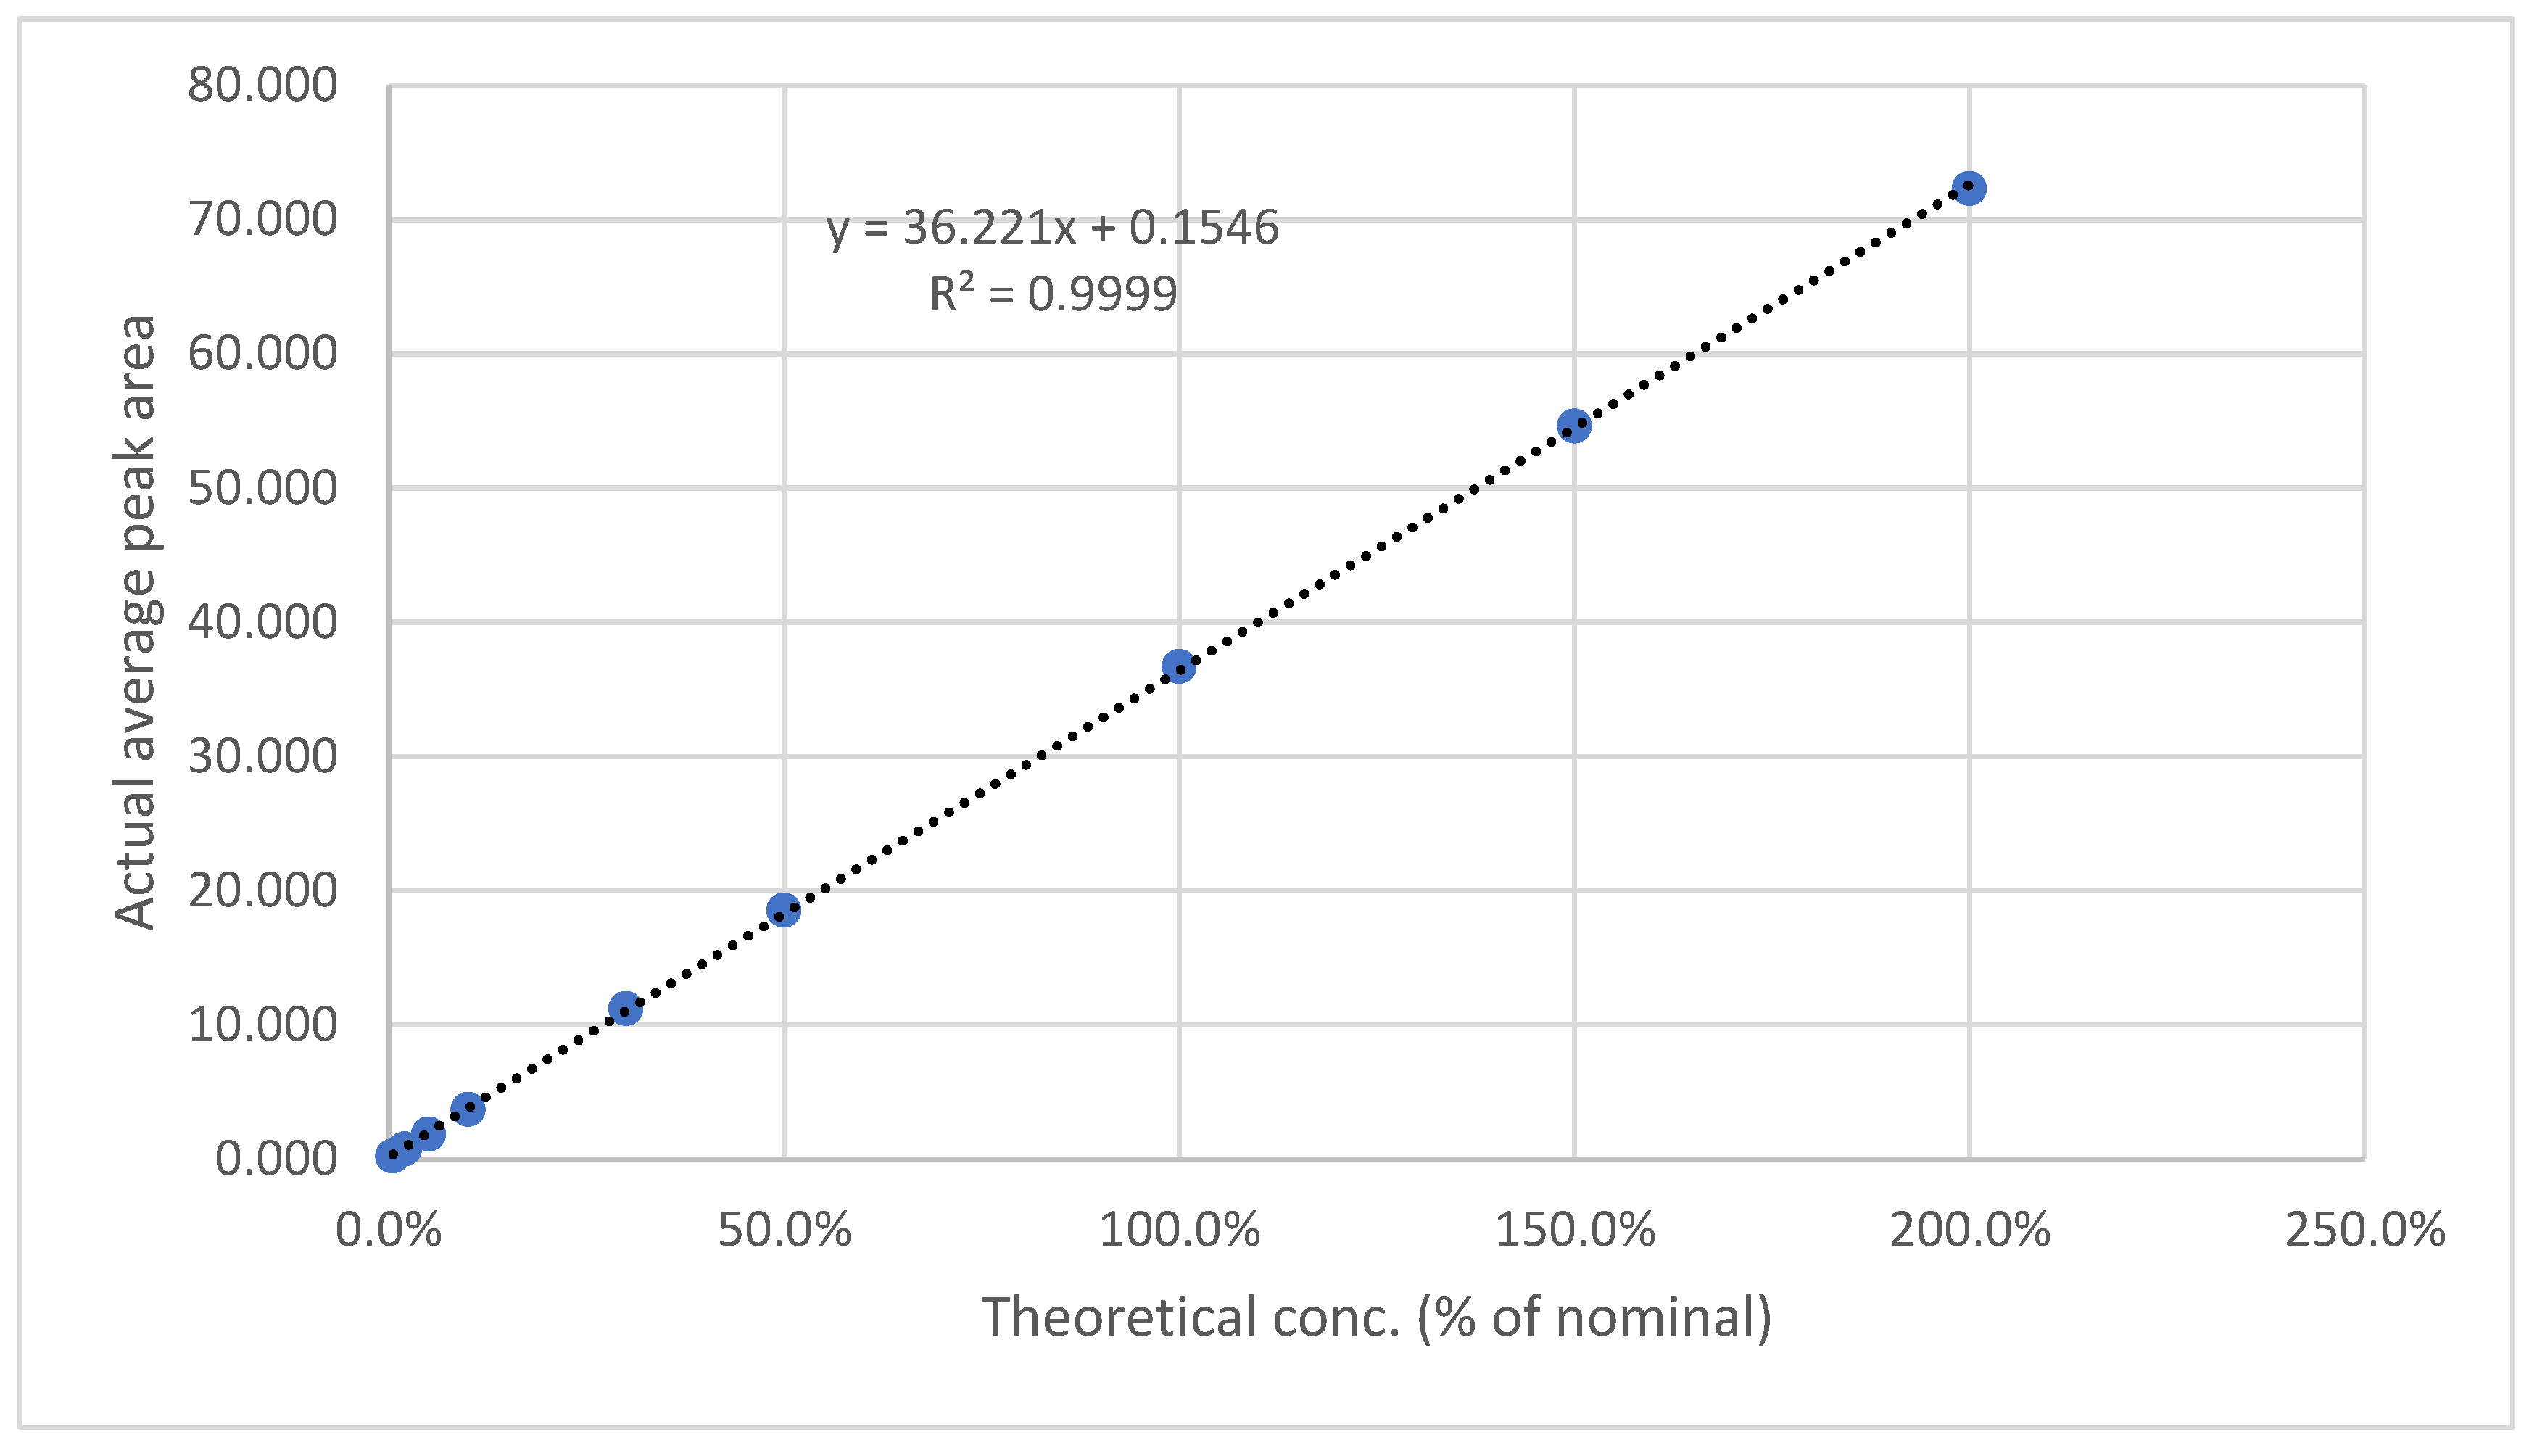
Analytical method linearity was used to evaluate the linear relationship between the concentration and the obtained results (peak area) within a range that should cover analytes with concentrations ranging from 80.0% to 120.0% for assays. For this purpose, various standard solutions for rivaroxaban and aspirin were prepared from standard stock solutions (0.05 mg/ml rivaroxaban and 1.0 mg/ml aspirin) to obtain solutions ranging from (0.5-200) % of the nominal concentration. Several concentrations of both actives (0.5, 2, 5, 10, 30, 50, 100, 150, and 200%) were prepared and analyzed, peak area vs. concentration was plotted, and correlation factor was calculated with acceptance criteria of correlation coefficient (R2) not less than 0.990 and RSD not more than 2.0%.
2.8.2. Precision
To evaluate whether a test method can produce similar findings after repeating the test or altering the equipment, analyst, or test day, known as Intermediate Precision (Ruggedness)[
23]. In the present study, six replicates of the nominal standard solution and six preparations of nominal sample solution were injected with an acceptance criteria of RSD of less than 2.0%.
2.8.3. Accuracy
The accuracy test measures the results of several previously spiked samples with a known quantity of the analyte to evaluate the closeness of the results obtained with the actual value.
Three solutions were prepared using a nominal placebo solution by adding standard solutions to achieve final concentrations of 2, 50, 100, and 200% for Rivaroxaban and 5, 50, 100, and 200% for Aspirin. Three samples were injected from each prepared solution, with the acceptance criteria of RSD not exceeding 10.0% for the lowest concentration within the limit of detection and RSD not exceeding 2.0% for the remaining points. Furthermore, the mean recovery should be within 100±2.0% of the nominal concentration at each concentration in the 5-200% range.
2.8.4. Specificity
One of the most important parameters of HPLC is its specificity, which refers to the capacity of the analytical method to differentiate between the analyte and other components in a complex mixture, including impurities, degradants, and matrix [
21]. When known impurities are available, as in the current drug product, specificity is evaluated by employing stress conditions, such as heat, oxidation, and acid-base hydrolysis.
Different reagents were added to the nominal sample solutions using the stock spiked sample solution (0.05/1.0) mg/ml, and stressed sample solutions were prepared according to
Table 3. The stressed sample solutions were analyzed using the test method for assay determination of Aspirin and Rivaroxaban in tablets. Requirements for acceptance criteria are that the Aspirin and Rivaroxaban W.S. peaks have a peak purity of NLT 980 and a degradation of 5 - 20%[
24].
2.8.5. Robustness
The method's robustness was confirmed by implementing minor and deliberate modifications of the experimental conditions. The parameters studied were wavelength and flow rate by injecting 6 replicates of nominal standard solution with modified wavelengths of 238 nm and 242 nm, with modified flow rates of 1.4 ml/min and 1.6 ml/min, respectively. The tested samples should not have an RSD of more than 2.0%.
2.8.6. LOD & LOQ
The Limit of detection (LOD) is defined as the lowest amount of analyte that can be detected, whereas the limit of quantitation (LOQ) is the lowest amount of analyte that can be quantified with suitable Precision [
25].
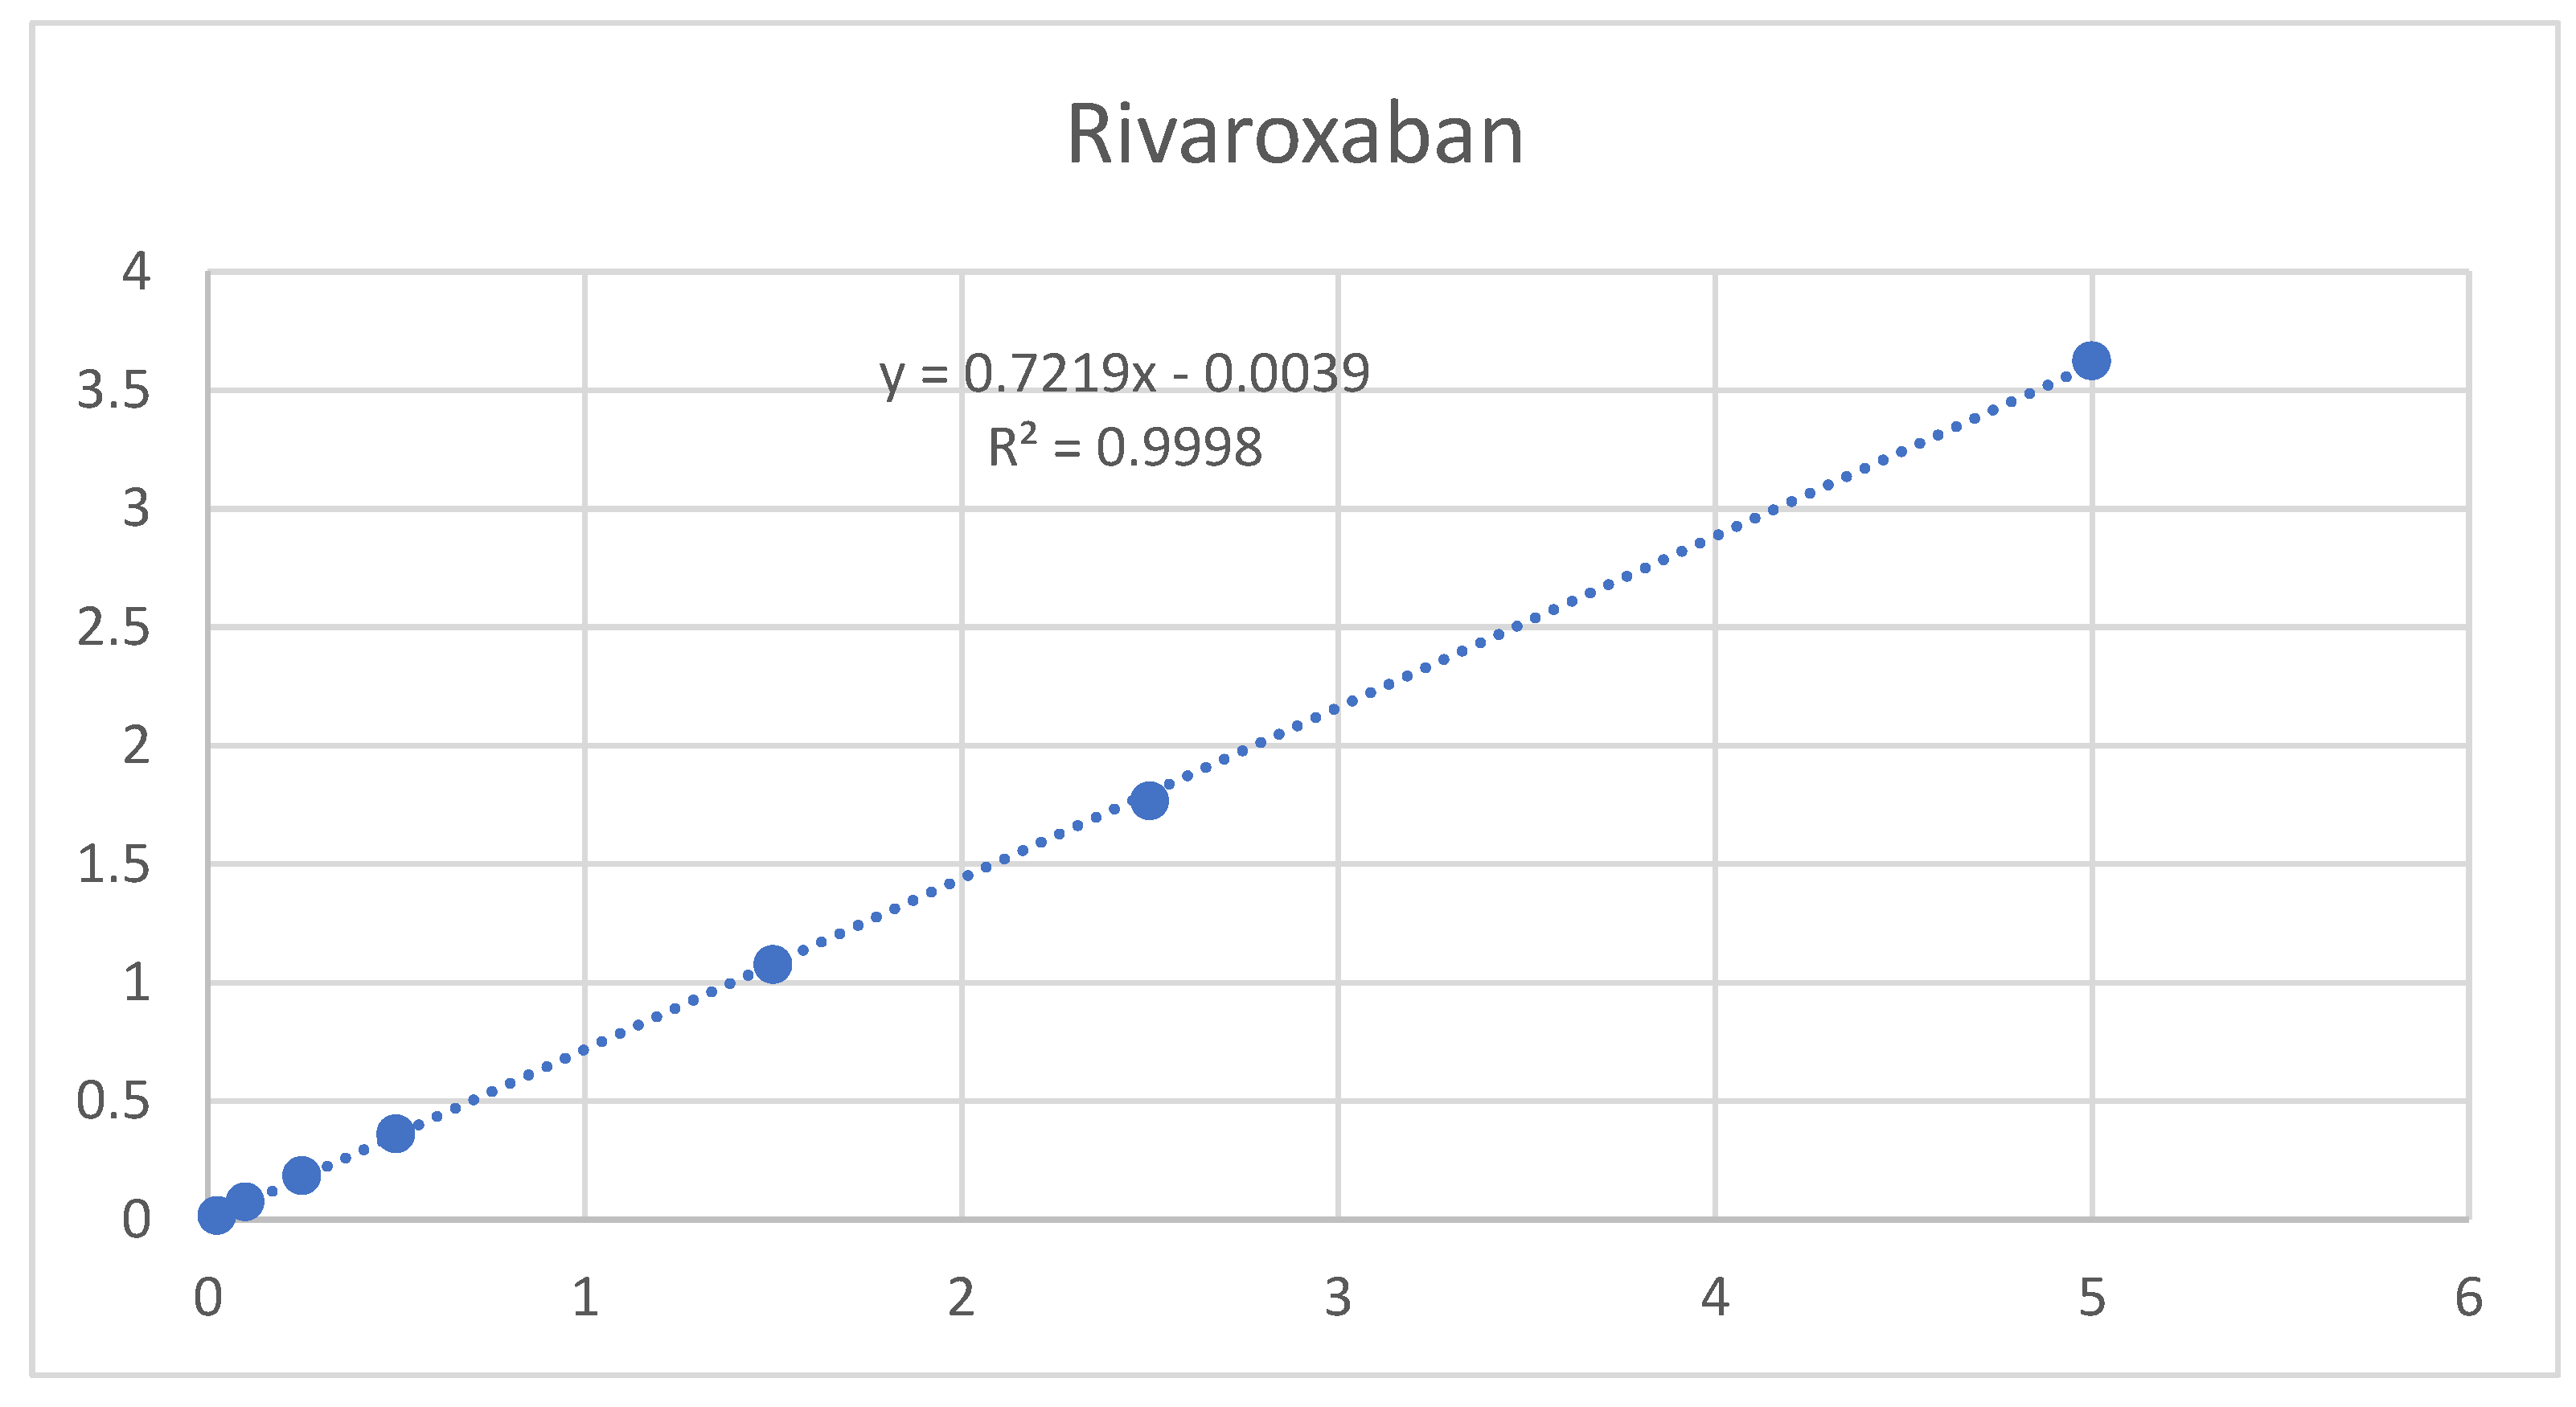
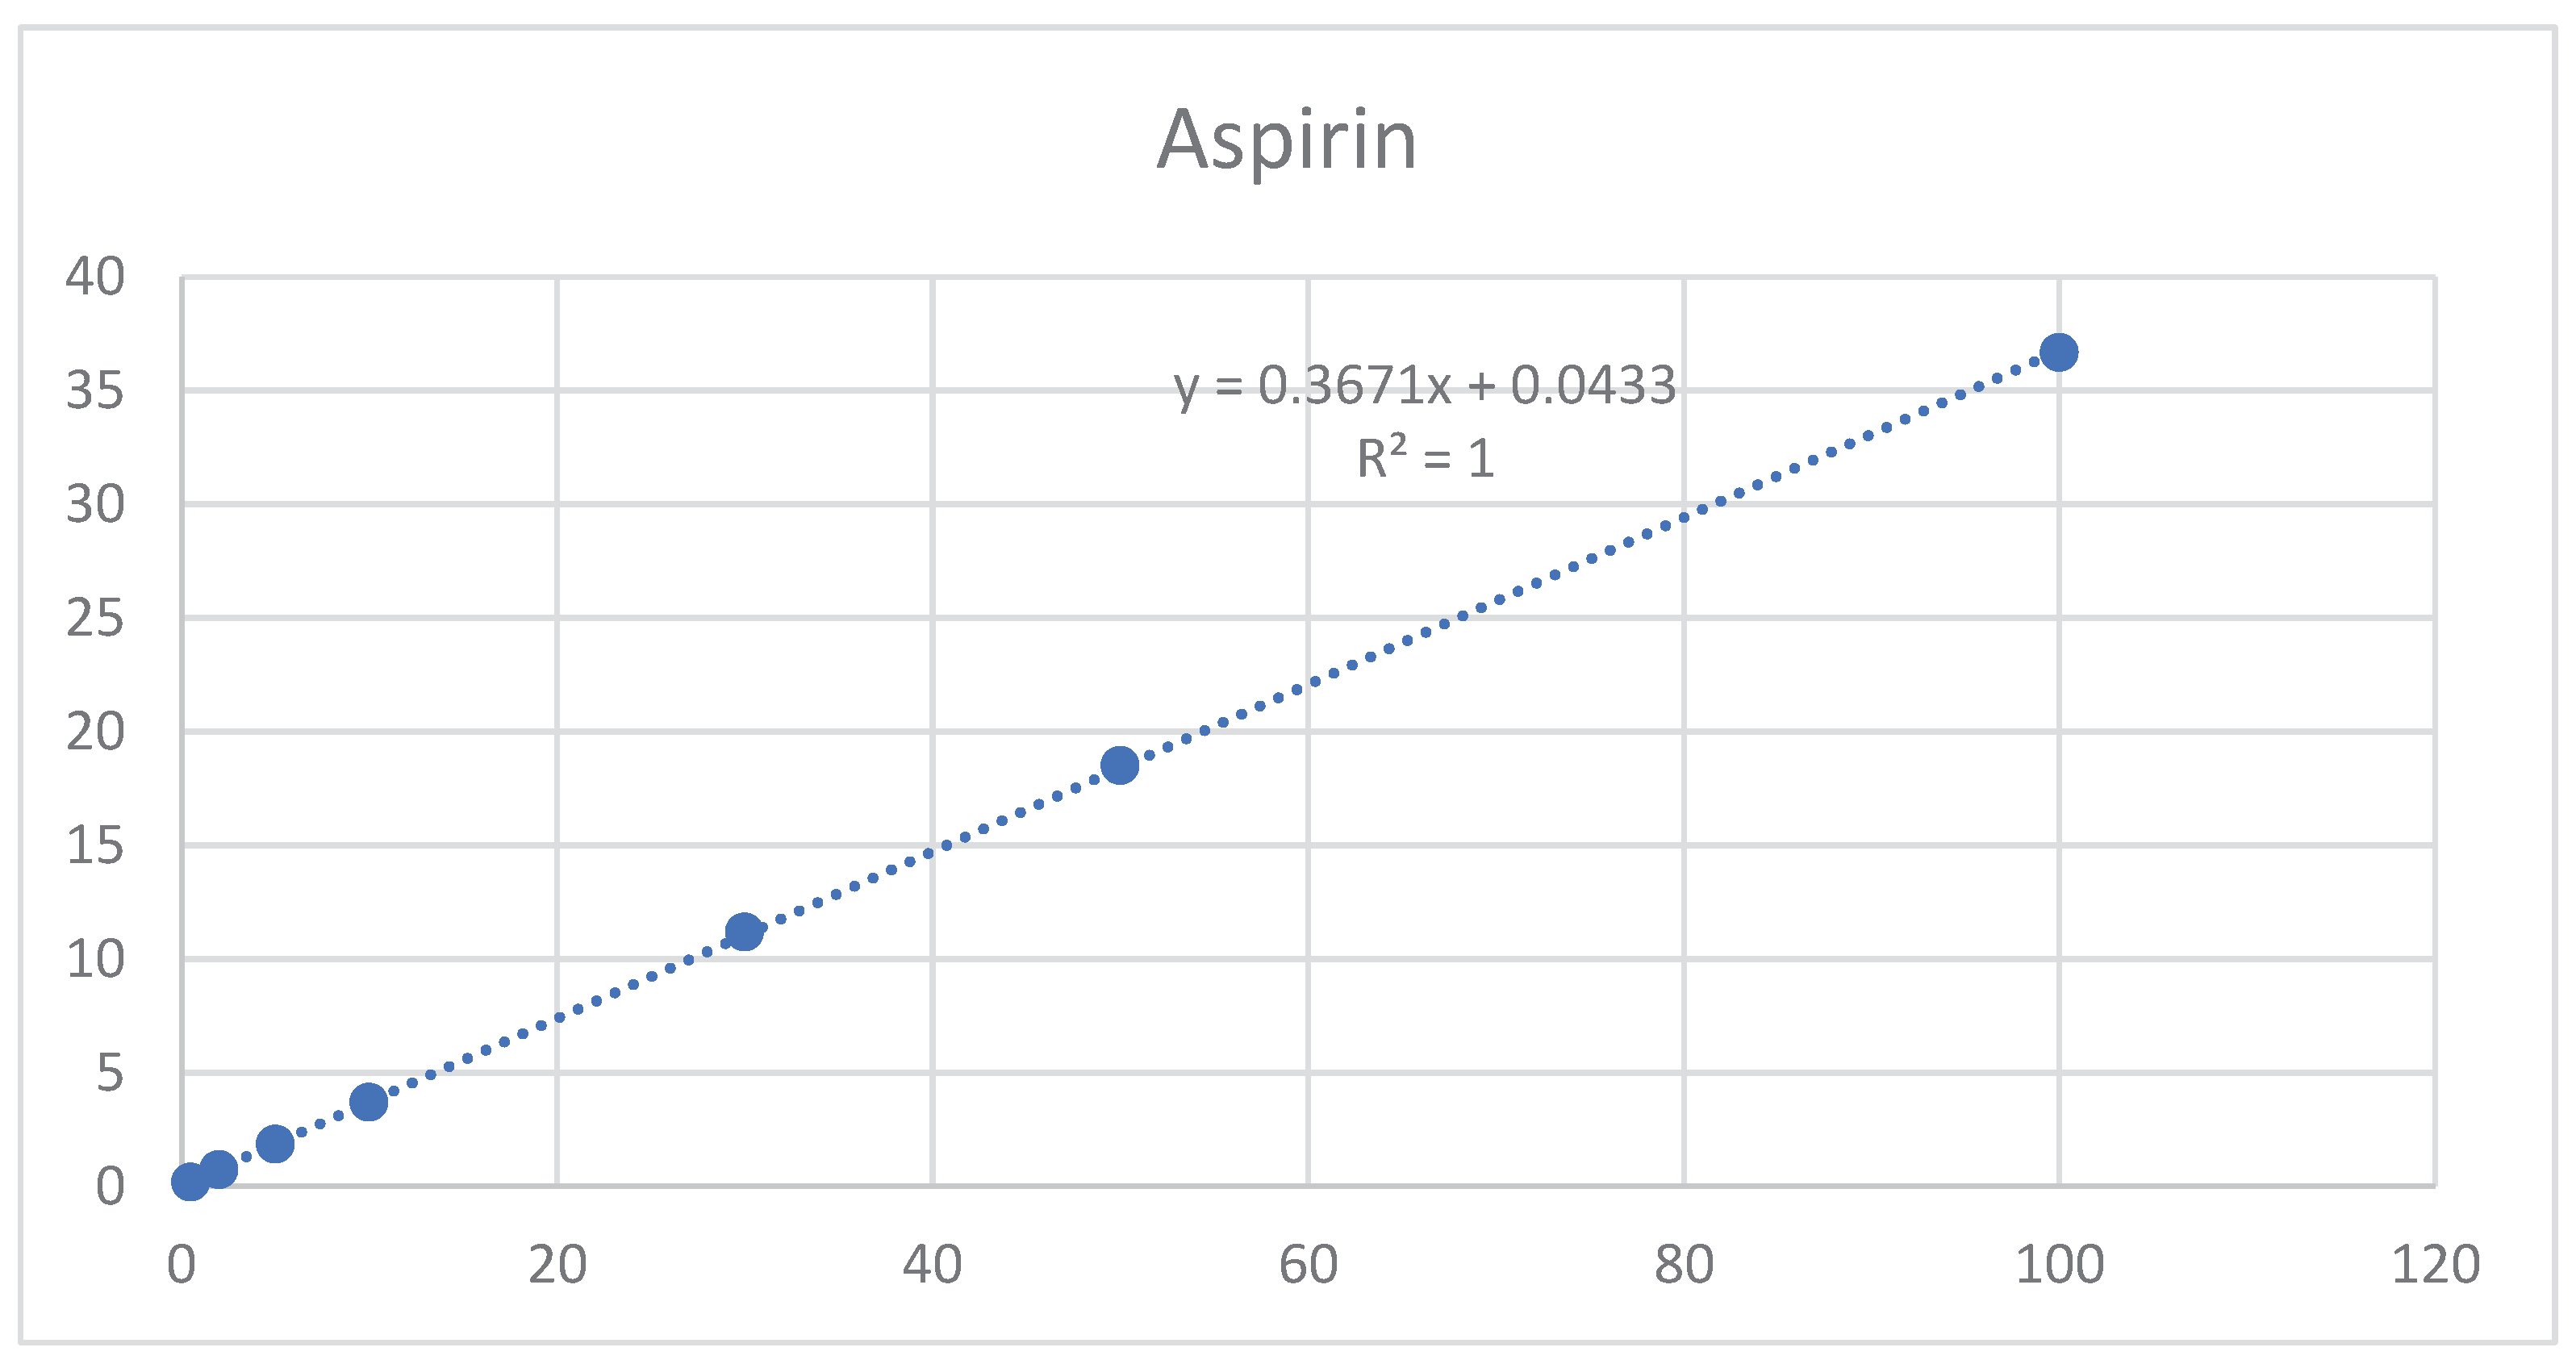
A calibration curve was constructed using a series of concentrations of analytes, and LOD and LOQ were calculated using equations 1 and 2 based on the standard deviation of the response and the slope[
26].
Equation 1: Limit of detection calculation
Equation 2 Limit of quantitation calculation
where
σ = the standard deviation of the response (STEYX)
S = the slope of the calibration curve
3. Results and Discussion
3.1. Formulation Development
An investigation was conducted on pharmaceuticals containing 2.5 mg of rivaroxaban and 75 mg of aspirin, evaluating both products' physicochemical and biopharmaceutical features (19,20). Excipient selection is crucial in developing and manufacturing tablets, from functionality to drug excipients compatibility[
27].
Before developing and optimizing a formulation, investigations of the physical and chemical compatibility of both drugs and the selected excipients were conducted to meet quality standards and develop a stable tablet. Table A1 summarizes the compatibility study samples that were examined, as well as the test conditions and findings. The results revealed that the visual appearance of all mixes remained unchanged. Moreover, the worst-case samples (opened at 40°C/75%RH) were analyzed for potential unknown individual impurities using HPLC, and no impurities were detected. These findings revealed no interactions between APIs and excipients, and the selected excipients could be used during the formulation development stage.
3.2. Formulae Evaluation
Several formulations with different excipients percentages were evaluated. The physical evaluation of the tablets prepared from formulas F1, F2, and F3 are summarized in (
Table 4). The tablets were assessed, and the results showed that the prepared tablets had acceptable characteristics (weight, thickness, and hardness,
Table 4), a disintegration time of up to one minute, and a friability of approximately 0.1%. Furthermore, these tablets passed the uniformity of dosage unit test, with assay values of aspirin of 99.5%, 100.3%, and 101.2% and those of rivaroxaban of100.6%, 100.9%, and 101.0% for F1, F2, and F3, respectively, and no unknown individual impurities were detected. Compared with the other formulas, F3 required a higher compression force during the compression stage to achieve the tablet hardness (6.5 kgf). This finding could be attributed to the fact that formula F3 contains a lower amount of microcrystalline cellulose (26.4%) than the F1 and F2 formulations (38.0% and 50.4%, respectively)[
28].
Physical and chemical evaluations of all formulas were accepted. However, the relatively low thickness of formula F1 could cause manufacturing difficulties, such as tablets stuck between Take –off blade and discharge chute and turret in the tableting machine or tablets stuck in the feeding system of blistering machines, therefor formula F2 and F3 were selected to proceed with dissolution profile.
Additionally, the prepared wet granulation tablets (F4 and F5) were analyzed, and the results revealed that the prepared tablets had acceptable properties (weight, thickness, and hardness,
Table 5), with a friability of approximately 0.1%. The uniformity of the dosage unit test exceeded the assay values of aspirin by 100.1% and 100.7%, and those of rivaroxaban were 100.6% and 100.9% for F4 and F5, respectively. No unknown impurities were detected.
Furthermore, the disintegration time was longer (up to 2 min) than that of the dry mix formulas. This result was expected because the properties of intermediate granules produced by wet granulation can influence the quality attributes of tablets, such as disintegration time. Wet granulation produces fewer porous granules, and as a result, the porosity of the tablets is reduced compared to that of directly compressed tablets, resulting in a delay in the disintegration rate process[
29].
3.3. Dissolution Profiles
Dissolution testing is critical for evaluating dosage forms and is widely used in formulation development, process monitoring, and quality control testing[
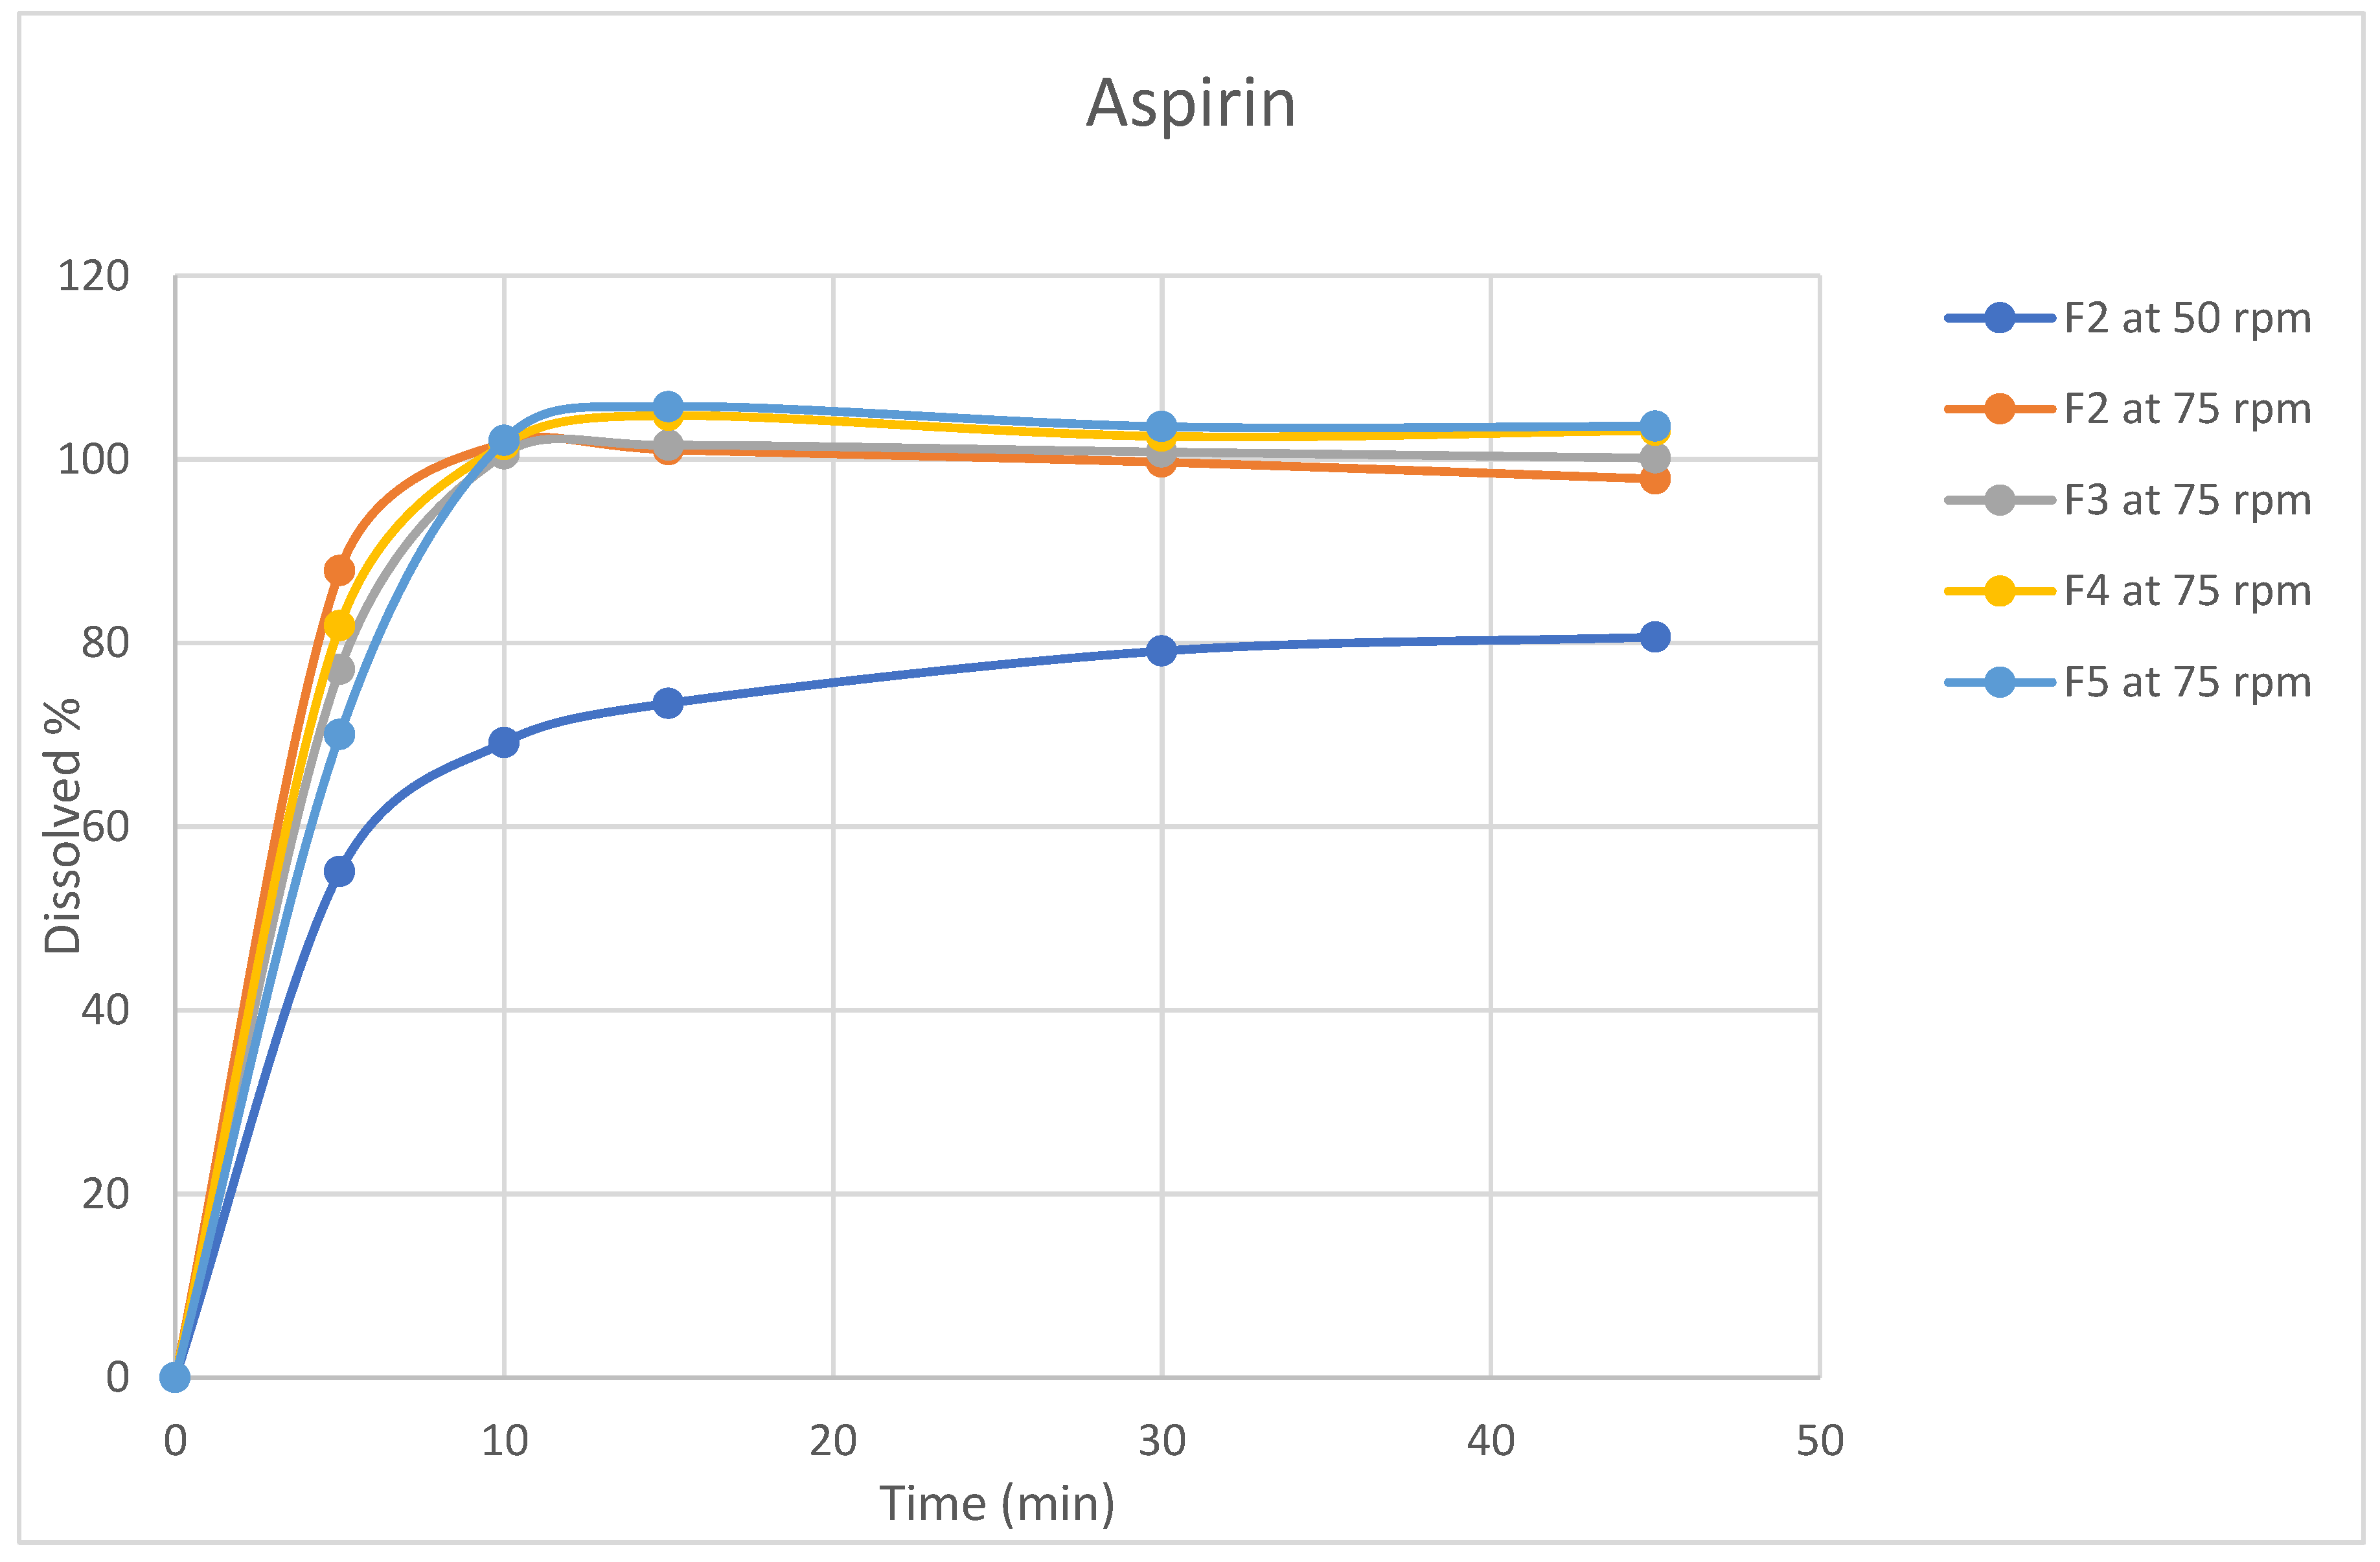
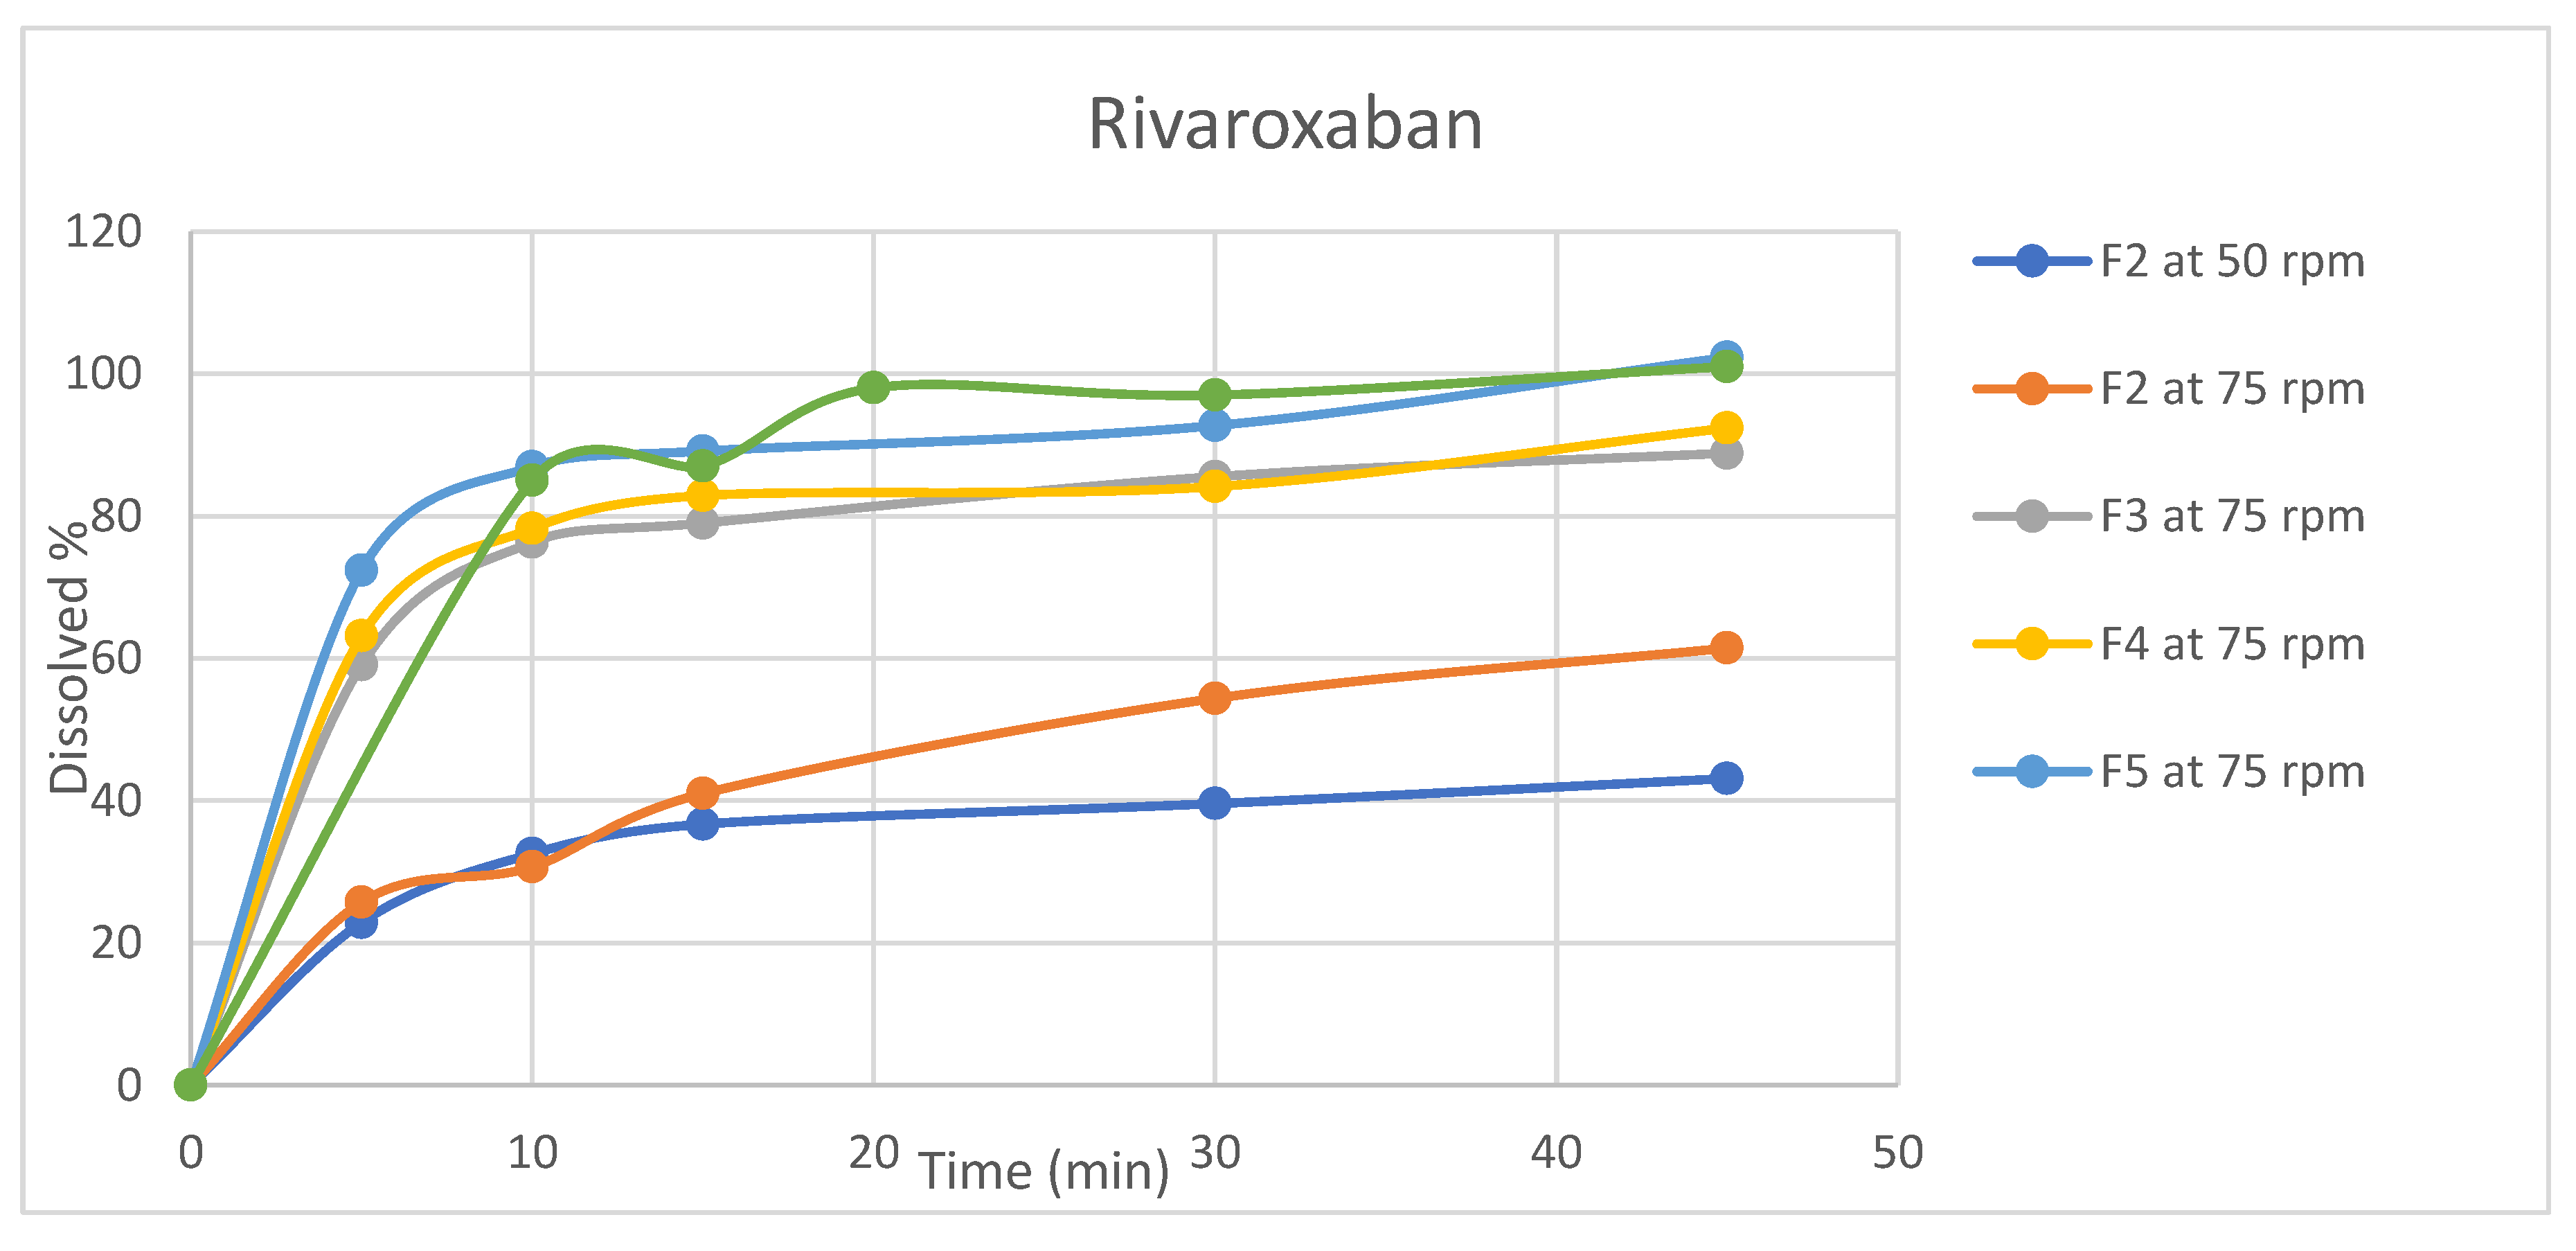
30]. In light of its significance, dissolution profiles were conducted for the four formulations in selected release media (acetate buffer pH4.5) using apparatus II (paddle). Table A7 and Table A8 and
Figure 3 and
Figure 4 summarize the average amount of dissolved active ingredients at the sampling time points (n=6).
Because rotation speed significantly impacts the dissolution process, the rotation speed of the proposed apparatus was assessed at two levels, 50 and 75 rpm, and the impact on drug release was assessed[
31]. The results revealed that a change in rotation speed from 50 to 75 rpm affected the dissolution rate of both ingredients because 50 rpm did not result in the desired 75% release of rivaroxaban within 45 min, which was the target value [
32]. In addition, higher variability in the data was observed at 50 rpm than at 75 rpm(figures 3,4). Moreover, the profile reached a plateau in less time but was more robust at 75 rpm, as the lower data variability indicated. This observation might occur because utilizing a low rotation speed may result in a lack of robustness in the data owing to poor hydrodynamics in the dissolving vessel, and the data may reflect system phenomena such as coning rather than actual formulation changes[
33]. Based on these findings, the rotational speed of 75 rpm was selected.
All formulas showed that aspirin was rapidly dissolved (> 85% in 15 min) when tested at a rotation speed of 75 rpm, while for rivaroxaban, the dissolution varied for different formulas; therefore, the dissolution profile for the reference product Xarelto (2.5 mg) tablets was conducted to serve as a reference for the dissolution profile.
The dissolution profiles of rivaroxaban for formulas F3, F4, and F5 were found to be similar to that of the reference product, as the similarity factor (f2) calculated as per equation 3 was 50.2 for formula F3 and 53.7 for formula F4, for the formula F5 no need for similarity factor calculation as both reference and test products reached > 85% dissolution in 15 minutes [
34]. In accordance with these findings, formula F5 was chosen because the dissolution profiles revealed a faster dissolution of rivaroxaban and the best similarity to the reference product, whereas aspirin dissolved rapidly.
Equation 3: Similarity factor f2
3.3. Stability Study
The tablets were assessed for general appearance, disintegration, hardness, and assay after three months of storage under controlled conditions. All the tablets maintained their appearance, disintegration, and hardness after storage under controlled conditions. Furthermore, the prepared tablets were shown to be stable under controlled conditions for three months, with assays values for F1 (94.0% and 93.0%), F2 (95.3%, and 90.3%), F3 (105.6%, and 90.6%), F4 (99.4%, and 97.1%), F5 (104.0%, and 96.7%), for aspirin and rivaroxaban, respectively.
3.4. Analytical Methods Development
A reverse-phase HPLC method was developed to determine the APIs assays and degradants. The method was developed based on the Aspirin tablets B.P. monograph and Rivaroxaban tablets FDA-Approved Drugs monograph, summarized in
Table 6 [
35,
36].
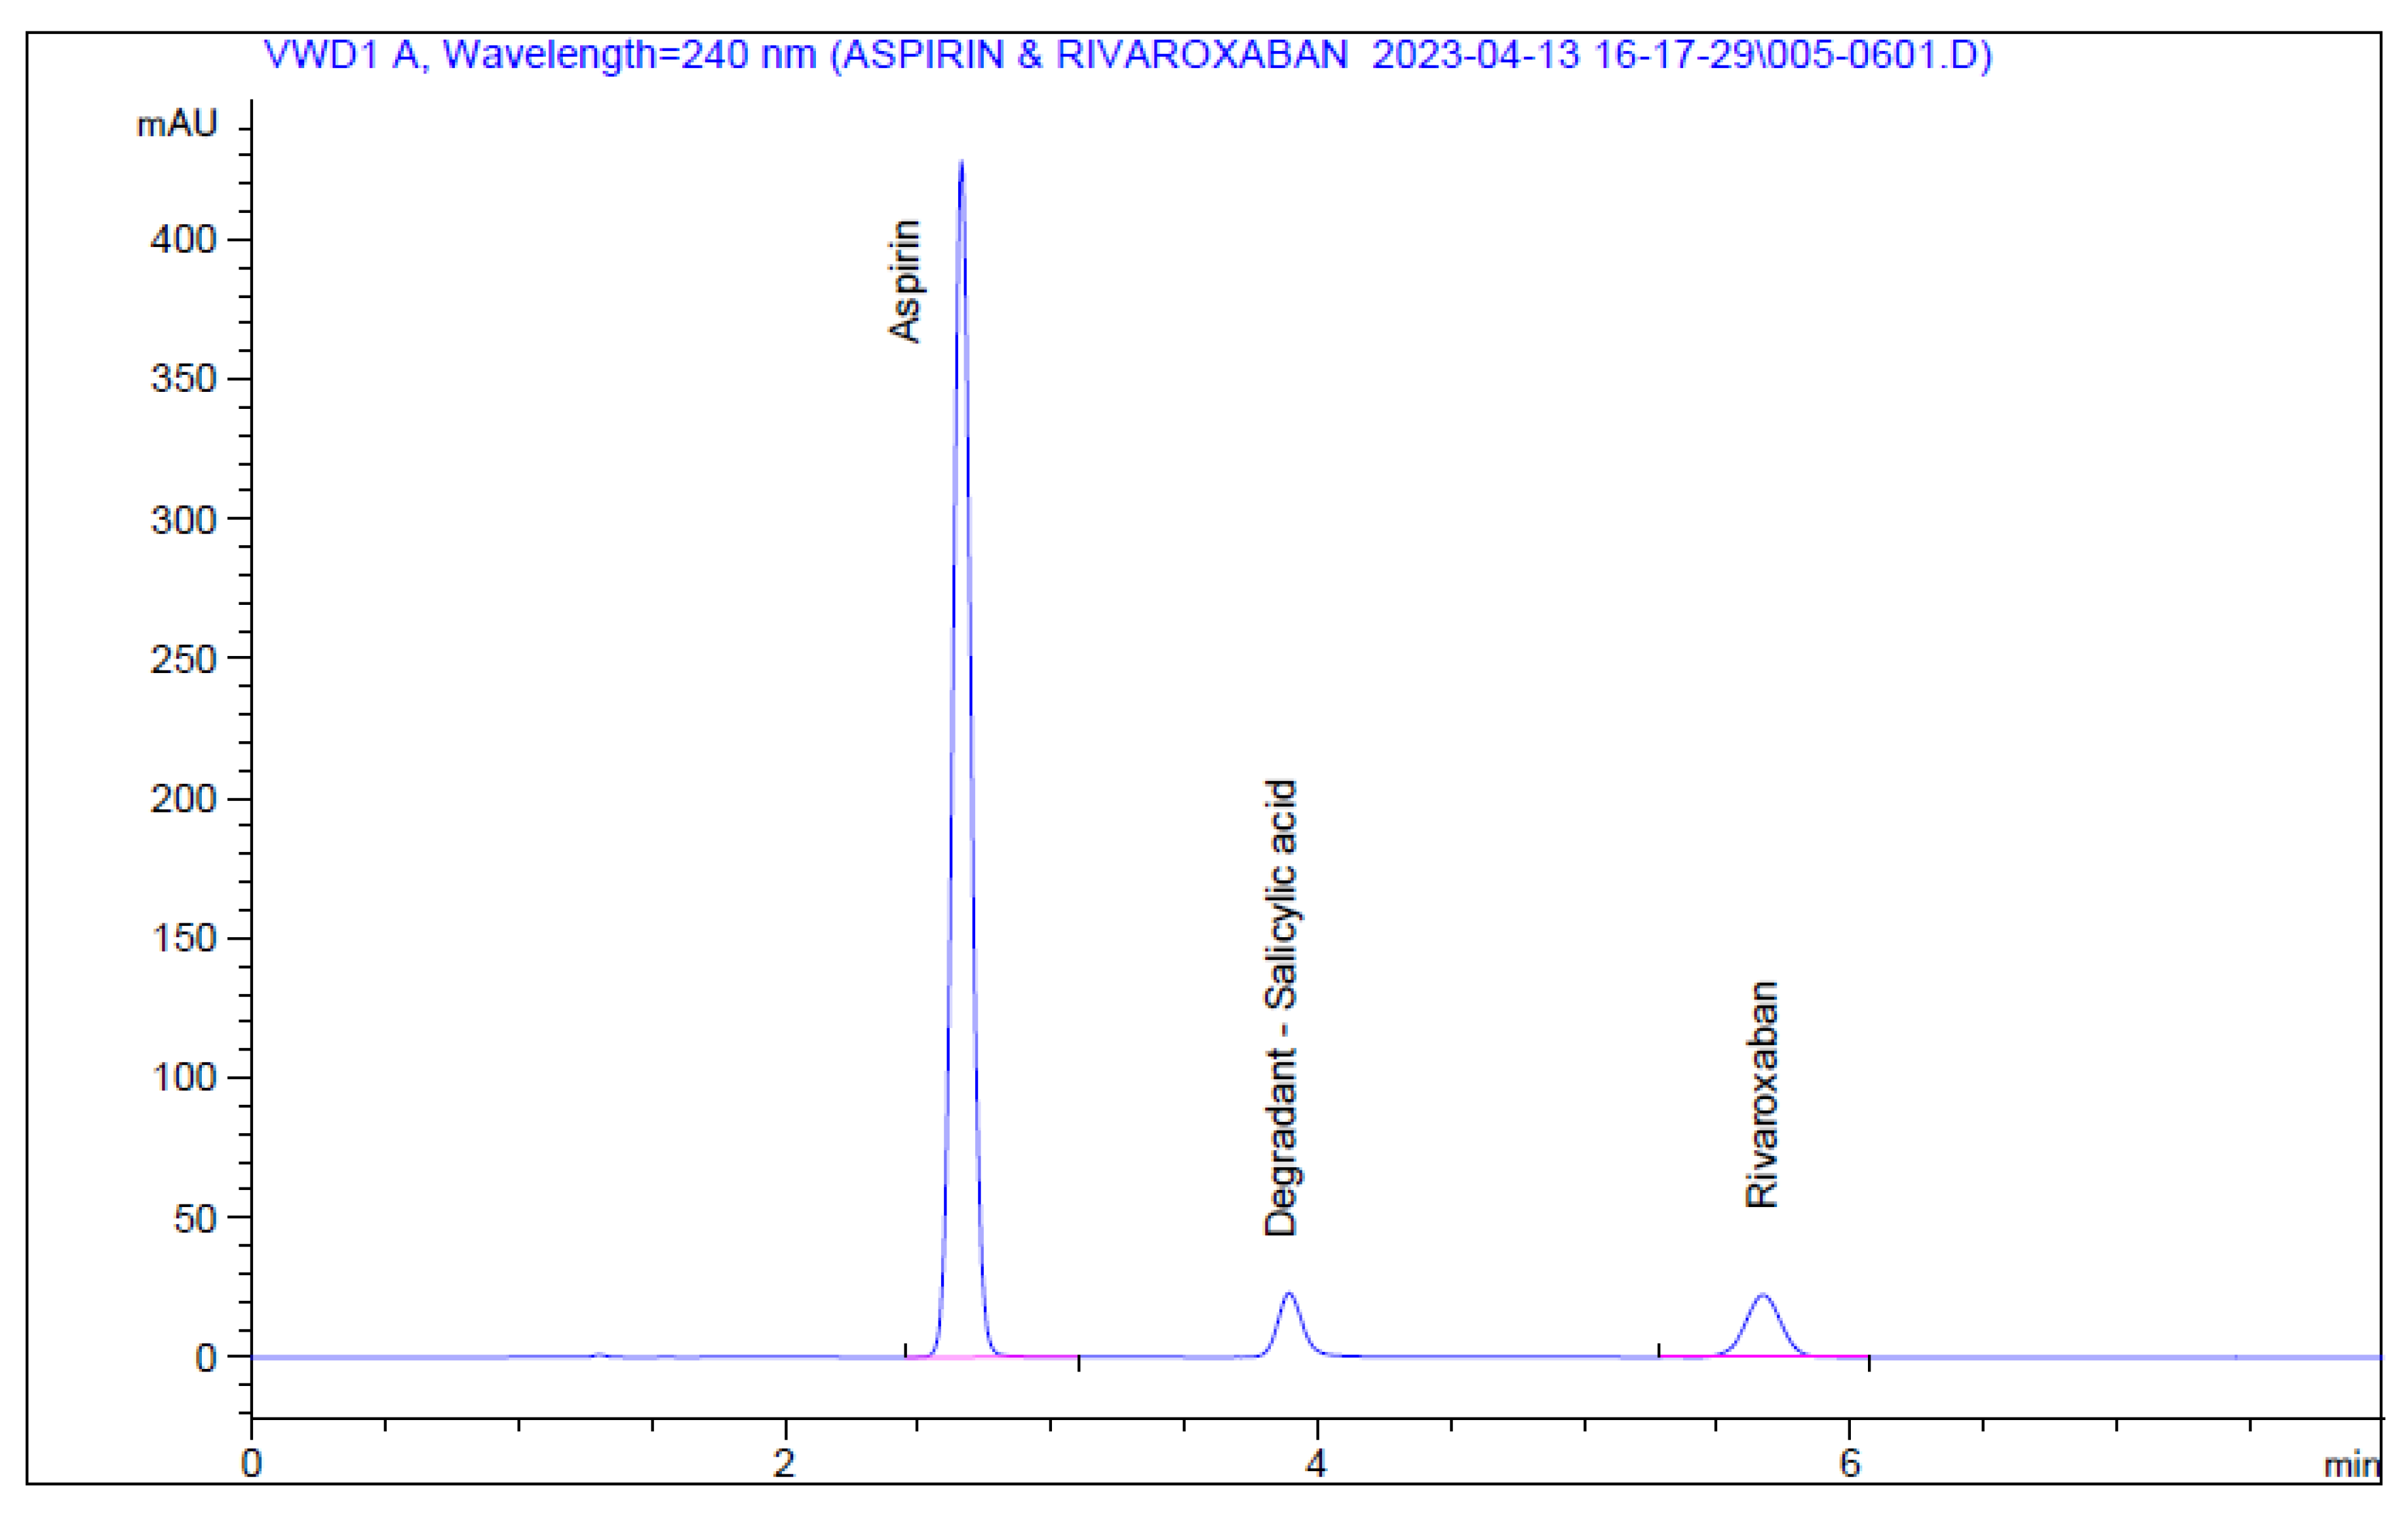
A preliminary reversed-phase HPLC chromatographic method was developed, including the detection wavelength, mobile phase, stationary phase, and sample preparation procedure. In addition, several experiments were carried out for this purpose, including various mobile phase compositions, stationary phase types, column lengths, pH levels, and buffering agents. The mobile phase consisted of acetonitrile: phosphoric acid 0.1% in the ratio 30: 70 v/v with a flow rate of 1.5 ml/min, injection volume 25 μL, at a wavelength of 240nm and using column Phenomenex C18 (150cm 4.6 mm, 5 µ ) at ambient temperature, and was optimized as the best chromatographic conditions for the current research. These conditions led to a lower difference in intensity between APIs peak resolutions when Rivaroxaban and Aspirin were eluted, producing symmetrical peak shapes, as well as an appropriate analysis time with retention times of approximately 2.658 min for Aspirin and 5.654 min for Rivaroxaban (
Figure 5).
3.5. Analytical Method Validation
3.5.1. Specificity
Stress testing was performed on aspirin and rivaroxaban to establish degradation pathways and help evaluate the drug ingredient's stability and validate the specificity of the analytical method.
Table 7 summarizes the results of the forced degradation. The basic condition was adding 0.03M NaOH to both active substances for 30 minutes at room temperature, resulting in assay losses of approximately 6% and 3.21% for Aspirin and Rivaroxaban, respectively, and total degradative substances of 8.9%. This degradative product was identified as salicylic acid, resulting from aspirin hydrolysis.
Figure 6 shows no interference between the chromatographic peaks of Aspirin and Rivaroxaban and excipients, impurities, and degradation products under various primary stress conditions. The method is capable of detecting possible degradants. Aspirin & Rivaroxaban peaks were pure with Peak purity NLT 980, and degradation was within acceptable limits (5 - 20%)[
37].
3.5.2. Linearity range
The results shown in Table A9 and
Figure 7 and
Figure 8 indicate that linearity was achieved for aspirin and rivaroxaban within their respective concentration ranges. For both active compounds, the % RSD value was below 2% and R2 was approximately 1. Generally, a regression coefficient (R2) greater than 0.998 indicates an acceptable fit between the data and the regression line[
37].
3.5.3. Precision
The % RSD for six replicates of the nominal standard solution and six preparations of the nominal sample solution was calculated to establish precision.
Table 3 summarizes the data collected. The RSD values were less than 2% in all the cases.
3.5.4. Accuracy
The accuracy results showed that the percentage recovery at all levels was 99.6-102.1% for aspirin and 94.6-101.4% for Rivaroxaban, with % RDS values ranging between 0.1-0.3% and 0.1-4.6%, respectively. The results for the spiked solutions are listed in
Table 9. Again, the results show that the method was accurate over the tested range.
3.5.5. Robustness:
Minor changes in wavelength and flow rate were tested, and the results are presented in
Table 10. The method performance was not affected by the small changes in the tested wavelength and flow rate parameters. Consequently, the appropriate separation of Aspirin and Rivaroxaban was obtained for all changes, the values were within acceptable ranges, and the %RSD was less than 2.0%. Therefore, this method can be considered robust[
21].
3.5.6. LOD & LOQ
The results are presented in
Table 11 and
Table 12, as well as in
Figure 9 and
Figure 10. The method showed a LOD of 0.08 ppm and 0.82 for Rivaroxaban and aspirin, respectively, and LOQ of 0.25 ppm and 2.5 ppm for Rivaroxaban and aspirin, respectively. The obtained values were sufficiently small to accurately identify rivaroxaban and aspirin at low concentrations during the dissolution test in the early stages.
4. Conclusions
Rivaroxaban 2.5 mg and 50 mg aspirin fixed-dose combination tablets were reformulated using a direct mixing and wet granulation. Formulae F3 (direct mix), F4 (wet granulation – aspirin extragranular), and F5 (wet granulation – aspirin intragranular) were found to be promising and showed relatively rapid dissolution behavior.
A reverse-phase HPLC method was successfully developed for determining Rivaroxaban and Aspirin in this fixed-dose combination tablet. It was stable and validated to ensure linearity, accuracy, and precision over its range. In addition, the method was robust against minor changes in the chromatographic conditions.
Author Contributions
Conceptualization H.N, M.Q. and M.A.; methodology, M.A. AND H.N.; formal analysis, M.A, R.M.and M.K.; resources,N.M., H.N. and M.K.; data curation, M.Q., M.K., A.R; writing—original draft preparation, M.A., H.N and MQ; writing—review and editing, N.M., M.K., A.K., H.N., A.R. ; supervision,H.N., M.Q., and N.M.; project administration, H.A., A.K., and A.R.; All authors have read and agreed to the published version of the manuscript.
Funding
This research received no external funding.
Institutional Review Board Statement
“Not applicable” for studies not involving humans or animals.
Informed Consent Statement
Not applicable.
Data Availability Statement
The data used to aid the outputs of this research are available at Hani Naseef (hshtaya@birzeit.edu) upon request.
Acknowledgments
All authors acknowledge Jerusalem Pharmaceuticals for donating the materials that were used in this study.
Conflicts of Interest
The authors declare no conflict of interest.
References
- Allen, L. V; Emeritus, C.; Popovich, N.G.; Ansel, H.C.; Emeritus, D. Ansel’s Pharmaceutical Dosage Forms and Drug Delivery Systems NINTH EDITION;
- Chapter 17. Modified-Release Drug Products | Applied Biopharmaceutics & Pharmacokinetics, 6e | AccessPharmacy | McGraw Hill Medical Available online: https://accesspharmacy.mhmedical.com/content.aspx?bookid=513§ionid=41488035 (accessed on Mar 12, 2023).
- Janczura, M.; Sip, S.; Cielecka-Piontek, J. The Development of Innovative Dosage Forms of the Fixed-Dose Combination of Active Pharmaceutical Ingredients. Pharmaceutics 2022, Vol. 14, Page 834 2022, 14, 834. [CrossRef]
- Desai, D.; Wang, J.; Wen, H.; Li, X.; Timmins, P. Formulation design, challenges, and development considerations for fixed dose combination (FDC) of oral solid dosage forms. 2013, 18, 1265–1276. [CrossRef]
- Medendorp, J.; Shapally, S.; Vrieze, D.; Tolton, K. Process Control of Drug Product Continuous Manufacturing Operations—a Study in Operational Simplification and Continuous Improvement. Journal of Pharmaceutical Innovation 2022, 17, 85–96. [CrossRef]
- Annex 5 Guidelines for registration of fixed-dose combination medicinal products.
- Harder, S. Pharmacokinetic and pharmacodynamic evaluation of rivaroxaban: Considerations for the treatment of venous thromboembolism. Thrombosis Journal 2014, 12, 1–13. [CrossRef]
- Perzborn, E.; Roehrig, S.; Straub, A.; Kubitza, D.; Mueck, W.; Laux, V. Rivaroxaban: A New Oral Factor Xa Inhibitor. Arteriosclerosis, Thrombosis, and Vascular Biology 2010, 30, 376–381. [CrossRef]
- CHMP Xarelto, INN-Rivaroxaban.
- Wada, S.; Inoue, M.; Matsuki, T.; Okata, T.; Kumamoto, M.; Tagawa, N.; Okamoto, A.; Miyata, T.; Ihara, M.; Koga, M.; et al. Rivaroxaban concentrations in acute stroke patients with different dosage forms. PLOS ONE 2019, 14, e0214132. [CrossRef]
- Su, Y.F.; Yang, S.H.; Lee, Y.H.; Wu, B.C.; Huang, S.C.; Liu, C.M.; Chen, S.L.; Pan, Y.F.; Chou, S.S.; Chou, M.Y.; et al. Aspirin-induced inhibition of adipogenesis was p53-dependent and associated with inactivation of pentose phosphate pathway. European Journal of Pharmacology 2014, 738, 101–110. [CrossRef]
- Al-Jabi, S.W.; Aldabe, L.; Alhaj-Asaad, L.; Thaher, M.; Zyoud, S.H.; Sweileh, W.M. Assessment of drug interactions and their associated factors among patients with cardiovascular diseases: a cross-sectional study from the occupied Palestinian territory. The Lancet 2021, 398, S8. [CrossRef]
- Aspirin: Uses, Interactions, Mechanism of Action | DrugBank Online Available online: https://go.drugbank.com/drugs/DB00945 (accessed on Mar 13, 2023).
- Dressman, J.B.; Nair, A.; Abrahamsson, B.; Barends, D.M.; Groot, D.W.; Kopp, S.; Langguth, P.; Polli, J.E.; Shah, V.P.; Zimmer, M. Biowaiver monograph for immediate-release solid oral dosage forms: Acetylsalicylic acid. Journal of Pharmaceutical Sciences 2012, 101, 2653–2667. [CrossRef]
- Khan, H.; Popkov, M.; Jain, S.; Djahanpour, N.; Syed, M.H.; Rand, M.L.; Eikelboom, J.; Mazer, C.D.; Al-Omran, M.; Abdin, R.; et al. Low-dose aspirin and rivaroxaban combination therapy to overcome aspirin non-sensitivity in patients with vascular disease. Frontiers in Cardiovascular Medicine 2022, 9, 2185. [CrossRef]
- Eikelboom, J.W.; Connolly, S.J.; Bosch, J.; Dagenais, G.R.; Hart, R.G.; Shestakovska, O.; Diaz, R.; Alings, M.; Lonn, E.M.; Anand, S.S.; et al. Rivaroxaban with or without Aspirin in Stable Cardiovascular Disease. New England Journal of Medicine 2017, 377, 1319–1330. [CrossRef]
- Kaplovitch, E.; Eikelboom, J.W.; Dyal, L.; Aboyans, V.; Abola, M.T.; Verhamme, P.; Avezum, A.; Fox, K.A.A.; Berkowitz, S.D.; Bangdiwala, S.I.; et al. Rivaroxaban and Aspirin in Patients With Symptomatic Lower Extremity Peripheral Artery Disease: A Subanalysis of the COMPASS Randomized Clinical Trial. JAMA Cardiology 2021, 6, 21–29. [CrossRef]
- Gurbel, P.A.; Bliden, K.P.; Dichiara, J.; Newcomer, J.; Weng, W.; Neerchal, N.K.; Gesheff, T.; Chaganti, S.K.; Etherington, A.; Tantry, U.S. Evaluation of Dose-Related Effects of Aspirin on Platelet Function Results From the Aspirin-Induced Platelet Effect (ASPECT) Study. 2007. [CrossRef]
- Aspirin 75mg Gastro-Resistant Tablets - Summary of Product Characteristics (SmPC) - (emc) Available online: https://www.medicines.org.uk/emc/product/2614/smpc#gref (accessed on Mar 16, 2023).
- Xarelto 2.5 mg film-coated tablets - Summary of Product Characteristics (SmPC) - (emc) Available online: https://www.medicines.org.uk/emc/product/3410/smpc (accessed on Mar 16, 2023).
- ICH ICH HARMONISED TRIPARTITE GUIDELINE VALIDATION OF ANALYTICAL PROCEDURES: TEXT AND METHODOLOGY Q2(R1) Guideline on Validation of Analytical Procedures: Methodology developed to complement the Parent Guideline. 2005.
- Fda; Cder; Beers; Donald Analytical Procedures and Methods Validation for Drugs and Biologics Guidance for Industry. 2015.
- Naseef, H.; Moqadi, R.; Qurt, M. Development and Validation of an HPLC Method for Determination of Antidiabetic Drug Alogliptin Benzoate in Bulk and Tablets. Journal of Analytical Methods in Chemistry 2018, 2018, 1–7. [CrossRef]
- Blessy, M.; Patel, R.D.; Prajapati, P.N.; Agrawal, Y.K. Development of forced degradation and stability indicating studies of drugs—A review. Journal of Pharmaceutical Analysis 2014, 4, 159–165. [CrossRef]
- Batrawi, N.; Naseef, H.; Al-Rimawi, F. Development and Validation of a Stability-Indicating HPLC Method for the Simultaneous Determination of Florfenicol and Flunixin Meglumine Combination in an Injectable Solution. Journal of Analytical Methods in Chemistry 2017, 2017. [CrossRef]
- Ray, P.; Knowlton, K.F.; Shang, C.; Xia, K. Development and Validation of a UPLC-MS/MS Method to Monitor Cephapirin Excretion in Dairy Cows following Intramammary Infusion. PLOS ONE 2014, 9, e112343. [CrossRef]
- Narang, A.S.; Rao, V.M.; Raghavan, K.S. Excipient Compatibility. Developing Solid Oral Dosage Forms: Pharmaceutical Theory and Practice 2009, 125–145. [CrossRef]
- Kim, J.Y.; Choi, D.H. Control Strategy for Excipient Variability in the Quality by Design Approach Using Statistical Analysis and Predictive Model: Effect of Microcrystalline Cellulose Variability on Design Space. Pharmaceutics 2022, 14, 2416. [CrossRef]
- Jange, C.G.; Wassgren, C.R.; Ambrose, K. The Significance of Tablet Internal Structure on Disintegration and Dissolution of Immediate-Release Formulas: A Review. Powders 2023, Vol. 2, Pages 99-123 2023, 2, 99–123. [CrossRef]
- Anand, O.; Yu, L.X.; Conner, D.P.; Davit, B.M. Dissolution Testing for Generic Drugs: An FDA Perspective. The AAPS Journal 2011, 13, 328–335. [CrossRef]
- Khan, A.; Iqbal, Z. Dissolution testing of bilayer tablets: Method development, validation and application in post-marketing quality evaluation. Dissolution Technologies 2017, 24, 36–45. [CrossRef]
- Medicines Agency, E. Committee for Medicinal Products for Human use (CHMP) Committee for Medicinal Products for Veterinary use (CVMP) Quality Working Party (QWP) Reflection paper on the dissolution specification for generic solid oral immediate release products with systemic action Reflection paper on the dissolution specification for generic solid oral immediate release products with systemic action. 2017.
- Lagace, M.; Gravelle, L.; di Maso, M.; McClintock, S. Developing a Discriminating Dissolution Procedure for a Dual Active Pharmaceutical Product with Unique Solubility Characteristics. Dissolution Technologies 2004, 11, 13–17. [CrossRef]
- Xie, F.; Ji, S.; Cheng, Z. In vitro dissolution similarity factor (f2) and in vivo bioequivalence criteria, how and when do they match? Using a BCS class II drug as a simulation example. European Journal of Pharmaceutical Sciences 2015, 66, 163–172. [CrossRef]
- Aspirin Tablets-BP 2018.
- Grillo, J.A.; Bullock, J.M.; Mehrotra, N.; Garnett, C.; Zhao, P. OFFICE OF CLINICAL PHARMACOLOGY REVIEW ADDENUM TO Brand Name XARELTO ® immediate release tablets Generic Name Primary Reviewer DCP5 Team Leader Pharmacometrics Reviewer Pharmacometrics Team Leader SIMCYP & Drug Metabolism Submission Type; Code Resubmission NME NDA (SDN 70), Priority Review [original OCP NME NDA review 4/6/2009] OCP Briefing Date. 2009.
- ICH guideline Q14 on analytical procedure development.
Figure 1.
Structure of Rivaroxaban[
9].
Figure 1.
Structure of Rivaroxaban[
9].
Figure 2.
Structure of Aspirin[
13].
Figure 2.
Structure of Aspirin[
13].
Figure 3.
Dissolution profiles for Aspirin (n=6, mean values) for rivaroxaban/aspirin tablets.
Figure 3.
Dissolution profiles for Aspirin (n=6, mean values) for rivaroxaban/aspirin tablets.
Figure 4.
Dissolution profiles for Rivaroxaban (n=6, mean values) for rivaroxaban/aspirin tablets.
Figure 4.
Dissolution profiles for Rivaroxaban (n=6, mean values) for rivaroxaban/aspirin tablets.
Figure 5.
Chromatograms of nominal standard solutions of rivaroxaban and aspirin.
Figure 5.
Chromatograms of nominal standard solutions of rivaroxaban and aspirin.
Figure 6.
Chromatograms of aspirin and rivaroxaban following forced degradation using 0.03M NaOH.
Figure 6.
Chromatograms of aspirin and rivaroxaban following forced degradation using 0.03M NaOH.
Figure 7.
Rivaroxaban calibration curve.
Figure 7.
Rivaroxaban calibration curve.
Figure 8.
Aspirin calibration curve.
Figure 8.
Aspirin calibration curve.
Figure 9.
Calibration curve for LOD& LOQ test for Rivaroxaban.
Figure 9.
Calibration curve for LOD& LOQ test for Rivaroxaban.
Figure 10.
Calibration curve for LOD& LOQ test for Rivaroxaban.
Figure 10.
Calibration curve for LOD& LOQ test for Rivaroxaban.
Table 1.
Composition of Rivaroxaba/Aspirin formulae for direct compression trials.
Table 1.
Composition of Rivaroxaba/Aspirin formulae for direct compression trials.
| |
|
F1 |
F2 |
F3 |
| Material |
Function |
Qty/tab (mg) |
Qty/tab |
Qty/tab |
W/W
(%) |
Qty / tab (mg) |
W/W
(%) |
| Rivaroxaban |
API |
2.50 |
2.5 |
2.50 |
2.0 |
2.50 |
2.0 |
| Aspirin |
API |
50.00 |
50.0 |
50.00 |
40.0 |
50.00 |
40.0 |
| Croscarmellose sodium |
Disintegrant |
4.00 |
4.0 |
4.00 |
3.2 |
4.00 |
3.2 |
| Microcrystalline cellulose (PH112) |
Diluent |
38.00 |
38.0 |
63.00 |
50.4 |
33.0 |
26.4 |
| Lactose Anhydrous |
Diluent |
0.0 |
0.0 |
0.0 |
0.0 |
30.0 |
24.0 |
| Sodium Lauryl Sulfate |
Wetting agent |
1.00 |
1.0 |
1.00 |
0.8 |
1.00 |
0.8 |
| Hypromellose (E5) |
Binder |
3.00 |
3.0 |
3.00 |
2.4 |
3.00 |
2.4 |
| Colloidal silicon dioxide |
Glidant |
0.50 |
0.5 |
0.5 |
0.4 |
0.50 |
0.4 |
| Stearic acid |
Lubricant |
1.00 |
1.0 |
1.00 |
0.8 |
1.00 |
0.8 |
| |
Total wt. |
100 |
|
125 |
|
125 |
|
Table 2.
Composition of Rivaroxaban/Aspirin formulae for wet granulation trials.
Table 2.
Composition of Rivaroxaban/Aspirin formulae for wet granulation trials.
| |
|
|
F4 |
F5 |
| |
Material |
Function |
Qty / tab (mg) |
W/W
(%) |
Qty / tab (mg) |
W/W
(%) |
| Intra-granular materials |
Rivaroxaban |
API |
2.50 |
2.5 |
2.50 |
2.0 |
| Aspirin |
API |
0.00 |
0.0 |
50.00 |
40.0 |
| Croscarmellose sodium |
Disintegrant |
4.00 |
3.2 |
4.00 |
3.2 |
| Microcrystalline cellulose (ph101) |
Diluent |
33.0 |
26.4 |
33.0 |
26.4 |
| Lactose monohydrate (200 mesh) |
Diluent |
30.0 |
24.0 |
30.0 |
24.0 |
| Sodium Lauryl Sulfate |
Wetting agent |
1.00 |
0.8 |
1.00 |
0.8 |
| Hypromellose (E5) |
Binder |
3.00 |
2.4 |
3.00 |
2.4 |
| Isopropyl alcohol |
Granulation solvent |
30.00 |
--- |
30.00 |
--- |
| |
Aspirin |
API |
50.00 |
50.0 |
0.00 |
0.0 |
| Colloidal silicon dioxide |
Glidant |
0.50 |
0.4 |
0.50 |
0.4 |
| Stearic acid |
Lubricant |
1.00 |
0.8 |
1.00 |
0.8 |
| |
|
Total wt. |
125 |
|
125 |
|
Table 3.
Stress conditions applied for Aspirin & Rivaroxaban tablet.
Table 3.
Stress conditions applied for Aspirin & Rivaroxaban tablet.
| # |
Sample Solution Conc. (mg/ml)(1) |
Volume of Stock Solution |
Reagent Added/
Stress Condition |
Total Volume
(ml)(2) |
Conditions
Time / TOC |
| 1 |
(0.005/0.1) |
5 |
Fresh sample |
50 |
Fresh sample/room temp |
| 2 |
(0.005/0.1) |
5 |
0.03M NaOH |
50 |
30 min / room temp |
| 3 |
(0.005/0.1) |
5 |
2M HCl |
50 |
40 min / room temp |
| 4 |
(0.005/0.1) |
5 |
3% H2O2 |
50 |
1 hr. / room temp |
1: Stock Sample Solution (6.3)
2: Volumetric flask (ml) diluted to final volume with diluent. |
|
Table 4.
Direct mixing formulae test results for rivaroxaban/aspirin tablets.
Table 4.
Direct mixing formulae test results for rivaroxaban/aspirin tablets.
| |
Formula F1 |
Formula F2 |
Formula F3 |
| |
Weight
(mg) |
Thickness
(mm) |
Hardness
(Kgf) |
Weight
(mg) |
Thickness
(mm) |
Hardness
(Kgf) |
Weight
(mg) |
Thickness
(mm) |
Hardness
(Kgf) |
| Tablet 1 |
101.0 |
2.80 |
4.4 |
123.6 |
3.09 |
5.7 |
122.7 |
3.15 |
6.4 |
| Tablet 2 |
97.0 |
2.85 |
6.0 |
126.4 |
3.18 |
6.7 |
123.8 |
3.25 |
6.5 |
| Tablet 3 |
99.2 |
2.66 |
5.5 |
121.4 |
3.21 |
6.9 |
126.1 |
3.22 |
6.7 |
| Tablet 4 |
102.3 |
2.77 |
5.0 |
126.1 |
3.19 |
7.2 |
125.4 |
3.15 |
6.6 |
| Tablet 5 |
100.5 |
2.70 |
4.6 |
124.0 |
3.19 |
6.9 |
123.6 |
3.20 |
6.6 |
| Tablet 6 |
98.0 |
2.90 |
4.2 |
122.9 |
3.09 |
5.9 |
123.7 |
3.10 |
6.5 |
| Tablet 7 |
96.0 |
2.80 |
5.0 |
121.6 |
3.19 |
6.4 |
122.9 |
3.20 |
6.4 |
| Tablet 8 |
99.0 |
2.70 |
4.8 |
125.5 |
3.08 |
6.3 |
124.6 |
3.17 |
6.2 |
| Tablet 9 |
101.0 |
2.65 |
4.2 |
122.6 |
3.15 |
6.0 |
125.1 |
3.22 |
6.5 |
| Tablet 10 |
100.7 |
2.69 |
4.8 |
122.1 |
3.22 |
7.5 |
124.1 |
3.18 |
6.6 |
| min |
96.0 |
2.65 |
4.2 |
121.4 |
3.08 |
5.7 |
122.7 |
3.10 |
6.2 |
| max |
102.3 |
2.90 |
6.0 |
126.4 |
3.22 |
7.5 |
126.1 |
3.25 |
6.7 |
| Average |
99.5 |
2.75 |
4.9 |
123.6 |
3.16 |
6.6 |
124.2 |
3.18 |
6.5 |
| SD |
2.0 |
0.1 |
0.6 |
1.8 |
0.1 |
0.6 |
1.1 |
0.0 |
0.1 |
Table 5.
Wet granulation formulae test results for rivaroxaban/aspirin tablets.
Table 5.
Wet granulation formulae test results for rivaroxaban/aspirin tablets.
| |
Formula F4 |
Formula F5 |
| |
Weight
(mg) |
Thickness
(mm) |
Hardness
(Kgf) |
Weight
(mg) |
Thickness
(mm) |
Hardness
(Kgf) |
| Tablet 1 |
123.7 |
3.16 |
6.4 |
130.8 |
3.25 |
8.1 |
| Tablet 2 |
122.8 |
3.20 |
6.3 |
127.6 |
3.18 |
7.9 |
| Tablet 3 |
125.2 |
3.20 |
6.3 |
127.8 |
3.19 |
7.9 |
| Tablet 4 |
124.5 |
3.21 |
6.4 |
128.8 |
3.22 |
7.9 |
| Tablet 5 |
124.0 |
3.16 |
6.3 |
129.9 |
3.30 |
8.0 |
| Tablet 6 |
123.3 |
3.12 |
6.4 |
130.5 |
3.30 |
8.1 |
| Tablet 7 |
124.2 |
3.19 |
6.5 |
132.1 |
3.30 |
8.2 |
| Tablet 8 |
123.6 |
3.10 |
6.1 |
128.6 |
3.18 |
7.8 |
| Tablet 9 |
124.1 |
3.12 |
6.3 |
129.7 |
3.24 |
7.9 |
| Tablet 10 |
125.5 |
3.10 |
6.4 |
133.0 |
3.22 |
8.3 |
| min |
122.8 |
3.10 |
6.1 |
127.6 |
3.18 |
7.8 |
| max |
125.5 |
3.21 |
6.5 |
133.0 |
3.30 |
8.3 |
| Average |
124.1 |
3.16 |
6.3 |
129.9 |
3.24 |
8.0 |
| SD |
0.8 |
0.0 |
0.1 |
1.8 |
0.0 |
0.2 |
Table 6.
Comparison between Aspirin tablets and Rivaroxaban tablets monographs chromatographic conditions.
Table 6.
Comparison between Aspirin tablets and Rivaroxaban tablets monographs chromatographic conditions.
| |
Aspirin tablets – B.P. monographs |
Rivaroxaban tablets – B.P. monographs |
| |
reverse phase HPLC method |
reverse phase HPLC method |
| Column |
C18 (25 cm × 4.6 mm)5 µm |
0.055 m, Ø = 4.0 mm |
| Mobile phase |
Isocratic
2 volumes of phosphoric acid, 400 volumes of acetonitrile and 600 volumes of water |
Gradient
A: acetonitrile & 0.67 mL of phosphoric acid R to 1000 mL with water (8:92 V/V)
B: acetonitrile |
| Detection |
UV at 237 nm |
UV at 250 nm |
| Injection volume |
20 μL |
5 μL |
| Temperature |
ambient |
45 °C |
| Flow rate |
1.0 mL/minute |
mL/minute |
Table 7.
Forced degradation study data for rivaroxaban and aspirin.
Table 7.
Forced degradation study data for rivaroxaban and aspirin.
| |
|
Aspirin |
Rivaroxaban |
Degradants % |
Reagent Added/
Stress Condition |
Conditions
Time / TOC |
Recovered % |
Peak Purity |
Recovered % |
Peak Purity |
|
| 0.03M NaOH |
30 min / room temp |
94.09% |
1000 |
96.79% |
997 |
8.90% |
| 2M HCl |
40 min / room temp |
100.2% |
1000 |
100.9% |
998 |
Not detected |
| 3% H2O2 |
1 hr. / room temp |
99.75% |
1000 |
94.65% |
997 |
Not detected |
Table 8.
Precision data for rivaroxaban/aspirin HPLC analysis.
Table 8.
Precision data for rivaroxaban/aspirin HPLC analysis.
| |
Nominal Standard |
Nominal Sample |
| Sample # |
Aspirin
(Peak Area) |
Rivaroxaban
(Peak Area) |
Aspirin
(Peak Area) |
Rivaroxaban
(Peak Area) |
| 1 |
36.667 |
3.622 |
36.878 |
3.651 |
| 2 |
36.677 |
3.613 |
36.906 |
3.647 |
| 3 |
36.677 |
3.624 |
36.905 |
3.639 |
| 4 |
36.682 |
3.622 |
36.917 |
3.640 |
| 5 |
36.701 |
3.621 |
36.904 |
3.639 |
| 6 |
36.691 |
3.605 |
36.890 |
3.652 |
| Average |
36.683 |
3.618 |
36.900 |
3.645 |
| SD |
0.01 |
0.01 |
0.01 |
0.01 |
| %RSD |
0.03 |
0.20 |
0.04 |
0.17 |
Table 9.
Accuracy data for rivaroxaban/aspirin HPLC analysis.
Table 9.
Accuracy data for rivaroxaban/aspirin HPLC analysis.
| Aspirin |
Rivaroxaban |
| Conc. % |
Average Recovery ± SD (n=3) |
RSD% |
Conc. % |
Average Recovery ± SD (n=3) |
RSD% |
| 2% (LOQ) |
102.1% ± 0.1 |
0.1 |
5% (LOQ) |
94.6% ± 4.3 |
4.6 |
| 50% |
100.5% ± 0.3 |
0.3 |
50% |
98.4% ± 0.2 |
0.2 |
| 100% |
101.7% ± 0.1 |
0.1 |
100% |
101.4% ± 0.1 |
0.1 |
| 200% |
99.6% ± 0.2 |
0.2 |
200% |
100.0% ± 0.6 |
0.6 |
Table 10.
Robustness results for rivaroxaban/aspirin HPLC analysis.
Table 10.
Robustness results for rivaroxaban/aspirin HPLC analysis.
| |
Aspirin |
Rivaroxaban |
| Changed Parameter |
Actual Average Peak Area ± S.D.
(n=6) |
RSD % |
Actual Average Peak Area ± S.D.
(n=6) |
RSD % |
| Wavelength + (242 nm) |
27.579 ± 0.0 |
0.06 |
3.724 ± 0.0 |
0.10 |
| Wavelength - (238 nm) |
44.938 ± 0.0 |
0.05 |
3.205 ± 0.0 |
0.07 |
| Flow rate + (1.6 ml/min) |
33.678 ± 0.0 |
0.03 |
3.257 ± 0.0 |
0.09 |
| Flow rate - (1.4 ml/min) |
38.486 ± 0.0 |
0.05 |
3.546 ± 0.0 |
0.25 |
Table 11.
Rivaroxaban LOD & LOQ results.
Table 11.
Rivaroxaban LOD & LOQ results.
| Conc % |
Conc. (ppm) |
1st Area |
2nd Area |
3rd Area |
Av Area |
SD |
RSD |
| 0.5% |
0.025 |
0.0172 |
0.0173 |
|
0.017 |
0.000 |
0.4% |
| 2% |
0.1 |
0.0772 |
0.0738 |
0.0729 |
0.075 |
0.002 |
3.0% |
| 5% |
0.25 |
0.1878 |
0.1844 |
0.181 |
0.184 |
0.003 |
1.8% |
| 10% |
0.5 |
0.3641 |
0.3542 |
0.363 |
0.360 |
0.005 |
1.5% |
| 30% |
1.5 |
1.0797 |
1.0797 |
1.0682 |
1.076 |
0.007 |
0.6% |
| 50% |
2.5 |
1.7839 |
1.7621 |
1.7514 |
1.766 |
0.017 |
0.9% |
| 100% |
5 |
3.6144 |
3.6178 |
3.638 |
3.623 |
0.013 |
0.4% |
| |
STEYX |
|
|
|
0.018 |
|
|
| |
SLOPE |
|
|
|
0.721 |
|
|
| |
LOQ(PPM) |
|
|
|
0.25 |
|
|
| |
LOD(PPM) |
|
|
|
0.08 |
|
|
Table 12.
Aspirin LOD & LOQ results.
Table 12.
Aspirin LOD & LOQ results.
| Conc % |
Conc. (ppm) |
1st Area |
2nd Area |
3rd Area |
Av Area |
SD |
RSD |
| 0.5% |
0.5 |
0.183 |
0.177 |
- |
0.180 |
0.004 |
2.4% |
| 2% |
2 |
0.732 |
0.731 |
0.7399 |
0.734 |
0.005 |
0.7% |
| 5% |
5 |
1.847 |
1.837 |
1.846 |
1.843 |
0.006 |
0.3% |
| 10% |
10 |
3.69 |
3.687 |
3.69 |
3.689 |
0.002 |
0.0% |
| 30% |
30 |
11.19 |
11.19 |
11.18 |
11.187 |
0.006 |
0.1% |
| 50% |
50 |
18.51 |
18.51 |
18.49 |
18.503 |
0.012 |
0.1% |
| 100% |
100 |
36.66 |
36.67 |
36.66 |
36.663 |
0.006 |
0.0% |
| |
STEYX |
0.094 |
0.094 |
0.093 |
0.092 |
|
|
| |
SLOPE |
0.0353 |
0.0353 |
0.0353 |
0.367 |
|
|
| |
LOQ(PPM) |
26.76 |
26.68 |
26.33 |
2.50 |
|
|
| |
LOD(PPM) |
8.83 |
8.81 |
8.69 |
0.82 |
|
|
|
Disclaimer/Publisher’s Note: The statements, opinions and data contained in all publications are solely those of the individual author(s) and contributor(s) and not of MDPI and/or the editor(s). MDPI and/or the editor(s) disclaim responsibility for any injury to people or property resulting from any ideas, methods, instructions or products referred to in the content. |
© 2023 by the authors. Licensee MDPI, Basel, Switzerland. This article is an open access article distributed under the terms and conditions of the Creative Commons Attribution (CC BY) license (http://creativecommons.org/licenses/by/4.0/).
