Submitted:
09 June 2023
Posted:
12 June 2023
You are already at the latest version
Abstract
Keywords:
1. Introduction
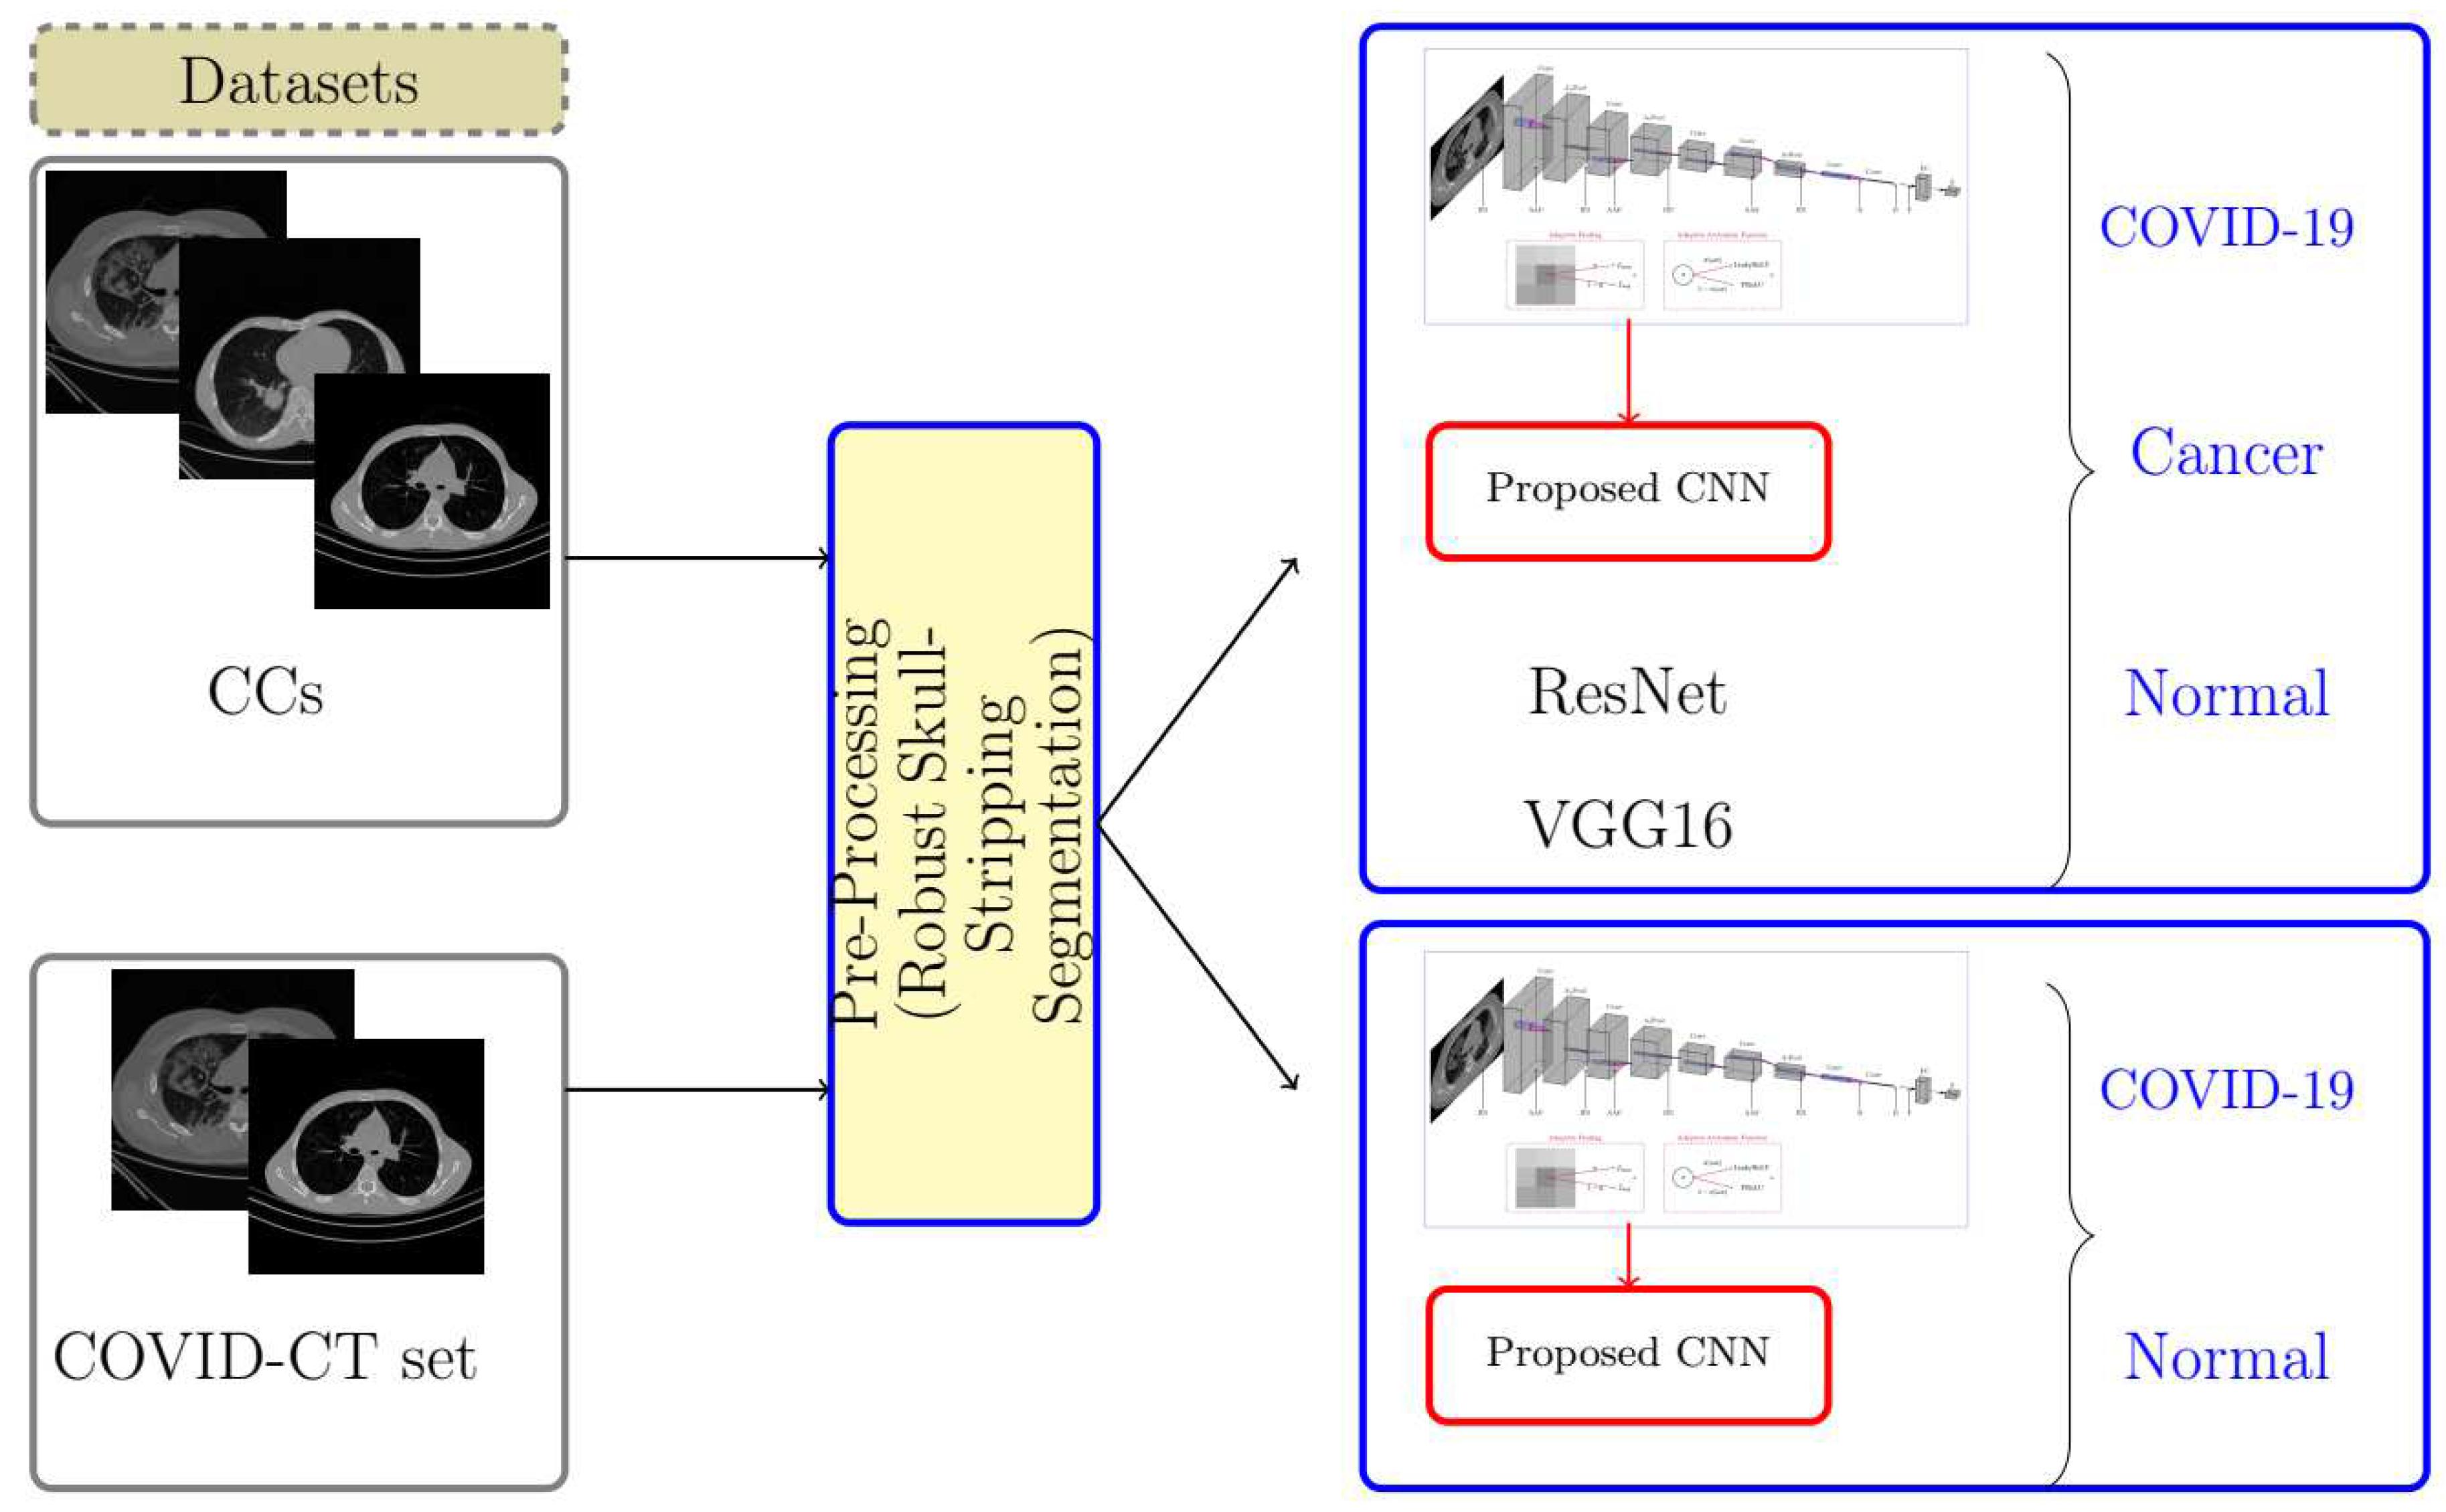
- A novel lightweight CNN-based model with Adaptive Feature EXtraction layers (AFEX-Net) is suggested for the classification of chest CT images into three classes.
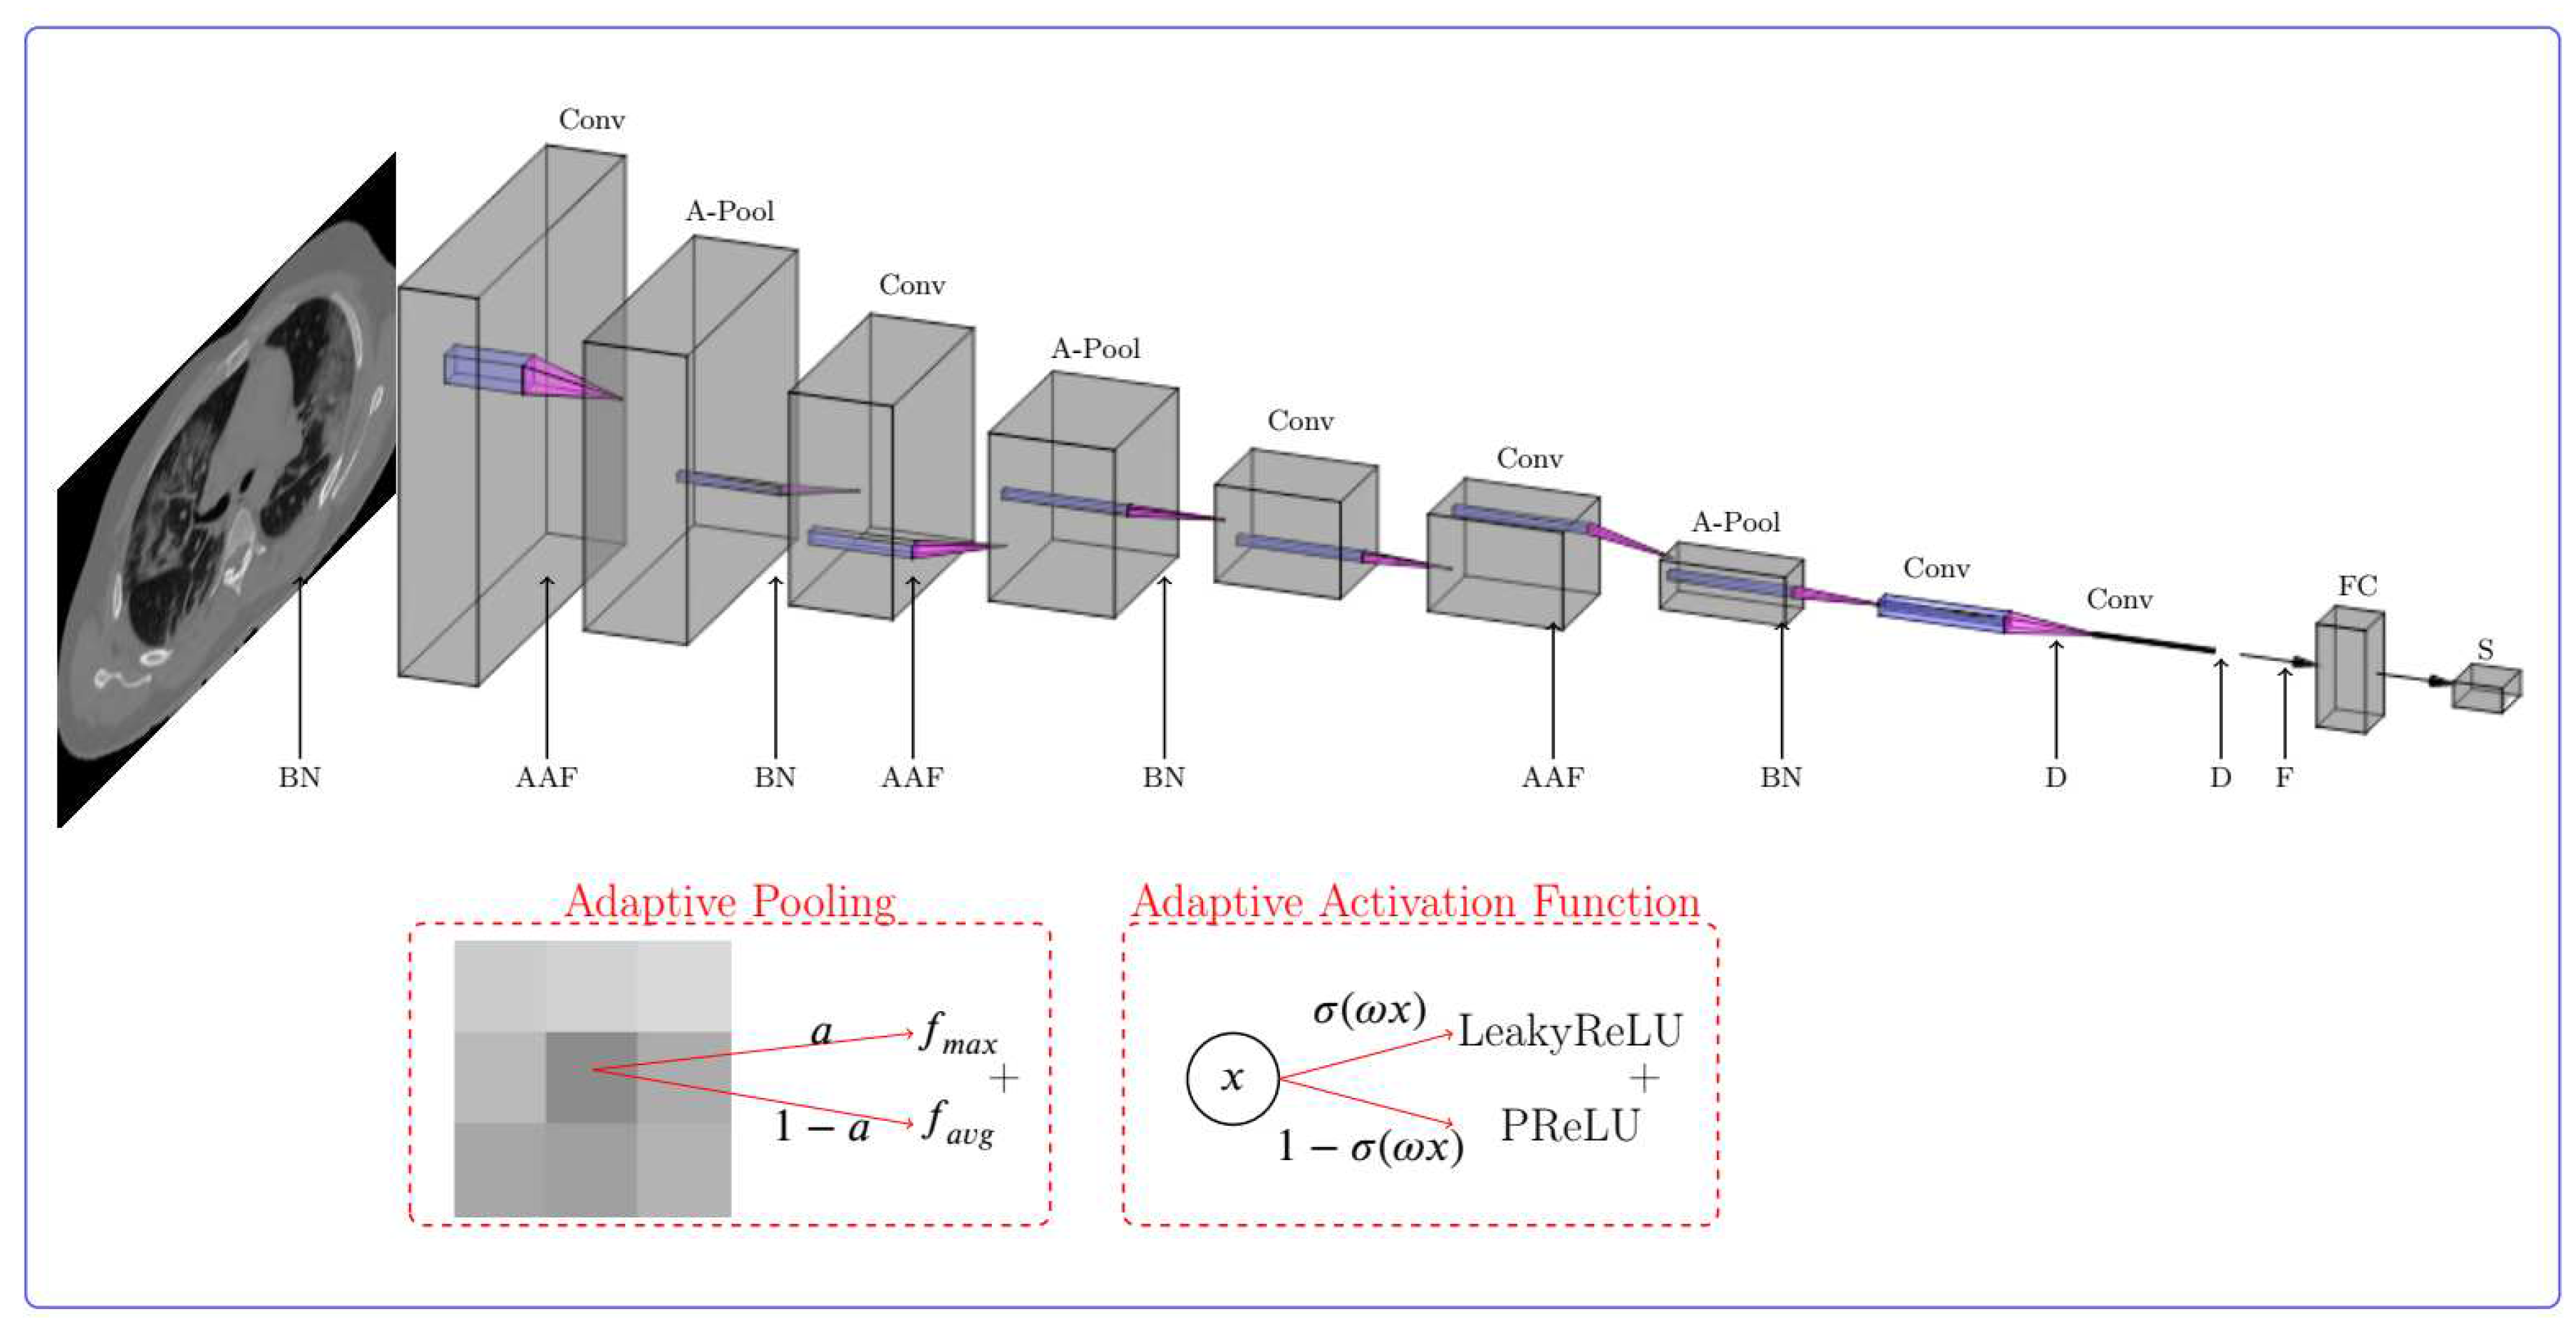
- The proposed network has an adaptive pooling strategy with adaptive activation functions, increasing model robustness.
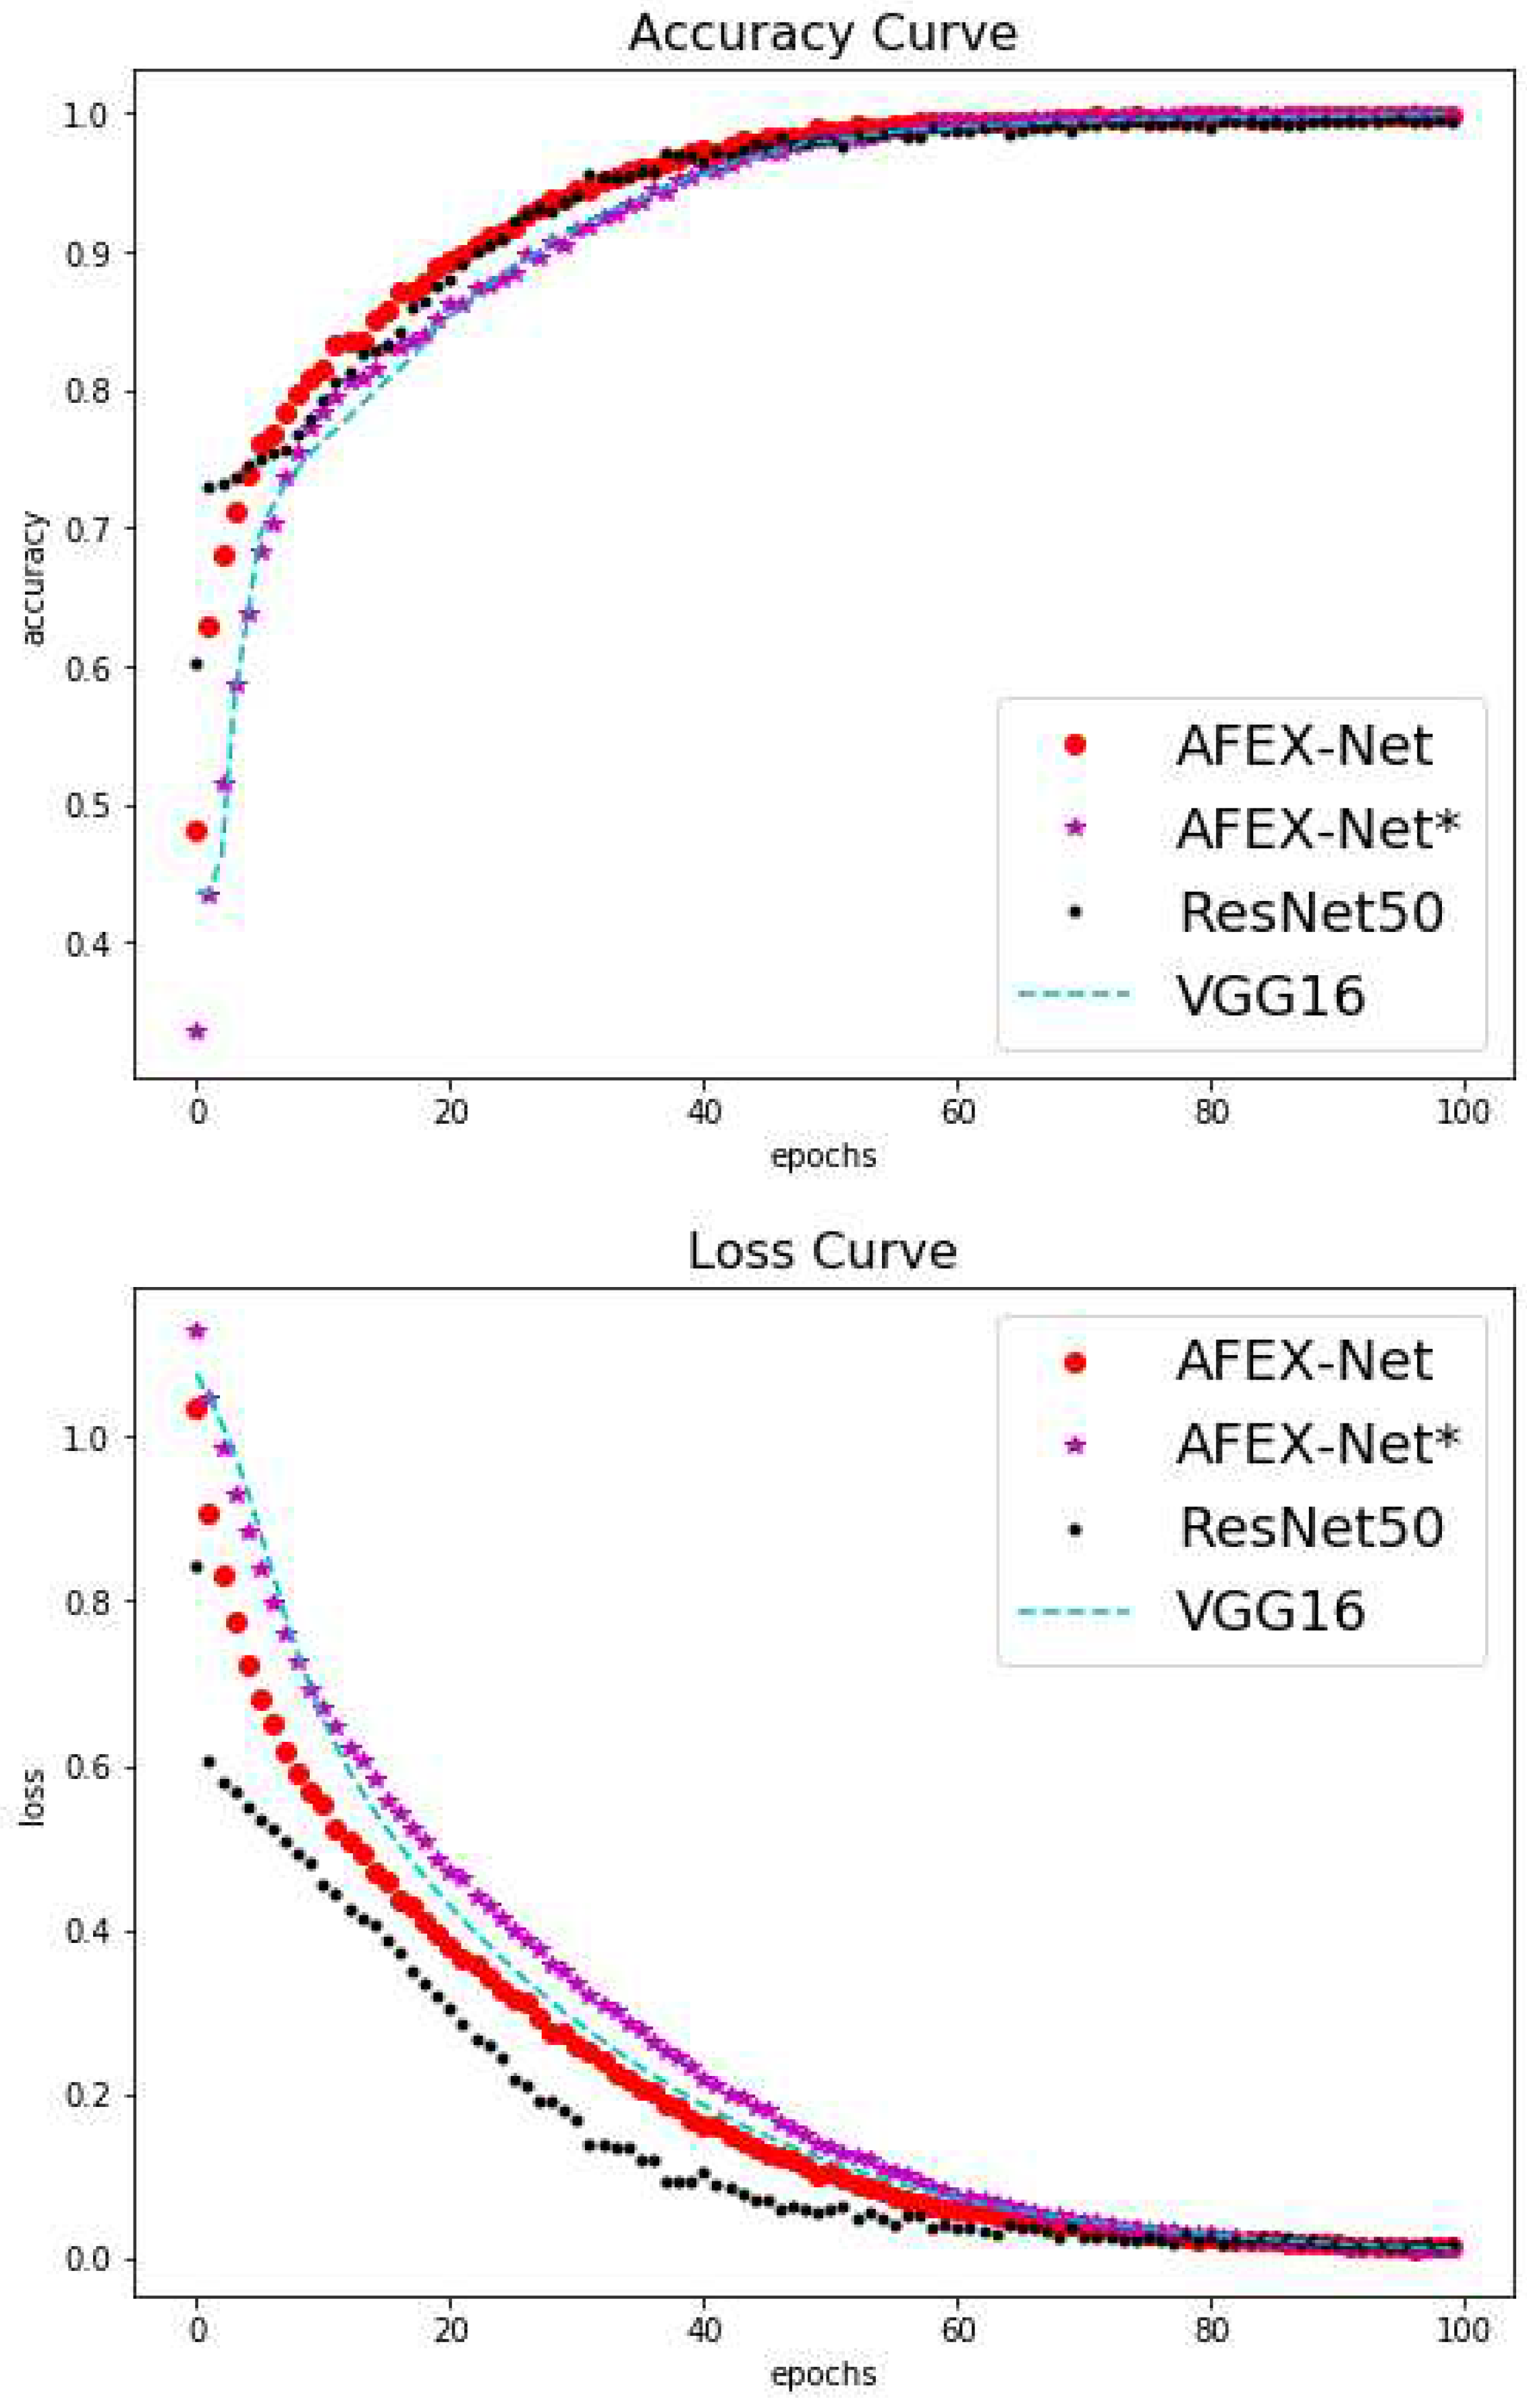
- The proposed network has few parameters compared to other CNN models used in this area (e.g. ResNet50 and VGG16) with faster training while preserving the accuracy. The low computational time of the proposed model makes it highly attractive in the clinic.
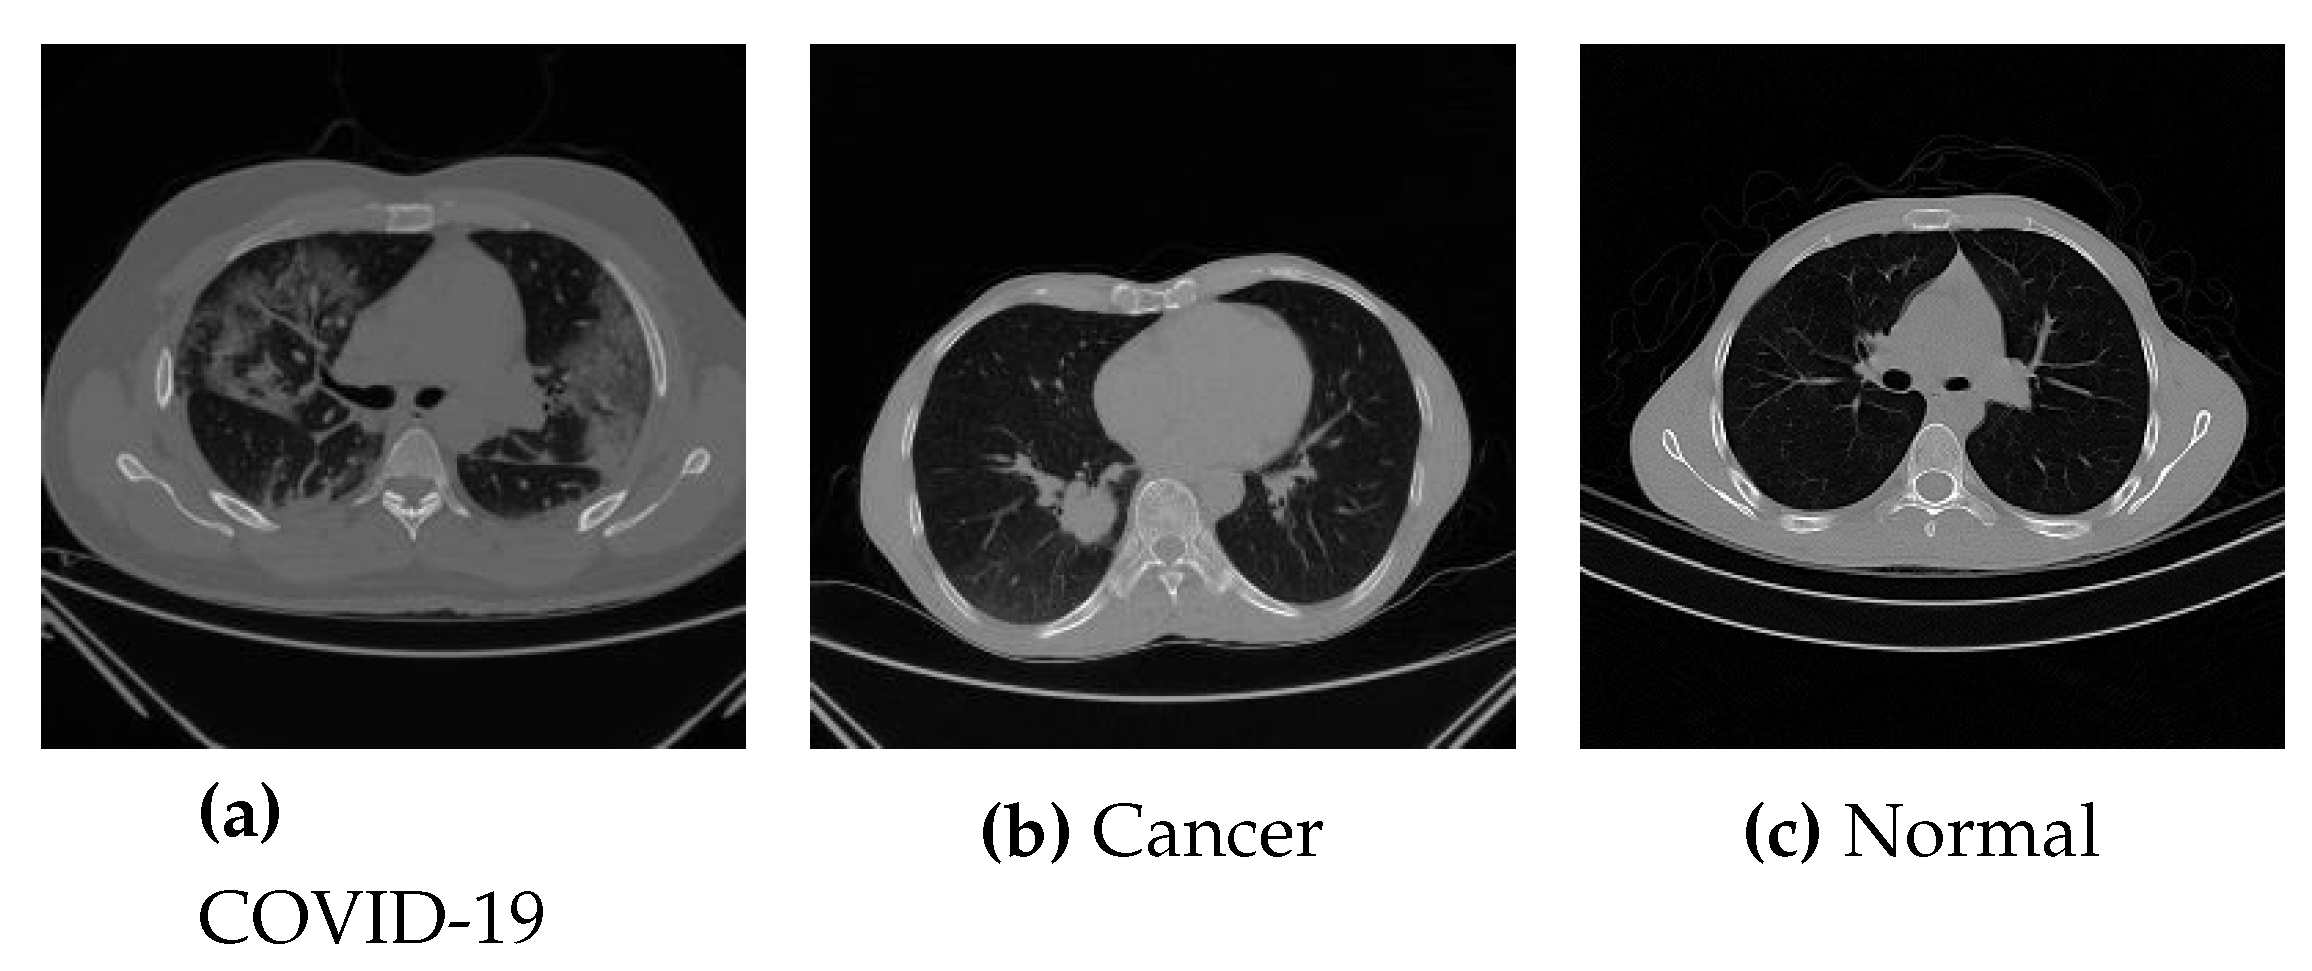
- The proposed model has been evaluated on collected chest CT images from one origin to limit the learning risk of bias.
2. AFEX-Net: The Proposed Deep Model
2.1. Image Preparation
- applying an irrational mask based on the Gregory-Leibniz infinite series on the input image.
- applying an image binarization method on the previously filtered image using a proper and adapted binarization threshold.
- eliminating the undesired tissues from the binary image using morphological operations (using proper and adaptive disc size) and applying the flood-fill algorithm to fill holes in the image.
- cropping the final images (removing the black background) and resizing the resulted images to a unique size containing only the chest area.
2.2. Proposed Deep CNN for Chest CT Images Classification
- Adaptive activation function Here, the gated adaptive activation function in [38] is employed which is formulated as followswhere, is a learnable controlling parameter and and are the LeakyReLU and PReLU activation functions, respectively. The aim of using gated function is to combine basic activation function in non-linear structure that is the most suitable one for a special data.
- Adaptive pooling layer based on the proposed adaptive pooling in [39], this layer is a combination of max pooling () and average pooling () layer,where the combination coefficient is a scalar parameter that is learned during network training (abbreviation stands for per layer/region/channel combination). Using this layer, the pooling operation is also influenced by the learning process and the input data.
3. Evaluation
3.1. Dataset
3.1.1. COVID-Cancer-Set (CC)
3.1.2. COVID-CTset
3.2. Experimental Setup
3.3. Performance Metrics
3.4. Results & Discussion
3.4.1. CCs Dataset
3.4.2. COVID-CTset
4. Conclusions
Author Contributions
Funding
Institutional Review Board Statement
Informed Consent Statement
Data Availability Statement
Conflicts of Interest
References
- Wang, C.; Horby, P.W.; Hayden, F.G.; Gao, G.F. A novel coronavirus outbreak of global health concern. Lancet 2020, 395, 470–473. [Google Scholar] [CrossRef] [PubMed]
- Chen, N.; Zhou, M.; Dong, X.; Qu, J.; Gong, F.; Han, Y.; Qiu, Y.; Wang, J.; Liu, Y.; Wei, Y.; et al. Epidemiological and clinical characteristics of 99 cases of 2019 novel coronavirus pneumonia in Wuhan, China: a descriptive study. Lancet 2020, 395, 507–513. [Google Scholar] [CrossRef] [PubMed]
- Zhu, Y.; Gao, Z.H.; Liu, Y.L.; Xu, D.Y.; Guan, T.M.; Li, Z.P.; Kuang, J.Y.; Li, X.M.; Yang, Y.Y.; Feng, S.T. Clinical and CT imaging features of 2019 novel coronavirus disease (COVID-19). J. Infect. 2020, 81, 147–178. [Google Scholar] [CrossRef] [PubMed]
- Singhal, T. A review of coronavirus disease-2019 (COVID-19). Indian J. Pediatr. 2020, 87, 281–286. [Google Scholar] [CrossRef]
- World Health Organization. Laboratory testing for 2019 novel coronavirus (2019-nCoV) in suspected human cases. Who - Interim Guid. 2020, 2019, 1–7. [Google Scholar]
- Tabik, S.; Gómez-Ríos, A.; Martín-Rodríguez, J.L.; Sevillano-García, I.; Rey-Area, M.; Charte, D.; Guirado, E.; Suárez, J.L.; Luengo, J.; Valero-González, M.A.; et al. COVIDGR Dataset and COVID-SDNet Methodology for Predicting COVID-19 Based on Chest X-Ray Images. IEEE J. Biomed. Health Informatics 2020, 24, 3595–3605. [Google Scholar] [CrossRef]
- Kalra, M.K.; Homayounieh, F.; Arru, C.; Holmberg, O.; Vassileva, J. Chest CT practice and protocols for COVID-19 from radiation dose management perspective. Eur. Radiol. 2020, 30, 6554–6560. [Google Scholar] [CrossRef]
- Ucar, F.; Korkmaz, D. COVIDiagnosis-Net: Deep Bayes-SqueezeNet based diagnosis of the coronavirus disease 2019 (COVID-19) from X-ray images. Med. Hypotheses 2020, 140, 109761–109761. [Google Scholar] [CrossRef]
- Pereira, R.M.; Bertolini, D.; Teixeira, L.O.; Silla, C.N.; Costa, Y.M. COVID-19 identification in chest X-ray images on flat and hierarchical classification scenarios. Comput. Methods Programs Biomed. 2020, 194, 105532. [Google Scholar] [CrossRef]
- Yi, P.; Kim, T.K.; Lin, C. Generalizability of Deep Learning Tuberculosis Classifier to COVID-19 Chest Radiographs: New Tricks for an Old Algorithm? J. Thorac. Imaging 2020, Publish Ahead of Print, 1. [Google Scholar] [CrossRef]
- Tuncer, T.; Dogan, S.; Ozyurt, F. An automated Residual Exemplar Local Binary Pattern and iterative ReliefF based corona detection method using lung X-ray image. Chemom. Intell. Lab. Syst. 1040. [Google Scholar]
- Yamaç, M.; Ahishali, M.; Degerli, A.; Kiranyaz, S.; Chowdhury, M.E.H.; Gabbouj, M. Convolutional Sparse Support Estimator-Based COVID-19 Recognition From X-Ray Images. IEEE Trans. Neural Netw. Learn. Syst. 2021, 32, 1810–1820. [Google Scholar] [CrossRef]
- Rubin, G.D.; Ryerson, C.J.; Haramati, L.B.; Sverzellati, N.; Kanne, J.P.; Raoof, S.; Schluger, N.W.; Volpi, A.; Yim, J.J.; Martin, I.B.K.; et al. The Role of Chest Imaging in Patient Management during the COVID-19 Pandemic: A Multinational Consensus Statement from the Fleischner Society. Radiology 2020, 296, 172–180. [Google Scholar] [CrossRef]
- Castiglione, A.; Vijayakumar, P.; Nappi, M.; Sadiq, S.; Umer, M. COVID-19: Automatic Detection of the Novel Coronavirus Disease from CT Images Using an Optimized Convolutional Neural Network. IEee Trans. Ind. Informatics 2021. [Google Scholar] [CrossRef]
- Singh, D.; Kumar, V.; Vaishali. ; Kaur, M. Classification of COVID-19 patients from chest CT images using multi-objective differential evolution-based convolutional neural networks. Eur. J. Clin. Microbiol. Infect. Dis. 2020, 39, 1379–1389. [Google Scholar] [CrossRef] [PubMed]
- Yang, S.; Jiang, L.; Cao, Z.; Wang, L.; Cao, J.; Feng, R.; Zhang, Z.; Xue, X.; Shi, Y.; Shan, F. Deep learning for detecting corona virus disease 2019 (COVID-19) on high-resolution computed tomography: a pilot study. Ann. Transl. Med. 2020, 8. [Google Scholar] [CrossRef] [PubMed]
- A Fully Automatic Deep Learning System for COVID-19 Diagnostic and Prognostic Analysis. Eur. Respir. J. 2020. [CrossRef]
- Pu, J.; Leader, J.; Bandos, A.; Shi, J.; Du, P.; Yu, J.; Yang, B.; Ke, S.; Guo, Y.; Field, J.B.; et al. Any unique image biomarkers associated with COVID-19? Eur. Radiol. 2020, 1. [Google Scholar] [CrossRef] [PubMed]
- Xu, X.; Jiang, X.; Ma, C.; Du, P.; Li, X.; Lv, S.; Yu, L.; Ni, Q.; Chen, Y.; Su, J.; et al. A deep learning system to screen novel coronavirus disease 2019 pneumonia. Engineering 2020, 6, 1122–1129. [Google Scholar] [CrossRef] [PubMed]
- Ardakani, A.A.; Kanafi, A.R.; Acharya, U.R.; Khadem, N.; Mohammadi, A. Application of deep learning technique to manage COVID-19 in routine clinical practice using CT images: Results of 10 convolutional neural networks. Comput. Biol. Med. 2020, 121, 103795. [Google Scholar] [CrossRef]
- Kasinathan, G.; Jayakumar, S.; Gandomi, A.H.; Ramachandran, M.; Fong, S.J.; Patan, R. Automated 3-D lung tumor detection and classification by an active contour model and CNN classifier. Expert Syst. Appl. 2019, 134, 112–119. [Google Scholar] [CrossRef]
- Piñeiro, F.M.; López, C.T.; De la Fuente Aguado, J. Management of lung cancer in the COVID-19 pandemic: A review. J. Cancer Metastasis Treat. 2021, 2021, 10. [Google Scholar] [CrossRef]
- Liu, M.; Zeng, W.; Wen, Y.; Zheng, Y.; Lv, F.; Xiao, K. COVID-19 pneumonia: CT findings of 122 patients and differentiation from influenza pneumonia. Eur. Radiol. 2020, 30, 5463–5469. [Google Scholar] [CrossRef] [PubMed]
- Ibrahim, D.M.; Elshennawy, N.M.; Sarhan, A.M. Deep-chest: Multi-classification deep learning model for diagnosing COVID-19, pneumonia, and lung cancer chest diseases. Comput. Biol. Med. 2021, 132, 104348. [Google Scholar] [CrossRef] [PubMed]
- Torralba, A.; Efros, A.A. Unbiased look at dataset bias. In Proceedings of the CVPR 2011, 2011, pp. 1521–1528. [Google Scholar] [CrossRef]
- López-Cabrera, J.D.; Orozco-Morales, R.; Portal-Diaz, J.A.; Lovelle-Enríquez, O.; Pérez-Díaz, M. Current limitations to identify COVID-19 using artificial intelligence with chest X-ray imaging. Health Technol. 2021, 11, 411–424. [Google Scholar] [CrossRef] [PubMed]
- Gao, X.W.; Hui, R.; Tian, Z. Classification of CT brain images based on deep learning networks. Comput. Methods Programs Biomed. 2017, 138, 49–56. [Google Scholar] [CrossRef]
- Nakamura, Y.; Higaki, T.; Tatsugami, F.; Honda, Y.; Narita, K.; Akagi, M.; Awai, K. Possibility Deep. Learn. Med. Imaging Focus. Improv. Comput. Tomogr. Image Qual. 2020. Learn. Med. Imaging Focus. Improv. Comput. Tomogr. Image Qual. 2020, 2020. 44, 161–167. [Google Scholar] [CrossRef]
- Moldovanu, S.; Moraru, L.; Biswas, A. Robust Skull-Stripping Segmentation Based on Irrational Mask for Magnetic Resonance Brain Images. J. Digit. Imaging 2015, 28, 738–747. [Google Scholar] [CrossRef]
- Tek, F.B.; İlker Çam. ; Karlı, D. Adaptive convolution kernel for artificial neural networks. J. Vis. Commun. Image Represent. 2021, 75, 103015. [Google Scholar] [CrossRef]
- Su, H.; Jampani, V.; Sun, D.; Gallo, O.; Learned-Miller, E.G.; Kautz, J. Pixel-Adaptive Convolutional Neural Networks. CoRR, 1904. [Google Scholar]
- Liu, D.; Zhou, Y.; Sun, X.; Zha, Z.; Zeng, W. Adaptive Pooling in Multi-instance Learning for Web Video Annotation. 2017 IEEE International Conference on Computer Vision Workshops (ICCVW).
- Momeny, M.; Sarram, M.A.; Latif, A.; Sheikhpour, R.a. A Convolutional Neural Network based on Adaptive Pooling for Classification of Noisy Images. Signal Data Process. 2021, 17, http. [Google Scholar] [CrossRef]
- Li, Y.; Wang, N.; Shi, J.; Hou, X.; Liu, J. Adaptive Batch Normalization for practical domain adaptation. Pattern Recognit. 2018, 80, 109–117. [Google Scholar] [CrossRef]
- ZahediNasab, R.; Mohseni, H. Neuroevolutionary based convolutional neural network with adaptive activation functions. Neurocomputing 2020, 381, 306–313. [Google Scholar] [CrossRef]
- Jagtap, A.D.; Kawaguchi, K.; Karniadakis, G.E. Adaptive activation functions accelerate convergence in deep and physics-informed neural networks. J. Comput. Phys. 2020, 404, 109136. [Google Scholar] [CrossRef]
- Farahani, A.; Mohseni, H. Medical image segmentation using customized U-Net with adaptive activation functions. Neural Comput. Appl. 2021, 33, 6307–6323. [Google Scholar] [CrossRef]
- Qian, S.; Liu, H.; Liu, C.; Wu, S.; Wong, H.S. Adaptive activation functions in convolutional neural networks. Neurocomputing 2017, 272, 204–212. [Google Scholar] [CrossRef]
- Lee, C.Y.; Gallagher, P.W.; Tu, Z. Generalizing pooling functions in convolutional neural networks: Mixed, gated, and tree. In Proceedings of the Proceedings of the 19th International Conference on Artificial Intelligence and Statistics, AISTATS 2016, 2016, pp. 464–472, [150908985]. [Google Scholar]
- Simonyan, K.; Zisserman, A. Very deep convolutional networks for large-scale image recognition. arXiv 2014, arXiv:1409.1556 2014. [Google Scholar]
- He, K.; Zhang, X.; Ren, S.; Sun, J. Deep Residual Learning for Image Recognition. CoRR, 1512. [Google Scholar]
- Rahimzadeh, M.; Attar, A.; Sakhaei, S.M. A fully automated deep learning-based network for detecting COVID-19 from a new and large lung CT scan dataset. Biomed. Signal Process. Control. 2021, 68, 102588. [Google Scholar] [CrossRef] [PubMed]
- Kingma, D.P.; Ba, J. Adam: A Method for Stochastic Optimization. In Proceedings of the 3rd International Conference on Learning Representations, ICLR 2015, San Diego, CA, USA, 2015, Conference Track Proceedings; Bengio, Y.; LeCun, Y., Eds., 2015., May 7-9.
- Chollet, F.; et al. Keras. https://keras.io, 2015.
- Abadi, M.; et al. TensorFlow: Large-Scale Machine Learning on Heterogeneous Systems, 2015. Software available from tensorflow.org.
- Bisong, E. Building Machine Learning and Deep Learning Models on Google Cloud Platform; Apress, 2019. [CrossRef]
- Nguyen, D.; Kay, F.; Tan, J.; Yan, Y.; Ng, Y.S.; Iyengar, P.; Peshock, R.; Jiang, S. Deep Learning–Based COVID-19 Pneumonia Classification Using Chest CT Images: Model Generalizability. Front. Artif. Intell. 2021, 4. [Google Scholar] [CrossRef] [PubMed]

| Layer | Type | Filter-size | Strides | Filter | Output Shape | Parameters |
|---|---|---|---|---|---|---|
| 1 | BN | - | - | - | ( 200, 200, 1) | 4 |
| 2 | Conv | (4,4) | 6 | ( 48, 48, 96) | 11712 | |
| 3 | AAF | - | - | - | ( 48,48, 96) | 221184 |
| 4 | A-pool | (3,3) | - | ( 16,16, 96) | 24576 | |
| 5 | BN | - | - | - | ( 16,16, 96) | 384 |
| 6 | Conv | (2,2) | 256 | (8,8, 256) | 614656 | |
| 7 | AAF | - | - | - | ( 8, 8, 256) | 16384 |
| 8 | A-pool | (3,3) | - | ( 8, 8, 256) | 2304 | |
| 9 | BN | - | - | - | ( 4, 4, 256) | 1024 |
| 10 | Conv. | (3,3) | 384 | ( 4, 4, 384) | 885120 | |
| 11 | Conv | (2,2) | 256 | (2, 2, 256) | 884992 | |
| 12 | AAF | - | - | - | ( 2,2, 256) | 1024 |
| 13 | A-pool | (3,3) | - | (1, 1, 256) | 256 | |
| 14 | BN | - | - | - | ( 1, 1, 256) | 1024 |
| 15 | Conv | (2,2) | 192 | (1, 1, 192) | 1769664 | |
| 16 | dropout | 1, 1, 192 | 0 | |||
| 17 | Conv | (2,2) | 96 | (1, 1, 96) | 18528 | |
| 18 | dropout | (1, 1, 96) | 0 | |||
| 19 | Flatten | (96) | 0 | |||
| 20 | FC | - | - | - | (3) | 291 |
| 21 | Softmax | - | - | - | (3) | 0 |
| Total params: 4,453,127; Trainable params:4,451,909; Non-trainable params: 1,218. | ||||||
| Model | trainable | non-trainable | Total | Training Time | Epochs |
|---|---|---|---|---|---|
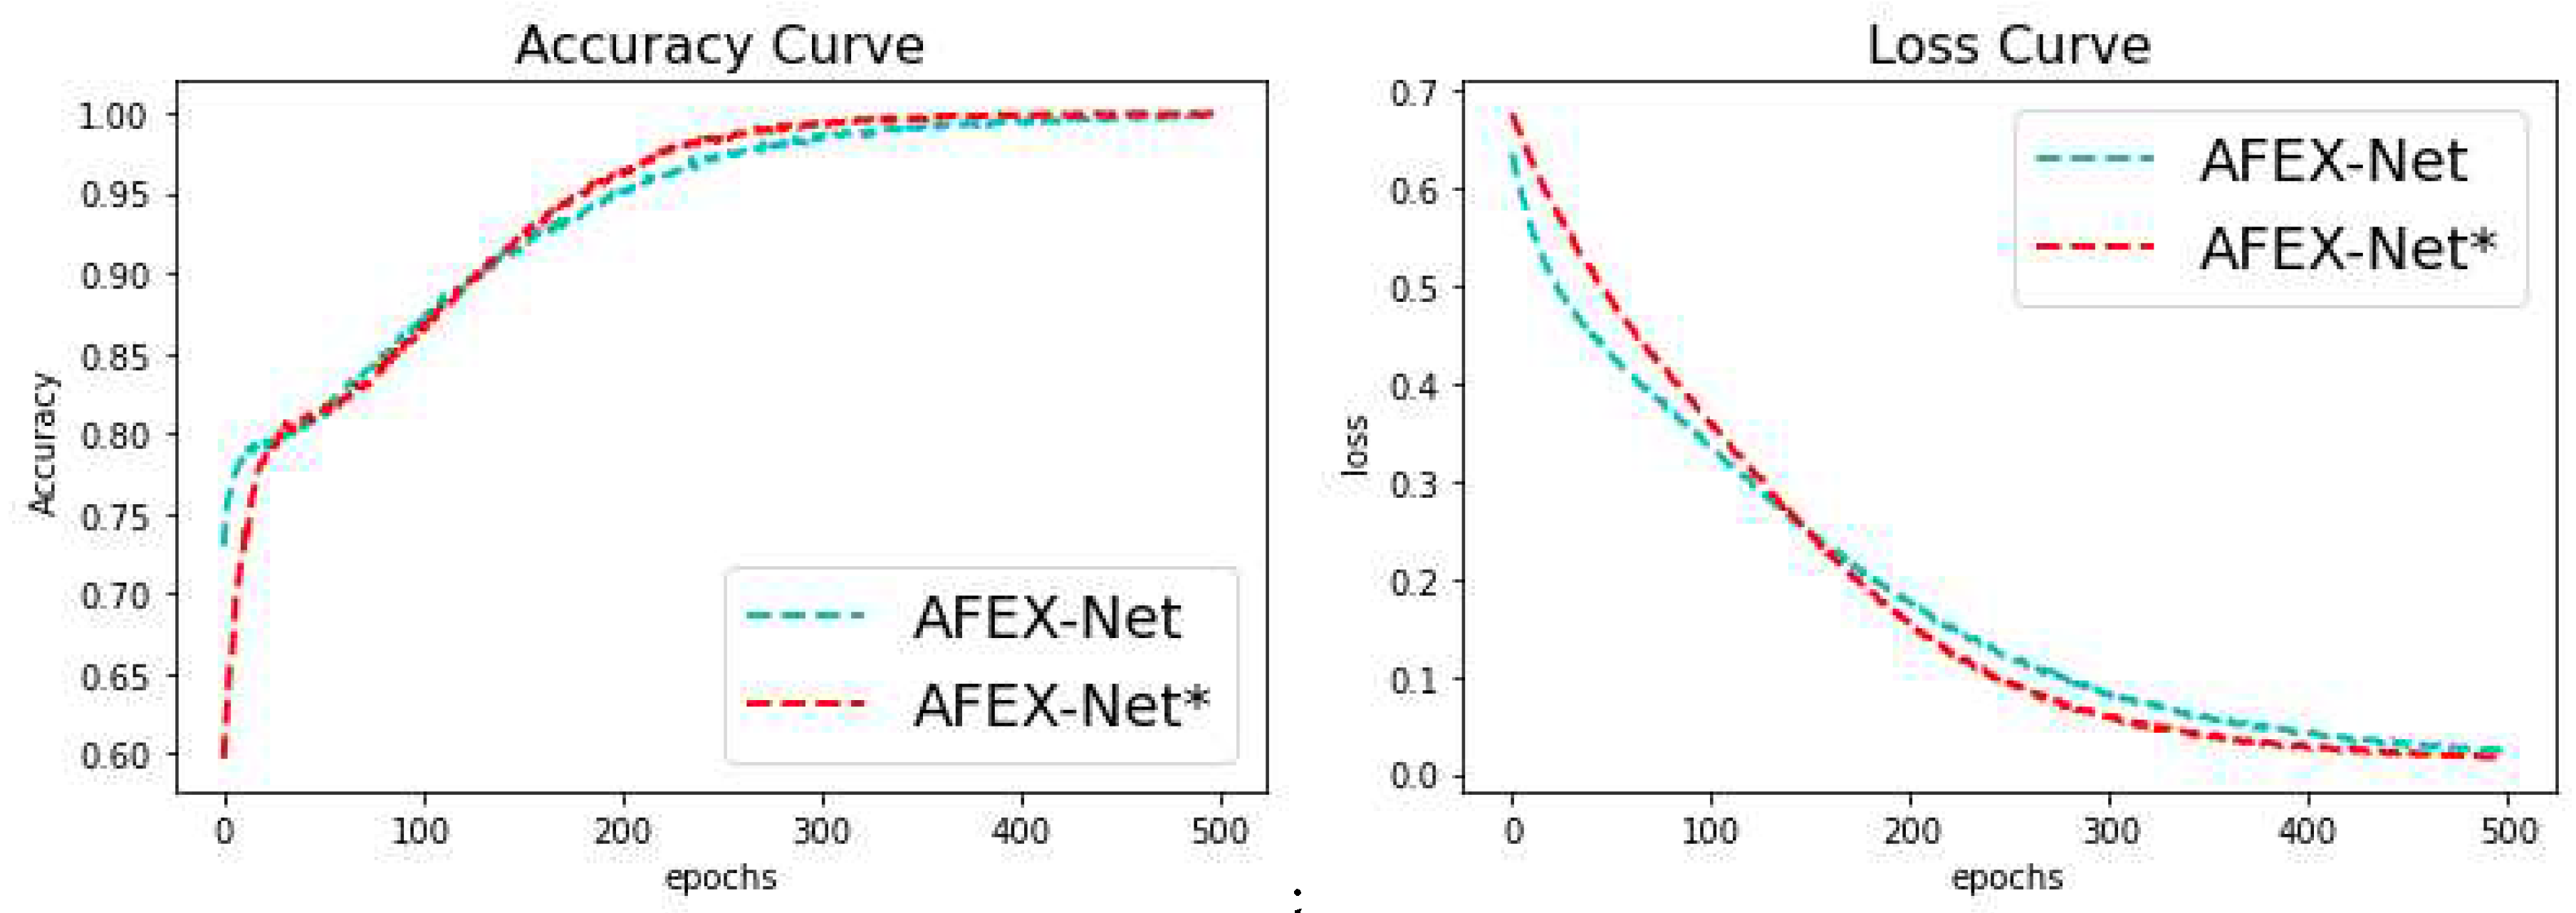
| AFEX-Net | 4,451,909 | 1,218 | 4,453,127 | 45m | 100 |
| ResNet50 | 23,534,467 | 53,120 | 23,587,587 | 1h:47m | 100 |
| VGG16 | 107,008,707 | 0 | 107,008,707 | 2h:16m | 100 |
| Model | Optimizer | Learning rate | Epochs |
|---|---|---|---|
| AFEX-Net | Adam | 100 | |
| ResNet50 | Adam | 100 | |
| VGG16 | Adam | 100 |
| Model | Class | Sensitivity | Specificity | Precision | Overall loss | Overall Accuracy |
|---|---|---|---|---|---|---|
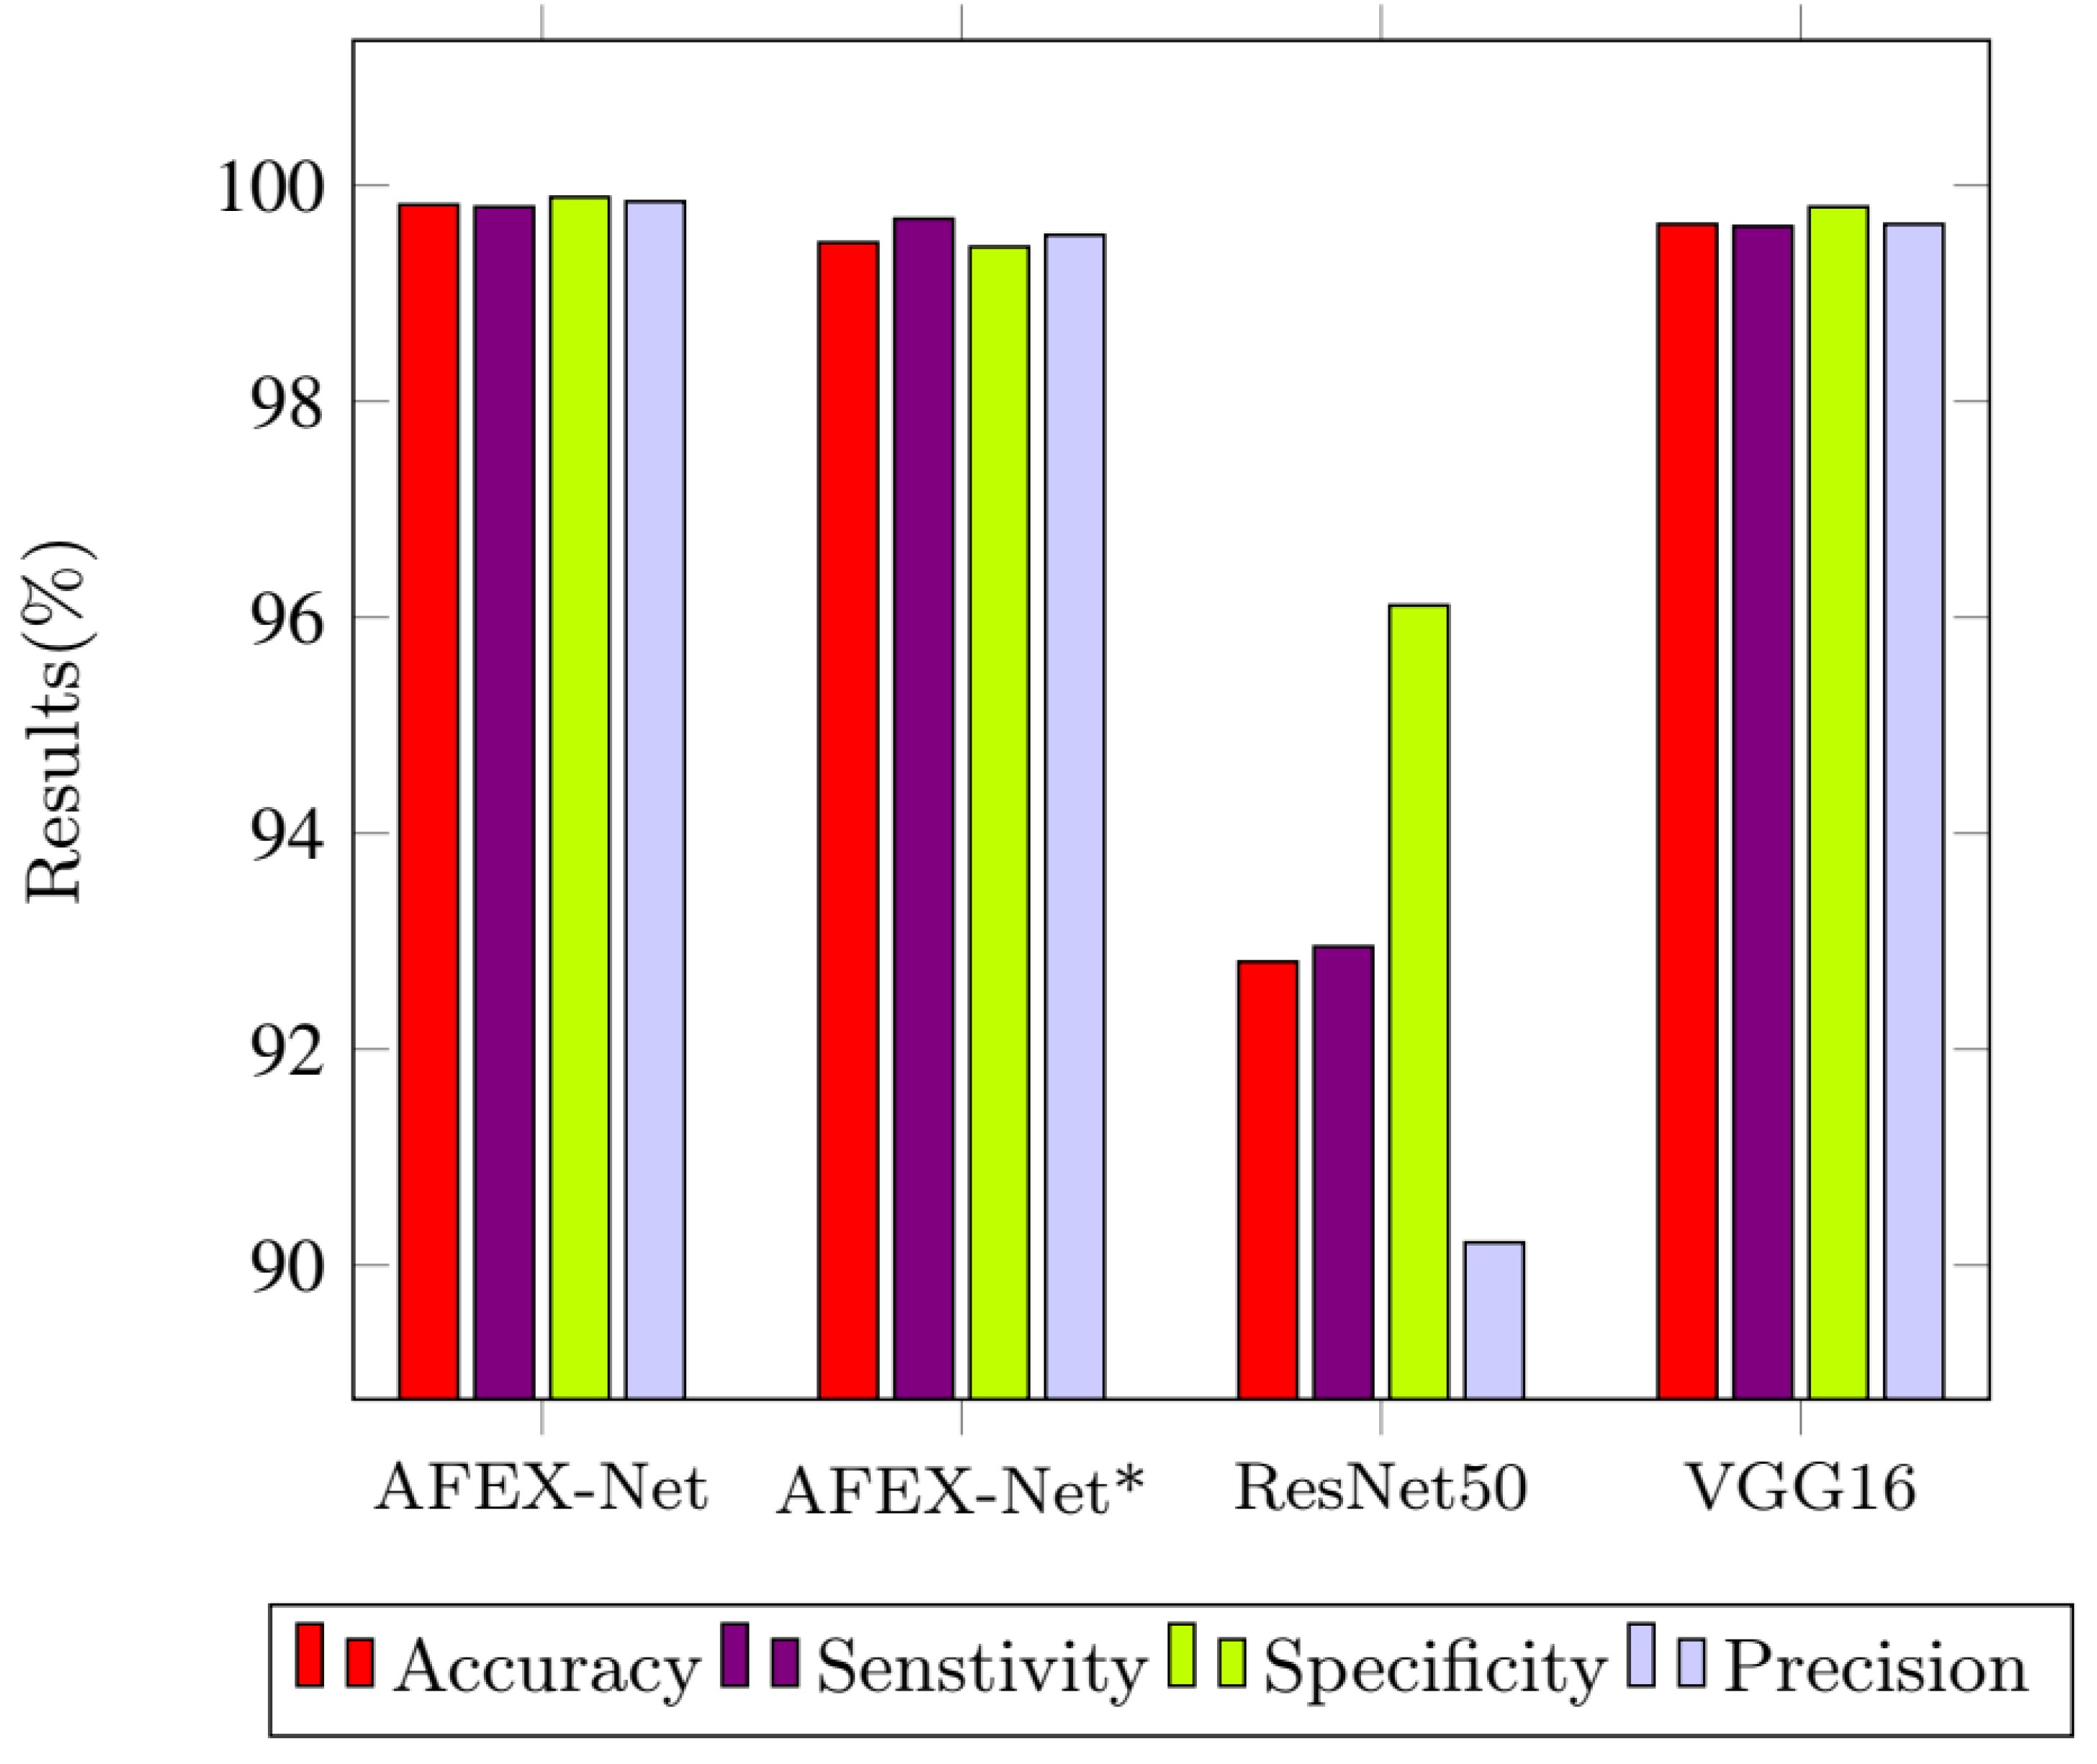
| AFEX-Net | COVID-19 | 99.89 | 99.80 | 99.79 | 1.04 ± 0.18 | 99.71 ± 0.05 |
| Cancer | 99.53 | 99.93 | 99.81 | |||
| Normal | 100 | 99.96 | 99.96 | |||
| Cancer | 98.78 | 99.76 | 99.34 | |||
| Normal | 99.89 | 100 | 100 | |||
| ResNet50 | COVID-19 | 88.65 | 97.45 | 97.59 | 24.31 ± 2.62 | 92.81 ± 0.75 |
| Cancer | 94.2 | 91.39 | 74.6 | |||
| Normal | 96 | 99.49 | 98.46 | |||
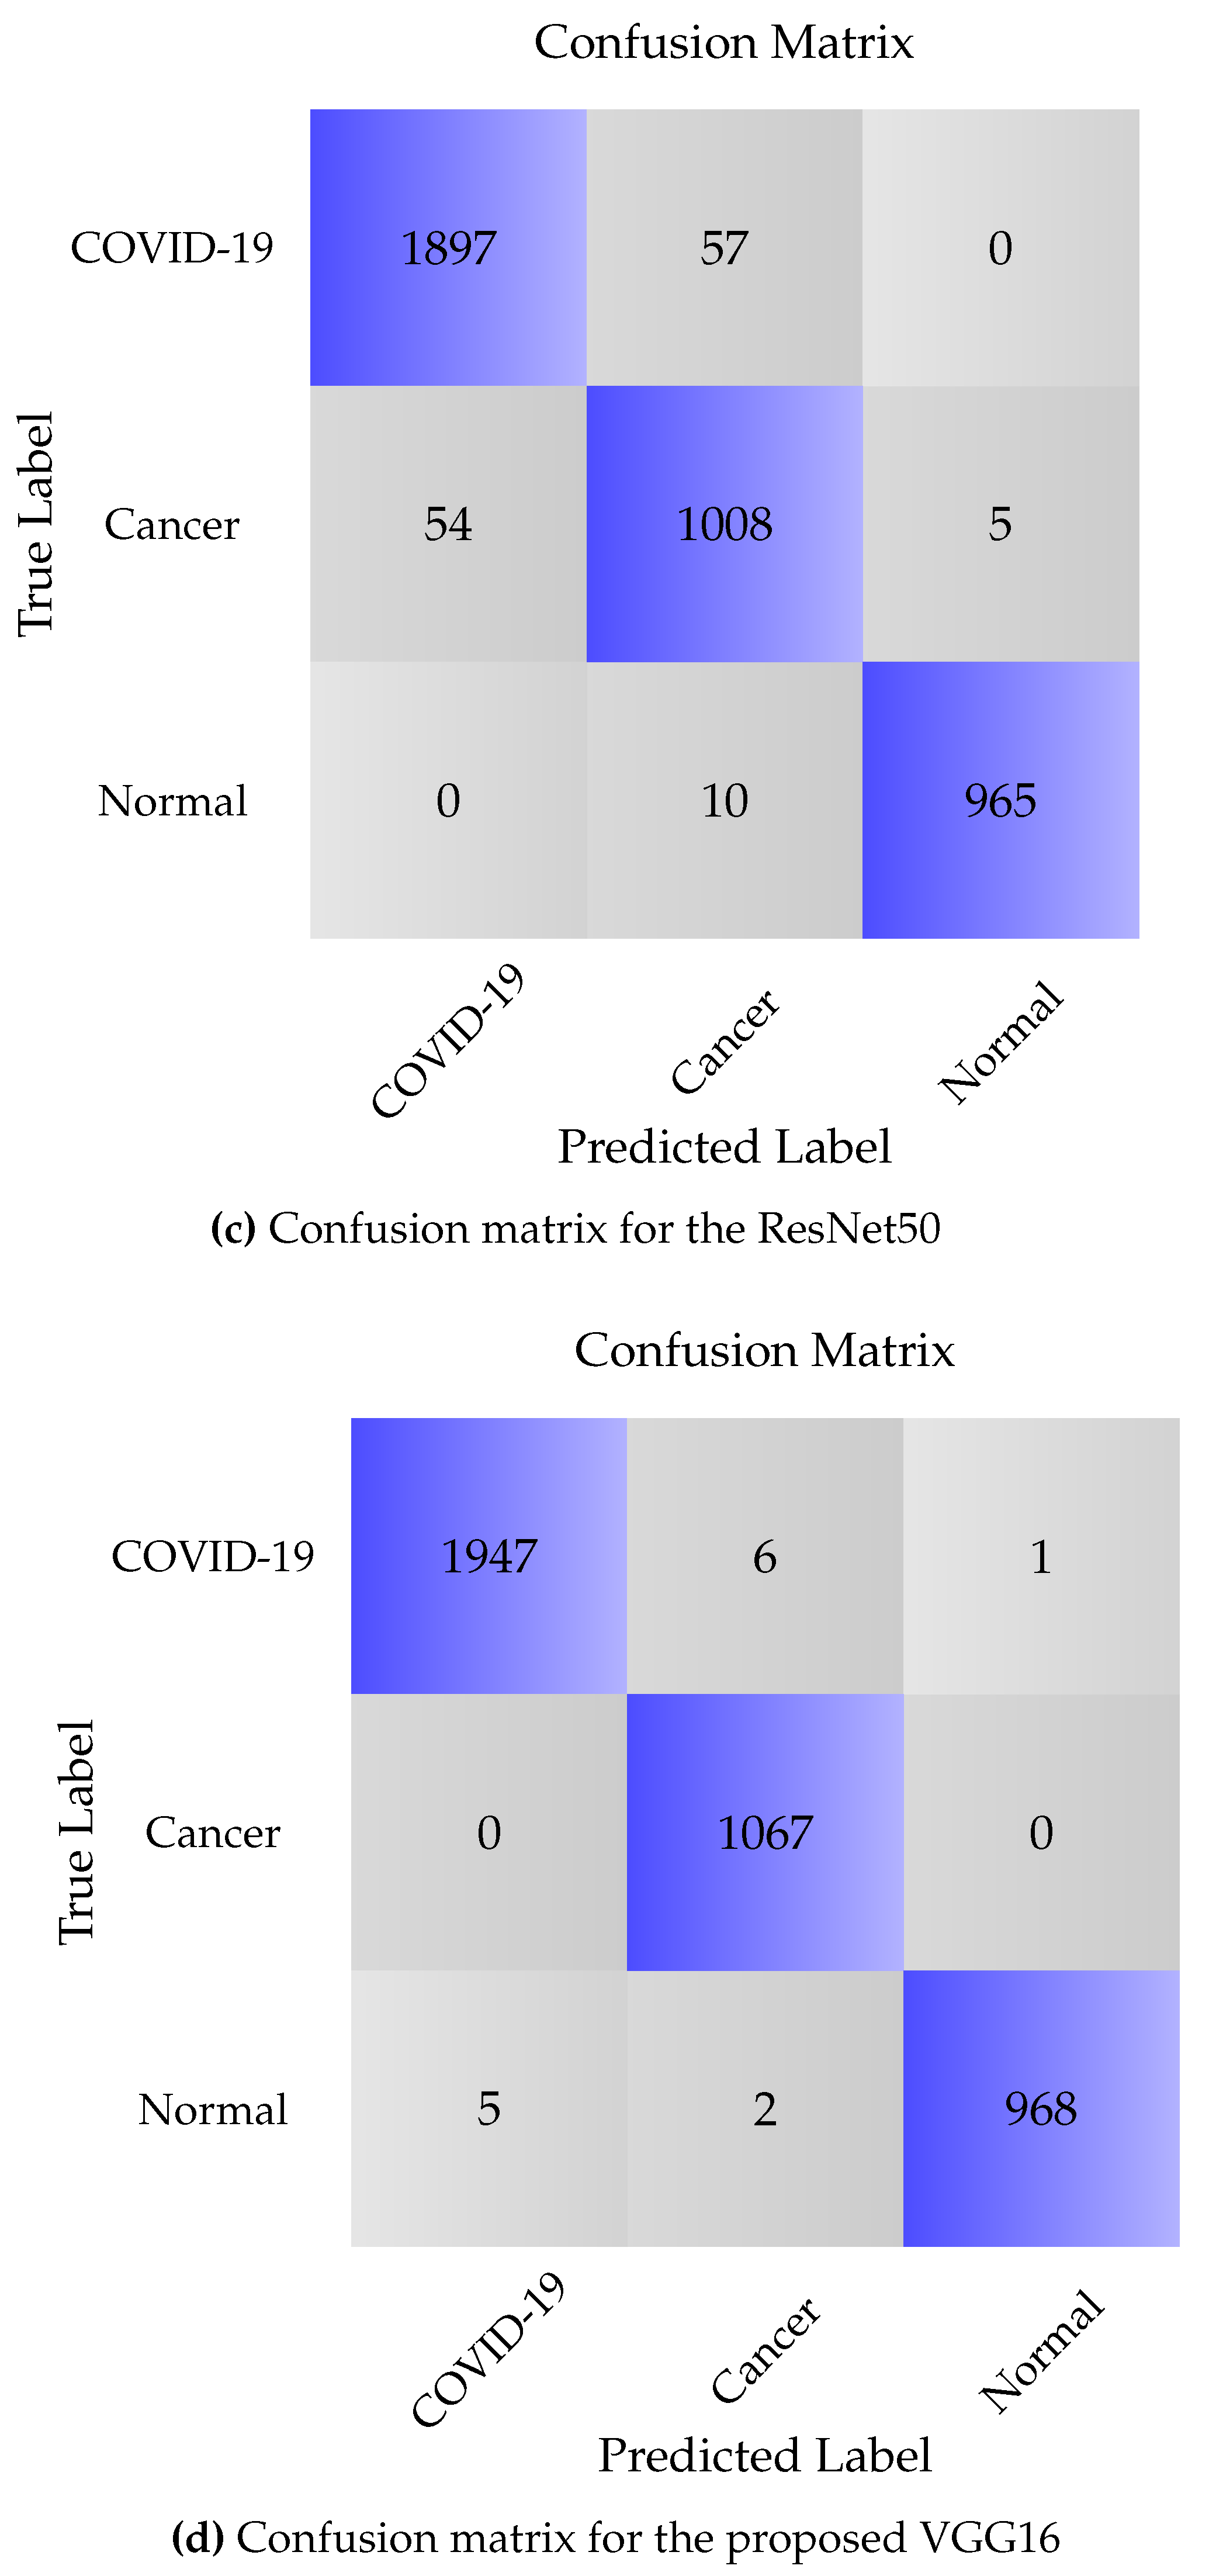
| VGG16 | COVID-19 | 99.74 | 99.65 | 99.64 | 2.6 ± 0.18 | 99.50 ± 0.05 |
| Cancer | 99.25 | 100 | 100 | |||
| Normal | 99.89 | 99.76 | 99.28 |
| Model | Overall Accuracy | Sensitivity | Specificity | Precision |
|---|---|---|---|---|
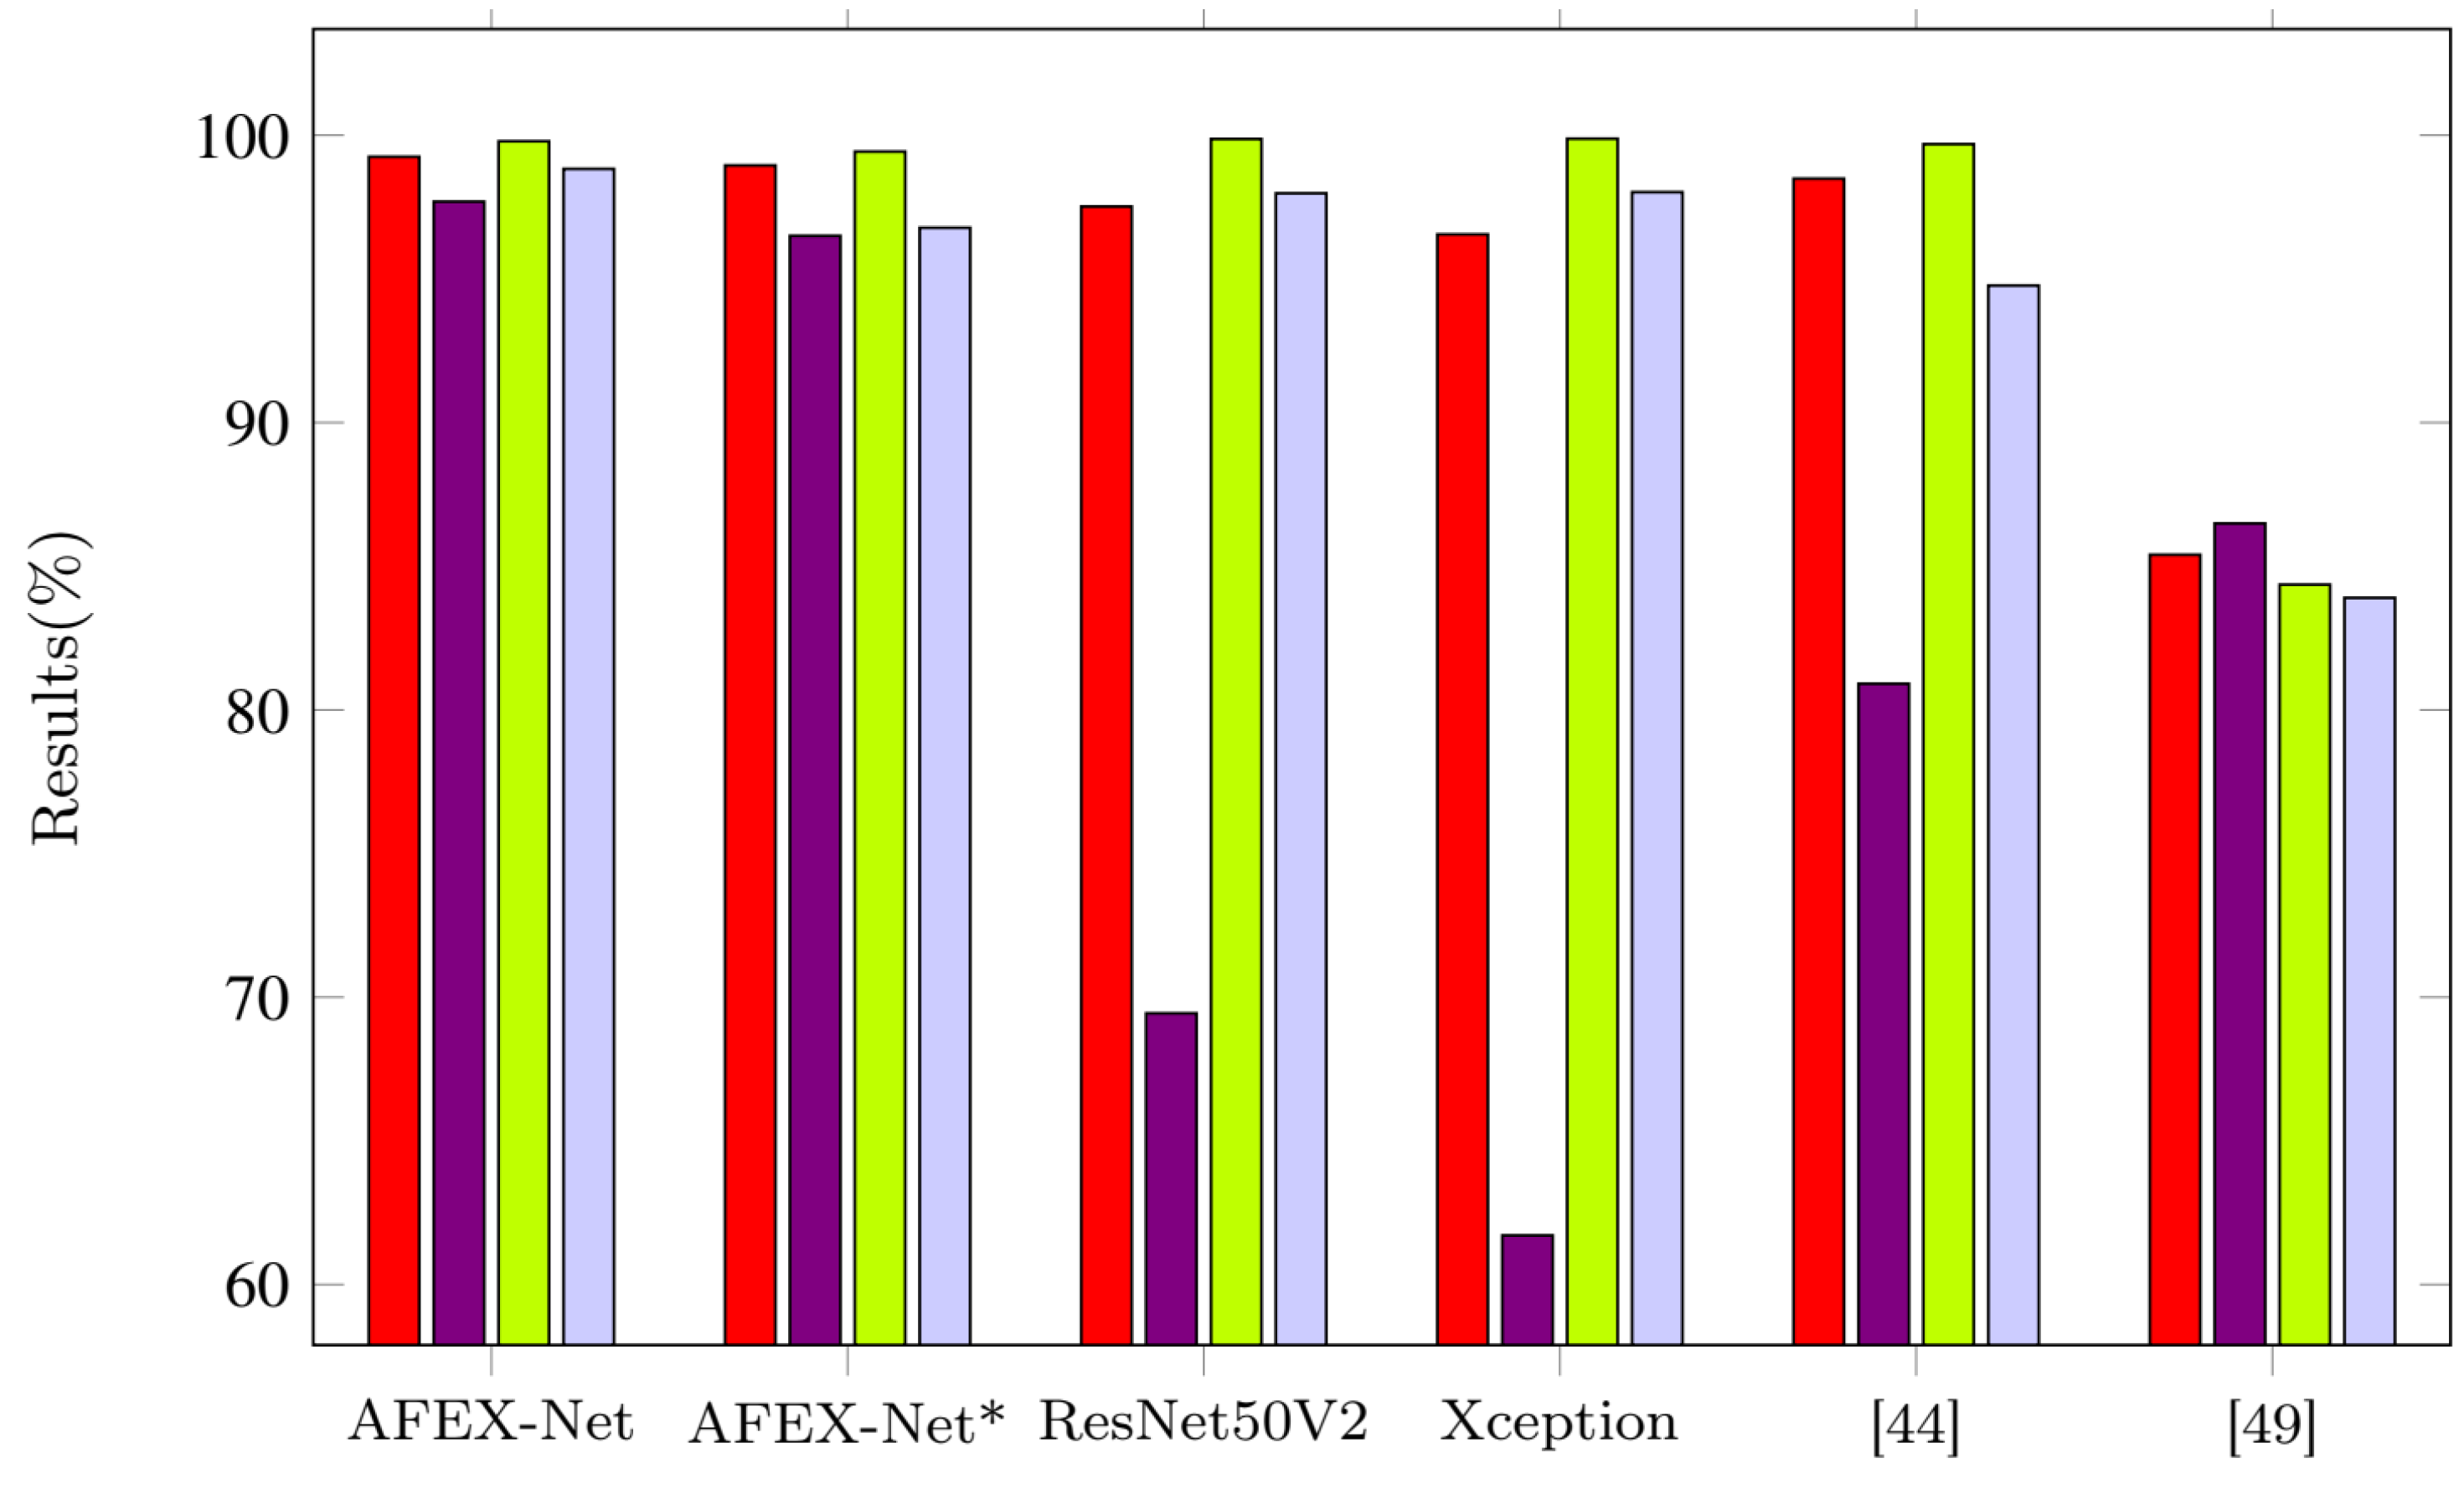
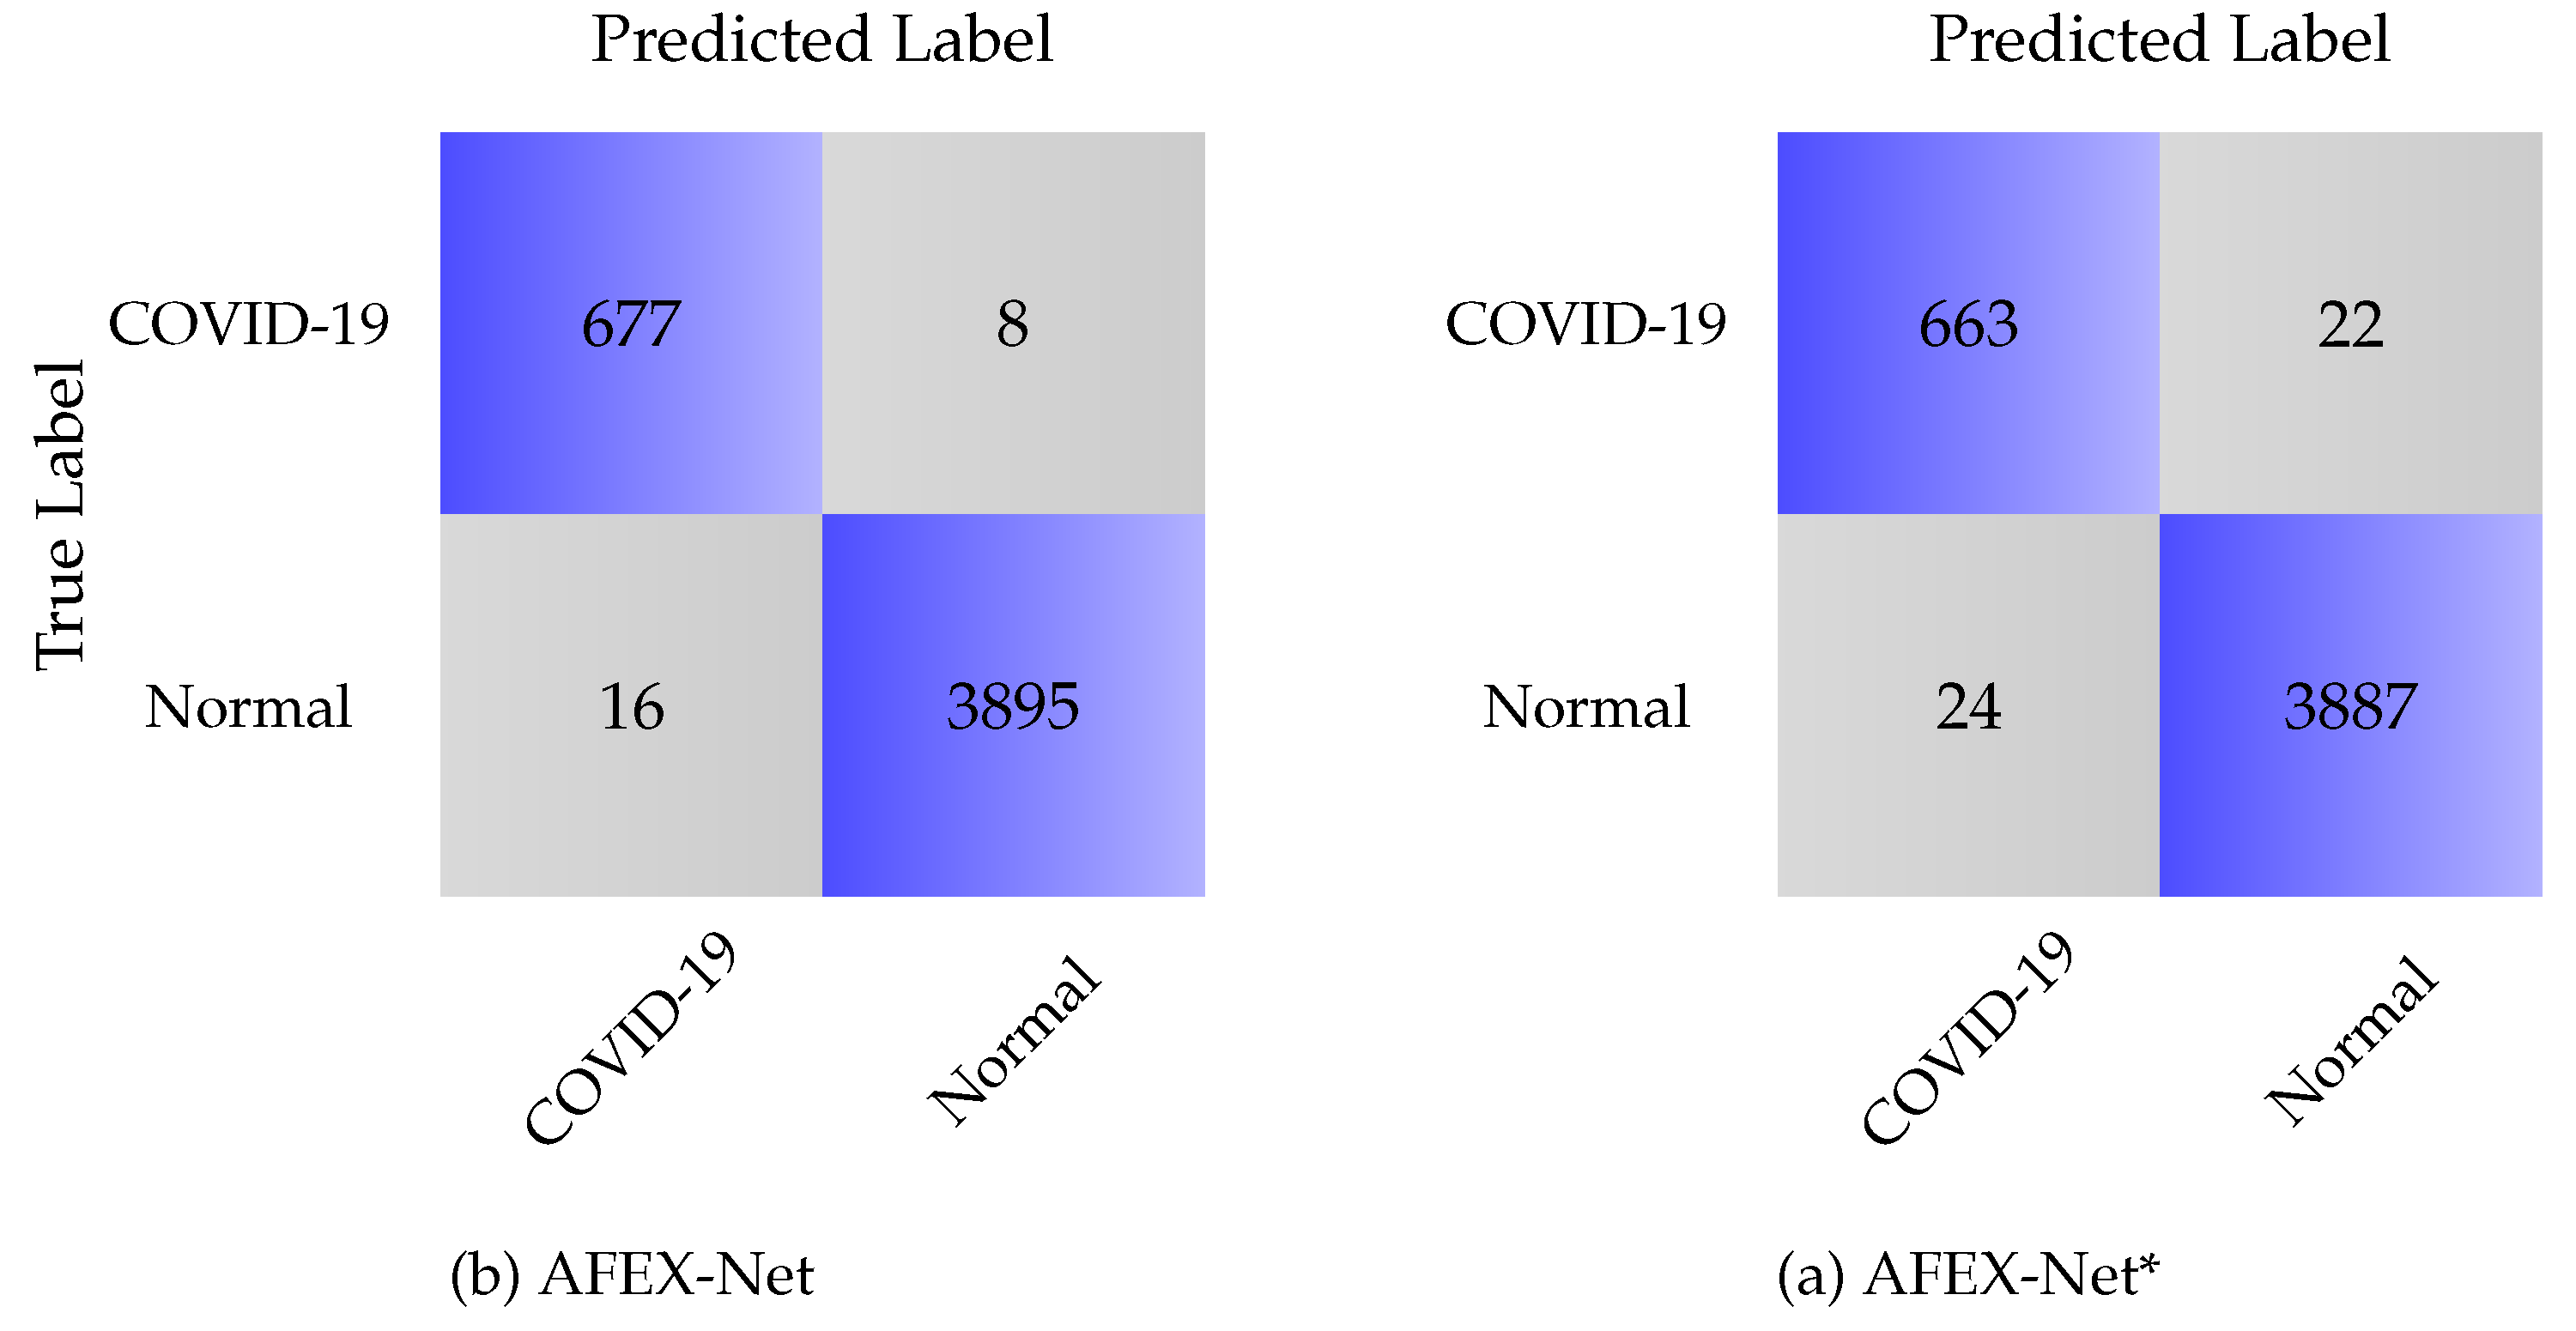
| AFEX-Net | 99.25 | 97.69 | 99.79 | 98.83 |
| AFEX-Net* | 98.95 | 96.50 | 99.43 | 96.78 |
| ResNet50V2 | 97.52 | 69.44 | 99.87 | 97.98 |
| Xception | 96.55 | 61.71 | 99.88 | 98.02 |
| [42] | 98.49 | 80.91 | 99.69 | 94.77 |
| [47] | 85.4 | 86.49 | 84.36 | 83.9 |
Disclaimer/Publisher’s Note: The statements, opinions and data contained in all publications are solely those of the individual author(s) and contributor(s) and not of MDPI and/or the editor(s). MDPI and/or the editor(s) disclaim responsibility for any injury to people or property resulting from any ideas, methods, instructions or products referred to in the content. |
© 2023 by the authors. Licensee MDPI, Basel, Switzerland. This article is an open access article distributed under the terms and conditions of the Creative Commons Attribution (CC BY) license (http://creativecommons.org/licenses/by/4.0/).


