INTRODUCTION
Food and beverage (F&B) companies are one of the industries that play an important role in the Indonesian economy. However, this sector is also vulnerable to fluctuations in the price of basic commodities which can affect the financial resilience of F&B companies. Rising prices of basic commodities such as rice, sugar, cooking oil and meat can have a negative impact on the profitability and solvency of food and beverage companies. Therefore,financial resilience become an important factor in maintaining the continuity of the F&B company's business amidst unstable market conditions.
Financial resilience can be interpreted as the company's ability to survive in an unstable situation and still be able to maintain good financial performance. Rising prices of staple foodstuffs can be one of the factors that can threaten the financial security of food and beverage companies. This is because F&B companies generally have a fairly high cost structure and depend on quality and stable raw materials. An increase in the price of basic commodities can affect the company's profit margins and cash flow, thereby worsening the company's financial condition.
Therefore, it is important to assess the impact of increasing prices of staple foods on sustainabilityfinancial resilience Indonesian food and beverage companies. This study aims to assist F&B companies in identifying the risks associated with rising prices of staples and taking appropriate actions to guard against themfinancial resilience company. In addition, this study can help the government and regulators formulate policies that can help increase basic food price stability and support the growth of the F&B industry in Indonesia.
Problem Formulation
How to maintainfinancial recilience F&B companies when there is an increase in basic commodities?
How does the increase in the price of staples affectfinancial resilience in an F&B company?
How F&B companies can improvefinancial resilience in the face of unstable price fluctuations of basic commodities?
Research purposes
Know and identify the effect of rising prices of staples onfinancial resilience in an F&B company.
Understand and analyze the factors that influence financial sustainability in dealing with commodity price volatility in F&B companies.
Knowing that F&B companies can improvefinancial resilience in the face of unstable price fluctuations of basic commodities.
LITERATURE REVIEW
(Klaper & Lusardi, 2019) Financial Resilience is defined as the ability to withstand life events that impact one's income and/or assets.
(Pandin, Sandari, Surahman, & GS, 2023) Resilience has three capacities, namely adaptive, absorptive and transformative which respond to various levels of change or shocks. Meanwhile, according to Danes (2014), concluded that financial behavior is positively correlated with financial resilience.
(Dananti, Nany, & Gusmao, 2022) Assessment of financial performance is one of the methods used by management to fulfill obligations in achieving the goals set by the company to investors.
(Hasibuana & Novialdi, 2022) A very significant increase in the price of basic necessities will have a negative impact on the economy of the Indonesian people, one of which is a decrease in purchasing power.
(Rochmaniah & Oktafia, 2019) One of the problems that often occurs in Indonesia is the increase in the price of basic commodities which has recently become a serious problem, usually caused by uncertain climate and weather factors. Thus causing farmers to fail to harvest, as a result the distribution to the community is reduced.
(Andira, 2020) Food commodities have a very important role in economic, social and political aspects (Prabowo, 2014). The food commodity itself is greatly influenced by the stability of the distribution of demand and supply. Commodity prices often fluctuate due to several factors, namely, the production of basic commodities experiences crop failure due to weather, pest disturbances and factors that will disrupt the price of basic commodities.
distribution path.
In dealing with fluctuations in the price of production staples, F&B companies can also take other strategies such as diversifying products or sources of raw materials, increasing operational efficiency, and carrying out careful planning in inventory management.
High raw material prices will have an adverse effect onfinancial resilience F&B companies, especially if those prices increase suddenly and significantly. This can reduce the company's profits and can even threaten the survival of the company. To overcome this problem, companies can use several strategies, such as:
-
Diversification of sources of raw materials
By having several different sources of raw materials, companies can reduce the risk of dependence on one source of raw materials and can cope with fluctuations in the price of production materials.
-
Long term contracts with suppliers
Companies can enter into long-term contracts with raw material suppliers to ensure that raw materials are purchased at stable prices within a certain period of time.
-
Product price adjustments
Companies can adjust the prices of their products to reflect increases in raw material prices. However, companies must be careful not to increase the price of their products so high that consumers switch to competitors' products.
-
Production efficiency
Companies can improve their production efficiency to reduce production costs and can cope with rising raw material prices.
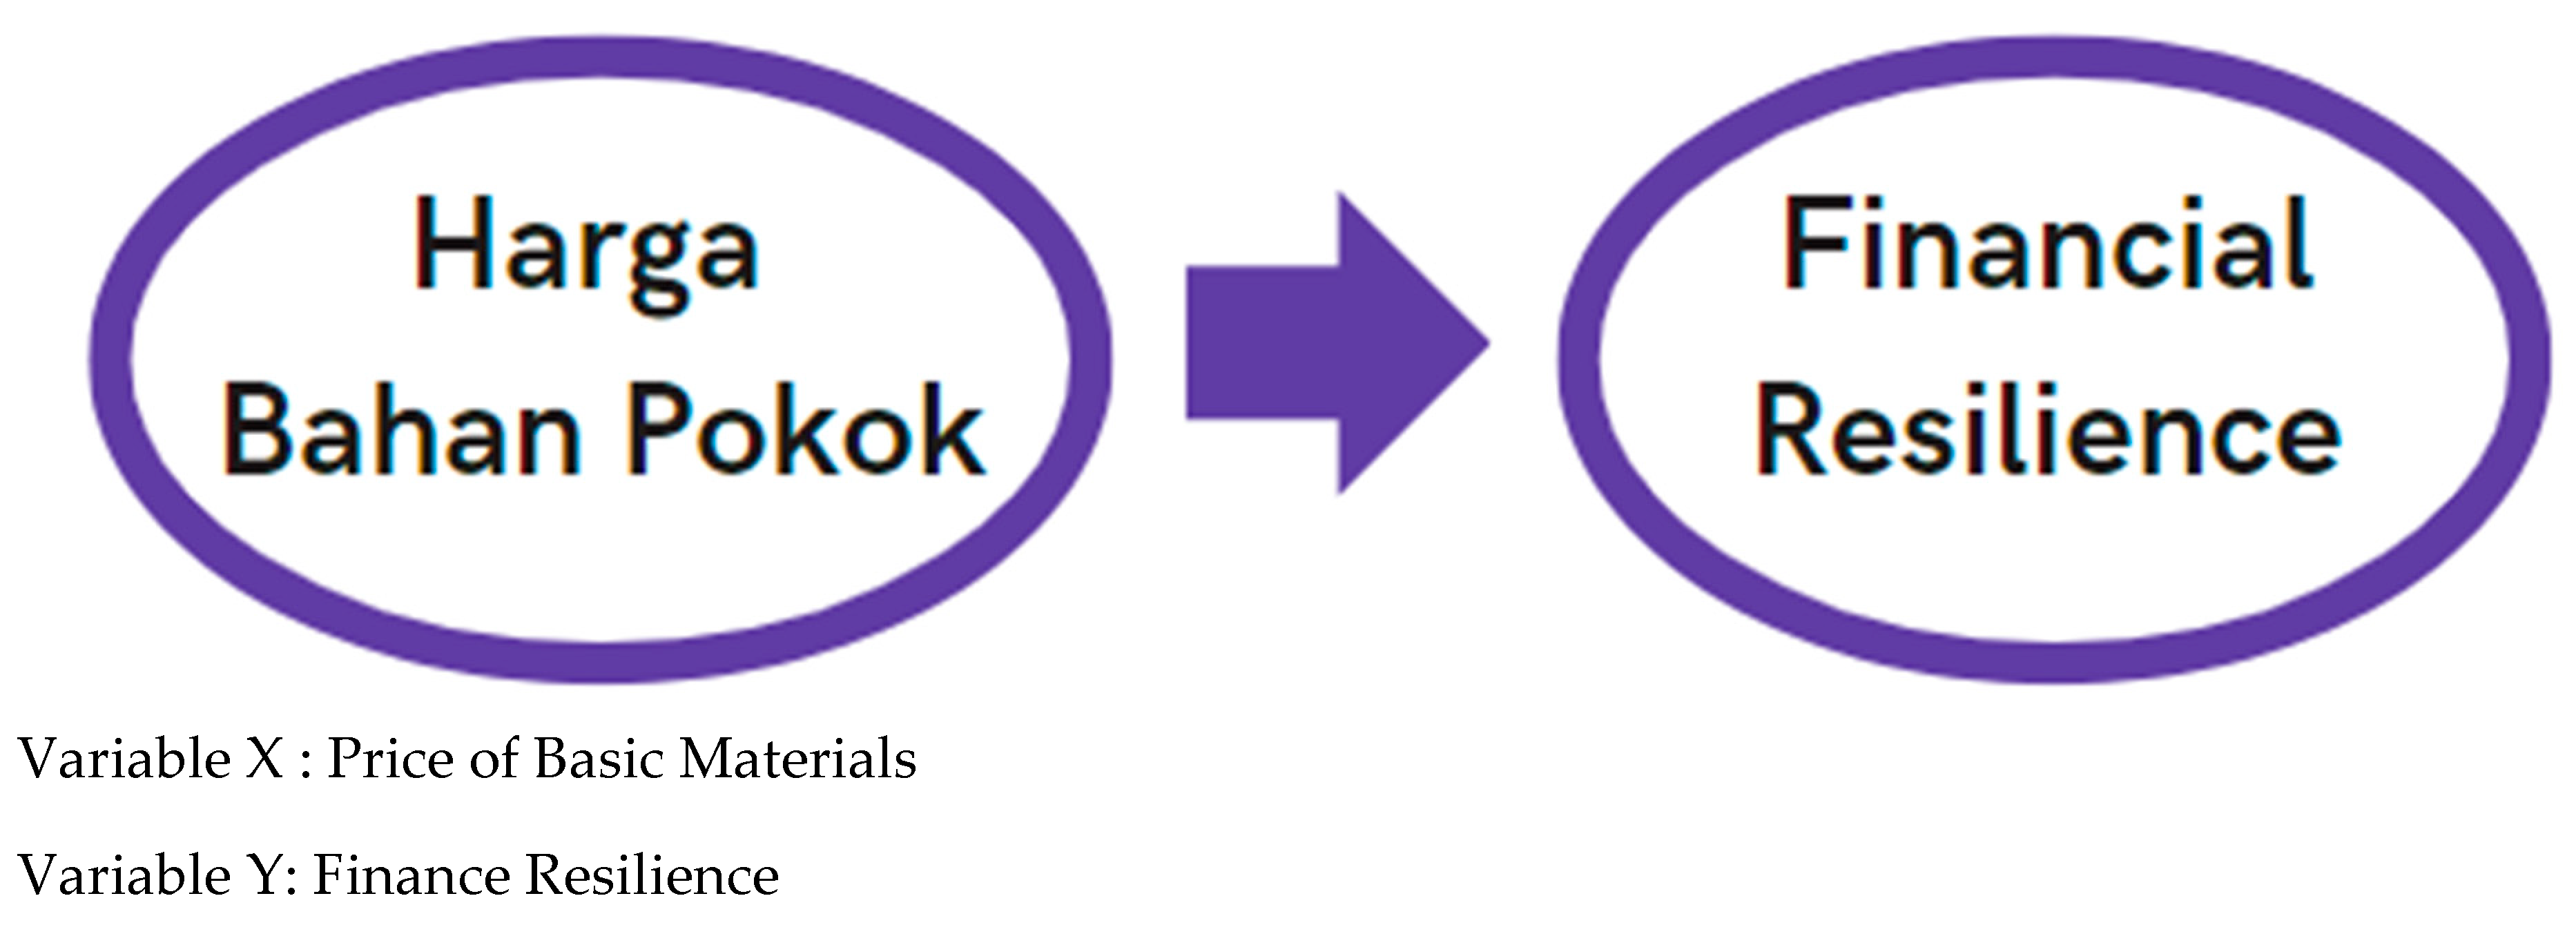
conceptual framework

hypothesis
Effect of Increase in Staples on Financial Resilience in F&B Companies
Research Hypothesis:
H0 : There is no effect of an increase in staples on financial resilience in F&B companies
H1 : There is an influence of the increase in raw materials on financial resilience in F&B companies.
RESEARCH METHODS

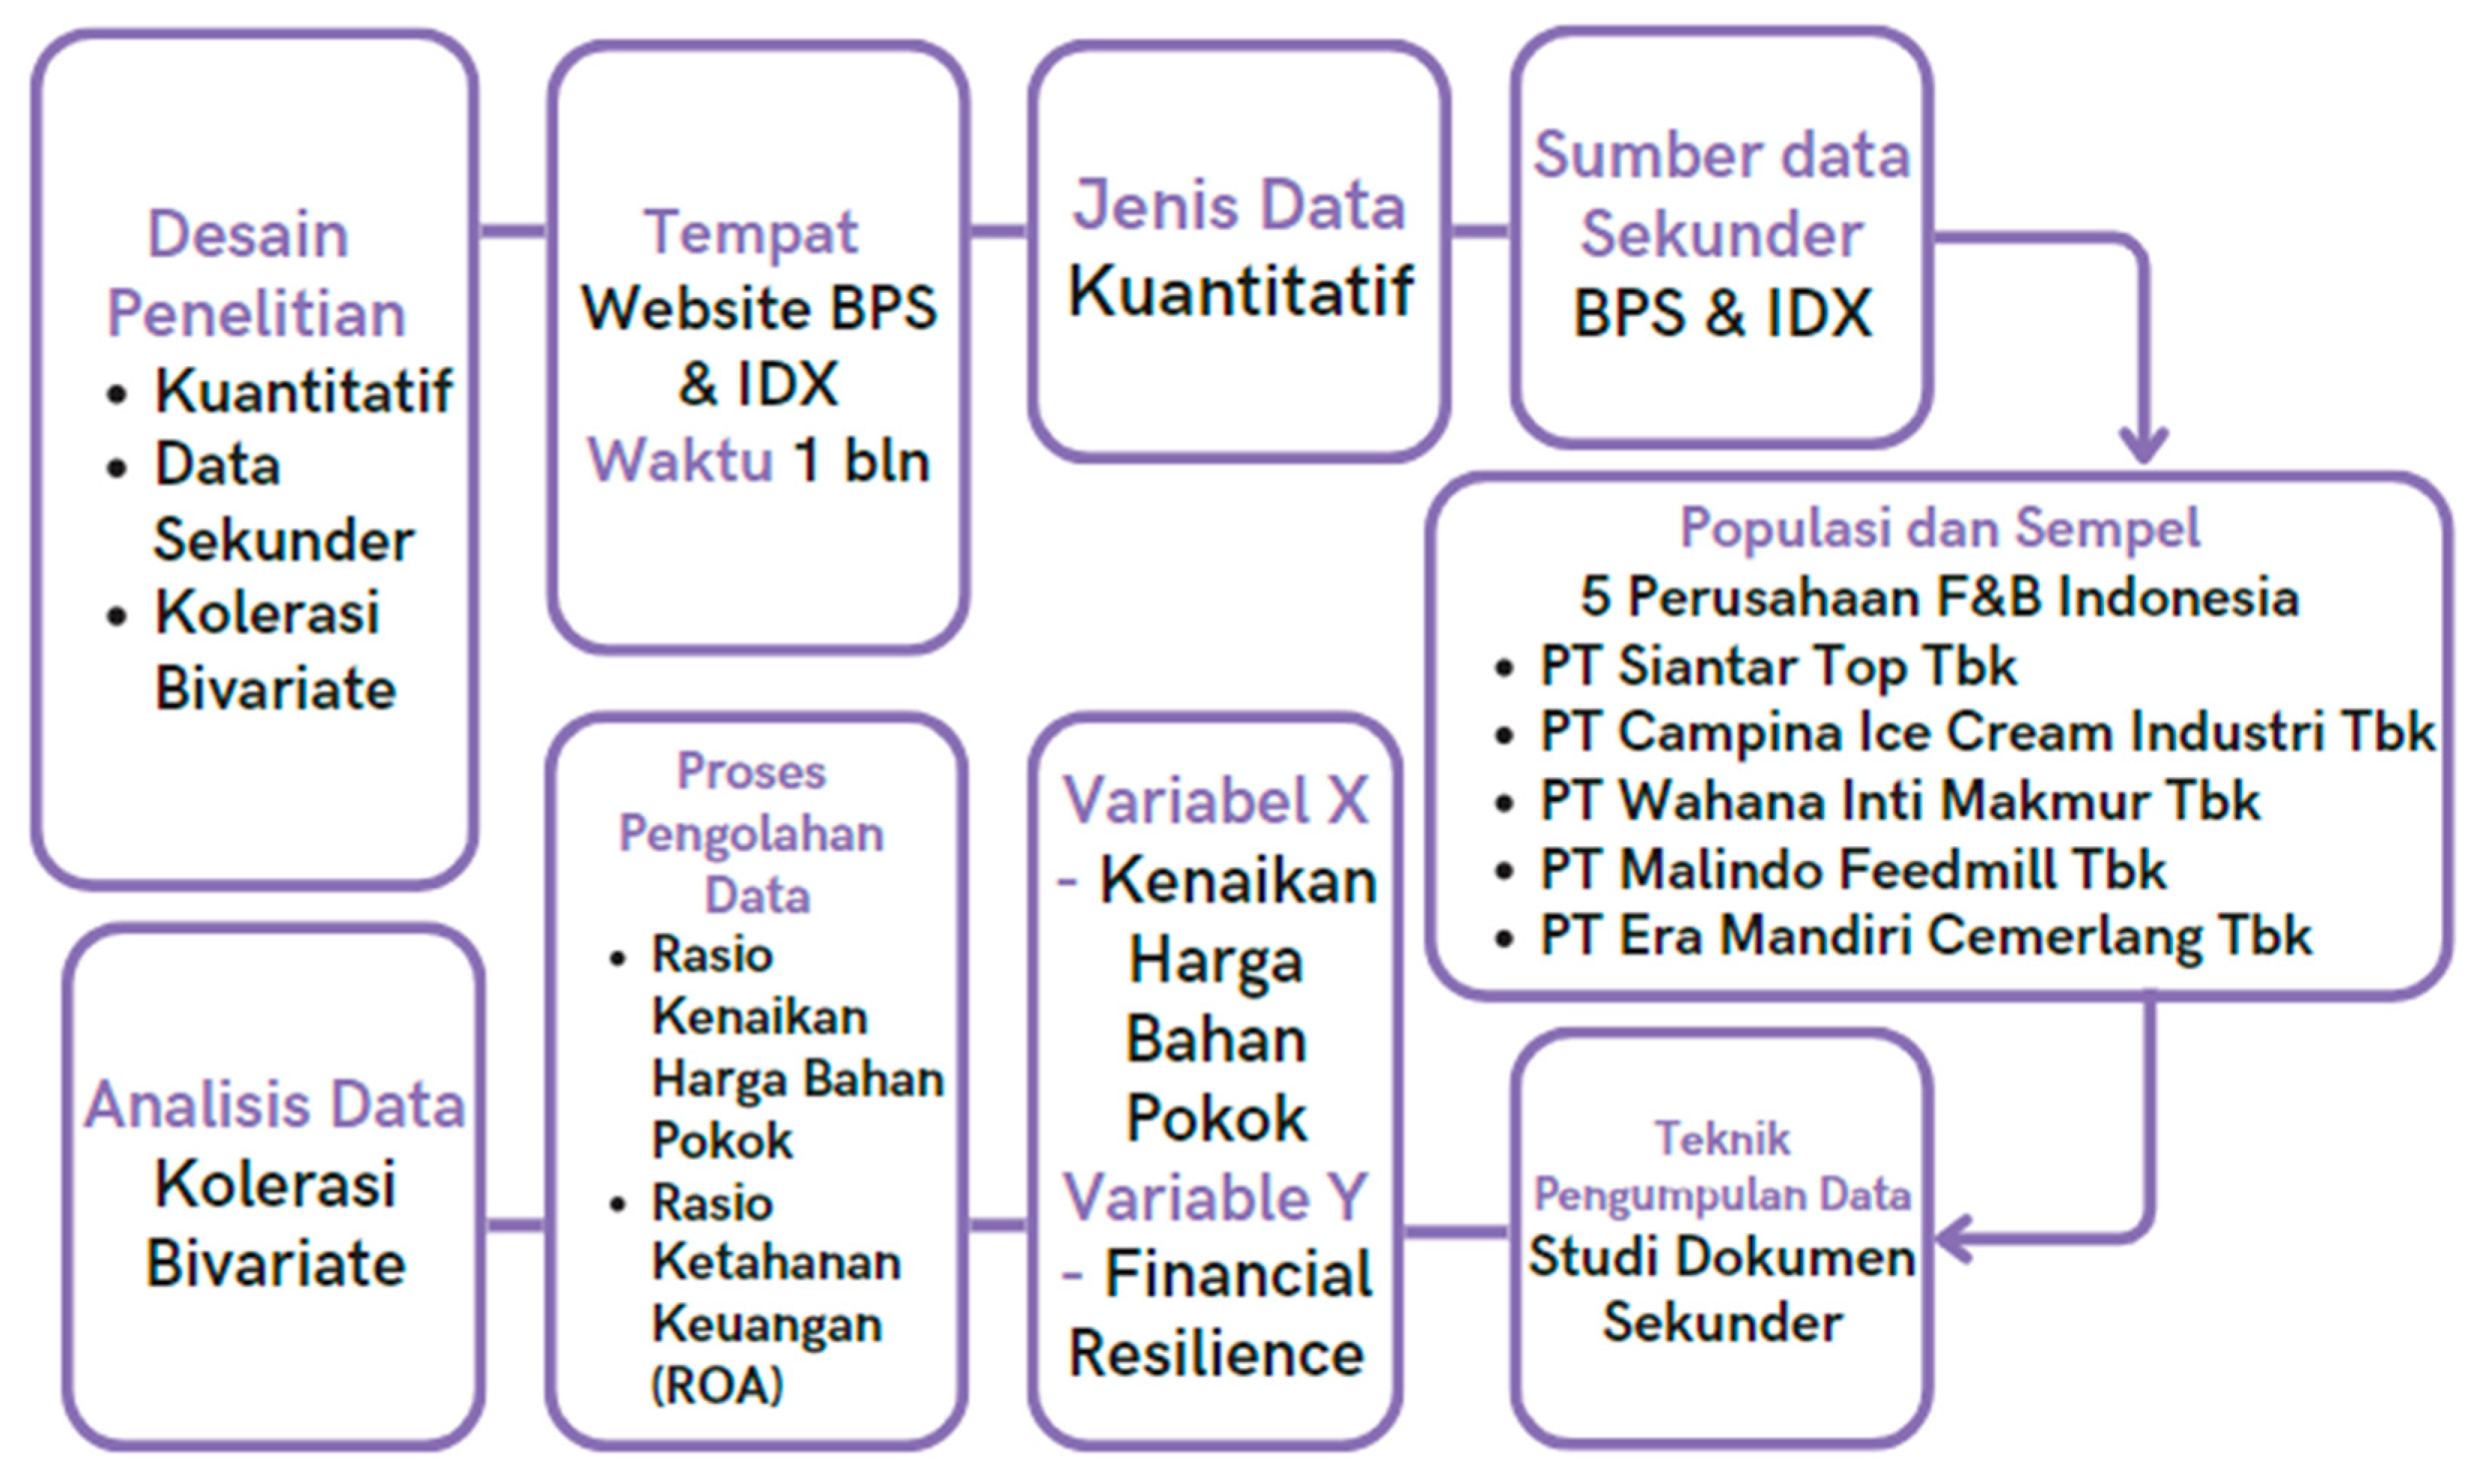
Research design
In this study the method used is the causal comparative research method, the definition of the comparative causal method is research that is closely related to the correlational research method. In comparative causal research, the aim is to identify possible causal linkages, namely by observing the effects that exist and then tracing certain data by examining possible causal factors. it can be seen the increase in staples in that year, and the financial performance of F&B companies by looking for financial ratios, namely how F&B companies have the ability to measure the effectiveness of the use of fixed assets and measure the effectiveness of overall assets in generating profits which are then analyzed using statistical techniques.
Place and time of research
The place of this research is located on the BPS and IDX Web. The period of time needed to carry out the research is approximately 1 month.
Data Type
The data collected is a type of quantitative data. The definition of quantitative data is data that can be measured, assigned a numerical value, and calculated. Quantitative data obtained can be analyzed using statistical correlation analysis aimed at knowing the impact or influence of the price of production staples on finansial resilience F&B company.
Data source
The data source for this research is secondary data collected from various sources such as BPS, IDX. Study of literature and other theoretical sources related to the research topic obtained, based on written information sources (in the form of books, regulations, or other written materials).
Population and Sample
The population in this study is PT Siantar Top Tbk (STTP) year (2020), PT Campina Ice Cream Industry Tbk (CAMP) year (2020), PT Wahana Inti Makmur Tbk (NASI) year (2022), PT Malindo Feedmill Tbk (MAIN ) year (2021), and PT Era Mandiri Cemerlang Tbk (IKAN) year (2020). While the sample in this study is data regarding the increase in prices of staples.
Technology Statistics
The statistical technique used is a secondary document study. The definition of secondary data is information obtained from other existing sources. So that, the author does not collect data directly from the object under study.
Variable Definitions and Operational Definitions
The independent variable in this research is the ratio of the increase in the price of production staples and the ratio of financial resilience to changes in F&B, while the dependent variable is the financial statements of several F&B companies including PT Siantar Top Tbk (STTP), PT Campina Ice Cream Industri Tbk (CAMP), PT Wahana Inti Makmur Tbk (NASI), PT Malindo Feedmill Tbk (MAIN), PT Era Mandiri Cemerlang Tbk (IKAN).
Data Processing Process
The method used to manage the data is using the statistical correlation method which functions to determine the relationship between the ratio of the increase in the price of production staples and the ratio of the financial resilience of F&B companies. The use of correlation shows the relationship between two variables. Therefore, correlation serves to determine the relationship between the independent variable or the influencing variable (X) with the dependent variable or the affected variable (Y). The results of the correlation analysis will find whether there is a positive (+), negative (-) relationship and there may also be no relationship (0) between the two variables. Continuity between variable X and variable Y can be perfect, very strong,strong, or no relation. In the correlation analysis will be found the magnitude of the correlation coefficient with the correlation formula used is the correlationproduct moment. The correlation coefficient value will be between 1 and -1 and can be written as follows:
-1 ≤ r ≤ 1
r = -1 : variable X and variable Y have a negative and perfect relationship
= 1 : variable X and variable Y have a positive and perfect relationship
r = 0 : variable X and variable Y have no relationship
r is getting closer to 1 or -1 with this the relationship between variable X and variable Y is getting stronger
r is getting closer to 0 with this the relationship between variables X and Y is getting weaker
This research gets the calculationefficienty rational total asset trunover by dividing the total sales by the total assets of each company, the results are also obtainedprofibability ratios retrun on asset (ROA) using the method of total net profit after tax (EAT) divided by fixed assets, as well as to find out the results of the average total ratioAsset Trunover divided by ROA.
The results of the correlation analysis to identify whether there is a significant relationship between the price of production staples tofinancial resilience F&B company. If there is a significant relationship, it can be concluded that the price of production staples influencesfinancial resilience F&B company. So that a deeper analysis must be carried out to identify how much influence the price of production staples has onfinancial resilience F&B company.
RESULTS AND DISCUSSION
Company data
| No |
Company name |
Code |
Year |
| 1 |
PT SIANTAR TOP Tbk |
STTP |
2020 |
| 2 |
PT CAMPINA ICE CREAM INDUSTRI Tbk |
CAMP |
2020 |
| 3 |
PT WAHANA INTI MAKMUR Tbk |
RICE |
2022 |
| 4 |
PT MALINDO FEEDMILL Tbk |
MAIN |
2021 |
| 5 |
PT ERA MANDIRI CEMERLANG Tbk |
FISH |
2020 |
In the company data table there are names, codes and years of data that will be taken for testing. The company data is data contained in BPS and idx.co.id where the company is already a public company where information about the financial statements of each company can be accessed by the wider community.
Basic Material Data
| Company Code |
Basic Materials |
Unit |
The price of basic materials |
| Before |
After |
Ascension |
RatioAscension |
| STTP |
Flour |
/kg |
9.509,97 |
10.521,51 |
1.011,54 |
0,11 |
| CAMP |
Counts |
/item |
3.146,76 |
3.196,30 |
49,54 |
0,02 |
| RICE |
grain |
/kg |
4.551,78 |
4.895,67 |
343,89 |
0,08 |
| MAIN |
Chicken |
/kg |
51.712,42 |
56.787,28 |
5.074,86 |
0,10 |
| FISH |
Fish |
/Kg |
20.576,92 |
20.423,08 |
-153,85 |
-0,01 |
In the staple food data table, it provides information that there are prices for each staple food before and after the increase. The ratio of the 4 companies shows another positive value, as is the case with PT Era Mandiri Cemerlang Tbk, which has a negative average ratio of staple foods.
Ratio of Average Financial Resilience
| Company Code |
Sale |
Active Total |
Net Profit after tax |
Efficientyration |
Profitabiltyratios |
Average - Average Ratio |
| Total AssetTrunover |
Return WhereAssets (ROA) |
| STTP |
3.846.300.254.825 |
3.448.995.059.882 |
625.246.591.164 |
1,115 |
0,181 |
0,648 |
| CAMP |
956.634.474.111 |
1.086.873.666.641 |
44.722.940.073 |
0,880 |
0,041 |
0,461 |
| RICE |
59.036.498.441 |
70.220.263.356 |
1.037.538.518 |
0,841 |
0,015 |
0,428 |
| MAIN |
9.130.618.395.000 |
5.436.745.210.000 |
63.182.149.000 |
1,679 |
0,012 |
0,846 |
| FISH |
84.646.710.437 |
132.538.615.751 |
-1.094.117.543 |
0,639 |
-0,008 |
0,315 |
In the table of the average ratio of financial security, it can be seen that the ratio of the average financial security of 5 companies, where the results are obtained from the averageTotal Asset Trunover / Return On Asset (LONG).
Bivariate Correlation Analysis

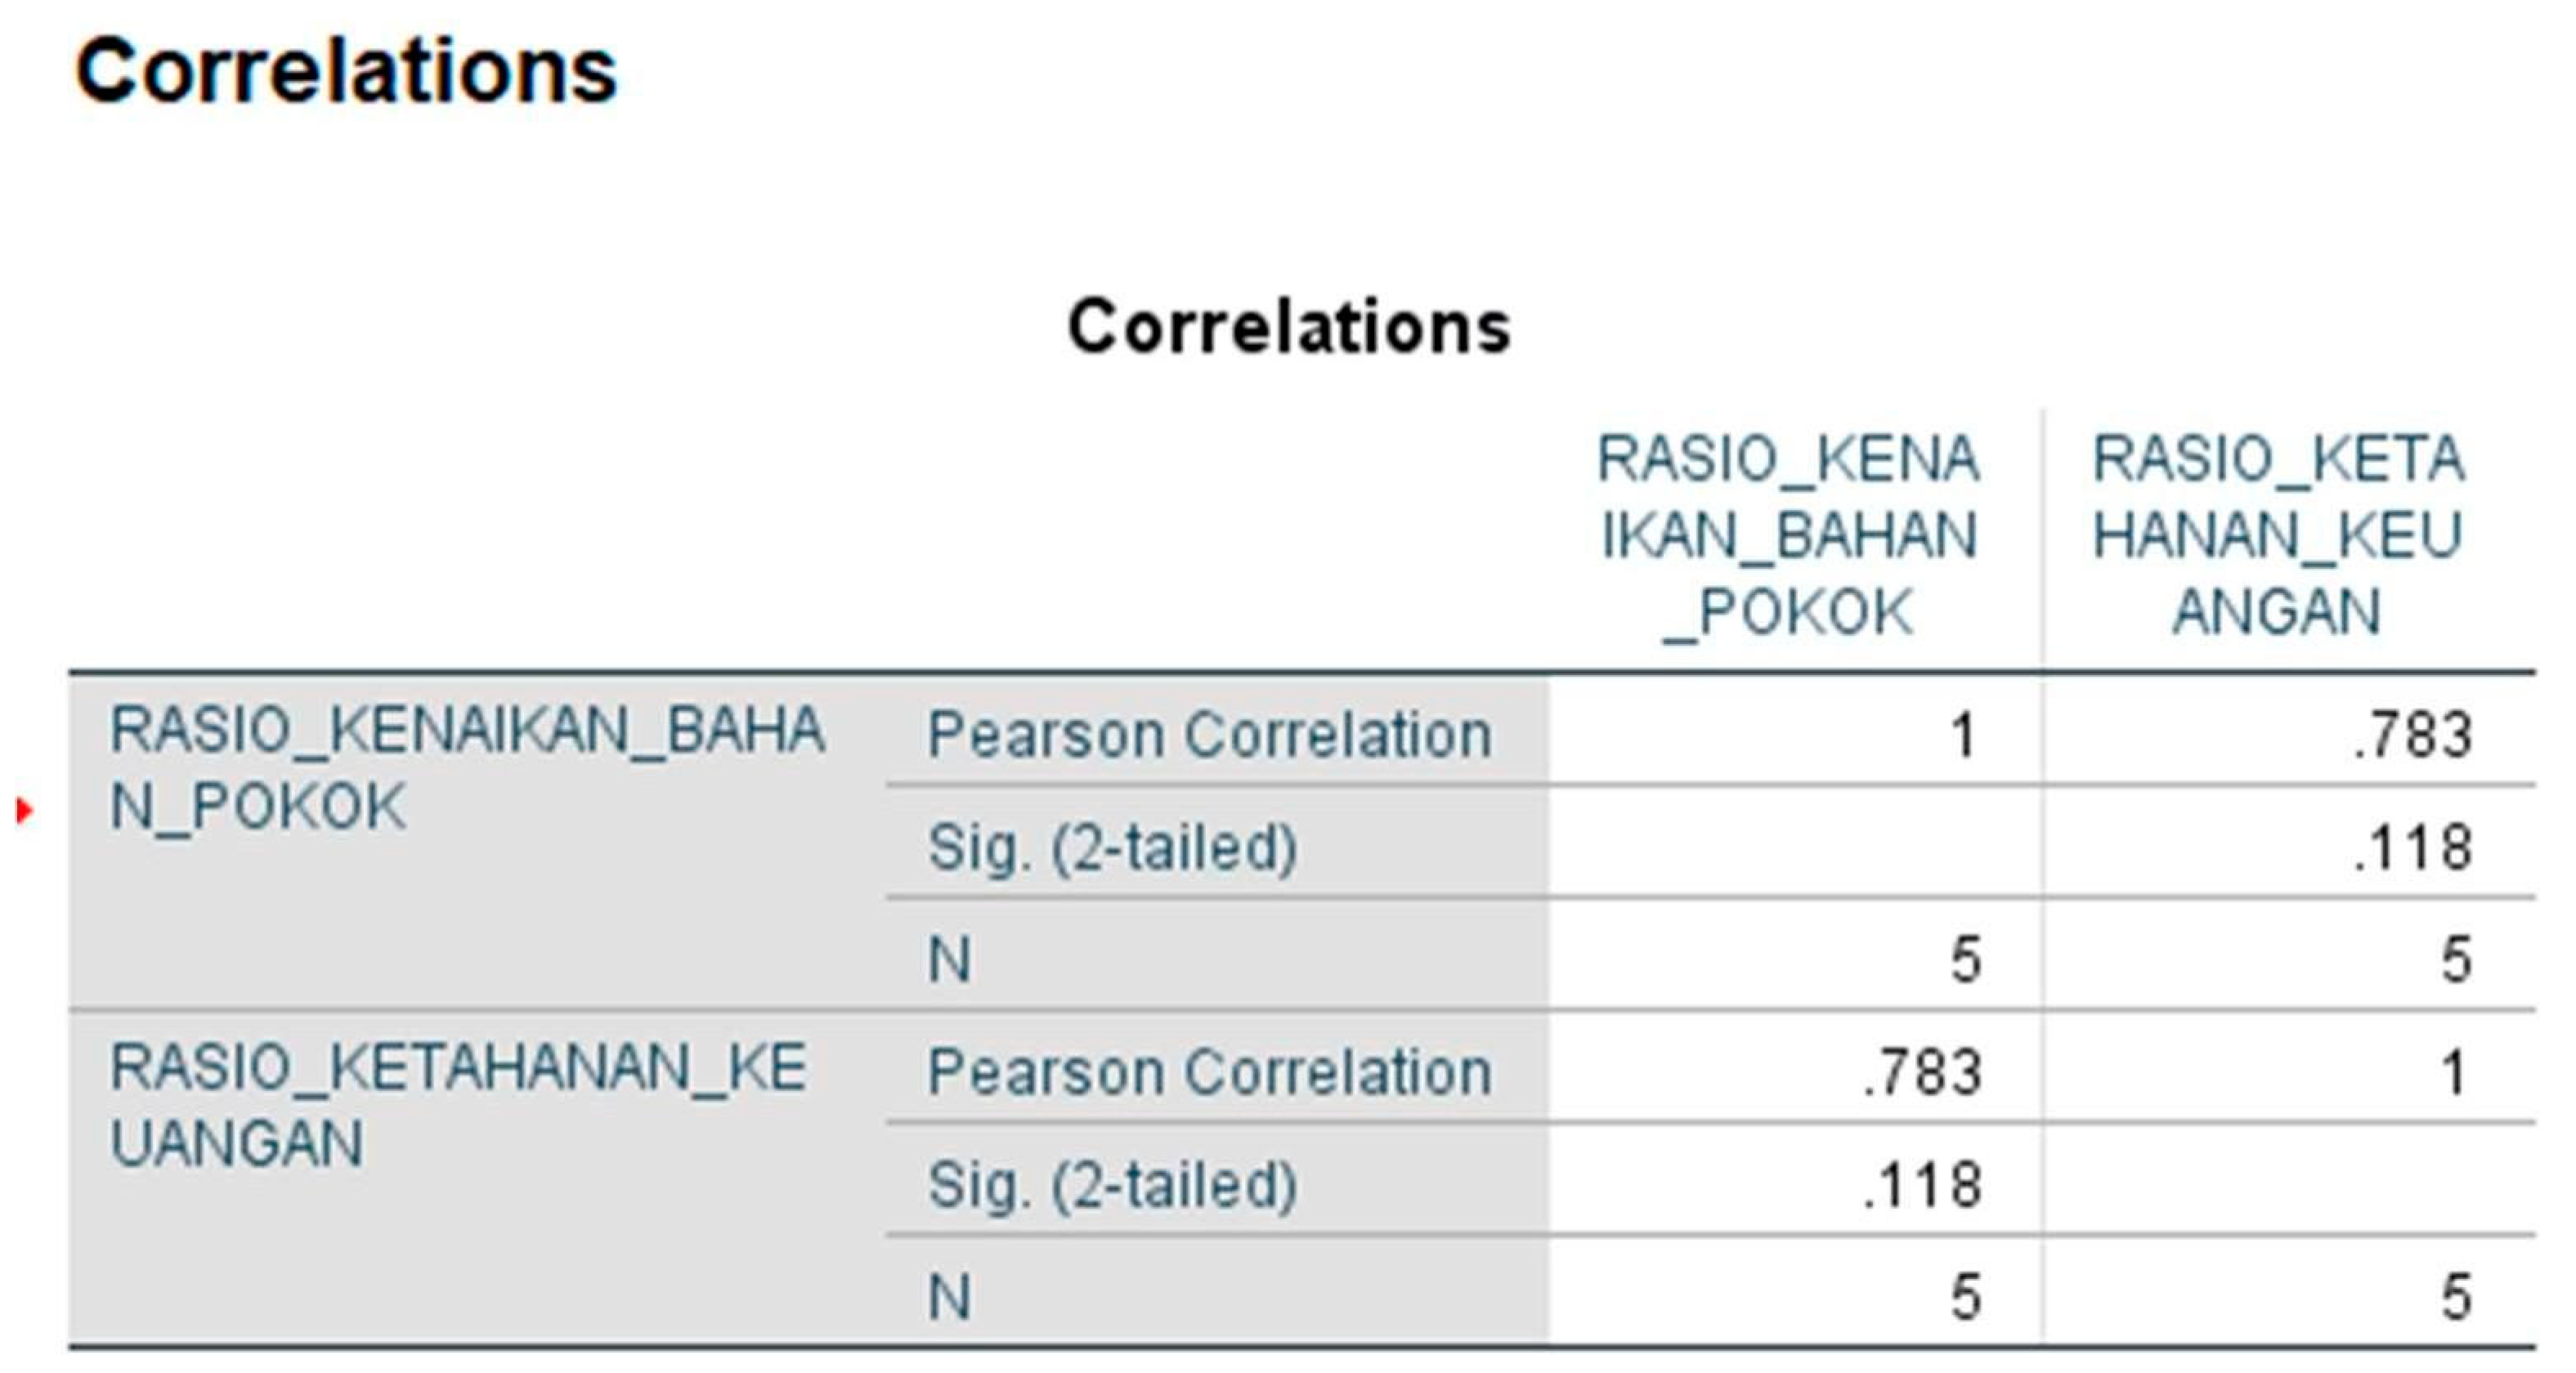
In the bivariate correlation analysis results table, it can be concluded that the ratio of staple foods to the financial security ratio shows a value of 0.783 where the value is close to positive 1, so that the relationship or influence of the variables X and Y has a higher relationship and relationship and has a positive and perfect relationship.
CONCLUSIONS AND RECOMMENDATIONS
Conclusion
The conclusions obtained from the results of the research and discussion that have been described, that raw material prices do have a significant influence on financial security (financial resilience) F&B companies, an increase in the price of basic commodities can affect the efficiency of the company's financial resilience, as well as have a negative impact on the company's sustainability. Therefore, F&B companies need to develop appropriate strategies in managing risks that may increase raw material prices, such as diversification of raw material sources, use of information and communication technology in raw material procurement management, and proactive risk management.
Suggestion
From the conclusions that have been explained, the researcher can provide the following suggestions:
For companies: Based on research results which show that there is an effect of an increase in staples on a company's financial resilience, it is important for F&B companies to manage risks and strategic management of staple prices in order to be able to predict if there is a possibility of an increase in prices of staples in the future so that the risks that will faced by the company has a smaller opportunity.
For readers: This research can provide additional knowledge, as well as be useful for readers not only that it also helps provide insight related to the effect of rising prices of basic commodities on the financial security of a company, especially within the scope of F&B companies.
For future researchers: For future researchers, when taking the same topic, it is hoped that they will be able to add to the sample to be studied, for example, a sample of other factors that affect the financial resilience of a company that is more numerous and broad.
References
- Andira, G. (2020). PENGARUH KENAIKAN HARGA BAHAN POKOK TERHADAP TINGKAT INFLASI DI KABUPATEN TEMANGGUNG. Jurnal Paradigma Multidisipliner (JPM). [CrossRef]
- Badan Pusat Statistik. (2020). Harga Produsen. Retrieved April 8, 2023, from Rata-rata Harga Gabah Bulanan Menurut Kualitas, Komponen Mutu dan HPP di Tingkat Petani: https://www.bps.go.id/indicator/36/1034/2/rata-rata-harga-gabah-bulanan-menurut-kualitas-komponen-mutu-dan-hpp-di-tingkat-petani.html.
- Badan Pusat Statistik. (2021). Harga Produsen. Retrieved April 15, 2023 from Rata-rata Harga Gabah Bulanan Menurut Kualitas, Komponen Mutu dan HPP di Tingkat Petani: https://www.bps.go.id/indicator/36/1034/3/rata-rata-harga-gabah-bulanan-menurut-kualitas-komponen-mutu-dan-hpp-di-tingkat-petani.html.
- Badan Pusat Statistik Kabupaten Ngawi. (2020). Perikanan. Retrieved April 8, 2023, from Perkembangan Harga Ikan di Kabupaten Ngawi: https://ngawikab.bps.go.id/indicator/56/488/1/perkembangan-harga-ikan-di-kabupaten-ngawi.html.
- Badan Pusat Statistik Provinsi Sumatera Utara. (2022, Maret 21). Harga Eceran. Retrieved April 9, 2023, from Harga Eceran Barang-barang Keperluan Rumahtangga di Pedesaan menurut Jenis (rupiah), 2019 - 2021: https://sumut.bps.go.id/statictable/2022/03/21/2697/harga-eceran-barang-barang-keperluan-rumahtangga-di-pedesaan-menurut-jenis-rupiah-2019---2021.html.
- Dananti, K., Nany, M., & Gusmao, E. F. (2022). ANALYSIS OF THE FINANCIAL PERFORMANCE OF FOOD AND BEVERAGE COMPANIES BEFORE AND DURING THE COVID-19PANDEMIC IN INDONESIA. International Journal of Social Science (IJSS). [CrossRef]
- Hasibuana, L. S., & Novialdi, Y. (2022). Prediksi Harga Minyak Goreng Curah dan Kemasan Menggunakan Algoritme Long Short-Term Memory (LSTM). Jurnal Ilmu Komputer & Agri-Informatika. [CrossRef]
- Klaper, L., & Lusardi, A. (2019). Financial literacy and financial resilience: Evidence from around the world. Financial Management. [CrossRef]
- Lukas Setia Atmaja, P. (2008). Teori & Praktik Manajemen Keuangan. Yogyakarta: ANDI.
- Malindo Feedmill Tbk. (2022, 03 31). idx.co.id. Retrieved 04 08, 2023 from https://www.idx.co.id/Portals/0/StaticData/ListedCompanies/Corporate_Actions/New_Info_JSX/Jenis_Informasi/01_Laporan_Keuangan/02_Soft_Copy_Laporan_Keuangan//Laporan%20Keuangan%20Tahun%202021/Audit/MAIN/FinancialStatement-2021-Tahunan-MAIN.pdf.
- Pandin, M. Y., Sandari, T. E., Surahman, D., & GS, A. D. (2023). Financial Resilience Strategy on Cancer Survivors Household in East Java. JEJAK "Jurnal Ekonomi dan Kebijakan".
- PT Campin Ice Cream Industry Tbk. (2021, 04 30). idx.co.id. Retrieved 04 08, 2023 from https://www.idx.co.id/Portals/0/StaticData/ListedCompanies/Corporate_Actions/New_Info_JSX/Jenis_Informasi/01_Laporan_Keuangan/02_Soft_Copy_Laporan_Keuangan//Laporan%20Keuangan%20Tahun%202020/Audit/CAMP/FinancialStatement-2020-Tahunan-CAMP.pdf.
- PT Era Mandiri Cemerlang Tbk. (2021, 06 02). idx.co.id. Retrieved 04 08, 2023 from https://www.idx.co.id/Portals/0/StaticData/ListedCompanies/Corporate_Actions/New_Info_JSX/Jenis_Informasi/01_Laporan_Keuangan/02_Soft_Copy_Laporan_Keuangan//Laporan%20Keuangan%20Tahun%202020/Audit/IKAN/FinancialStatement-2020-Tahunan-IKAN.pdf.
- PT Siantar Top Tbk. (2021, 06 01). idx.co.id. Retrieved 04 08, 2023 from https://www.idx.co.id/Portals/0/StaticData/ListedCompanies/Corporate_Actions/New_Info_JSX/Jenis_Informasi/01_Laporan_Keuangan/02_Soft_Copy_Laporan_Keuangan//Laporan%20Keuangan%20Tahun%202020/Audit/STTP/FinancialStatement-2020-Tahunan-STTP.pdf.
- PT Wahana Inti Makmur Tbk. (2023, 04 01). idx.co.id. Retrieved 04 08, 2023 from https://www.idx.co.id/Portals/0/StaticData/ListedCompanies/Corporate_Actions/New_Info_JSX/Jenis_Informasi/01_Laporan_Keuangan/02_Soft_Copy_Laporan_Keuangan//Laporan%20Keuangan%20Tahun%202022/Audit/NASI/FinancialStatement-2022-Tahunan-NASI.pdf.
- Rochmaniah, S. A., & Oktafia, R. (2019). KENAIKAN HARGA BAHAN POKOK DI INDONESIA. Umsida Repository.
|
Disclaimer/Publisher’s Note: The statements, opinions and data contained in all publications are solely those of the individual author(s) and contributor(s) and not of MDPI and/or the editor(s). MDPI and/or the editor(s) disclaim responsibility for any injury to people or property resulting from any ideas, methods, instructions or products referred to in the content. |
© 2023 by the authors. Licensee MDPI, Basel, Switzerland. This article is an open access article distributed under the terms and conditions of the Creative Commons Attribution (CC BY) license (http://creativecommons.org/licenses/by/4.0/).


