1. Introduction
The imperative need to resolve environmental concerns and promote sustainable development requires the formulation of effective green public policies. This necessity is strengthened by the global commitment to the Sustainable Development Goals (SDGs) of the United Nations, which provide a comprehensive framework for attaining a sustainable future for everyone. The SDGs are comprised of seventeen interconnected goals that span social, economic, and environmental dimensions intending to eradicate poverty, safeguard the planet, and ensure prosperity for all [
1].
Green public policies play a pivotal role in advancing the SDGs by aligning national and international efforts to address environmental challenges [
2]. These policies serve as strategic instruments for governments to integrate sustainable practices into various sectors, including energy, transportation, agriculture, and waste management. By embracing green policies, countries can promote a transition to low-carbon economies, enhance resource efficiency, protect ecosystems, and improve the well-being of their populations.
Designing effective green public policies is significant and pertinent due to their capacity to address urgent environmental concerns while supporting sustainable development goals. Rapid industrialization, population growth, and unsustainable consumption patterns have resulted in a variety of environmental issues, such as climate change, air and water pollution, deforestation, and biodiversity loss. These obstacles have far-reaching effects on ecosystems, human health, socioeconomic stability, and the well-being of current and future generations.
The objective of this paper is to contribute to the literature by employing the system of systems (SoSs) approach to the design of green public policies. SoSs is an encompassing and integrated method for comprehending and administering complex systems comprised of numerous individual systems. We emphasize the impact that green public policies have on other systems, such as the economy, energy, health, and pollutants. Consequently, the relationships between these systems must be taken into account when designing green public policies. We refer to green public policies, energy, health, pollutants, and the economy as systems because each consists of a collection of interconnected components or elements that work together to accomplish a particular goal. These components interact with one another to produce the intended outcome, typically through inputs, processes, and outputs. In order to deal with them readily and from a macro perspective, we view each of them as a system interacting within a SoSs.
The rest of this paper is structured as follows:
Section 2 examines the relevant literature on green public policies as well as the approaches usually used in policy creation.
Section 3 discusses the established framework and provides an example of how to use DEMATEL and ISM to build green public policy. Finally,
Section 4 summarizes the important results, discusses their consequences, and suggests future study possibilities in the area of green policy design.
2. Literature Review
Rapid industrialization and urbanization have increased greenhouse gas (GHG) emissions, pollution, and other environmental challenges, worsening the consequences of climate change. Green policies are critical in this context for minimizing the negative environmental consequences of human activity and fostering sustainable development [
3]. Green policies are policies that encourage long-term development by minimizing or eliminating negative environmental consequences while assuring economic growth and social welfare. These measures are intended to decrease GHG emissions, improve energy efficiency, promote renewable energy, minimize waste, and protect natural resources [
3].
Numerous studies have employed the Decision-Making Trial and Evaluation Laboratory (DEMATEL) method to resolve crucial concerns in the formulation of green policies. [
4] investigated the factors that influence individuals' propensity to employ platforms for green public welfare activities. The authors conducted in-person DEMATEL questionnaire surveys. According to the research, content accessibility, user-friendliness, and an interactive community were the most influential factors in the propensity to utilize platforms for green public welfare activities. [
5] examined the significant determinants of environmentally responsible public procurement in Singapore. The authors interviewed senior executives involved in the public procurement process and employed a conceptual framework based on natural resource-based theory. The authors analyzed interview information and data using the DEMATEL method. The research found that energy-efficiency strategy and environmental standards were the two most influential factors in Singapore's environmentally conscious public procurement. [
6] examined the impediments to green supply chain management in Canada. The authors employed a DEMATEL-based strategy and recruited seven manufacturers of electronic products. The authors categorized obstacles as knowledge-related, commitment-related, and product design-related. [
7] identified the main performance evaluation indicators (PEIs) of green supply chains using the DEMATEL technique. The authors chose twenty performance assessment indicators with six dimensions and solicited the assistance of six specialists from two distinct organizations. According to the research, the four most significant PEIs for the success of GSCM were senior management support and commitment, green corporate culture, investment preparedness, and government support policy. [
8] developed a set of dimensions and criteria for evaluating green project management. The authors devised six aspects and twenty-four criteria of green project management by combining DEMATEL and the analytic network process (ANP) into an integrated methodology. The research uncovered the interrelationship structure and priority of each dimension and criterion in green project management. Using the DEMATEL technique, [
9] established the priority of the most important GSCM factors pertinent to Indian Government Public Procurement. The authors analyzed twenty-six GSCM criteria across eight dimensions and found that supplier engagement and support, management support, and consumer involvement and support were the most significant GSCM success factors.
While DEMATEL has proven effective in analyzing causal relationships, system thinking has emerged as another powerful method for designing ecological public policies. System thinking, based on understanding interconnections and dynamic behavior in complex systems, offers a holistic approach to comprehending the complexities of green policy formulation. Although it has not been extensively utilized for this purpose, the combination of system thinking and DEMATEL can provide valuable insights into the interrelationships and dynamics within complex systems, aiding the development of evidence-based policies that promote environmental preservation and public health.
System thinking is an effective method for designing ecological public policies. SoSs is based on the system thinking approach, which focuses on the interconnections and dynamic behavior of complex systems. Rather than analyzing each component separately, it emphasizes understanding their interactions. Using causal loop diagrams, it analyzes the systems holistically. This method is applicable in a variety of disciplines and is useful for comprehending the complexities of devising green public policies; nevertheless, it has not been used seriously for this aim.
DEMATEL and Interpretative Structural Modelling (ISM) techniques are utilized to establish the causal linkage between the elements of the defined SoSs. They are soft operations research (SOR) techniques that fall under the category of systematic structural analysis [
10]. Hard Operations Research (HOR) and SOR are two methodologies within the discipline of Operations Research (OR). Soft systems methodology (SSM) and analytic network process (ANP) are additional examples of SOR, whereas linear programming, integer programming, and dynamic programming illustrate HOR [
10,
11,
12,
13].
It is crucial to note that the distinction between SOR and HOR is not always clear-cut; depending on the problem at hand, there can be overlaps and combinations of approaches. SOR and HOR both seek to enhance decision-making and problem-solving. Some researchers and practitioners utilize a mixed methods strategy that incorporates soft and hard OR techniques to solve complex real-world problems [
10]. However, it should be noted that the methodologies and assumptions of SOR and HOR differ [
10]. Utilizing techniques such as interviews, case studies, and surveys, SOR employs qualitative and subjective methods that emphasize stakeholder participation, social interactions, and human judgment. It seeks to comprehend complex systems and their dynamics, addressing unstructured and ill-defined problems while taking human factors and subjective opinions into account [
10,
11,
12,
13]. In contrast, HOR employs quantitative and objective methods, such as mathematical modelling, optimization algorithms, and statistical analysis. It focuses on rigorous mathematical formulations, numerical analysis, and optimization in order to derive optimal solutions for well-defined and structured problems [
10]. It is concerned with mathematical optimization. SOR endorses participative decision-making, involving stakeholders and experts, and acknowledges the significance of subjective judgments and social consensus. In social sciences, organizational behaviour, policy analysis, and community development, it has applications. HOR, on the other hand, emphasizes objective decision-making based on quantitative analysis, to find optimal solutions using mathematical models and algorithms [
10,
11].
DEMATEL is a beneficial technique for analyzing the cause-and-effect relationships among various decision-making factors or criteria. Other applications of DEMATEL include strategic management, organizational analysis, risk analysis, quality management, sustainability assessment, and technology evaluation. It is classified as a non-compensatory method that concentrates on interdependence analysis and lies under the category of multi-criteria decision-making (MCDM) methods. DEMATEL analyzes complex systems and the relationships between their elements. It is founded on the system thinking methodology, which aids in comprehending the structure of a system by identifying and visualizing the interrelationships and interdependencies between its constituent parts. It provides an exhaustive view of the system's architecture, emphasizing the major components and their interconnections. One of the most essential features of DEMATEL is that it explicitly models the causal relationships between factors, enabling decision-makers to comprehend the problem's cause-and-effect dynamics. DEMATEL identifies feedback loops and interdependencies between factors, allowing decision-makers to evaluate the indirect effects of changes in one factor on others [
10,
11].
On the flip side, DEMATEL has two significant disadvantages. First, it significantly depends on the judgments of experts, which introduces subjectivity and bias due to varying perspectives and interpretations. Second, it can be difficult to collect accurate and reliable data on the relationships between factors, especially when data is limited, incomplete, or ambiguous. Insufficient or inaccurate data can undermine the validity and dependability of an analysis. To improve the accuracy and usefulness of DEMATEL as a decision-making instrument, careful consideration, minimizing bias, ensuring expert participation, and collecting reliable data are required [
10,
11].
ISM is also a SOR method that is utilized to analyze complex systems and comprehend the hierarchical relationships between factors [
14]. Similarly, to DEMATEL, ISM can visualize the interdependencies and interrelationships between its components using the system thinking methodology. ISM can also be used to create a hierarchical representation of the system, illustrating the relative importance and influence of various elements. This hierarchical structure facilitates comprehension of the relative significance of various system components and their influence on the entire system.
ISM permits the evaluation of system component relationships, facilitating the identification of strong and feeble relationships. It aids in identifying which elements exert direct influence on others and which elements serve as intermediaries or movers within the system. By delineating the relationships and dependencies between system components, ISM can provide a systematic approach to decision-making [
14].
ISM technique also has some disadvantages. It requires identifying relationships, constructing hierarchies, and analyzing dependencies, which can be difficult and time-consuming to implement, particularly for large and intricate systems [
14]. Simplifying and generalizing complex systems can result in omissions and the loss of crucial details. ISM is subjective and biased, relying largely on the knowledge and judgment of experts, which can result in errors and inconsistencies. The availability and quality of data present obstacles, and inaccurate or insufficient data can lead to erroneous interpretations. ISM lacks a dynamic representation, as it is primarily concerned with immutable relationships and does not account for temporal variations or feedback cycles. Expertise is required to interpret ISM results, limiting their accessibility and utility for decision-makers and stakeholders [
14].
By integrating ISM and DEMATEL, decision-makers can obtain insight into both the hierarchical structure and interdependencies of the factors. ISM can aid in the identification of the system's primary or dependent factors, which can then be incorporated into the DEMATEL analysis.
The study provides significant contributions by introducing the utilization of the SoSs method to develop sustainable green public policies. This novel approach takes into account the interdependencies among energy, health, the environment, and the economy, considering them as interconnected systems. In doing so, we recognize that each system consists of interconnected components that collaborate to fulfill specific objectives. While existing research often focuses on examining conflicts of interest within a single resource, such as water or forests, the SoSs method presents a pioneering perspective by simultaneously addressing multiple issues. Our study highlights the importance of employing SoSs methodologies to effectively shape green public policies. To demonstrate the functionality of the system, we employ casual loop sketches through the employment of DEMATEL and ISM. By providing step-by-step guidance, we offer an illustrative example that elucidates the application of these methodologies. Moreover, we thoroughly evaluate the advantages and disadvantages of DEMATEL and ISM, while exploring their potential synergies with complementary methods. This comprehensive analysis ensures a more holistic understanding of these techniques and paves the way for their integration with other approaches.
Overall, this study breaks new ground by introducing the SoSs method for building green public policies, emphasizing its ability to address complex interdependencies among energy, health, the environment, and the economy. The integration of DEMATEL and ISM further enhances the effectiveness of this methodology. By providing concrete examples and considering potential combinations with other methods, our research contributes to the advancement of sustainable policy-making in a comprehensive and informed manner.
Table 1 shows a summary of the main results and where this study fits in with the other research.
3. Definition of the Framework and an Illustrative Example
The systems included in the SoSs for designing green public policy are displayed in
Table 2. As demonstrated, green public policies play a role in the systems because we seek to comprehend their interactions with other systems. As stated previously, we refer to energy, health, green public policies, pollution, and the economy as systems because they are comprised of interdependent elements, facets, or forces that collaborate to achieve a particular objective (in this case, sustainable development).
Table 2 displays two prospective component examples for each system.
DEMATEL
The elements of DEMATEL are frequently referred to as "variables" since they reflect multiple characteristics or components of the investigated complicated system or issue. The DEMATEL approach is used to assess the interdependence of various factors and to appreciate their mutual influence. The elements are referred to as a system in this research because they are a collection of interrelated elements or components that have a common function or purpose.
The Initial Direct Relation Matrix (IDRM) in DEMATEL indicates the degree of effect between components. Each IDRM value is assumed to indicate the effect of the element in the associated row on the element in the corresponding column. IDRM is often determined via expert opinion.
Table 3 shows how the authors define the IDRM in the example. It should be noted that the IDRM values in DEMATEL are not defined scientifically, but are chosen based on expert opinion. While this may make DEMATEL subjective, it does allow for the evaluation of various stakeholders' opinions. As mentioned in the introduction, group decision-making DEMATEL is a way of combining multiple experts' judgments, with IDRM formed by the average values of experts [
10,
15].
Normalization scales IDRM values within a consistent range, typically between 0 and 1, enabling a clearer interpretation of influence levels and reducing any biases induced by varying impact scales or magnitudes. To normalize the IDRM, the sum of all rows and columns is calculated, and their utmost value is defined. In
Table 3, the IDRM is given as = 12. As shown in
Table 4, the normalized IDRM is generated by dividing all matrix elements.
N denotes the normalized matrix [
10,
15].
N is identical to the
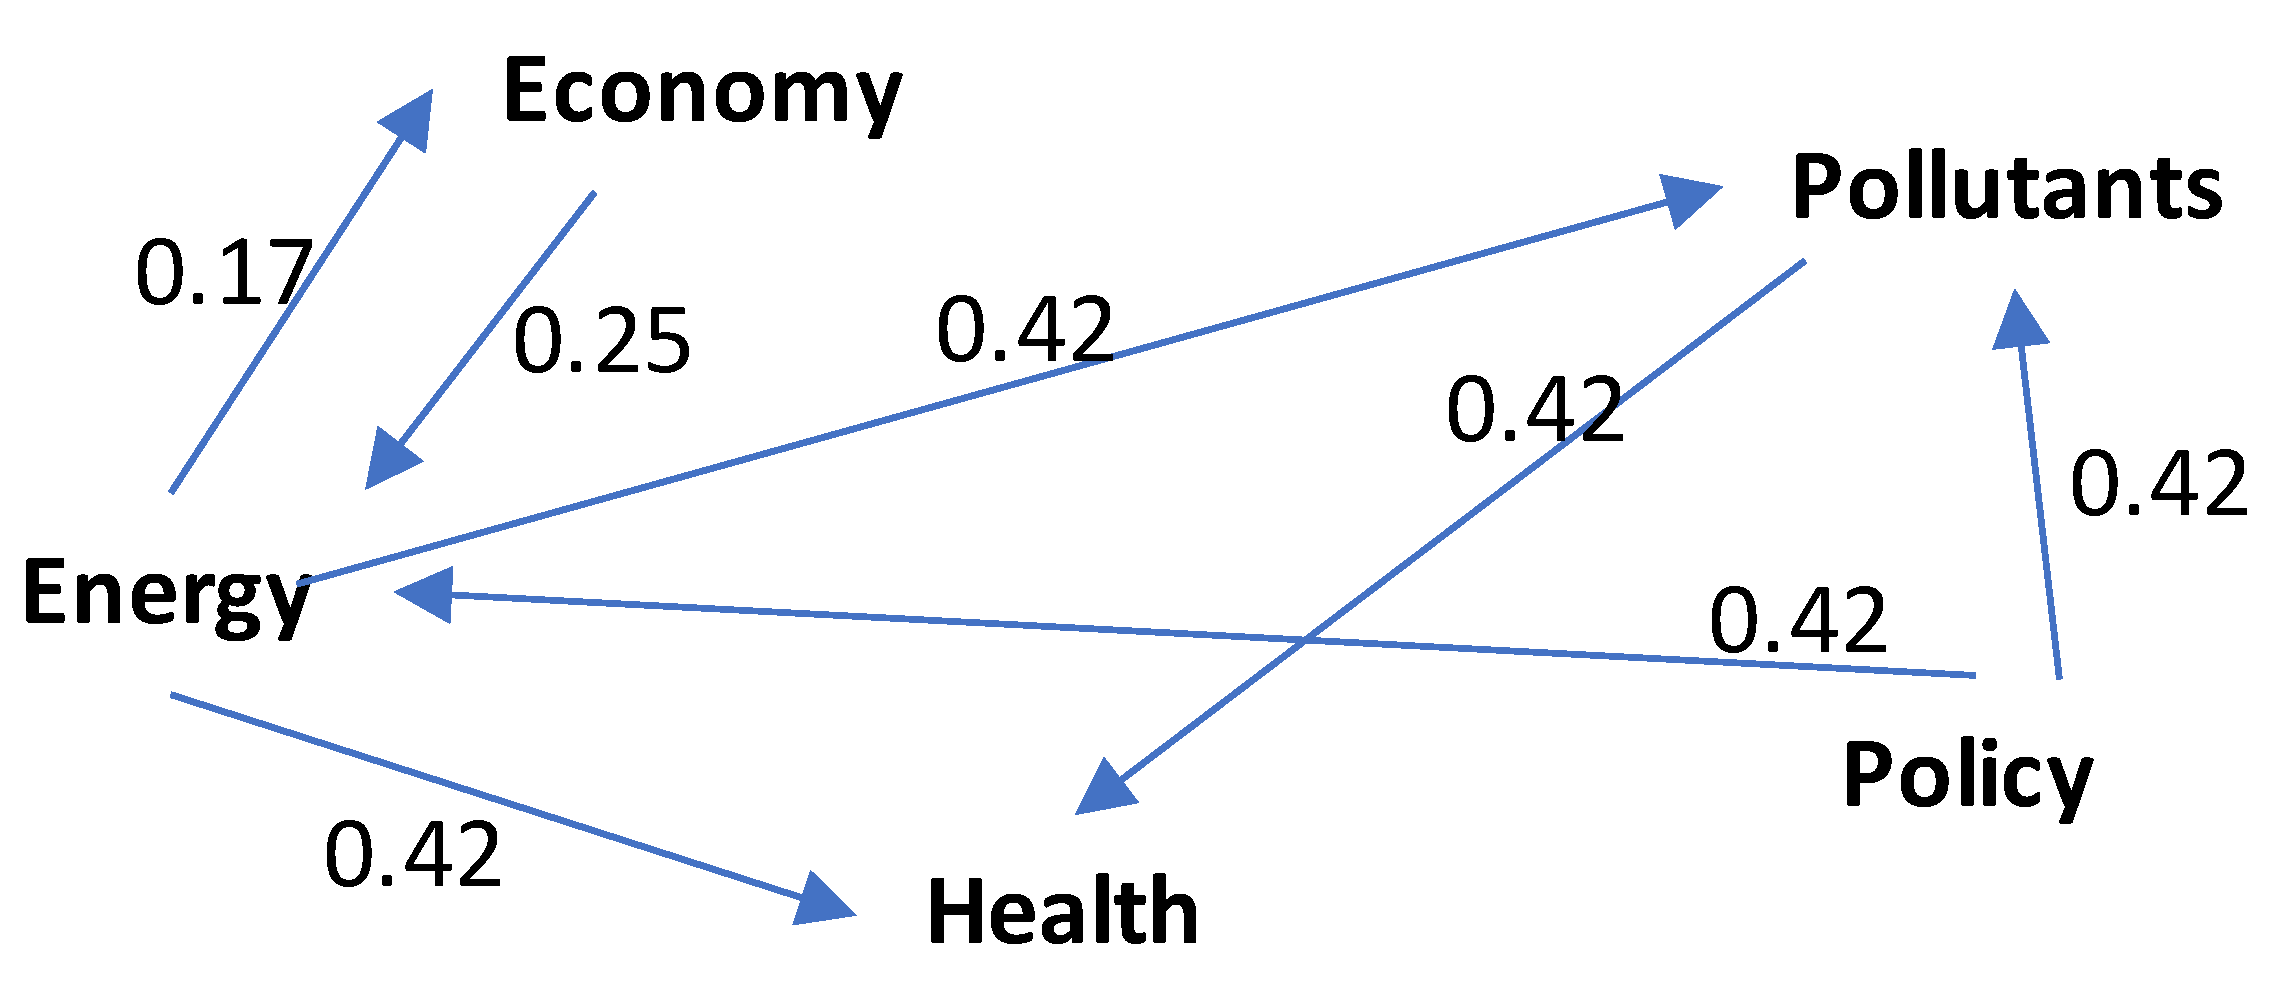
matrix of direct impacts. The causal tree of direct impacts generated from
is shown in
Figure 1. In DEMATEL, the causal loop diagram of direct impacts displays the linkages and causal links between system or network components. Arrows or directed boundaries are often used to represent the direction of effect [
10,
15]. The causal loop diagram is a visual depiction of the system's cause-and-effect interactions that shows how the parts interact and impact one another.
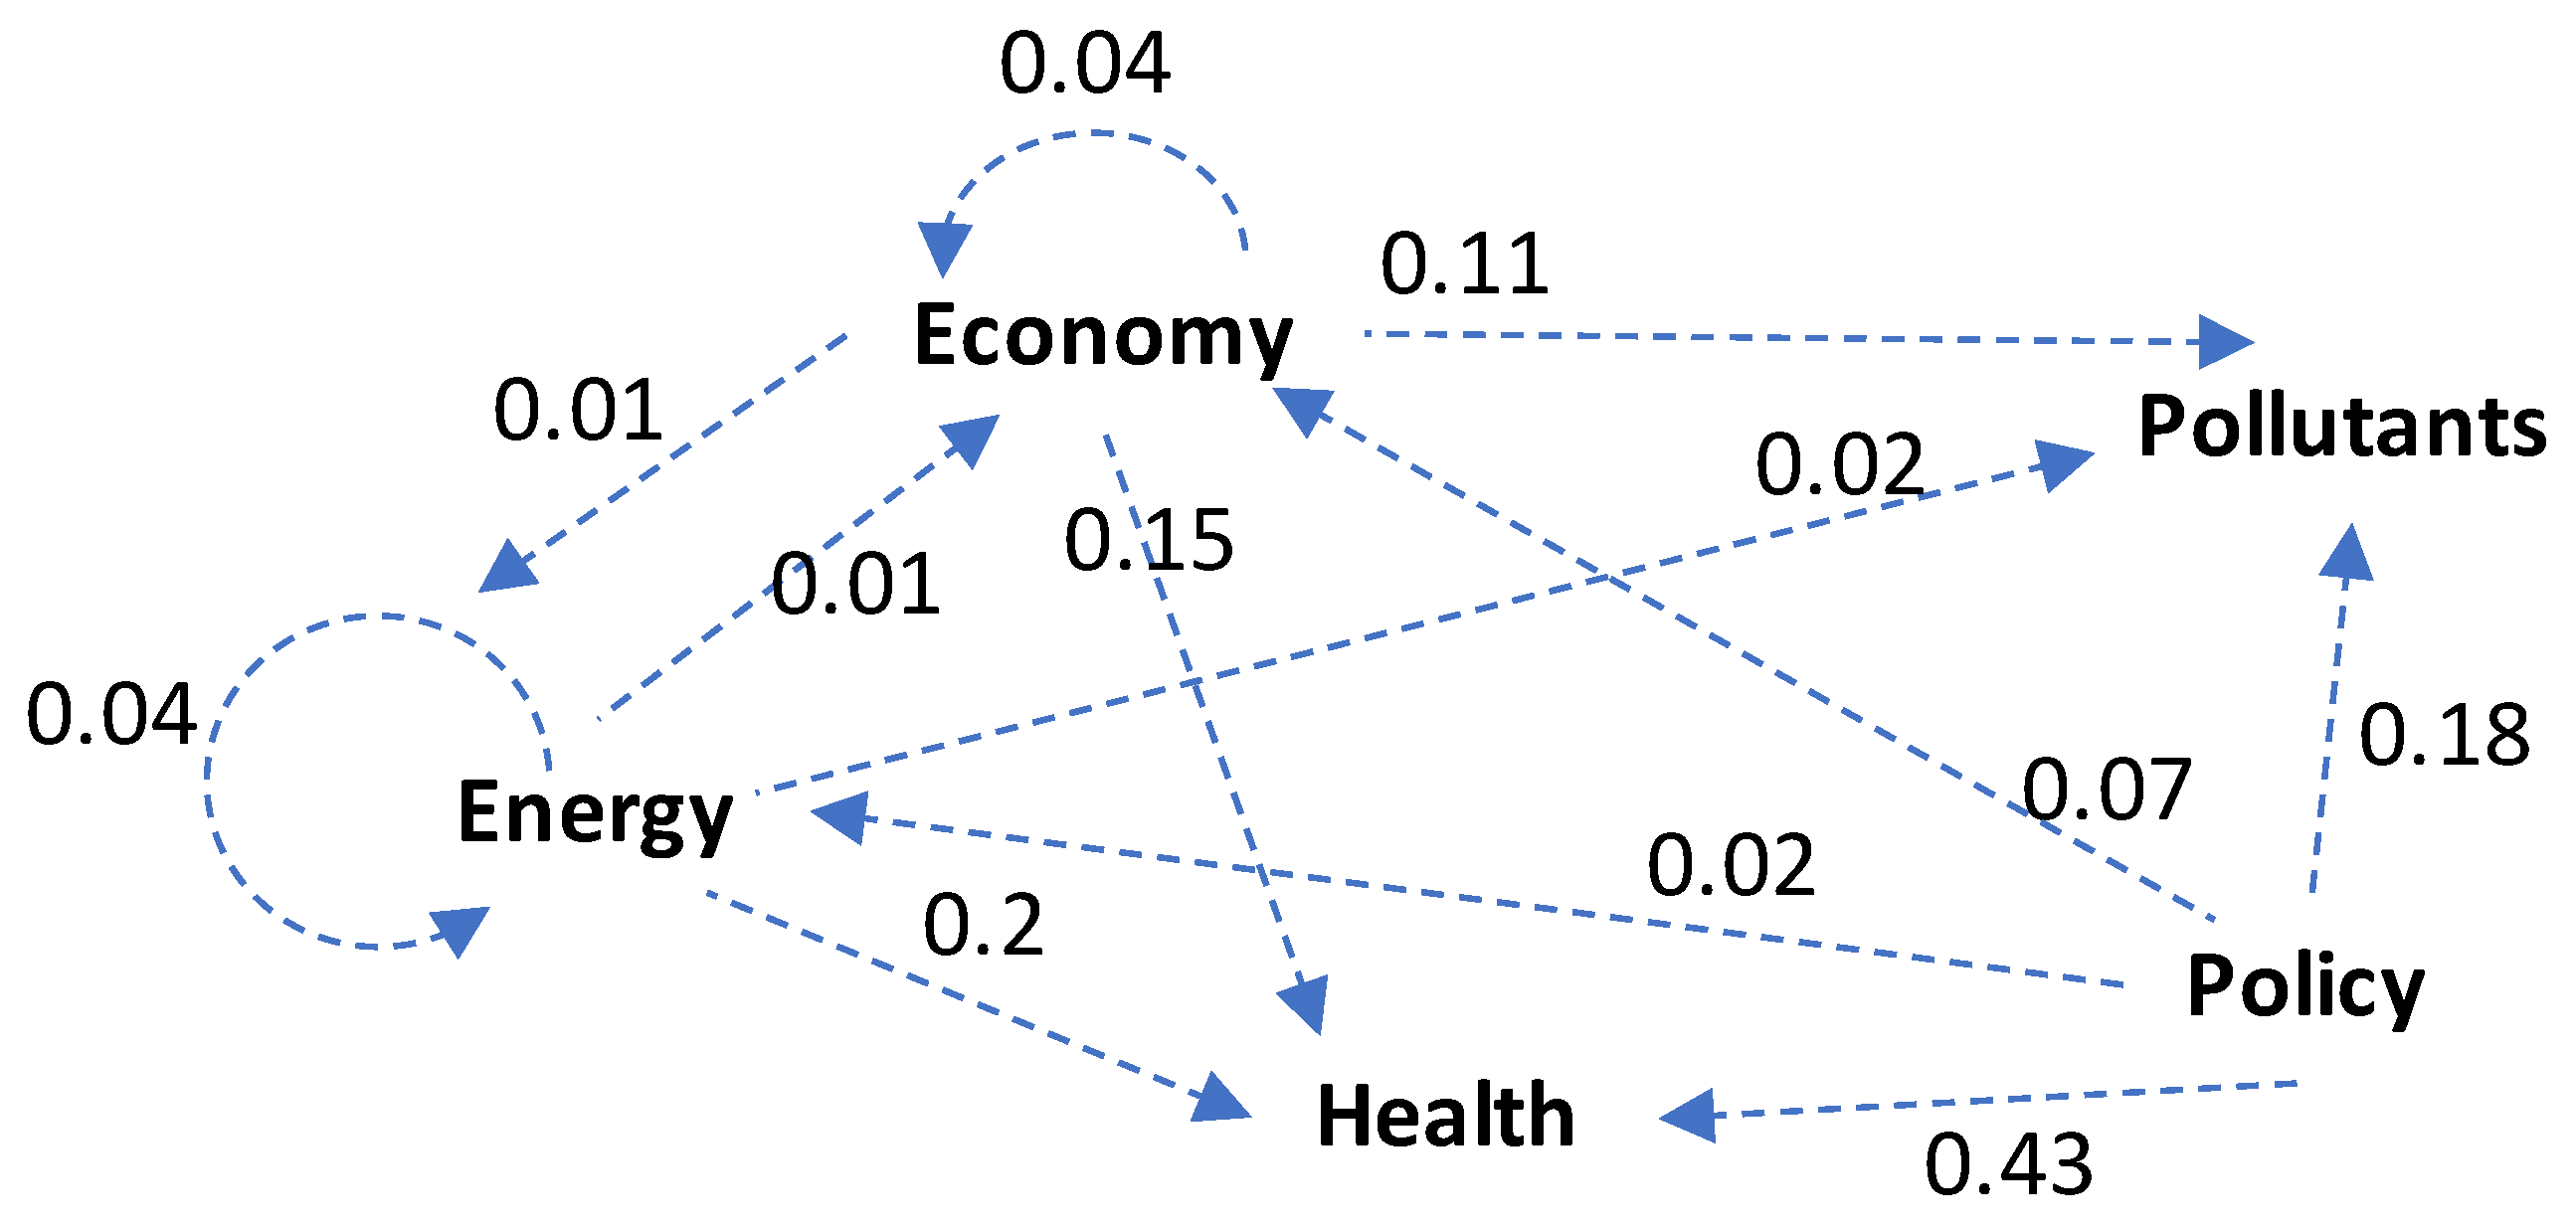
Indirect impacts between systems may arise when the impact of one element on another is mediated or transferred by other components in the system. These intermediary elements serve as bridges or paths for the impact to be conveyed. Using the following equation, the matrix of indirect impact may be constructed as shown in
Table 5:
, where
I is an identity matrix [
10,
15].
Figure 2 displays the causal loop diagram of indirect effects based on
.
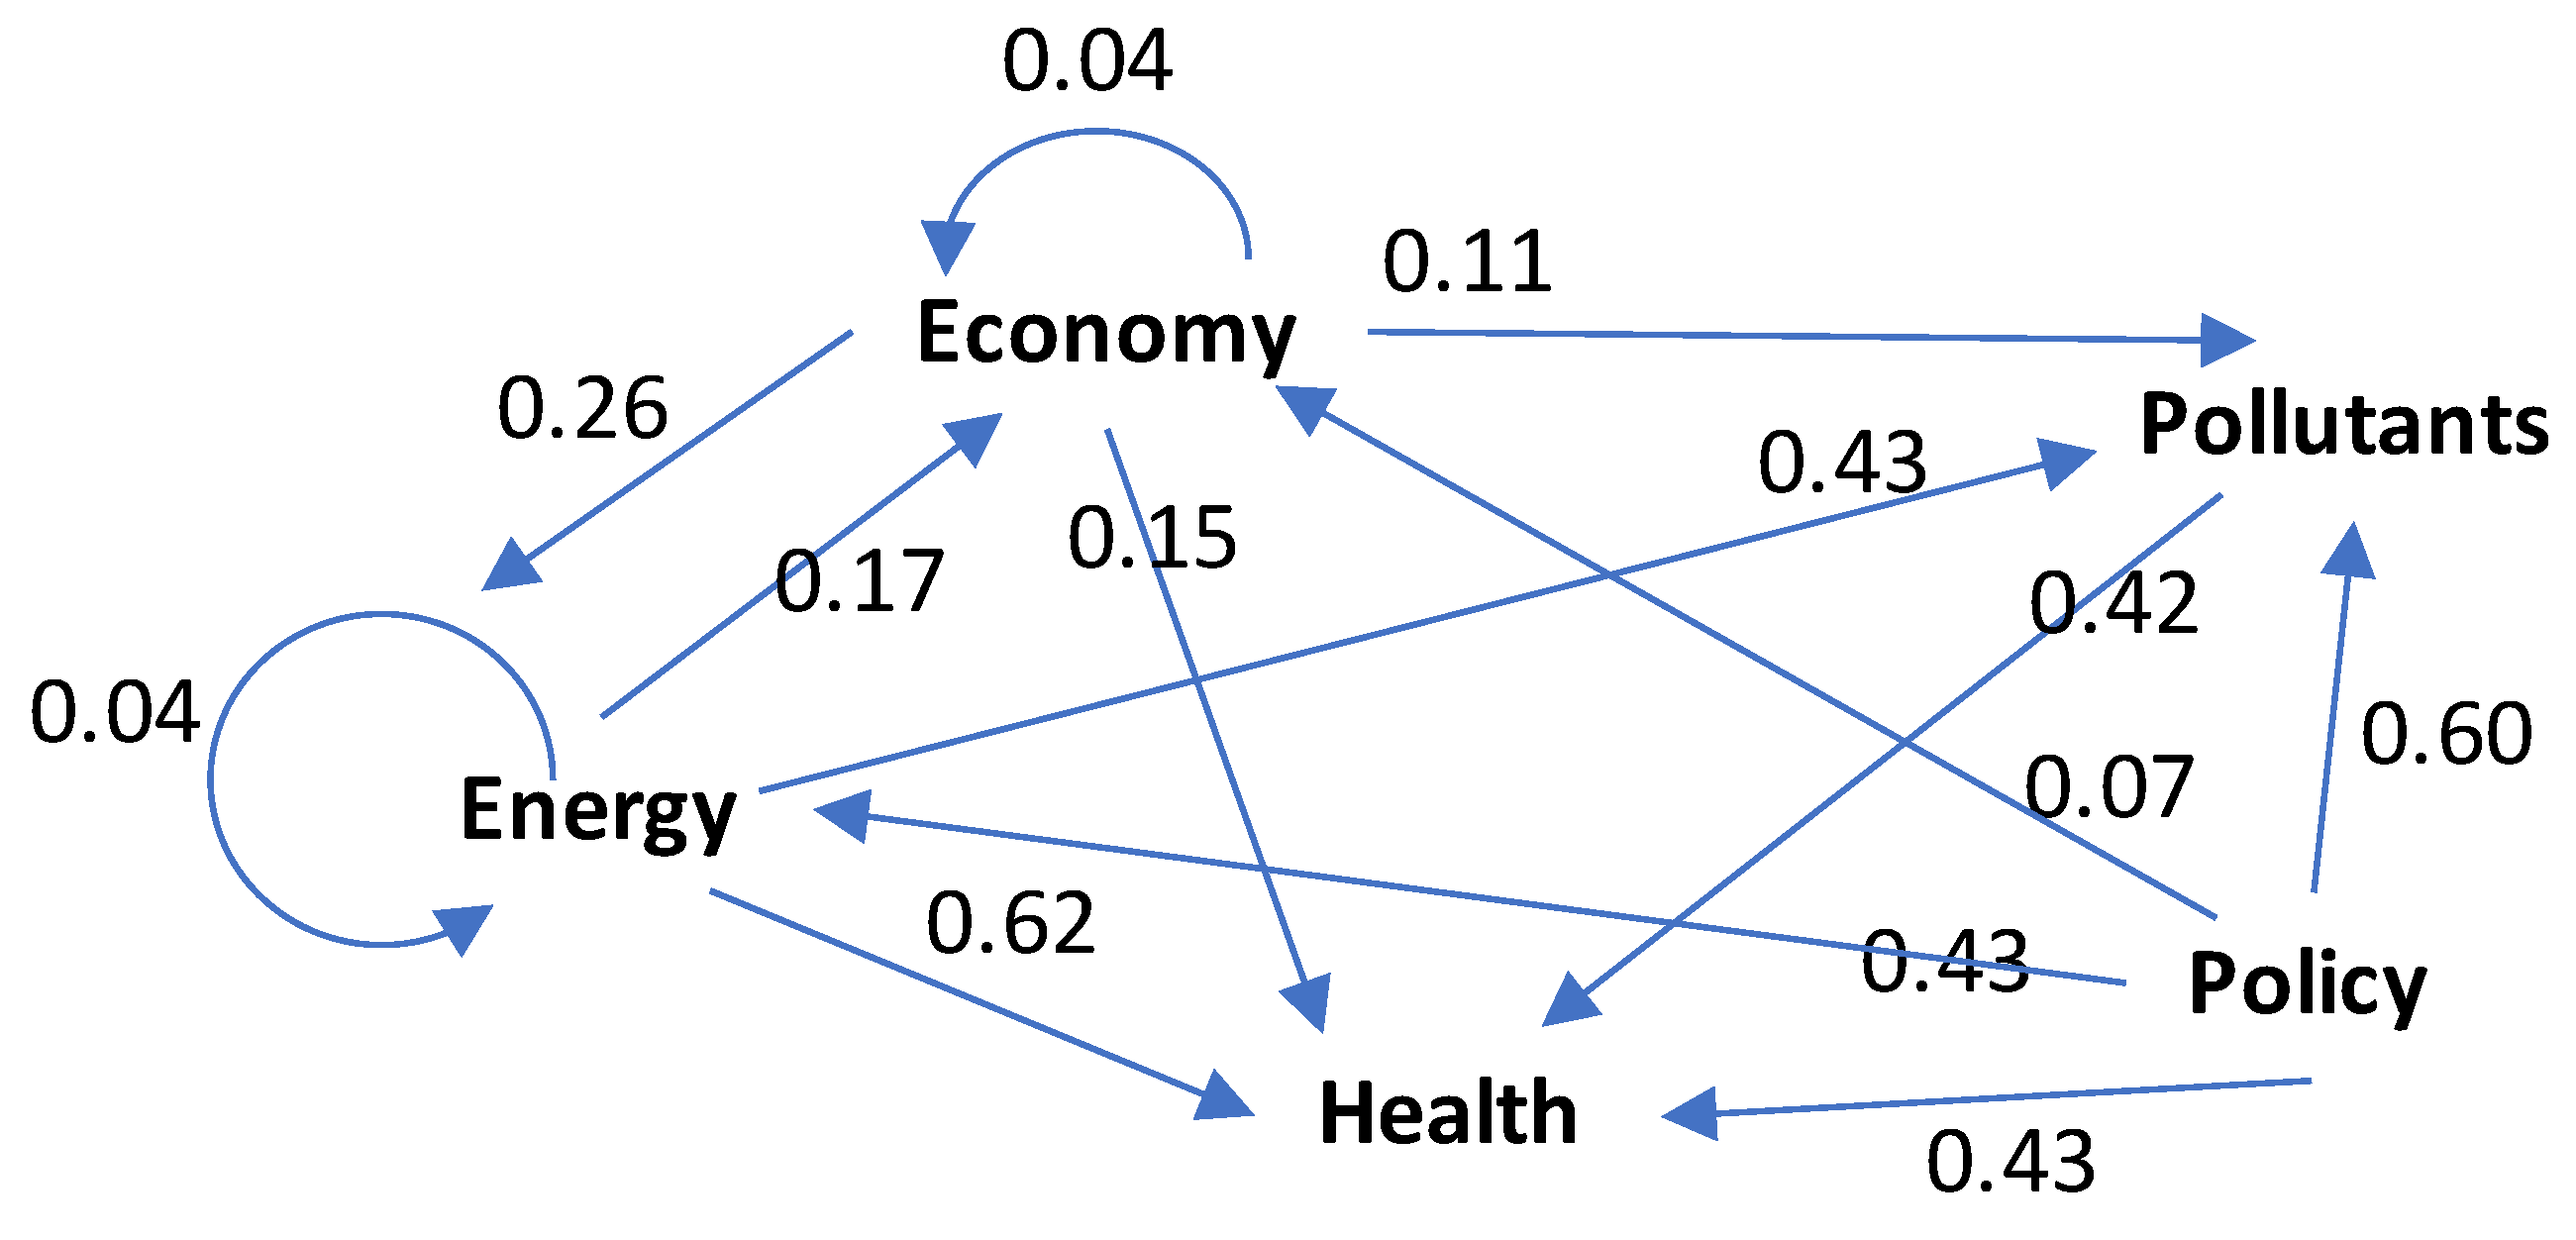
The total influence matrix is obtained as in
Table 6, using the equation
, where I is the identity matrix, where
I denotes the identity matrix. It is worth noting that
[
10,
15].
Figure 3 depicts the causal loop diagram of total influences derived from
.
The Normalized Reciprocal Matrix,
, is used to standardize and compare the influence values. We apply the following transformations to produce
, where
and
are the elements in row
i and column
j of matrices
and
, respectively, and
is the average of the elements in
[
10,
15].
The values in the direct and indirect effect matrices may be changed throughout the normalization process. As a consequence,
and
may have different values.
is acquired as shown in
Table 7.
Figure 4 depicts the causal loop diagram produced from
.
Matrice d'Impacts Croisés Multiplication Appliquée à un Classement (MicMac) analysis (also known as Matrix of Cross-Impact Multiplication Applied to Classification) is a methodology usually used with DEMATEL method. In MicMac,
R is determined for each system as the total of associated rows in
, whereas
C is acquired as the sum of relevant columns.
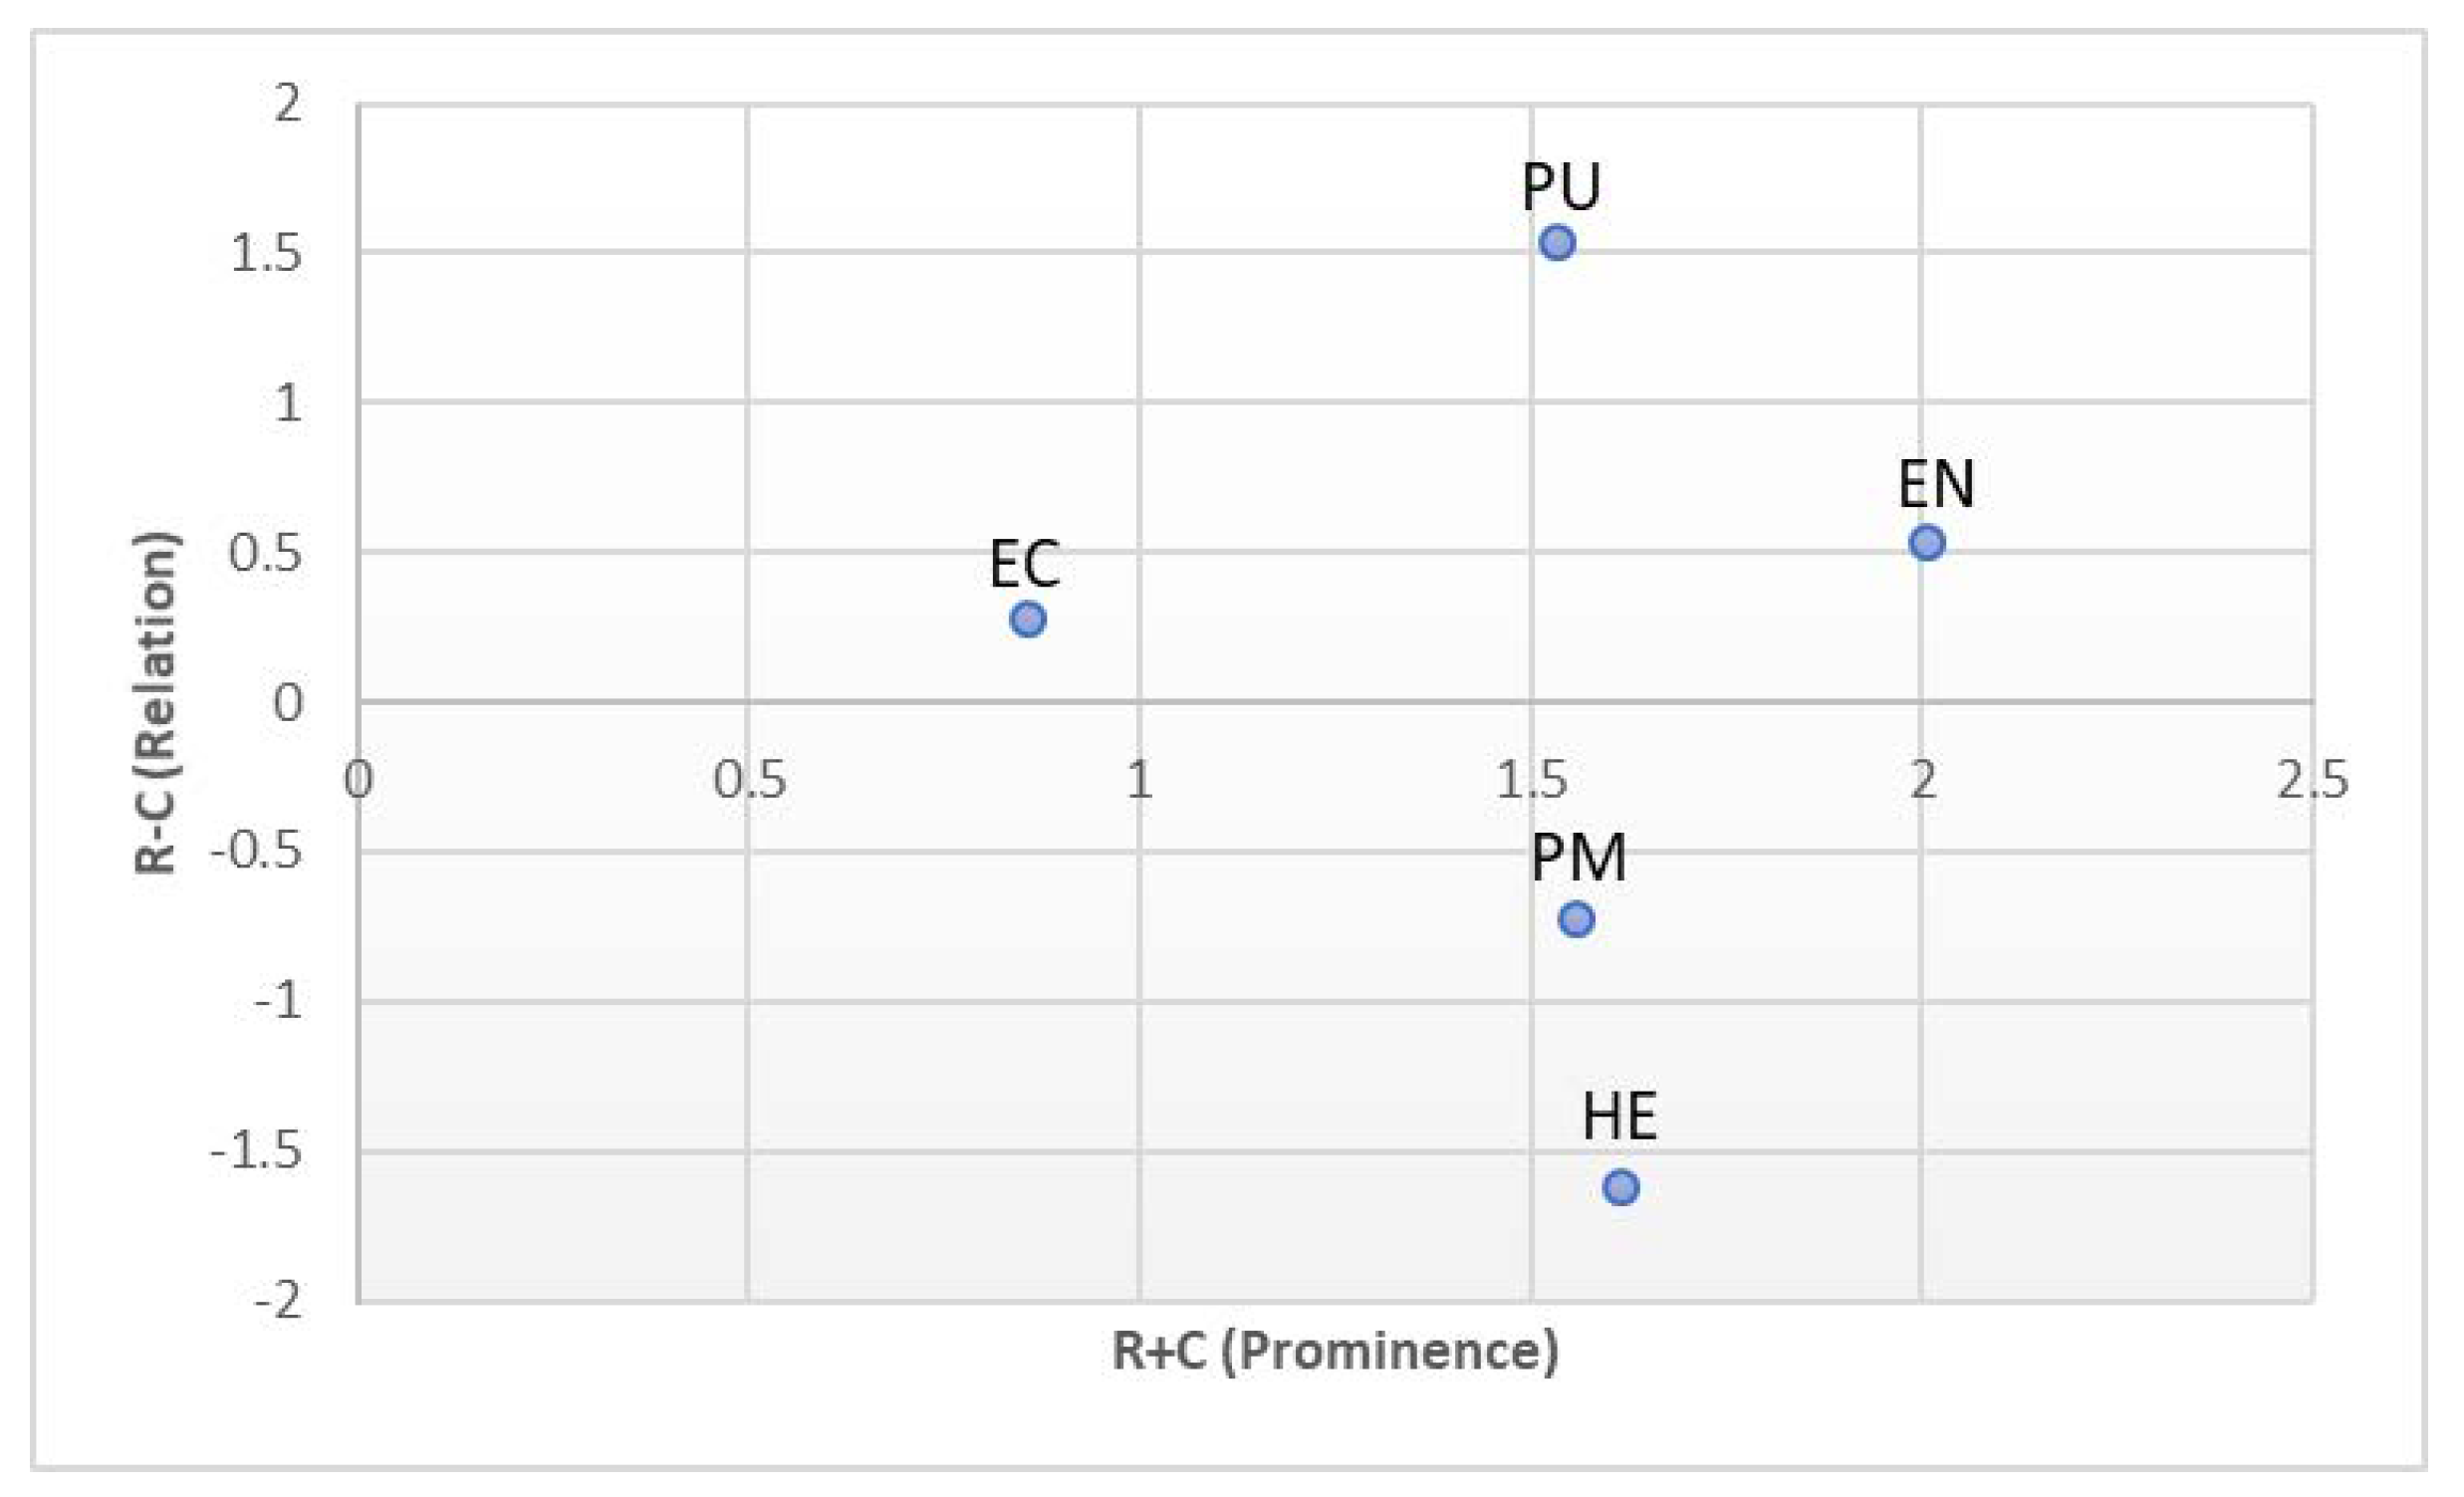
R+C denote prominence, which shows the total impact or relevance of a component within the system under consideration.
R-C measures a factor's efficacy; if
R-C > 0, the factor is largely effecter, whereas if
R-C = 0, it is mostly affected [
10,
15].
Figure 5 shows the results of the MicMac analysis. According to this graphic, PU has the greatest impact, whereas HE is the most affected.
ISM
As previously stated, integrating DEMATEL with ISM allows decision-makers to acquire a more thorough picture of the system, taking into account both hierarchical links and causal loops. ISM aids in the identification of direct linkages between components and acts as a basis for defining the system's hierarchical structure and interdependencies [
10,
16,
17].
The initial matrix in ISM, like DEMATEL, is built by a set of expert assessments or surveys in which experts evaluate the links between pairs of components in terms of their effect or influence. The experts submit evaluations or scores indicating the level of influence, which are then utilized to construct the interaction matrix. Ordinal scales or binary values (0 or 1) are often used to express these assessments. In
Table 3, we utilize the IDRM matrix of DEMATEL and replace the elements higher than 0 with 1. As a result, the initial matrix of ISM is produced, as shown in
Table 8.
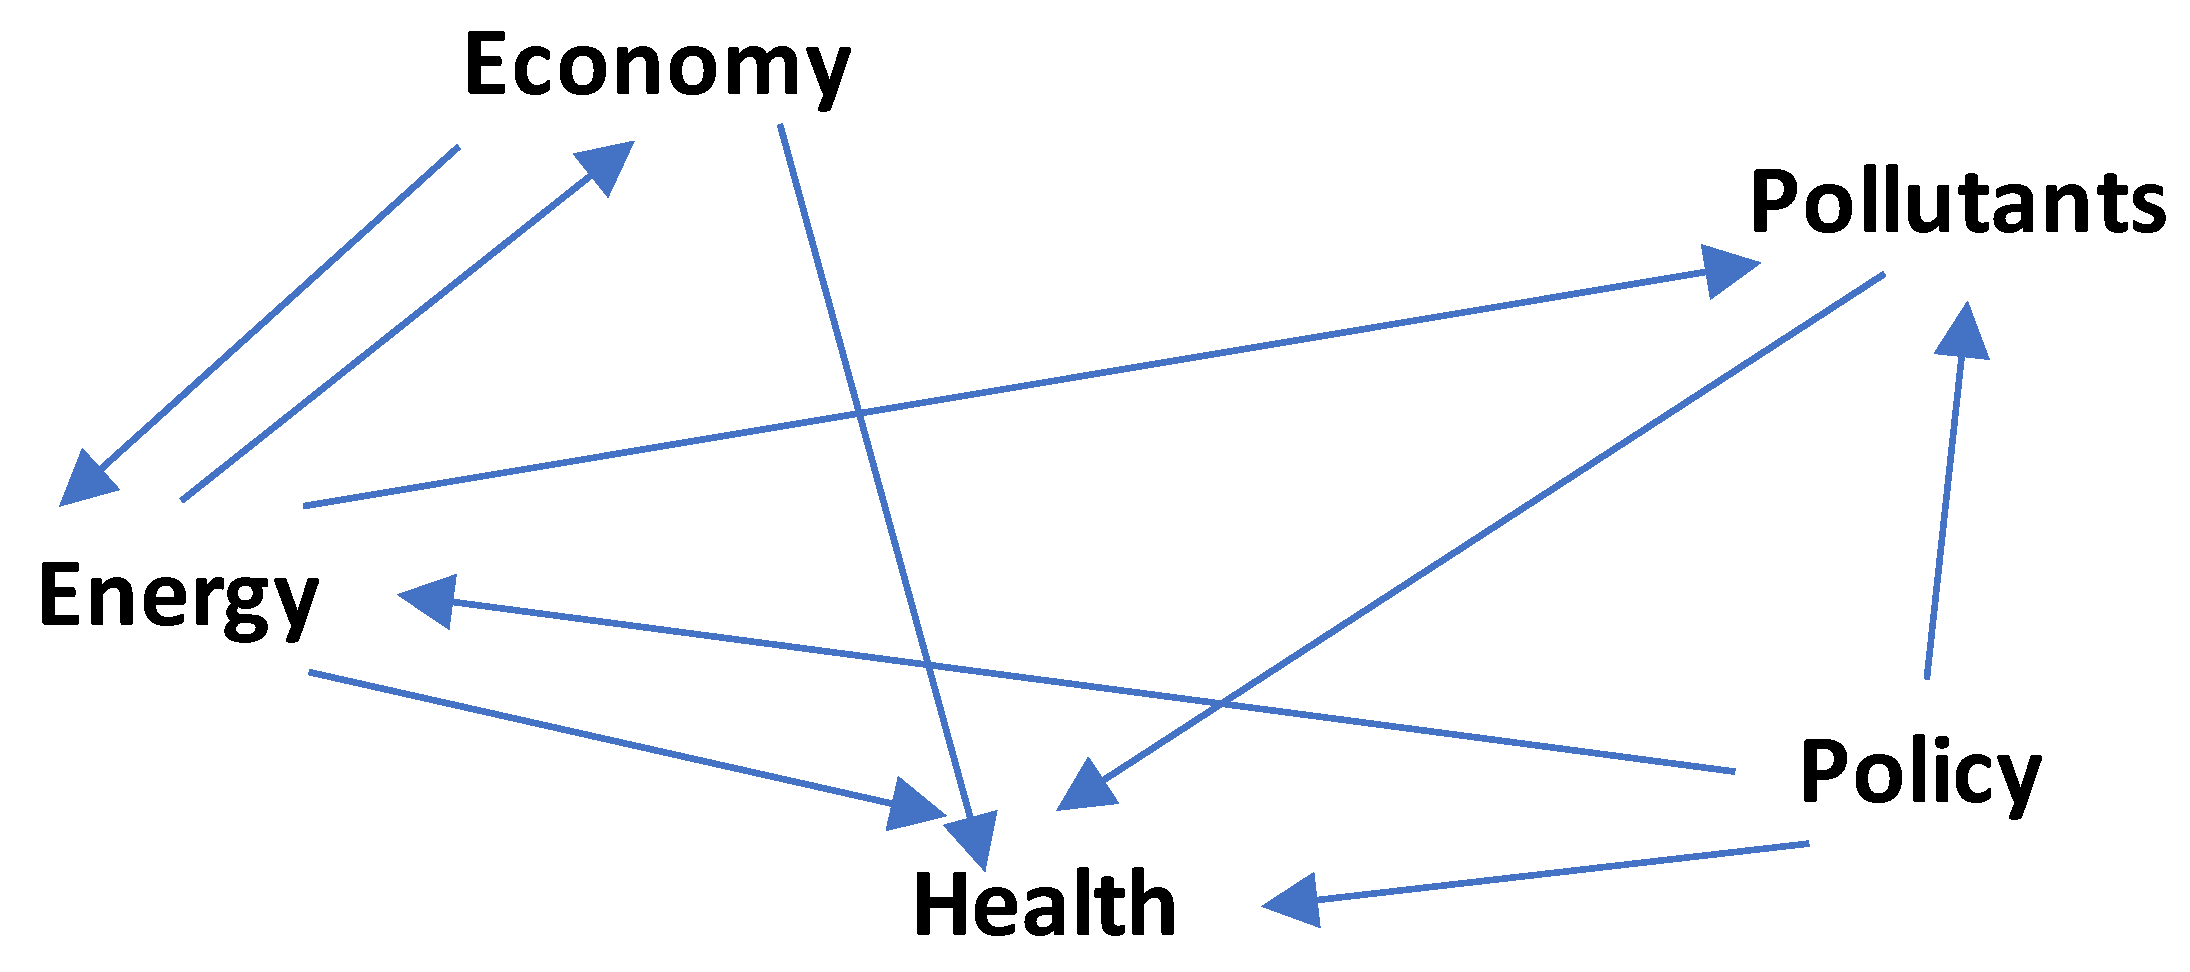
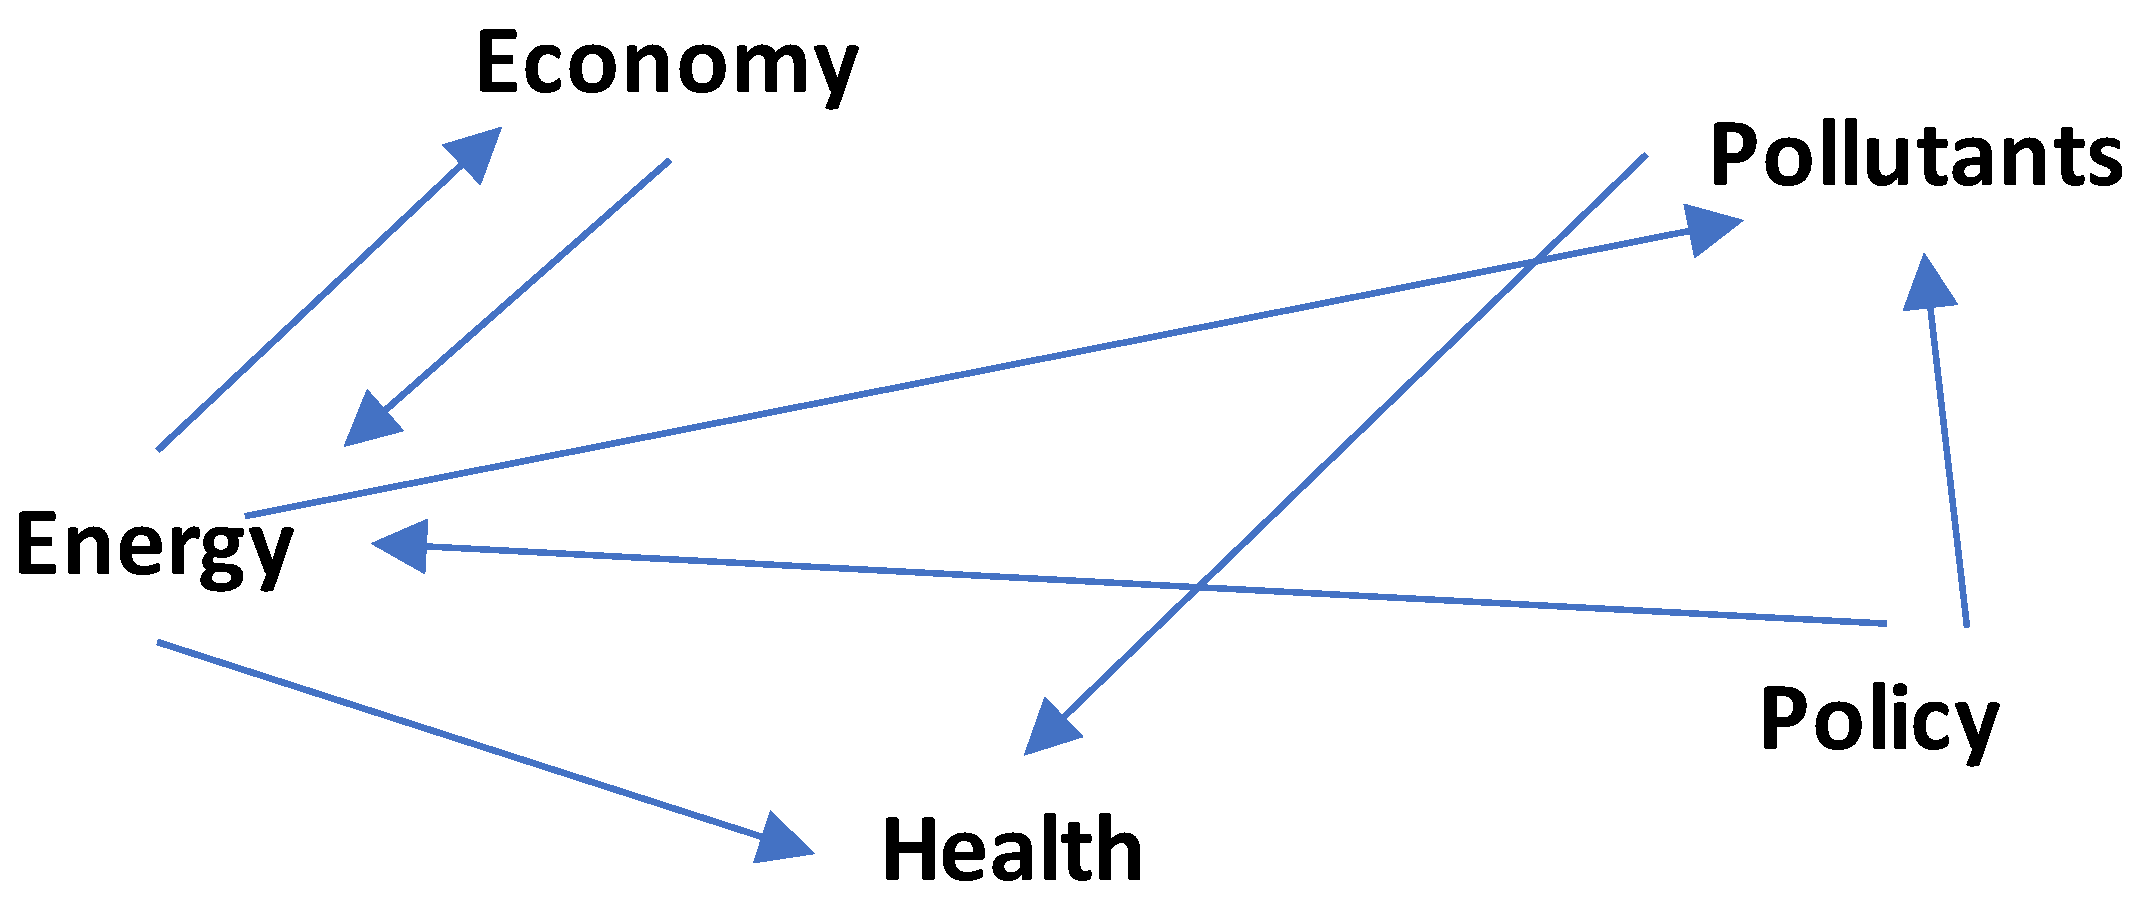
The causal loop diagram obtained from the initial matrix of ISM is depicted in
Figure 6.
There are several approaches for obtaining the final matrix from the first one. This is accomplished by examining the pairwise relationships between the components in the original matrix. The final matrix comprises both direct and indirect interactions between the components [
10,
16,
17]. As seen in
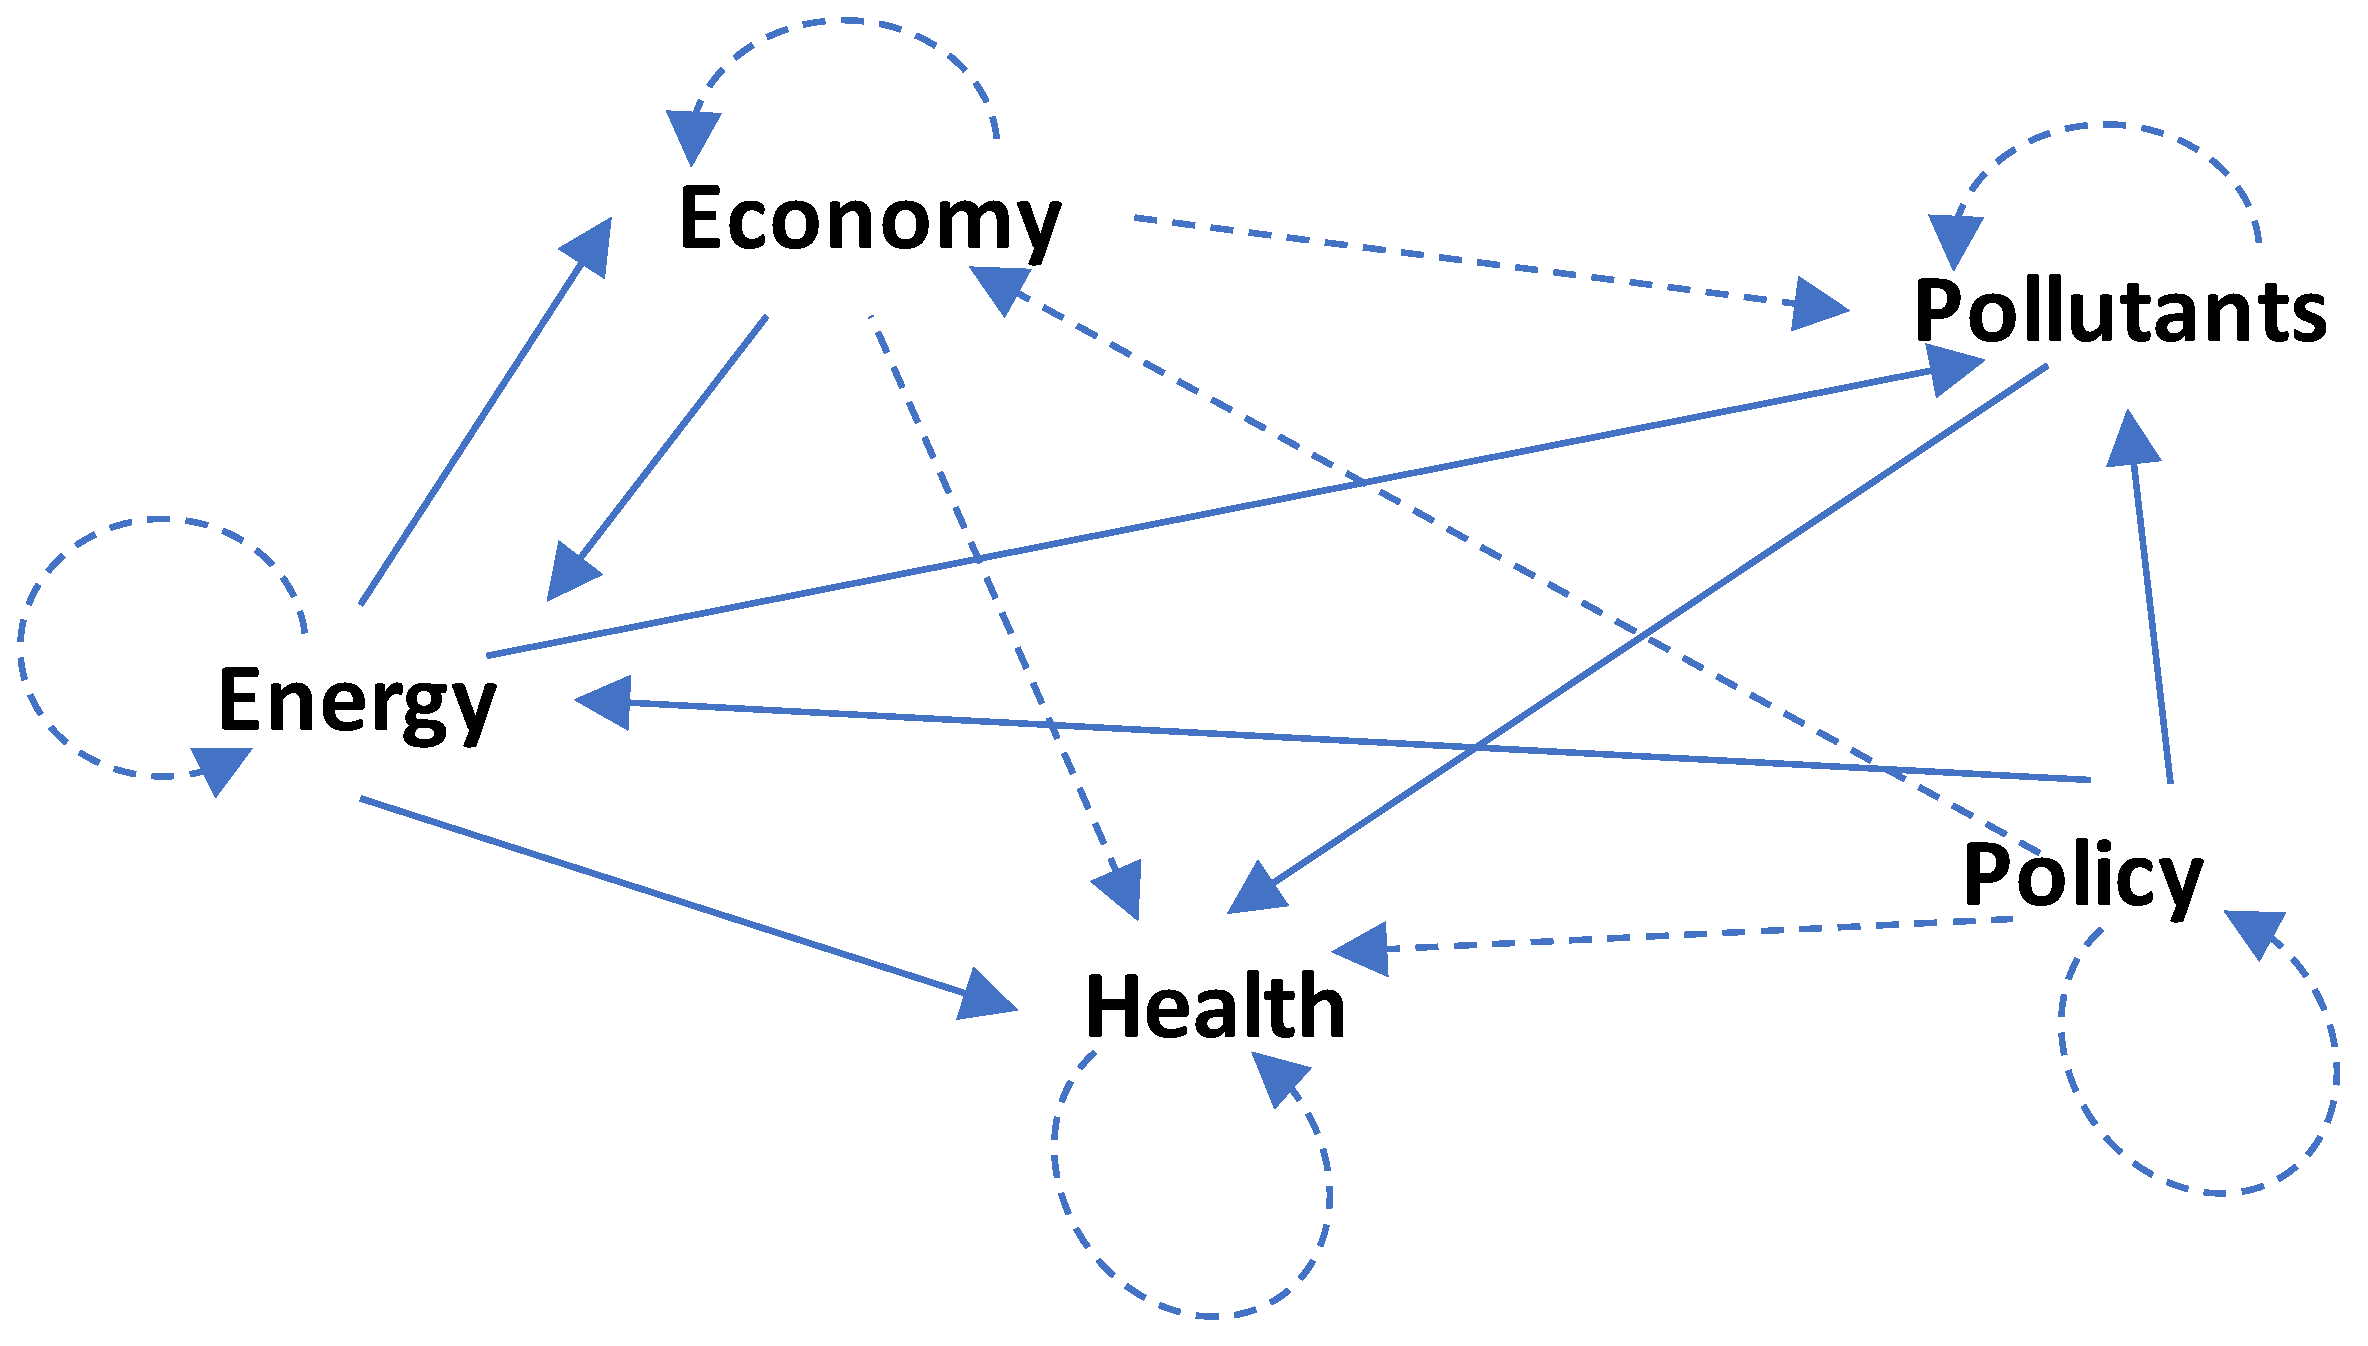
Figure 6, policy affects energy, which in turn influences health. As a result, the policy has an indirect effect on health, as seen by the dashed arrow in
Figure 7. The additional in-direct linkages between the systems may be constructed similarly, as illustrated in
Figure 7 with dashed arrows. Furthermore, each system is considered to have an indirect link with itself.
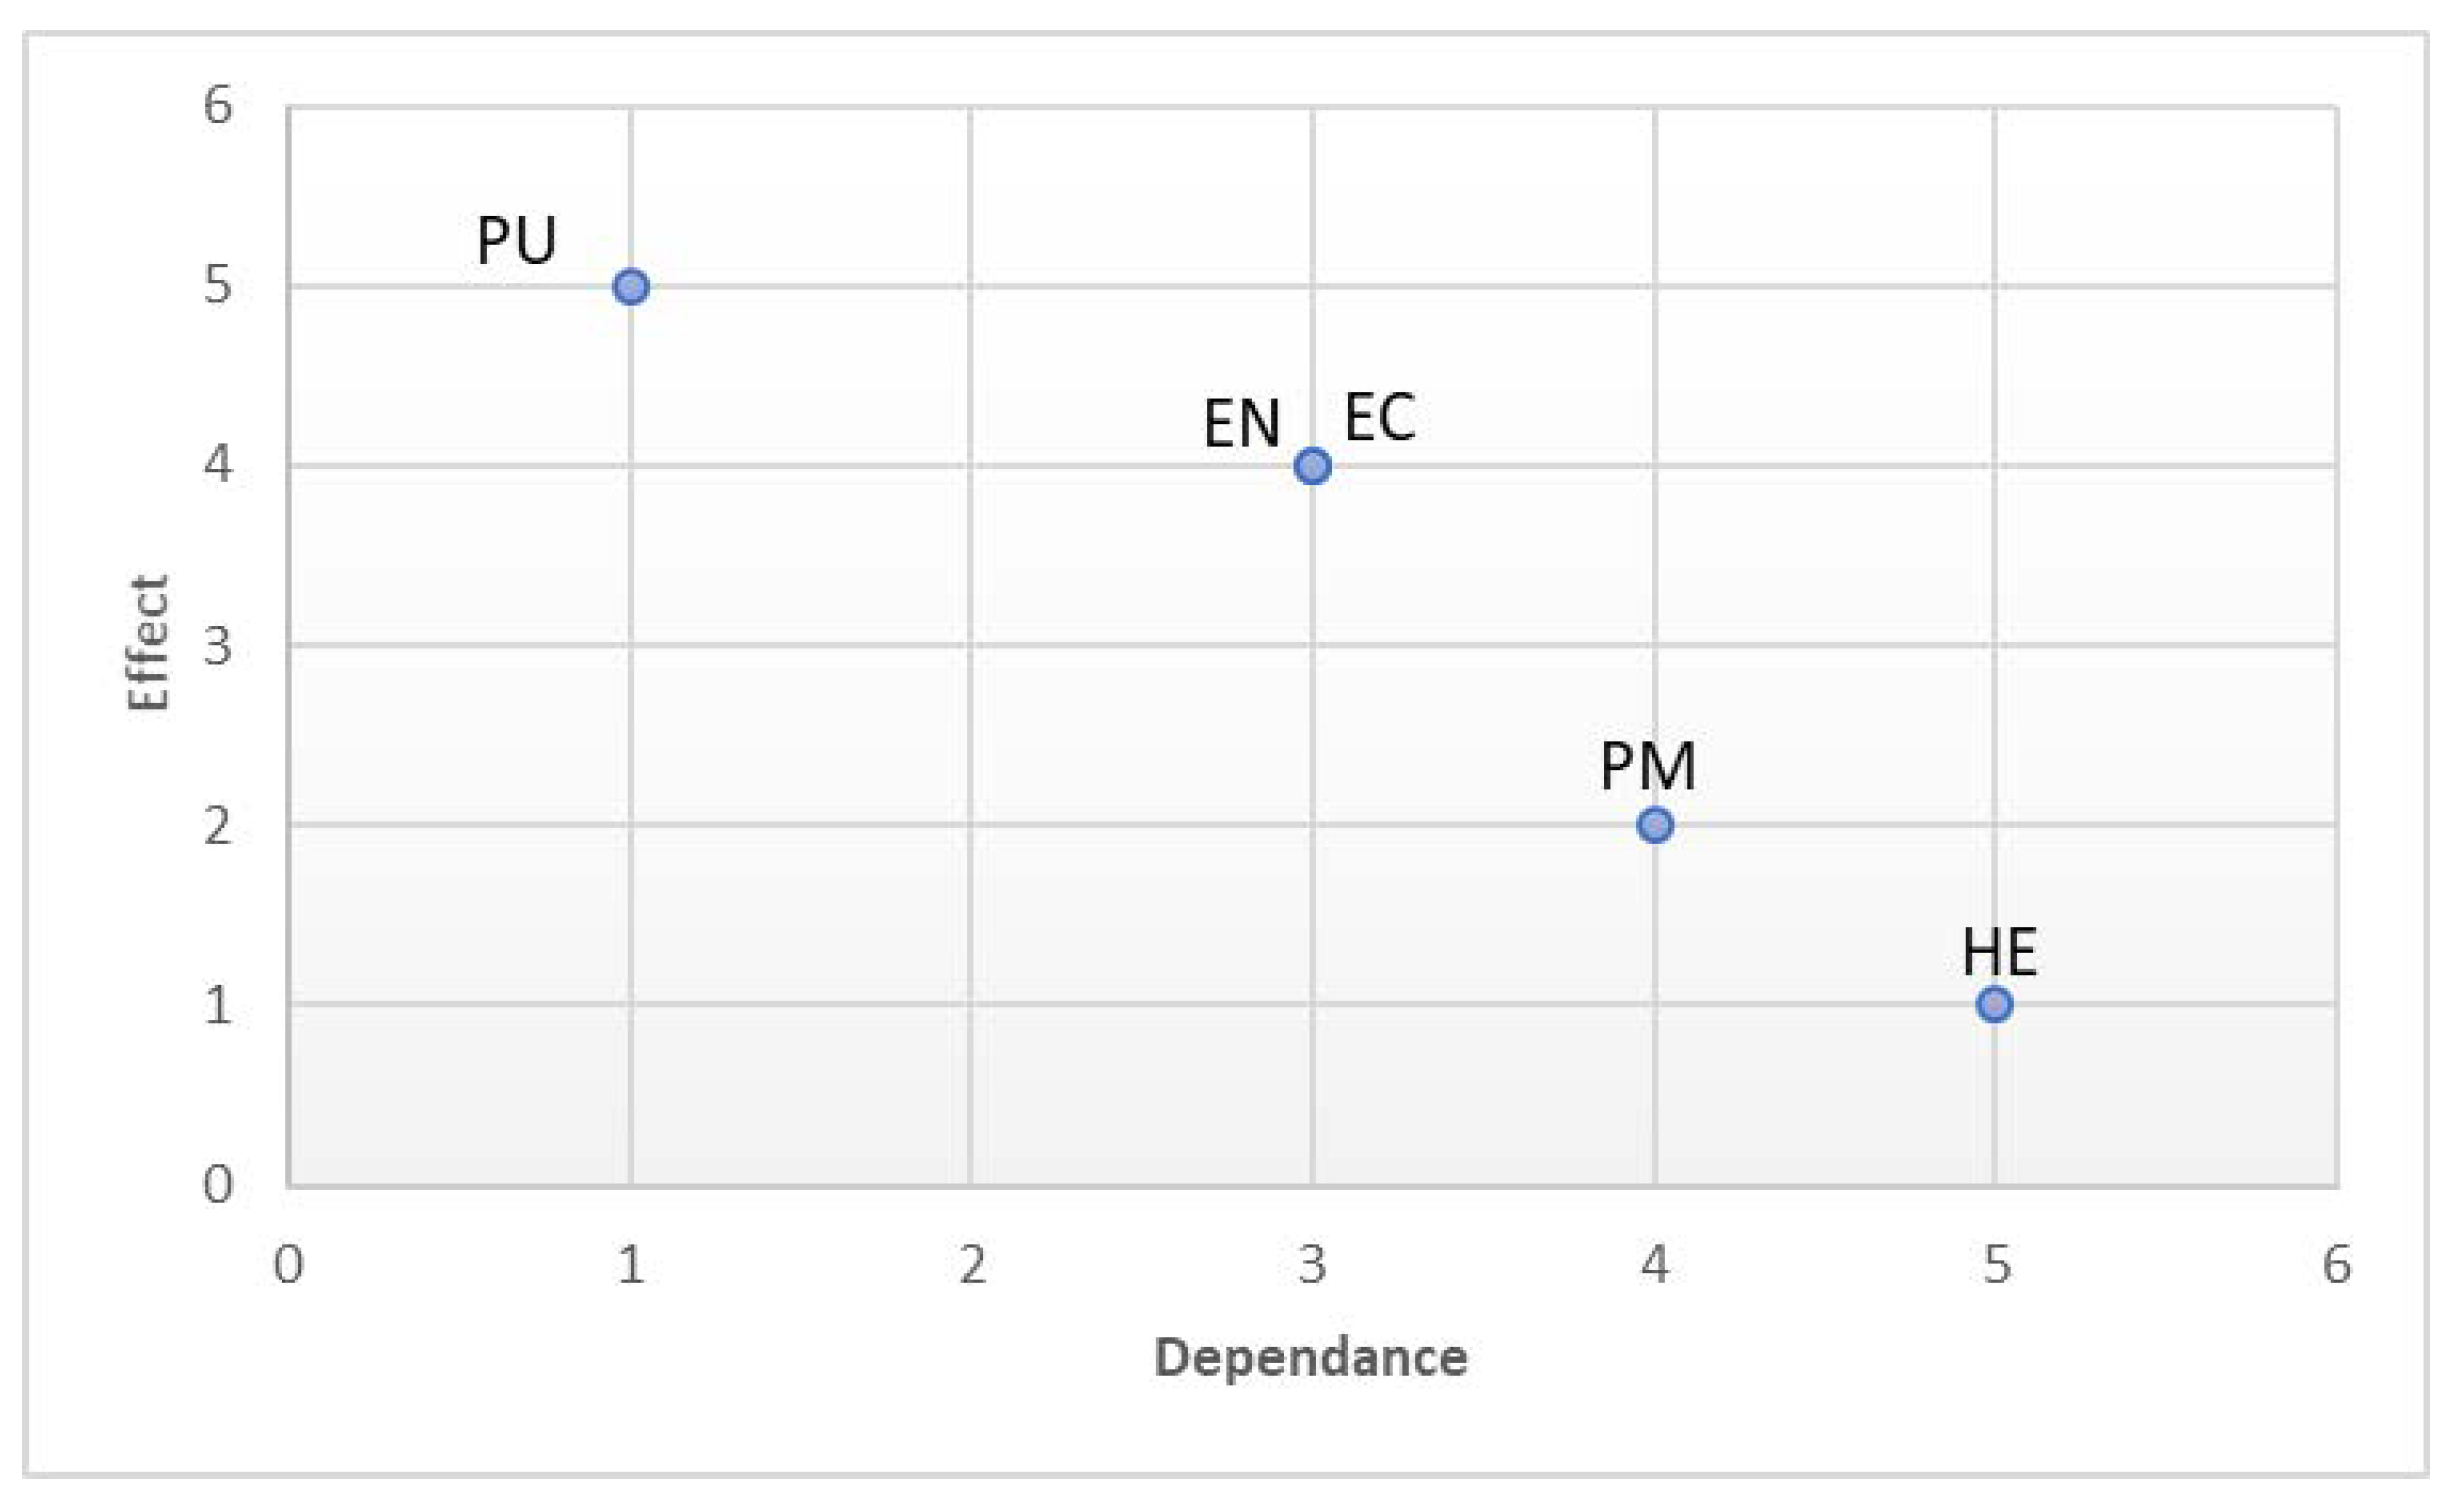
The dependency and influence of each system are derived using the final matrix, as shown in
Table 10. For each system, dependence is equal to the sum of the related column, while the effect is equal to the sum of the related row.
As seen in
Table 10, policy has the greatest influence and the least dependency, while health has the greatest effect and the most dependence. This is also represented in
Figure 8, implying that the changes are mostly the result of governmental policies.
In ISM, the forming of a level is a critical step that provides managers with a visual tool. The hierarchical grouping of components based on their interdependence and impact is referred to as levels, which signify various degrees of influence, control, or relevance within the system under consideration. Elements within each level are more closely connected than elements from other levels [
10,
16,
17].
The number of levels in an ISM analysis might vary according to the complexity of the system under consideration. An ISM model often has multiple layers, with the top level representing the most influential or driving components and the lower levels representing elements impacted by the higher-level elements [
10,
16,
17].
To form the levels, using the matrix in
Table 9, we create the sets of antecedent, reachable, and intersection sets as in
Table 11. For each system, the members of the sets of antecedent and reachable are, respectively, the ones in the corresponding column and row. The members of the intersection set are the joint ones between the antecedent and reachable sets [
10,
16,
17].
The system in level 1 is the one whose reachable and intersection sets are the same. According to
Table 11, the system of health is selected as level 1. Then, the row and column relevant to the system of health are eliminated from
Table 9, whose result is as in
Table 12.
In a similar way, the sets of antecedent, reachable, and intersection are created for the matrix in
Table 12, whose result is as in
Table 13.
Since the reachable and intersection sets for the system of pollutants are the same, it is selected as level 2. Accordingly, the row and column of the system of pollutants are eliminated from
Table 12, whose result is as in
Table 14.
The sets of antecedent, reachable, and intersection for the matrix in
Table 12 are as in
Table 15, where the reachable and intersection sets for the systems of energy and economy are the same. Thus, they are selected as level 3, and accordingly, the system of public policy is level 4.
The diagram of levels is drawn in
Figure 9.
From
Figure 9, it can be concluded that the system with the most impact in the defined SoSs is public policy, which directly affects the systems of energy and economy. The system of pollutants is affected by the systems of energy and economy, while it affects the system of health. It should be noted that this is a conclusion from
Table 8, and if it is different, this conclusion is different too. Based on this fact, it is mentioned that the results of the ISM are subjective and based on the judgment of experts.
There should not be inconsistencies between the results of DEMATEL and ISM. The conclusion from the MicMac analysis shown in
Figure 5 is similar to the conclusion from
Figure 9.
The visual outputs of DEMATEL and ISM can be very helpful for managers, which can be considered their advantage over other decision-making techniques. For example, generating pairwise comparison matrices in AHP and super-matrix in ANP can be difficult; however, they may not be as understandable as the outputs of DEMATEL and ISM. AHP and ANP are widely used for the prioritization and weighting of criteria or alternatives. By incorporating the insights gained from DEMATEL, the prioritization and weighting processes become more informed and accurate. DEMATEL helps identify the key drivers and factors that influence the decision problem, which can be incorporated into the prioritization process of AHP or ANP. This leads to more robust and reliable prioritization outcomes.
Managerial Implications
The utilization of DEMATEL and ISM as robust and systematic structural analysis techniques has important theoretical implications for evidence-based policy formulation. By employing the DEMATEL and ISM methods, it is possible to identify and analyze the causal relationships between Energy, Health, and Pollutants, thereby gaining a comprehensive understanding of the interdependencies among these factors. This understanding is crucial for making informed decisions and formulating policies that promote environmental preservation and public well-being.
The comparative analysis conducted in this research contributes to the credibility and applicability of DEMATEL and ISM as distinct analytical tools for green policy design. It highlights the unique advantages that DEMATEL and ISM offer over other established methods, such as System Dynamics, in uncovering and comprehending the complex relationships between factors. This understanding empowers policymakers and researchers to make informed decisions regarding the selection and application of appropriate analytical methods.
From a managerial perspective, by utilizing DEMATEL and ISM as analytical tools, policymakers and managers can effectively design green public policies that address pressing environmental challenges while promoting sustainability. The abilities of DEMATEL and ISM to uncover the complex relationships between factors enable the development of evidence-based policies that align with SDGs.
In addition, managers can leverage the unique advantages of DEMATEL and ISM, such as their ability to provide valuable insights into causal relationships, to enhance their decision-making processes. The utilization of DEMATEL and ISM empowers managers to make well-informed decisions that are aligned with sustainability objectives. By considering the comprehensive understanding of the interdependencies among Energy, Health, and Pollutants that DEMATEL and ISM provide, managers can develop and implement effective green policies that contribute to environmental preservation and the well-being of the public.
4. Conclusion and Future Works
The development of effective green public policies is crucial in addressing environmental concerns and promoting sustainable development, in alignment with the United Nations' SDGs. The primary objective of this research is to enhance the understanding and implementation of policies that effectively promote sustainability and address pressing environmental challenges. By utilizing the analytical capabilities of DEMATEL, we provide a tool with which policymakers can gain a comprehensive understanding of the causal relationships among energy, health, public policies, pollutants, and the economy. This understanding enables the formulation of evidence-based green policies. The study's findings highlight the distinct advantages of DEMATEL over other methods, establishing its value as a valuable tool for informed policy decision-making in the pursuit of environmental preservation and public well-being. Although the focus of the paper centers on the application of DEMATEL as a structural analysis technique for green policy design, it does not delve into potential challenges or limitations specific to using DEMATEL in this context. Future research could therefore explore practical implementation issues, data requirements, and potential biases associated with applying DEMATEL in green policy design. Additionally, the comparative analysis conducted in the study compares DEMATEL with System Dynamics and Fuzzy methods, providing insights into the unique advantages of DEMATEL. However, this comparison may not encompass all possible analytical methods used in policy formulation and decision-making.
In
Table 2, we present two examples of elements or factors for each system. They can be generalized and also a more comprehensive model should discover the relationships between them.
Although the results of DEMATEL and ISM reflect the interests of different stakeholders, they are subjective. In future studies, it is planned to define a utility function for the stakeholders to fill the deficiency [
18].
Future research can focus on integrating DEMATEL with various methods and approaches to enhance analysis and decision-making. For example, combining DEMATEL with grey relational analysis (GRA) can handle incomplete or imprecise data. Additionally, integrating DEMATEL with techniques like Analytic Hierarchy Process (AHP) and Analytic Network Process (ANP) can determine factor weights. Further investigation can explore the application of Technique for Order Preference by Similarity to Ideal Solution (TOPSIS) alongside DEMATEL for additional insight. Researchers can also explore fuzzy DEMATEL to manage uncertainty using fuzzy set theory. Complementary techniques like MICMAC and Soft Systems Methodology (SSM) can enhance classification and address complex issues. Also, Group Decision-Making DEMATEL incorporates multiple stakeholder opinions, while integrating System Dynamics (SD) provides a comprehensive understanding of systems.
Figure 1.
The causal loop diagram of direct influences.
Figure 1.
The causal loop diagram of direct influences.
Figure 2.
The causal loop diagram of indirect influences.
Figure 2.
The causal loop diagram of indirect influences.
Figure 3.
The causal loop diagram of total influences.
Figure 3.
The causal loop diagram of total influences.
Figure 4.
The causal loop diagram obtained from
Figure 4.
The causal loop diagram obtained from
Figure 5.
MicMac analysis.
Figure 5.
MicMac analysis.
Figure 6.
The causal loop diagram of the initial matrix of ISM shows direct relationships among the systems.
Figure 6.
The causal loop diagram of the initial matrix of ISM shows direct relationships among the systems.
Figure 7.
The causal loop diagram of direct and indirect relationships among the systems.
Figure 7.
The causal loop diagram of direct and indirect relationships among the systems.
Figure 8.
Diagram of dependence and effect of systems.
Figure 8.
Diagram of dependence and effect of systems.
Figure 9.
The obtained levels by ISM.
Figure 9.
The obtained levels by ISM.
Table 1.
A comparison of studies from the literature.
Table 1.
A comparison of studies from the literature.
| Studies |
DEMATEL |
ISM |
ANP |
| Xu and Fu [4] |
X |
|
|
| Sujak et al. [5] |
X |
|
|
| Kaur et al. [6] |
X |
|
|
| Shen and Yao [7] |
X |
|
|
| Chou et al. [8] |
X |
|
x |
| Etraj and Jayaprakash [9] |
X |
|
|
| This paper |
X |
x |
|
Table 2.
The systems in the defined SoSs.
Table 2.
The systems in the defined SoSs.
| Notation |
System |
Sample Factor |
| EN |
Energy |
Renewable energy percentage (0-100%) |
| Total installed renewable power generation capacity (in gigawatts) |
| HE |
Health |
Mortality from PM2.5 and ozone (0 or higher per 1,000,000 inhabitants) |
Diseases like respiratory issues, cardiovascular, allergies, impaired lung
function, and allergic reactions, caused by pollutants |
| PU |
Green Public Policies |
Environment-related tax percentage (0-100%) |
| Finance amount for innovation in eco-friendly technology |
| PM |
Pollutants |
Fine particulate Matter - PM2.5 (Micrograms per cubic meter) |
| Coarse Particulate Matter - PM10 (Micrograms per cubic meter) |
| EC |
Economy |
Gross Domestic Product - GDP (USD) |
| Gross National Product - GNP (USD) |
Table 3.
IDRM in the illustrative example.
Table 3.
IDRM in the illustrative example.
| |
EN |
HE |
PU |
PM |
EC |
| EN |
0 |
5 |
0 |
5 |
2 |
| HE |
0 |
0 |
0 |
0 |
0 |
| PU |
5 |
0 |
0 |
5 |
0 |
| PM |
0 |
5 |
0 |
0 |
0 |
| EC |
3 |
0 |
0 |
0 |
0 |
Table 4.
Normalized reachability matrix, denoted by N.
Table 4.
Normalized reachability matrix, denoted by N.
| |
EN |
HE |
PU |
PM |
EC |
| EN |
0 |
0.42 |
0 |
0.42 |
0.17 |
| HE |
0 |
0 |
0 |
0 |
0 |
| PU |
0.42 |
0 |
0 |
0.42 |
0 |
| PM |
0 |
0.42 |
0 |
0 |
0 |
| EC |
0.25 |
0 |
0 |
0 |
0 |
Table 5.
, the matrix of indirect influences.
Table 5.
, the matrix of indirect influences.
| |
EN |
HE |
PU |
PM |
EC |
| EN |
0.04 |
0.20 |
0 |
0.02 |
0.01 |
| HE |
0 |
0 |
0 |
0 |
0 |
| PU |
0.02 |
0.43 |
0 |
0.18 |
0.07 |
| PM |
0 |
0 |
0 |
0 |
0 |
| EC |
0.01 |
0.15 |
0 |
0.11 |
0.04 |
Table 6.
, the matrix of total influences.
Table 6.
, the matrix of total influences.
| |
EN |
HE |
PU |
PM |
EC |
| EN |
0.04 |
0.62 |
0 |
0.43 |
0.17 |
| HE |
0 |
0 |
0 |
0 |
0 |
| PU |
0.43 |
0.43 |
0 |
0.60 |
0.07 |
| PM |
0 |
0.42 |
0 |
0 |
0 |
| EC |
0.26 |
0.15 |
0 |
0.11 |
0.04 |
Table 7.
| |
EN |
HE |
PU |
PM |
EC |
| EN |
0 |
1 |
0 |
1 |
1 |
| HE |
0 |
0 |
0 |
0 |
0 |
| PU |
1 |
1 |
0 |
1 |
0 |
| PM |
0 |
1 |
0 |
0 |
0 |
| EC |
1 |
1 |
0 |
0 |
0 |
Table 8.
Initial matrix of ISM.
Table 8.
Initial matrix of ISM.
| |
EN |
HE |
PU |
PM |
EC |
| EN |
0 |
1 |
0 |
1 |
1 |
| HE |
0 |
0 |
0 |
0 |
0 |
| PU |
1 |
0 |
0 |
1 |
0 |
| PM |
0 |
1 |
0 |
0 |
0 |
| EC |
1 |
0 |
0 |
0 |
0 |
Table 9.
Final matrix in ISM.
Table 9.
Final matrix in ISM.
| |
EN |
HE |
PU |
PM |
EC |
| EN |
1 |
1 |
0 |
1 |
1 |
| HE |
0 |
1 |
0 |
0 |
0 |
| PU |
1 |
1 |
1 |
1 |
1 |
| PM |
0 |
1 |
0 |
1 |
0 |
| EC |
1 |
1 |
0 |
1 |
1 |
Table 10.
Dependence and effect of each system.
Table 10.
Dependence and effect of each system.
| |
Dependence |
Effect |
| EN |
3 |
4 |
| HE |
5 |
1 |
| PU |
1 |
5 |
| PM |
4 |
2 |
| EC |
3 |
4 |
Table 11.
The sets of antecedent, reachable and intersection in the first stage of forming level.
Table 11.
The sets of antecedent, reachable and intersection in the first stage of forming level.
| |
Antecedent set |
Reachable set |
Intersection set |
| EN |
EN, PU, EC |
EN, HE, PM, EC |
EN, EC |
| HE |
EN, HE, PU, PM, EC |
HE |
HE |
| PU |
PU |
EN, HE, PU, PM, EC |
PU |
| PM |
EN, PU, PM, EC |
HE, PM |
PM |
| EC |
EN, PU, EC |
EN, HE, PM, EC |
EN, EC |
Table 12.
The revised matrix after the first stage.
Table 12.
The revised matrix after the first stage.
| |
EN |
PU |
PM |
EC |
| EN |
1 |
0 |
1 |
1 |
| PU |
1 |
1 |
1 |
1 |
| PM |
0 |
0 |
1 |
0 |
| EC |
1 |
0 |
1 |
1 |
Table 13.
The sets of antecedent, reachable, and intersection in the second stage of forming levels.
Table 13.
The sets of antecedent, reachable, and intersection in the second stage of forming levels.
| |
Antecedent set |
Reachable set |
Intersection set |
| EN |
EN, PU, EC |
EN, PM, EC |
EN, EC |
| PU |
PU |
EN, PU, PM, EC |
PU |
| PM |
EN, PU, PM, EC |
PM |
PM |
| EC |
EN, PU, EC |
EN, PM, EC |
EN, EC |
Table 14.
The revised matrix after the second stage.
Table 14.
The revised matrix after the second stage.
| |
EN |
PU |
EC |
| EN |
1 |
0 |
1 |
| PU |
1 |
1 |
1 |
| EC |
1 |
0 |
1 |
Table 15.
The sets of antecedent, reachable and intersection in the third stage of forming levels.
Table 15.
The sets of antecedent, reachable and intersection in the third stage of forming levels.
| |
Antecedent set |
Reachable set |
Intersection set |
| EN |
EN, PU, EC |
EN, EC |
EN, EC |
| PU |
PU |
EN, PU, EC |
PU |
| EC |
EN, PU, EC |
EN, EC |
EN, EC |
