1. Introduction
Living walls (LWs) are modern vertical greenery systems essential for increasing the city's green space. They have the advantage that they can be used anywhere and bring about the well-known positive effects of urban greenery. These effects include, for example, cooling and improving air quality, and promoting biodiversity, aesthetics, psychological well-being, and energy-saving through building insulation [
1,
2,
3,
4,
5].
Unlike a traditional ground-based system, LW is a new, wall-based system for vertical greening of facades that does not require a ground connection [
4,
5]. This is particularly advantageous since a ground connection is often impossible in dense urban environments. If no soil connection is possible, the plants are supplied with water and nutrients directly on the wall [
3,
4,
5]. There are several LW configurations that, in principle, allow adaptation to the building, environmental conditions, and goals of greening [
3].
The "vertical green industry" highlighted the cooling potential of LWs in the urban environment in the context of climate change consequences and the urban heat island effect.
Further, researchers have suggested the use of LWs to increase urban greenery and cool the ambient temperature [
1,
6]. Studies have discussed the cooling potential of LWs and the building insulation that LWs can provide. This article is about the cooling effect of LW in an urban space, i.e., an urban environment or street space.
While some studies describe the cooling potential of vertical greenery, it is not yet clear how an LW needs to be configured to achieve a great cooling effect.
Previous studies on the cooling effect of ground-based facade greening show the following values: 2-20 °C [
7], up to 30 °C [
8], 1.7 °C [
9], and 2 °C (depending on exposure) [
10]. Previous studies on TA reductions due to LWs were summarized by Besir and Cuce [
6] and Brune et al. [
11] and included, for example, 4.5 °C [
12], 1.9-8.3 °C [
13], 12-20 °C [
14], 1-10.94 °C [
15], and 5 °C [
16]. A decrease in wall surface temperature between 3.33 °C and 11.58 °C was found in different studies and summarized in [
1].
These values were collected in different climates, systems, and experimental designs. While it is clear that climate influences cooling potential [
6], it is often not specified which plants were planted in LWs [
13,
14,
17,
18]. In the study by Cameron et al. [
19], the reduction in TA was described for individual plant species:
Stachys byzantina, 7.6 °C;
Hedera helix, 7.3 °C;
Lonicera 'Gold Flame', 5.5 °C;
Fuchsia 'Lady Boothby', 5.5 °C;
Jasminum officinale 'Clotted Cream', 4.3 °C, and
Prunus laurocerasus, 6.3 °C. In addition, the cooling effect depends on the plants' vitality and the degree of cover [
13,
18]. It is also crucial at what distance from the vegetation the temperature is measured [
15,
17].
In a study by Žuvela-Aloise et al. [
20], several simulations were performed on the cooling effect due to green and blue infrastructure. It became clear that the transpiration cooling effect depends on many location-dependent factors (such as the built environment or wind characteristics). This dependency confirmed the findings from other studies (summarized in [
6,
11,
20]).
Alexandri and Jones [
21] simulated the temperature in greened/ungreened streets using the solar radiation, TA, relative humidity, and wind speed (min, max, average) of nine different cities by measuring the hydrothermal properties of the following materials: concrete, soil, asphalt, and vegetation. Depending on these initial values, a temperature reduction due to facades and green roofs was always observed in the model. In the course of the day, the highest temperature reduction was observed between 2 and 8 p.m. [
21]. Depending on the city, they observed maximum temperature reduction of 2.5 to 5 °C for facade greening [
21].
Different factors of a vertical greenery system result in a lower environmental temperature. Evapotranspiration is crucial for the cooling effect. We distinguish between transpiration and evaporation. Transpiration means the departure of water from the stomata of the plant leaves during photosynthesis. Evaporation describes the process of water departing the substrate to enter the environment.
We can differentiate three factors that influence the cooling effect:
(1) plants, plant shading, and transpiration [
6,
11,
20]. These factors are influenced by solar radiation and, thus, exposure [
22].
Plant selection and vitality are critical to evapotranspiration performance [
6,
22,
23]. Plants should be well irrigated when their transpiration only functions if they have no (dry) stress. Only then are the stomata fully open, which requires transpiration [
22]. Plants with a high transpiration rate cool the temperature more than others [
6]. However, the LW practice uses established and drought stress-resistant species (e.g., Heuchera) or creates systems that are as low-maintenance, robust, and low-water intensive as possible. These species mostly have a low transpiration rate.
Furthermore, the leaf canopy characteristic is important: plants' biomass, plant stage development, leaf thickness, leaf color (albedo), and leaf area also affect their cooling properties [
6,
22,
24].
There are few published scientific results on plants in LWs [
2,
4,
25]. Previous studies have been from different climates and have examined only a few LW systems and plant species.
(2) Technical configuration affects cooling performance. In addition to the plant, the substrate surface produces evaporation cooling; i.e., substrate amount and type have an influence [
6]. The size of the rhizosphere, moisture of the substrate, and, thus, the irrigation (specifically, the amount and frequency of watering) are essential to a plant’s cooling performance [
24].
(3) The environment, including local and microclimate, exposure, wind speed, humidity, solar radiation, and temperature, influences the cooling effect of plants [
6,
24]. The dependency of many site factors is summarized in [
6,
11,
20].
Based on the current state of knowledge, the statements on temperature-reducing effects do not allow any differentiated conclusions to be attributed to the different characteristics of an LW, e.g., plant selection, irrigation, or environment. Research is needed to quantify the air cooling of LWs [
5,
7,
26]. In addition, there is a lack of direct translation of results from experimental studies to urban environments.
As Koch [
22] stated, to describe the energy-saving effect of LWs, most previous studies focused on the thermal effect of an LW on the building. In contrast, only a few studies examined the impact on the local climate and microclimate [
22] or the temperature in the vegetation stock.
The main aim of our study, started in 2017, was to describe how we could measure temperature in LWs, to determine which factors influence temperature and its measurement, what conditions plants have to deal with in an LW, and which cooling effect an LW could provide.
2. Materials and Methods
We have already published parts of this research project in various ways, including two articles with practical advice in German [
27,
28], an overview of the visual impression of all planting variants [
29], and detailed elaborations about both the seeding variants [
30] and the planting variants [
31].
In this paper, we would like to present how we measured the temperature in our LW experiment.
Experimental setup
At the Hochschule Geisenheim University, in Geisenheim (49° 59′ 11.161″ N 7° 58′ 0.099″ E.), we built experimental walls exposed to the north, south, east, and west, respectively (
Figure 1). We tested a new LW system at different expositions from 2017 to 2019. The LW system (a vegetation mat) consisted of a polyester-textile material (Sächsisches Textilforschungsinstitut e.V., Chemnitz, Germany) and had no substratum [
28]. An automatically closed irrigation system was installed for the watering and nutrition of the plants. We tested different plant species and created three different plant categories—"Ground cover", "Cascade", and "Meadow" (here we placed seeds in the substrate)—and used a control without planting. Spontaneous vegetation (from random weeds, mostly moss and plants from the other variants) established itself in the Control and the Cascade areas. The plant variants were repeated four times.
Temperature measurement
Between 2017 and 2019, we carried out various temperature measurements (
Table 1). We documented the TA [°C], radiation [W/m²], humidity [%], and precipitation [mm] near our experimental walls with a weather station (field) (
Figure 1). The climate of the experimental location is classified as a temperate oceanic climate. We measured the temperature [°C] at different mat positions, plants, exposures, seasons, and in front of or behind the LW. Therefore, measurement instruments were arranged in different experimental setups (
Table 1).
We used radiation unprotected sensors: plastic sheathed 10k thermistor, (SKTS 200/U, UP Umweltanalytische Produkte GmbH Bockradener Strasse 52b, 49477 Ibbenbüren, Germany) and metallic sleeve Thermokon cable temperature sensor T14, (Elektro- und Automatisierungsanlagen Pierre Ambrozy, Schmiedestrasse 14, 06466 Gatersleben, Germany) for temperature measurement. We create radiation protection (open plant pot covered with aluminum foil (alu pot)) for the temperature sensors (
Table 1, measurement: 6).
The temperature sensors logged the data every 5 minutes. We calculated the mean of 15 minutes (n=3) and adapted the data on the weather data, which were recorded every 15 minutes.
Radiation-protected TA and humidity were determined via psychrometer (KE-PTFF-8024, NTC sensor, Elektro- und Automatisierungsanlagen Pierre Ambrozy, Schmiedestrasse 14, 06466 Gatersleben, Germany).
For thermal imaging, we used an InfRec R500EX-Pro IR camera from Nippon Avionics Co. Ltd with the InfReC Analyzer NS9500 software (Eichleite 13b, 82031 Grünwald München, Germany).
We installed the following weather stations at the experimental walls (east and west): Compact WSC11 (Adolf Thies GmbH & Co. KG, Hauptstrasse 76, 37083 Göttingen, Germany). These data were compared to the data of the field weather station (
Figure 1).
3. Results and Brief Information Regarding the Setup
3.1. First Try: Temperature Measurement
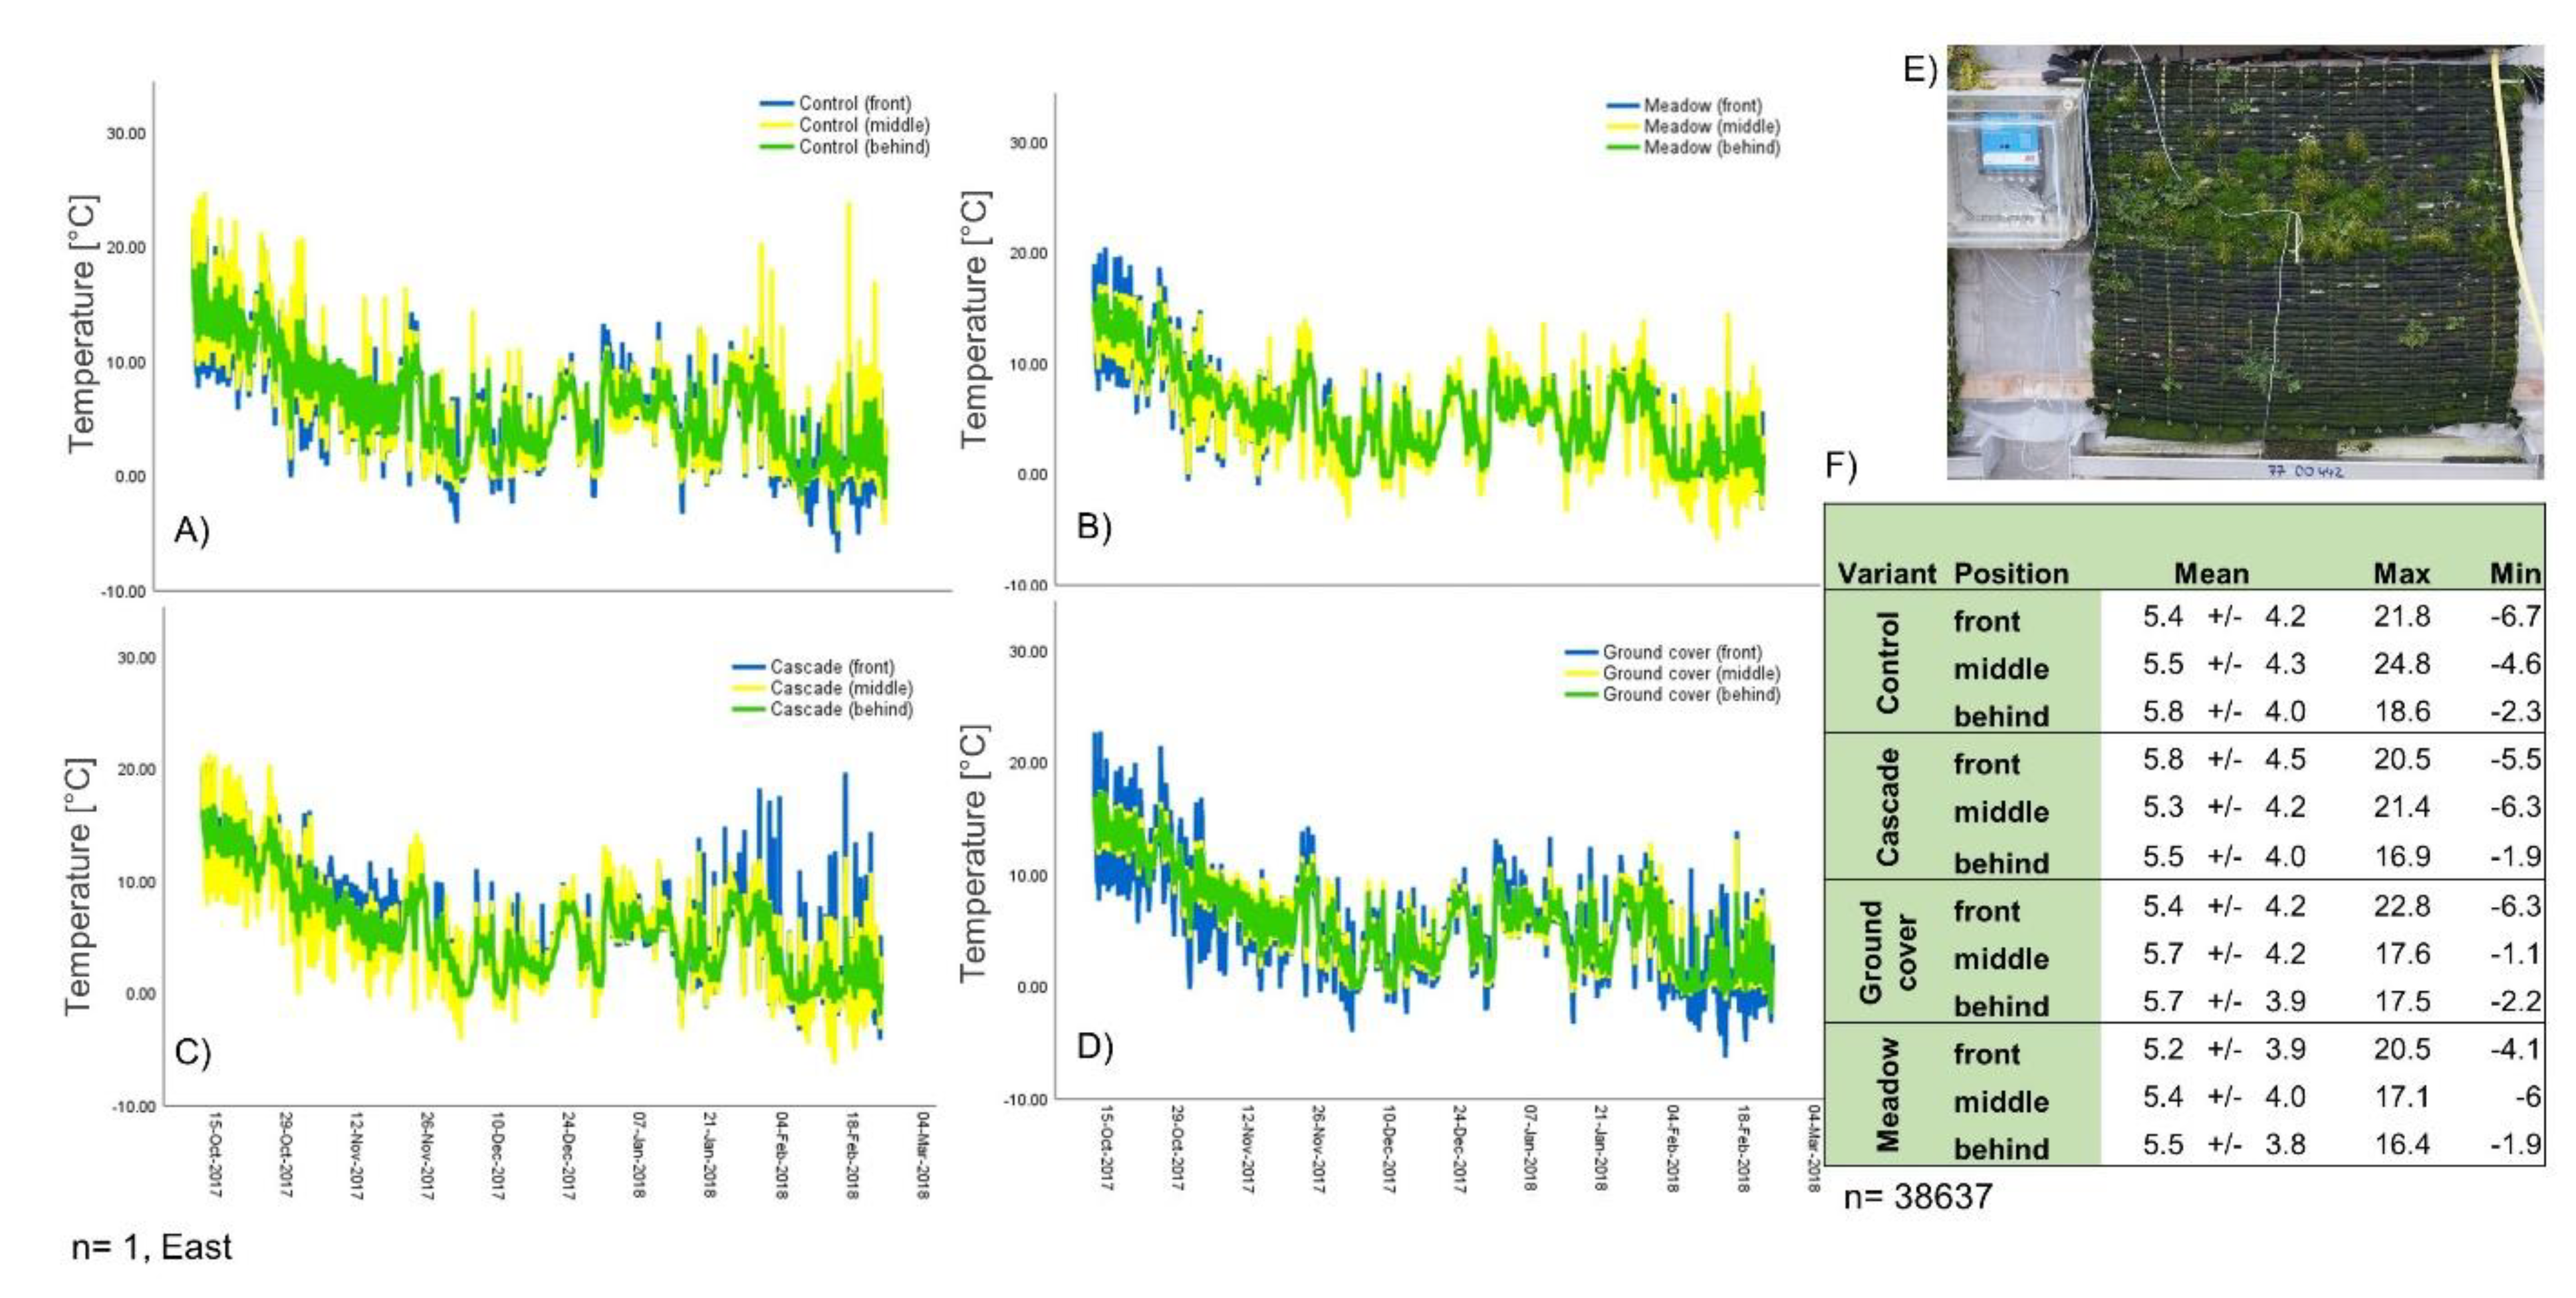
In our first measurement, from October 2017 to February 2018, we aimed to determine if there were differences between the planting variants and positions in, behind, and in front of the mat.
Our findings revealed that the Control showed the highest differences between positions, whereas the Cascade and Meadow exhibited less variation between positions (Figure 2 A-C). For Ground cover, we observed similar temperatures between the middle and behind positions, while the front position had either the lower or higher temperatures, depending on the time of day (Figure 2 D).
Regarding temperature trends over time, we found that temperature behind and in the middle of the plants remained similar for Control, Meadow, and Cascade. The temperature behind the plants was consistently lower than the middle temperature. Ground cover showed similar temperatures for both middle and behind positions.
Our results showed that the front temperature during the daytime was higher than the middle and behind temperatures for Control and Cascade. During the nighttime, the Control had lower front temperatures than at the behind and middle positions. For Ground cover, the front temperature was either higher or lower than the middle and behind temperatures.
Our analysis of the overall temperature patterns found that the mean values for all positions and plant variants were similar (
Figure 2 F). The maximum temperature recorded was around 20-22°C for all variants, except for the Control, which showed the highest maximum temperature of 24.8°C. The Cascade had a maximum temperature of 21.4°C, while both Ground cover and Meadow had a maximum temperature of around 17°C. We also observed a minimum temperature of -4 to -6°C for all variants in the front and middle positions, except for the Ground cover, which had a minimum temperature of -1°C in the middle position. The temperature behind the mat was consistent across all variants, with a minimum temperature of around -2°C.
3.2. Advanced Setup to Measure Differences between the Variants and Positions
Based on the findings from the first experiment, the experimental setup was optimized. We now wanted to compare data from a period with strongly increasing (April 2018) and decreasing temperatures (February 2019) (
Figure 3). Furthermore, the research question of whether there are differences between the variants and the measurement position was addressed.
We found few inter-variant differences and partial differences between the individual positions. We observed the highest diurnal temperature variations in the Control. This temperature variation was documented behind the mat compared (1) and (3) (
Figure 3).
In February, we observed the lowest temperatures inside the mat (1-into) for the Control, Seeding, and Ground cover may be due to frost. For Ground cover and the Control, the temperature measurements into (1) and back (2) showed similar values. For Cascade, we measured the same temperature at all positions, except for a drastic temperature increase measured at the beginning of the day. For Seeding, the temperatures were about the same at all positions. The front temperature (3) was partly higher.
In April, higher temperatures were measured overall. Here, a difference between the Control and the planting variants was noticeable. For Control, we documented similar values for 1-into and 3-front. For all plant variants, we analyzed an extreme temperature increase in the inner part of the vegetation layer (1-into) at the beginning of the day (from 6 to 9 a.m.). In April, we observed higher Tdiffs between the positions (front, back, into). In addition, we found the highest temperature at the front (3) most of the time. This position showed the highest diurnal differences.
3.3. Influence of the Amount of Biomass
We wanted to know if there was an influence on temperature due to the amount of biomass (
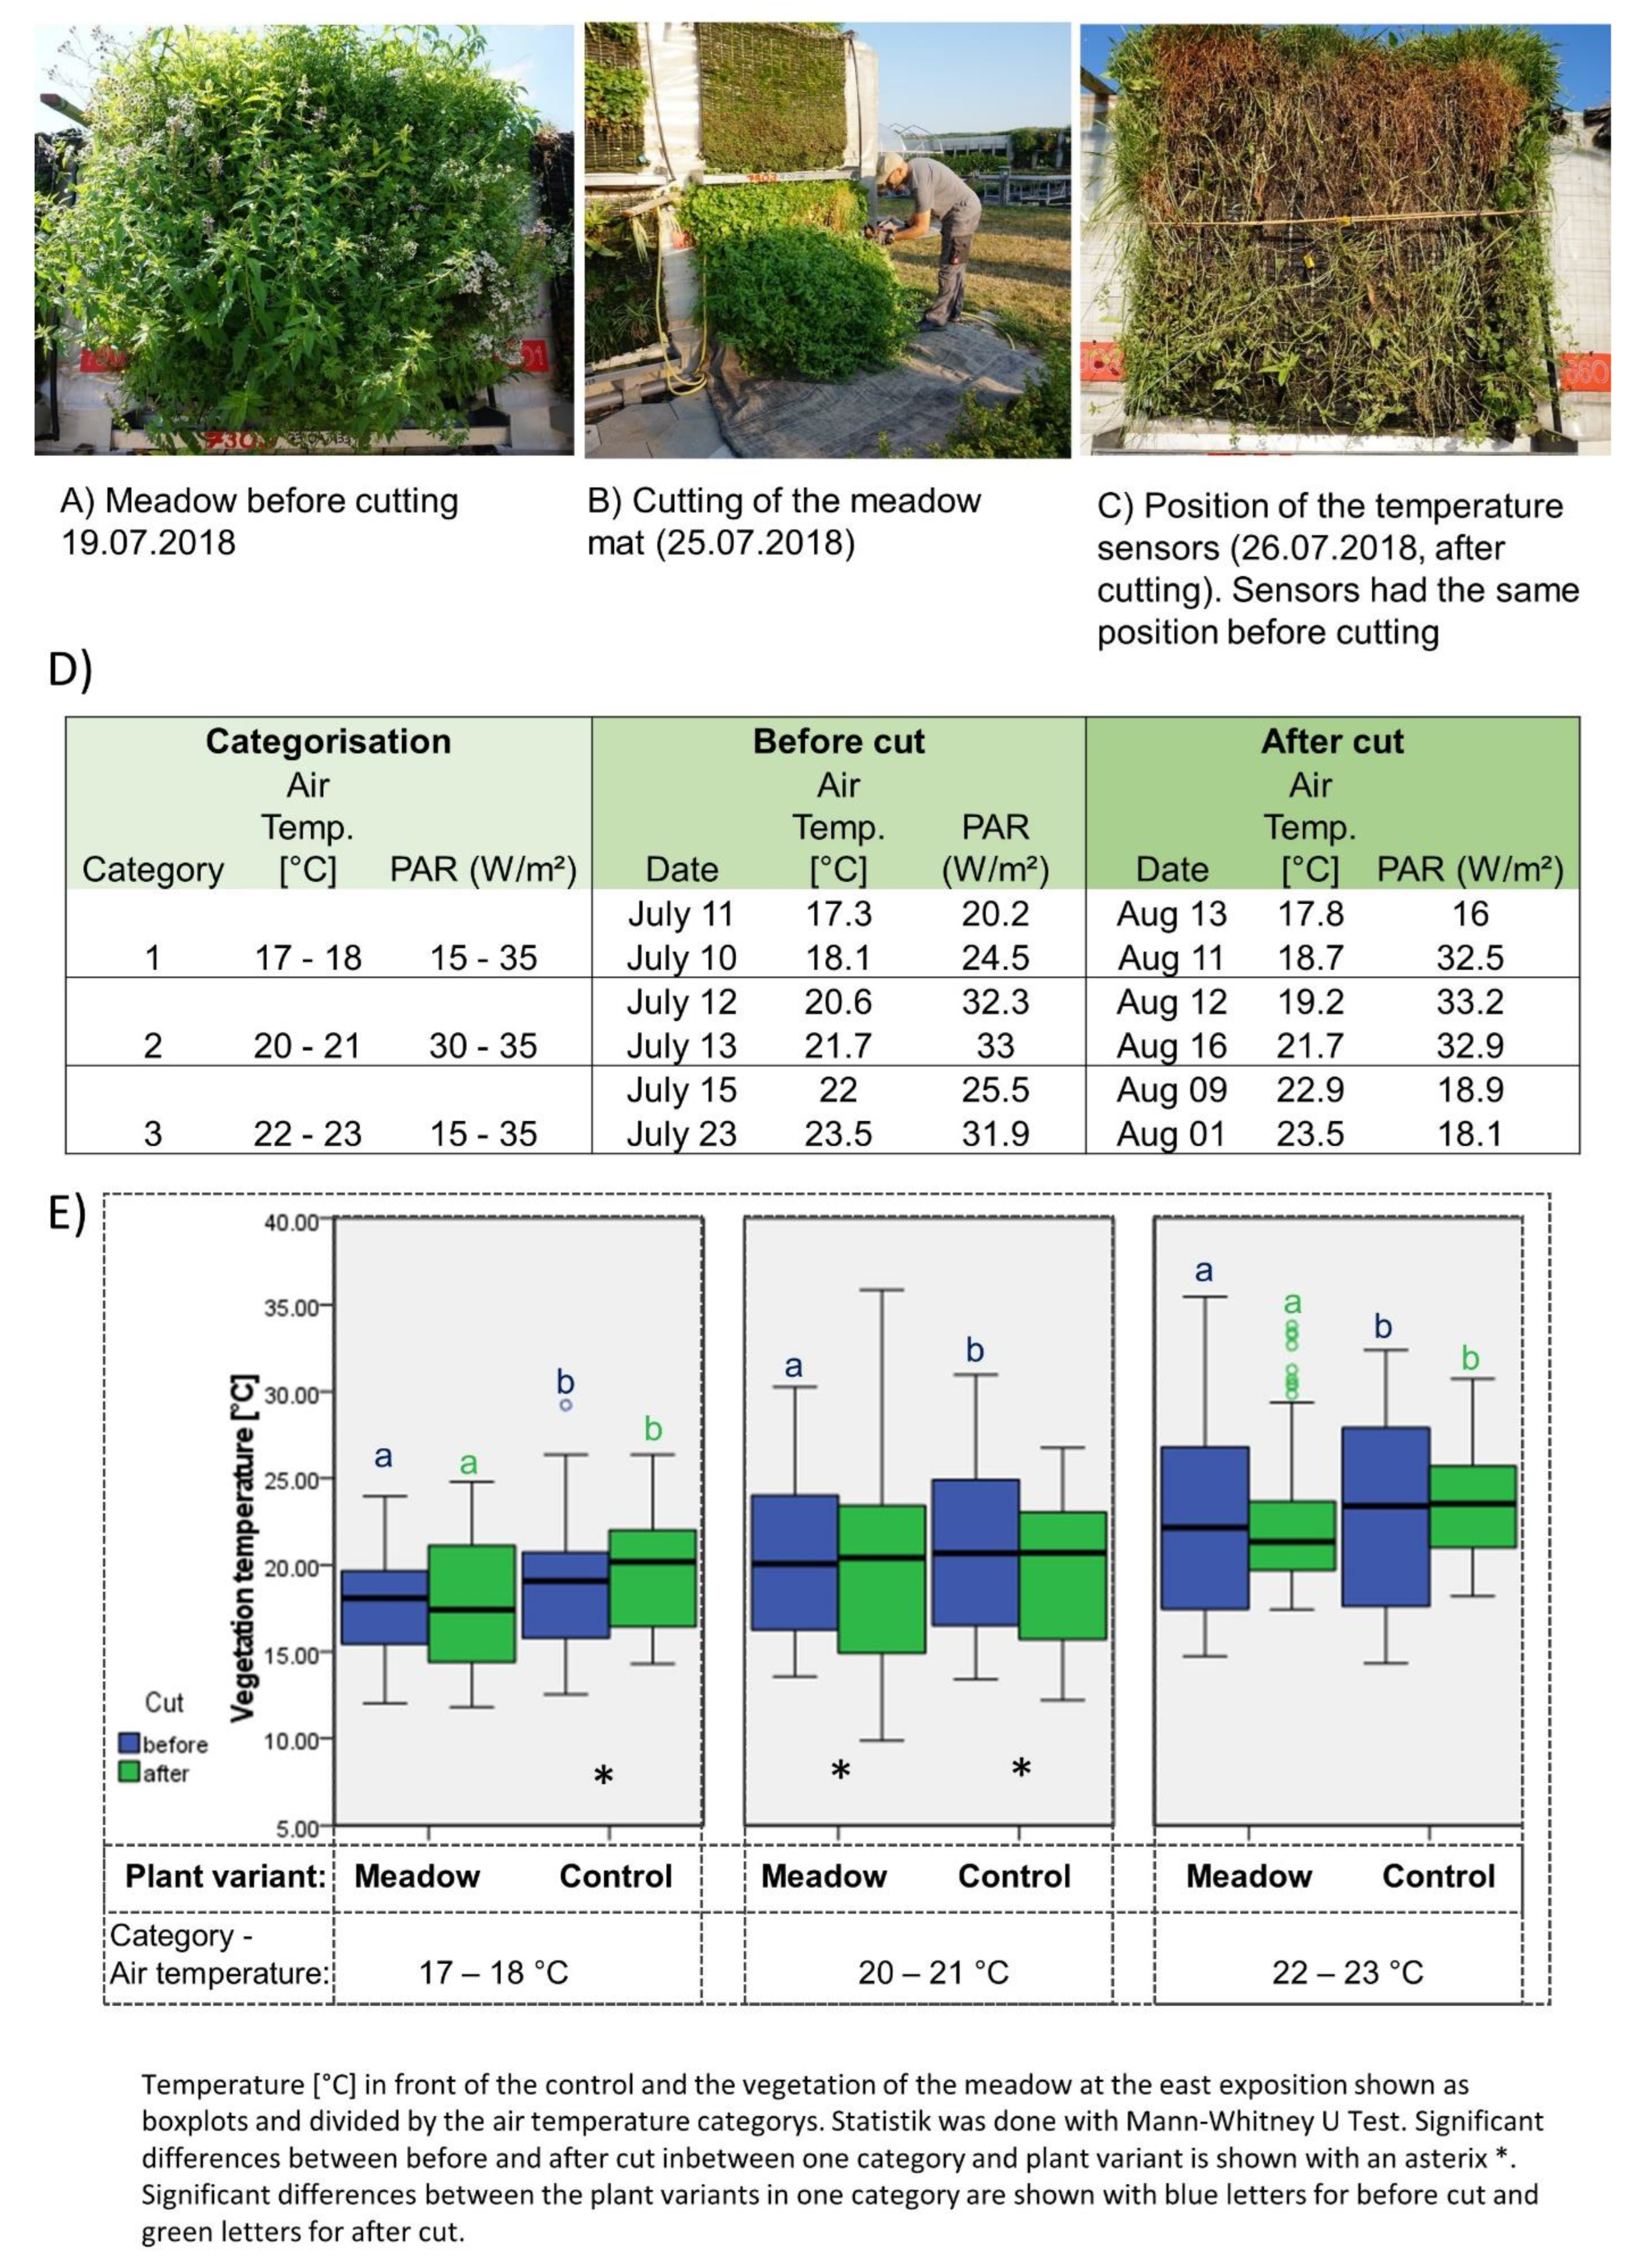
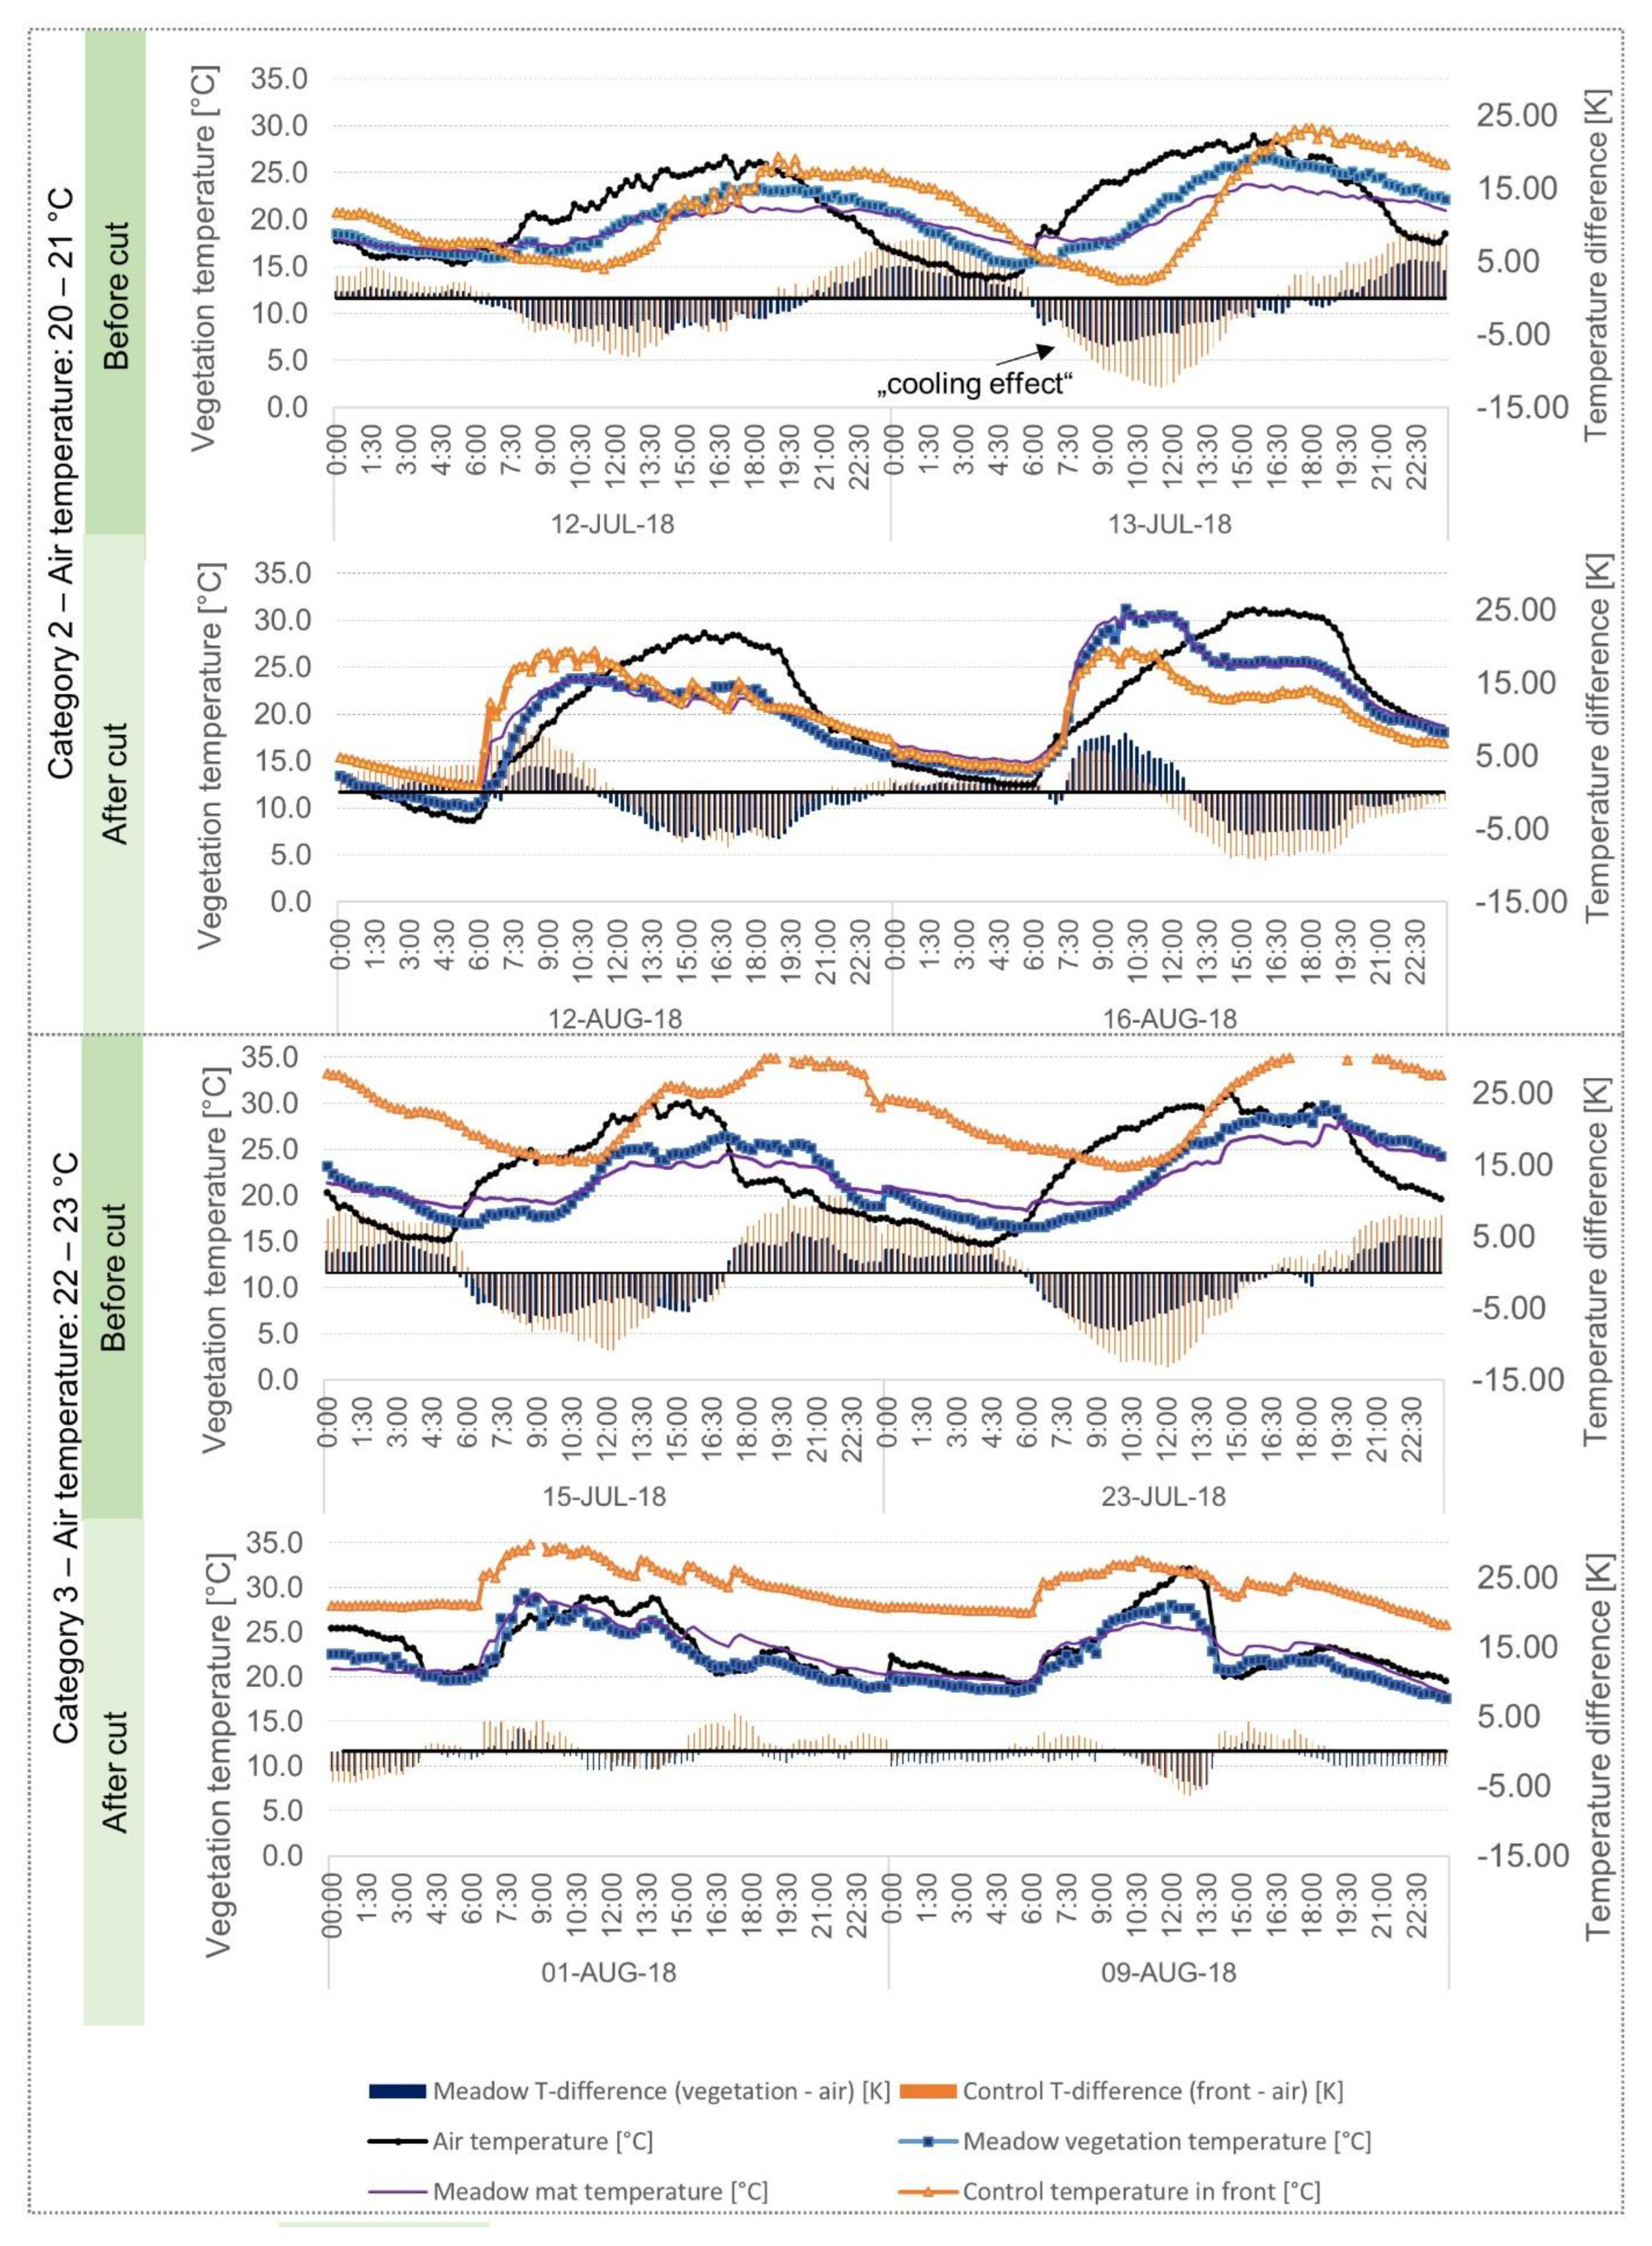
Table 2 and Suppl. 1). Therefore, we measured the temperature before and after cut of the Meadow and Control in July and August 2018. Data from before and after the cut were compared within temperature categories selected based on similar TA (Figure 4 to 5). In addition to the temperature, we measured the height, coverage, and biomass after the cut.
We observed similar results in all temperature categories before and after the cut (
Figure 4).
The temperature was significantly higher in Control compared to Meadow, but fewer differences were measured between the time before and after cutting. In Category 2 (20 - 21 °C), there were the most significant differences between before and after cutting for Meadow and Control (
Figure 4 E).
Overall, we can say that the TA was sometimes higher and sometimes lower compared to the TV (
Figure 5). We observed differences between categories and measurement points. Except for the days when the mean TA was between 17 and 18 °C (category 1), there were fewer differences between the variants.
In Category 2, the air, Control, and Meadow temperatures were similar. In Category 3, the Control temperature was significantly higher (up to 10°C).
In Categories 2 and 3, a cooling effect of vegetation was observed before cutting at daytime. At night, a higher temperature of Control and vegetation was observed compared to the TA.
After the cut, a lower difference or no difference was observed between the TA and TV for Category 3. Before cutting, Control temperature was significantly higher than all other temperatures measured, Category 2, and Category 3.
3.4. Temperature of the Single Plants
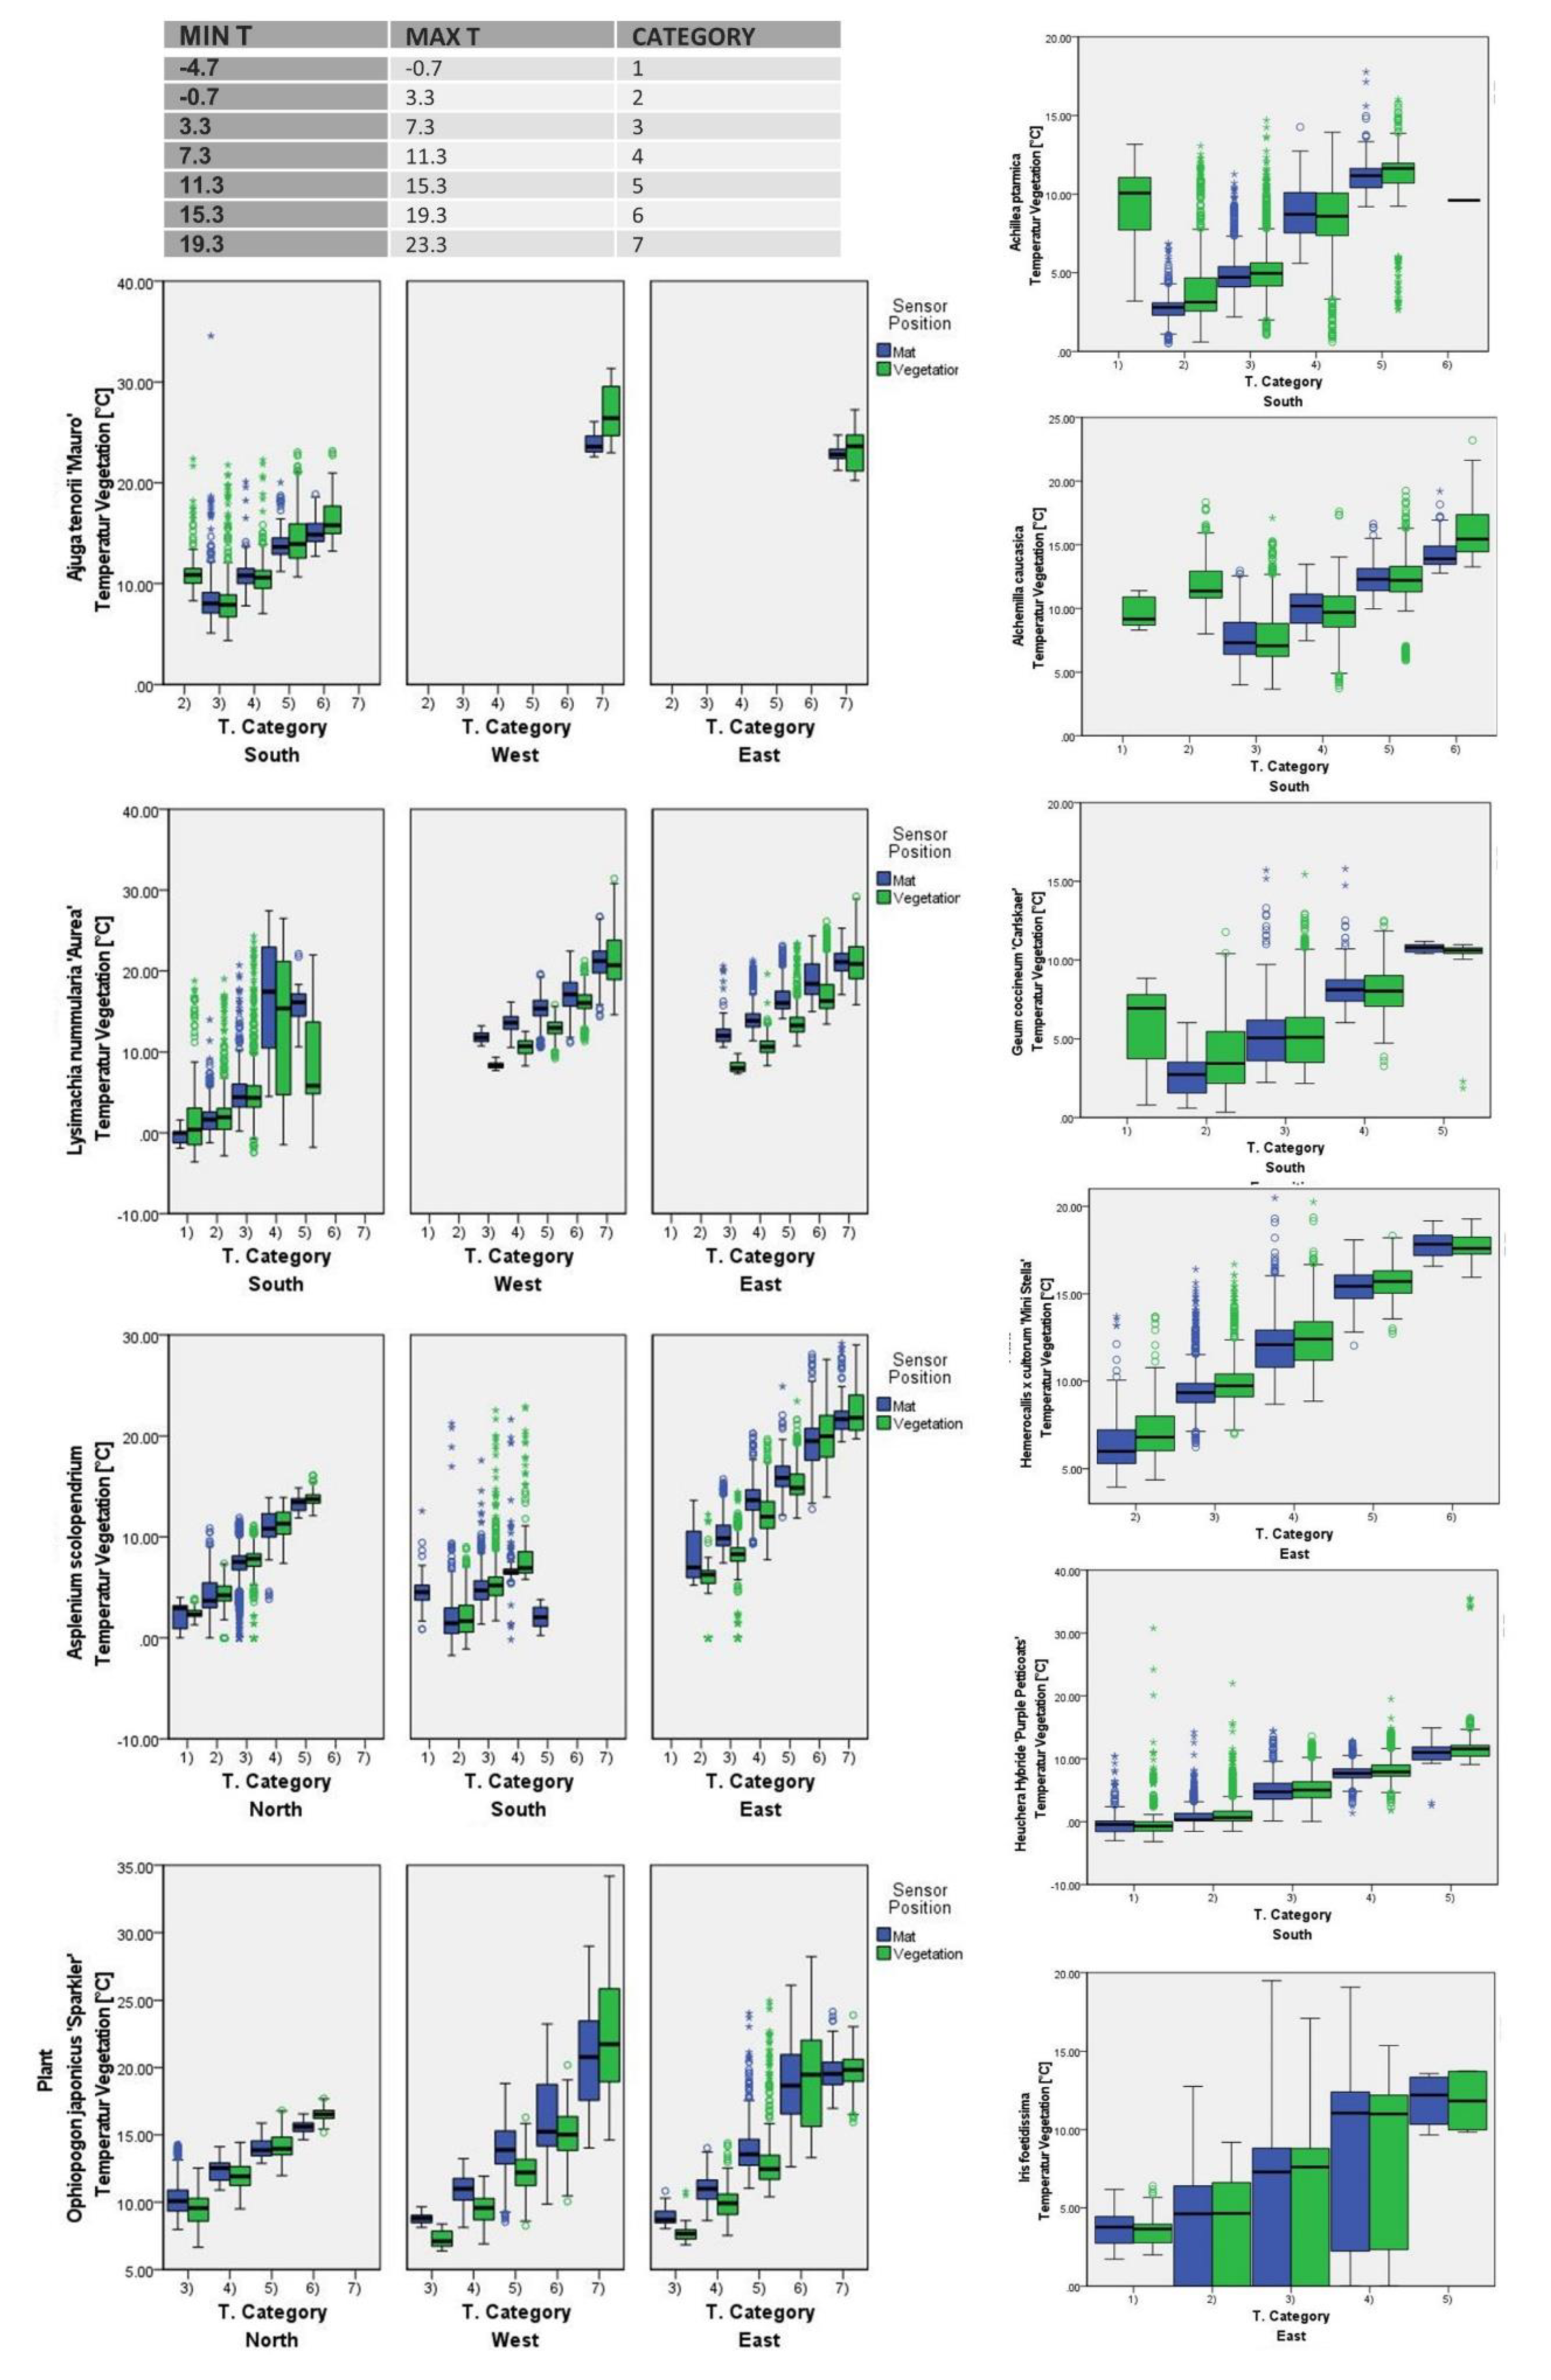
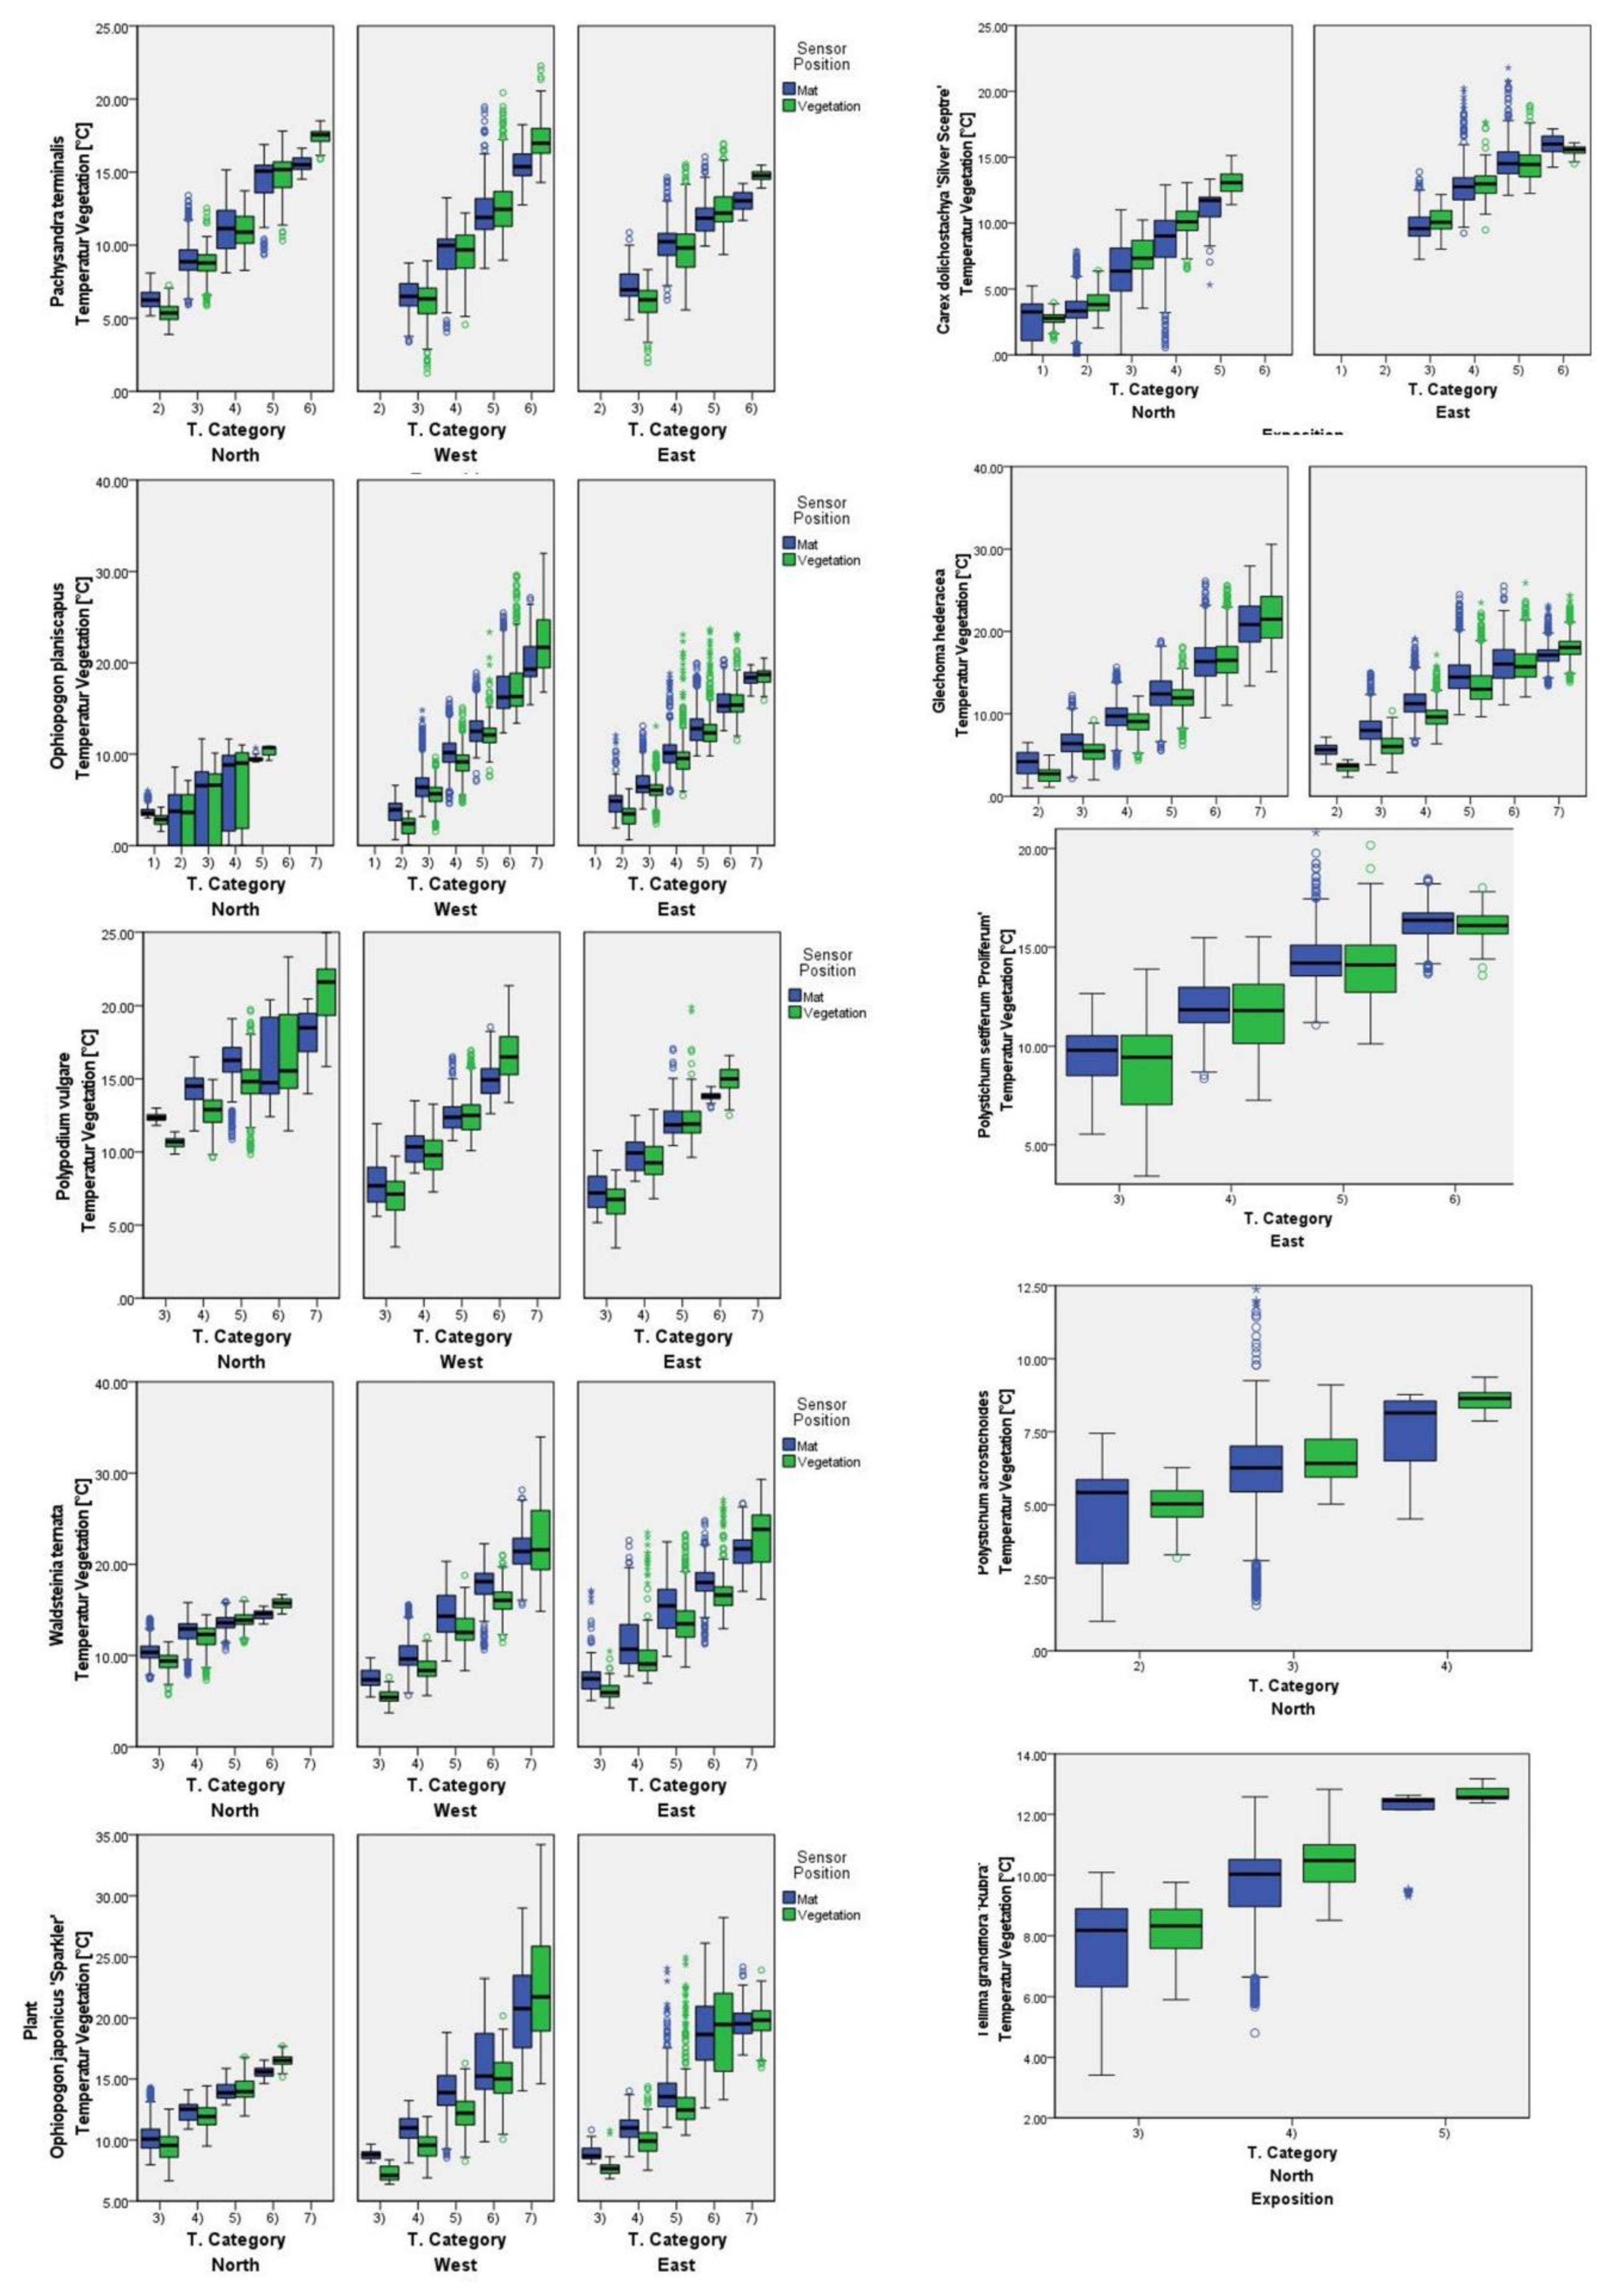
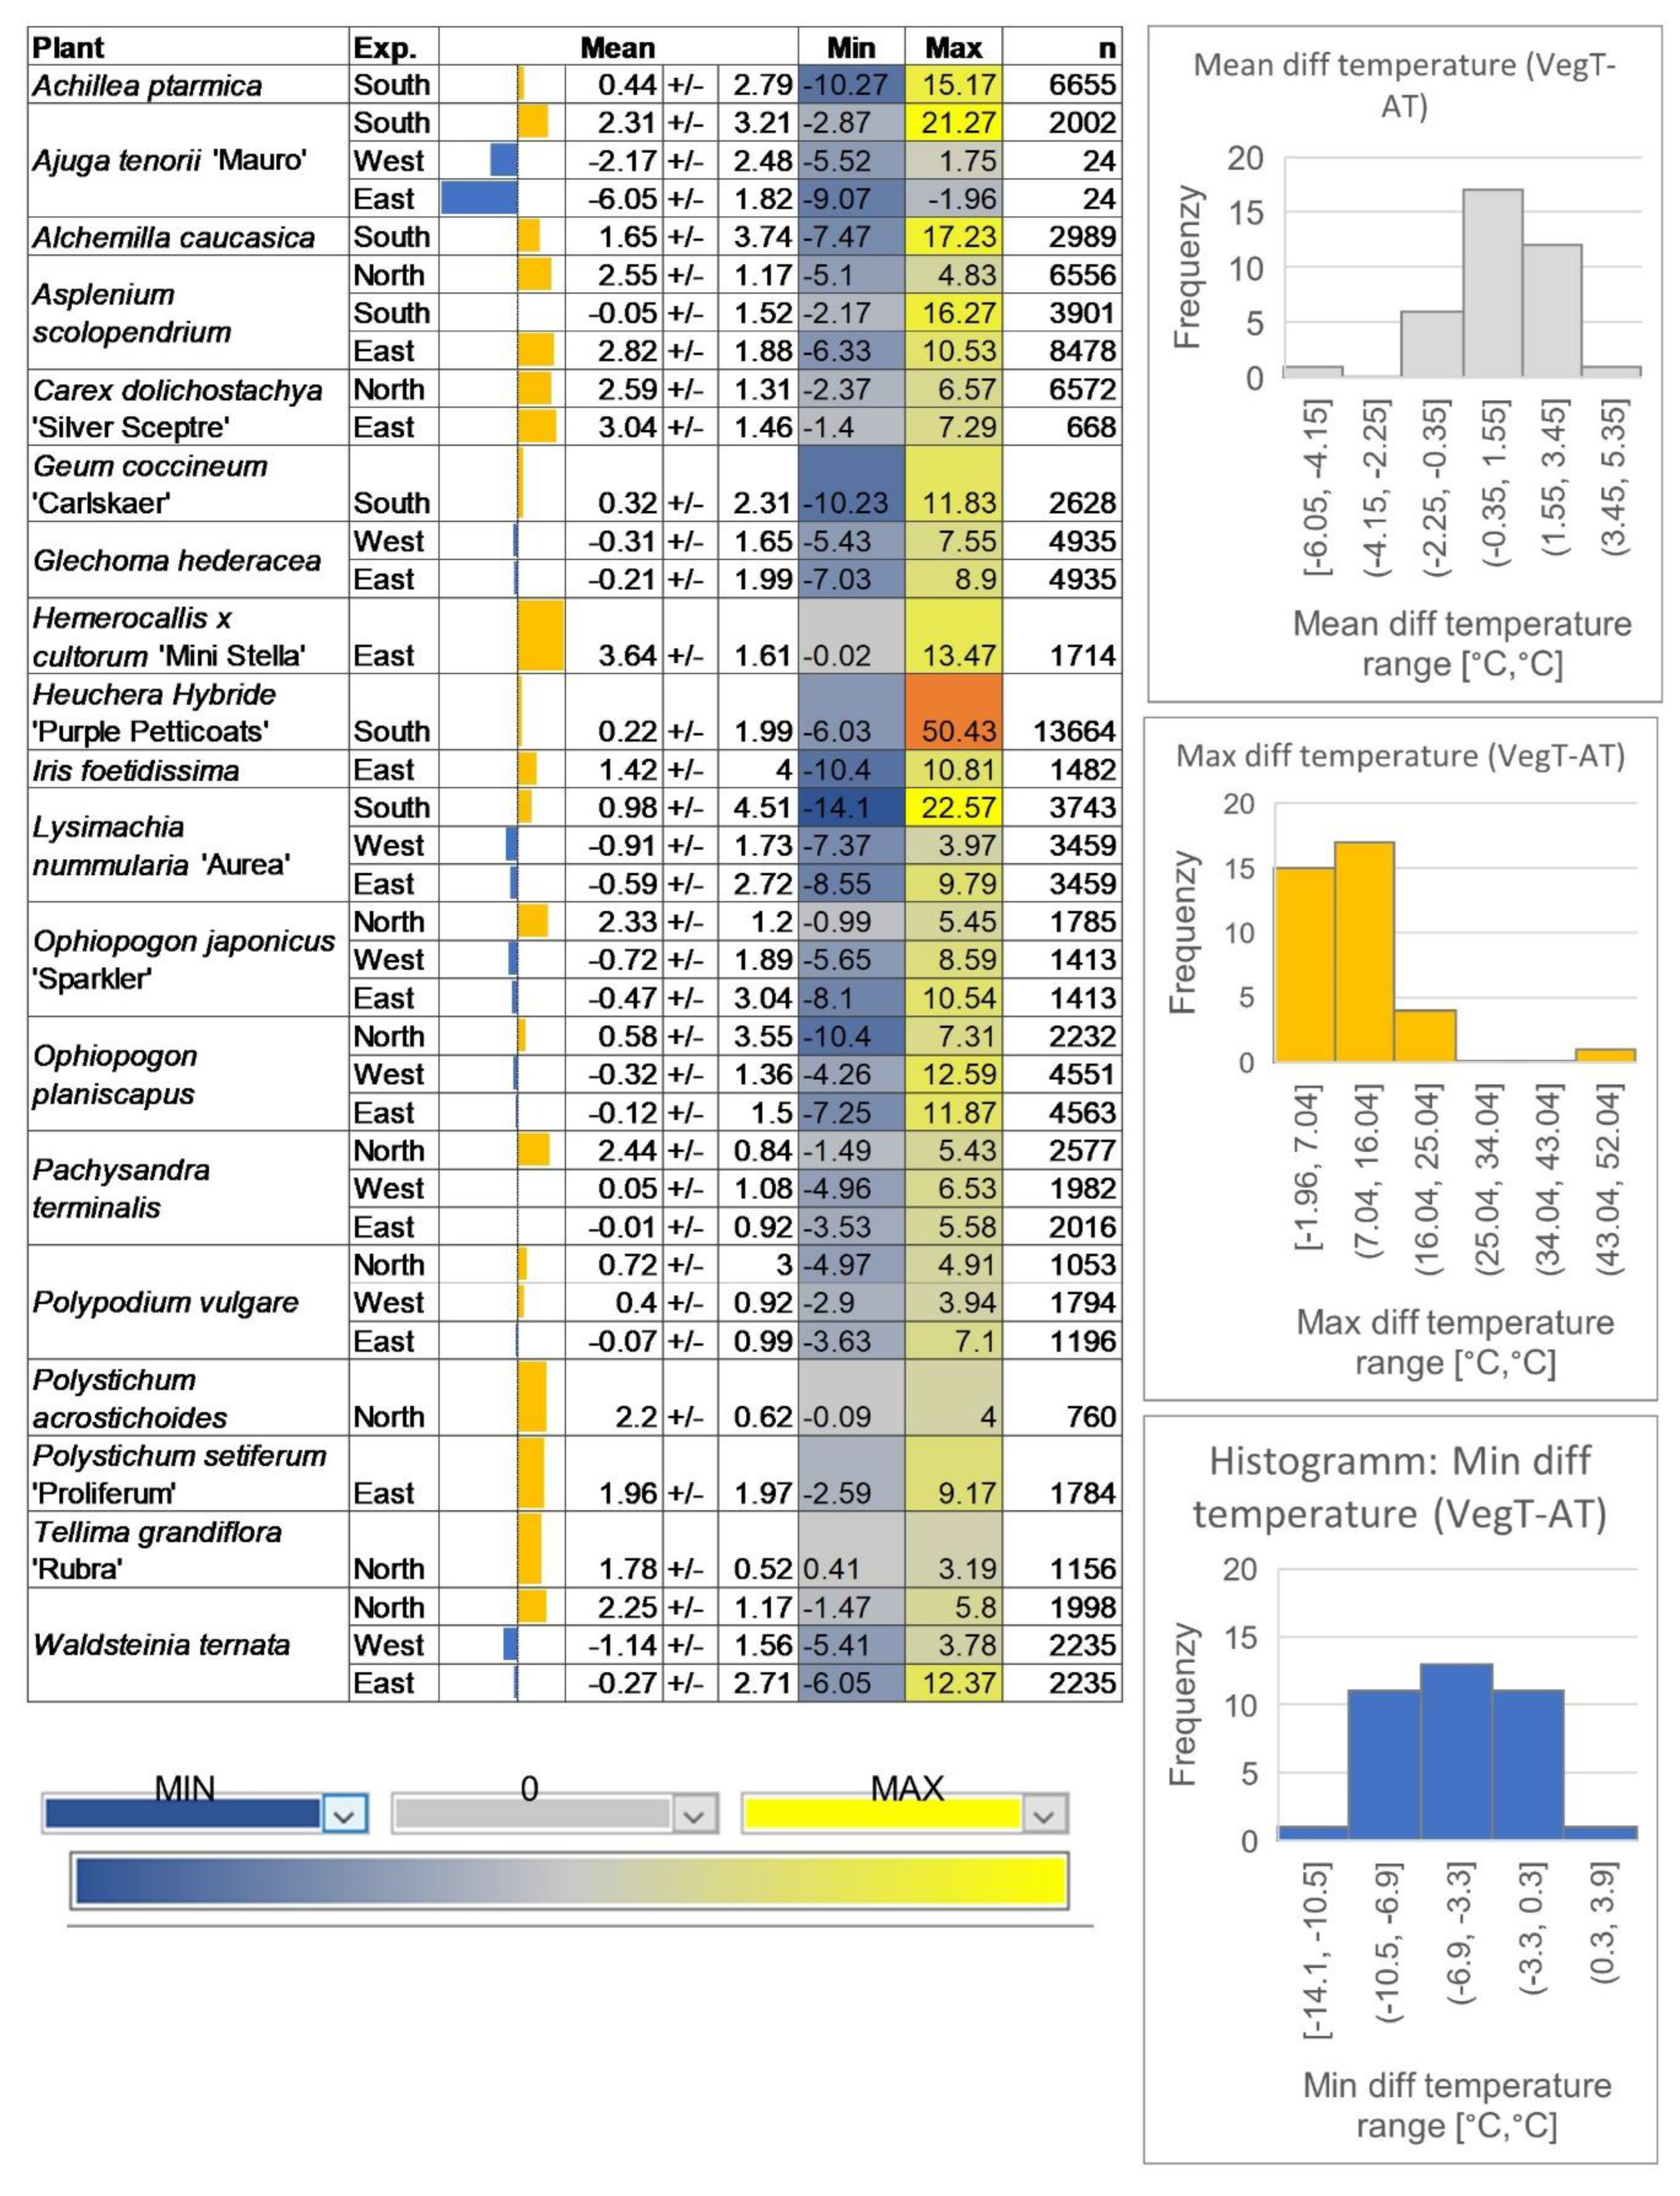
After we obtained information about the Meadow variant, we wanted to learn more about the single plants in the Cascade and Ground cover variant. To measure all single plants, we used the period between September 2018 and January 2019. We carried out the measurement in the vegetation and below into the mat. As we did not have enough sensors for all the plants, we changed the sensors after a time. Nevertheless, to achieve comparability between all species we categorized the TA (A1–2 and Suppl. 2–5) and compared the different plants only within one temperature category. In addition, we calculated the difference between air and TV.
We observed Tdiffs among plant species, measurement points (vegetation and mat), and expositions. Our results showed significant differences in temperature data between the factors mentioned above (Suppl. 5). We observed that the TV was generally in a similar range as the TA and temperature categories. Moreover, the TV increased with rising TA (boxplots). We found a wide distribution of temperature values throughout the day for air and vegetation (
Table 3). The TV exhibited a larger range of temperature values compared to TA (absolute difference between the minimum and maximum [K]). The range of values for the TV was between 9.8 K and 53.1 K, while that of the TA was between 6.7 K and 35.4 K. This indicated a more dynamic and larger temperature range for the TV.
Our analysis of Tdiff_V-A revealed that the TV was higher than the TA (
Figure 6). On average, across all investigated plant species, the TV was 0.6 K higher than the TA and, at maximum, 3.6 K higher. This effect was observed mainly during the day and rarely during the night, when the temperature of the vegetation was rarely cooler compared to the TA. We also observed significant differences between expositions and plant species (Suppl. 5).
Plant species from the Ground cover planting variant (
Ajuga tenorii, Lysimachia nummularia,
Waldsteinia ternata,
Figure 6) exhibited the lowest temperatures at the east- and west-facing walls. At the north- and south-facing walls, the vegetation had higher temperatures. Among the Cascade variant (plant species:
Asplenium scolopendrium, Carex doliostachya, and
Hemerocallis X cultorum,
Figure 6), we measured the highest TV at the east-facing wall.
3.5. Differences within One Mat
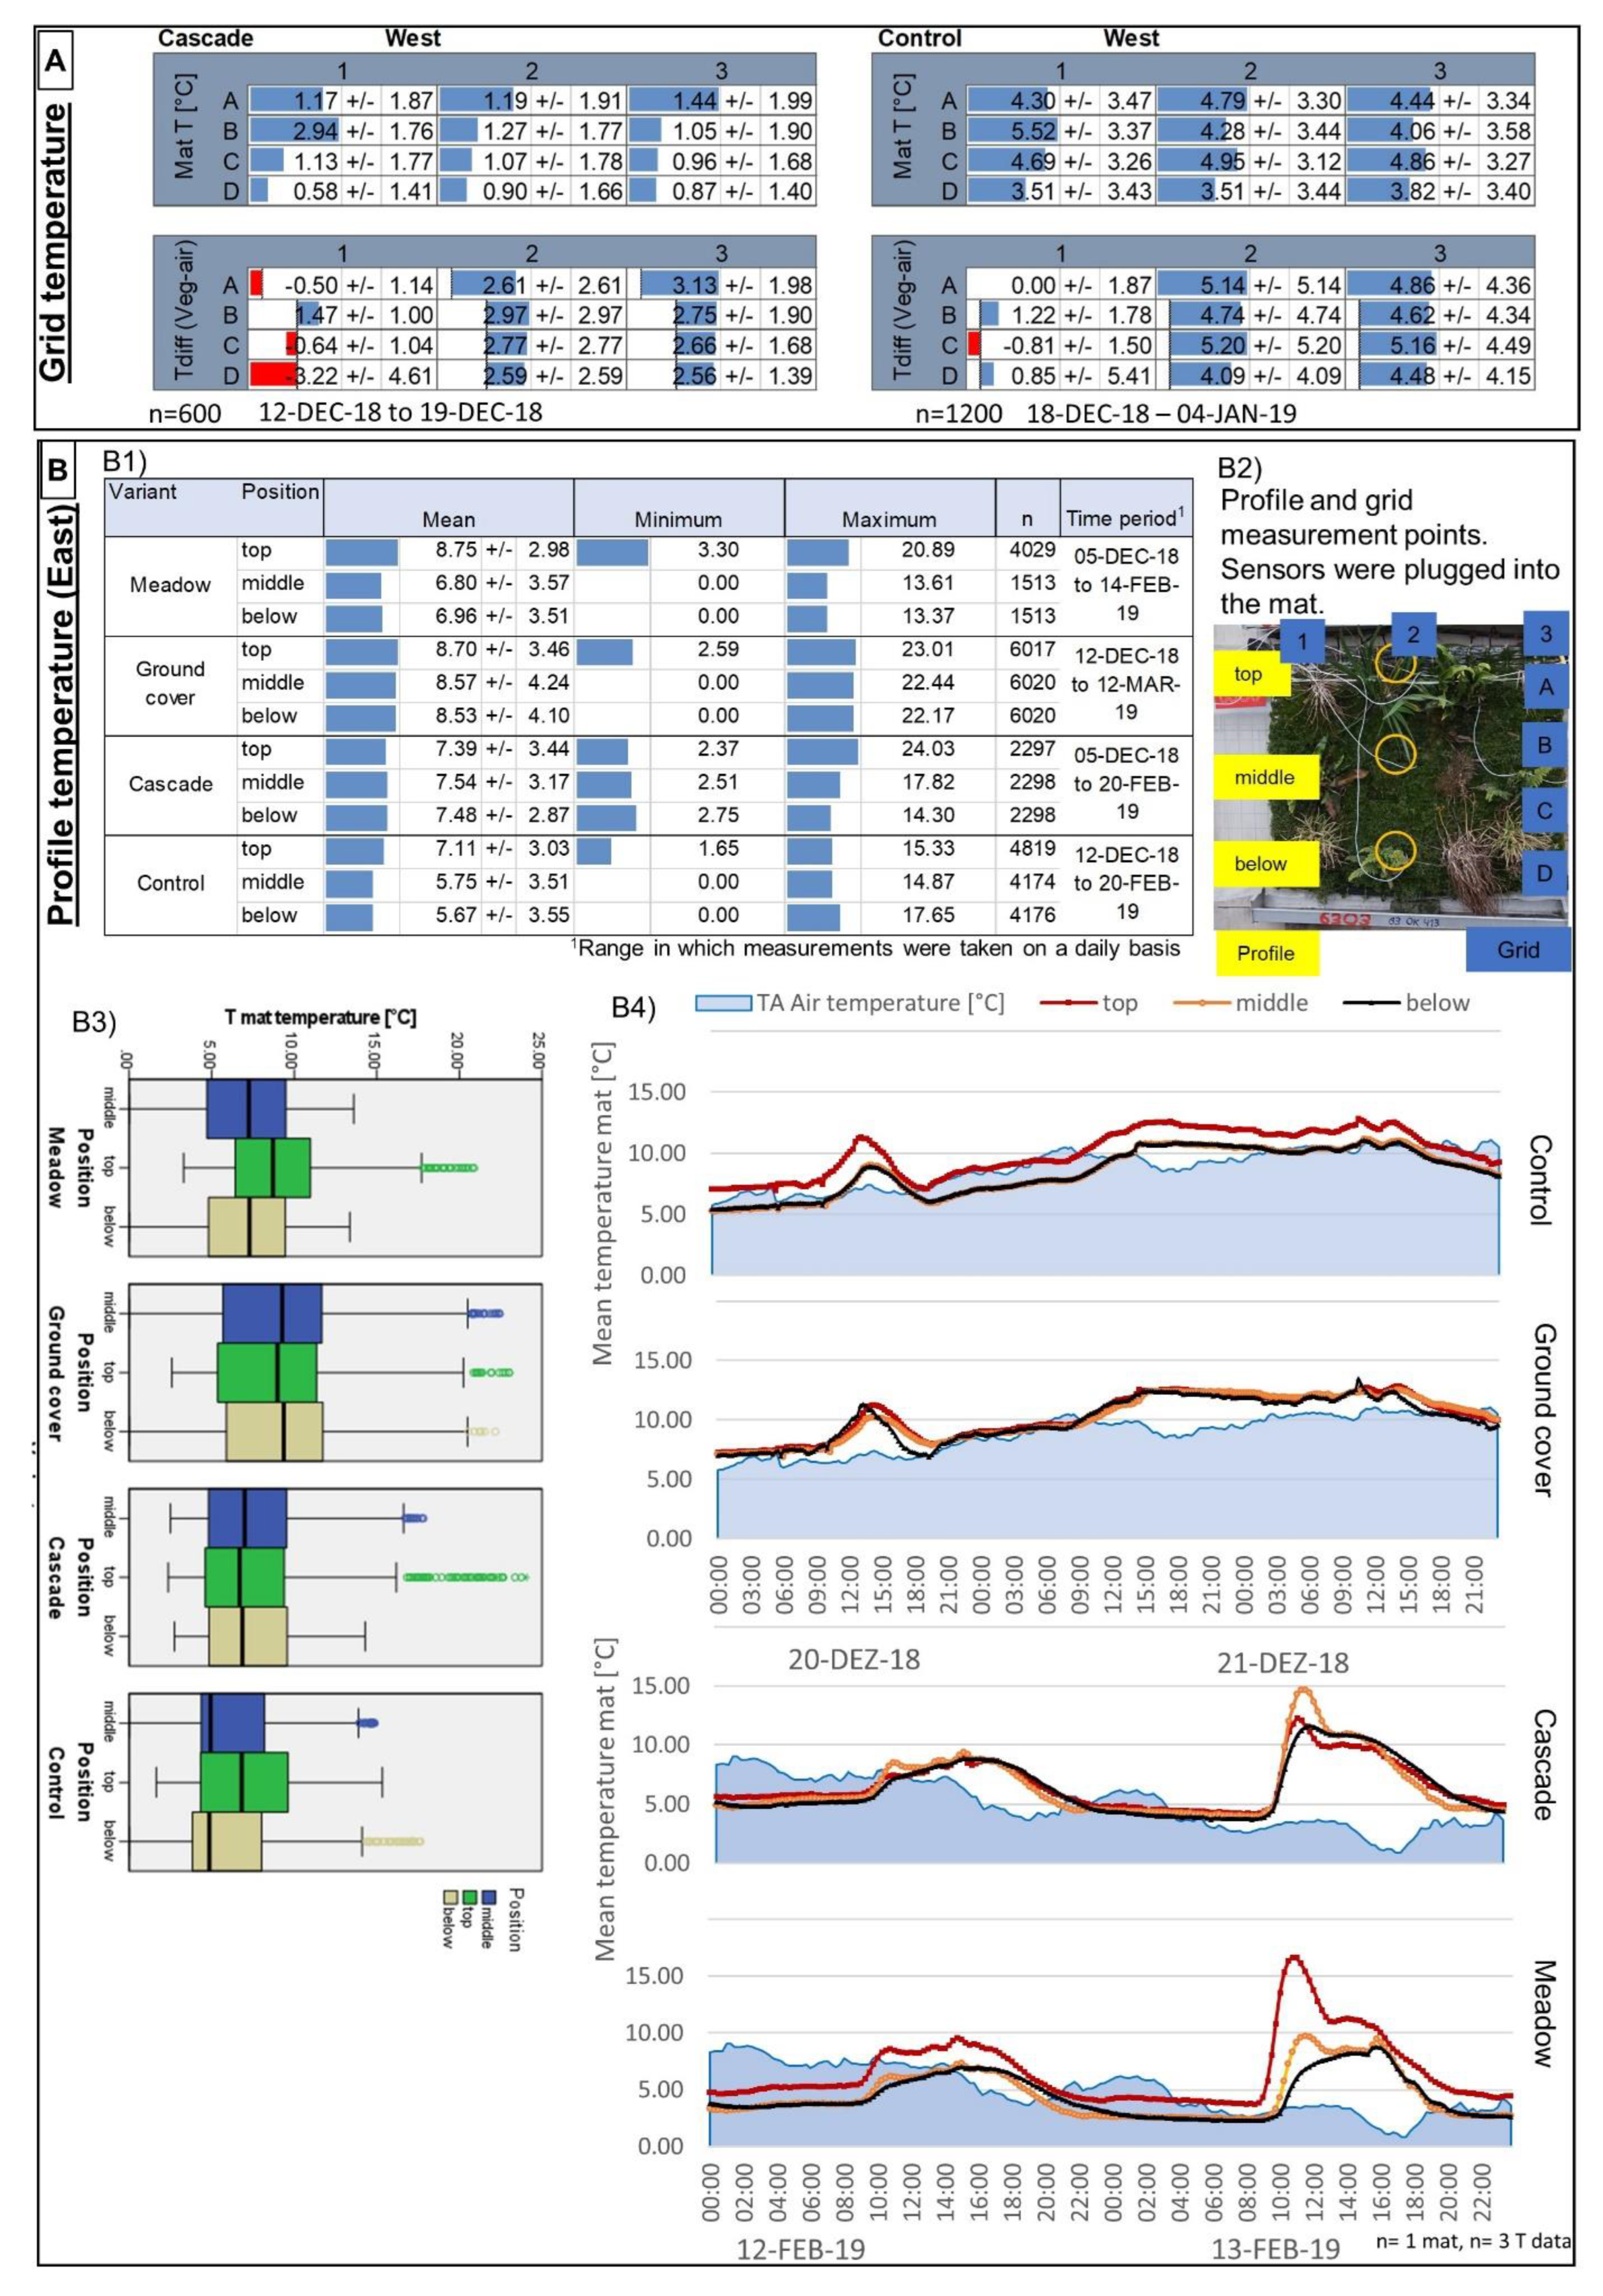
We installed temperature sensors in a mat in a grid or profile to detect whether there was a different temperature distribution within a mat. The sensors were plugged into the mat. The available sensors were plugged into only one mat to measure as many positions as possible. This measurement was carried out between December 2018 to February 2019.
The grid measurement showed higher mat temperatures in the upper part of the mat, especially for Cascade (Suppl. 6). The first row of the mat (left) was cooler than the TA and the rest of the mat in comparison. The second and third rows showed higher temperatures compared to the air (Figure 7 A).
In the profile measurement, there were fewer differences between Ground cover and Cascade positions. For Control and Meadow, we observed a mean difference of around 2 K between the top and middle/below (
Figure 7 B1, 3). The temperature in the mat was higher in the daytime for all variants and positions (
Figure 7 B4).
3.6. Alu Pot Radiation Protection
We built a new setup to place the sensors in front of the experimental wall. For our previous measurement, we used radiation-unprotected temperature sensors, and we had only three psychrometers that could measure the temperature without the influence of radiation. In the earlier setups, we tried to protect the sensors with vegetation and took the radiation error into account. Since we wanted more measuring points, we tried to create radiation protection for the temperature sensors. Thus, we tried different materials and compared the temperature at the same measurement point. The psychrometers showed lower temperature values than all other protection variants (
Figure 8). The highest differences between the psychrometer and the temperature sensors was reached at "no protection" and the closed white plant pot. In the east, we also observed higher temperatures for the protected sensors compared to the weather station near the wall and the psychrometer. From this experience, we decided to use protection. Open plant pots were covered with aluminum foil, and this was designated as “alu pot”.
3.7. Temperature at a Fixed Distance from the Wall
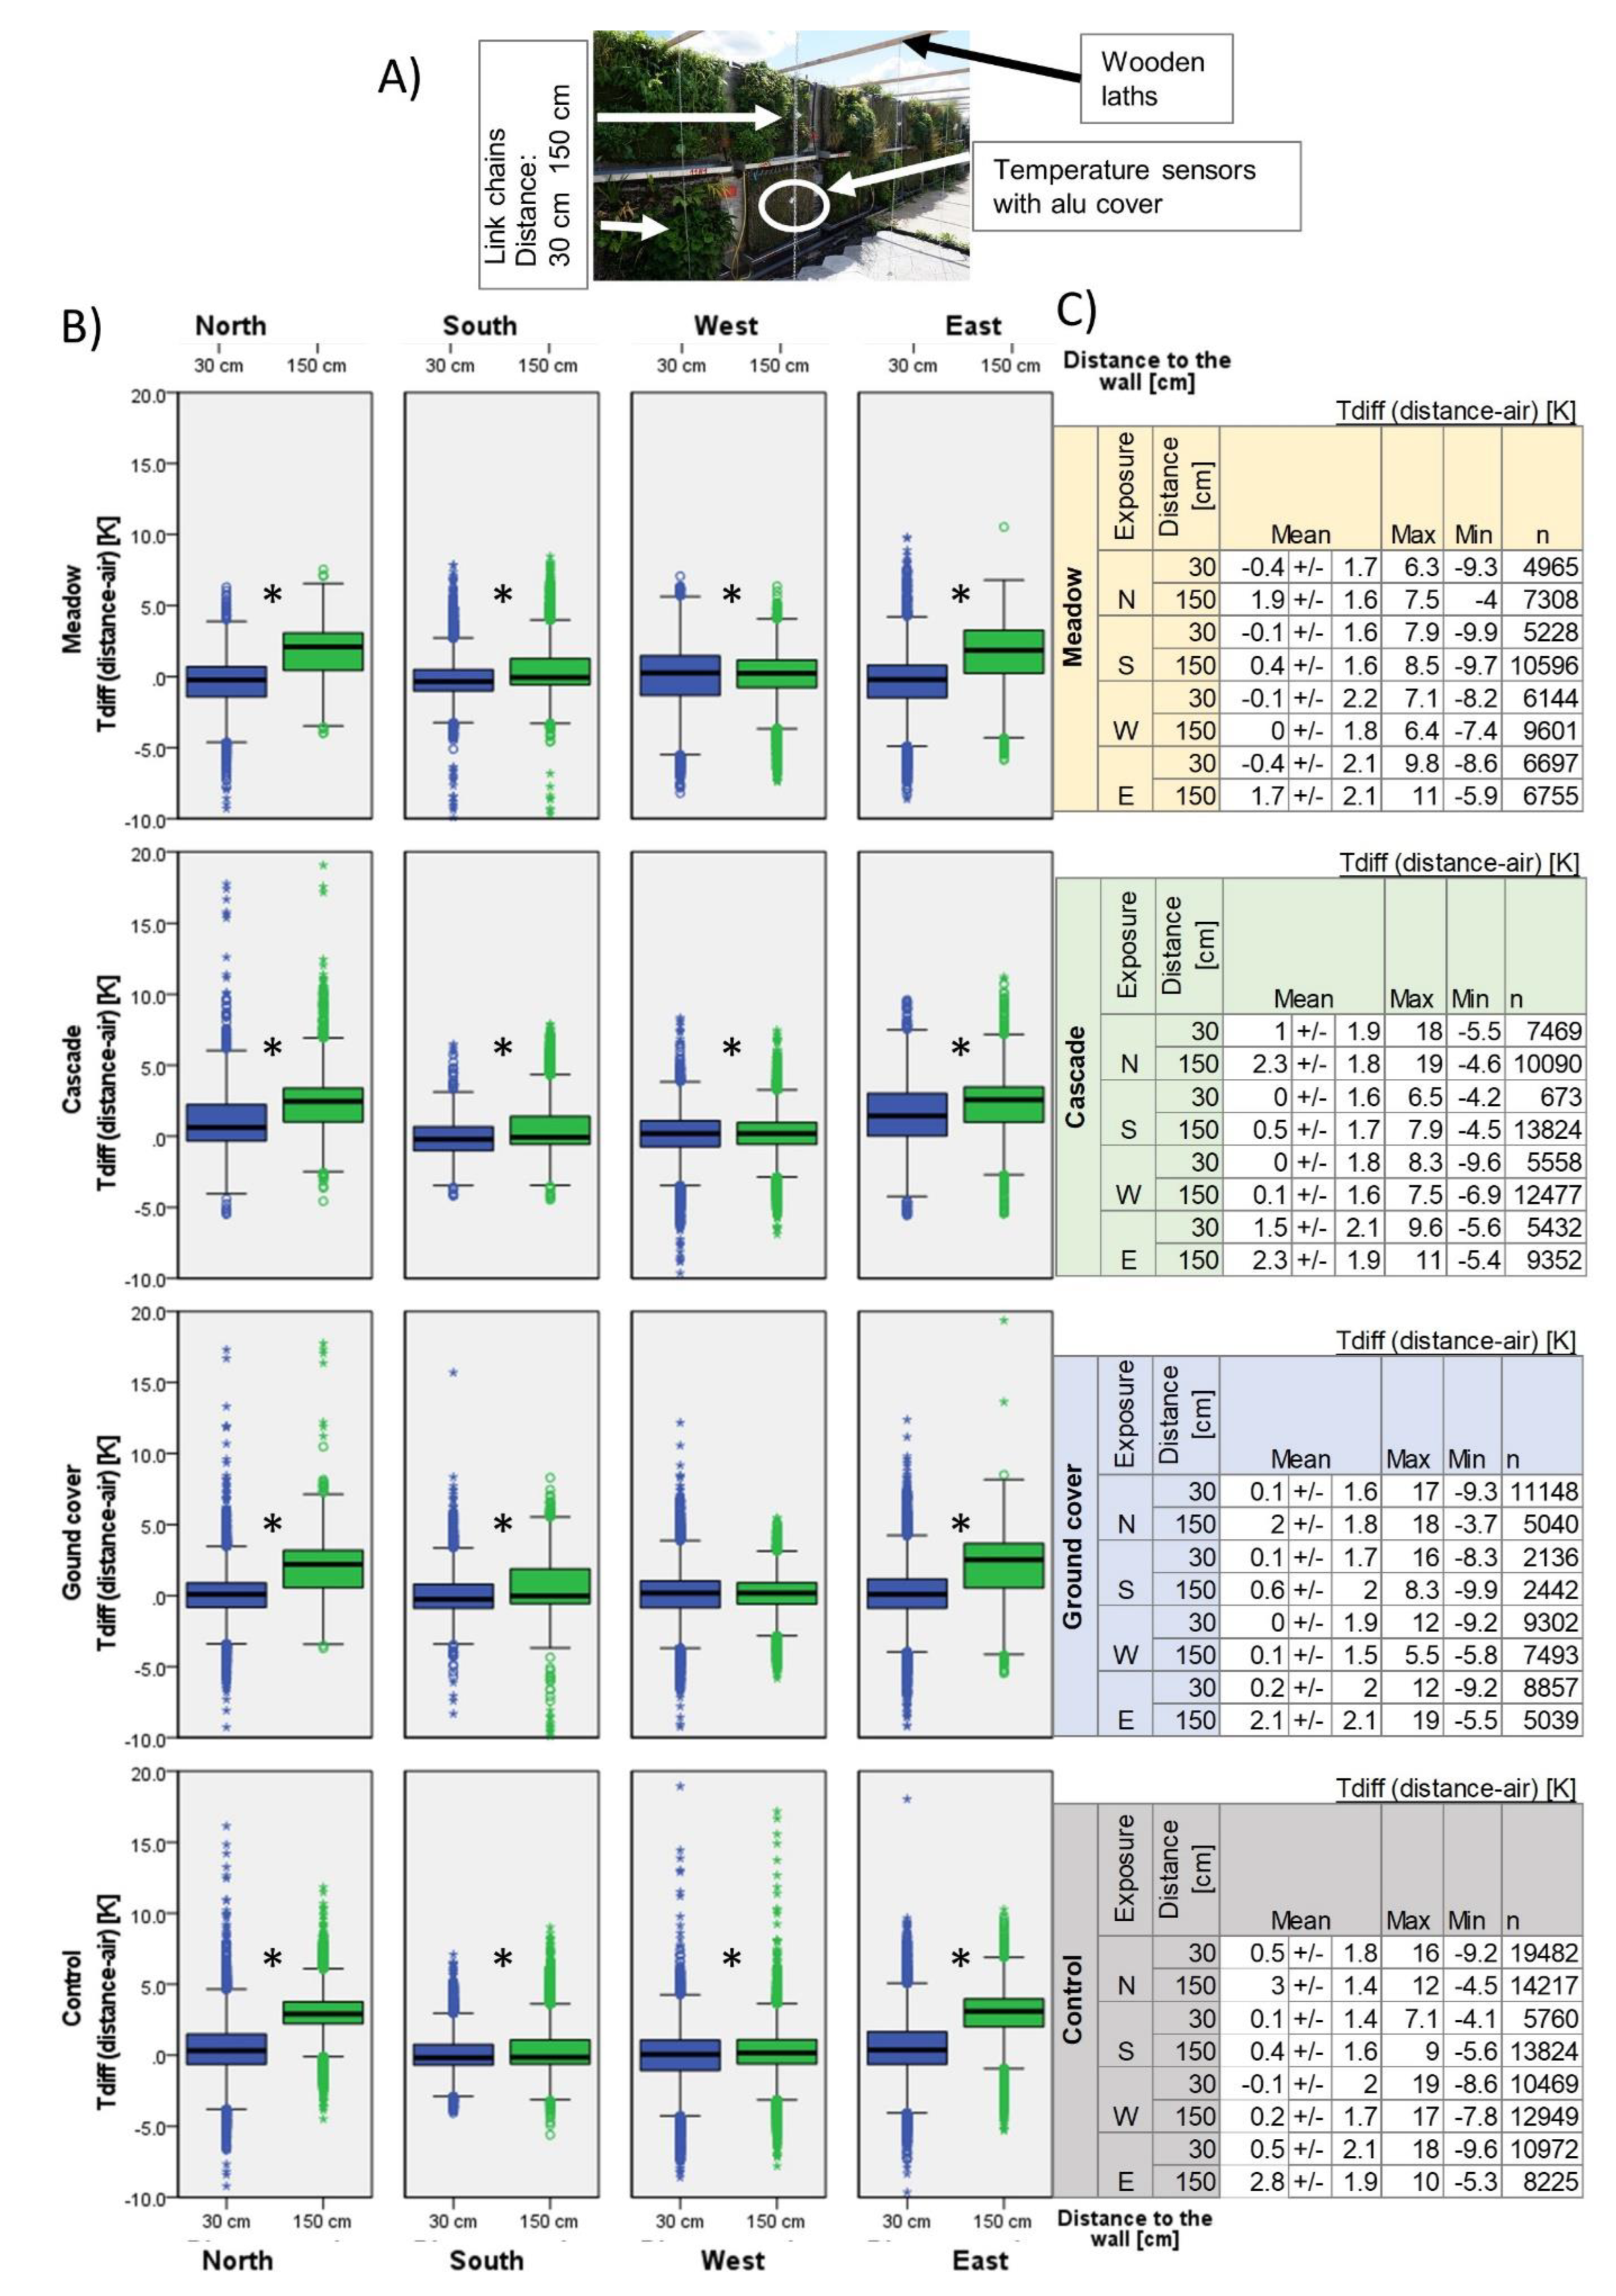
We designed a new setup, based on our previous experiences, to ensure consistent sensor placement at fixed distances of 30 cm and 150 cm in front of the experimental wall. For the installation, wooden laths were attached to the experimental wall. Link chains were hung down from the laths, and sensors were attached to the chains. To protect the sensors, we employed an alu pot radiation shield. Our measurements were conducted from April to July 2019, encompassing various exposures and planting variants.
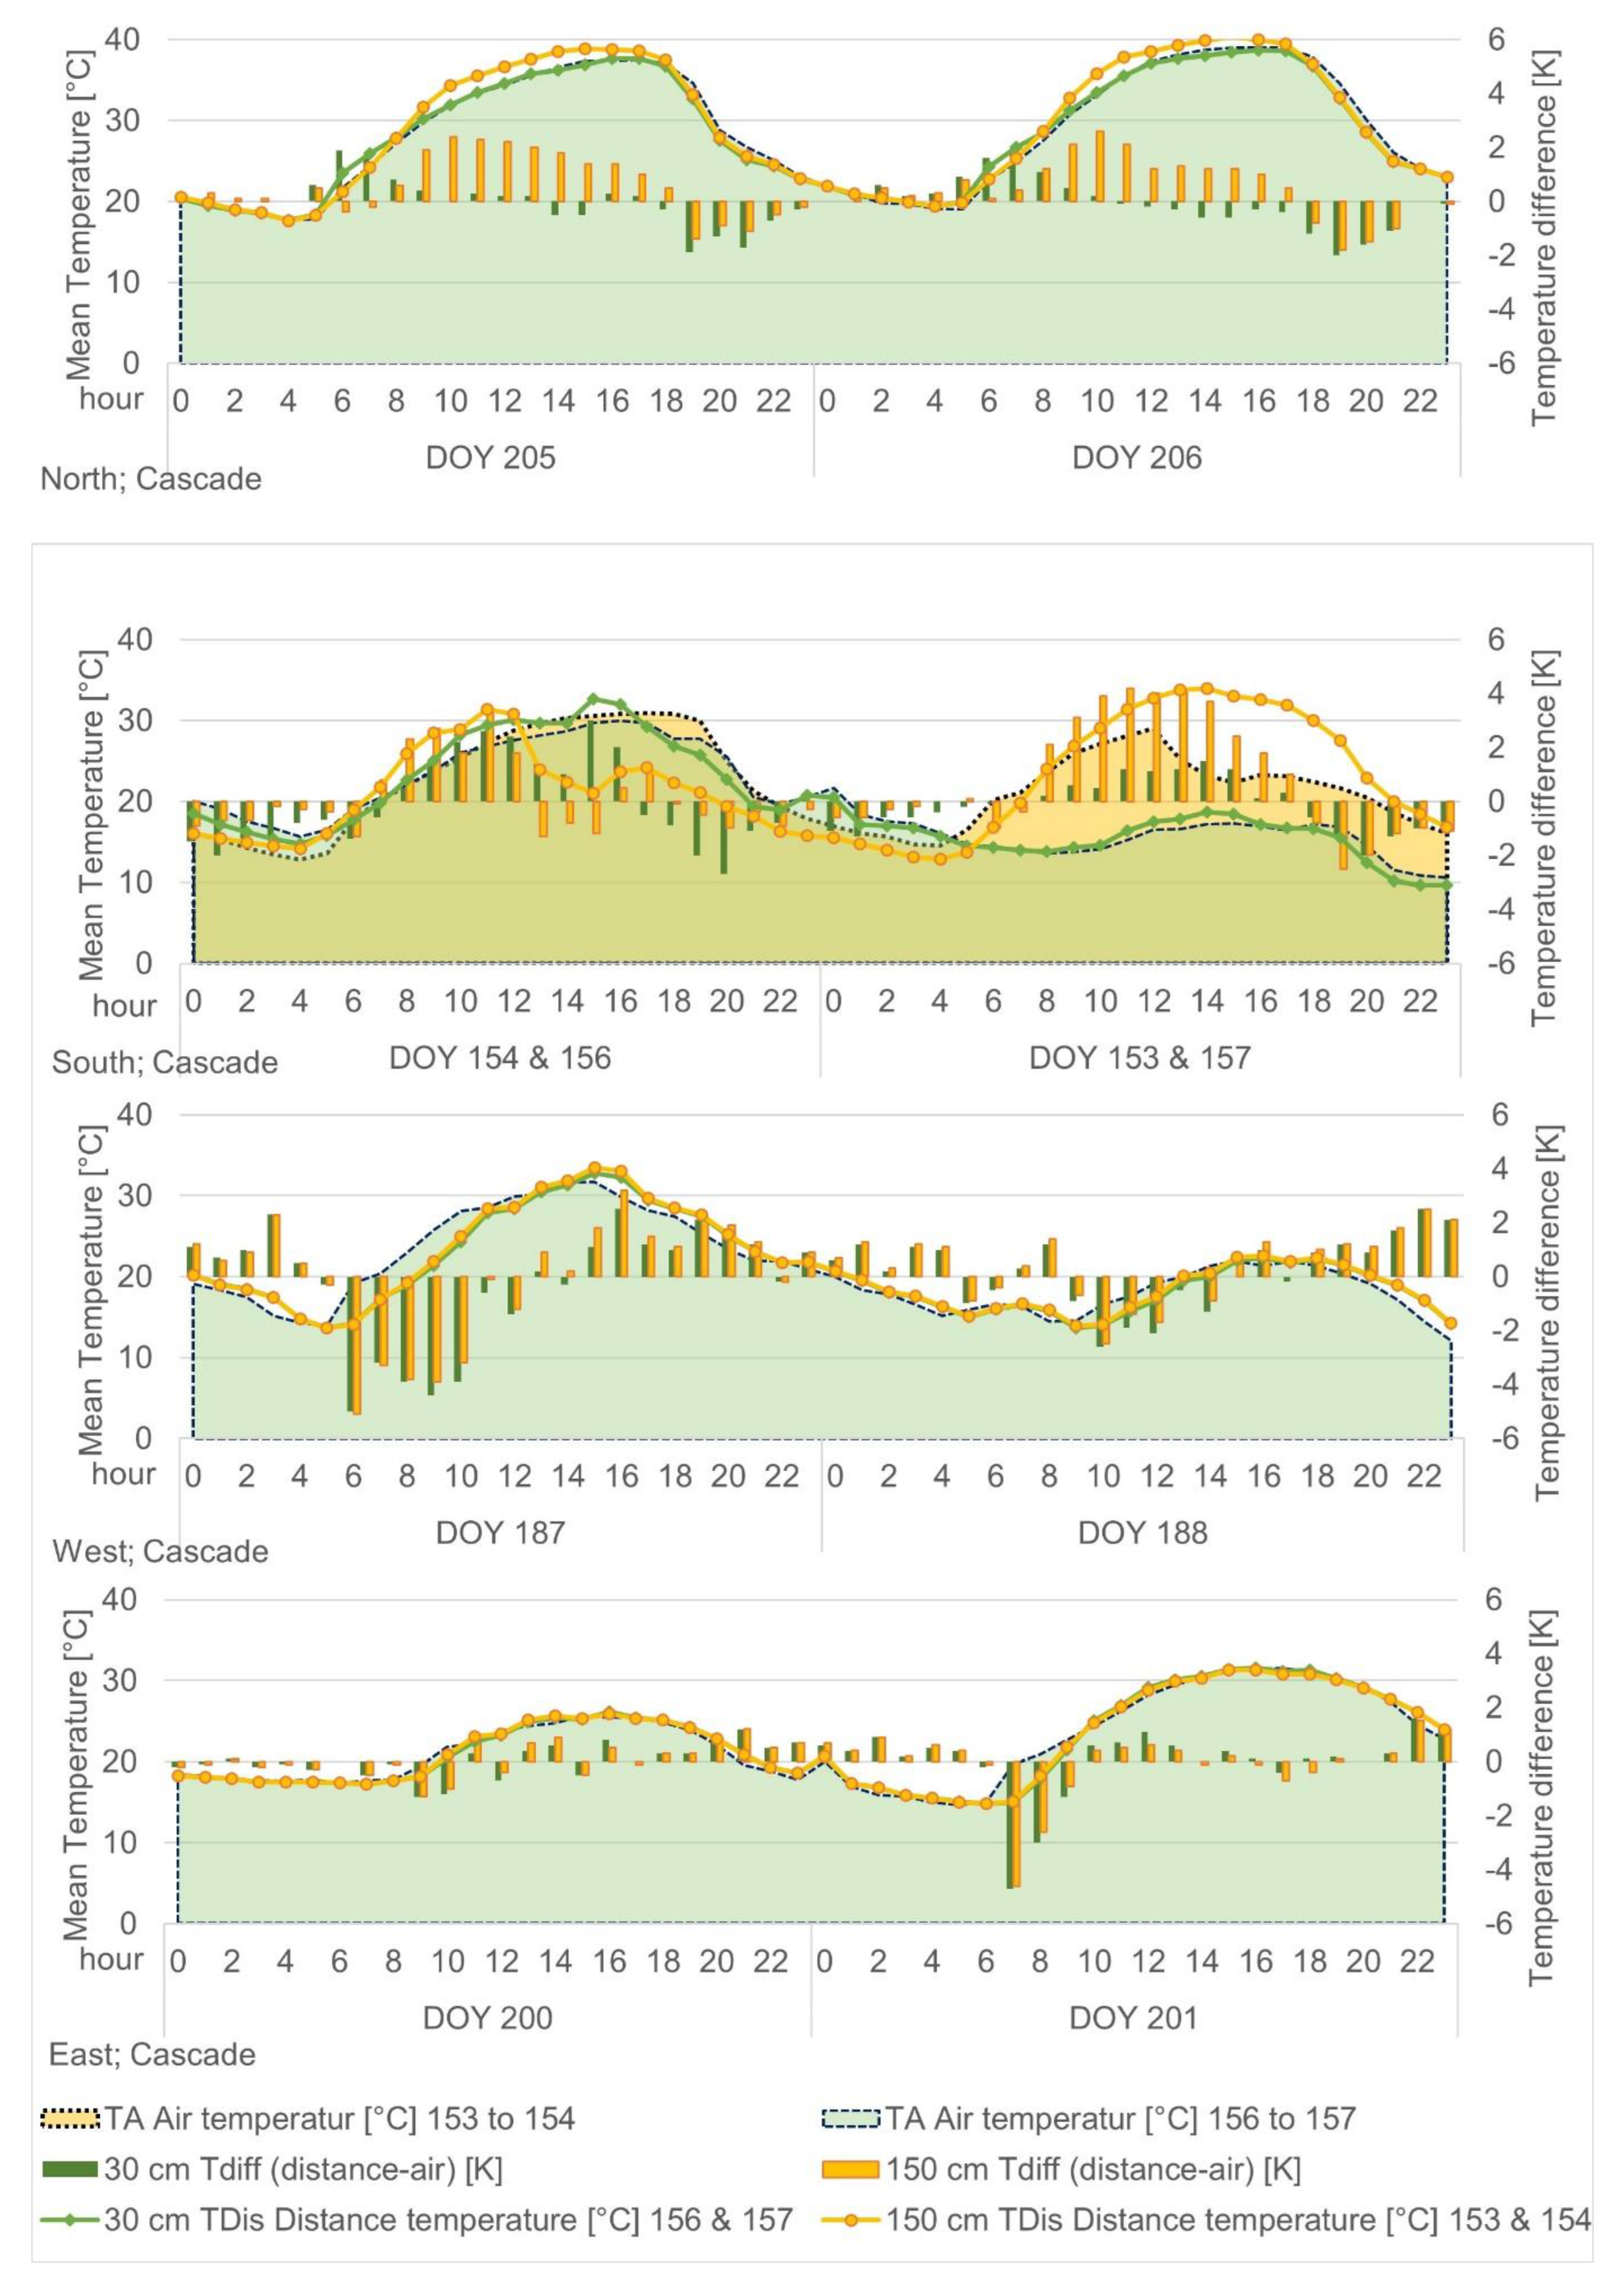
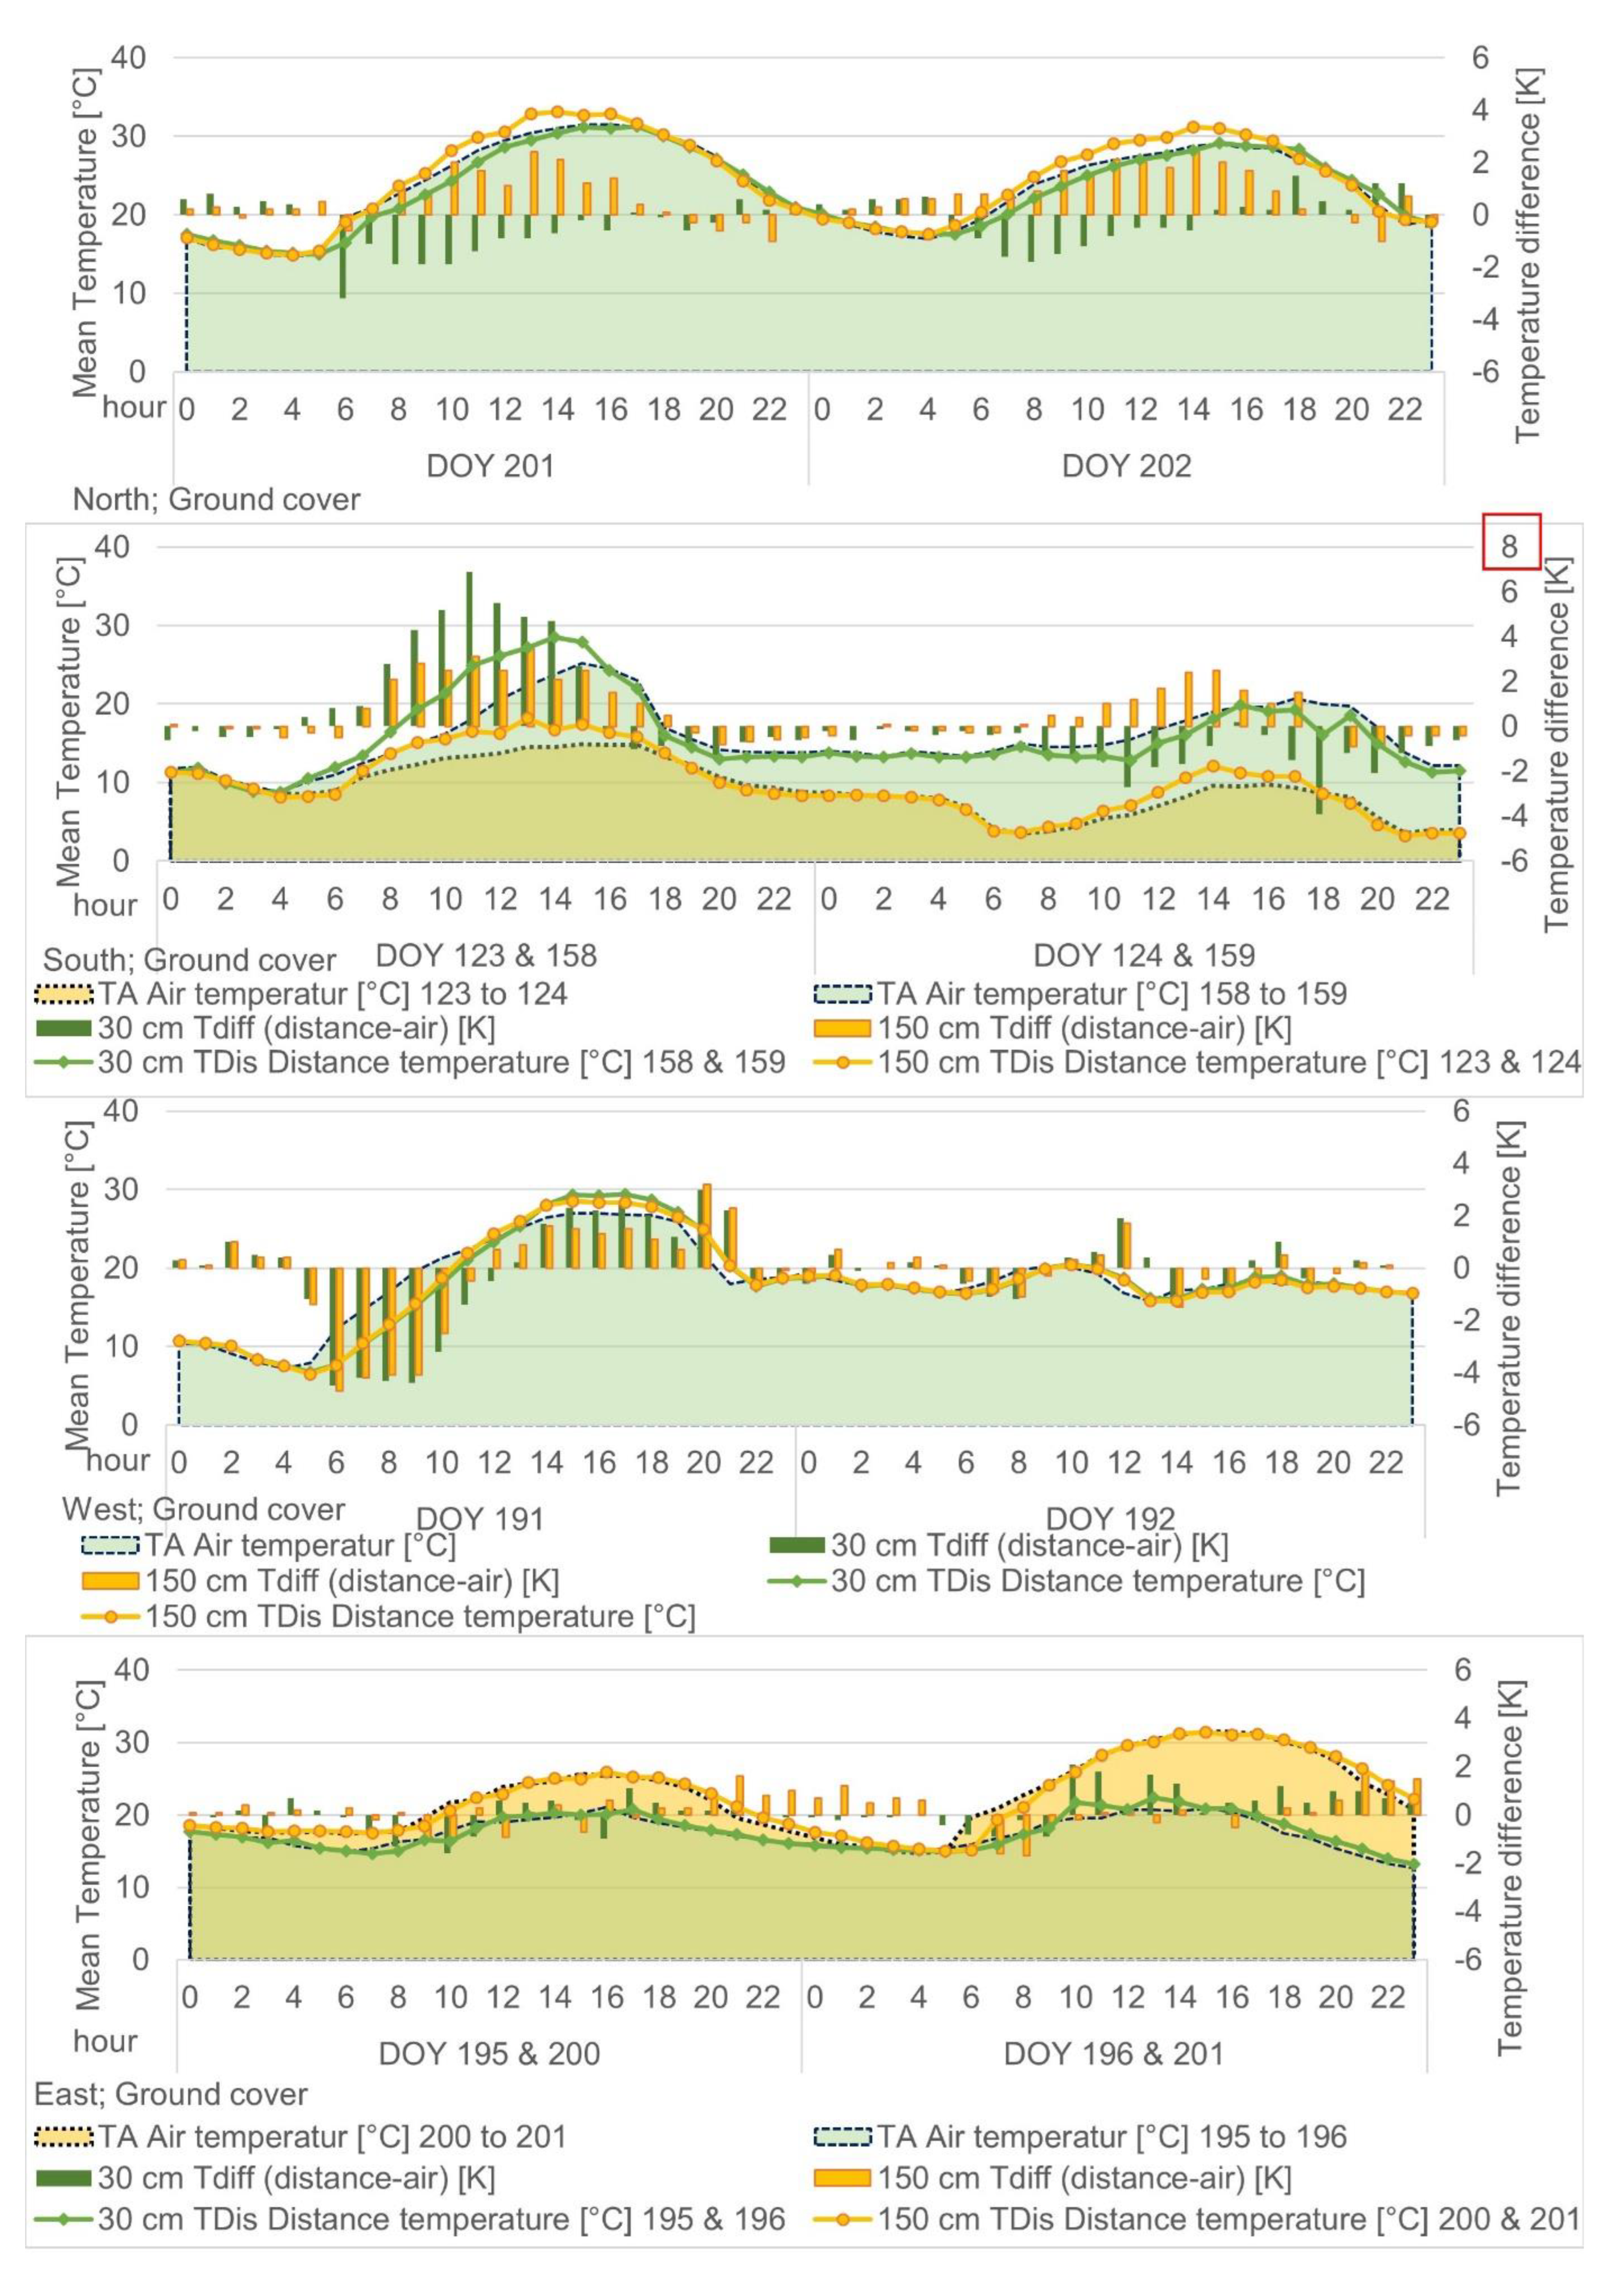
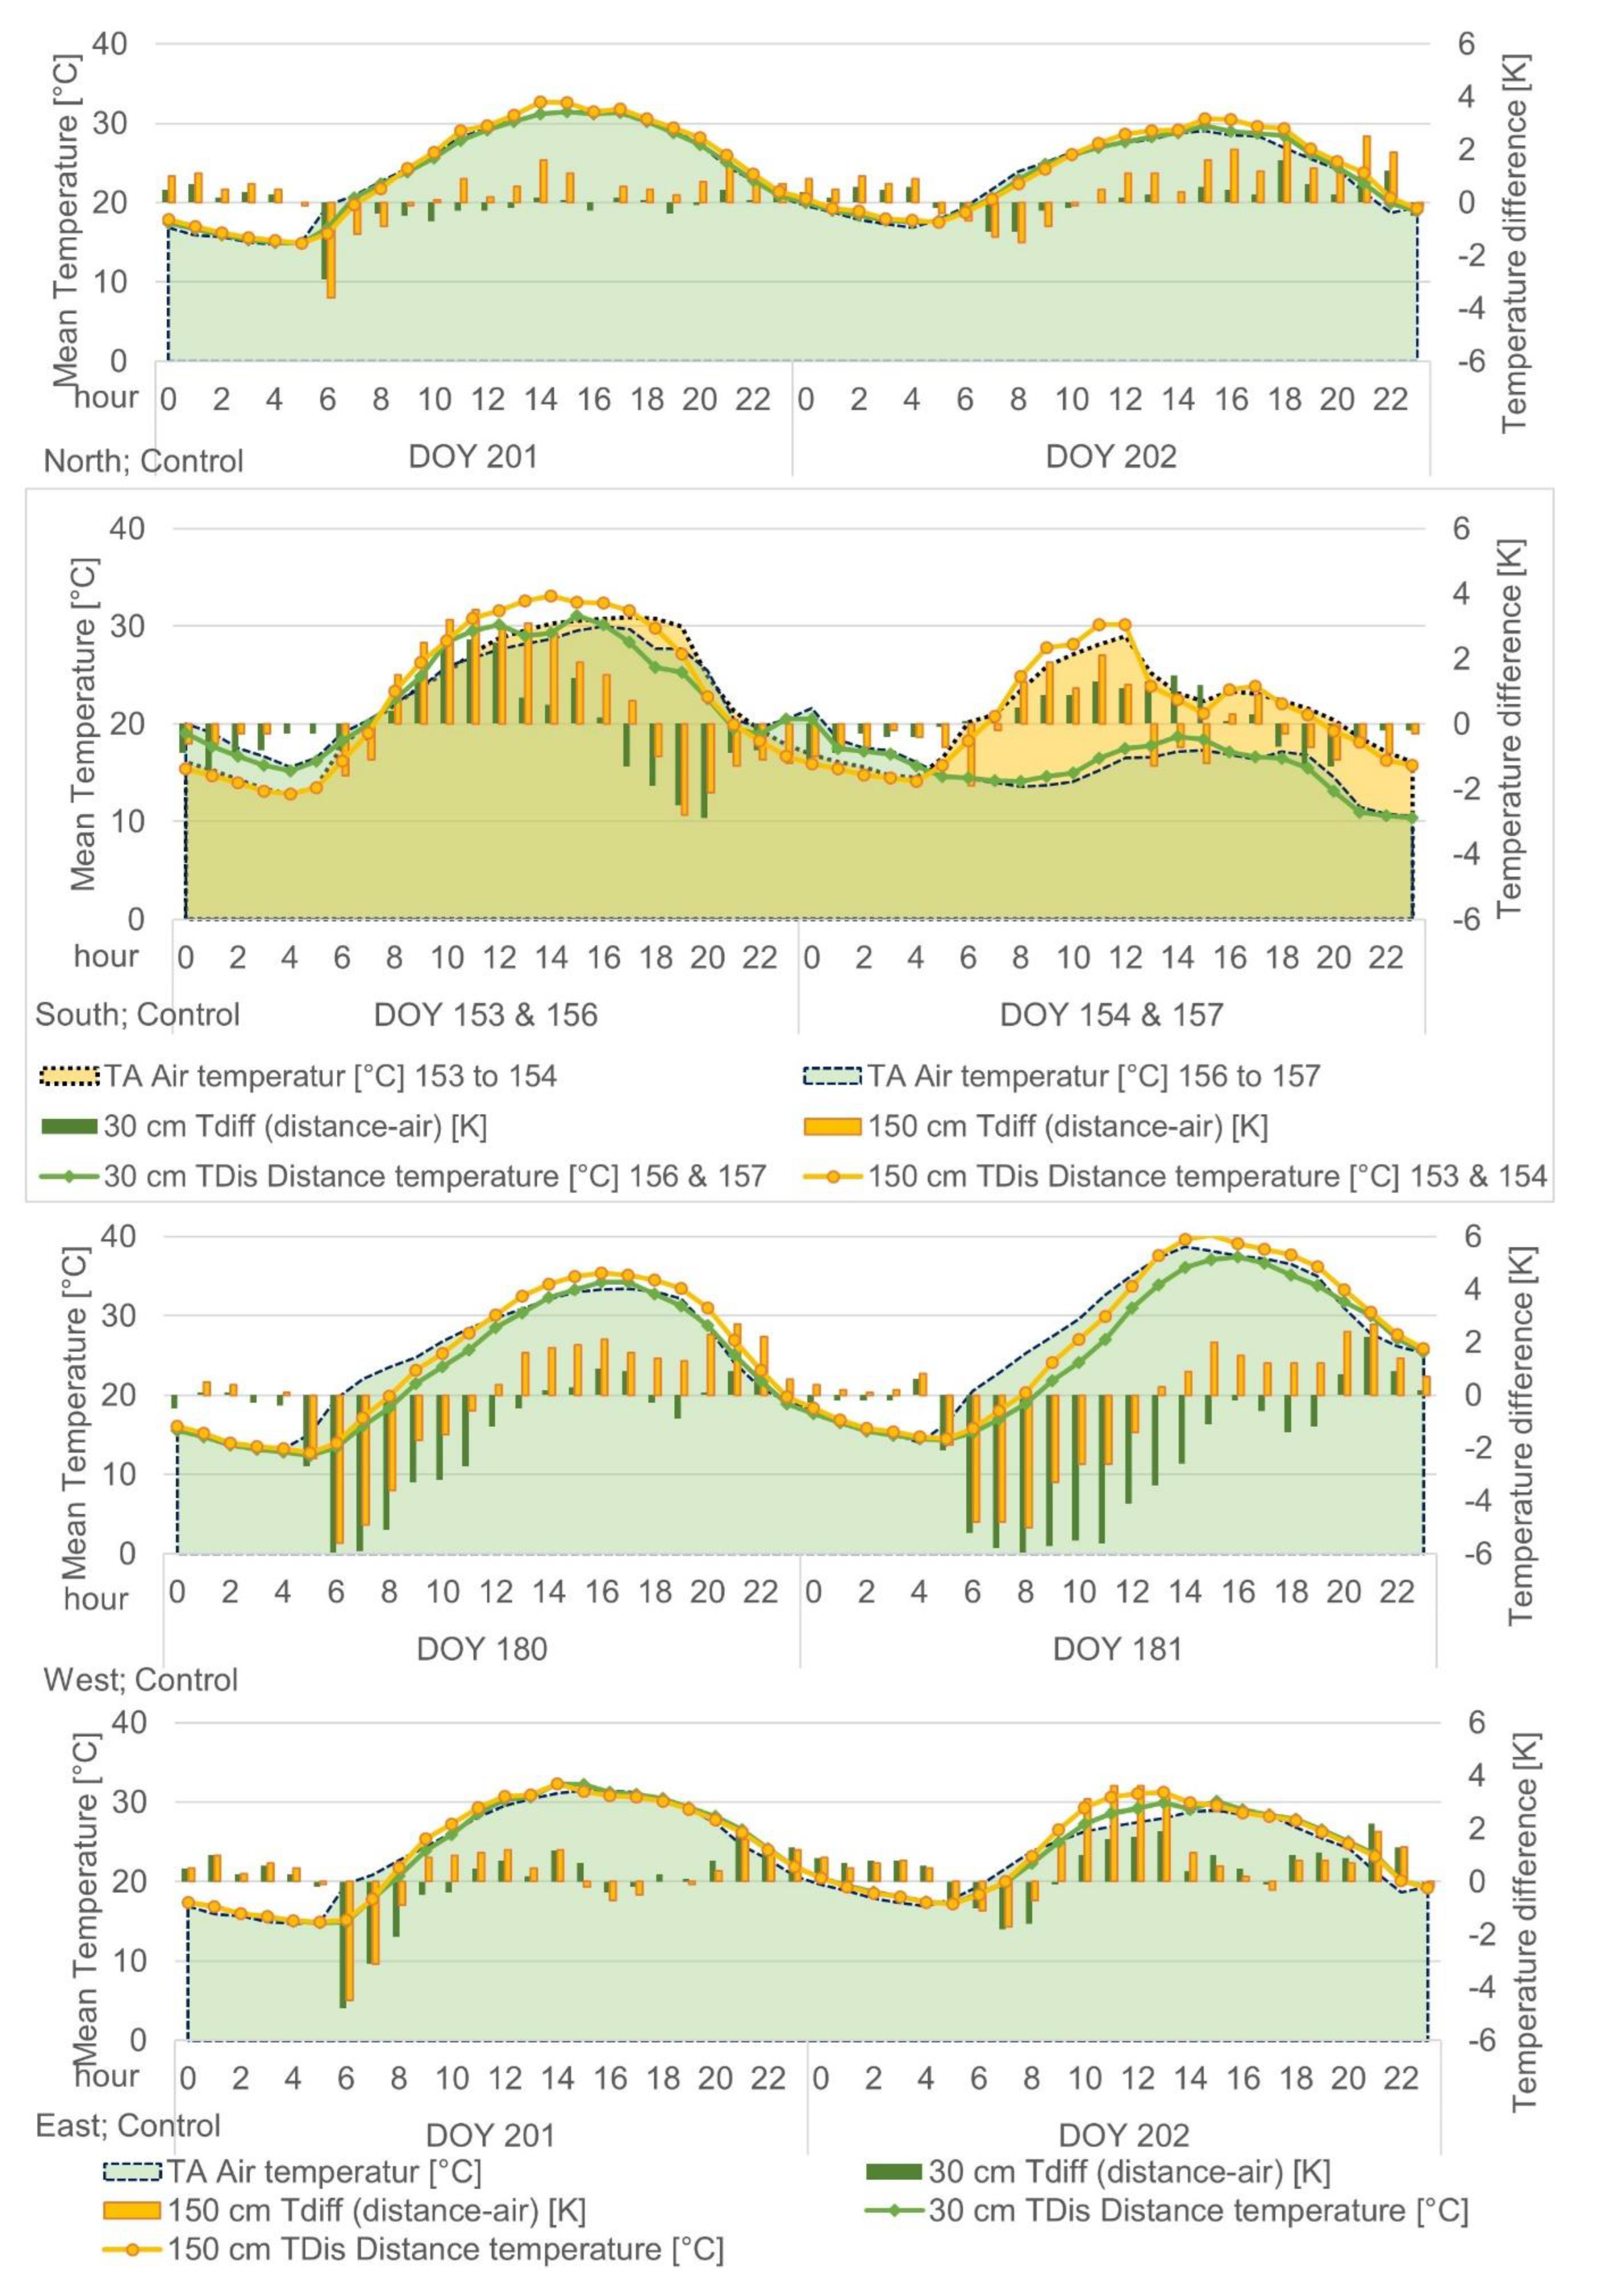
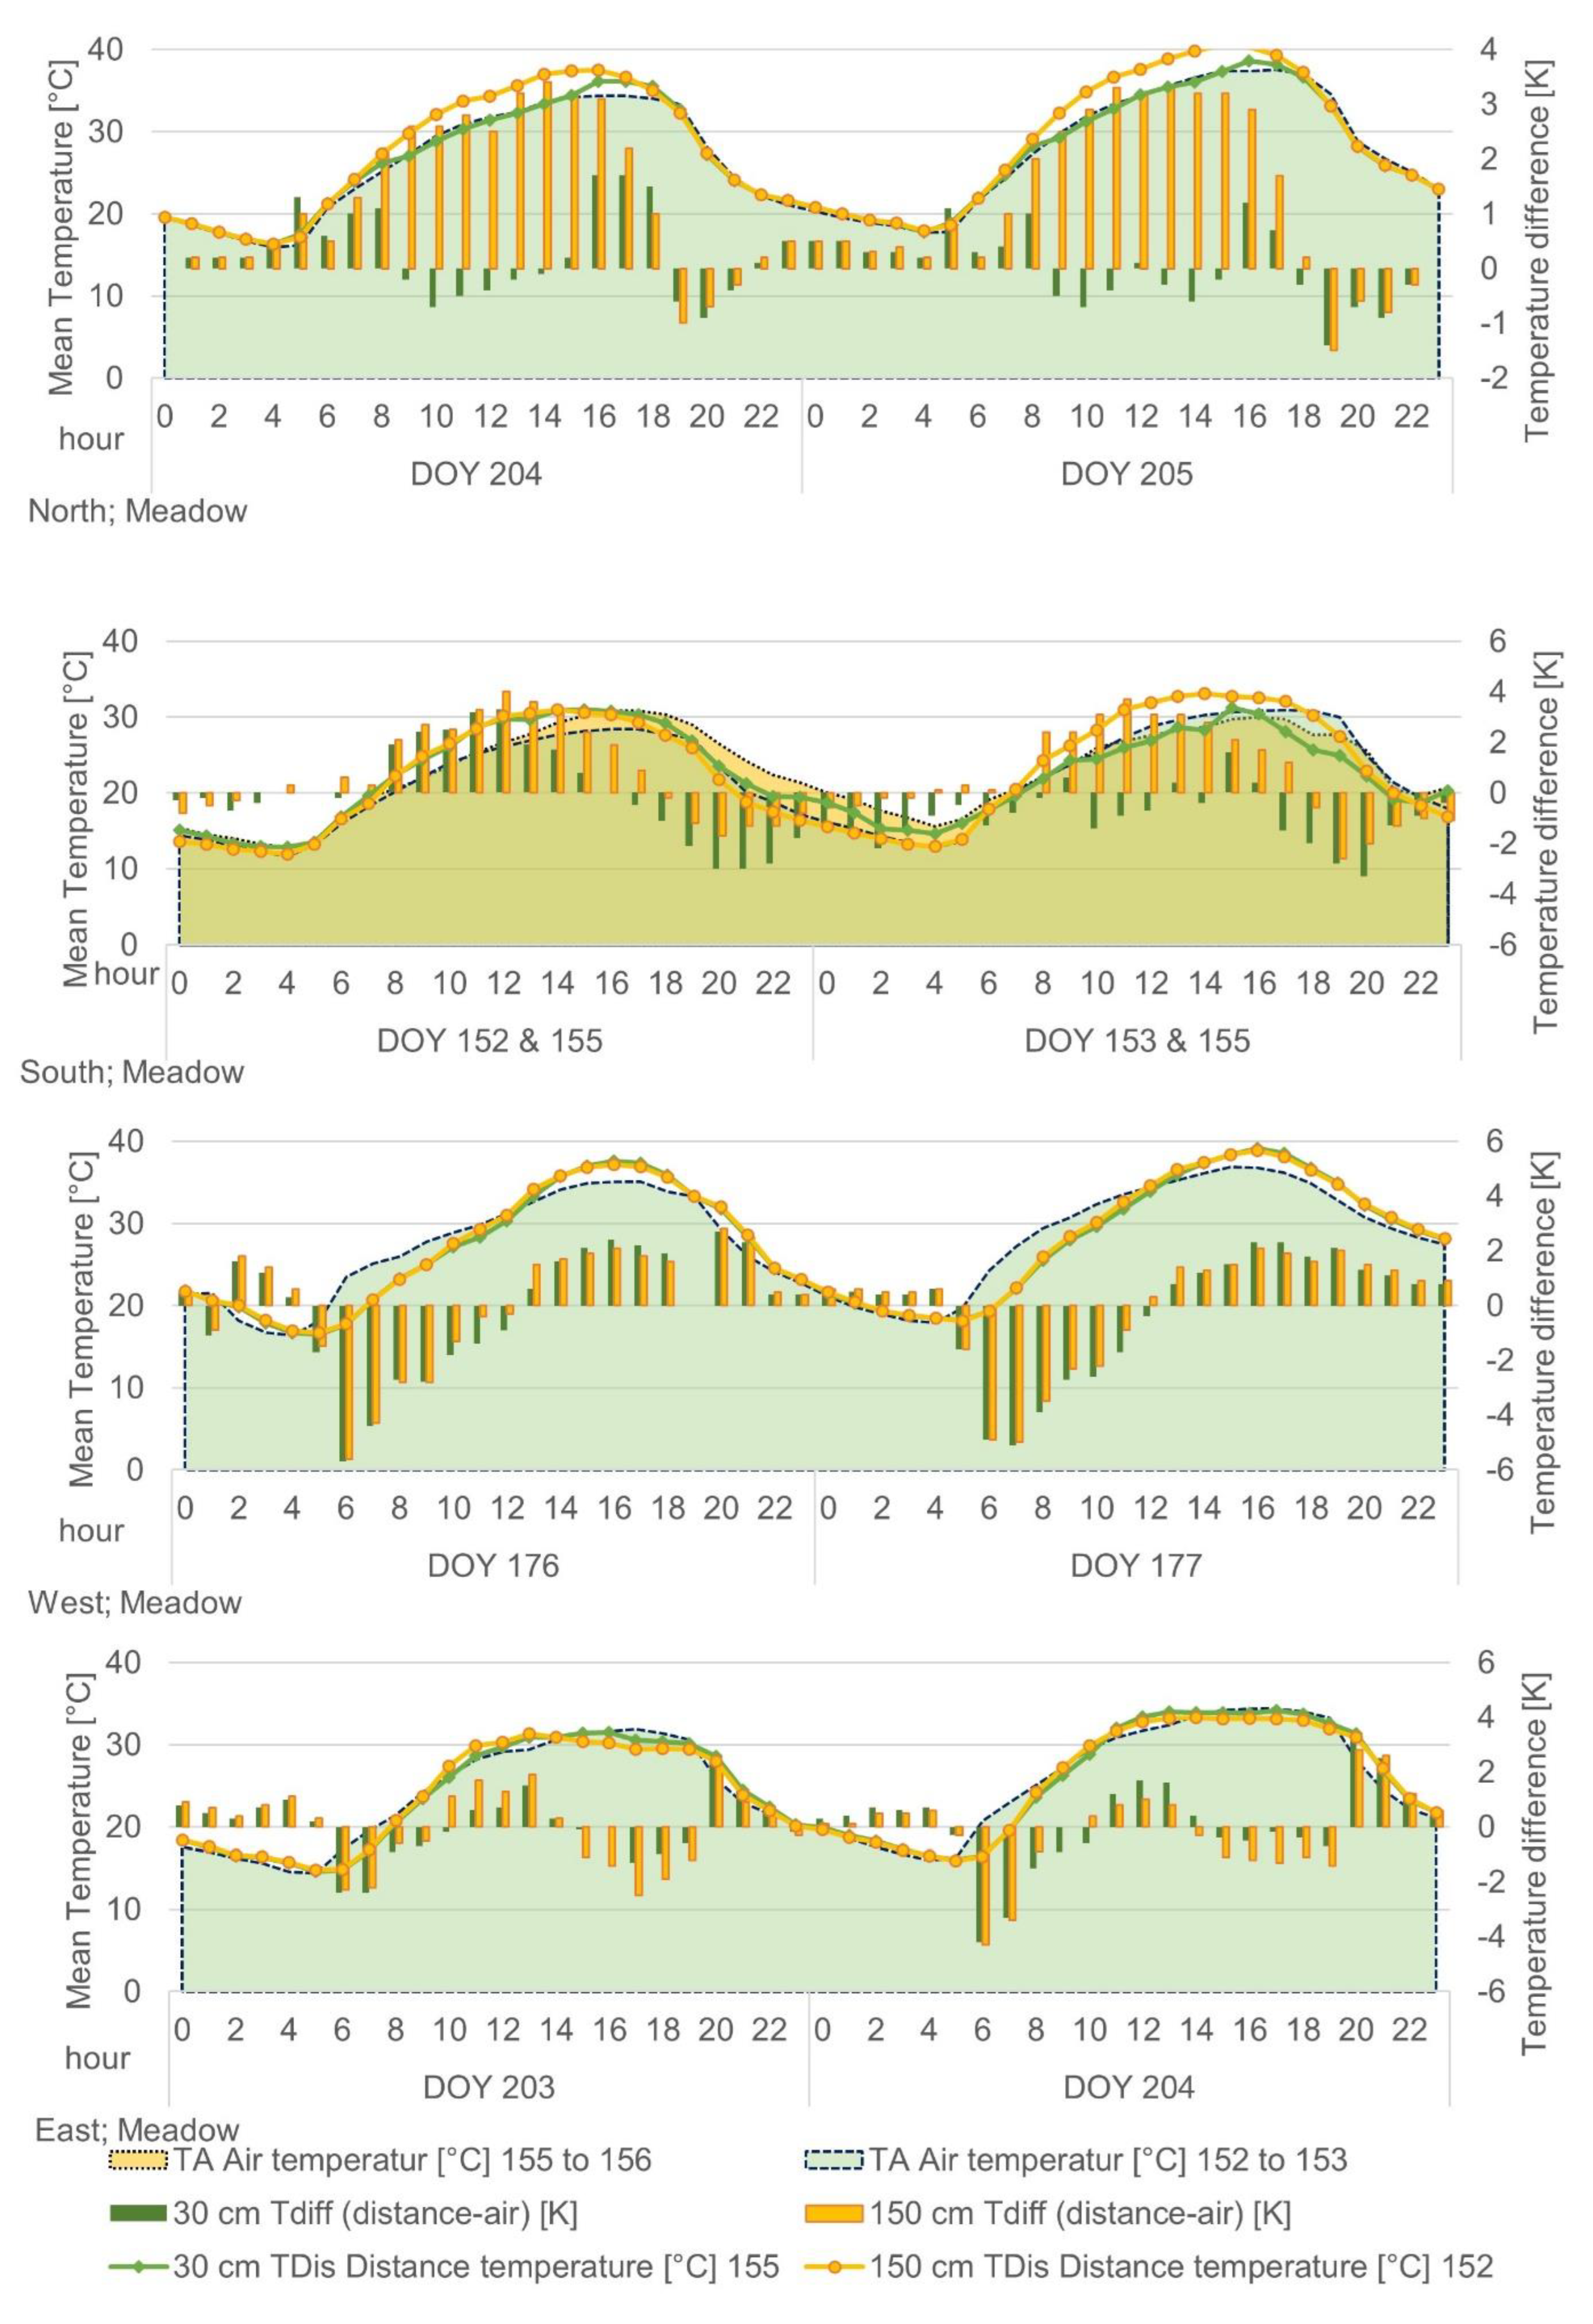
Significant differences were observed for Tdiff (distance–air) between the 30 cm and 150 cm temperature distances across all variants and exposures, except for the west exposure and Ground cover (
Figure 9 A and A3 - 6). Additionally, significant differences were observed between the different exposures and variants (Suppl. 7 - 8).
Overview boxplots were generated to analyze the data. Positive values indicated that the temperature at the measurement point was higher than the TA, while negative values indicated cooling, i.e., lower temperatures than the TA. For both the 30 cm and 150 cm distances, the temperature fluctuated above and below the TA within a similar range. Thus, the hypothesized cooling effect was not observed. Further, Control group did not differ significantly from the plant variants.
The temperature range for Tdiff (distance–air) was comparable for both distances. However, the 150 cm distance range tended to be skewed towards positive values, indicating that temperatures at 150 cm were often higher than the TA compared to the 30 cm distance, where it was cooler (
Figure 9 B). In summary, average values were calculated (
Figure 9 C). A cooling effect was observed for Meadow at the 30 cm distance. However, at 150 cm, temperatures were consistently 2 K higher for the north and east exposures, while no differences were observed for other exposures.
No differences were observed at 30 cm for the south and west for Cascade, while a 1-1.5 K higher temperature was recorded for the north and east. At 150 cm, temperatures were consistently higher for the north and east (2.3 K).
Ground cover and Control variants showed fewer differences at the 30 cm distance, but a 2 K higher temperature was observed at 150 cm. At a distance of 150 cm, no significant difference was observed between planting variants and the Control group (Suppl. 7).
Notably, temperatures were consistently higher for the north and east exposures at 150 cm, even for the Control group. Overall, a cooling effect was only observed for the Meadow variant at the 30 cm distance.
Example days were plotted to illustrate daily temperature variations for different variants and exposures (A3 - 5). In general, it is impossible to draw a clear conclusion from considering all variants and exposures.
3.8. IR Camera vs. Temperature Sensors
We built a new setup to place the sensors at a fixed distance. We extended the setup shown in
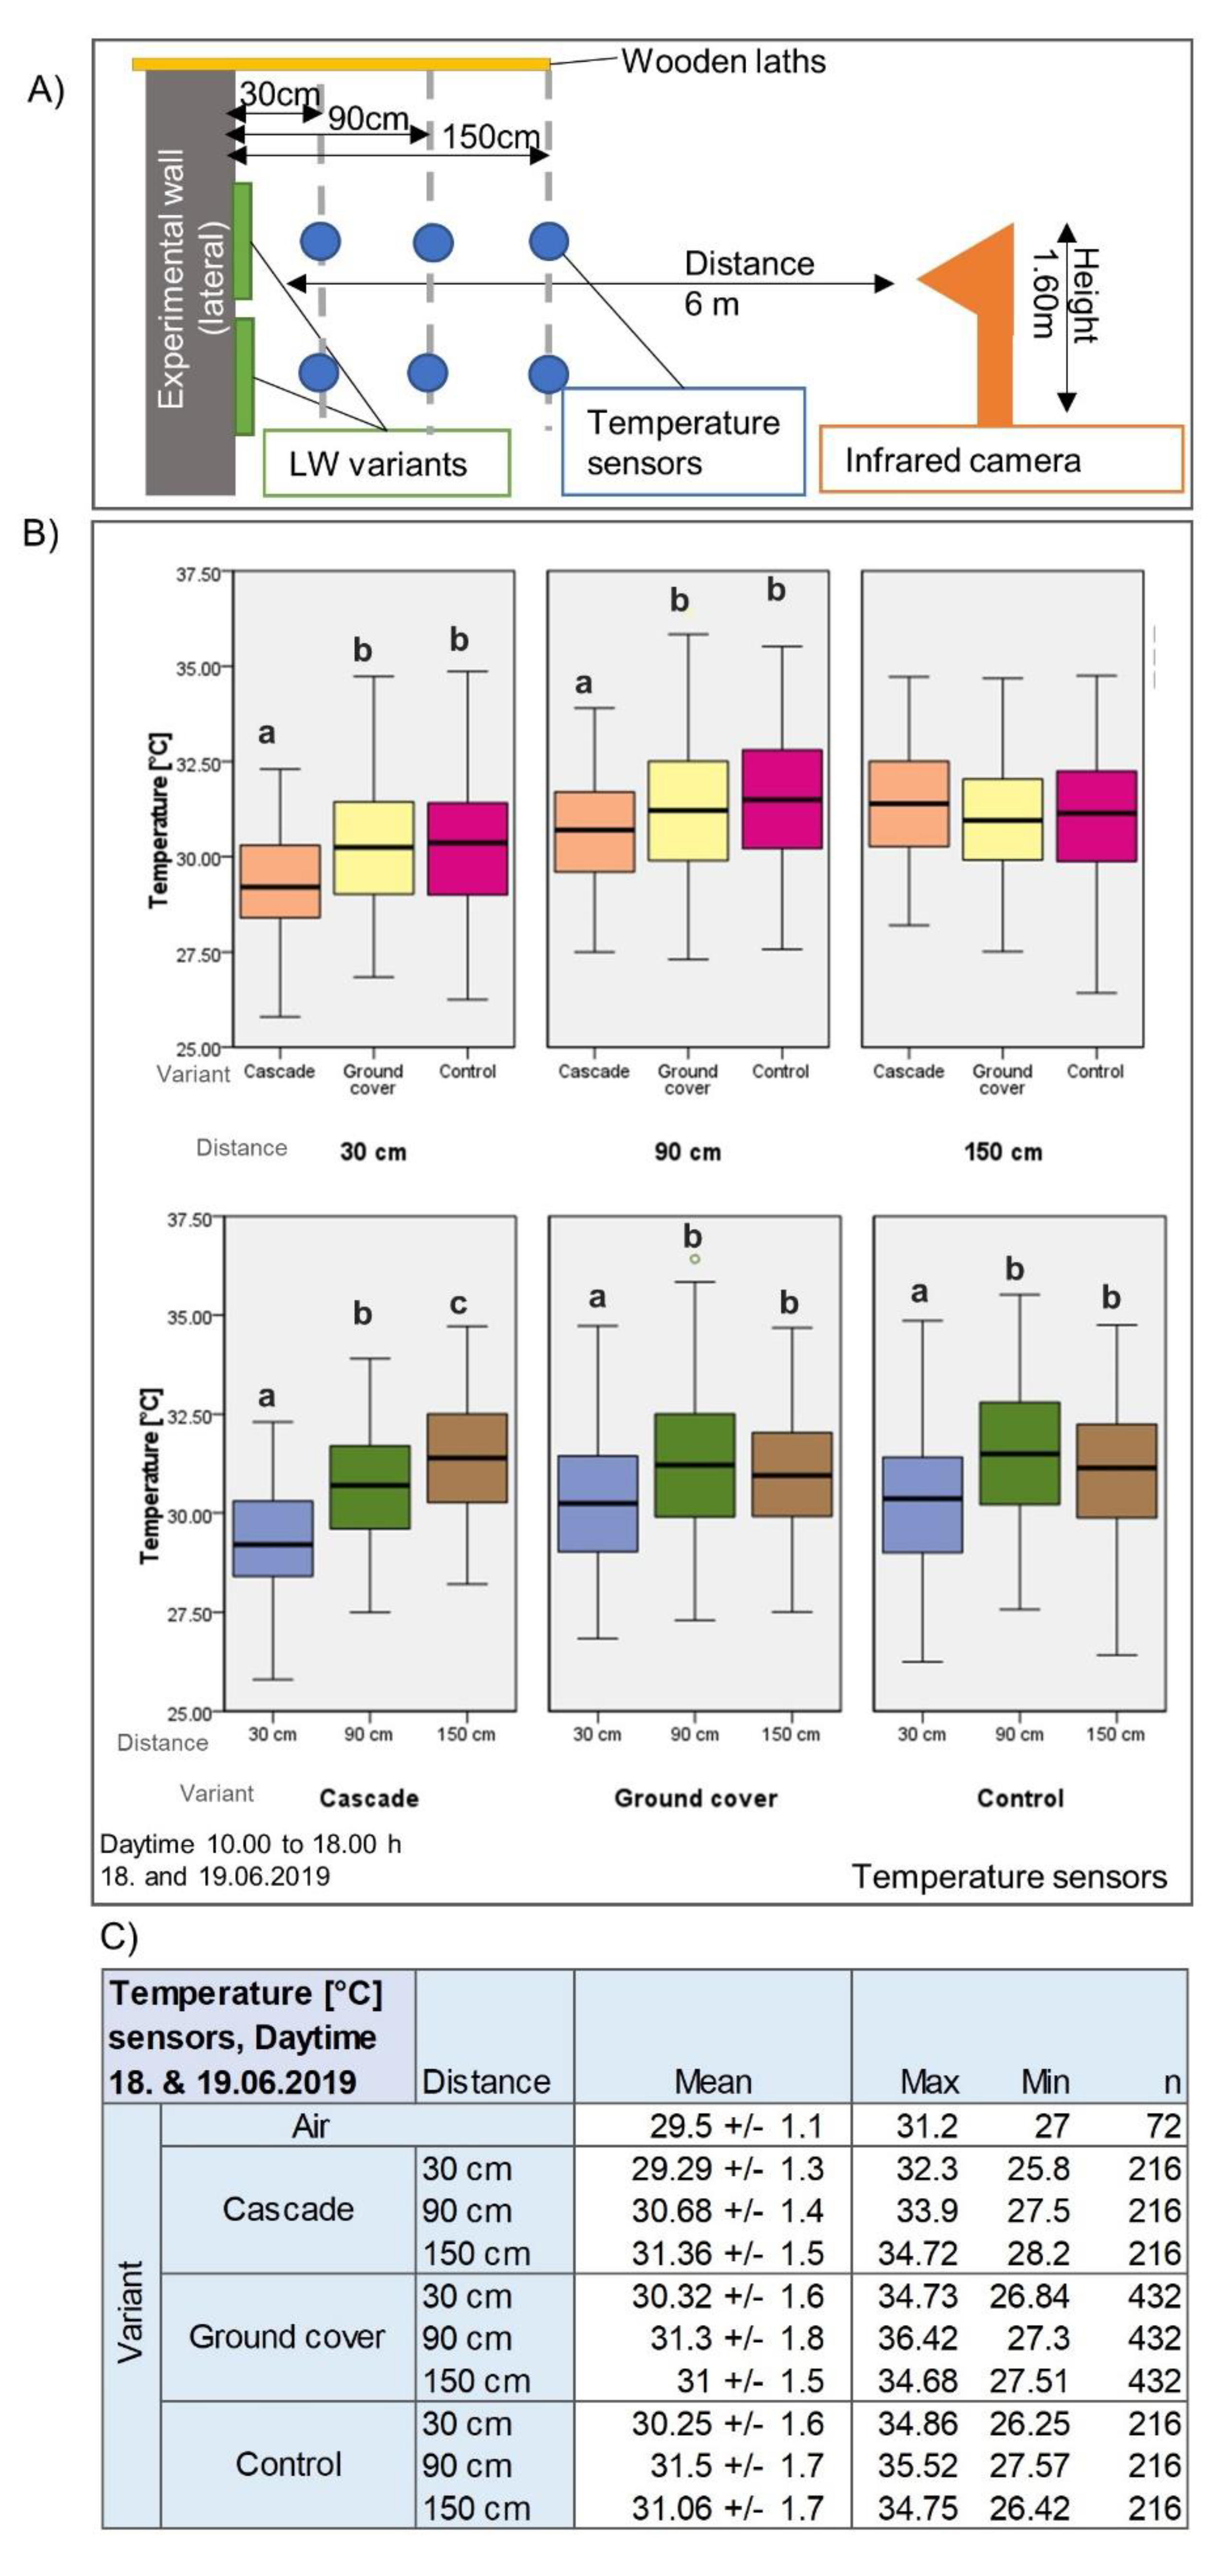
Figure 7 and installed temperature sensors at a distance of 90 cm. In addition to the measurement with the temperature sensors, we made measurements with the IR camera from a distance of 6 m (
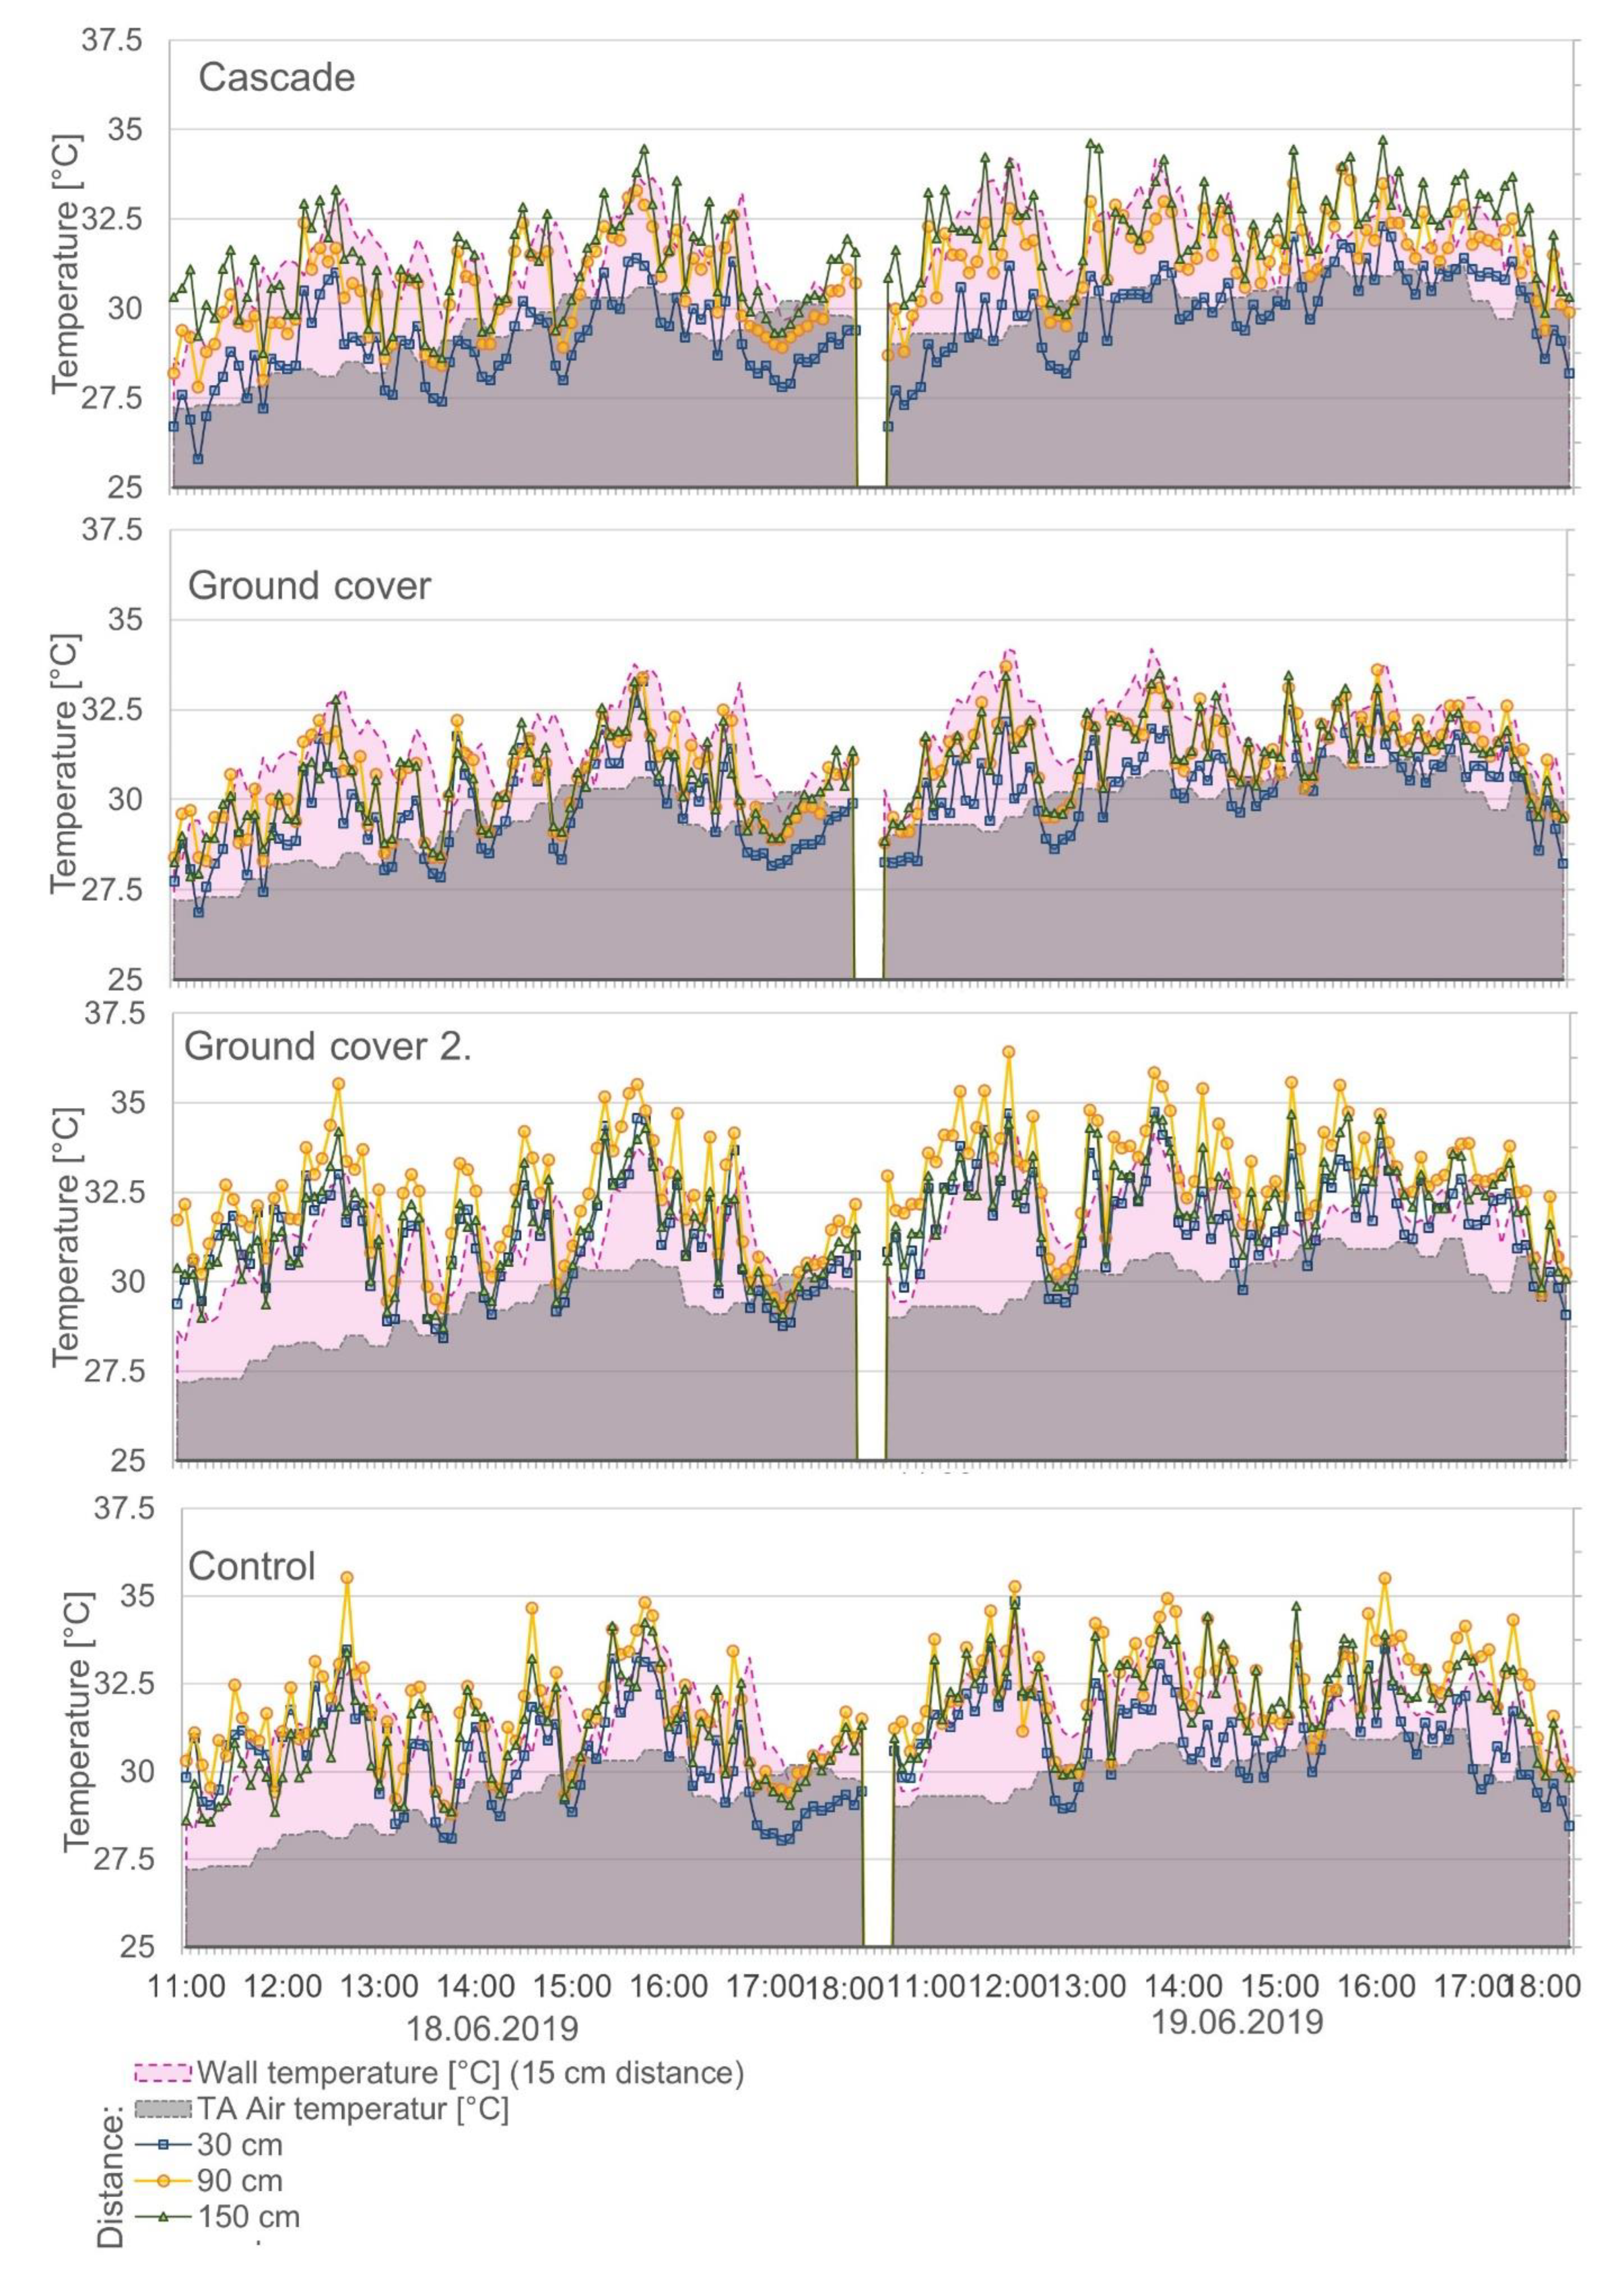
Figure 10 A and A7). We collected temperature data with temperature sensors 30, 90, and 150 cm in front of the experimental wall. For the installation, wooden laths were attached to the experimental wall. Link chains were hung down from the laths, and sensors were attached to the chains. The sensors were covered with the alu pot radiation shield.
We observed significant Tdiffs in front of Cascade at distances of 30 cm and 90 cm compared to Control and Ground cover. Both distances exhibited lower temperatures. However, there were no significant differences between the variants at a distance of 150 cm (
Figure 1 B). Regarding Cascade, the temperature also increased significantly as the distance increased. For the Ground cover and Control variants, we found that the temperature range at 30 cm distance showed significantly lower temperatures compared to distances of 90 cm and 150 cm (
Figure 10 B).
There were minimal differences between the variants and distances when considering the mean values. However, Cascade showed lower maximum temperatures at 30 cm and 90 cm distances than Ground cover and Control (
Figure 10 C).
All variants exhibited significantly higher temperatures compared to the ambient TA. In the daily cycle, we observed that Cascade and Ground cover 1 were either slightly below or equal to the white wall temperature (wall without vegetation/mat). The Control and Ground cover 2 (both hanging on the second row against the wall) recorded temperatures above the wall temperature. Notably, the two repetitions of the Ground cover variant showed distinct differences.
There seemed to be little variation in temperatures among the different distances in the diurnal cycle. For Cascade, it was evident that the temperature at 30 cm distance was significantly lower than at other distances. In Ground cover 2 and Control, temperatures at 90 cm distance were occasionally higher than at 30 cm and 150 cm from the wall. These instances often exhibited spikes above 35 °C, followed by a quick drop (A7).
The IR images vividly depict the surface temperature fluctuations throughout the day (Suppl. 9). Within an hour, the surface temperature rose from 24 °C to 39 °C, then decreased to 24 °C within 2 hours (Figure, 8 B, 18.06. 9 a.m. to 1 p.m., top left). Smaller temperature variation of the surface seems normal during the diurnal cycle (e.g., 19.06.2019, 2:40 p.m. to 3:16 p.m.). Irrigation and solar radiation played a role in these fluctuations. The measured drainage ranged between 4 and 6 liters for all variants. Approximately 14 liters were applied for irrigation, meaning that after each irrigation event (once per hour) [
30], around 8 liters of water were absorbed.
Differences between the planting variants are evident on the 19th of June 2019 at 11:36 a.m. and 1:52 p.m. The Heuchera surface (Cascade, reddish color) and Achillea (Ground cover 2) appeared to warm 2 to 4 K. The Control, covered with moss, also showed a larger area with approximately 5 K higher surface temperature at 11:36 a.m. and cooled down again within 3 hours (
Figure 11). Even within a single variant, significant differences in surface temperatures were observed.
The IR pictures and temperature sensors both demonstrated fluctuating temperature values. While the surface temperatures exhibited a drastic increase at 11:07 a.m. on the 18th of June 2019, this observation was not reflected in the diurnal cycle diagrams (A7). However, the temperature sensors consistently indicated higher temperatures at a distance of 30 cm compared to surface temperatures. While the temperature sensor data suggested that Control and Ground cover 2 had higher temperatures, this cannot be observed in the IR images.
3.9. Climate Data at the Experimental Wall
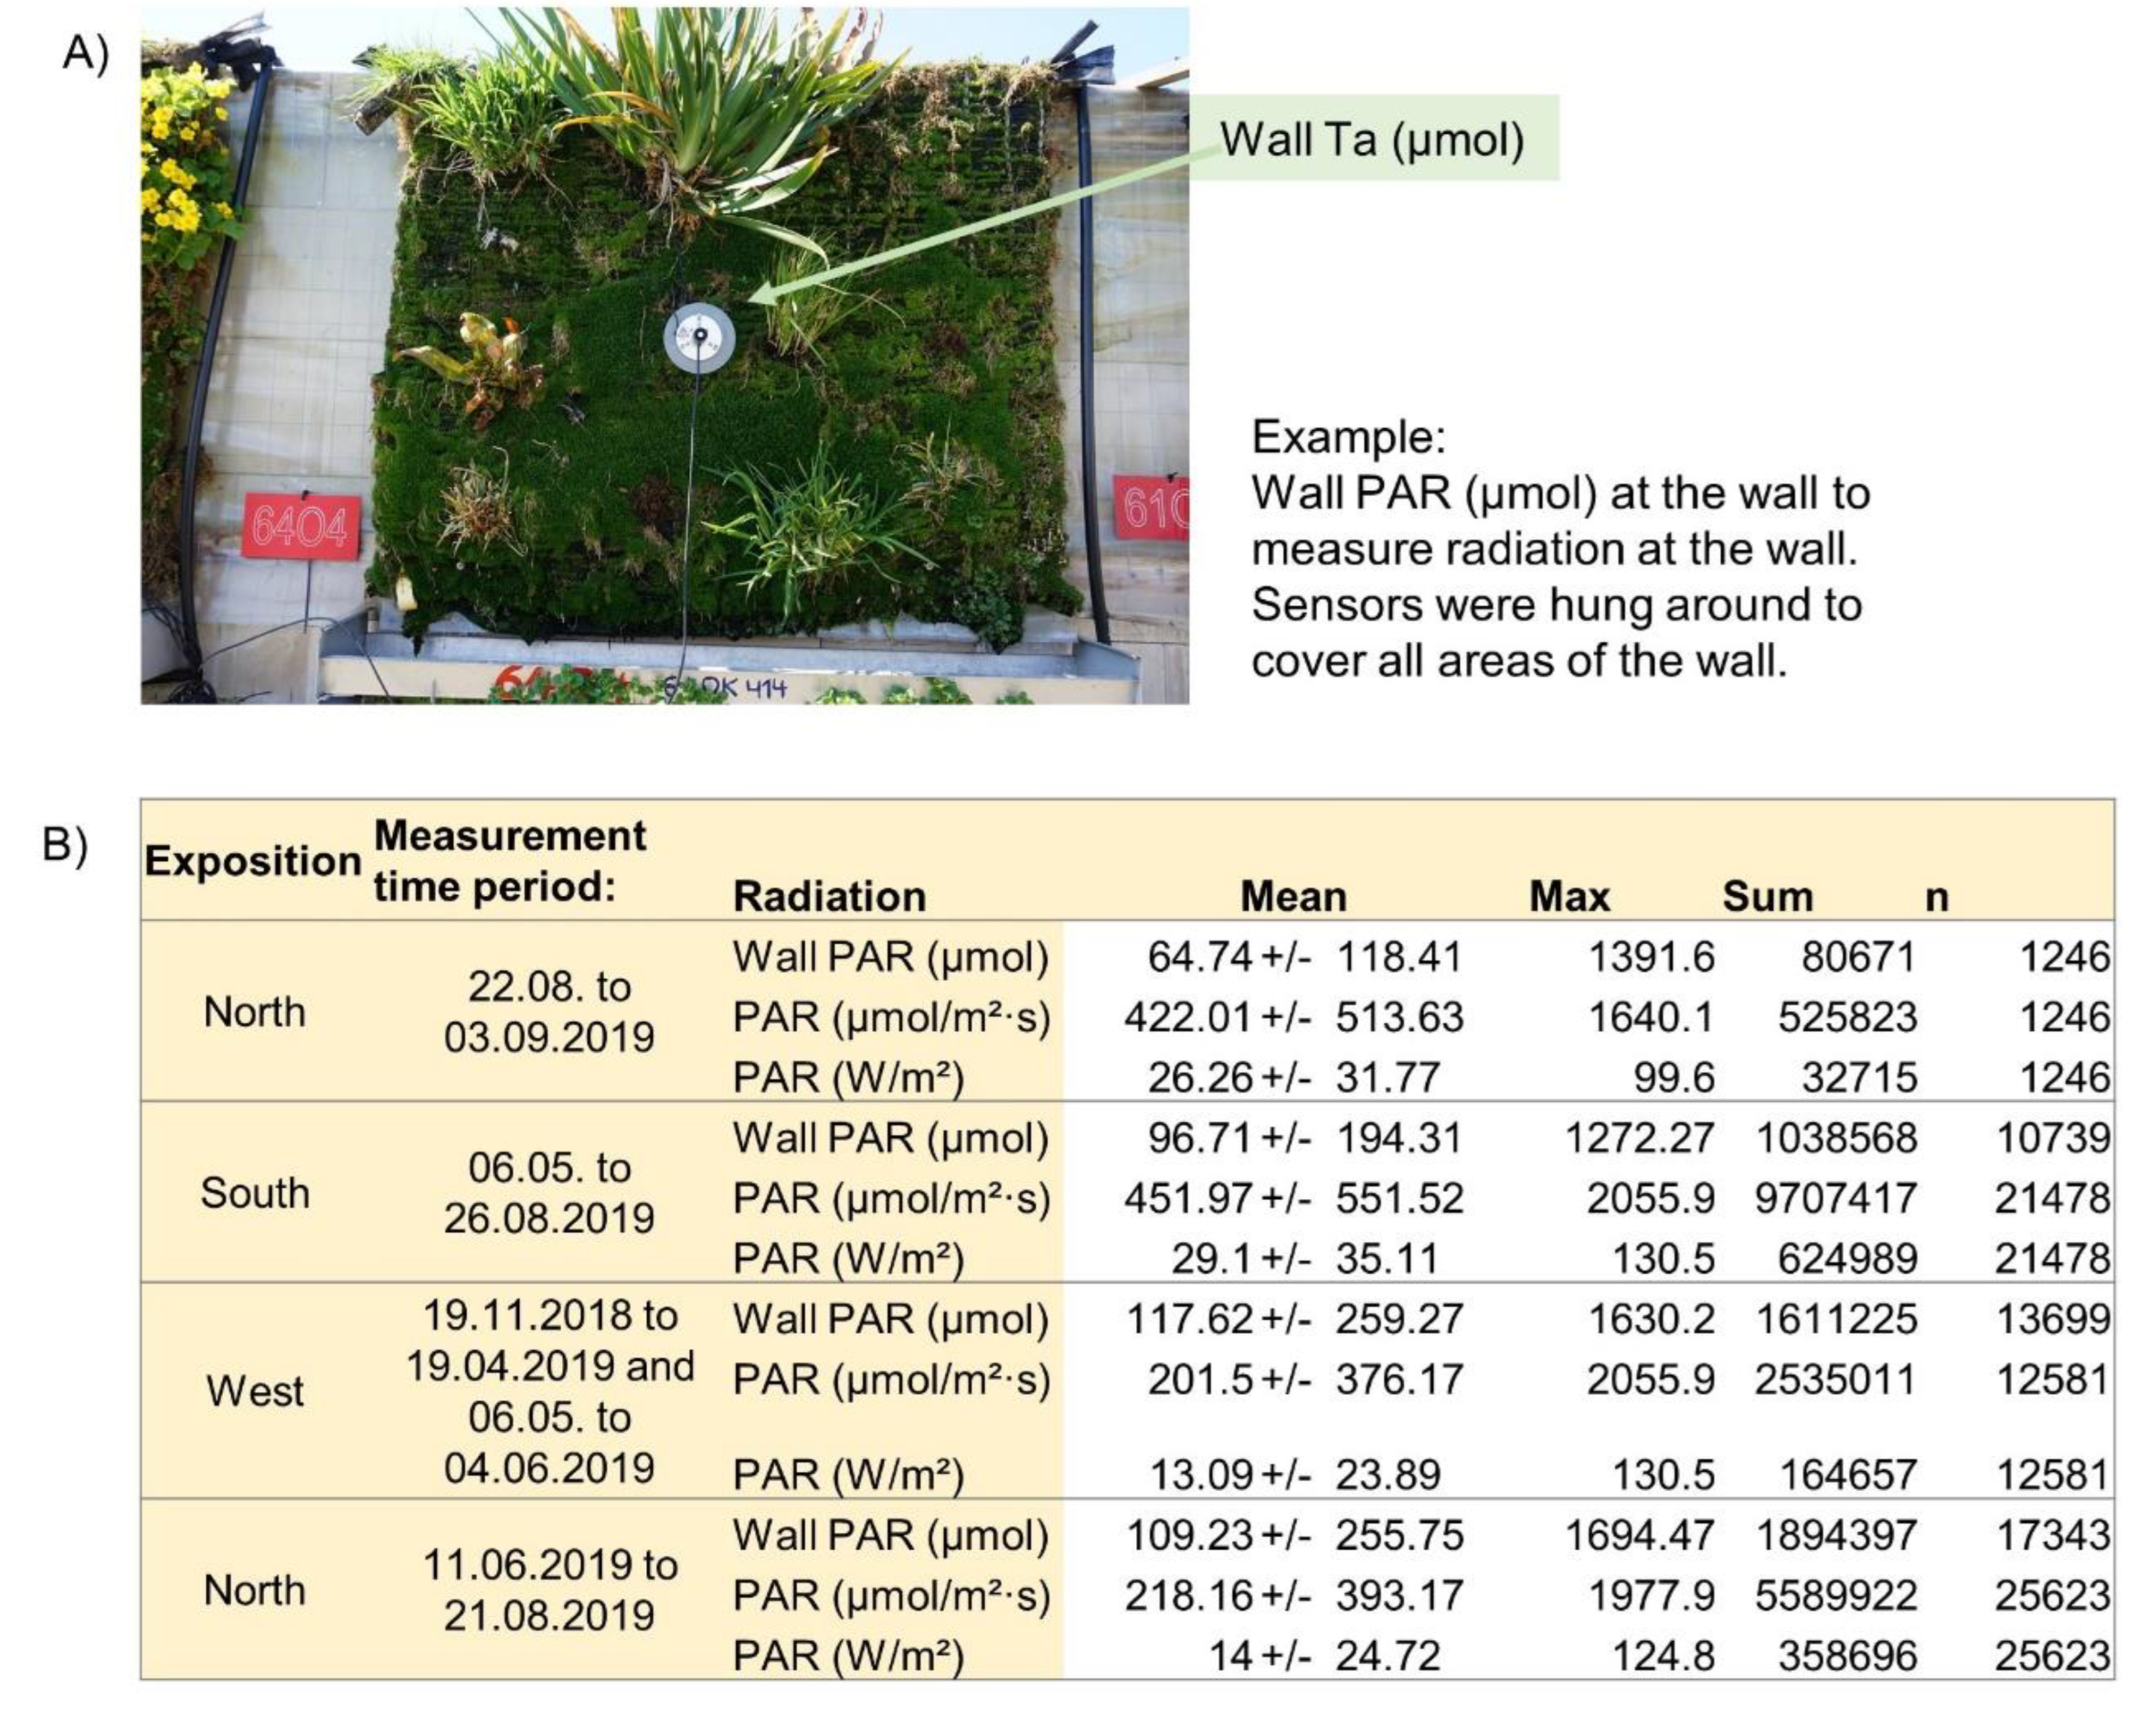
To determine the vertical radiation on the wall, we hung PAR meters, which are typically used horizontally, vertically on the walls. We compared them with radiation data from the field weather station. We observed significantly lower PAR values on the wall (A10).
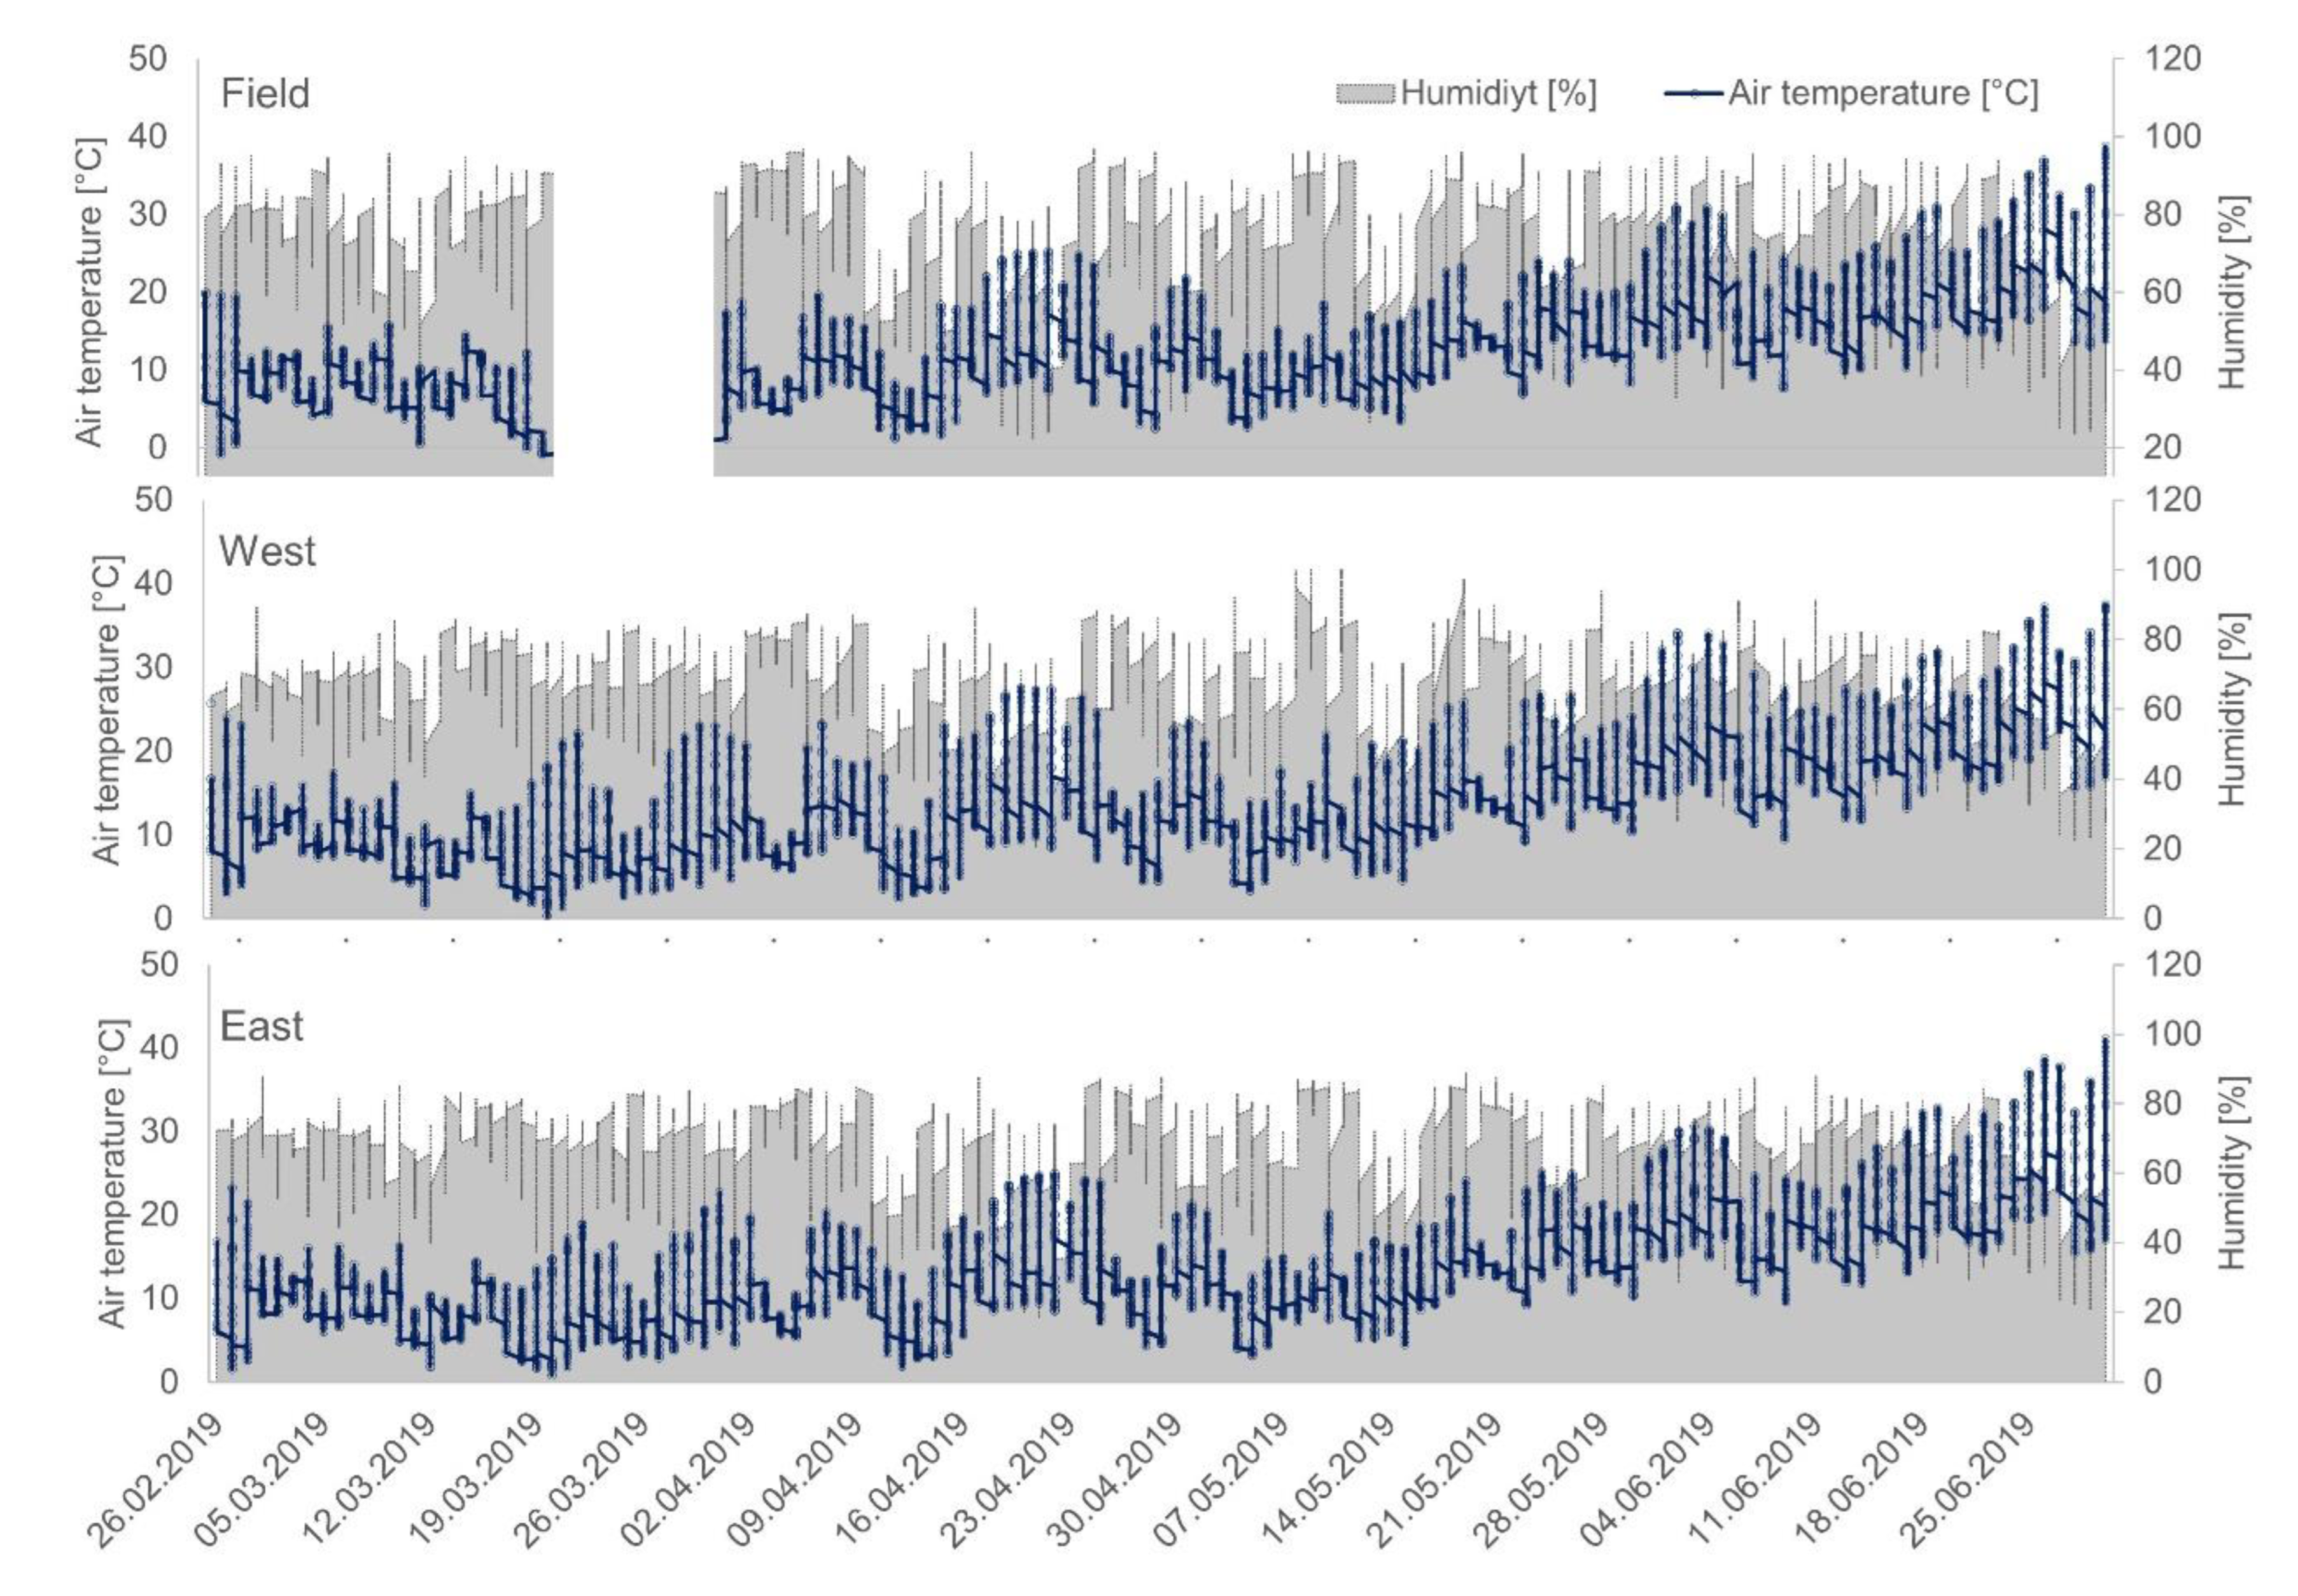
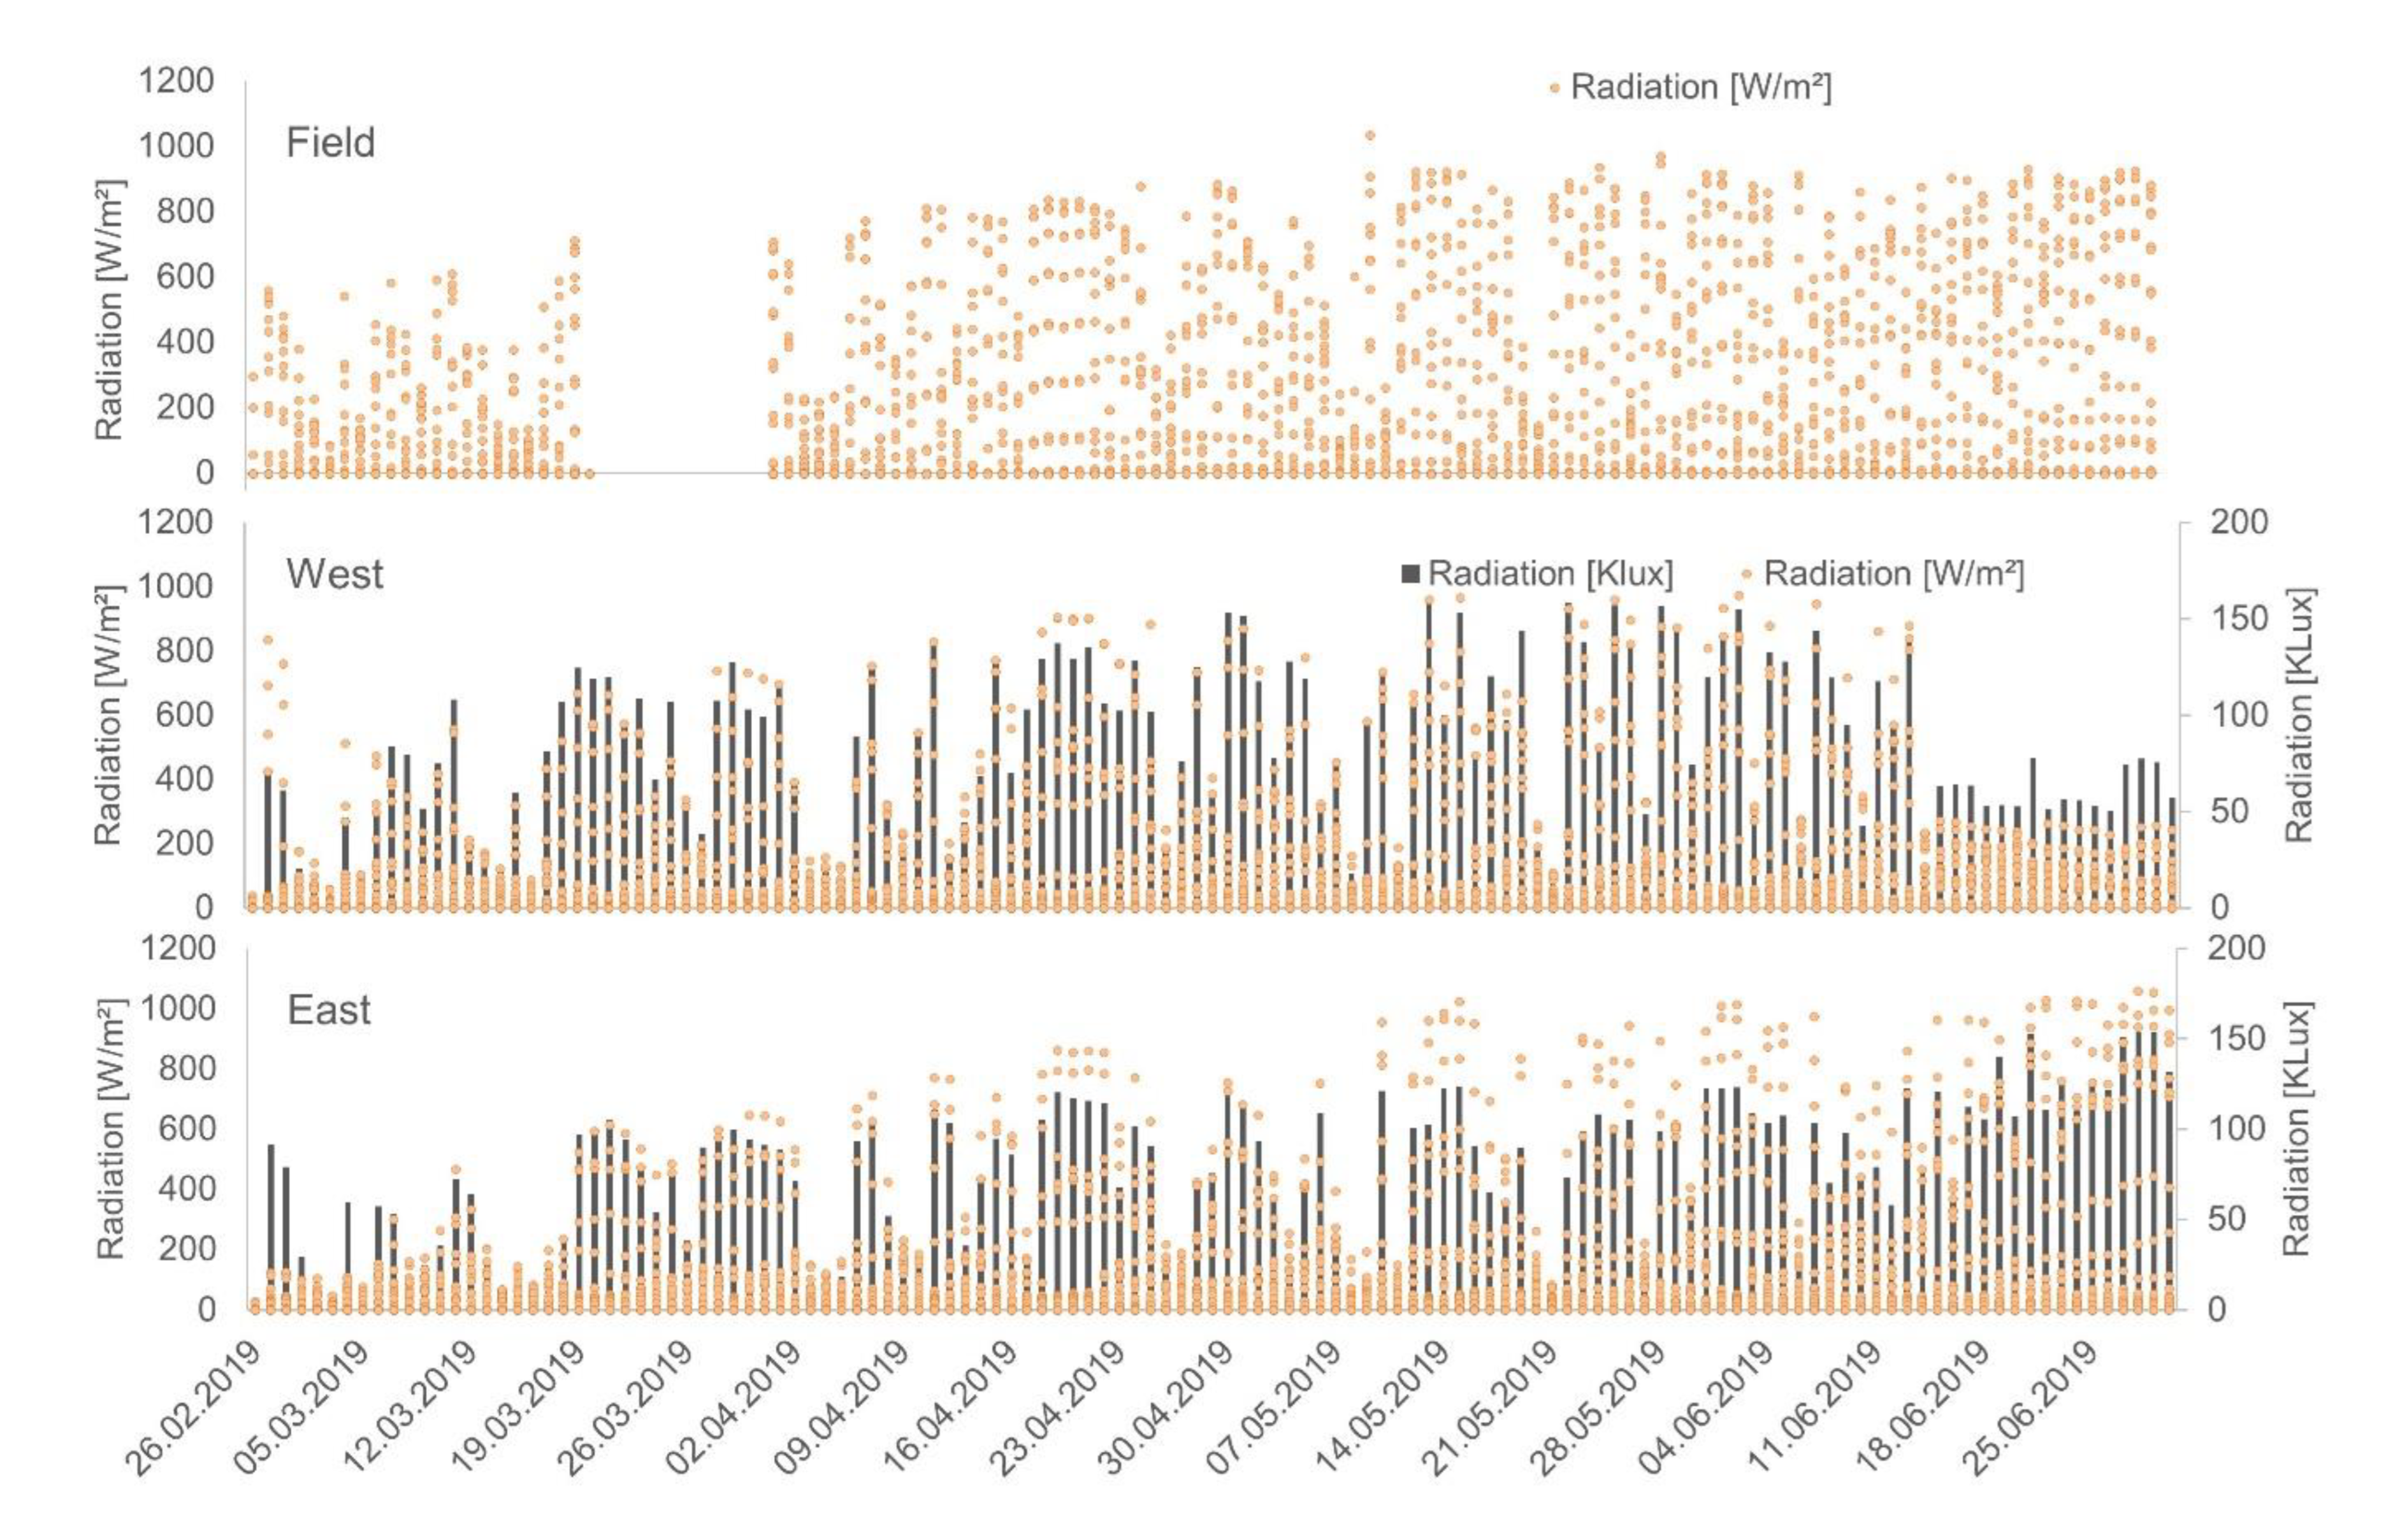
We installed weather stations in the center of both the west and the east walls. We measured from February to June 2019. We compared these data with the data from the weather station nearby (
Figure 12; A8–9 and Suppl. 10). The data from this field weather station were used to calculate the Tdiffs in previous experiments.
The temperature values at all three weather stations were similar (
Figure 12 A). Differences were observed when examining the total radiation (
Figure 12 B). The field weather station recorded a higher total radiation than both wall weather stations. There was only a difference between the east and west weather stations in June, but it was technically related (
Figure 12 C). Looking at individual days throughout the day, it becomes evident that radiation is higher in the morning in the east and higher in the west from midday onwards, compared to the field.
The field weather station partially recorded higher humidity (%) and wind speed (m/s). For precipitation (mm), all weather stations recorded values within the same range. The wind direction (°) differed between the east and west.
4. Discussion
Only a few experiments investigate the ambient temperature effects of plants in LWs. These studies do not apply standardized measurement methods and (mostly) do not include replications of the variants or measurements [
2,
11]. Therefore, comparison of previous data is difficult; yet, these data are used in models/simulations [
11]. There are also models/simulations that run without validation, using data from experiments [
2]. In other cases, the exact procedure was insufficiently explained, so replication of the study is impossible [
2]. Hunter et al. [
2] demanded that scientific experimental design be improved, a sufficient number of replicates be built-in, and modelling studies be validated with data from experiments [
2].
Therefore, we devised different experimental setups in which we measured the temperature of plants in LWs in different time periods and with different sensors. As there are fewer studies about temperature measurement, we attempted different methodological approaches. With these approaches, we wanted to identify influencing factors, the climatic condition of plants at walls, and if the LW system has a cooling effect. We wanted to know: how can temperature be measured inside and in front of LWs? Therefore, we used temperature categories for formation of Tdiffs, soil temperature sensors, and an IR camera.
We had only a small number of temperature sensors available and could only measure a certain number of plants and positions. To compare all plants with each other, we used the approach of forming temperature categories. This means that days with a similar TA were searched for and formed a category. The results of the temperature measurements in the vegetation were compared only within one temperature category. In addition, we calculated the Tdiff (Tdiff) from the TV and the TA. We have aimed to compare the temperature data of the different species measured at different time intervals. However, we found that the influence of the TA was substantial, so it was impossible to compare the data outside the temperature categories. Comparison of data within a temperature category yielded successful results, such as in the experiment to study the influence of biomass on temperature. We could not confirm this finding in another experiment measuring the temperature of individual plants. Compared to the TA, the Ground cover plant species on the east and west exposures had the lowest temperature.
In contrast, the vegetation on the north and south exposures had higher temperatures in a comparable temperature category. However, these results cannot be effectively compared in a category or with Tdiffs due to considerable differences in measurement periods. Therefore, we concluded that temperature categories and calculation of Tdiffs based on TA are useful when seasonal variations are not too far apart.
We conducted experiments to assess the usefulness of soil temperature sensors in measuring temperature and to determine if they are affected by radiation errors that can be minimized by using alu pot covers. Our experiments showed that vegetation or surface temperature exhibited a wider range of temperature values compared to TA. This difference could be attributed to the variations in measurement methods between TA and vegetation sensors. We devised a radiation protection method—using pots covered with aluminum foil (alu pot)—to mitigate radiation errors. It is worth noting that the psychrometer also recorded lower temperature values compared to the alu pots. This discrepancy may be due to a lack of air exchange caused by the protective covering or the covering material's heat absorption and retention properties.
Nevertheless, despite these factors, we decided to use the alu pots as a means of protection, as they yielded lower temperature values than the sensors without any protection. Acknowledging that the measured results still carry a radiation error is important. We strongly recommend using appropriate TA sensors to minimize such errors, particularly those placed at a distance from LWs.
Compared to the temperature sensors, we wanted to explore the results of an IR camera. In contrast to the sensors, the IR images exhibited a much stronger variation or dynamic range of temperature values within minutes. Additionally, the images allowed for a more detailed differentiation of surface temperatures among individual plants and variants. Overall, the IR images showed lower temperatures compared to those recorded by the sensors. It is also noticeable that the cooling effect of irrigation was visible in the surface temperature when watering had occurred, which was not evident in the sensor readings.
We aimed to identify influencing factors on the TV at the LW. We found that temperature data differed because of (1) climatic conditions, (2) exposure, (3) measurement positions, and (4) plant species, planting variant, and biomass.
(1) We argue that climatic conditions, particularly TA, and external environmental factors have a greater influence on temperature and potential cooling effects in front of or within the vegetation of the LW rather than the vegetation itself. In all our experimental setups, we observed that TA determined the temperature of the vegetation or its immediate surroundings. It was evident that the measured temperatures closely followed the pattern of the TA. For instance, we noticed a significant temperature increase within the inner part of the vegetation layer at the beginning of the day on the east side, where solar radiation is high. We could only compare temperatures within the temperature categories, since even the calculated Tdiffs were strongly influenced by the climatic conditions. It was apparent that the cooling effect was minimal at cooler TAs (< 22°C) and only measurable at higher external temperatures (above approximately 22°C). Gräf et al. [
24] also demonstrated the dependence of TV on TA. They highlighted that Tdiffs were greater on warm days compared to cold ones.
Furthermore, we rarely observed differences among plant variants compared to the control group. This finding suggests that environmental conditions, most likely temperature, impact TV the most.
When using IR cameras, we observed different temperature values, indicating that plants have a microclimatic effect that does not significantly influence the broader environment. In turn, the TA in the surroundings has the greatest impact. Overall, evaporative cooling might not be as pronounced as initially hypothesized. However, numerous studies on insulation effects provide evidence of a temperature effect, suggesting that shading and protection from direct solar radiation are the primary temperature-modulating factors associated with vegetation [
32].
(2) There were minor differences between the exposures. The most noticeable difference was that a higher temperature at a distance of 150 cm from north- and east-facing walls was measured compared to that of the other exposures.
It is possible that our setups and the chosen measurement period in which we compared the exposures were not well chosen. In future experiments, all experimental walls should be compared at the same time and over a longer time.
There were clear differences between the different distances and positions (3). There were partial differences between the individual positions on a mat. Compared to the TA, the mat in the first row (left) was found to be cooler than the TA and the rest of the mat. Conversely, the second and third rows showed higher temperatures than the air. Possibly, these positions were better protected from the wind. It is rather difficult to rule out that the moisture of the mats was lower here, as the mats were overwatered.
One significant finding was the Tdiff (Tdiff) between the distances of 30 cm and 150 cm from the air across all variations and exposures, except for the west exposure with Ground cover. It was observed that temperatures at 150 cm were often significantly higher than the TA. In contrast, the temperature was cooler at distances of 30 cm and 90 cm compared to the distance temperature of 150 cm.
The position behind the LW exhibited fewer significant temperature changes, depending on the daily cycle. Additionally, variations were observed in the positions based on the season and plant variant. In most cases, the front position tended to be warmer, while at night, the back position exhibited higher temperatures, indicating a buffering effect. A similar result was also seen in other studies [
15,
17].
(4) We observed differences in temperature depending on plant species, planting variant, and biomass. On average, all plant variants showed similar reactions. However, there were partial differences observed between plant variants and species. Examining individual plants revealed significant variations in terms of minimum and maximum temperatures. It is important to note that measurements were taken at different time points, limiting their comparability. The measured TV should always be considered in relation to the TA. Based on this, there is a likelihood that the choice of plant species influences the temperature effect.
The amount of biomass in LWs has an impact on temperature. This was evident in the experiment where we observed cooler temperatures in Meadow before the cut during the daytime compared to after the cut. We assume that the experimental wall and the mat/vegetation stored heat at night, as we measured higher temperatures during the nighttime. Plants contribute to a balanced microclimate, resulting in fewer extreme temperatures on the wall.
We found few differences between plant variants, and the Control group exhibited the highest diurnal temperature variations. Overall, our results suggest that temperature variations depend on the plant variant. However, we also observed that repeating the same variant yielded different temperatures, possibly due to the position on the wall (upper or lower row).
Partially, the Control group had higher temperatures during the day than the plant variants. The colour of the mat (black) also certainly played a role in the temperature development. However, our Control group had moss growth, which had similar effects. Thermographic images showed that the plant variants' temperature was lower than the moss, although not consistently. A study by Gräf et al. [
24] found that stressed plants did not demonstrate a different leaf temperature compared to non-stressed plants (range maximum 1 K). They observed a wider span only for Heuchera.
Our experiment showed that temperatures became similar across all variants when irrigation was applied. Since the temperature reduction occurred in both vegetation and Control group, we believe that temperature depends more on irrigation rather than the amount of biomass. Irrigation is essential to achieve a cooling effect [
24].
Studies on plant suitability are rare. One study by Cameron et al. [
19] examined different plants in a facade greening system (pots in front of a wall) under controlled conditions in a greenhouse. They observed a maximum temperature decrease of 7.6 °C and a minimum of 4.3 °C. Other studies did not differ in the temperature measurement between the plant species.
We could only measure a small number of plant species or variants simultaneously. Our results do not provide a conclusive explanation for the different temperatures observed. Further research is needed to investigate the temperature effects of individual plant species and the impact of irrigation and substrate selection.
Our next aim was to describe the climatic conditions for plants, which refers to the experimental environment. It is known that plants on facades are exposed to extreme conditions [
25], and that plants do not evaporate and cool temperature if they are stressed because of extreme conditions [
6]. Therefore, knowing more about the facade conditions for plants in LWs is important.
While measuring the TV, we observed a broader range of temperature values than the TA. This suggests that plants in the LW (presumably referring to the study area) are exposed to significantly different climatic conditions than what "normal" weather stations measure. As a result, we conducted measurements directly at the experimental walls using weather stations. We found similar climate conditions for the walls compared to the field. It is important to note that the measurement period was limited to February through June 2019, focusing on the west and east exposures. Therefore, we cannot conclude that the regular weather data are sufficient to derive wall conditions.
One crucial factor in determining the climatic conditions is the radiation incident on the wall. Typically, radiation is measured horizontally. Even the wall weather stations measured radiation horizontally. However, the plants in our LW were exposed to vertical radiation. Therefore, we attempted to measure the radiation vertically, but it was unsuccessful. Furthermore, we assume these specific parameters significantly differ from the normal horizontal planting conditions.
In general, it should be noted that our experimental walls are not situated in an urban environment. They are located in research areas where several plants and trees are present. There are plastic panels in front of the experimental walls, and in front of the south wall is mypex foil, which heats up. However, there are numerous plants in close proximity, and the weather station where the TA was measured is directly situated in a viticulture research field. Consequently, the results must be interpreted in light of these circumstances.
After analyzing all our results, we aimed to determine if a LW has a cooling effect. While we discovered that TV generally follows the TA and depends on it, we also observed a wider range of temperature values in the vegetation compared to the TA. This temperature range difference could be attributed to variations in the measurement methods for TA and the vegetation sensors.
We partially observed a cooling effect within the vegetation and that the plant variants exhibited lower maximum temperatures than the Control group. However, this varied depending on the plant variant, plant species, time of day, and season. Generally, we can conclude that vegetation acts as a buffer, resulting in warmer temperatures behind the vegetation during the night compared to areas without vegetation.
Measurements taken at distances of 30 cm and 150 cm from the vegetation showed temperature fluctuations both above and below the TA. Therefore, the hypothesized cooling effect was not observed. Furthermore, no significant differences existed between the Control group and the plant variants. Perhaps our LW area was not large enough to measurably affect the surroundings.
Our findings did not achieve the temperature cooling effects described in previous studies [
6]. Generally, we could only detect the cooling effect on a microclimatic scale. We observed several differences between the variants, exposures, plant species, and distances from the wall.
We still assume that there is a microclimatic effect of vegetation, particularly within a 30 cm distance. The greater impact of vegetation likely lies in shading the facade, protecting it from direct radiation. Additionally, vegetation can buffer extreme temperatures and store heat during the winter.
We also affirm that further research is required to describe or predict the temperature effect of LWs under different conditions and different LW characteristics [
11]. In future experiments, it would be beneficial to carry out long-term temperature measurements at different distances and positions, using different plant species.
