Submitted:
13 June 2023
Posted:
13 June 2023
You are already at the latest version
Abstract
Keywords:
1. Introduction
2. Source Selection and Data Reduction
3. Results
4. Conclusions
Acknowledgments
References
- Dermer, C.D.; Giebels, B. Active galactic nuclei at gamma-ray energies. C R Phys. 2016, 17, 594–616, [1602.06592].
- Gaidos, J.A.; Akerlof, C.W.; Biller, S.; Boyle, P.J.; Breslin, A.C.; Buckley, J.H.; Carter-Lewis, D.A.; Catanese, M.; Cawley, M.F.; Fegan, D.J.; et al. Extremely rapid bursts of TeV photons from the active galaxy Markarian 421. Nature 1996, 383, 319–320. [CrossRef]
- Aharonian, F.; Akhperjanian, A.G.; Anton, G.; Barres de Almeida, U.; Bazer-Bachi, A.R.; Becherini, Y.; Behera, B.; Benbow, W.; Bernlöhr, K.; Boisson, C.; et al. Simultaneous multiwavelength observations of the second exceptional γ-ray flare of PKS 2155-304 in July 2006. A&A 2009, 502, 749–770, [arXiv:astro-ph.CO/0906.2002]. [CrossRef]
- Abeysekara, A.U.; Benbow, W.; Bird, R.; Brill, A.; Brose, R.; Buchovecky, M.; Buckley, J.H.; Christiansen, J.L.; Chromey, A.J.; Daniel, M.K.; et al. The Great Markarian 421 Flare of 2010 February: Multiwavelength Variability and Correlation Studies. The Astrophysical Journal 2020, 890, 97, [arXiv:astro-ph.HE/2002.03567]. [CrossRef]
- Aranzana, E.; Körding, E.; Uttley, P.; Scaringi, S.; Bloemen, S. Short time-scale optical variability properties of the largest AGN sample observed with Kepler/K2. Monthly Notices of the Royal Astronomical Society 2018, 476, 2501–2515, [arXiv:astro-ph.HE/1802.08058]. [CrossRef]
- Kim, J.; Karouzos, M.; Im, M.; Choi, C.; Kim, D.; Jun, H.D.; Lee, J.H.; Mezcua, M. Intra-Night Optical Variability of Active Galactic Nuclei in the Cosmos Field with the KMTNet. Journal of Korean Astronomical Society 2018, 51, 89–110, [arXiv:astro-ph.GA/1809.01350]. [CrossRef]
- Goyal, A. A Comparative Study of Multiwavelength Blazar Variability on Decades to Minutes Timescales. Galaxies 2018, 6. [CrossRef]
- Blandford, R.D.; Levinson, A. Pair Cascades in Extragalactic Jets. I. Gamma Rays. Astrophysical Journal 1995, 441, 79. [CrossRef]
- Georganopoulos, M.; Aharonian, F.A.; Kirk, J.G. External Compton emission from relativistic jets in Galactic black hole candidates and ultraluminous X-ray sources. Astronomy & Astrophysics 2002, 388, L25–L28, [arXiv:astro-ph/astro-ph/0110379]. [CrossRef]
- Sikora, M.; Begelman, M.C.; Rees, M.J. Comptonization of Diffuse Ambient Radiation by a Relativistic Jet: The Source of Gamma Rays from Blazars? Astrophysical Journal 1994, 421, 153. [CrossRef]
- Böttcher, M.; Reimer, A.; Sweeney, K.; Prakash, A. Leptonic and Hadronic Modeling of Fermi-detected Blazars. Astrophysical Journal 2013, 768, 54, [arXiv:astro-ph.HE/1304.0605]. [CrossRef]
- Mannheim, K.; Biermann, P.L. Gamma-ray flaring of 3C 279 : a proton-initiated cascade in the jet ? Astronomy and Astrophysics 1992, 253, L21–L24.
- Kovalev, Y.Y.; Kardashev, N.S.; Kellermann, K.I.; Lobanov, A.P.; Johnson, M.D.; Gurvits, L.I.; Voitsik, P.A.; Zensus, J.A.; Anderson, J.M.; Bach, U.; et al. RadioAstron Observations of the Quasar 3C273: A Challenge to the Brightness Temperature Limit. The Astrophysical Journal Letters 2016, 820, L9, [arXiv:astro-ph.HE/1601.05806]. [CrossRef]
- Ghisellini, G.; Tavecchio, F. Canonical high-power blazars. Monthly Notices of the Royal Astronomical Society 2009, 397, 985–1002, [arXiv:astro-ph.CO/0902.0793]. [CrossRef]
- Dermer, C.D.; Finke, J.D.; Krug, H.; Böttcher, M. Gamma-Ray Studies of Blazars: Synchro-Compton Analysis of Flat Spectrum Radio Quasars. The Astrophysical Journal 2009, 692, 32–46, [arXiv:astro-ph/0808.3185]. [CrossRef]
- Foschini, L.; Ghisellini, G.; Tavecchio, F.; Bonnoli, G.; Stamerra, A. Search for the shortest variability at gamma rays in flat-spectrum radio quasars. Astronomy & Astrophysics 2011, 530, A77, [arXiv:astro-ph.HE/1101.1085]. [CrossRef]
- Donea, A.C.; Protheroe, R.J. Gamma Ray and Infrared Emission from the M87 Jet and Torus. Progress of Theoretical Physics Supplement 2003, 151, 186–191, [arXiv:astro-ph/astro-ph/0303522]. [CrossRef]
- Liu, H.T.; Bai, J.M. Absorption of 10-200 GeV Gamma Rays by Radiation from Broad-Line Regions in Blazars. The Astrophysical Journal 2006, 653, 1089–1097, [arXiv:astro-ph/0807.3135]. [CrossRef]
- Acharyya, A.; Chadwick, P.M.; Brown, A.M. Locating the gamma-ray emission region in the brightest Fermi-LAT flat-spectrum radio quasars. Monthly Notices of the Royal Astronomical Society 2021, 500, 5297–5321, [arXiv:astro-ph.HE/2011.01073]. [CrossRef]
- Liodakis, I.; Romani, R.W.; Filippenko, A.V.; Kocevski, D.; Zheng, W. Probing Blazar Emission Processes with Optical/Gamma-Ray Flare Correlations. The Astrophysical Journal 2019, 880, 32, [arXiv:astro-ph.HE/1905.11418]. [CrossRef]
- de Jaeger, T.; Shappee, B.J.; Kochanek, C.S.; Hinkle, J.T.; Garrappa, S.; Liodakis, I.; Franckowiak, A.; Stanek, K.Z.; Beacom, J.F.; Prieto, J.L. Optical/γ-ray blazar flare correlations: understanding the high-energy emission process using ASAS-SN and Fermi light curves. Monthly Notices of the Royal Astronomical Society 2023, 519, 6349–6380, [arXiv:astro-ph.HE/2210.16329]. [CrossRef]
- Krawczynski, H.; Hughes, S.B.; Horan, D.; Aharonian, F.; Aller, M.F.; Aller, H.; Boltwood, P.; Buckley, J.; Coppi, P.; Fossati, G.; et al. Multiwavelength Observations of Strong Flares from the TeV Blazar 1ES 1959+650. The Astrophysical Journal 2004, 601, 151–164, [arXiv:astro-ph/astro-ph/0310158]. [CrossRef]
- Atwood, W.B.; Abdo, A.A.; Ackermann, M.; Althouse, W.; Anderson, B.; Axelsson, M.; Baldini, L.; Ballet, J.; Band, D.L.; Barbiellini, G.; et al. The Large Area Telescope on the Fermi Gamma-Ray Space Telescope Mission. The Astrophysical Journal 2009, 697, 1071–1102, [arXiv:astro-ph.IM/0902.1089]. [CrossRef]
- Cohen, D.P.; Romani, R.W.; Filippenko, A.V.; Cenko, S.B.; Lott, B.; Zheng, W.; Li, W. TEMPORAL CORRELATIONS BETWEEN OPTICAL AND GAMMA-RAY ACTIVITY IN BLAZARS. The Astrophysical Journal 2014, 797, 137. [CrossRef]
- Fuhrmann, L.; Larsson, S.; Chiang, J.; Angelakis, E.; Zensus, J.A.; Nestoras, I.; Krichbaum, T.Â.P.; Ungerechts, H.; Sievers, A.; Pavlidou, V.; et al. Detection of significant cm to sub-mm band radio and γ-ray correlated variability in Fermi bright blazars. Monthly Notices of the Royal Astronomical Society 2014, 441, 1899–1909, [arXiv:astro-ph.HE/1403.4170]. [CrossRef]
- Max-Moerbeck, W.; Hovatta, T.; Richards, J.L.; King, O.G.; Pearson, T.J.; Readhead, A.C.S.; Reeves, R.; Shepherd, M.C.; Stevenson, M.A.; Angelakis, E.; et al. Time correlation between the radio and gamma-ray activity in blazars and the production site of the gamma-ray emission. Monthly Notices of the Royal Astronomical Society 2014, 445, 428–436, [arXiv:astro-ph.HE/1408.6264]. [CrossRef]
- Tonry, J.L.; Denneau, L.; Heinze, A.N.; Stalder, B.; Smith, K.W.; Smartt, S.J.; Stubbs, C.W.; Weiland, H.J.; Rest, A. ATLAS: A High-cadence All-sky Survey System. Publications of the Astronomical Society of the Pacific 2018, 130, 064505, [arXiv:astro-ph.IM/1802.00879]. [CrossRef]
- Welsh, W.F. On the Reliability of Cross-Correlation Function Lag Determinations in Active Galactic Nuclei. Publications of the Astronomical Society of the Pacific 1999, 111, 1347–1366, [arXiv:astro-ph/astro-ph/9911112]. [CrossRef]
- Sadun, A.C.; Asadi-Zeydabadi, M.; Mills, B.; Moody, J.W. Statistical Analysis of the Microvariable AGN Source Mrk 501. Galaxies 2018, 6. [CrossRef]
- Smith, K.W.; Smartt, S.J.; Young, D.R.; Tonry, J.L.; Denneau, L.; Flewelling, H.; Heinze, A.N.; Weiland, H.J.; Stalder, B.; Rest, A.; et al. Design and Operation of the ATLAS Transient Science Server. Publications of the Astronomical Society of the Pacific 2020, 132, 085002, [arXiv:astro-ph.IM/2003.09052]. [CrossRef]
- Heinze, A.N.; Tonry, J.L.; Denneau, L.; Flewelling, H.; Stalder, B.; Rest, A.; Smith, K.W.; Smartt, S.J.; Weiland, H. A First Catalog of Variable Stars Measured by the Asteroid Terrestrial-impact Last Alert System (ATLAS). The Astronomical Journal 2018, 156, 241, [arXiv:astro-ph.SR/1804.02132]. [CrossRef]
- Wood, M.; Caputo, R.; Charles, E.; Di Mauro, M.; Magill, J.; Perkins, J.S.; Fermi-LAT Collaboration. Fermipy: An open-source Python package for analysis of Fermi-LAT Data. In Proceedings of the 35th International Cosmic Ray Conference (ICRC2017), 2017, Vol. 301, International Cosmic Ray Conference, p. 824, [arXiv:astro-ph.IM/1707.09551].
- Atwood, W.; Albert, A.; Baldini, L.; Tinivella, M.; Bregeon, J.; Pesce-Rollins, M.; Sgrò, C.; Bruel, P.; Charles, E.; Drlica-Wagner, A.; et al. Pass 8: Toward the Full Realization of the Fermi-LAT Scientific Potential. arXiv e-prints 2013, p. arXiv:1303.3514, [arXiv:astro-ph.IM/1303.3514].
- Fermi-LAT collaboration.; :.; Abdollahi, S.; Acero, F.; Baldini, L.; Ballet, J.; Bastieri, D.; Bellazzini, R.; Berenji, B.; Berretta, A.; et al. Incremental Fermi Large Area Telescope Fourth Source Catalog. arXiv e-prints 2022, p. arXiv:2201.11184, [arXiv:astro-ph.HE/2201.11184].
- Meyer, M.; Scargle, J.D.; Blandford, R.D. Characterizing the Gamma-Ray Variability of the Brightest Flat Spectrum Radio Quasars Observed with the Fermi LAT. The Astrophysical Journal 2019, 877, 39, [arXiv:astro-ph.HE/1902.02291]. [CrossRef]
- Max-Moerbeck, W.; Richards, J.L.; Hovatta, T.; Pavlidou, V.; Pearson, T.J.; Readhead, A.C.S. A method for the estimation of the significance of cross-correlations in unevenly sampled red-noise time series. Monthly Notices of the Royal Astronomical Society 2014, 445, 437–459, [arXiv:astro-ph.IM/1408.6265]. [CrossRef]
- Edelson, R.A.; Krolik, J.H. The Discrete Correlation Function: A New Method for Analyzing Unevenly Sampled Variability Data. The Astrophysical Journal 1988, 333, 646. [CrossRef]
- Uttley, P.; Edelson, R.; McHardy, I.M.; Peterson, B.M.; Markowitz, A. Correlated Long-Term Optical and X-Ray Variations in NGC 5548. The Astrophysical Journal Letters 2003, 584, L53–L56, [arXiv:astro-ph/astro-ph/0301216]. [CrossRef]
- Emmanoulopoulos, D.; McHardy, I.M.; Papadakis, I.E. Generating artificial light curves: revisited and updated. Monthly Notices of the Royal Astronomical Society 2013, 433, 907–927, [arXiv:astro-ph.IM/1305.0304]. [CrossRef]
- Böttcher, M. Modeling the emission processes in blazars. arXiv 2007, arXiv:0608713. [CrossRef]
- Ackermann, M.; Ajello, M.; Allafort, A.; Antolini, E.; Barbiellini, G.; Bastieri, D.; Bellazzini, R.; Bissaldi, E.; Bonamente, E.; Bregeon, J.; et al. Multifrequency Studies of the Peculiar Quasar 4C +21.35 during the 2010 Flaring Activity. The Astrophysical Journal 2014, 786, 157, [arXiv:astro-ph.HE/1403.7534]. [CrossRef]
- Ong, R.A. Discovery of VHE Gamma-Ray Emission from the Fermi-LAT Source 1ES 0502+675. The Astronomer’s Telegram 2009, 2301, 1.
- Acciari, V.A.; Aliu, E.; Beilicke, M.; Benbow, W.; Böttcher, M.; Bradbury, S.M.; Buckley, J.H.; Bugaev, V.; Butt, Y.; Celik, O.; et al. VERITAS Discovery of >200 GeV Gamma-Ray Emission from the Intermediate-Frequency-Peaked BL Lacertae Object W Comae. The Astrophysical Journal Letters 2008, 684, L73, [arXiv:astro-ph/0808.0889]. [CrossRef]
- Ong, R.A. VERITAS reports a High Gamma-ray Flux from VER J0521+211. The Astronomer’s Telegram 2009, 2309, 1.
- Acharyya, A.; Adams, C.; Archer, A.; Bangale, P.; Benbow, W.; Brill, A.; Christiansen, J.; Chromey, A.; Errando, M.; Falcone, A.; et al. VERITAS discovery of very high energy gamma-ray emission from S3 1227+25 and multiwavelength observations. arXiv e-prints 2023, p. arXiv:2305.02860, [arXiv:astro-ph.HE/2305.02860]. [CrossRef]
- H. E. S. S. Collaboration.; Abramowski, A.; Acero, F.; Aharonian, F.; Akhperjanian, A.G.; Anton, G.; Balzer, A.; Barnacka, A.; Barres de Almeida, U.; Becherini, Y.; et al. Discovery of hard-spectrum γ-ray emission from the BL Lacertae object 1ES 0414+009. Astronomy & Astrophysics 2012, 538, A103, [arXiv:astro-ph.HE/1201.2044]. [CrossRef]
- Acciari, V.; Aliu, E.; Arlen, T.; Bautista, M.; Beilicke, M.; Benbow, W.; Böttcher, M.; Bradbury, S.M.; Buckley, J.H.; Bugaev, V.; et al. Discovery of Very High Energy Gamma-ray Radiation from the BL Lac 1ES 0806+524. The Astrophysical Journal Letters 2009, 690, L126–L129, [arXiv:astro-ph/0812.0978]. [CrossRef]
- Ong, R.A.; VERITAS Collaboration.; Paneque, D.; Fermi Large Area Telescope. VERITAS Discovery of Very High-Energy Gamma-Ray Emission from 1FGL J0648.8+1516. The Astronomer’s Telegram 2010, 2486, 1.
- Swordy, S. Discovery of >100 GeV Gamma-ray Emission from the Blazar 3C66A by VERITAS. The Astronomer’s Telegram 2008, 1753, 1.
- Mariotti, M. Discovery of Very High Energy Gamma-Ray Emission from 1ES 1215+303 by MAGIC. The Astronomer’s Telegram 2011, 3100, 1.
- Ong, R. VERITAS Discovery of VHE Gamma-Ray Emission from BL Lac object RGB J0710+591. The Astronomer’s Telegram 2009, 1941, 1.
- Nishiyama, T. Detection of a new TeV gamma-ray source of BL Lac object 1ES 1959+650. In Proceedings of the 26th International Cosmic Ray Conference (ICRC26), Volume 3, 1999, Vol. 3, International Cosmic Ray Conference, p. 370.
- Aharonian, F.; Akhperjanian, A.G.; Barres de Almeida, U.; Bazer-Bachi, A.R.; Behera, B.; Beilicke, M.; Benbow, W.; Bernlöhr, K.; Boisson, C.; Bolz, O.; et al. New constraints on the mid-IR EBL from the HESS discovery of VHE γ-rays from 1ES 0229+200. Astronomy & Astrophysics 2007, 475, L9–L13, [arXiv:astro-ph/0709.4584]. [CrossRef]
- Ong, R.A. Discovery of Very High Energy Gamma-ray Emission from the Blazar 1ES 1440+122. The Astronomer’s Telegram 2010, 2786, 1.
- Punch, M.; Akerlof, C.W.; Cawley, M.F.; Chantell, M.; Fegan, D.J.; Fennell, S.; Gaidos, J.A.; Hagan, J.; Hillas, A.M.; Jiang, Y.; et al. Detection of TeV photons from the active galaxy Markarian 421. Nature 1992, 358, 477–478. [CrossRef]
- Albert, J.; Aliu, E.; Anderhub, H.; Antoranz, P.; Armada, A.; Asensio, M.; Baixeras, C.; Barrio, J.A.; Bartelt, M.; Bartko, H.; et al. Discovery of Very High Energy Gamma Rays from 1ES 1218+30.4. The Astrophysical Journal Letters 2006, 642, L119–L122, [arXiv:astro-ph/astro-ph/0603529]. [CrossRef]
- Albert, J.; Aliu, E.; Anderhub, H.; Antoranz, P.; Armada, A.; Baixeras, C.; Barrio, J.A.; Bartko, H.; Bastieri, D.; Becker, J.K.; et al. Discovery of Very High Energy γ-Rays from 1ES 1011+496 at z = 0.212. The Astrophysical Journal Letters 2007, 667, L21–L24, [arXiv:astro-ph/0706.4435]. [CrossRef]
- Quinn, J.; Akerlof, C.W.; Biller, S.; Buckley, J.; Carter-Lewis, D.A.; Cawley, M.F.; Catanese, M.; Connaughton, V.; Fegan, D.J.; Finley, J.P.; et al. Detection of Gamma Rays with E > 300 GeV from Markarian 501. The Astrophysical Journal Letters 1996, 456, L83. [CrossRef]
- Acciari, V.A.; Aliu, E.; Arlen, T.; Aune, T.; Bautista, M.; Beilicke, M.; Benbow, W.; Böttcher, M.; Boltuch, D.; Bradbury, S.M.; et al. Discovery of Very High Energy Gamma Rays from PKS 1424+240 and Multiwavelength Constraints on Its Redshift. The Astrophysical Journal Letters 2010, 708, L100–L106, [arXiv:astro-ph.CO/0912.0730]. [CrossRef]
| 1 |
http://tevcat2.uchicago.edu/ (accessed on 03/06/2023) |
| 2 |
http://fermi.gsfc.nasa.gov/ssc/data/analysis/software (accessed on 03/06/2023) |
| 3 |
http://fermipy.readthedocs.io (accessed on 03/06/2023) |
| 4 | This was implemented using the gta.lightcurve() method in FERMIPY. |
| 5 | The code was developed from Connolly, S. D., 2016, Astrophysics Source Code Library, record ascl:1602.012. See https://github.com/samconnolly/DELightcurveSimulation. |
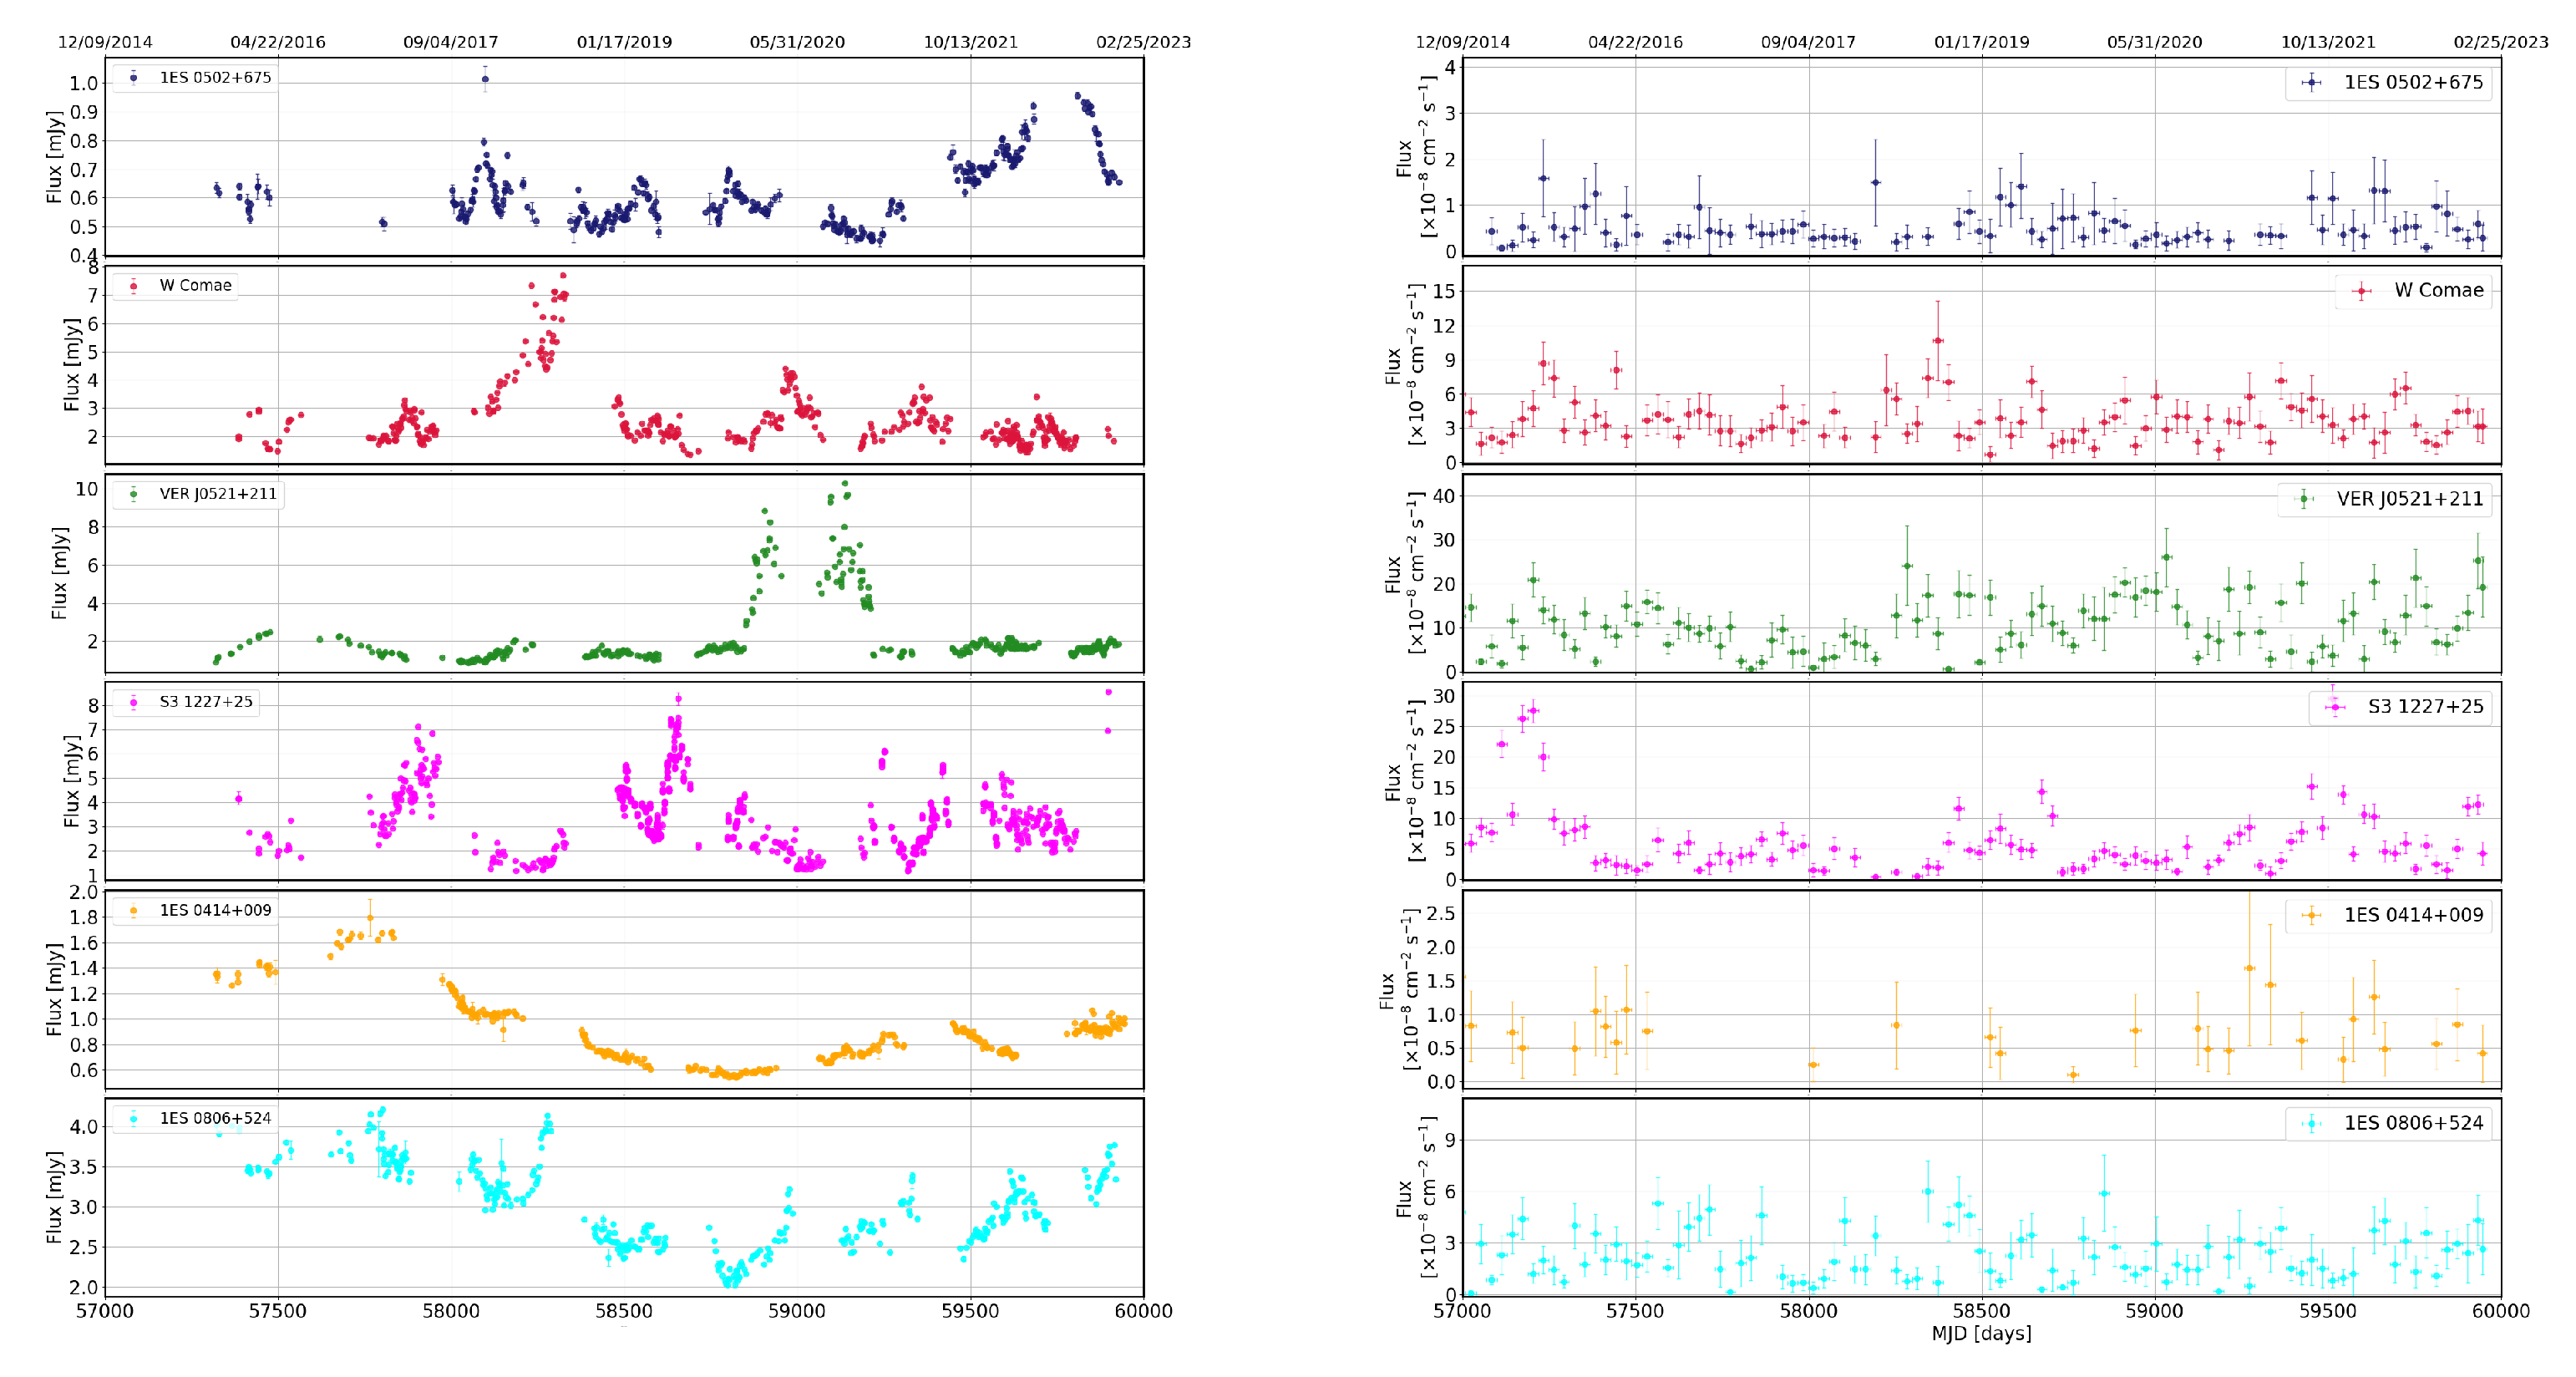
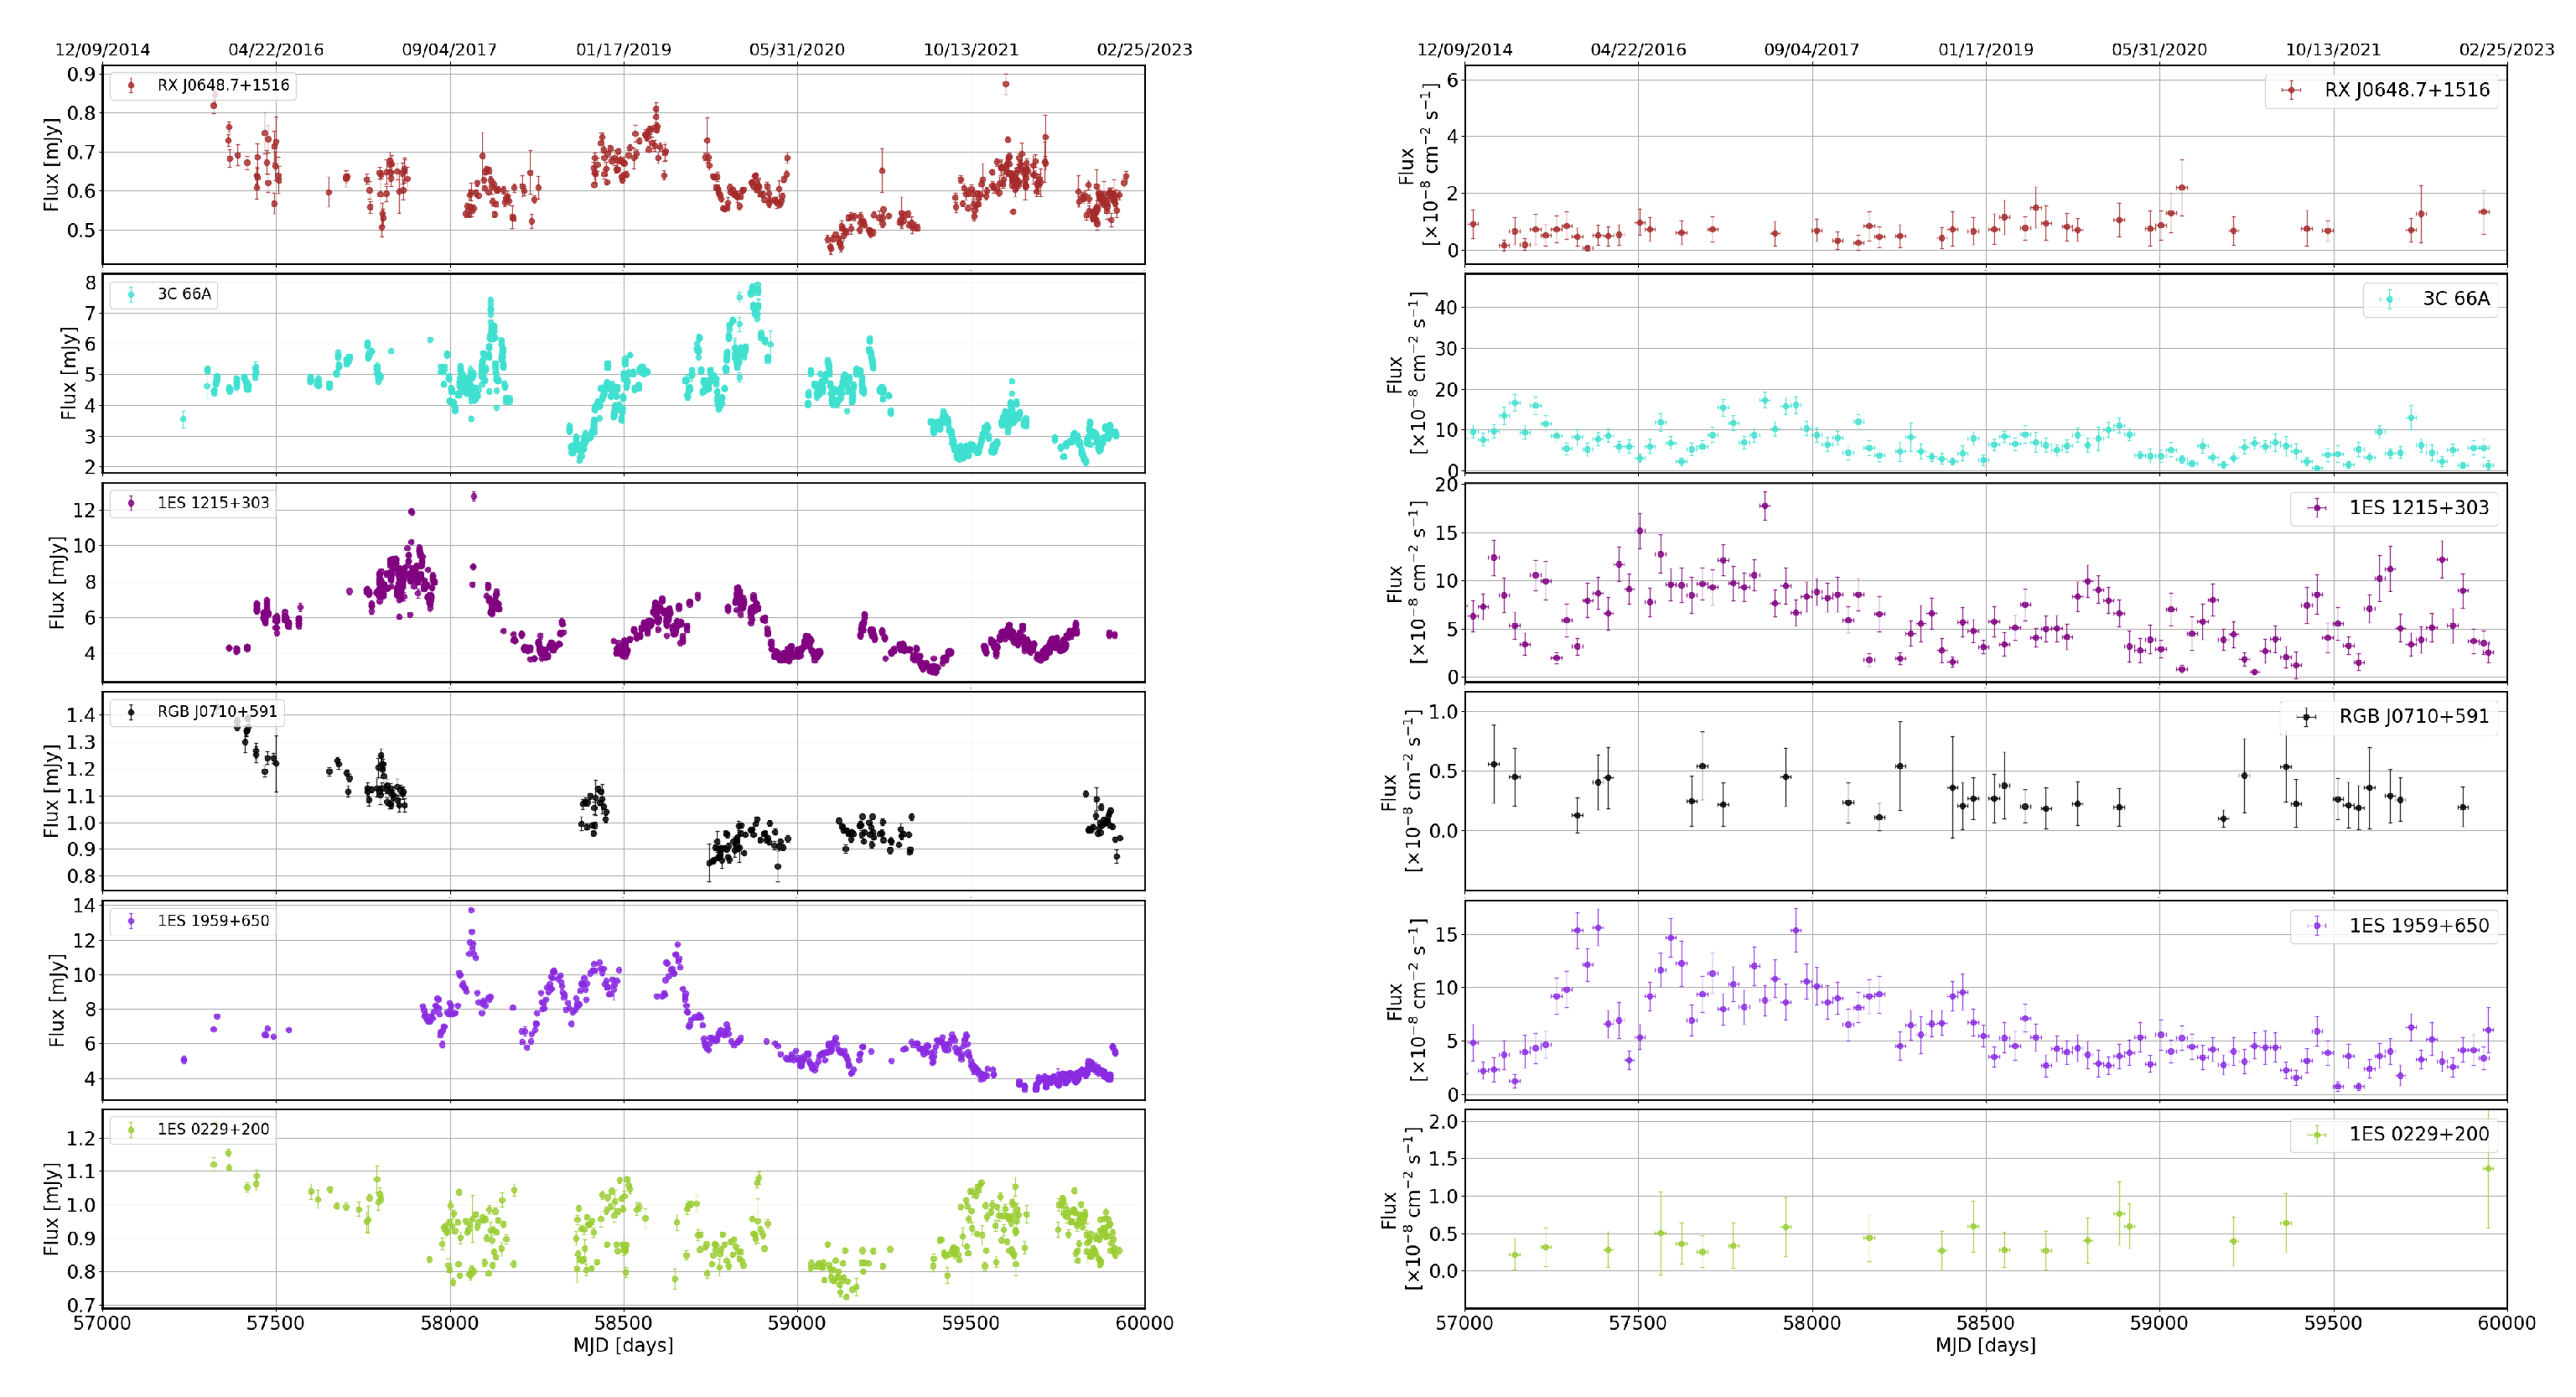
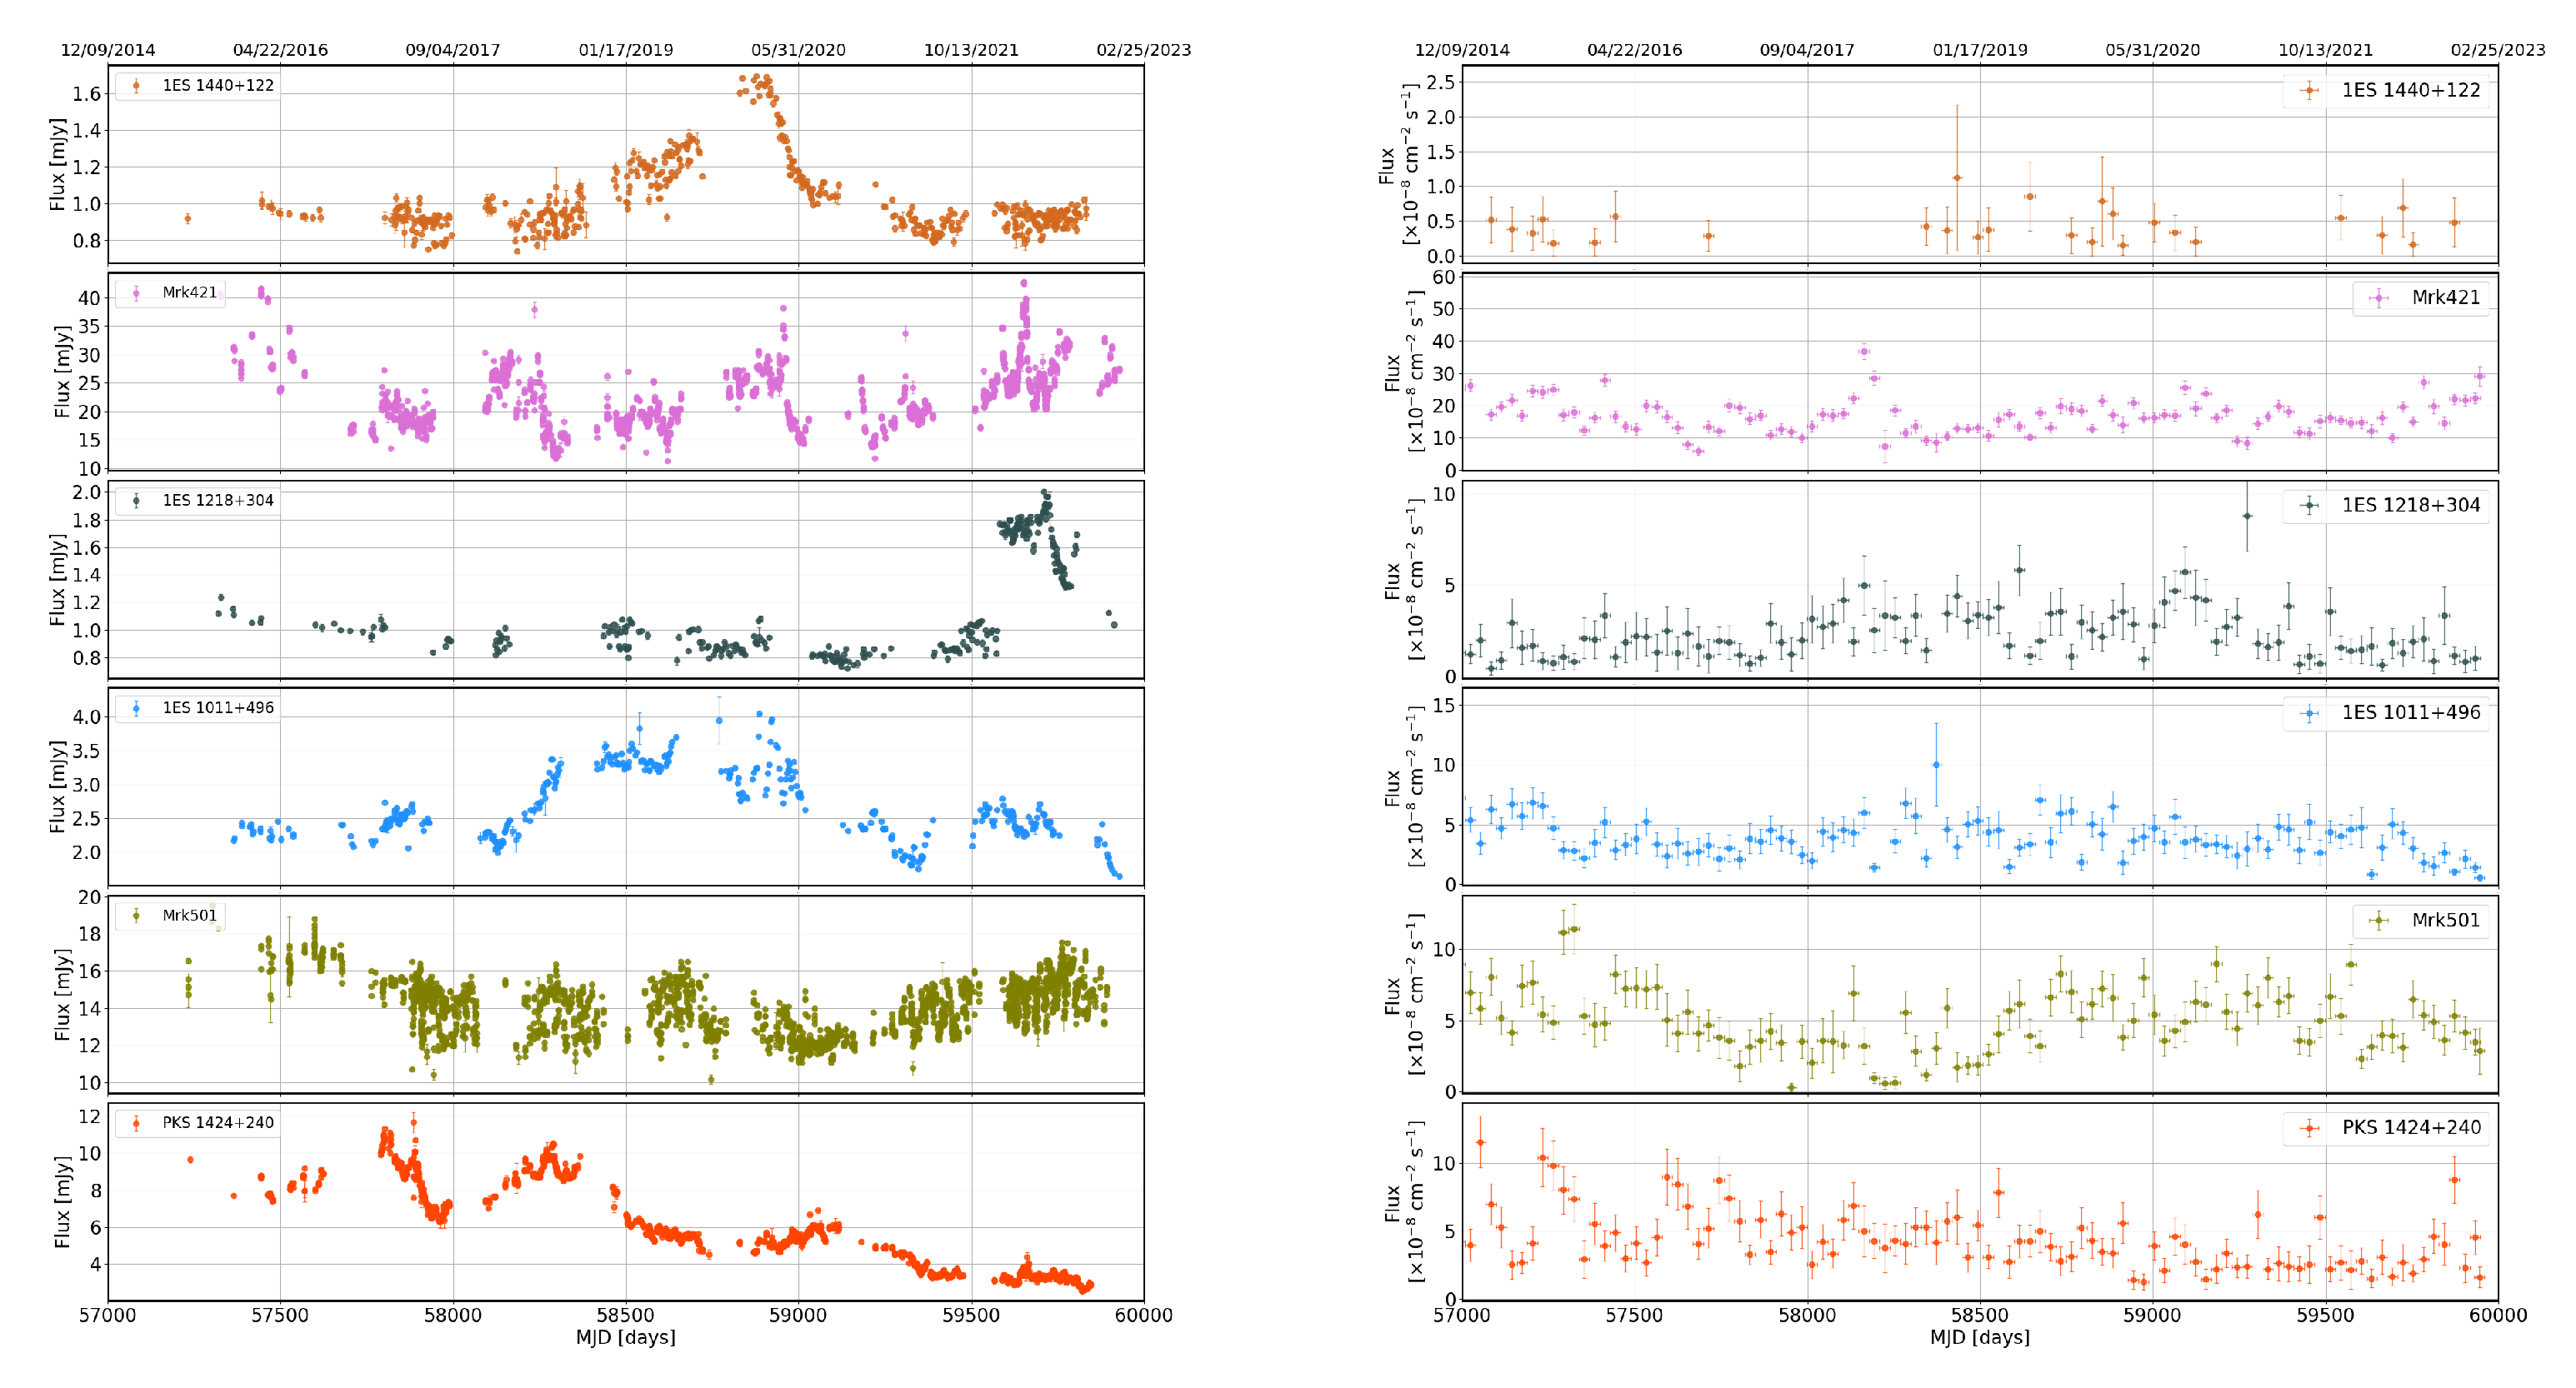
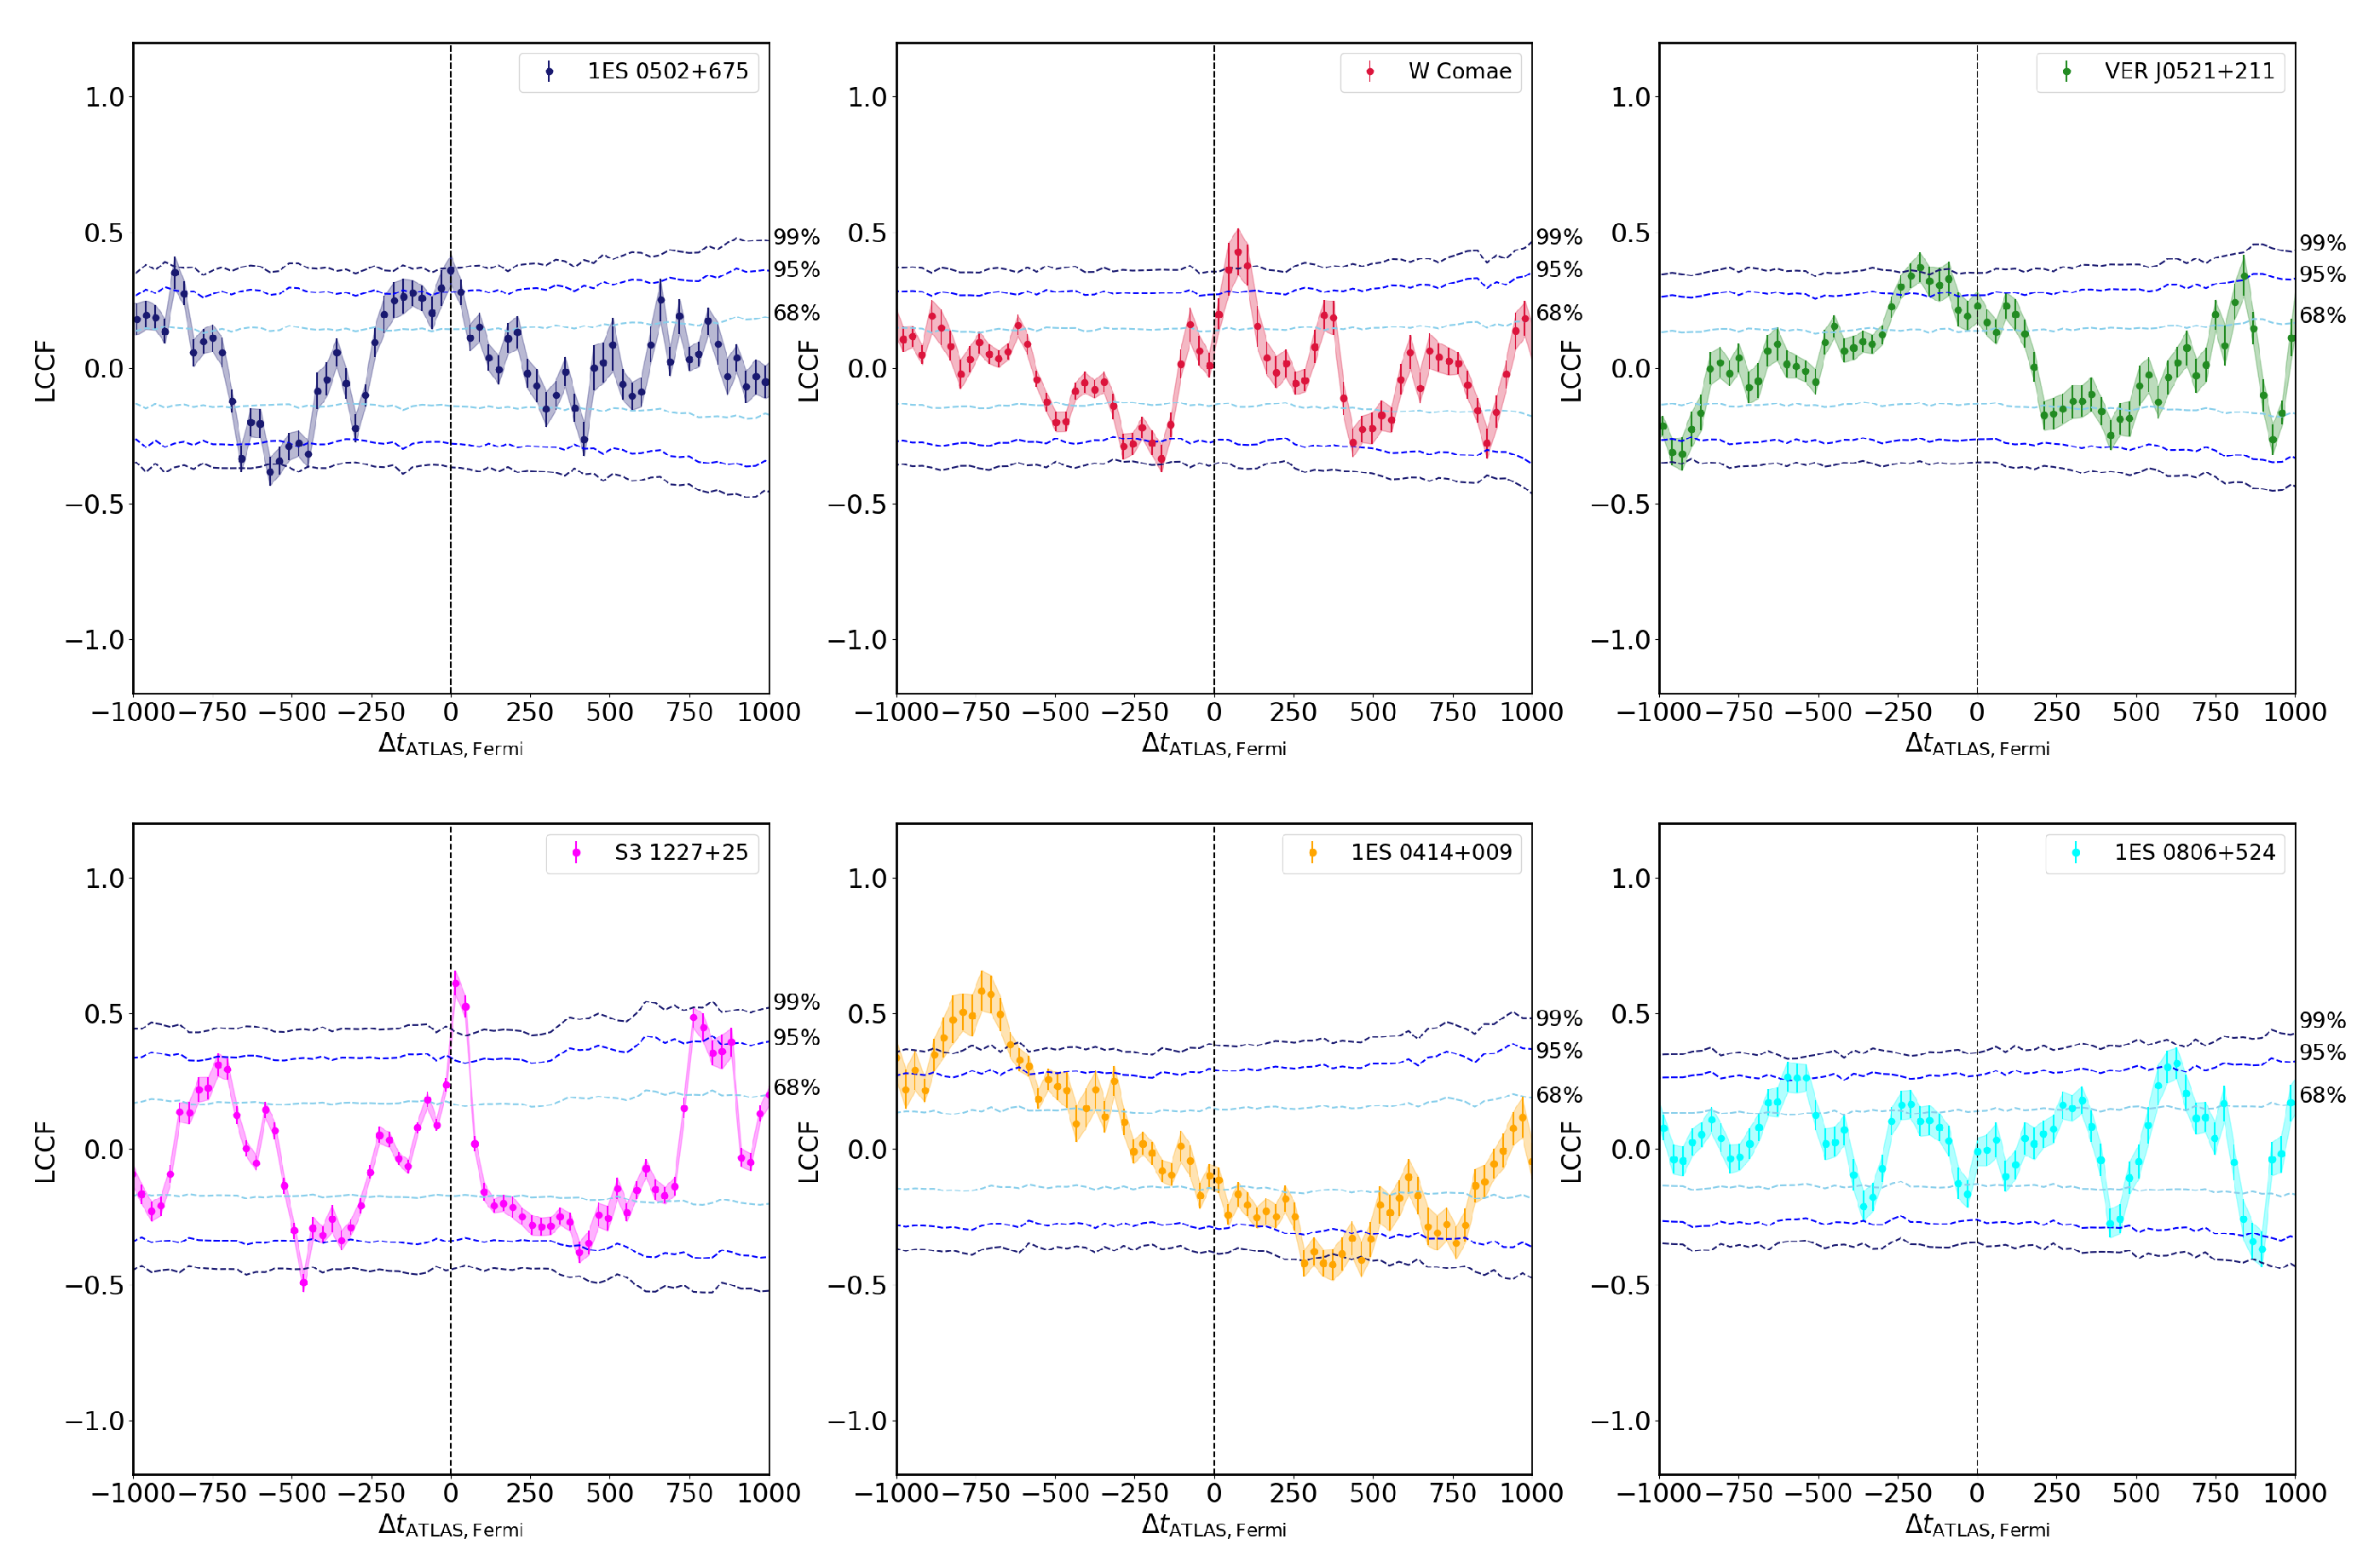
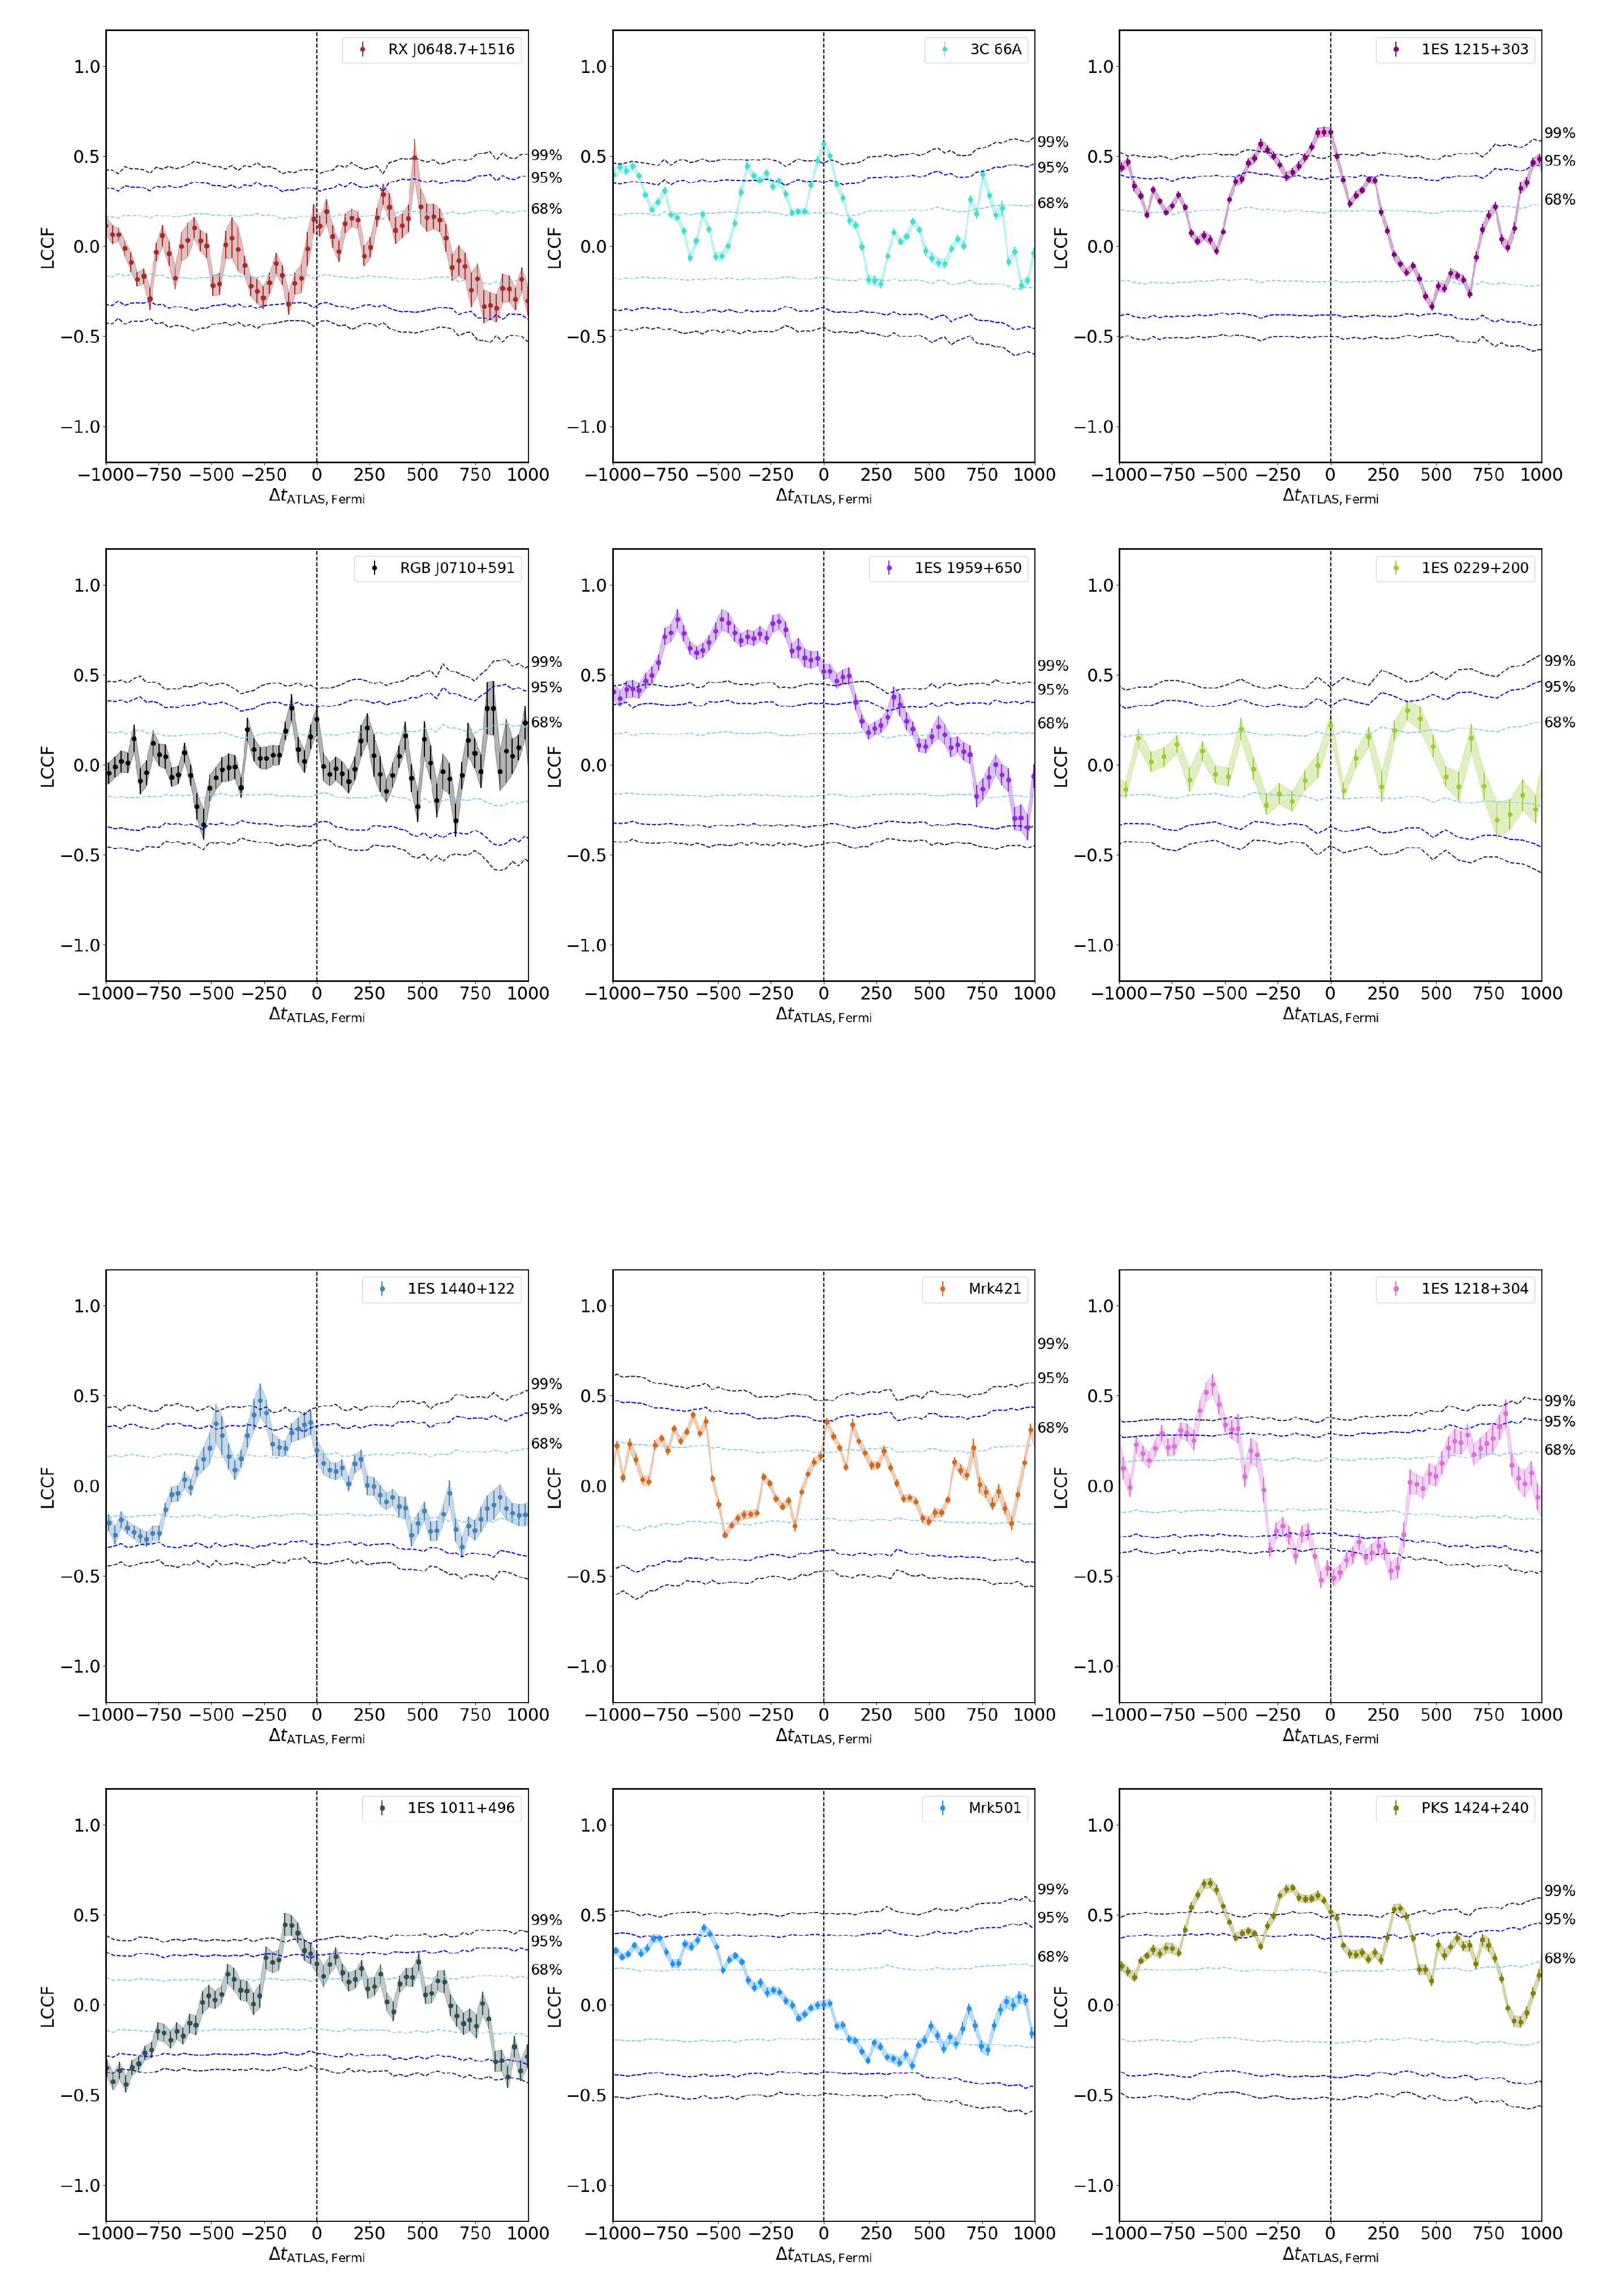
| Source | Class | RA | Dec | z | Timelag | Significance |
|---|---|---|---|---|---|---|
| [deg] | [deg] | [days] | [%] | |||
| 1ES 0502+675 | HBL | 76.9 | 67.6 | 0.340 | -9.75 ± 3.52 | ≥68 |
| W Comae | IBL | 185.4 | 28.2 | 0.102 | 74.78 ± 6.85 | ≥99 |
| VER J0521+211 | IBL | 80.4 | 21.2 | – | -236.07 ± 6.65 | ≥95 |
| S3 1227+25 | IBL | 187.6 | 25.3 | – | 20.71 ± 7.10 | ≥99 |
| 1ES 0414+009 | HBL | 64.2 | 1.1 | 0.287 | -746.48 ± 5.34 | ≥99 |
| 1ES 0806+524 | HBL | 122.5 | 52.3 | 0.138 | 626.02 ± 6.65 | ≥95 |
| RXJ0648.7+1516 | HBL | 102.2 | 15.3 | 0.179 | 466.59 ± 3.85 | ≥95 |
| 3C 66A | IBL | 35.7 | 43.0 | 0.340 | 2.61 ± 2.67 | ≥99 |
| 1ES 1215+303 | HBL | 184.5 | 30.1 | 0.131 | -56.10 ± 5.97 | ≥99 |
| RGB J0710+591 | EHBL | 107.6 | 59.1 | 0.125 | -130.00 ± 28.90 | ≥68 |
| 1ES 1959+650 | HBL | 299.9 | 65.2 | 0.048 | -683.44 ± 9.26 | ≥99 |
| 1ES 0229+200 | EHBL | 38.2 | 20.3 | 0.139 | 331.57 ± 19.98 | ≥68 |
| 1ES 1440+122 | HBL | 220.7 | 12.0 | – | -272.09 ± 2.03 | ≥99 |
| Mrk 421 | HBL | 166.1 | 38.2 | 0.031 | 28.68 ± 7.08 | ≥68 |
| 1ES 1218+304 | EHBL | 185.3 | 30.2 | 0.182 | -565.78 ± 2.09 | ≥99 |
| 1ES 1011+496 | HBL | 153.8 | 49.4 | 0.212 | -122.25 ± 8.26 | ≥99 |
| Mrk 501 | HBL | 253.5 | 39.8 | 0.034 | -574.50 ± 9.65 | ≥68 |
| PKS 1424+240 | HBL | 216.8 | 23.8 | – | -581.28 ± 1.78 | ≥99 |
Disclaimer/Publisher’s Note: The statements, opinions and data contained in all publications are solely those of the individual author(s) and contributor(s) and not of MDPI and/or the editor(s). MDPI and/or the editor(s) disclaim responsibility for any injury to people or property resulting from any ideas, methods, instructions or products referred to in the content. |
© 2023 by the authors. Licensee MDPI, Basel, Switzerland. This article is an open access article distributed under the terms and conditions of the Creative Commons Attribution (CC BY) license (http://creativecommons.org/licenses/by/4.0/).


